Article

Study on Pollution Characteristics of Perfluoroalkyl Substances (PFASs) in Shallow Groundwater

National Institute of Environmental Research, Hwangyong-ro 42, Seo-gu, Incheon 404-708, Republic of Korea
*
Author to whom correspondence should be addressed.
These authors contributed equally for first authorship.
Water 2023, 15(8), 1480; https://doi.org/10.3390/w15081480
Submission received: 2 March 2023 / Revised: 31 March 2023 / Accepted: 3 April 2023 / Published: 10 April 2023
(This article belongs to the Section Soil and Water)

Abstract

:
Perfluoroalkyl substances (PFASs) in shallow groundwater are increasingly being studied due to the global occurrence, environment persistence, bioaccumulation, and potential human health risk. In this research, 16 PFAS (11 perfluorinated carboxylic acids and 5 perfluorinated sulfonic acids) concentrations in groundwater were quantified to obtain information on geographical distribution and PFAS detection pattern for 4 years in South Korea. In the results, groundwater PFAS concentration ranged from non-detectable to average 45.2 ng/L (sum of PFASs). The major PFAS compounds were perfluorooctanoic acid (PFOA), perfluoropentanoic acid (PFPeA), perfluorohexanoic acid (PFHxA), perfluorohexane sulfonate (PFHxS), and perfluorooctane sulfonate (PFOS). The short chain (C < 8) PFASs were more prevalent than long chain (C > 8) PFASs in shallow groundwater. However, the detection patterns of 15 PFASs were different for each aquifer. Subsequently, through a health risk assessment, a non-carcinogenic risk level through ingestion, inhalation, and dermal contact for PFOA and PFOS was determined at 10−1, and it presents the need for PFAS management of groundwater.

1. Introduction

Among the basic backbone of hydrocarbon, perfluoroalkyl substances (PFASs) have a combined structure with a hydrophobic carbon chain that has hydrogen replaced with fluorine and hydrophilic interaction (e.g., carboxyl group, sulfonic group) [1]. In 2018, the Organization for Economic Co-operation and Development (OECD) and the United Nations Environment Programme (UNEP) released the PFASs list [2], which includes over-CnF2n-interaction as a “global PFC group”. Due to its structural characteristics, which include both hydrophilic and hydrophobic interaction similar to surfactants, PFASs have been widely used in various areas such as outdoor products, coating agents for items including frying pans, fire extinguishing foaming agents, and carpet since 1947, when 3M started manufacturing it [3]. Moreover, the powerful C-F covalent bonds of the hydrophobic carbon chain allow PFASs to have tolerance to biological degradation as well as having chemically stable and thermal-resistant characteristics [4,5]. However, that can also become a cause of environmental pollution, as PFASs leave residues for decades once they are exposed to the environment [6]. PFOA in the environment can be absorbed into the human body through oral exposure, skin contact, and inhalation of dust [7]. In particular, [8] (775–781) reported that over 90% of PFOA in the body is estimated to be bound to serum albumin in human blood.
Several studies in humans have examined PFOA as a carcinogen, according to the international agency for research on cancer (IARC by WHO), and PFOA can increase one’s chances of having kidney cancer and testicular cancer [9]. In 2017, IARC assigned PFOA to group 2B, which is classified as possibly carcinogenic to humans [7,10]. Furthermore, potential mechanisms for PFOA-induced toxicity and carcinogenicity in the liver include PPARα activation, involvement of other molecular pathways (i.e., constitutive androstane receptor, pregnane X receptor, estrogen receptor), and cytotoxicity [7,10]. Similarly, the US Department of Health and Human Services (HHS) reported through animal and epidemiological studies that PFOA and PFOS pose immunological risks to humans and suppress antibody responses [11]. In addition, some perfluorinated carboxylic acids (PFCAs) (e.g., perfluorooctanoic acid or PFOA) and perfluorinated sulfonic acids (PFSAs) (e.g., perfluorooctane sulfonic acid or PFOS, perfluoroheptane sulfonate of PFHpS) have been found to permanently exist in the environment. Some PFASs show toxicity for which the livers of rodents and monkeys are the target organ [12]. In particular, PFOA and PFOS are some of the PFASs that are often found in the environment [13], and these PFASs are easily shifted from location to location once they are exposed to the aquatic environment. As it is difficult to eliminate PFOA and PFOS by using the existing method of wastewater treatment [14,15], there has been vibrant international research that has presented management tips and purification methods. South Korea has designated PFOA, PFOS, and PFHxS as the targets for drinking water quality monitoring by amending the “Public Notice on the List of Drinking Water Quality Monitoring” in 2018 (Notice by the Ministry of Environment No. 2018-124), which allows for consistent monitoring. The United States has set the recommended level of PFOA and PFOS in drinking water to less than 70 ng/L [16]. The European Union (EU) identified PFOA and PFOS as prioritized hazardous substances according to its Water Framework Directive [17] and later designated PFOS and PFOA as persistent organic pollutants (POPs) in the EU in order to restrict the use of them [18,19]. In 2019, the EU included perfluorododecanoic acid (PFDoDA) and perfluoroundecanoic acid (PFUnDA) as the target of voluntary monitoring for ground water in what is called the “groundwater watch list” (GWWL) [20]. The Swedish National Food Administration set the action limit for 11 items, including PFOA and PFOS (7 PFCAs, 3 PFSAs, and 1 precursor), at 90 ng/L by considering the potential risks that can affect the human body in the case of intaking PFASs in drinking water [13,21]. Several researchers have developed an analytical method which involves solid phase extraction (SPE) and liquid chromatography-tandem mass spectrometry (LC-MS/MS) in order to quantify PFASs [22,23].
There have been recent news reports regarding PFASs detected in the groundwater at the US military bases in South Korea, car wash places, and places where there were fires, which aroused the public’s concerns regarding the use of groundwater. Therefore, this study conducts an analysis of the status of groundwater quality for 15 substances of PFASs including PFOA in order to find out some characteristics of PFASs (e.g., detection level by item, distribution characteristics of aquifer, variation characteristics by year). Furthermore, the study finds why PFASs in groundwater need to be managed through the risk level assessment for the human body by taking the exposure route of groundwater regarding the detected level of PFAS concentration into consideration.

2. Materials and Methods

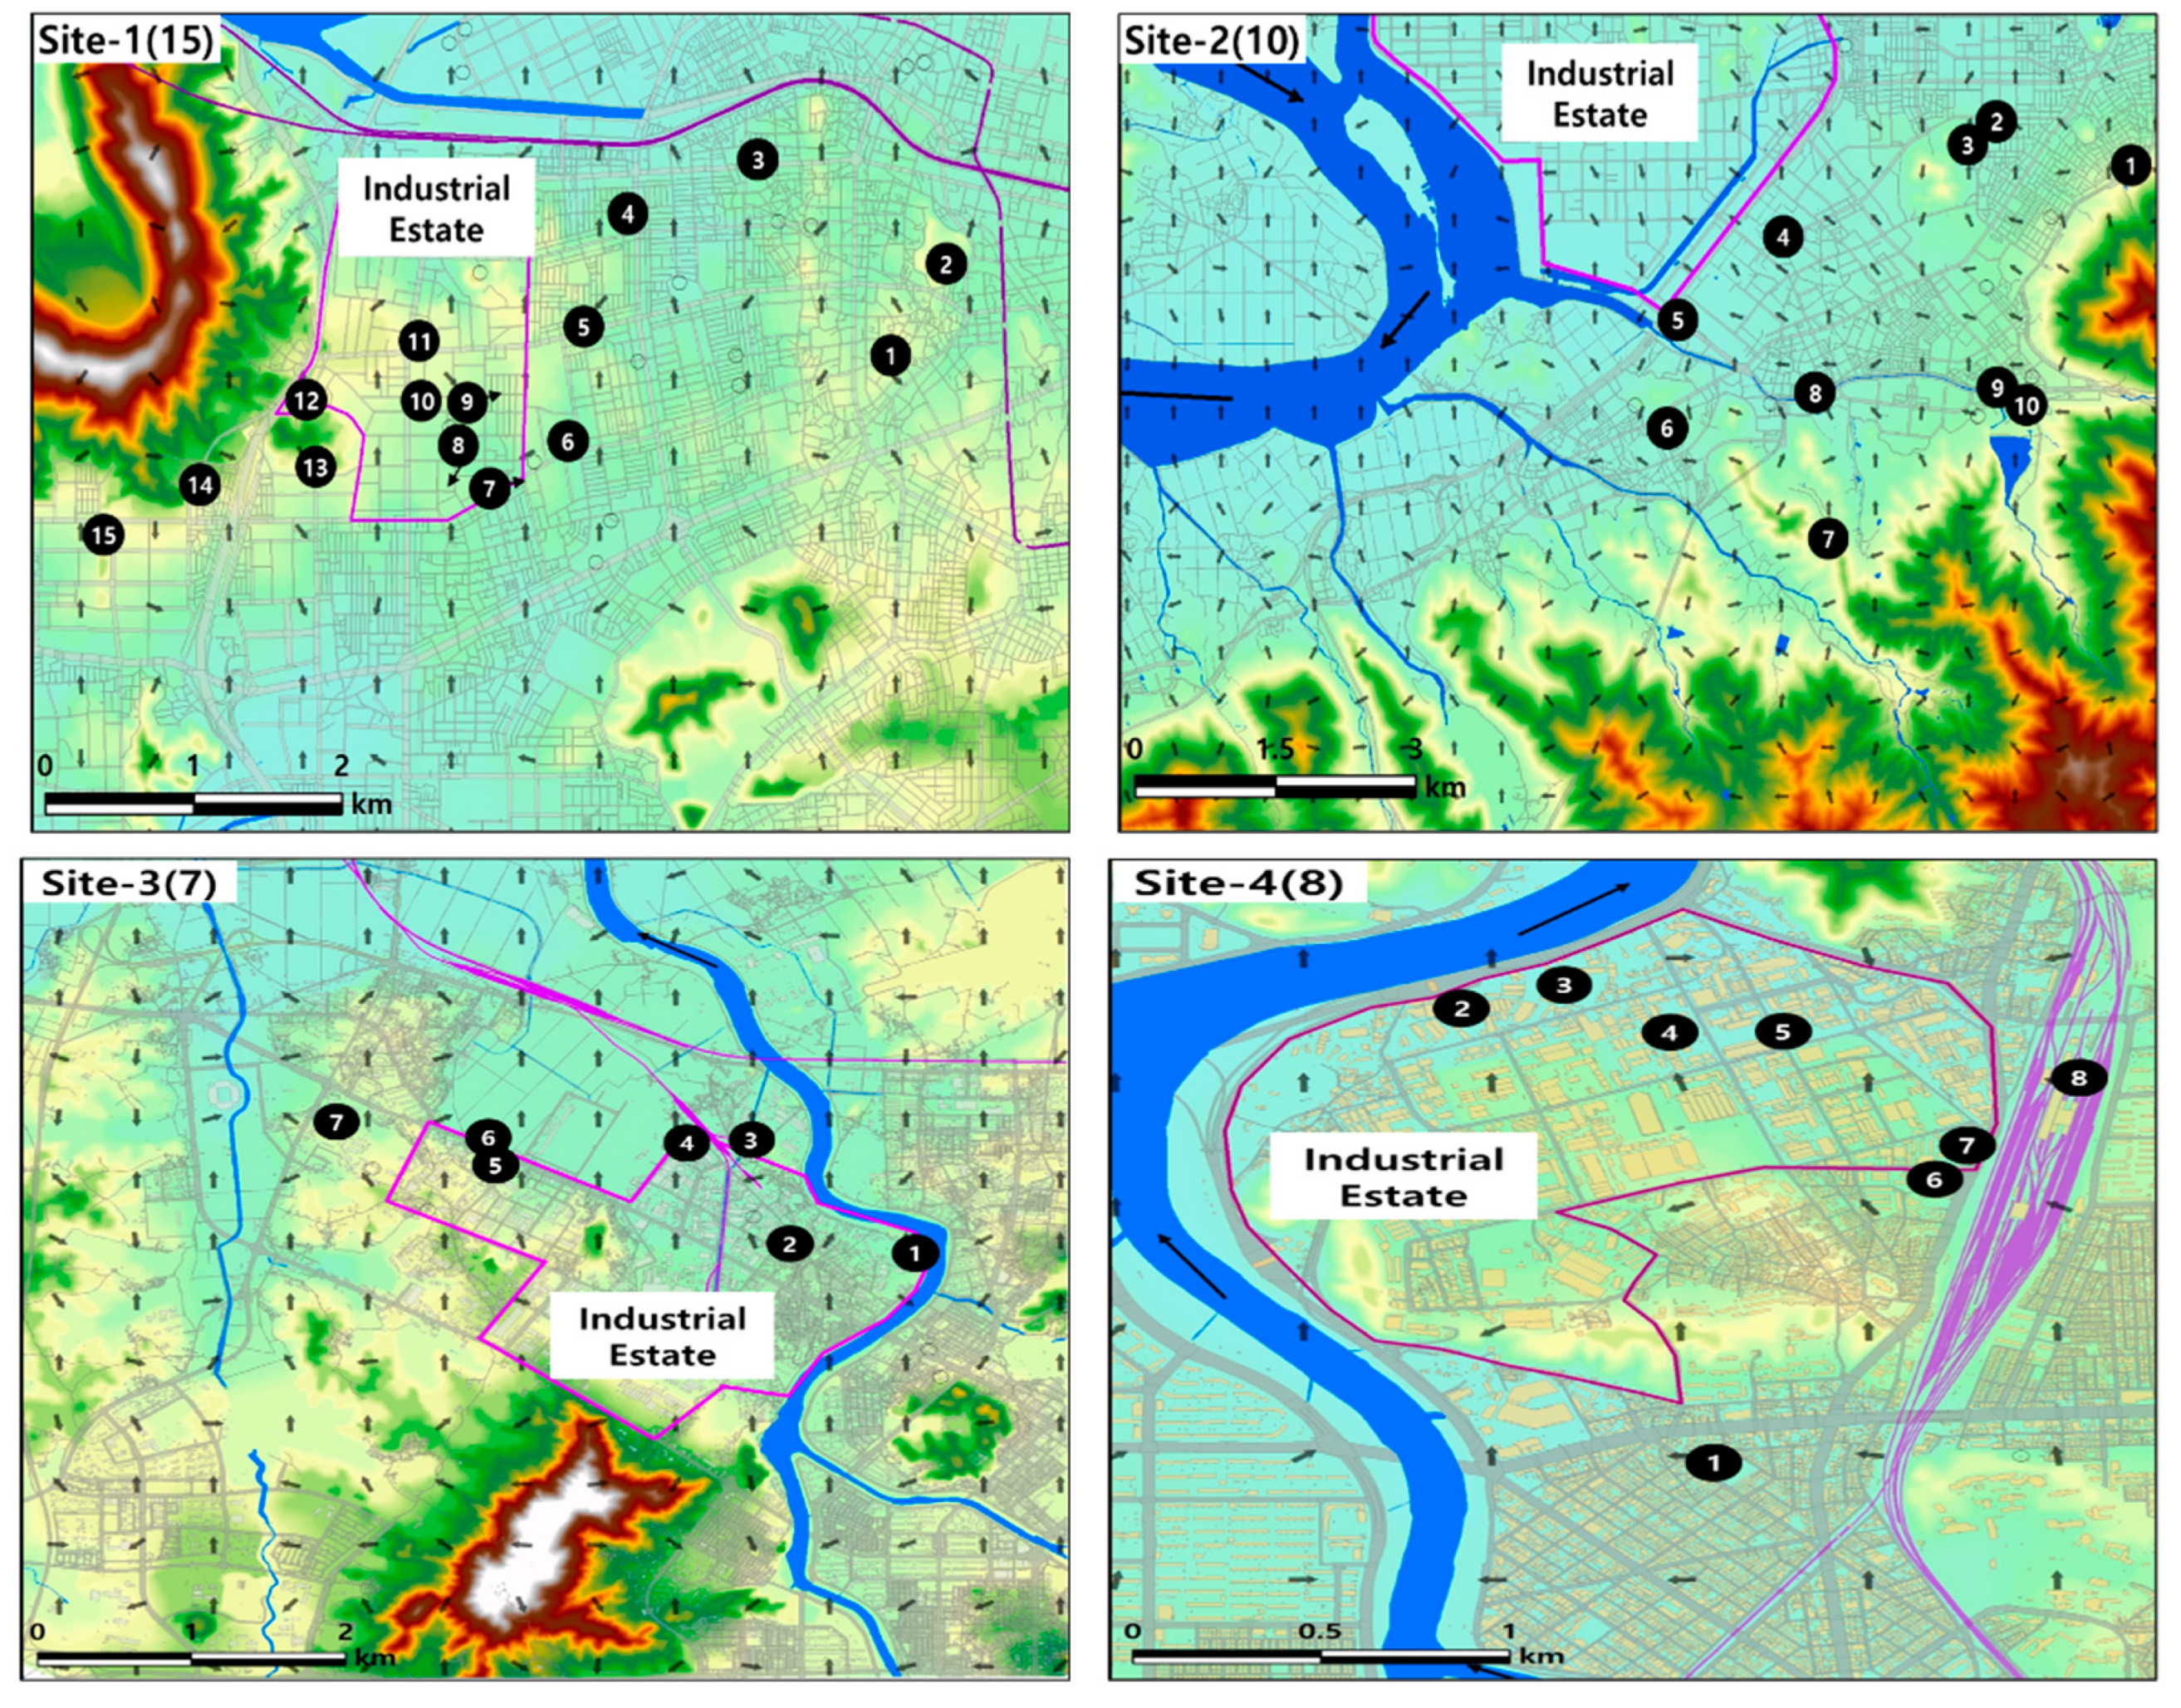
2.1. Selection of the Location of Survey Items

The present study conducted a background water quality survey starting in 2018 at groundwater monitoring wells nationwide in order to ascertain the distribution of PFASs. Based on the survey results, the study started an in-depth search for places with high concentration rates and their neighboring wells in 2019.

2.1.1. Selection of the Location and Survey Interval of Water Quality Status

For the status survey of PFASs, the study selected about 100 non-drinking groundwater wells. When selecting wells, the study considered whether there were pollutants in order to evaluate the characteristics of the groundwater contamination caused by PFAS-related pollutants. The study considered gas stations, car wash places, and factories that manufacture fluoropolymer as some of the major pollutants and selected 70 wells to measure contamination within an area with a 3 km radius by pollutant. In reverse, 30 background monitoring wells were selected by evenly considering regions where there were no neighboring pollutants in order to establish the background water quality. Those 100 monitoring wells for the water quality status survey underwent the survey for 4 years between 2018 and 2021 with a twice-a-year survey every year. This was to find out the variation characteristics by season and year.

2.1.2. Selection of the Location for the In-Depth Survey

The location was selected by reviewing the results of 2 surveys on water quality status from 100 monitoring wells in 2018. The surveys were conducted around where the concentration was relatively high, with some considerations including geographic conditions such as the status of the distribution of neighboring monitoring wells of ground water, and the flow direction of groundwater. In the end, a total of 40 monitoring wells at 4 sites was selected: 15 Site-1, 10 Site-2, 7 Site-3, and 8 Site-4. To study the variation characteristics of PFASs by item and the distribution characteristics in the aquifer, a series of water quality surveys were carried out for three years between 2019 and 2021, with a quarterly survey every year (Figure 1).

2.2. Sample Collections of Groundwater and Analysis on Site Measuring Items

Groundwater samples (830 samples, 2018~2021, twice a year) were collected from 100 groundwater wells, and 480 samples in 40 groundwater wells around 4 sites were collected 4 times a year to evaluate the perfluorinated chemical (PFC) pattern change in groundwater. These samples were collected according to the method of sample collection and storage (ES 04130.1e) of the Water Pollution Standard Method, and water temperature, pH, EC, Eh, and DO were collected on site. Cations and anions were separately collected into 125 mL polyethylene bottles after filtering the water through the membrane filter (0.45 μm, mixed cellulose ester, AdvanTec). For cations, 6–7 drops of HNO3 were added to adjust the pH level to 2 for storage. PFASs were collected into 1 L polypropylene (PP) bottles, and the collected samples were sealed to prevent any contact of the atmosphere. All the collected samples were stored in iceboxes at the temperature of 4 °C before being transferred.

2.3. Analysis on Major Cation and Anion

A total of four cations and three anions in groundwater was analyzed among some of the major cations and anions: the four selected cations include Ca2+, Mg2+, Na+, and K+ and the three anions are HCO3, SO42−, and Cl. The cations went through Standard method 3120 for the analysis, and the analysis tool that was used was ICP-OES (Optima 8300&7300DV, PerkinElmer, Waltham, MA, USA; 720-ES, Varian Inc., Palo Alto, CA, USA). Among the three anions, SO42− and Cl went through ion chromatography as a part of the Water Pollution Standard Method for the analysis, and the analysis tool that was used was IC (850 Professional, Metrohm, Switzerland; ICS-5000+, Dionex Thermo Fisher Scientific, Waltham, MA, USA). HCO3 was analyzed through 0.05 N HCl titration on site for the analysis. The analysis results from the selected cations and anions were used to classify the groundwater quality by using a piper diagram. This study concludes the classification of groundwater quality by comparing various data such as the ratio by groundwater quality at the survey areas. The classification includes the Ca-HCO3 type, which indicates shallow groundwater; the Na-HCO3 type, which shows the reaction between groundwater and water quality; the Ca-Cl type, which can prove that there has been artificial contamination; and the Na-Cl type, which is influenced by seawater [24].

2.4. Analysis on PFAS Samples

In total, 16 PFASs (11 carboxylic items such as PFOA and 5 sulfonic items) underwent the method called US EPA 537 (Rev. 1.1) by using the solid phase cartridge for extraction and enrichment before analysis. The collected samples for the PFAS analysis were filtered through the membrane filter (0.45 μm, mixed cellulose ester, AdvanTec) and were used as the initial samples by extracting 200 mL of the leftover fluid.
The product called PFAC-MXB and EPA-537IS by Wellington, Guelph, ON, Canada, was purchased as the standard and internal standard substances for PFAS analysis after the dilution process. For the solid phase cartridge, Oasis HLB Cartridge (6 cc) by Waters was used for sample extraction and enrichment. To activate the cartridge, 18 mL of methanol and 18 mL of distilled water were injected. After the cartridge activation, 200 mL of the initial sample that was previously filtered went through another filtering, which allowed PFASs to be collected in another cartridge. The cartridge was left for drying for about 30 min, followed by another 2 rounds of injection of 4 mL of methanol (total of 8 mL) in order to flow out PFASs that were collected in the cartridge. A nitrogen gas evaporator to enrich the flown-out liquid was combined with some of the internal standard substances and methanol, which finally became 0.4 mL in volume. All the laboratory glassware that was used during the pre-processing stage was composed of PP, and LC-MS/MS (LC-MS 8030, Shimadzu, Kyoto, Japan) was used to analyze the pre-processed samples. The following tables (Table 1 and Table 2) describe the instrument and MRM conditions.
Before the analysis on PFASs in groundwater, a quality control method called ES 04001.b in the Water Pollution Standard Method was applied to see whether analysis methods can be applied. To calculate the method detection limit (MDL) and the limit of qualification (LOQ), 7 samples were created in the 200 mL purified water at the level of 10 ng/L each for analysis. For the accuracy and precision assessment, five samples at the low concentration (20 ng/L) and another five samples at the high concentration (50 ng/L) were created. For the accuracy assessment, the mean values of the test concentration (20 ng/L, 50 ng/L) and the analysis concentration were calculated in percentage, and the precision was calculated by the standard deviation for the mean value of the analysis concentration in percentage. As a result of the quality control by the item, the level of precision was between 0.6% and 11.6%, and the accuracy was between 90.3% and 108.0%. The LOQ by item ranged between 0.3 ng/L and 1.6 ng/L, and the reporting limits for all items were set to be 5.0 ng/L in order to conclude the survey result.

2.5. Risk Assessment of PFASs for Human Body

A risk assessment was conducted for three items (PFOA, PFOS, PFHxS) that are part of the monitoring items of drinking water defined in South Korea. The exposure scenario consists of the drinking (ingestion) and non-drinking (e.g., dermal contact, inhalation) water parts, based on a review of reports regarding risk assessment, as well as the total exposure volume of PFASs in groundwater to the human body through multiple routes; academic papers; and other references regarding the use of groundwater in South Korea [25]. Household chores (e.g., doing dishes), showering, and indoor/outdoor agricultural activities are set as the exposure scenario for dermal contact and inhalation routes. For risk assessment, the concentration of the 95th percentile that was drawn from the in-depth survey was applied as the standard concentration. A concentration of the 95th percentile is regarded as a high-end risk within the entire distribution of risk assessment, which can affect 68% of receptors once it is exposed [26,27], which was drawn by using Crystal Ball ver. 11.0 (Oracle, Austin, TX, USA). The Guidelines for the Creation of the Risk Assessment Report were the reference to proceed with non-detect (ND) data depending on the detection frequency by item [28]. For the process, the study looked into physiochemical parameters and reference dose (RfD) by item (Table 3). Table 4 indicates the risk assessment formula by route and related factors.

3. Results and Discussion

3.1. Survey Results of Water Quality Status

The order of the elements detected from the survey on groundwater quality status regarding PFASs (average, detection rate) is as follows: PFOA (0.025 nmol/L, 28.8%) > PFPeA (0.020 nmol/L, 20.1%) > PFHxA (0.013 nmol/L, 19.6%), which shows a similar pattern of the PFAS detection overseas (Figure 2). In the results of PFAS monitoring in groundwater in 2014 and 2015 in China, the major detection compounds were PFOA, PFPeA, PFHxA, PFOS, etc. [5,33], and, in other research, the major detection compounds were perfluorobutanoic acid (PFBA), PFOA, PFPeA, PFHxA, and perfluorobutane sulfonate (PFBS) according to the result in a groundwater sampling from in Italy in 2018 [34]. Furthermore, the European Union (EU) identified PFHxS, perfluorononanoic acid (PFNA), and perfluorodecanoic acid (PFDA) as substances that are required to be monitored as per the groundwater watch list [20].
There was no significant difference in the detection frequency and the average concentration depending on the survey period (e.g., year, season). However, seven items with short chains of carbon (8 or less) except PFBS showed a yearly decrease in their average detection rates year after year, while there was a constant increase in the average detection rate of PFBS. The contamination monitoring well shows 4.1 times higher average concentration ([Contamination] 0.189 nmol/L, [Background] 0.046 nmol/L) than that of the background monitoring well (Figure 3).
When comparing the distribution of PFASs depending on the existence of pollutants, only seven items (e.g., PFOA, PFOS) with short chains of carbon (5–8 carbon) were detected from the background monitoring well, while four items (PFNA, PFDA, PFUnDA, perfluorotridecanoic acid (PFTrDA)) with long chains of carbon (9 or more carbon) were additionally detected on top of those seven items from the contamination monitoring well. This result suggests that PFASs with long chains of carbon (e.g., PFNA, PFDA, PFUnDA) are detected as the artificially produced poly-type PFASs and precursor (e.g., 10:2 fluorotelomer alcohol (FTOH)) are detected from the monitoring well near the contamination sources. The reason that PFASs with short chains of carbon (e.g., PFPeA) exist in the background monitoring well is that either precursors with long chains of carbon become those with shorter chains of carbon due to environmental impacts while moving around as those precursors move further from the contamination sources, or the soil there has relatively weaker absorption, and that leads to a wider range of mobility [33,35,36,37,38].

3.2. Results of In-Depth Survey

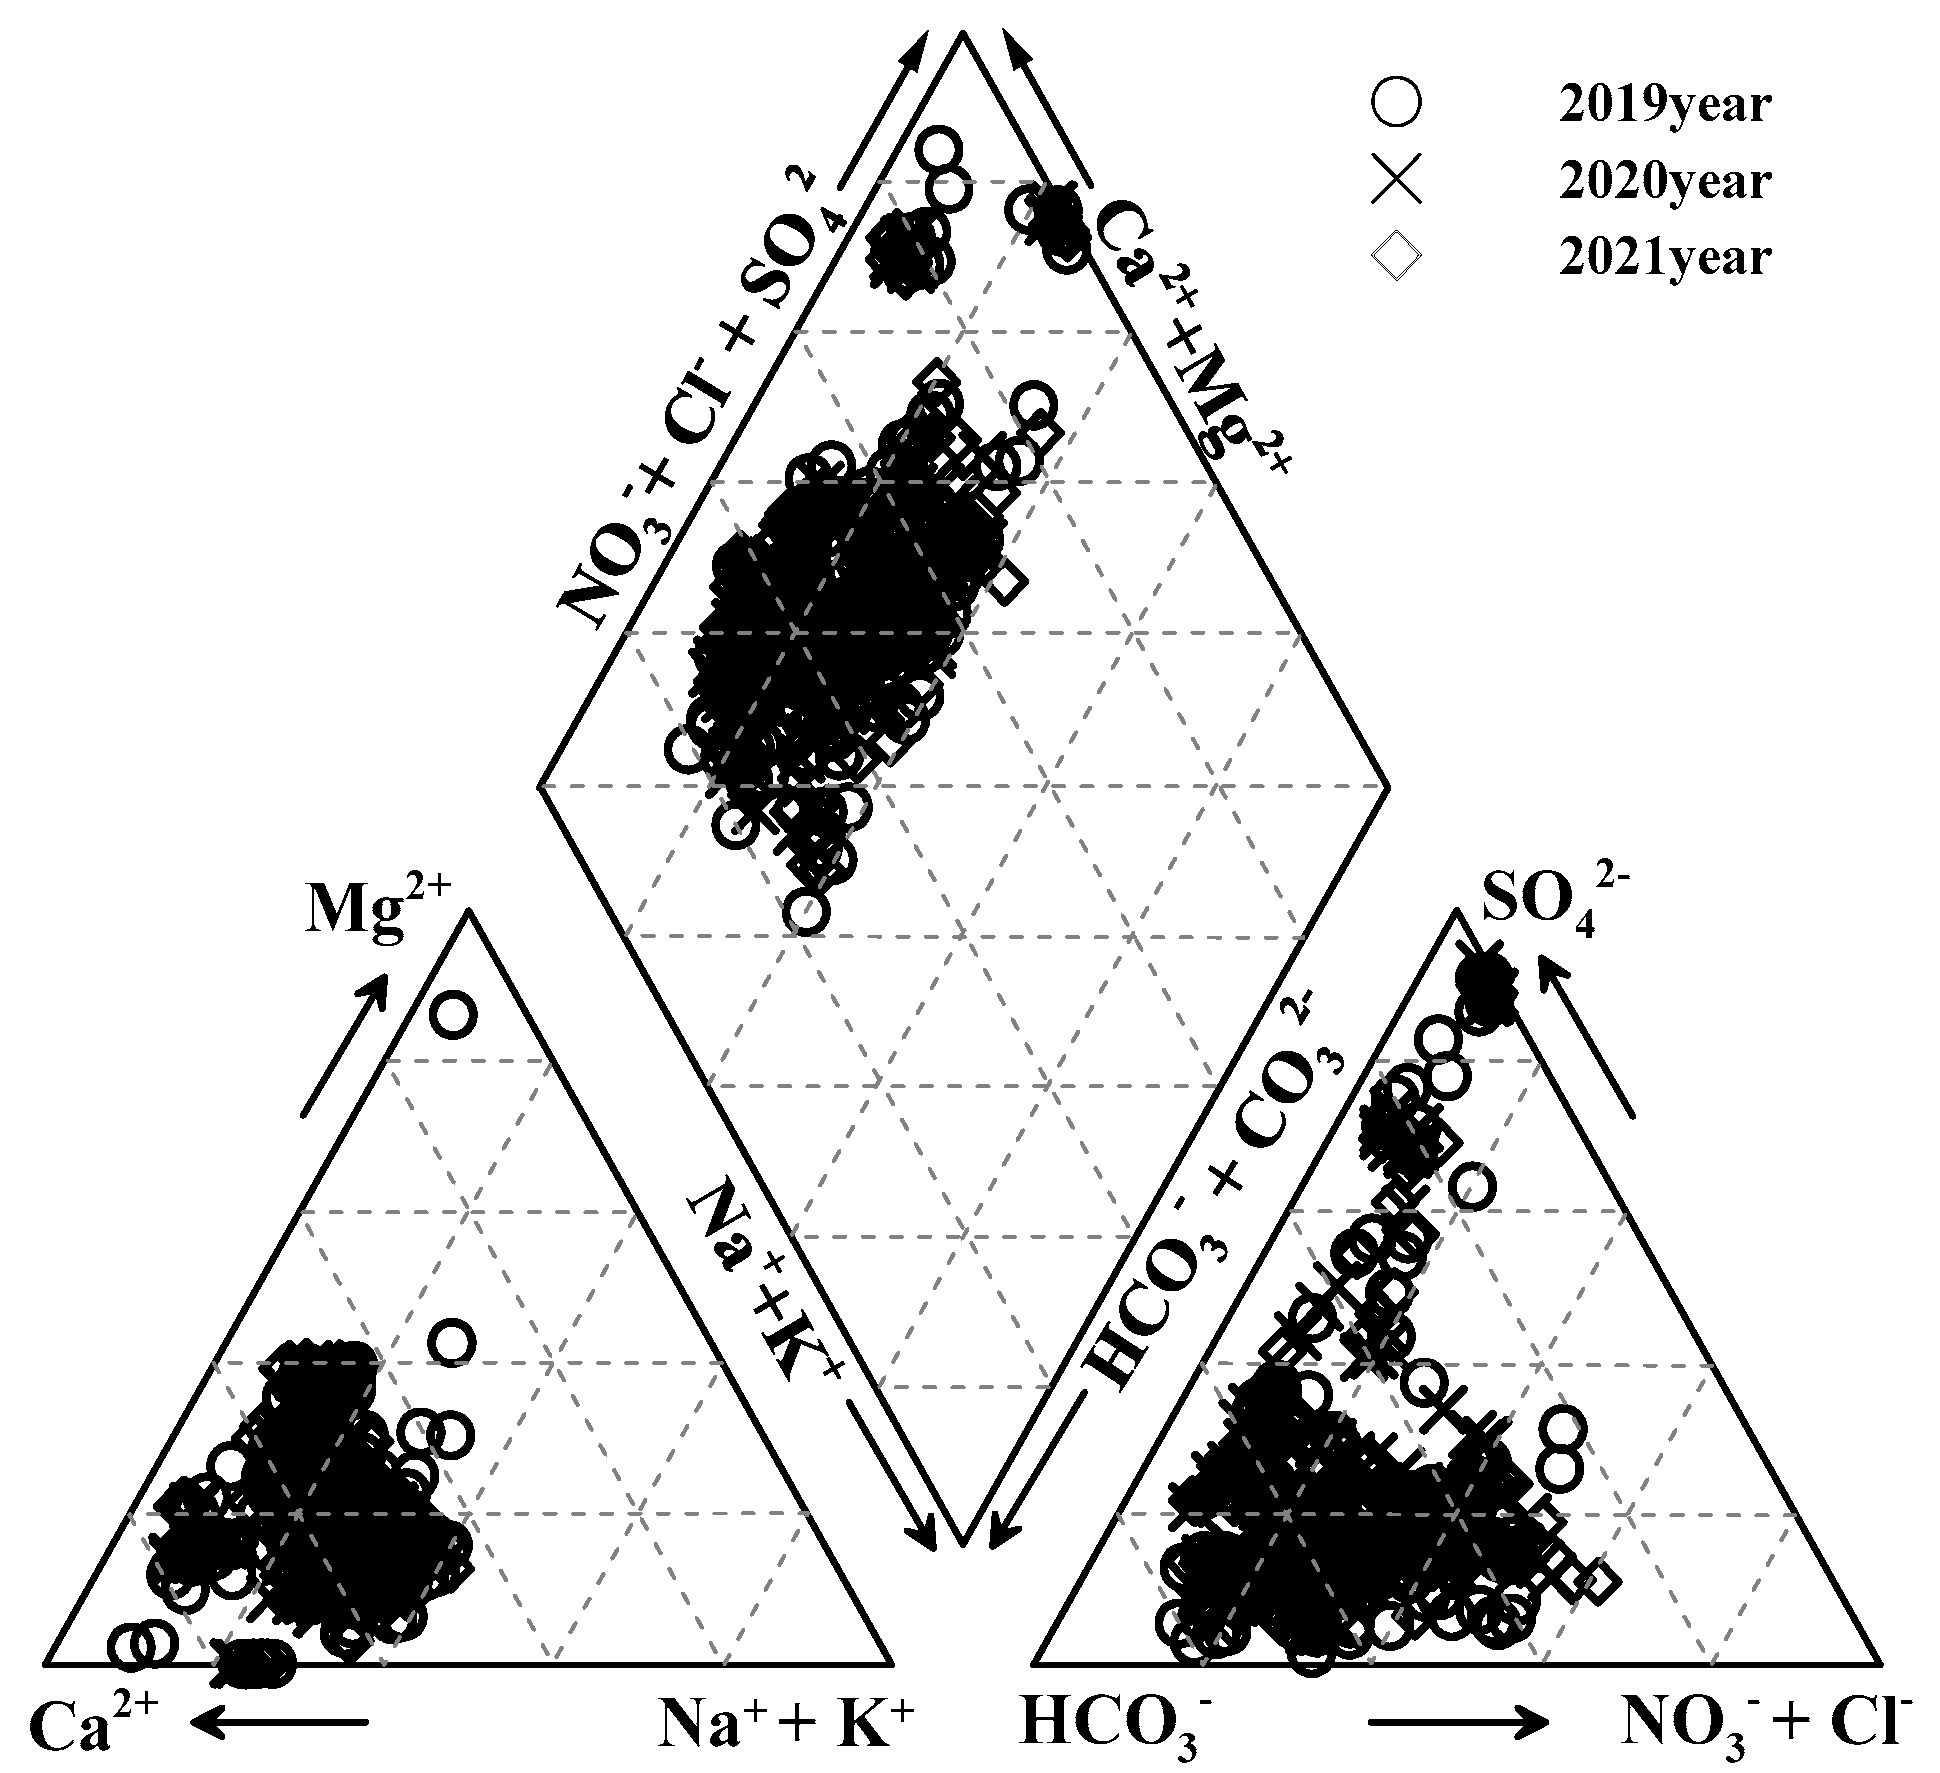
3.2.1. Analysis Results of Groundwater Quality Classification

As a result of the analysis on groundwater quality classification (2019–2021), 56% of the groundwater was classified as Ca-HCO3, which indicates that shallow groundwater is not contaminated, and 44% were found to be the Ca-(Cl+NO3) type, which seems to be affected by artificial pollutants (Figure 4).

3.2.2. Results of In-Depth Monitoring

The following information is the result of in-depth monitoring of 15 PFASs 4 times a year from 40 monitoring wells at 4 sites for 3 years between 2019 and 2021.

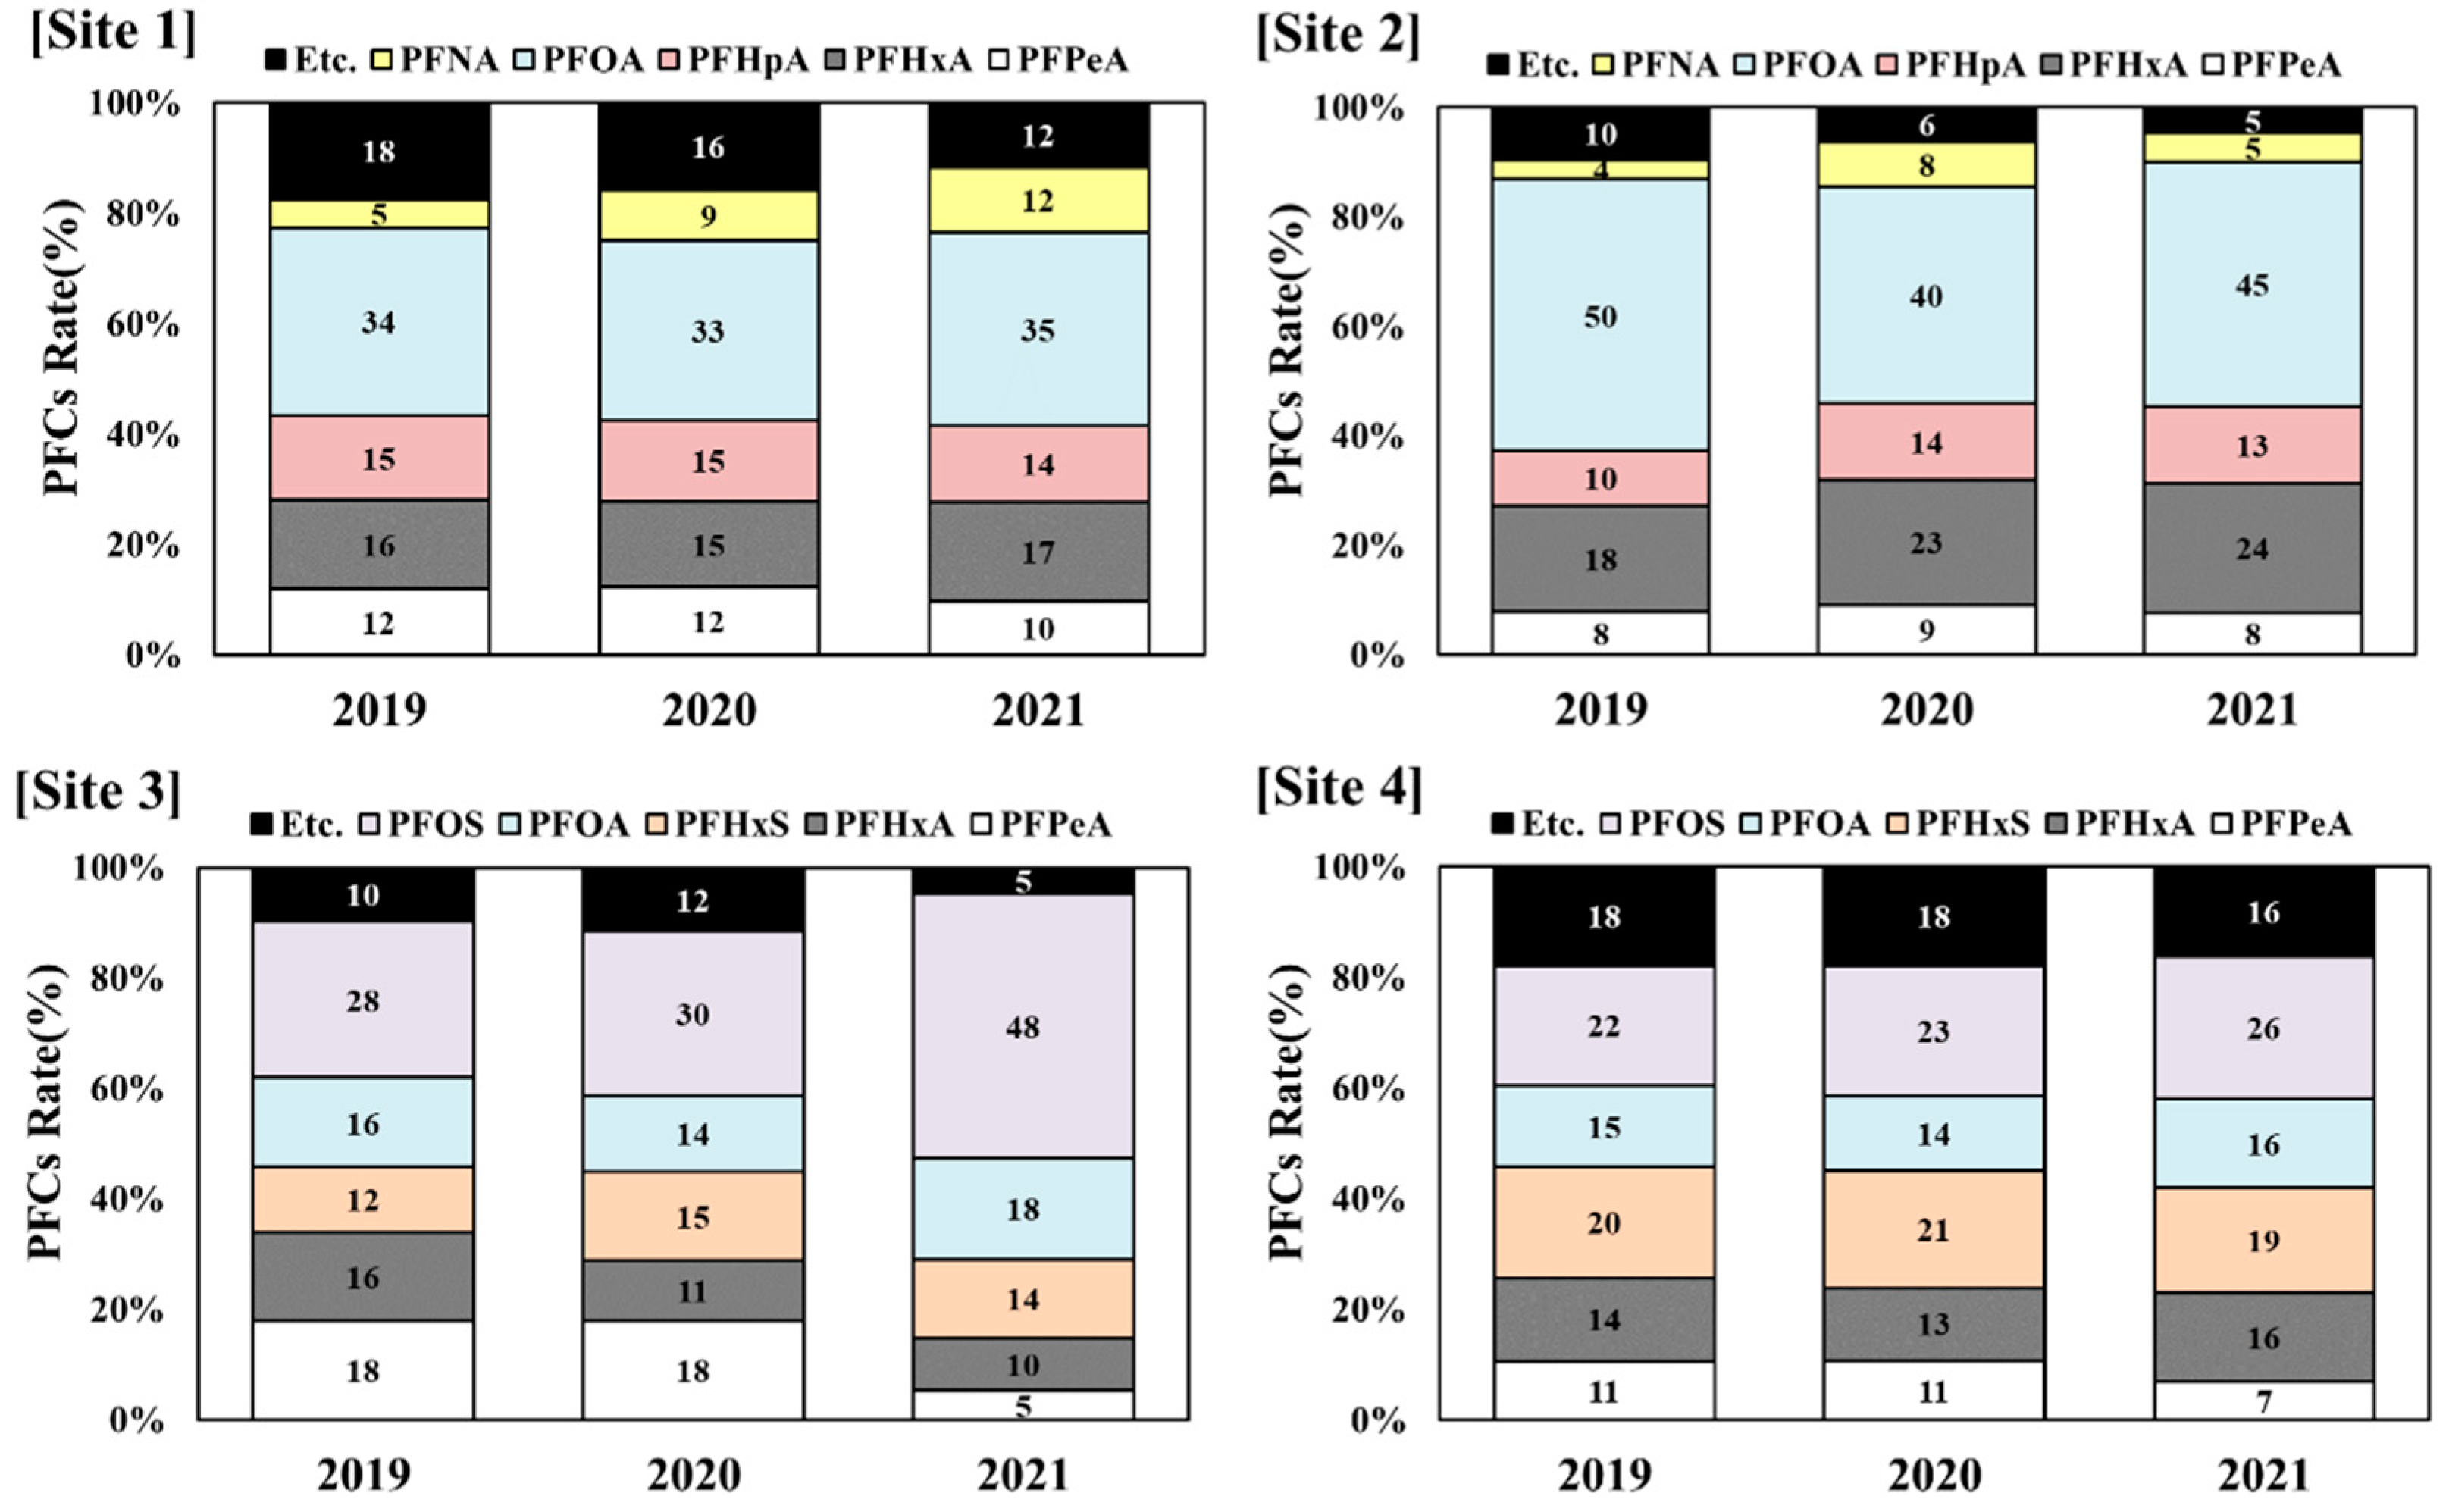
Analysis Results from Site-1

The following information is the result of the monitoring of 15 monitoring wells near an industrial complex (size: approx. 2.7 km2) ([between 2019 and 2021] average, detection rate): PFOA (0.119 nmol/L, 75.0%) > PFHxA (0.058 nmol/L, 68.9%) > perfluoroheptanoic acid (PFHpA) (0.052 nmol/L, 55.0%) > PFHxS (0.020 nmol/L, 50.0%) > PFPeA (0.040 nmol/L, 42.2%), which are the PFASs with relatively short chains of carbon. Among the PFASs, relatively more of the carboxyl type (88.5%) were detected than those of the sulfonyl type (11.5%). The PFAS detection rate did not show a meaningful difference depending on the survey period (Figure 5).

Analysis Results from Site-2

The following information is the result of the monitoring on 10 monitoring wells near an industrial complex (size: approx. 9.4 km2) ([between 2019 and 2021] average, detection rate): PFOA (0.425 nmol/L, 71.8%) > PFHxA (0.212 nmol/L, 68.9%) > PFHxS (0.028 nmol/L, 52.4%) > PFHpA (0.123 nmol/L, 51.6%) > PFPeA (0.079 nmol/L, 37.9%), of which the pattern is similar to that of Site-1 (carboxyl: 95.9% > sulfonyl: 4.1%) (Figure 5).

Analysis Results from Site-3

The following information is the result of the monitoring on 7 monitoring wells near an industrial complex (size: approx. 4.3 km2) ([between 2019 and 2021] average, detection rate): PFOS (0.033 nmol/L, 57.1%) > PFHxS (0.020 nmol/L, 48.8%) > PFOA (0.015 nmol/L, 47.6%) > PFHxA (0.012 nmol/L, 25.0%) > PFHpA (0.006 nmol/L, 21.4%). Among the PFASs, carboxyl type and sulfonyl type were detected at a similar rate (carboxyl: 49.8% ≒ sulfonyl: 50.2%) (Figure 5).

Analysis Results from Site-4

The following information is the result of the monitoring on 8 monitoring wells near an industrial complex (size: approx. 2.4 km2) ([between 2019 and 2021] average, detection rate): PFOA (0.044 nmol/L, 65.6%) > PFHxS (0.061 nmol/L, 52.1%) > PFHxA (0.044 nmol/L, 47.9%) > PFHpA (0.026 nmol/L, 46.9%) > PFOS (0.072 nmol/L, 40.6%), of which the pattern is similar to that of Site-3 (carboxyl: 50.8% ≒ sulfonyl: 49.2%) (Figure 5).

Results of In-Depth Monitoring (4 Sites)

The following information is the result of the in-depth monitoring ([between 2019 and 2021] average, detection rate): PFOA (0.165 nmol/L, 67.6%) > PFHxA (0.086 nmol/L, 55.6%) > PFHxS (0.029 nmol/L, 50.8%), which are the PFASs with relatively short chains of carbon (Figure 5).
In particular, a high concentration level of PFASs with relatively short chains of carbon was detected near the selected industrial complex. The concentration tended to reduce depending on the flowing direction of groundwater. At Site-1 and -2, there were relatively more carboxyl-type PFASs (e.g., PFOA) detected, and Site-3 and -4 showed relatively more sulfonic PFASs (e.g., PFOS) detected. It is difficult to let PFASs in groundwater be reduced in a natural manner, and that is why they were detected in similar patterns without drastic changes, regardless of the years when the research was conducted. Those PFASs have also been a potential contamination source in aquifers [39]. Therefore, there should be more series of studies, as well as constant monitoring regarding the management and reduction methods for the contamination source of PFASs (Figure 6).

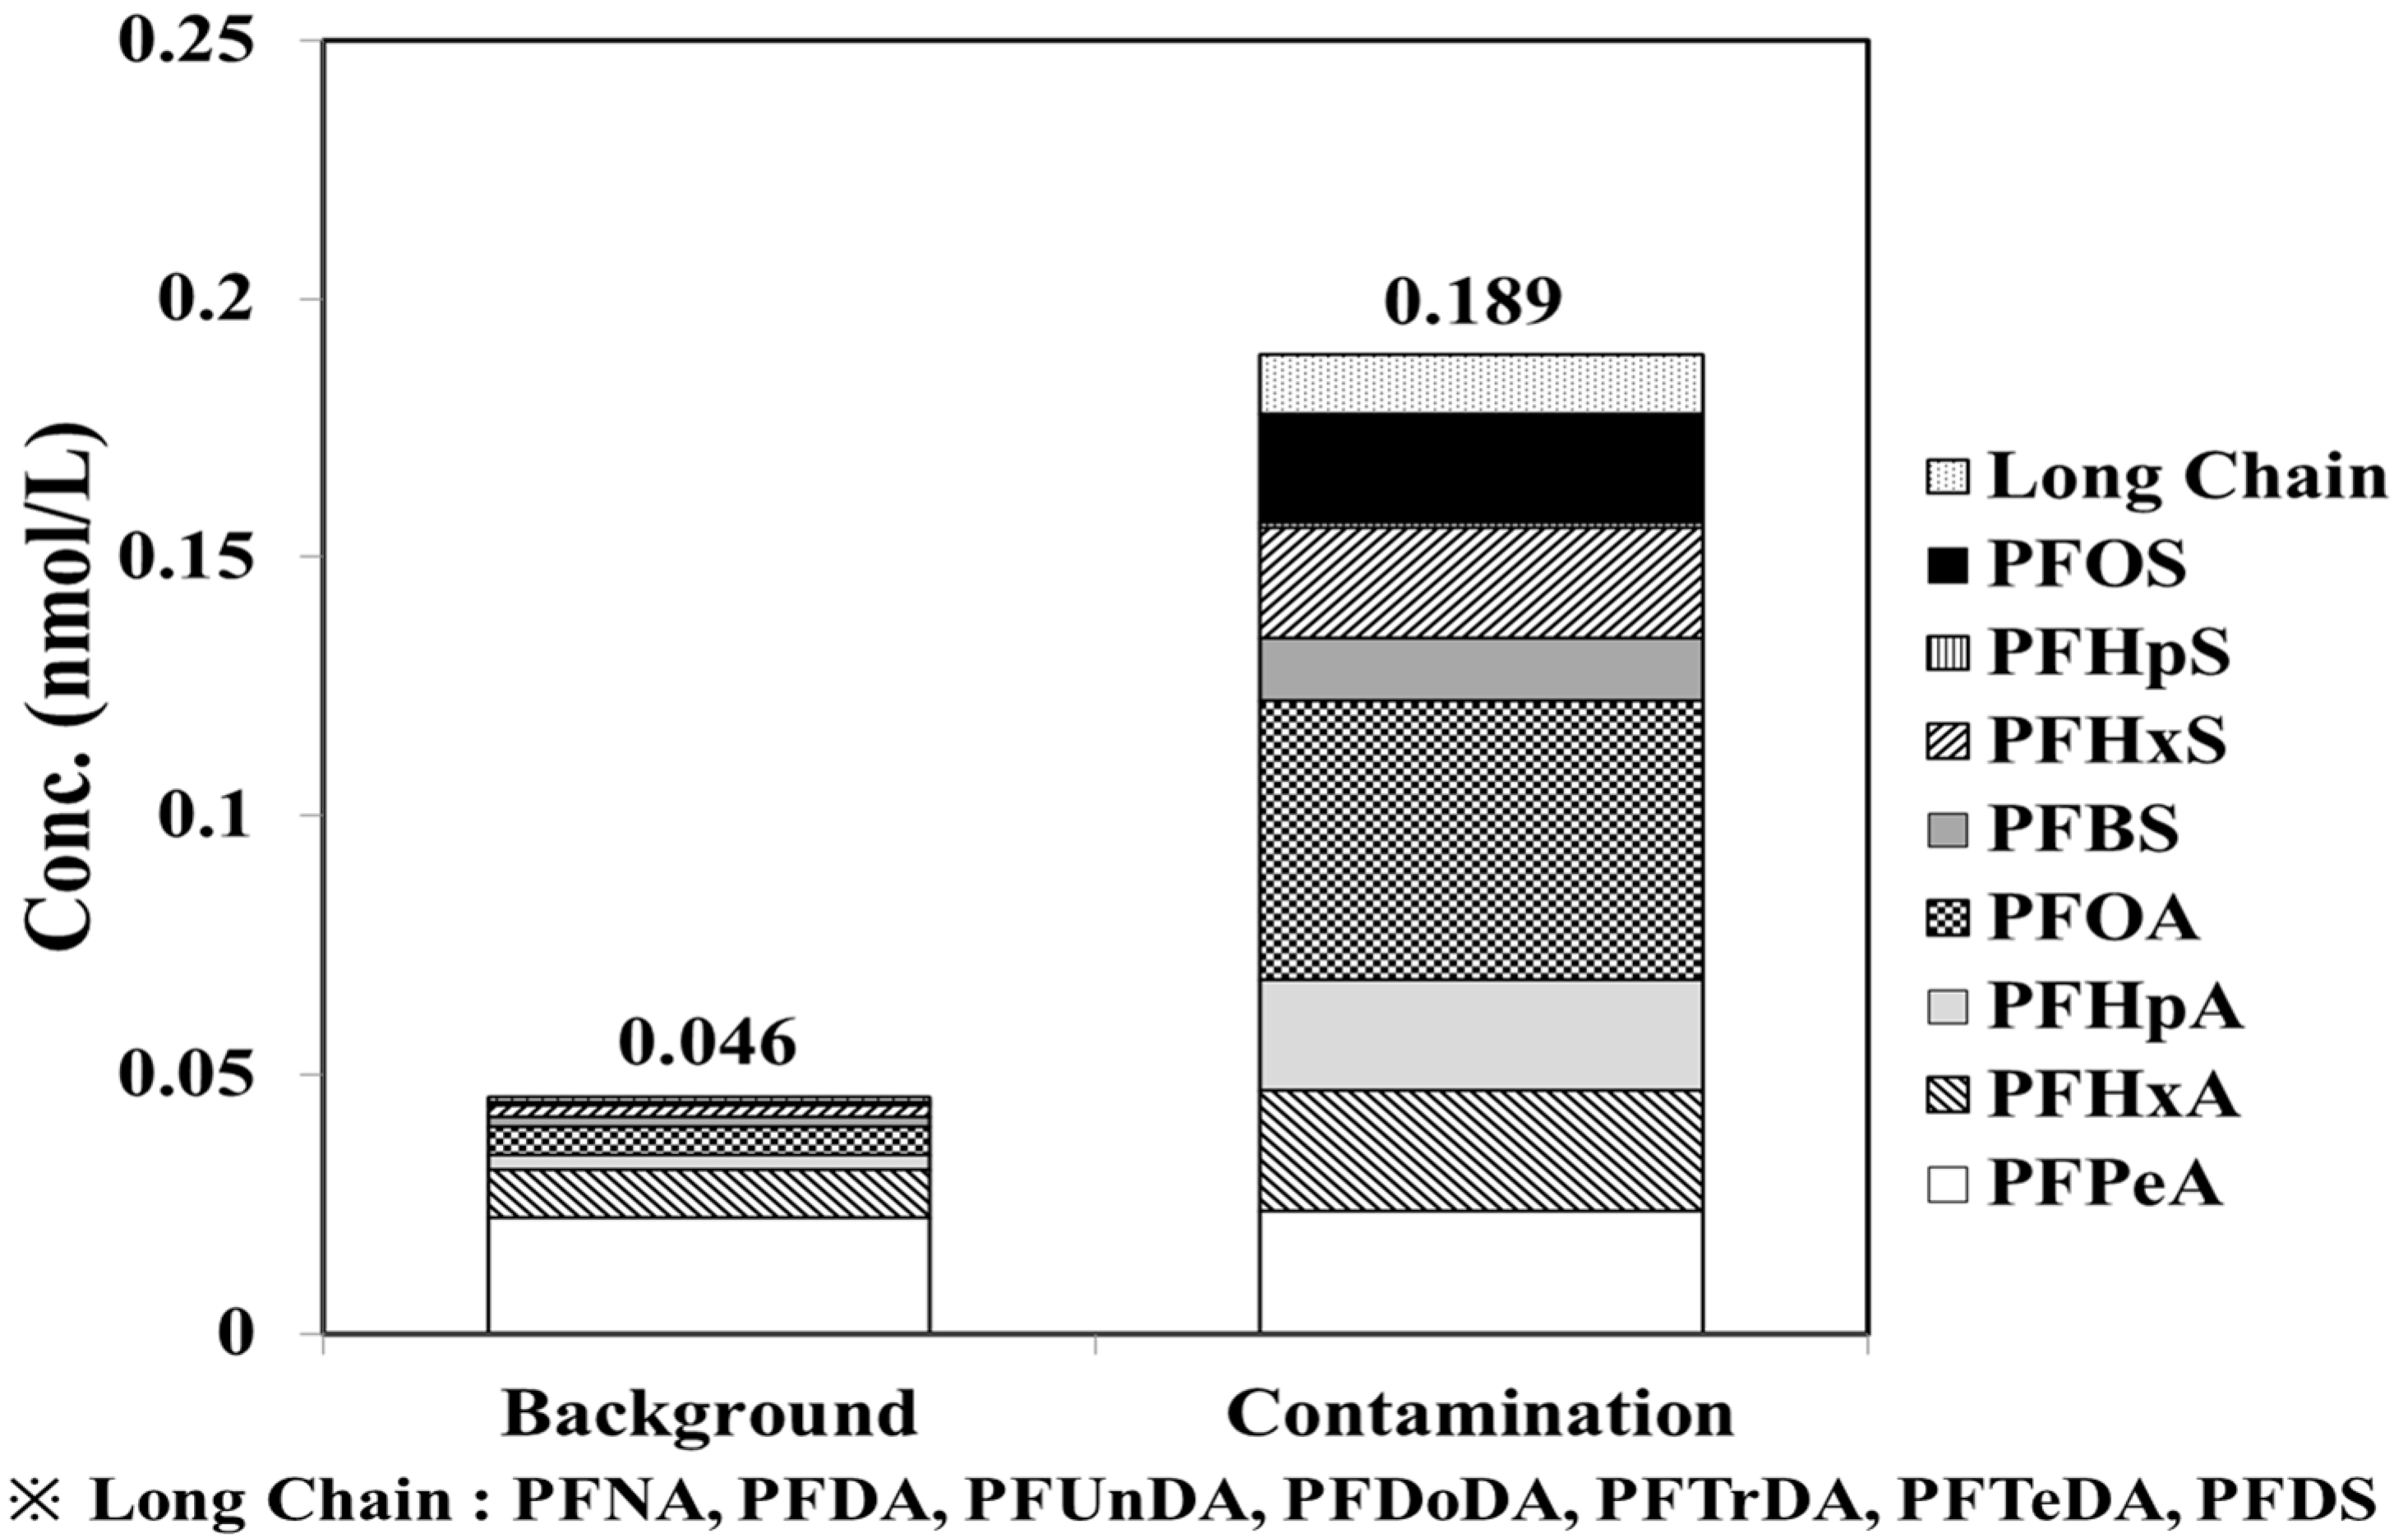
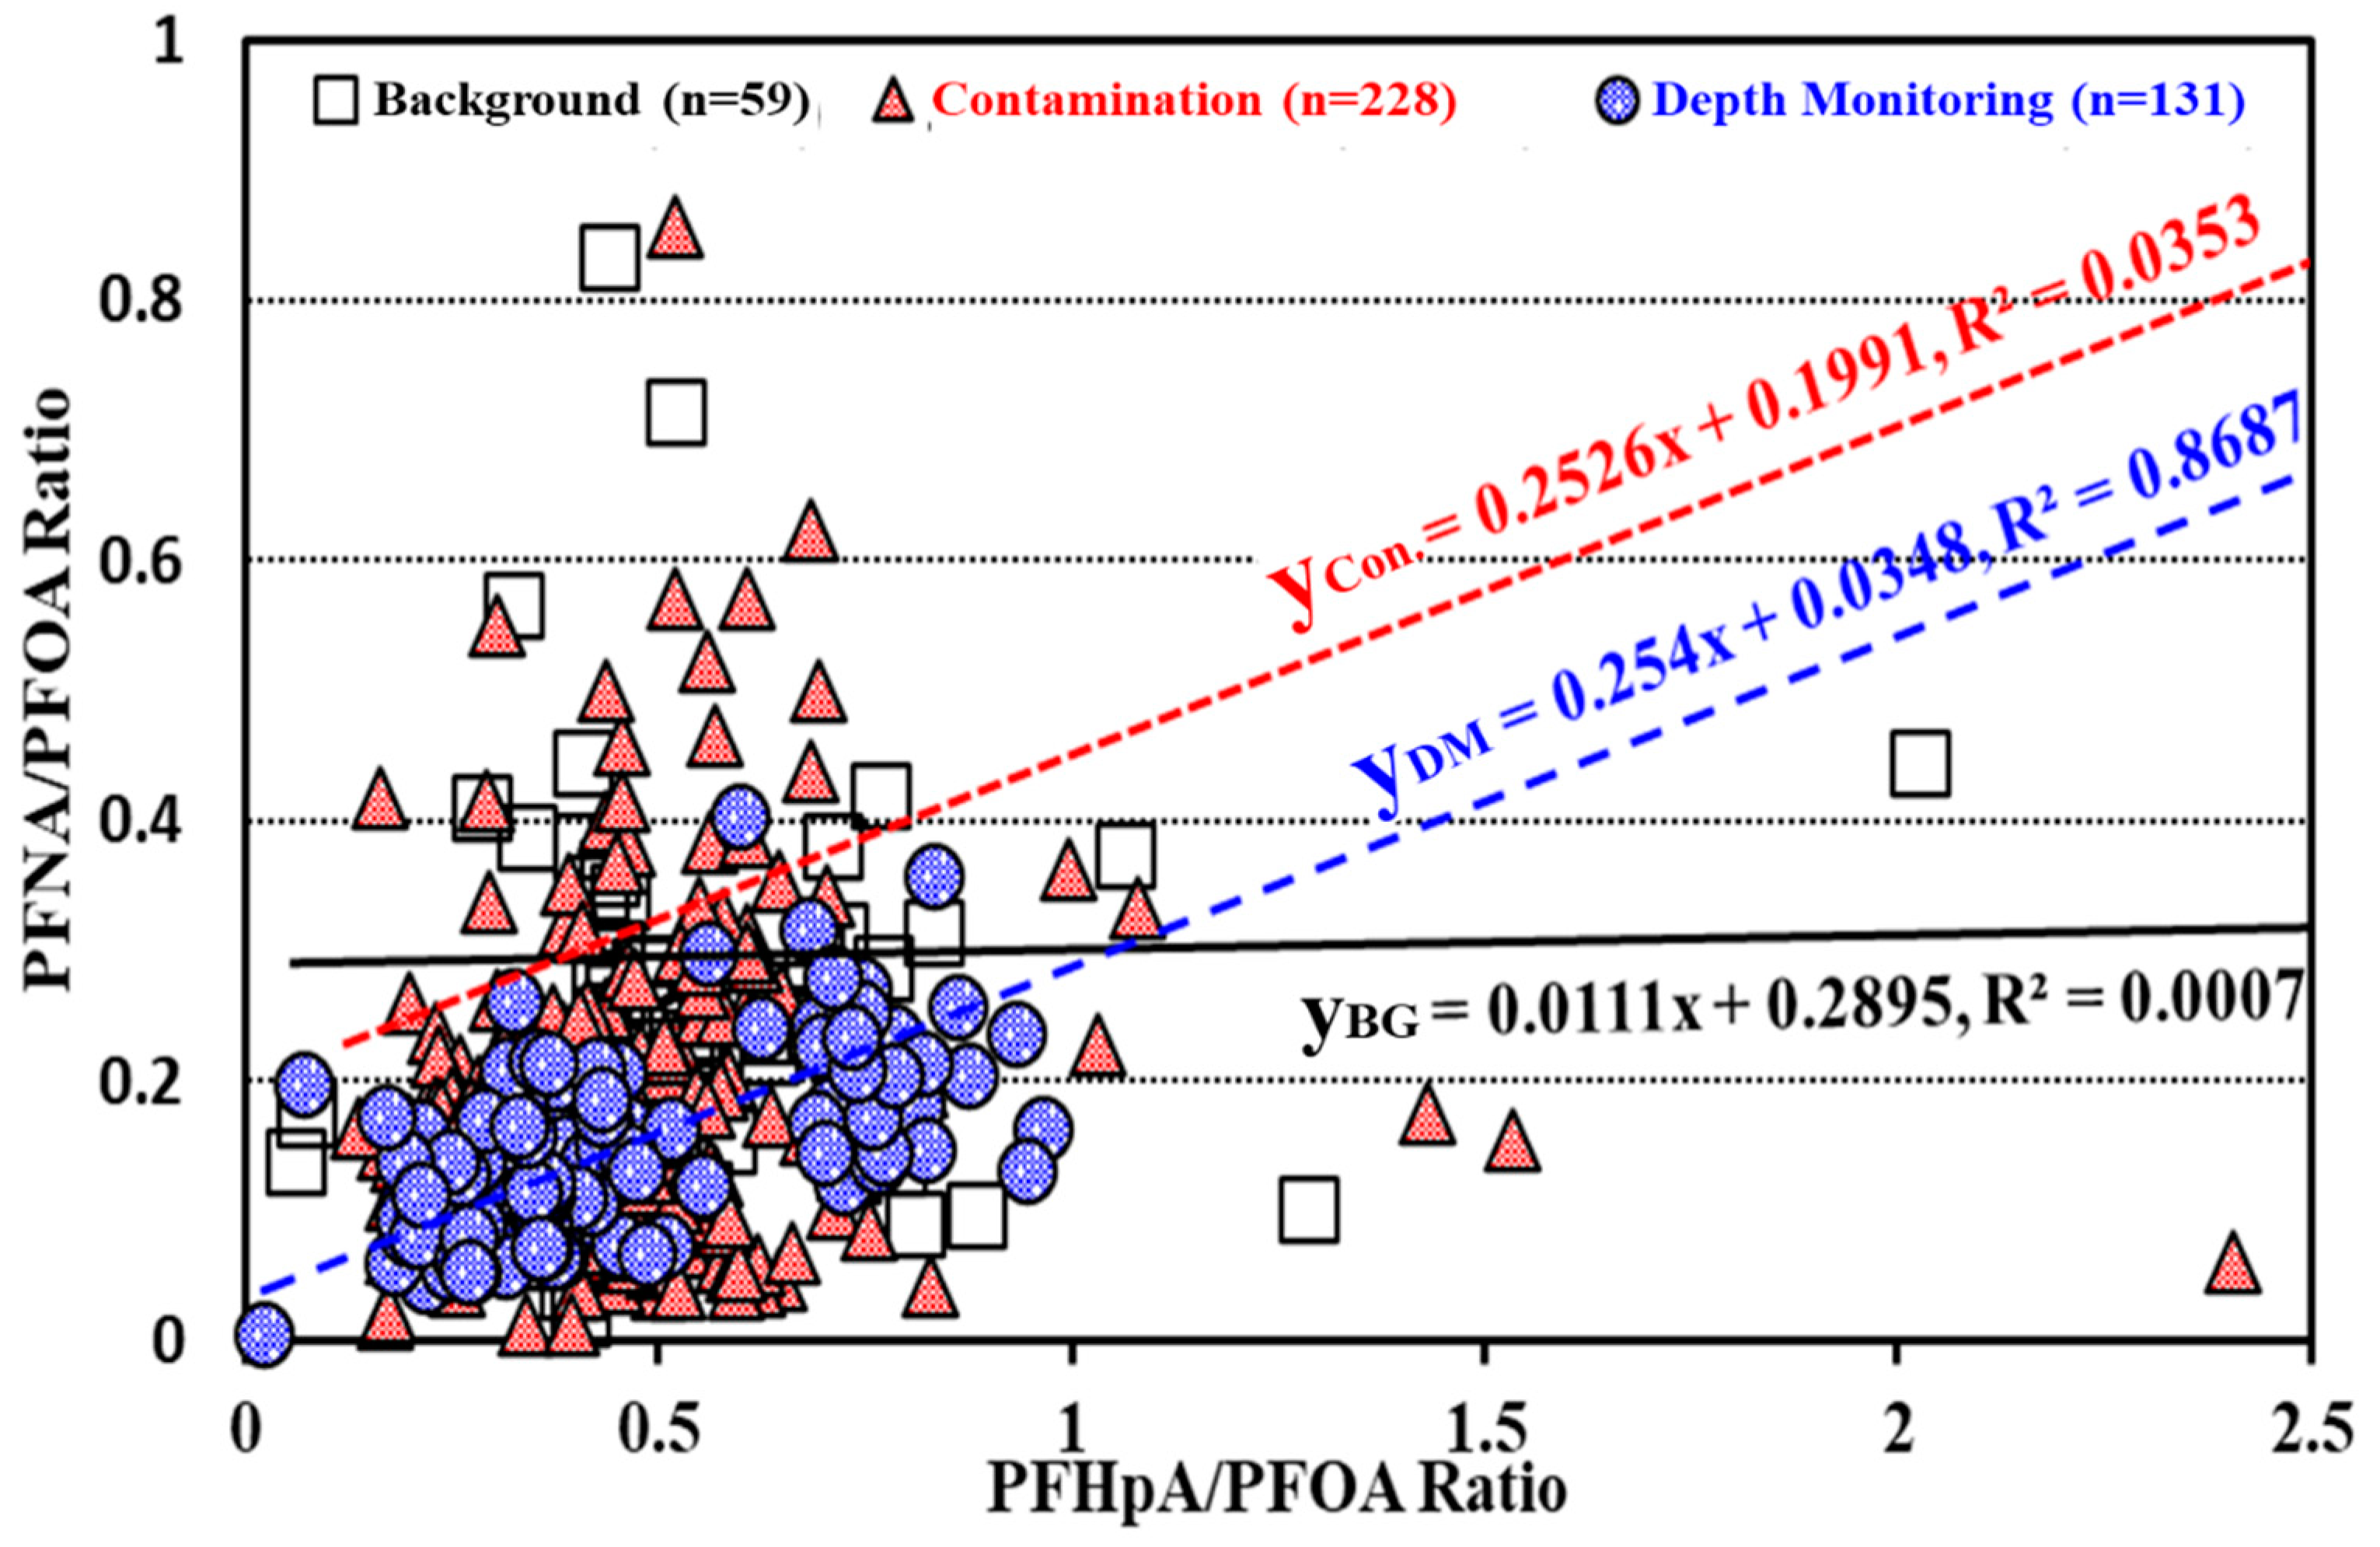
3.2.3. Assessment on Contamination Sources of PFASs in Groundwater

Environmental forensics is defined as evaluating physical, chemical, and historical information in a systematic and scientific manner with the purpose of developing scientific and legal grounding to discover where pollutants are discharged in the environment or how long the pollution has been present. Refs. [40] (208–217), [41] (101–113), and [42] (1–13) stated that it is possible to estimate a potential origin of pollutants by reviewing the ingredient ratio of PFASs. Regarding this, ref. [43] (8678–8683) reported that the ratio assessment on PFHpA/PFOA may help ascertain point contamination sources/air pollution sources. The correlation is possible because PFHpA is mainly related to a form of gas FTOH in the course of contacting the surface by rain [44]. Ref. [45] (1–10) announced that a relatively high level of PFOA/PFNA (same as low level of PFNA/PFOA) can be a sign that PFASs used for manufacturing various products are directly discharged into the environment. Alternatively, this high level can be an index regarding the creation of PFASs such as PFOA and PFHpA, which are created by the precursor of PFASs that exist in the environment.
This study is designed to compare and evaluate the correlation between the background monitoring well, contamination monitoring well, and the monitoring well for an in-depth survey with the contamination impact due to industrial activities by extracting the ratio of PFNA/PFOA–PFHpA/PFOA. As a result, Figure 7 from the monitoring well for in-depth survey and the contamination monitoring well show relatively high gradient and correlation (R2) compared to those from the background monitoring well. In other words, there was more of an impact from artificial contamination sources (e.g., manufacturing process of PFASs) for the monitoring well for the in-depth survey and the contamination monitoring well compared to those from the background monitoring well. In addition, when comparing the correlation (R2) between the in-depth monitoring well and the contamination monitoring well, the R2 from the contamination monitoring well was relatively low (0.0353). This suggests that there are some monitoring wells that are affected by the neighboring contamination sources within a 3 km radius, although some monitoring wells are not affected by the contamination sources.

3.3. Results of Assessment of Risk to Human Body (2018–2022)

As below, Table 5 describes the results of the assessment of risk to the human body via the route of exposure based on the 95th percentile concentration extracted from the background survey on PFASs.
As a result of risk assessment by item, the route of ingestion shows relatively high risks to the human body for all the surveyed items compared to dermal contact and inhalation. Meanwhile, PFOA that contains the confirmed carcinogen shows less than 10−6 of the carcinogenic risk level from all the exposure routes. With regard to the non-carcinogenic risk level, PFOA and PFOS show a level above 0.1, which is a part of the current monitoring list for drinking water. Other than that, there were more non-carcinogenic risks confirmed at a level that is not ideal to ignore (between 0.01 and 0.1). This suggests that it is necessary to secure some measures to manage PFASs. This result of risk levels is similar to the level suggested by the Interim recommendation of the US EPA [46], of which the HQ level of PFOA or PFOS is 0.1, and the screening level of ground water is 40 ng/L. Moreover, [47] has proposed a national primary drinking water regulation (NPDWR) to establish legally enforceable levels, called maximum contaminant levels (MCLs), for six PFAS in drinking water about PFOA (4 ng/L) and PFOS (4 ng/L) as individual contaminants.

4. Conclusions

This study suggests the initial methods of using LC-MSMS for the simultaneous analysis of 16 PFASs in groundwater. In addition, we obtained the distribution characteristics and major detection compounds for 16 PFASs in the shallow aquifer by groundwater monitoring in wells nation-wide or around locations with high PFAS concentrations. Along with the human risk assessment with the consideration of the exposure route of groundwater and the PFAS characteristic pattern assessment on temporal variation, this research has concluded the following observations:
  • As a result of the assessment on possibilities of the simultaneous analysis on PFASs in ground water, the accuracy (0.6–11.6%) and precision (90.3–108.0%) of each item meets both Korean and international standards of the analysis methods for PFASs in water. The LOQ by item ranges between 0.3 ng/L and 1.6 ng/L. The reporting limit for all the items were set with 5 ng/L of the LOQ, which is suggested by the Korean Water Pollution Standard Method (ES. 04506.1).
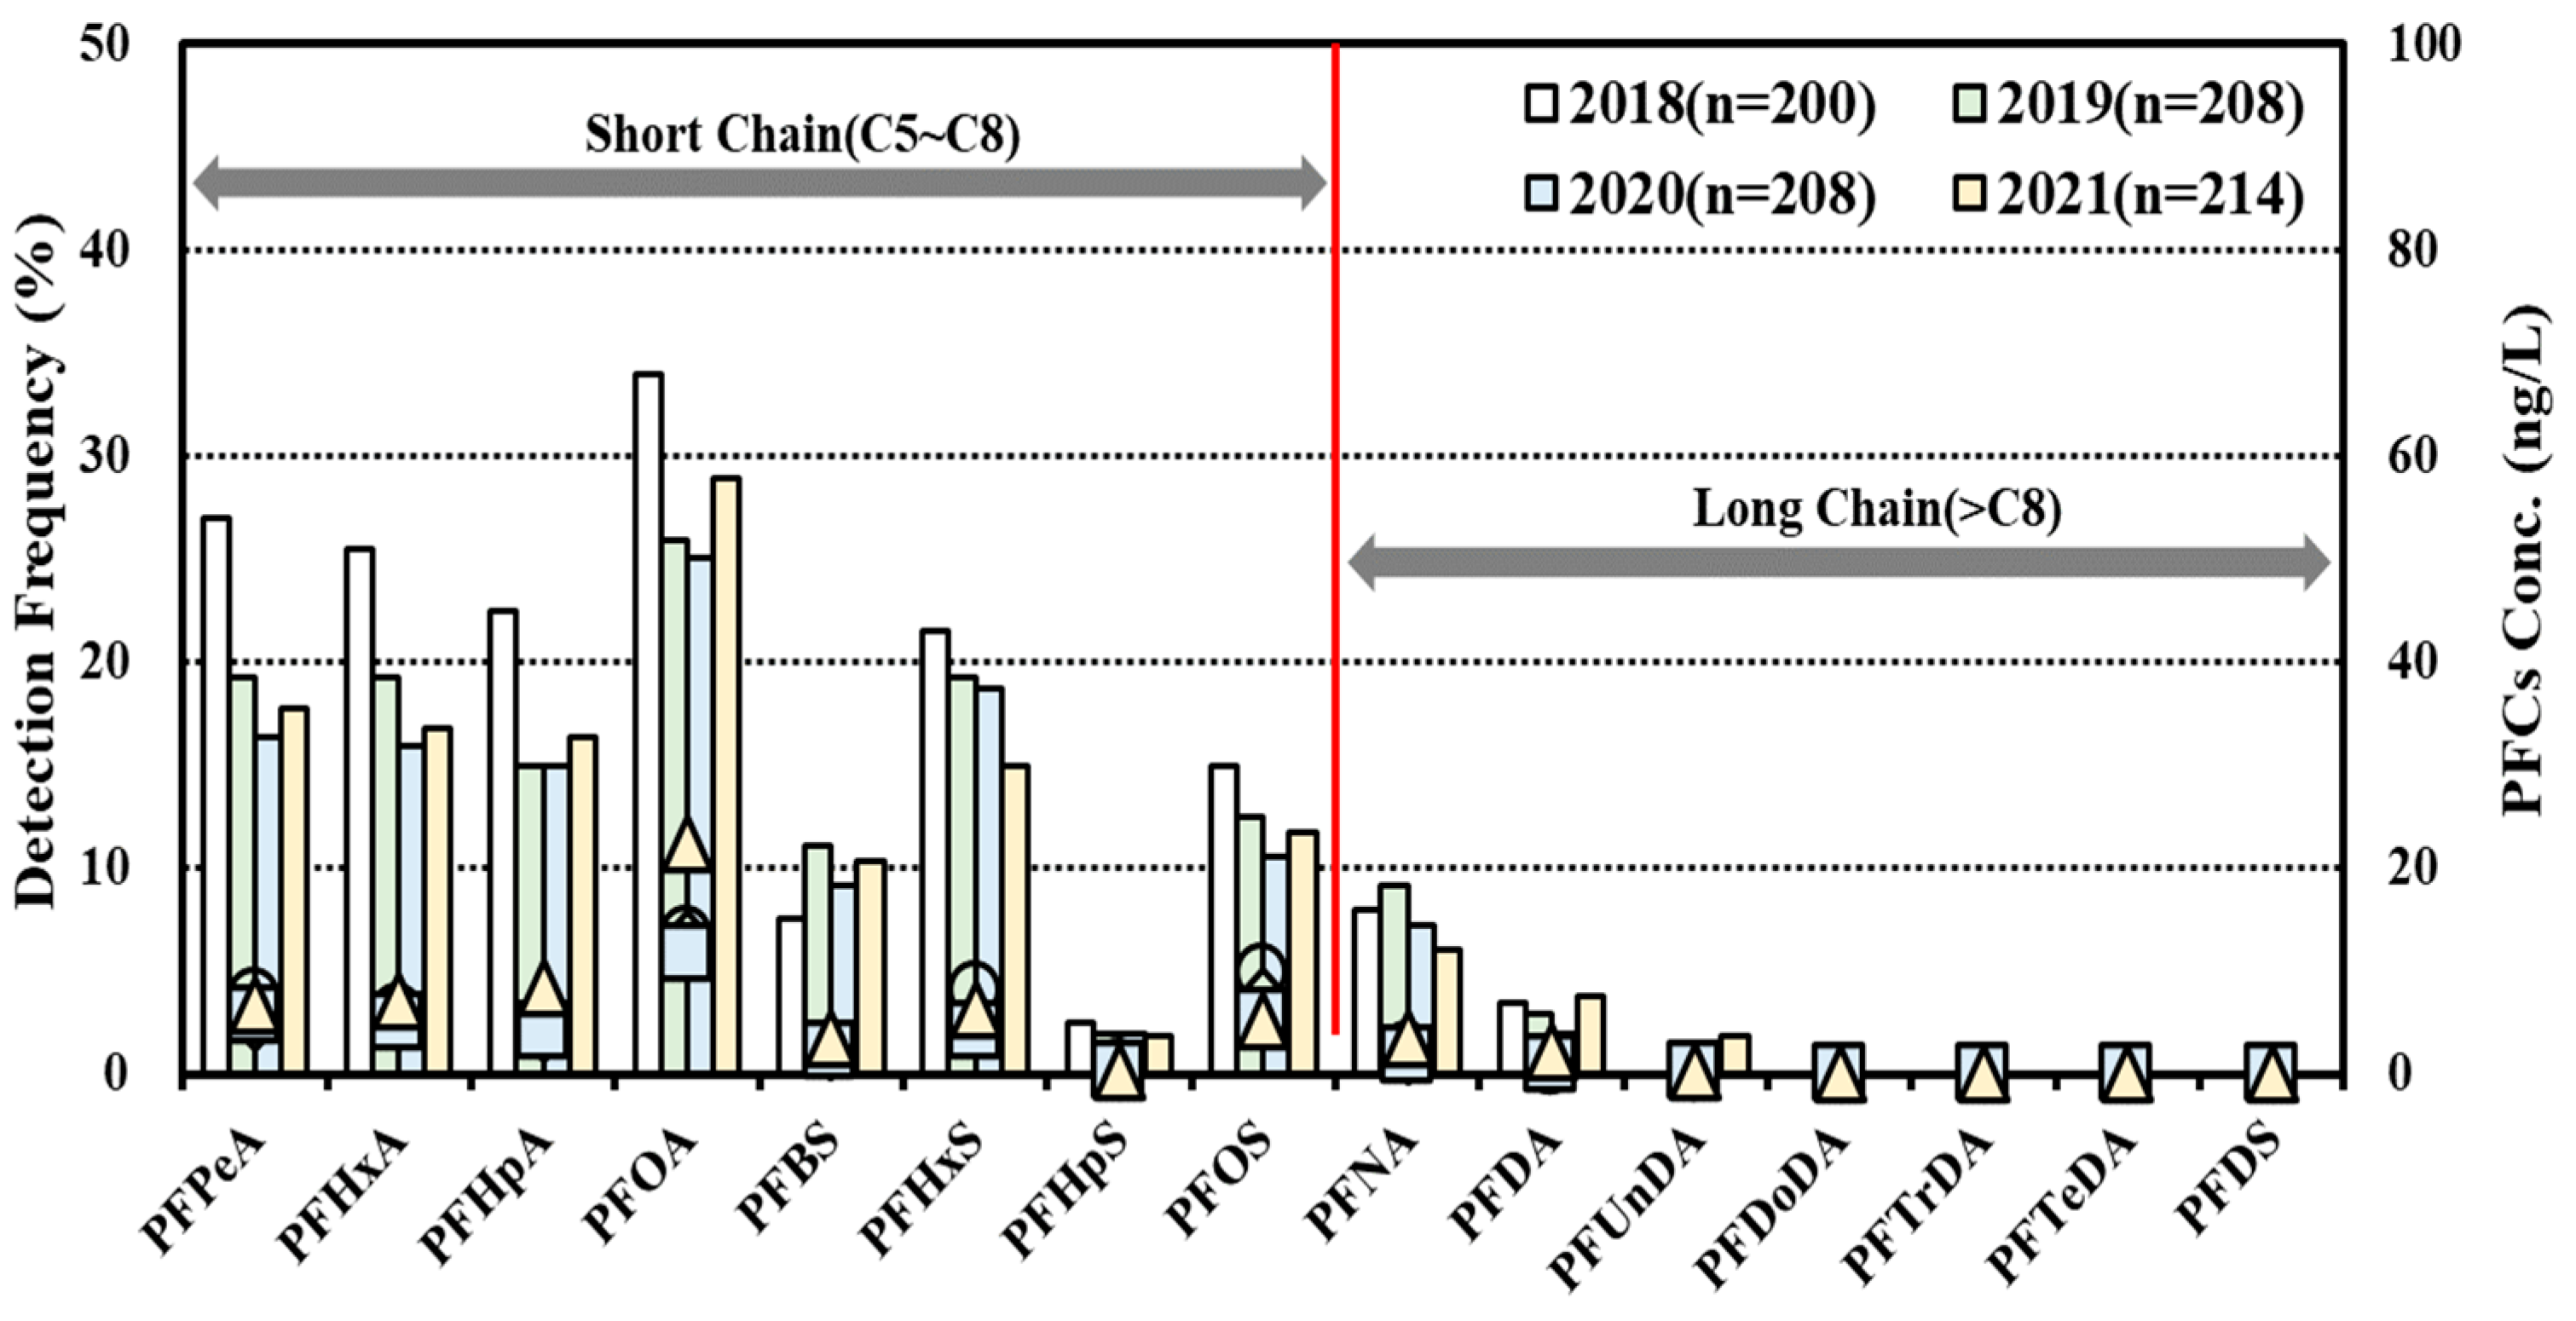
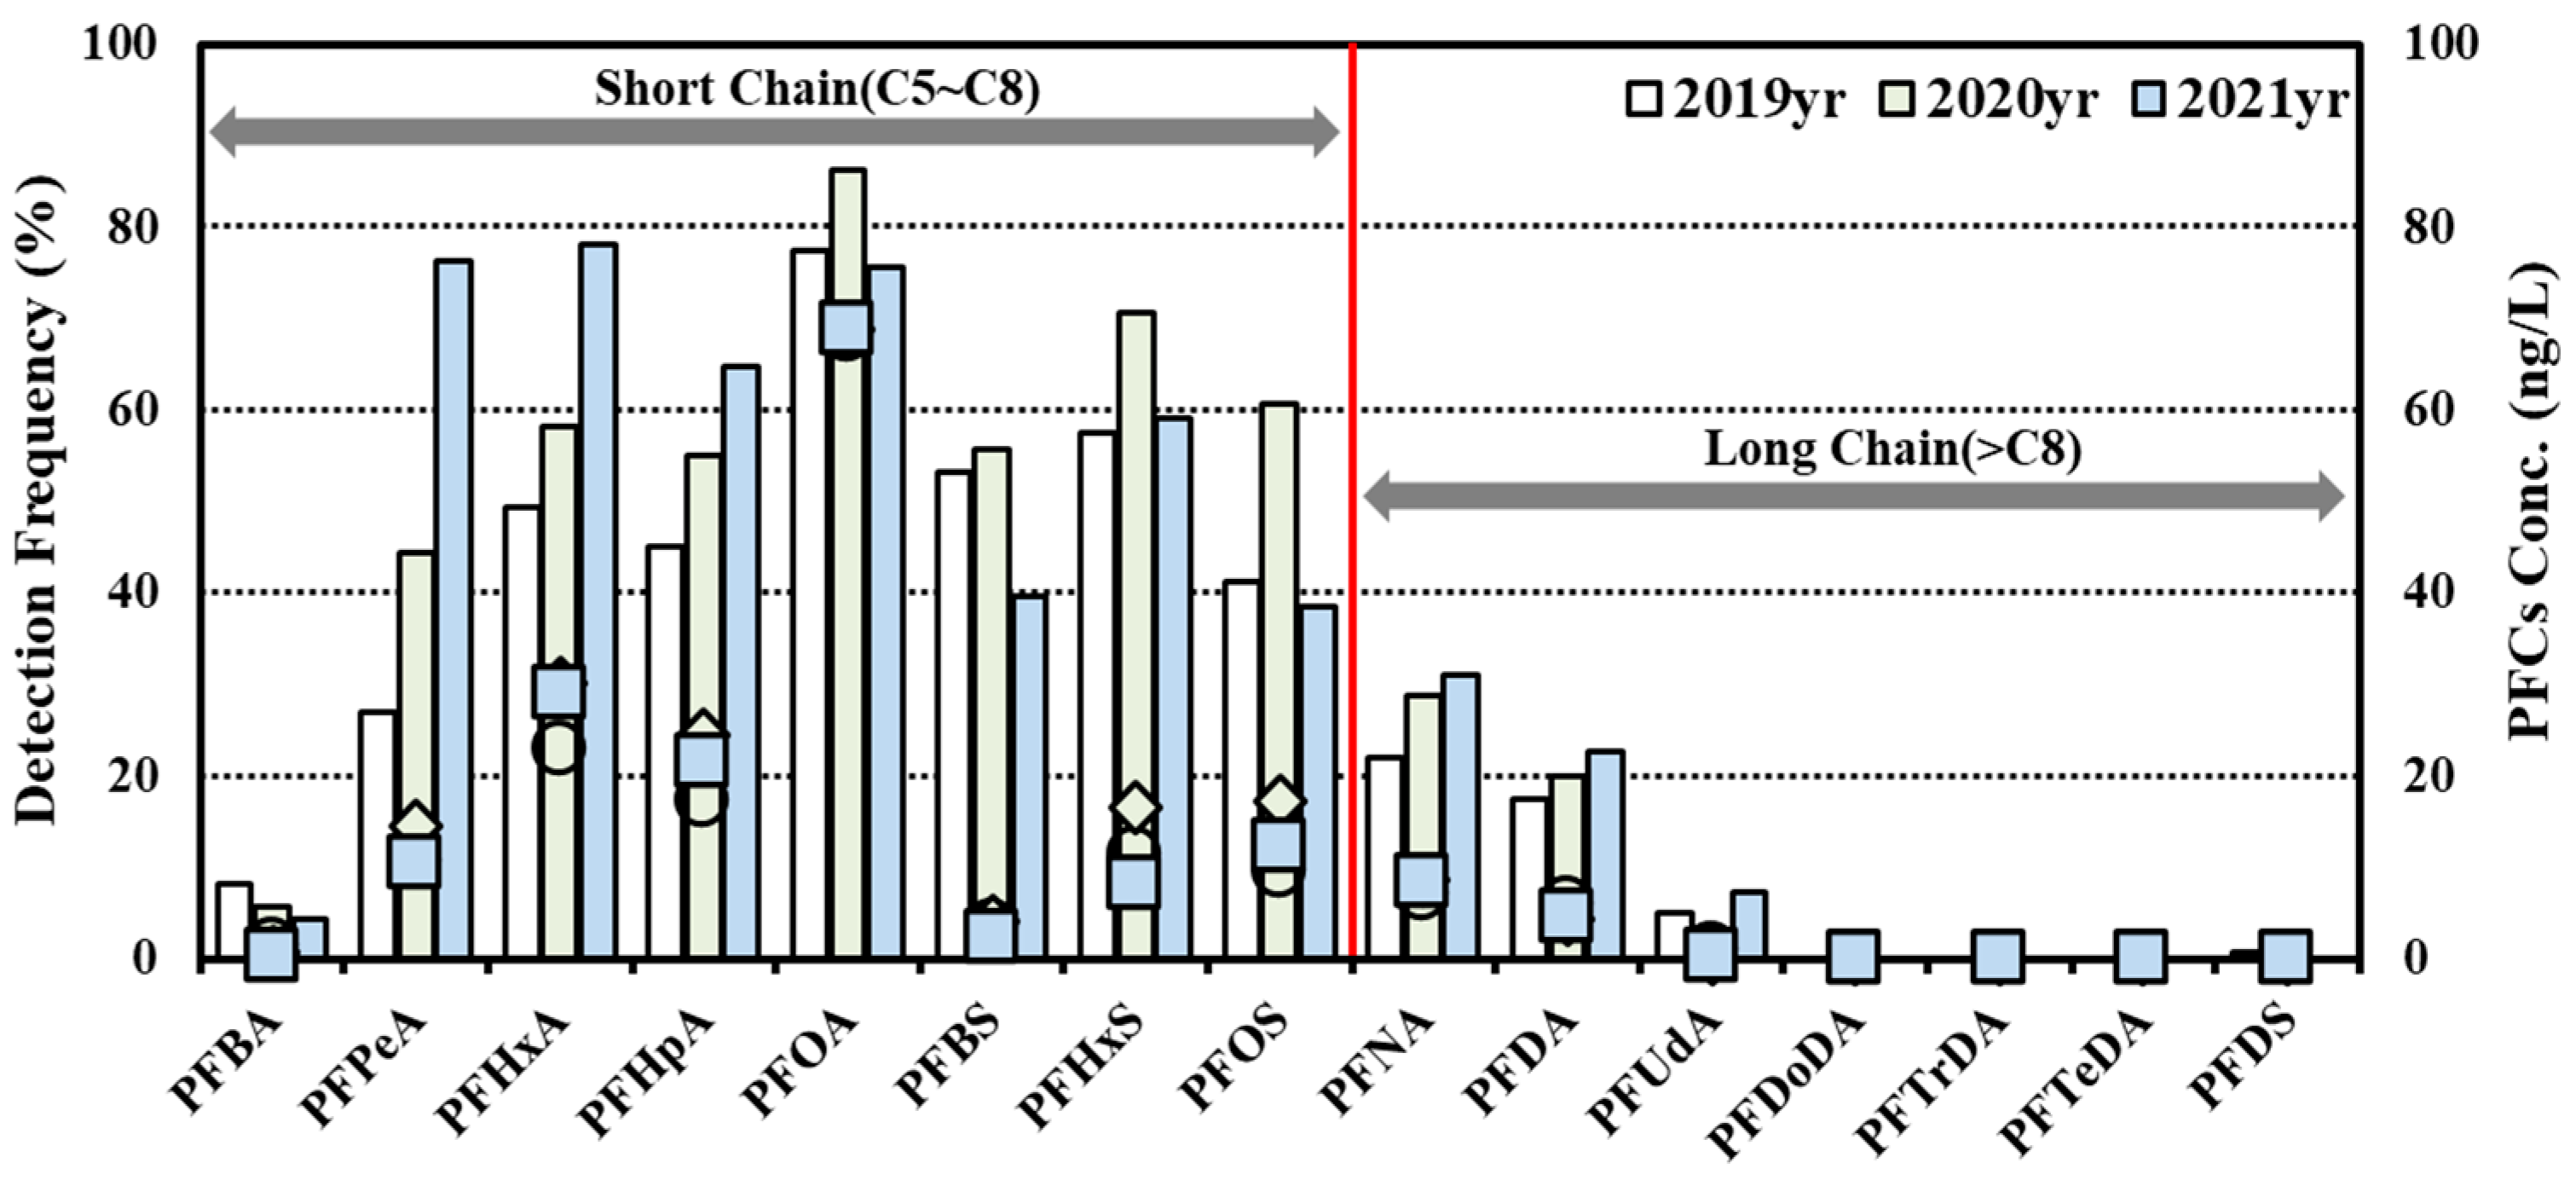
  • As a result of the status survey on PFASs in groundwater PFOA (0.025 nmol/L, 28.8%), PFPeA (0.020 nmol/L, 20.1%) and PFHxA (0.013 nmol/L, 19.6%) were detected in the aforementioned order. As a survey result of the distribution rate, depending on different types of PFASs, there were relatively more carboxyl-type PFASs detected than sulfonic PFASs. In addition, PFASs with relatively short chains (8 or less) of carbon showed relatively higher concentrations and frequencies than those with longer chains (9 or more) of carbon.
  • As a result of the human risk assessment of PFASs in groundwater, PFOA and PFOS show relatively higher levels of risk (non-carcinogenic risk level: 10−1) compared to other PFASs. When it comes to the assessment of risk contribution to the human body by exposure route, the route of ingestion contributed to risks to the human body among all the items detected from PFASs more than other routes (e.g., inhalation, dermal contact).
This study confirms that PFASs in the groundwater in South Korea are detected in the range of dozens to hundreds ng/L at some locations. In particular, the level of PFOA and PFOS turned out to be not ideal to ignore according to the assessment of risk to the human body (non-carcinogenic risk level: 10−1). Therefore, this study concludes that some further studies are needed regarding the assessment of the movement characteristics of PFASs and how to eliminate them in the environment in order to secure measures to manage those that are often detected from groundwater and are harmful to the human body, such as PFOA and PFOS.

Author Contributions

Conceptualization, S.P.; Data curation, J.-H.Y., J.-B.K., H.C. and M.K.; Writing—original draft, S.P. and D.-H.K.; Writing—review & editing, S.-K.S. and H.-K.K.; Project administration, S.P. All authors have read and agreed to the published version of the manuscript.

Funding

This research was funded by the Ministry of Environment of the Republic of Korea (NIER-2021-01-01-114; NIER-03-02-021), and grant from the National Institute of Environmental Research (NIER).

Institutional Review Board Statement

Not applicable.

Informed Consent Statement

Not applicable.

Data Availability Statement

Data will be available with permission of the NIER.

Conflicts of Interest

The authors declare that they have no conflict of interest.

References

  1. Cui, D.; Li, X.; Quinete, N. Occurrence, fate, sources and toxicity of PFAS: What we know so far in Florida and major gaps. Trends Anal. Chem. 2020, 130, 115976. [Google Scholar] [CrossRef]
  2. Wang, Z.; Buser, A.M.; Cousins, I.T.; Demattio, S.; Drost, W.; Johansson, O.; Ohno, K.; Patlewicz, G.; Richard, A.M.; Walker, G.W.; et al. A new OECD definition for per- and polyfluoroalkyl substances. Environ. Sci. Technol. 2021, 55, 15575–15578. [Google Scholar] [CrossRef] [PubMed]
  3. Kwon, Y.; Sa, J.; Kim, J.; Min, S. Study on environmental regulation of aqueous film forming foam and use of C4-based eco-friendly aqueous film forming foam. J. Korean Soc. Hazard Mitig. 2022, 22, 125–131. [Google Scholar] [CrossRef]
  4. Shahsavari, E.; Rouch, D.; Khudur, L.S.; Thomas, D.; Medina, A.A.; Ball, A.S. Challenges and current status of biological treatment of PFAS-contaminated soils. Front. Bioeng. Biotechnol. 2021, 8, 602040. [Google Scholar] [CrossRef]
  5. Chen, S.; Jiao, X.C.; Gai, N.; Li, X.J.; Wang, X.C.; Lu, G.H.; Piao, H.T.; Rao, Z.; Yang, Y.L. Perfluorinated compounds in soil, surface water, and groundwater from rural areas in eastern China. Environ. Pollut. 2016, 211, 124–131. [Google Scholar] [CrossRef]
  6. Patrik, N.B. Toxicological Profile for Perfluoroalkyls; Final Release; ATSDR, Division of Toxicology and Human Health Science: Atlanta, GA, USA, 2021; pp. 1–822.
  7. Bartell, S.M.; Bolt, H.M.; Cesta, M.F.; Chiu, W.; Cooper, G.; DeWitt, J.; Frisen, M.D.; Fritschi, L.; Fukushima, S.; Hansen, J.; et al. IARC Monographs: Some Chemicals Used as Solvents and in Polymer Manufacture; International Agency for Research on Cancer: Lyon, France, 2017; Volume 110, pp. 37–110.
  8. Han, X.; Snow, T.A.; Kemper, R.A.; Jepson, G.W. Binding of perfluorooctanoic acid to rat and human plasma proteins. Chem. Res. Toxicol. 2003, 16, 775–781. [Google Scholar] [CrossRef]
  9. Bartell, S.M.; Vieira, V.M. Critical review on PFOA, kidney cancer, and testicular cancer. J. Air Waste Manag. Assoc. 2017, 71, 663–679. [Google Scholar] [CrossRef]
  10. IARC Monographs on the Identification of Carcinogenic Hazards to Humans: Report of the Advisory Group to Recommend Priorities for the IARC Monographs During 2020–2024. Available online: https://monographs.iarc.who.int/wp-content-uploads/2019/10/IARCMonographs-AGReport-Priorities_2020-2024.pdf (accessed on 10 March 2023).
  11. NTP Monograph on Immunotoxicity Associated with Exposure to Perfluorooctanoic Acid (PFOA) or Perfluorooctan Sulfonate (PFOS). Available online: https://ntp.niehs.nih.gov/ntp/ohat/pfoa_pfos/pfoa_pfosmonograph_508.pdf (accessed on 19 March 2023).
  12. Borg, D.; Lund, B.O.; Lindquist, N.G.; Hakansson, H. Cumulative health risk assessment of 17 perfluoroalkylated and 405 polyfluoroalkylated substances(PFASs) in the Swedish population. Environ. Int. 2013, 59, 112–123. [Google Scholar] [CrossRef]
  13. Banzhaf, S.; Filipovic, M.; Lewis, J.; Sparrenbom, C.J.; Barthel, R. A review of contamination of surface-, ground-, and drinking water in Sweden by perfluoroalkyl and polyfluoroalkyl substances(PFASs). Ambio 2017, 46, 335–346. [Google Scholar] [CrossRef] [Green Version]
  14. Arvaniti, O.S.; Stasinakis, A.S. Review on the occurrence, fate and removal of perfluorinated compounds during wastewater treatment. Sci. Total Environ. 2015, 524–525, 81–92. [Google Scholar] [CrossRef]
  15. Filipovic, M.; Berger, U. Are perfluoroalkyl acids in wastewater treatment plant effluents the result of primary emissions from the technosphere or of environmental recirculation? Chemosphere 2015, 129, 74–80. [Google Scholar] [CrossRef] [PubMed]
  16. Fact Sheet: PFOA & PFOS Drinking Water Health Advisories. Available online: https://www.epa.gov/sites/default/files/2016-06/documents/drinkingwaterhealthadvisories_pfoa_pfos_updated_5.31.16.pdf (accessed on 14 February 2023).
  17. Commission Regulation (EU) 2017/1000. Available online: https://www.eur-lex.europa.eu/legal-content/EN/TXT/PDF/?uri=CELEX:32017R1000&rid=8 (accessed on 14 February 2023).
  18. Regulation (EU) 2019/1021 of the European Parliament and of the Council. Available online: https://eur-lex.europa.eu/legal-content/EN/TXT/PDF/?uri=CELEX:32019R1021&from=EN (accessed on 14 February 2023).
  19. Commission Delegated Regulation (EU) 2070/784. Available online: https://eur-lex.europa.eu/legal-content/EN/TXT/PDF/?uri=CELEX:32020R0784&rid=1 (accessed on 14 February 2023).
  20. Voluntary Groundwater Watch List Concept & Methodology. Available online: https://circabc.europa.eu/sd/a/d3fa0178-0134-4316-a11c-dcfd71efca69/Watch-List_Concept_Final.pdf (accessed on 14 February 2023).
  21. Sörengård, M.; Bergström, S.; McCleaf, P.; Wiberg, K.; Ahrens, L. Long-distance transport of per- and polyfluoroalkyl substances(PFAS) in a Swedish drinking water aquifer. Environ. Pollut. 2022, 311, 433–446. [Google Scholar] [CrossRef] [PubMed]
  22. Barreca, S.; Busetto, M.; Vitelli, M.; Colzani, L.; Clerici, L.; Pierluisa, D. Online solid-phase extraction LC-MS/MS: A rapid and valid method for the determination of perfluorinated compounds at sub ng·L−1 level in natural water. J. Chem. 2018, 2018, 1–9. [Google Scholar] [CrossRef] [Green Version]
  23. Savoca, D.; Melfi, R.; Piccionello, A.P.; Barreca, S.; Buscemi, S.; Arizza, V.; Arculeo, M.; Pace, A. Presence and biodistribution of perfluorooctanoic acid(PFOA) in paracentrotus lividus highlight its potential application for environmental biomonitoring. Nat. Sci. Rep. 2021, 11, 18763. [Google Scholar] [CrossRef] [PubMed]
  24. Kim, H.K.; Park, S.H.; Hwang, J.Y.; Kim, M.S.; Jo, H.J.; Jeon, S.H.; Lee, K.K.; Jeen, S.W. Groundwater qualities of wells around carcass burial areas. Korean J. Geol. Soc. 2017, 53, 433–446. [Google Scholar] [CrossRef]
  25. National Institute of Environmental Research. Study on Groundwater Standared of Unregulated Contaminants and Remediation Standard for TPH and Chlorinated Compounds (PCE, TCE); National Institute of Environmental Research: Incheon, Republic of Korea, 2018.
  26. EPA. Guidelines for Exposure Assessment; EPA/600/Z-92/001; United States Environmental Protection Agency: Washington, DC, USA, 1992.
  27. EPA. Risk Assessment Guidance for Superfund Volume III; Part A, Process for Conducting Probabilistic Risk assessment; United States Environmental Protection Agency: Washington, DC, USA, 2001.
  28. Kim, S.H. Guidelines for Risk Assessment Reports; Ministry of Food and Drug Safety: Cheongju-si, Republic of Korea, 2015; pp. 1–47.
  29. EPA. Risk Assessment Guidance for Superfund Volume I-Human Health Evaluation Manual (Part A); EPA/540/1-89/002; United States Environmental Protection Agency: Washington, DC, USA, 1989.
  30. Brown, L.M.; Pottern, L.M.; Blot, W.J. Lung cancer in relation to environmental pollutants emitted from industrial sources. Environ. Res. 1984, 34, 250–261. [Google Scholar] [CrossRef]
  31. McKone, T.E. Human exposure to volatile organic compounds in houhold tap water: The indoor inhalation pathway. Environ. Sci. Technol. 1987, 21, 1194–1201. [Google Scholar] [CrossRef]
  32. Marti, V.; DePablo, J.; Jubany, I.; Rovira, M.; Orejudo, E. Water-air volatilization factors to determine volatile organic compound(VOC) reference levels in water. Toxics 2014, 2, 276–290. [Google Scholar] [CrossRef] [Green Version]
  33. Liu, Z.; Lu, Y.; Wang, T.; Wang, P.; Li, Q.; Johnson, A.C.; Sarvajayakesavalu, S.; Sweetman, A.J. Risk assessmemnt and source identification of perfluoroalkyl acids in surface and groundwater: Spatial distribution around a mega-fluorochemical industrial park China. Environ. Int. 2016, 91, 69–77. [Google Scholar] [CrossRef] [Green Version]
  34. Barreca, S.; Busetto, M.; Colzani, L.; Clerici, L.; Marchesi, V.; Tremolada, L.; Daverio, D.; Dellavedova, P. Hyphenated high performance liquid chromatography-tandem mass spectrometry techniques for the determination of perfluorinated alkylated substances in Lombardia region in Italy, profile levels and assessment: One year of monitoring activated during 2018. Seperations 2020, 7, 17. [Google Scholar] [CrossRef] [Green Version]
  35. Ahrens, L.; Shoeib, M.; DelVento, S.; Codling, G.; Halsall, C. Polyfluoroalkyl compounds in the Canadian arctic atmosphere. Environ. Chem. 2011, 8, 399–406. [Google Scholar] [CrossRef] [Green Version]
  36. Ruan, T.; Lin, Y.; Wang, T.; Jiang, G.; Wang, N. Methodology for studying biotransformation of polyfluoroalkyl precursors in the environment. Trends Anal. Chem. 2015, 95, 122–131. [Google Scholar] [CrossRef]
  37. Ateia, M.; Maroli, A.; Tharayil, N.; Karanfil, T. The overlooked short- and ultrashort-chain poly- and perfluorinated substances: A review. Chemosphere 2019, 220, 866–882. [Google Scholar] [CrossRef] [PubMed]
  38. Yong, Z.Y.; Kim, K.Y.; Oh, J.-E. The occurrence and distributions of per- and polyfluoroalkyl substances (PFAS) in groundwater after a PFAS leakage incident in 2018. Environ. Pollut. 2021, 268, 115395. [Google Scholar] [CrossRef] [PubMed]
  39. Newell, C.J.; Adamson, D.T.; Kulkarni, P.R.; Nzeribe, B.N.; Conner, J.A.; Prpovic, J.; Stroo, H.F. Monitored natural attenuation to manage PFAS impacts to groundwater: Scientific basis. Groundw. Monit. Remediat. 2021, 41, 76–89. [Google Scholar] [CrossRef]
  40. Cao, X.; Wang, C.; Lu, Y.; Zhang, M.; Khan, K.; Song, S.; Wang, P.; Wang, C. Occurence, sources and health risk of polyfluoroalkyl substances (PFASs) in soil, water and sediment from a drinking water source area. Ecotoxicol. Environ. Saf. 2019, 174, 208–217. [Google Scholar] [CrossRef]
  41. Hepburn, E.; Madden, C.; Szabo, D.; Coggan, T.L.; Clarke, B.; Currel, M. Contamination of groundwater with per- and polyfluoroalkyl substances (PFAS) from legacy landfills in an urban re-development precinct. Environ. Pollut. 2019, 248, 101–113. [Google Scholar] [CrossRef]
  42. Xu, B.; Liu, S.; Zhou, J.L.; Zheng, C.; Jin, W.; Chen, B.; Zhang, T.; Qiu, W. PFAS and their substitutes in groundwater: Occurrence, transformation and remediation. J. Hazard. Mater. 2021, 412, 125159. [Google Scholar] [CrossRef]
  43. Simcik, M.F.; Dorweiler, K.J. Ratio of perfluorochemical concentrations as a tracer of atmospheric deposition to surface waters. Environ. Sci. Technol. 2005, 39, 8678–8683. [Google Scholar] [CrossRef]
  44. Yu, X.; Tabake, Y.; Yamamoto, K.; Matsumura, C.; Nishimura, F. Biodegradation property of 8:2 fluorotelomer alcohol (8:2 FTOH) under aerobic/anoxic/anaerobic conditions. J. Water Environ. Technol. 2016, 14, 177–190. [Google Scholar] [CrossRef] [Green Version]
  45. Lv, J.; Guo, C.; Liang, S.; Zhang, Y.; Xu, J. Partitioning behavior, source identification, and risk assessment of perfluorinated compounds in an industry-influenced river. Environ. Sci. Eur. 2019, 31, 55. [Google Scholar] [CrossRef] [Green Version]
  46. EPA. Interim Recommendations to Address Groundwater Contaminated with Perfluorooctanoic Acid and Perfluorooctanesulfonate; OLEM Directive No. 9283. 1-47; United States Environmental Protection Agency: Washington, DC, USA, 2019.
  47. EPA. Questions and Answers: Drinking Water Health Advisories for PFOA, PFOS, GenX Chemicals and PFBS. 2023. Available online: https://epa.gov/sdwa/questions-and-answers-drinking-water-health-advisories-pfoa-pfos-genx-chemicals-and-pfbs (accessed on 29 March 2023).
Figure 1. Locations of detailed monitoring wells.
Water 15 01480 g001
Figure 2. Detection frequencies and average concentration of PFASs.
Water 15 01480 g002
Figure 3. Mass-based average concentration by each of the PFASs.
Water 15 01480 g003
Figure 4. Groundwater type in monitored sites.
Water 15 01480 g004
Figure 5. Distribution of PFASs in each intensive monitoring site. ※ Site-1, -2, etc.: PFBA, PFNA, PFDA, PFUnDA, PFDoDA, PFTrDA, perfluorotetradecanoic acid (PFTeDA) PFBS, PFHxS, PFOS, perfluorodecane sulfonate (PFDS). ※ Site-3, -4, etc.: PFBA, PFHpA, PFNA, PFDA, PFUnDA, PFDoDA, PFTrDA, PFTeDA PFBS, PFDS.
Water 15 01480 g005
Figure 6. Detection frequencies of PFASs in groundwater.
Water 15 01480 g006
Figure 7. Assessing the PFAS contamination source by using the PFNA/PFOA ratio–PFHpA/PFOA ratio.
Water 15 01480 g007
Table 1. Instrument conditions.
ParameterCondition
ColumnACE 5 C18-PFP 150 × 2.1 mm
ModeBinary gradient
Mobile phaseA: 5 mM Ammonium acetate B: Methanol
GradientTime (min)014.0018.0018.0121.00
Solvent B (%)25851002525
Column flow rate0.2 mL/min
Injection volume5 μL
Column temp40 °C
Ionization modeNegative ion electrospray
Capillary voltage4.00 kV
Gas temperature280 °C
Gas flow9 L/min (N2)
Table 2. MRM Conditions.
CompoundCarboxyl
/Sulfonyl
Target
/Internal
Retention Time (min)Precursorion,
m/z
Production,
m/z (CE)
PFBACarboxylTarget5.620213.0169.05 (10)
PFPeA8.770262.9219.10 (8)
PFHxA10.868312.9269.05 (9)119.00 (21)
PFHpA12.332362.9319.10 (9)168.95 (17)
PFOA13.501412.9368.75 (11)168.85 (19)
PFNA14.457462.9418.80 (10)218.90 (18)
PFDA15.277513.0469.05 (10)218.90 (18)
PFUnDA15.228563.0519.00 (13)319.05 (19)
PFDoDA16.574612.9568.90 (12)169.00 (25)
PFTrDA16.544663.0619.00 (14)169.10 (32)
PFTeDA17.074712.9668.95 (13)168.90 (35)
PFBSSulfonylTarget9.435298.898.80 (32)79.80 (27)
PFHxS12.562398.979.85 (45)98.80 (34)
PFHpS13.580449.079.90 (42)98.80 (41)
PFOS14.558499.079.90 (46)98.80 (37)
PFDS15.912598.898.80 (55)80.00 (48)
M2PFOACarboxyl Internal13.704415.0370.40 (13)170.40 (36)
MPFOSSulfonyl14.841502.798.80 (44)
Table 3. Physicochemical parameters for human risk assessment of PFASs.
No.CompoundMW
(g/mol)
Henry’s Constant
(atm-m3/mol)
Dwater
(m2/s)
Dair
(m2/s)
log KOWVapor Pressure
(Pa, 25 °C)
Saq
(mg/L)
SP
(cm/hr)
1PFOA414.078.88 × 10−78.57 × 10−101.30 × 10−55.304.2195005.52 × 10−2
2PFOS500.132.96 × 10−98.44 × 10−101.30 × 10−56.430.27570-
3PFHxS400.111.96 × 10−108.74 × 10−101.31 × 10−55.175.172300-
Note(s): Reference: US EPA RSLs, 2020, https://www.epa.gov/risk/regional-screening-levels-rsls-generic-tables, accessed on 20 February 2022; PubChem, 2020, https://pubchem.ncbi.nlm.nih.gov/, accessed on 20 February 2022.
Table 4. Risk assessment formula considering ingestion, dermal contact, and inhalation.
Drinking
(O/X)
Exposure PathwayEquationReference
OIngestion L A D D I n g e s . = I R D w a t e r × E F × E D A T × C G w a t e r [29]
XDermal contact L A D D D e r m a l ,   i = S A i × S P B W × E T i × E F i × E D i A T × C G w a t e r
[i: Water use (Washing, Shower, Farm, etc.)]
[30]
Inhalation L A D D I n h a l . = B R i B W × E T i × E F i × E D i A T × V F × C G w a t e r
[i: Water use (Washing, Shower, Farm, etc.)]
[31]
Total non-cancer risk H Q i = L A D D i R f D [29]
Total cancer risk E C R i = L A D D i × C S F [32]
Note(s): LADD (lifetime average daily dose), IR (ingestion rate), EF (exposure frequency), ED (exposure duration), AT (averaging time), CGwater (chemical concentration in groundwater), SA (skin surface area), SP (skin permeability coefficient), BW (body weight), ET (exposure time by water using in exposure space), BR (breathing rate), VF (volatilization factor), HQ (hazard quotient), ECR (excess cancer risk), CSF (cancer slope factor).
Table 5. Risk and exposure assessment results of PFASs in groundwater monitored from 2018 to 2020.
Functional GroupCompoundCancer95th Percentile
Lifetime Daily Dose (ng/kg-Day)
Hazard Quotients (HQ)
DrinkingNon-DrinkingTotalDrinkingNon-DrinkingTotal
IngestionDermal ContactInhalationIngestionDermal ContactInhalation
CarboxylPFPeAX0.560.45.4 × 10−60.96
PFHxAX0.634.2 × 10−78.41 × 10−60.63
PFHpAX0.638.7 × 10−31.14 × 10−50.64
PFOAO1.523.14 × 10−33.80 × 10−51.53
PFNAX0.31.09 × 10−71.02 × 10−50.3
PFDAX0.75.21 × 10−73.04 × 10−50.7
SulfonylPFBSX0.27.31 × 10−32.47 × 10−60.2
PFHxSX0.381.77 × 10−79.35 × 10−60.38
PFOSX1.096.86 × 10−65.14 × 10−51.09
Note(s): Risk level of non-carcinogen (HQ): ● [0.1 ↑], ◉ [0.01~0.1], ◎ [0.001~0.01], ○ [0.001 ↓].
Disclaimer/Publisher’s Note: The statements, opinions and data contained in all publications are solely those of the individual author(s) and contributor(s) and not of MDPI and/or the editor(s). MDPI and/or the editor(s) disclaim responsibility for any injury to people or property resulting from any ideas, methods, instructions or products referred to in the content.

