

Type Selection between Arch Dam and Gravity Dam Based on Construction Simulation: A Case Study


1
Chengdu Engineering Corporation Limited, Chengdu 610072, China
2
Institute of Water Engineering Sciences, Wuhan University, Wuhan 430072, China
3
State Key Laboratory of Water Resources and Hydropower Engineering Science, Wuhan University, Wuhan 430072, China
*
Authors to whom correspondence should be addressed.
Water 2023, 15(8), 1482; https://doi.org/10.3390/w15081482
Submission received: 23 February 2023
/
Revised: 26 March 2023
/
Accepted: 7 April 2023
/
Published: 11 April 2023
(This article belongs to the Section Hydraulics and Hydrodynamics)
Abstract
:The issue of dam type selection is a prevalent challenge in water resource allocation engineering. The site of the Y2 dam in China is suitable for building concrete arch dams and roller-compacted concrete (RCC) gravity dams. To determine which dam type is better in terms of construction progress, this paper proposes a multiattribute decision-making method based on construction simulation. First, the construction characteristics of concrete dams are analyzed, and the construction simulation systems for arch dams and gravity dams are developed based on construction simulation theory. Then, for each dam type, the initial construction schemes are used as the input of the simulation systems, and attribute values of construction progress are output. Secondly, a multiattribute decision-making method is used to select the typical scheme of each dam type from these initial schemes. Finally, the simulation results of the typical schemes for the arch dam and the RCC gravity dam are compared, to determine the optimal dam type for the Y2 dam. The results show that for the Y2 dam, the construction period of the arch dam is 34 months, and that of the RCC gravity dam is 28 months. From the perspective of construction progress, the Y2 dam type should select the RCC gravity dam. Compared with similar dams that have been built, it is concluded that the simulated progress result conforms to the current actual construction level, which also verifies the correctness of the calculation results and the reliability of the construction simulation.
1. Introduction
Facing the severe challenge of global water shortage [1], building reservoirs can significantly optimize the allocation of water resources and improve their utilization rate, providing a direct and effective solution to the issue of water resource imbalance [2,3]. In a reservoir project, the dam serves as the key retaining structure, and the selection of its type is a critical aspect to consider. This choice has a direct impact on various aspects of the project, including engineering construction, safety, investment, operation, ecology and environment, and topographic geological conditions [4,5]. It is known that the dam type selection is a complex system engineering problem that needs to consider many factors. At present, the traditional methods are mostly based on qualitative analysis, lacking rigorous scientific quantitative calculations [6]. Therefore, it is imperative to carry out a quantitative and scientific comparative analysis of different dam types during the planning stage of the project to ensure the success and sustainability of the project.
For the dam type selection, construction is a crucial aspect that experts focus on, which determines the feasibility of a particular dam type, to a certain extent. The construction of concrete dams is often the key to control the whole project period because of the massive amount of concrete engineering. The construction period is a control index to measure the quality of a construction scheme. Therefore, reasonable calculation of pouring period for concrete dams can strongly support dam type selection. However, the construction of a concrete dam is a complex and stochastic dynamic process and is a semi-structured problem, making it difficult to analyze through mathematical models. The traditional method for estimating construction progress is based on expert experience and the analogy method, using empirical principles such as average pouring intensity or average rising height per month. This approach, however, lacks scientific rigor and persuasive evidence to confirm that the construction progress at each stage meets relevant requirements, as it does not involve systematic and quantifiable calculations.
With the rapid development of computer and simulation technology, simulation has become the primary means of studying construction progress, by adopting computers to simulate the dynamic process of concrete dam construction. The application of computer simulation technology in concrete project construction began in the early 1970s. Jurencha and Widmann proposed a concrete pouring process simulation in combination with concrete gravity dam construction, which was applied to the construction of the Schlegeis dam in Austria [7]. For over four decades, many scholars have developed theoretical methods and application research on simulation of the construction process. Those can be divided into four phases. For the first stage, Halpin proposed the cycle operation network (CYCLONE) construction simulation method for repetitive projects [8]. Many studies in this period are to expand and improve the CYCLONE, including Insight [9], UM-CYCLONE [10], STEPS [11], and HK-CONSIM [12]. In the second phase, construction simulation technology is characterized by objected-oriented simulation [13]. Simulation system users can build models, allocate resources, and connect with other scheduling systems through a graphical interface, which reduces coding and enhances model readability [14,15]. The third stage is the combination of the construction simulation and visualization technologies [16,17]. Kamat and Martinez developed Vitascope, a discrete construction simulation platform that integrates 3D visualization capabilities [18]. Lu and Olofsson proposed a BIM–DES framework, which implies changes in the building information modeling process [19]. Zhang et al. [20] designed loose-coupling visualization components in a distributed construction simulation environment with HLA. In recent years, integrating the artificial intelligence, big data, cloud computing, and other new information technologies, the intelligent construction simulation for the construction stage has developed rapidly [21]. The intelligent simulation is based on automatic perception, automatic simulation [22], multidimensional coupling, multiparty collaboration, and real-time feedback [23] as the basic mode to establish an intelligent progress analysis and control system that has the functions of perception, analysis, and control [24]. In general, for the design stage, the construction simulation technology has matured, but that of the construction stage is the current research hotspot.
The Y2 dam, a concrete structure, is planned to be built on the Yalong River in China. Through the exploration of topographic and geological conditions, experts preliminarily determined that the Y2 dam site is suitable for the establishment of arch dams and roller-compacted concrete (RCC) gravity dams. To determine the Y2 dam type and construction scheme, it is necessary to compare and analyze the construction progress attributes of the arch dam and the RCC gravity dam. However, because of the two dam types with different construction processes, the qualitative analysis based on experience is insufficient in argument. Therefore, this paper adopts construction simulation to deeply analyze and quantitatively compare the construction progress attributes of the arch dam and the RCC gravity dam, to support the dam type selection and construction management for the Y2 dam.
The remainder of this article is organized as follows: Section 2 describes the methodology regarding the dam construction simulation, and introduces and explains the arch dam construction progress system and the RCC gravity dam construction progress system used in the Y2 dam. Section 3 gives the construction conditions and data used throughout this work. Section 4 explains the multiattribute decision-making method for the dam type selection. Section 5 gives all the results of the construction simulation. Section 6 is the discussion and analysis of the results, and finally, Section 7 gives the conclusions.
2. Methodology
2.1. Mechanism Description of Concrete Dam Construction Process
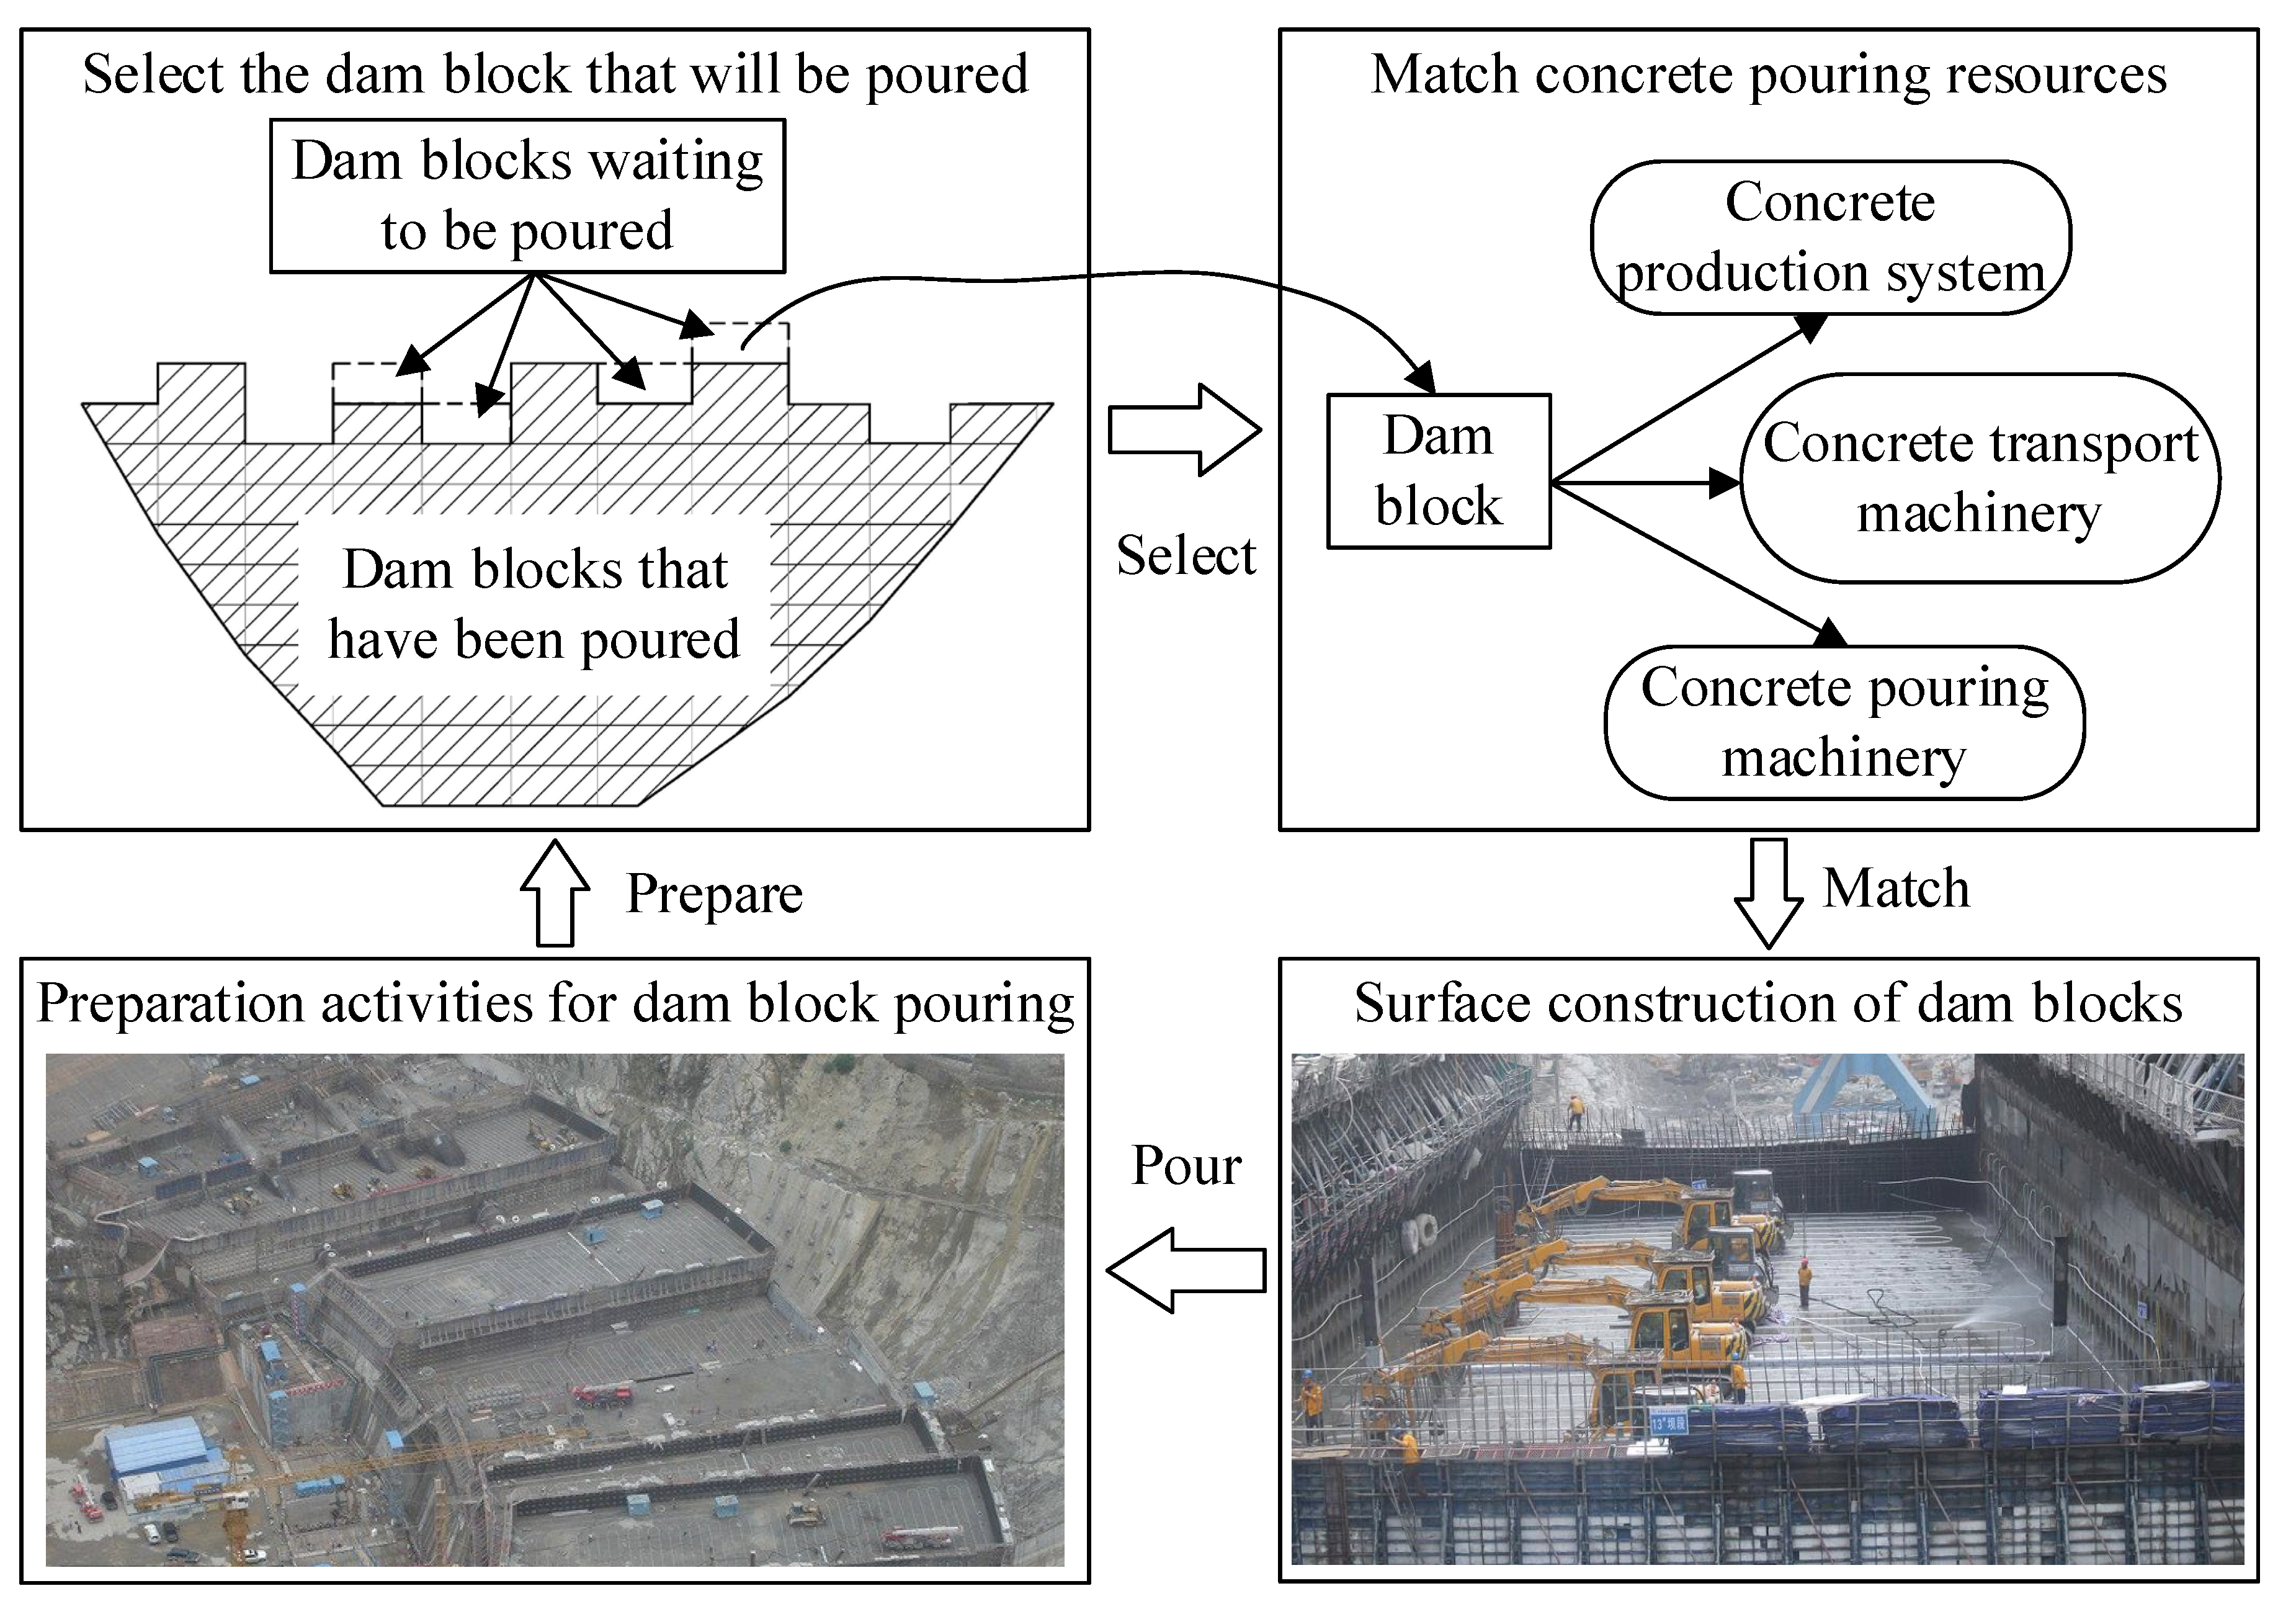
Concrete dams are typically poured in separate dam blocks. The dam body is divided into several dam sections through transverse joints, the dam section is divided into several storehouse surfaces through longitudinal joints, and then the dam section is divided into numerous pouring blocks, based on the actual pouring thickness requirements. Concrete dam construction is a cyclical process consisting of alternate selection and pouring activities between machinery and pouring blocks, including selection, matching, pouring, and preparation, as shown in Figure 1. At a certain moment in the dam pouring plane, there are often multiple dam blocks that meet the pouring conditions, and one of them needs to be selected for pouring; for the selected dam block, corresponding pouring resources are matched, including the concrete production system, transport machinery and pouring machinery; then, concrete pouring, paving, vibration, and other warehouse surface activities are carried out; preparation work includes dismantling formwork, laying cooling water pipes, etc. This cycle is then repeated for the next stage of the construction process.
Dam construction progress control is to study this cyclical construction process, including alternate selection and pouring activities, reasonably allocate pouring machinery and equipment, determine the pouring sequence of dam blocks, and correctly predict the pouring period.
2.2. Theory on Construction Progress Simulation
When the dam types, volume, joint, and block are determined, and the scheme of mechanical configuration is given, there is bound to be a suitable block pouring sequence, which meets various restrictions and constraints, and corresponds to the most efficient construction period. The progress simulation technology of dam construction uses computers to simulate the concrete pouring process. It takes the given pouring parameters and mechanical configuration as input, considers various construction conditions, constraints, and restrictions, arranges the pouring sequence of dam blocks, calculates the resource consumption and pouring time of each dam block, and outputs the construction period of the entire dam and pouring strength information [22,23,25]. By changing the pouring parameters and mechanical configuration, different schemes of dam construction are designed. Then, for these various schemes, multiple calculations are implemented by adopting the progress simulation technology to obtain the key attributes of dam construction. Finally, through comprehensive comparison, the better scheme is selected.
The purpose of the construction progress simulation is to find a good pouring sequence of dam blocks that can meet various constraints and restrictions, make full use of pouring resources including concrete production system and mechanical configuration, and have the most compact construction period, by constantly changing construction parameters and mechanical configuration.
2.3. Simulation Strategy of Concrete Dam Construction
The progress simulation model of the dam construction advances the simulation clock by alternating the pouring machinery and the pouring blocks, and repeatedly selecting pouring activities [26]. The entire simulation calculation traverses all the pouring blocks of the dam body until all the blocks are finished, and the system simulation is terminated. The algorithm flow of the simulation system is shown in Figure 2. The simulation calculation starts with the data acquisition, initializes the simulation calculation state through the construction parameters and corresponding data, and the simulation system carries out the calculation progress according to the specified initial state and simulation control parameters. The simulation calculation terminates the simulation process by determining whether the simulation termination condition is reached, generally based on whether the dam top elevation or the given completion time is reached as the termination condition.
Currently, for concrete dam construction, basing on the above simulation theory and model to develope the simulation system is the mainstream method for studying construction progress. However, arch dams and gravity dams are two entirely different dam types that use completely different construction technology processes, including construction conditions, types of pouring machinery, surface construction methods in the dam block, and selection rules of the dam blocks. For example, the arch dam pouring often selects a dam block once to pour separately, while the RCC gravity dam pouring selects multiple adjacent dam blocks to pour together. Therefore, there is no way to develop a simulation system that could be applied to the construction of the two dam types.
To address this issue, our research team has developed two special progress simulation systems: an arch dam construction progress simulation system, and an RCC gravity dam construction progress simulation system.
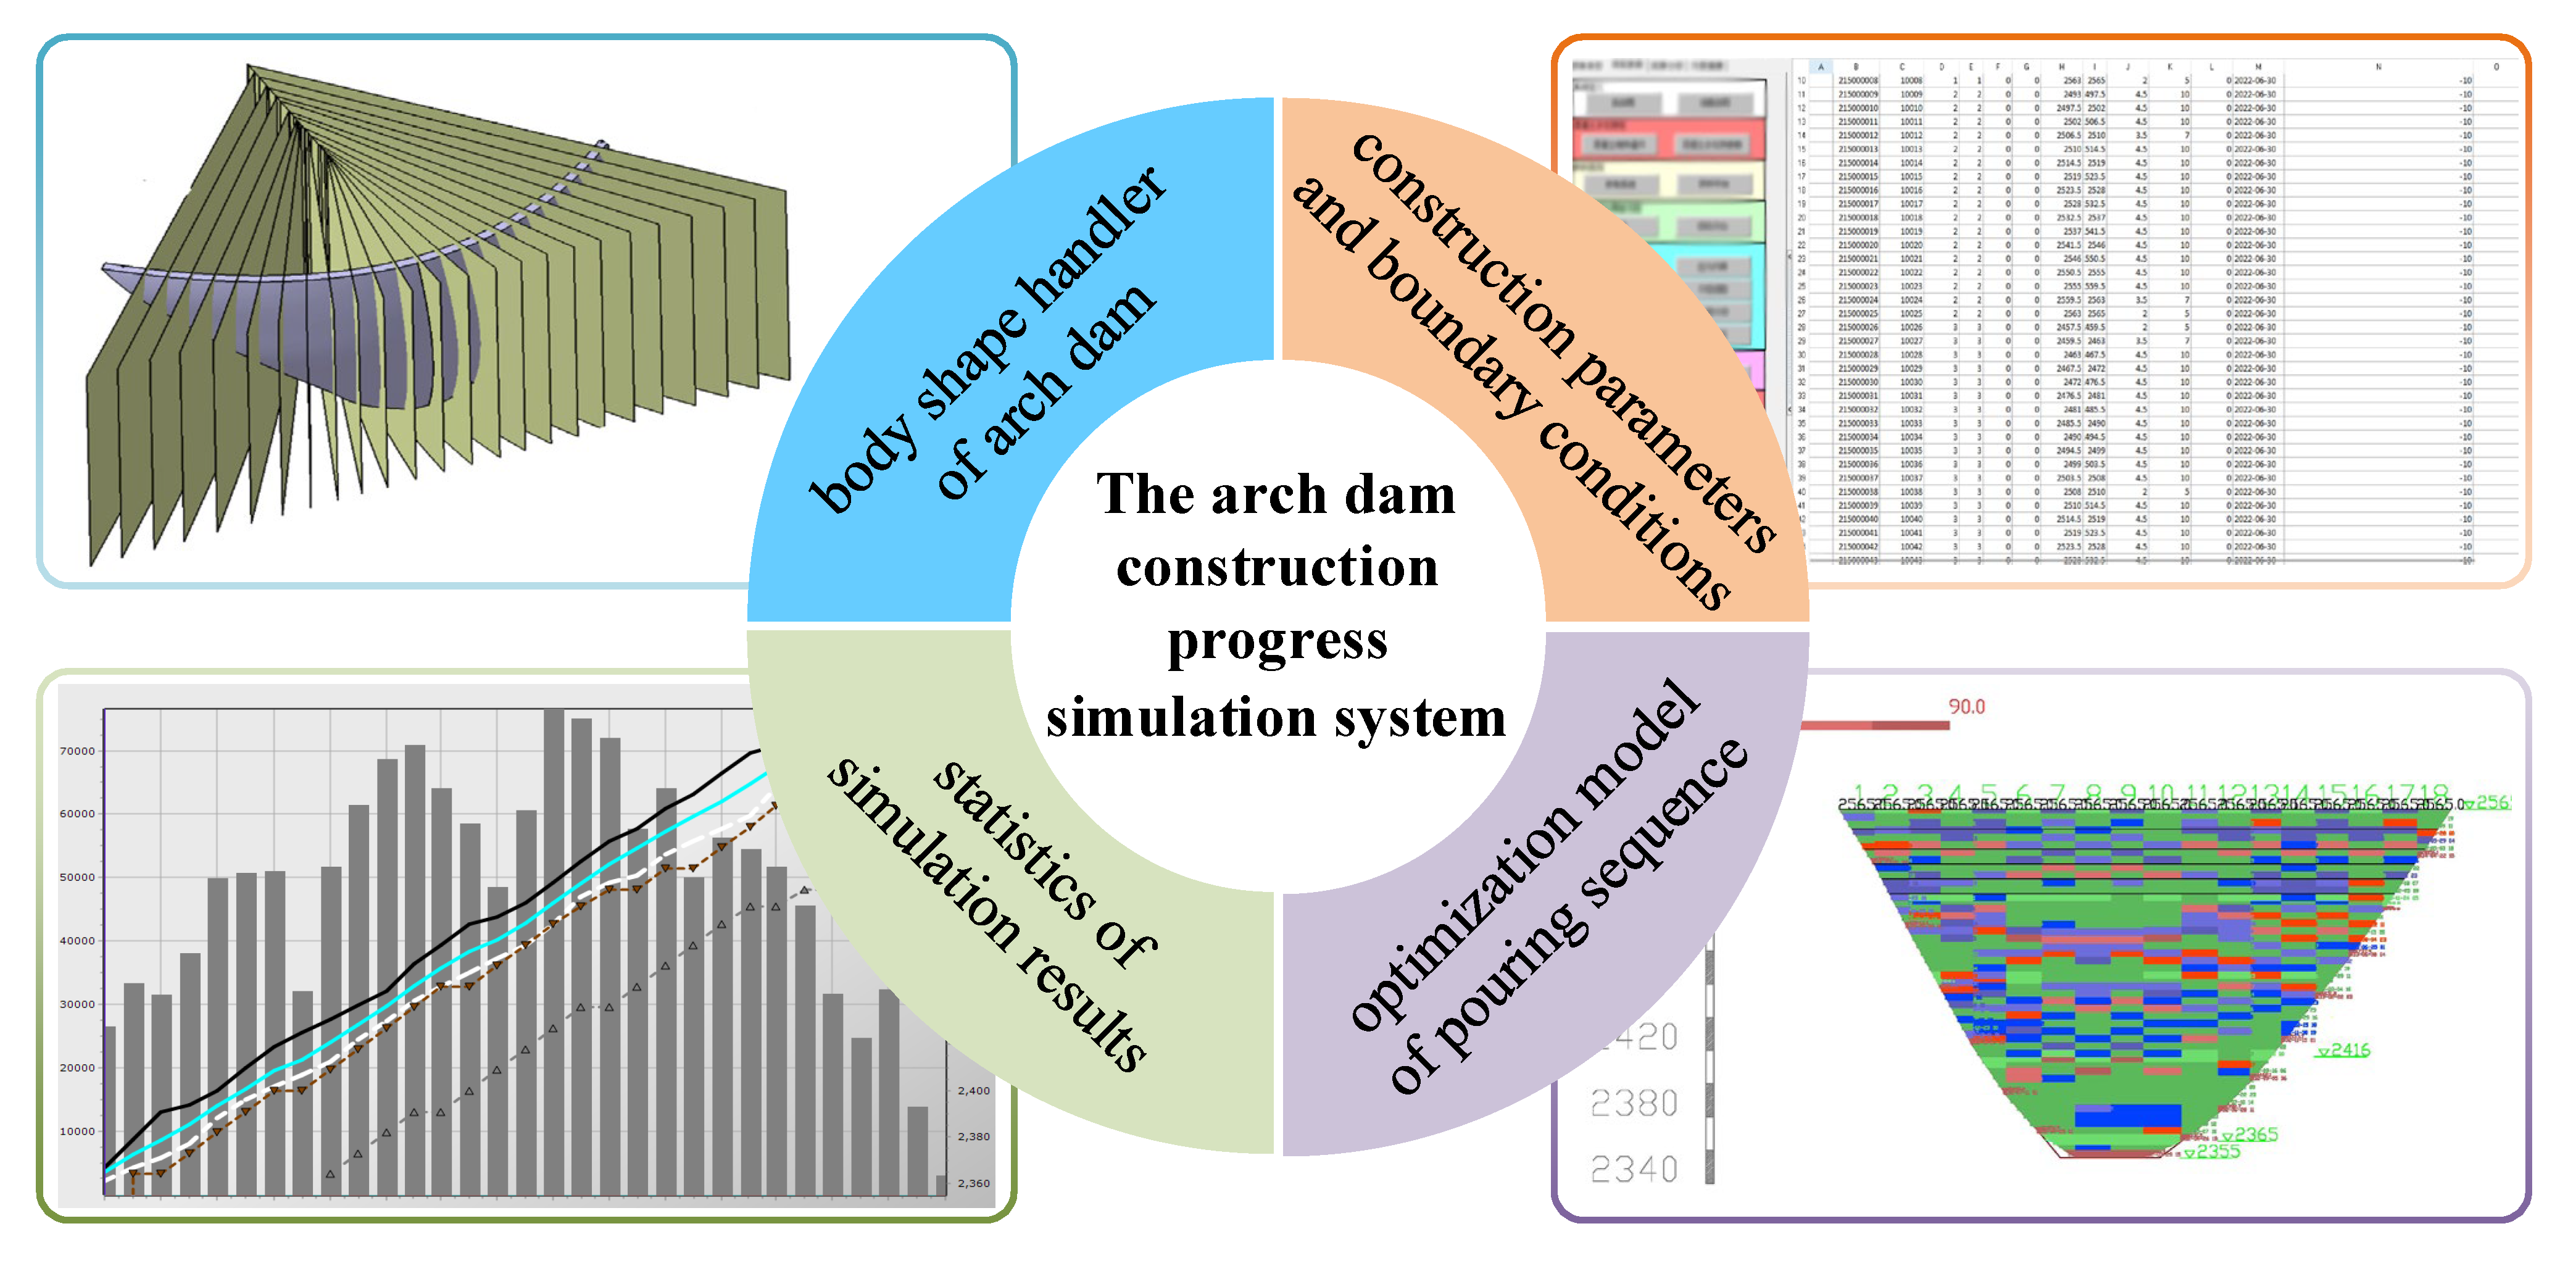
2.4. The Arch Dam Construction Progress Simulation System
Figure 3 is the framework of the arch dam construction progress simulation system. The simulation system is composed of four main parts: dam body shape handler, construction conditions and simulation parameters, simulation calculation, and statistics of simulation results. Among them, the first two parts are inputs to the system. The body shape handler divides the 3D model of arch dams into 0.5 m thick blocks that are used to extract the body shape parameters, as shown in Table 1. These body shape parameters that provide a complete description of the arch dam geometry are the underlying data for simulation calculations. These parameters are obtained automatically using programs written based on CATIA secondary development technology.
Construction conditions and simulation parameters are boundary conditions of simulation calculations, and are numerous and complex. Some of these parameters are listed in Table 2. These parameters require manual survey statistics or empirical estimates.
The simulation calculation is based on mathematical models that take into account construction characteristics. The arch dam construction is a pouring and transportation system led by the cable crane. Therefore, the following mathematical model is established:
where, T(t) is the time clock for the current construction state in the simulation system, T(k, i, j) is the time required for the k cable to pour the (i, j) dam block, i is a dam monolith, j is a pouring block, H(i, t) is the pouring elevation of the dam monolith i at the simulation clock t, and HE(i, j) is the height of the (i, j) dam block.
T(t + 1) = T(k, i, j) + T(t)
H(i, t + 1) = HE(i, j) + H(i, t)
The constraints are as follows [23]:
where, S is the matrix of constraints, R is the matrix of construction condition restriction, and Hmax is the maximum elevation of the dam.
The arch dam simulation calculation advances the system clock by repeatedly and alternatively selecting the pouring cable and the pouring blocks until the dam is poured to the maximum elevation, and the simulation calculation is terminated. The statistics of the simulation results include the construction period, the concrete pouring strength, the proportion of over-age concrete, and other key progress attributes. These results are presented in the form of graphs and tables. In addition, the system visualizes the appearance of the dam body at different stages during the dam pouring process.
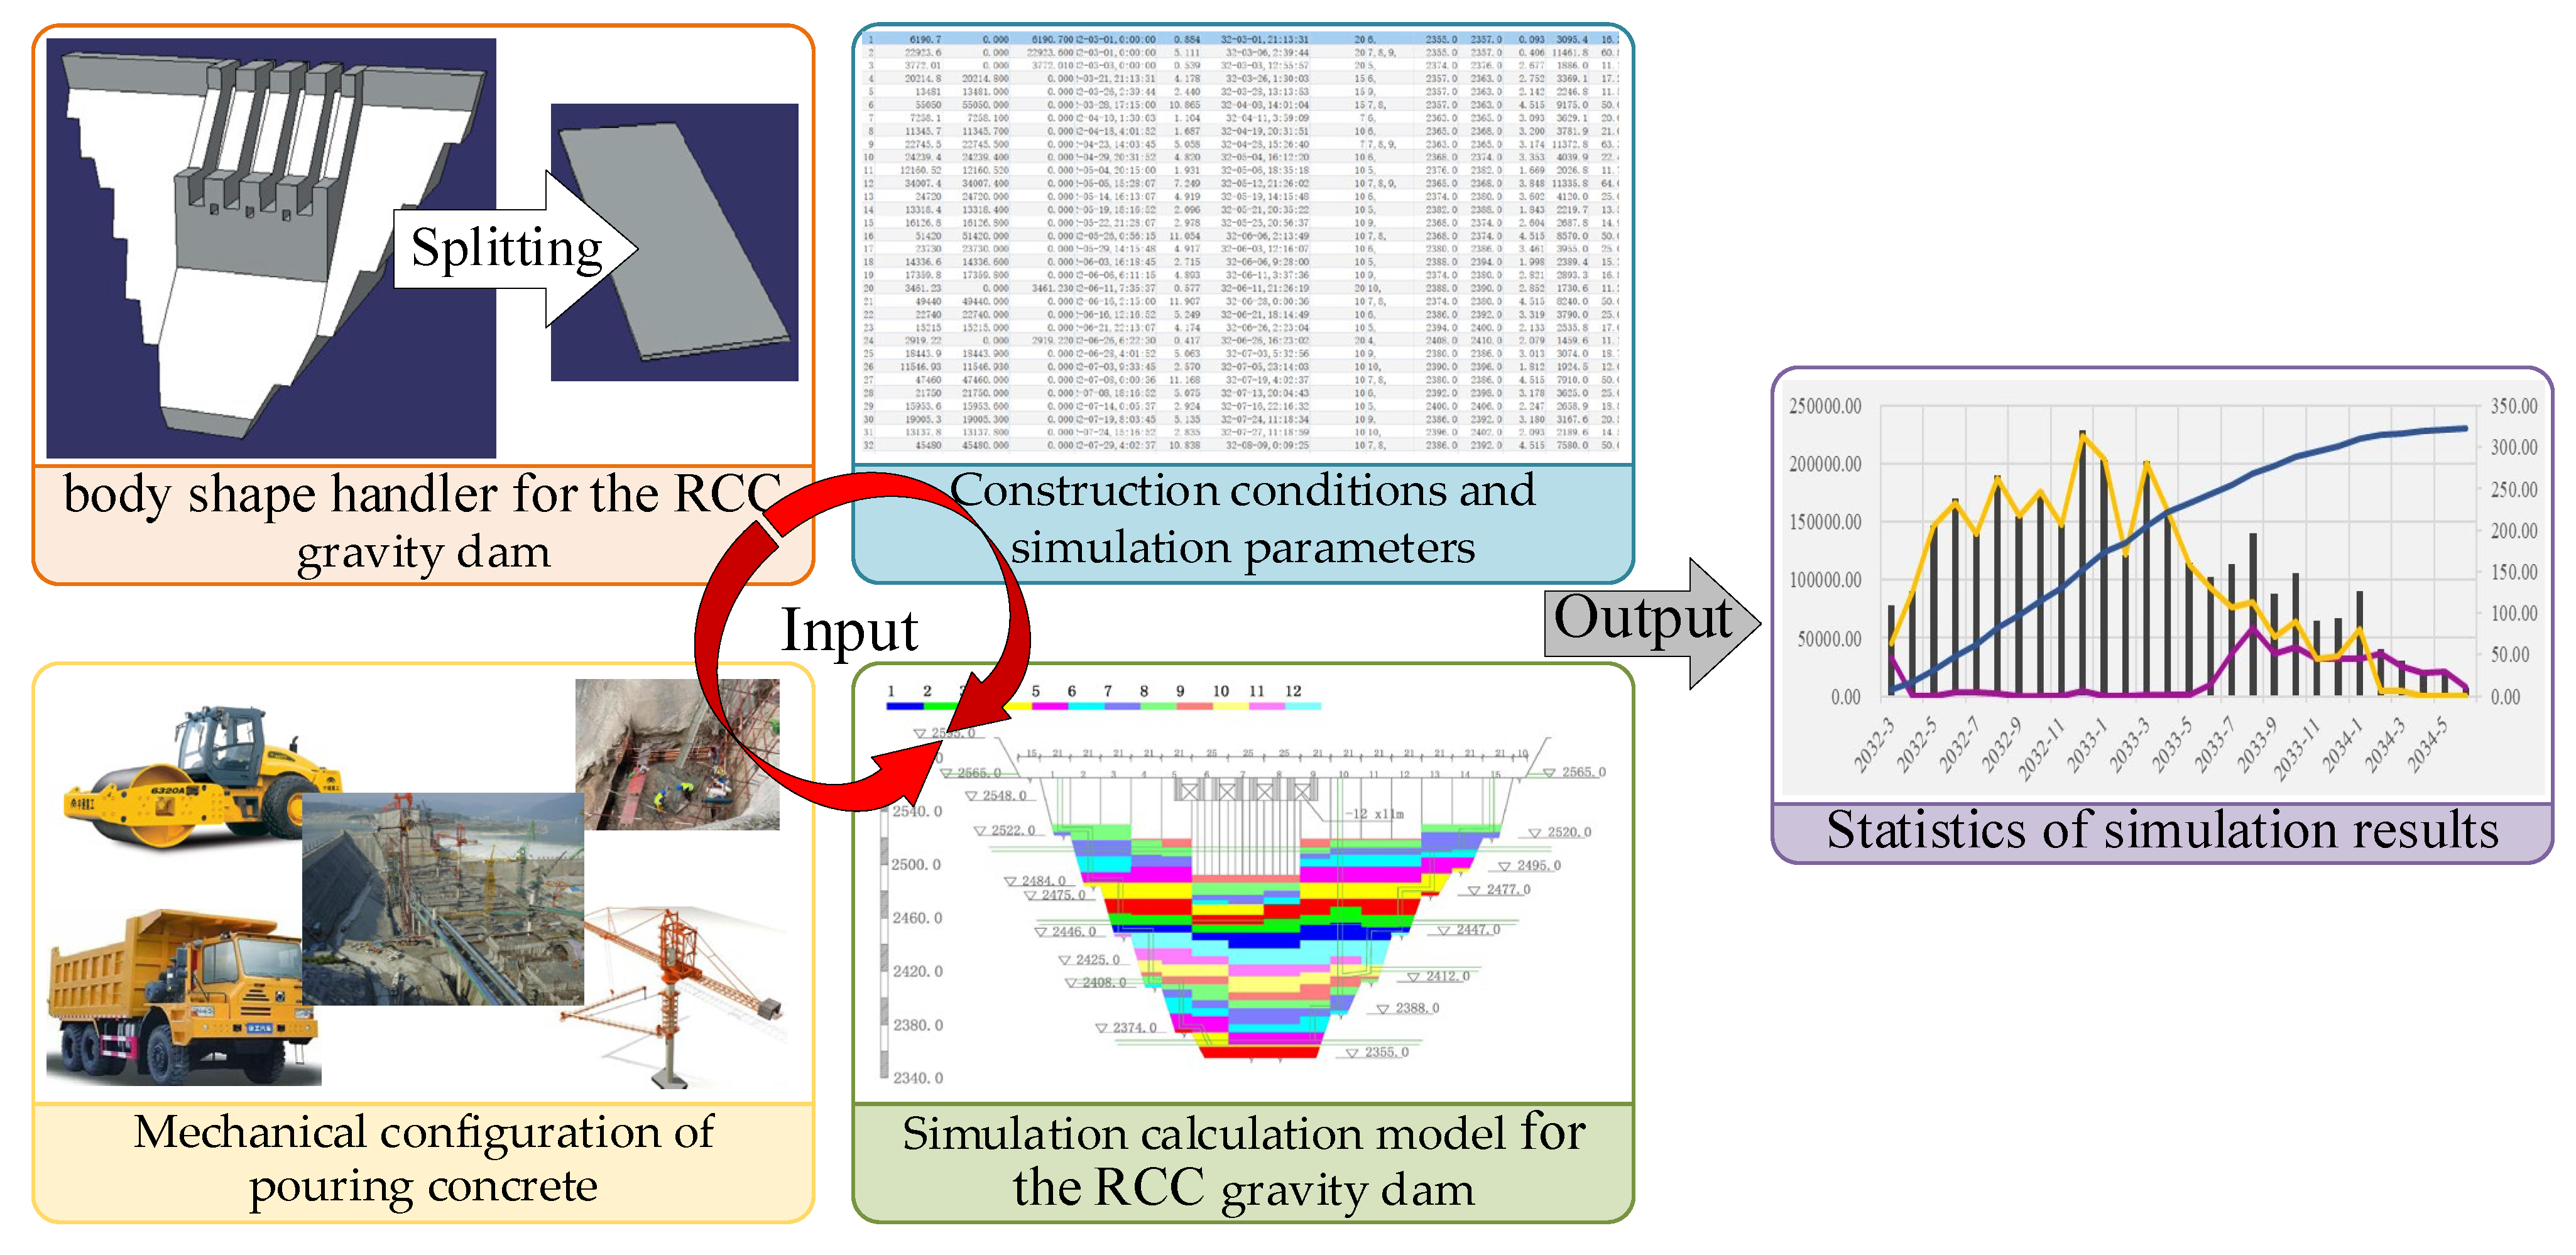
2.5. The RCC Gravity Dam Construction Progress Simulation System
Figure 4 is the framework of the RCC gravity dam construction progress simulation system. The simulation system is composed of five main parts: dam body shape handler, construction conditions and simulation parameters, mechanical configuration of pouring concrete, simulation calculation model, and statistics of simulation results. Compared with the arch dam construction progress simulation system, the main difference is the mechanical configuration of pouring concrete and the simulation calculation model. The details are described below:
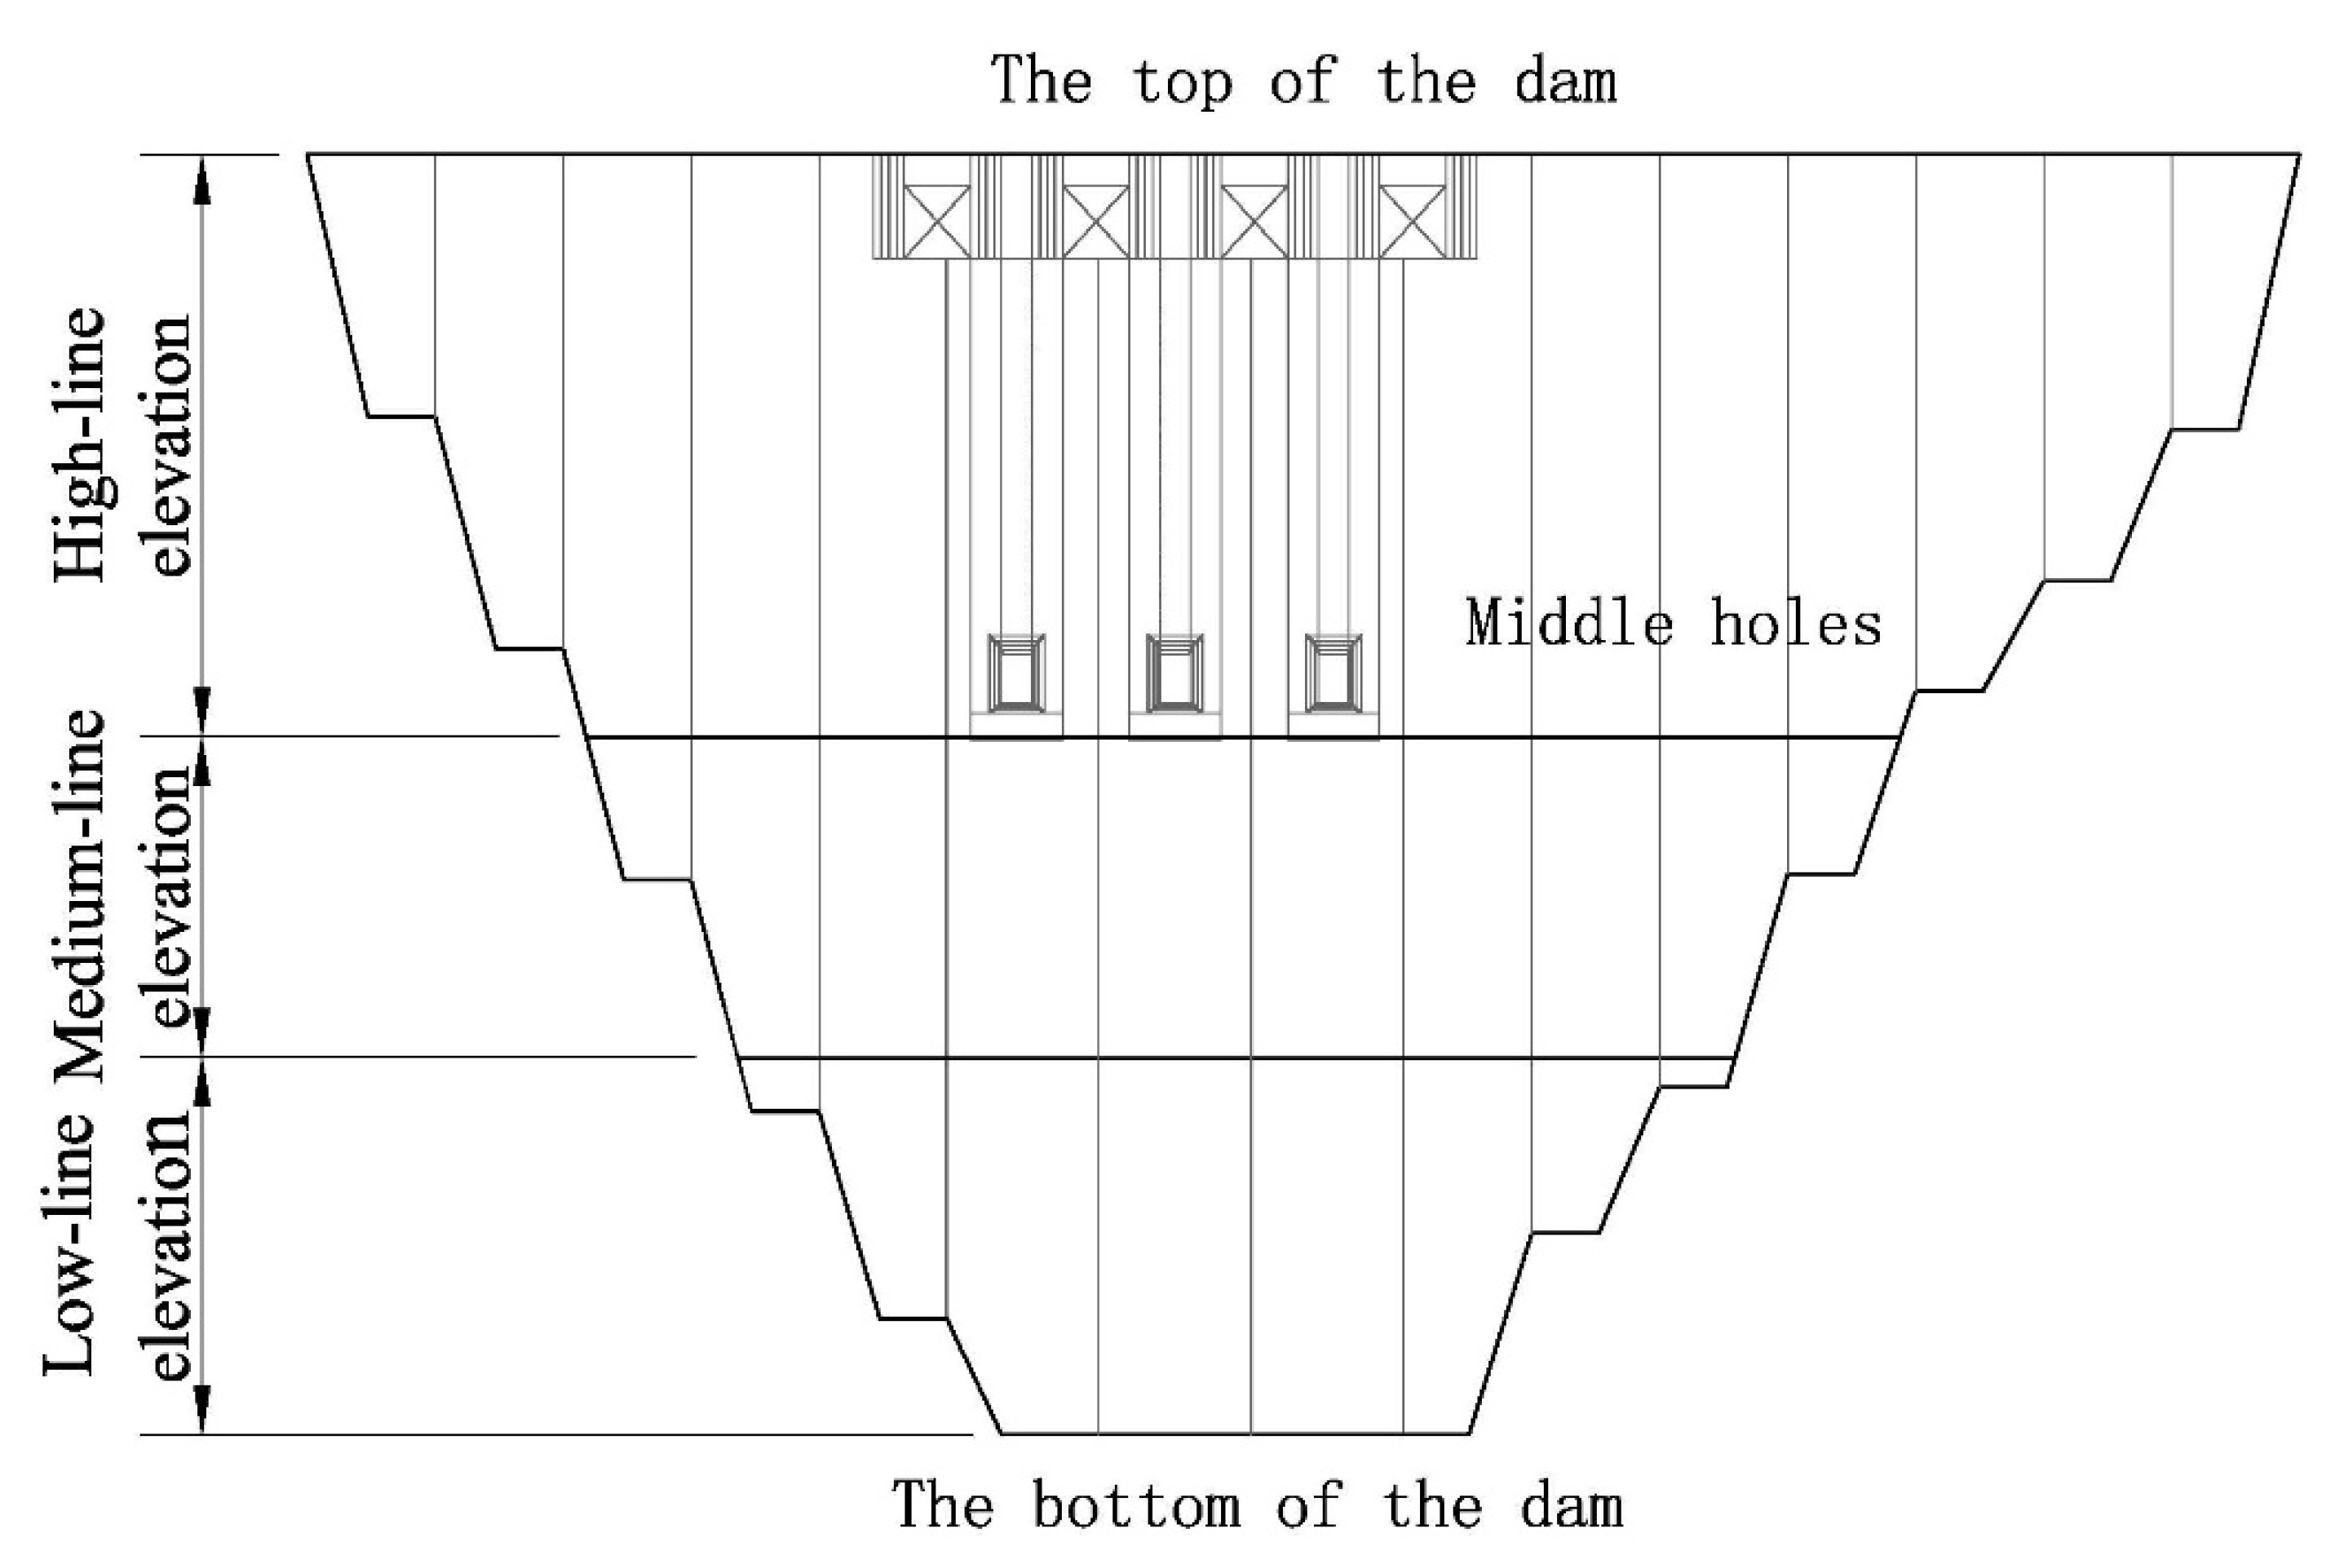
(1) In the mechanical configuration of pouring concrete, the arch dam construction generally adopts cables to pour dam blocks, and rarely involves other pouring machinery. However, the RCC gravity dam construction involves many types of pouring machinery, and different types of pouring machinery are used on different elevations and dam monoliths. The commonly used pouring machinery includes belt conveyors, dump trucks, chutes, tower (belt) machines, cable cranes, and others. The initial conditions of the simulation system need to give the mechanical configuration and its coverage. According to engineering experience, the low-line concrete of the dam body is often transported and placed by dump trucks. The medium- and high-line concrete is transported and placed with the cooperation of a variety of machinery. The high-, middle-, and low-lines of the dam body are divided according to the following (see Figure 5):
High-line elevation: usually from the bottom of the middle hole to the top of the dam.
Medium-line elevation: usually from the cofferdam elevation to the bottom of the middle hole.
Low-line elevation: usually from the bottom of the dam to the cofferdam elevation.
(2) Different from the arch dam construction system dominated by the cable, the gravity dam construction involves a variety of pouring machinery, which makes it impractical to rely on the pouring machinery to establish the simulation model. This paper proposes using the amount of poured concrete as the state variable to establish the mathematical model for the RCC gravity dam construction, as follows.
where, T(t) is the time clock for the current construction state in the simulation system, T(v, i, j) is the time required for pouring the (i, j) dam block, v is volume of the (i, j) dam block, V(t) is the amount of dam concrete that has been poured at the simulation clock t in the system, and V(i, j, t) is volume of the (i, j) dam block selected at the simulation clock t.
T(t + 1) = T(v, i, j) + T(t)
V(t + 1) = V(i, j, t) + V(t)
The constraints are as follows:
where, Vtotal is the total amount of concrete in the dam body.
The RCC gravity dam simulation system scans the database periodically to find an event that the pouring activity of a dam block is completed. When such an event is found, the time clock is advanced until the total amount of concrete poured reaches the dam volume, and the simulation calculation is terminated.
3. Construction Conditions and Data
According to the design data, the height of the Y2 dam is 210 m, the minimum foundation surface elevation is 2355 m, and the crest elevation is 2565 m. Table 3 presents the construction environment conditions at the Y2 dam site. On the basis of the natural number of days in each month, the number of bad weather days is removed, such as strong wind and heavy precipitation that affect concrete construction, and the effective working days of each month are obtained. The specific information regarding the RCC gravity dam and the arch dam are as follows:
- (1)
- The Y2 arch dam
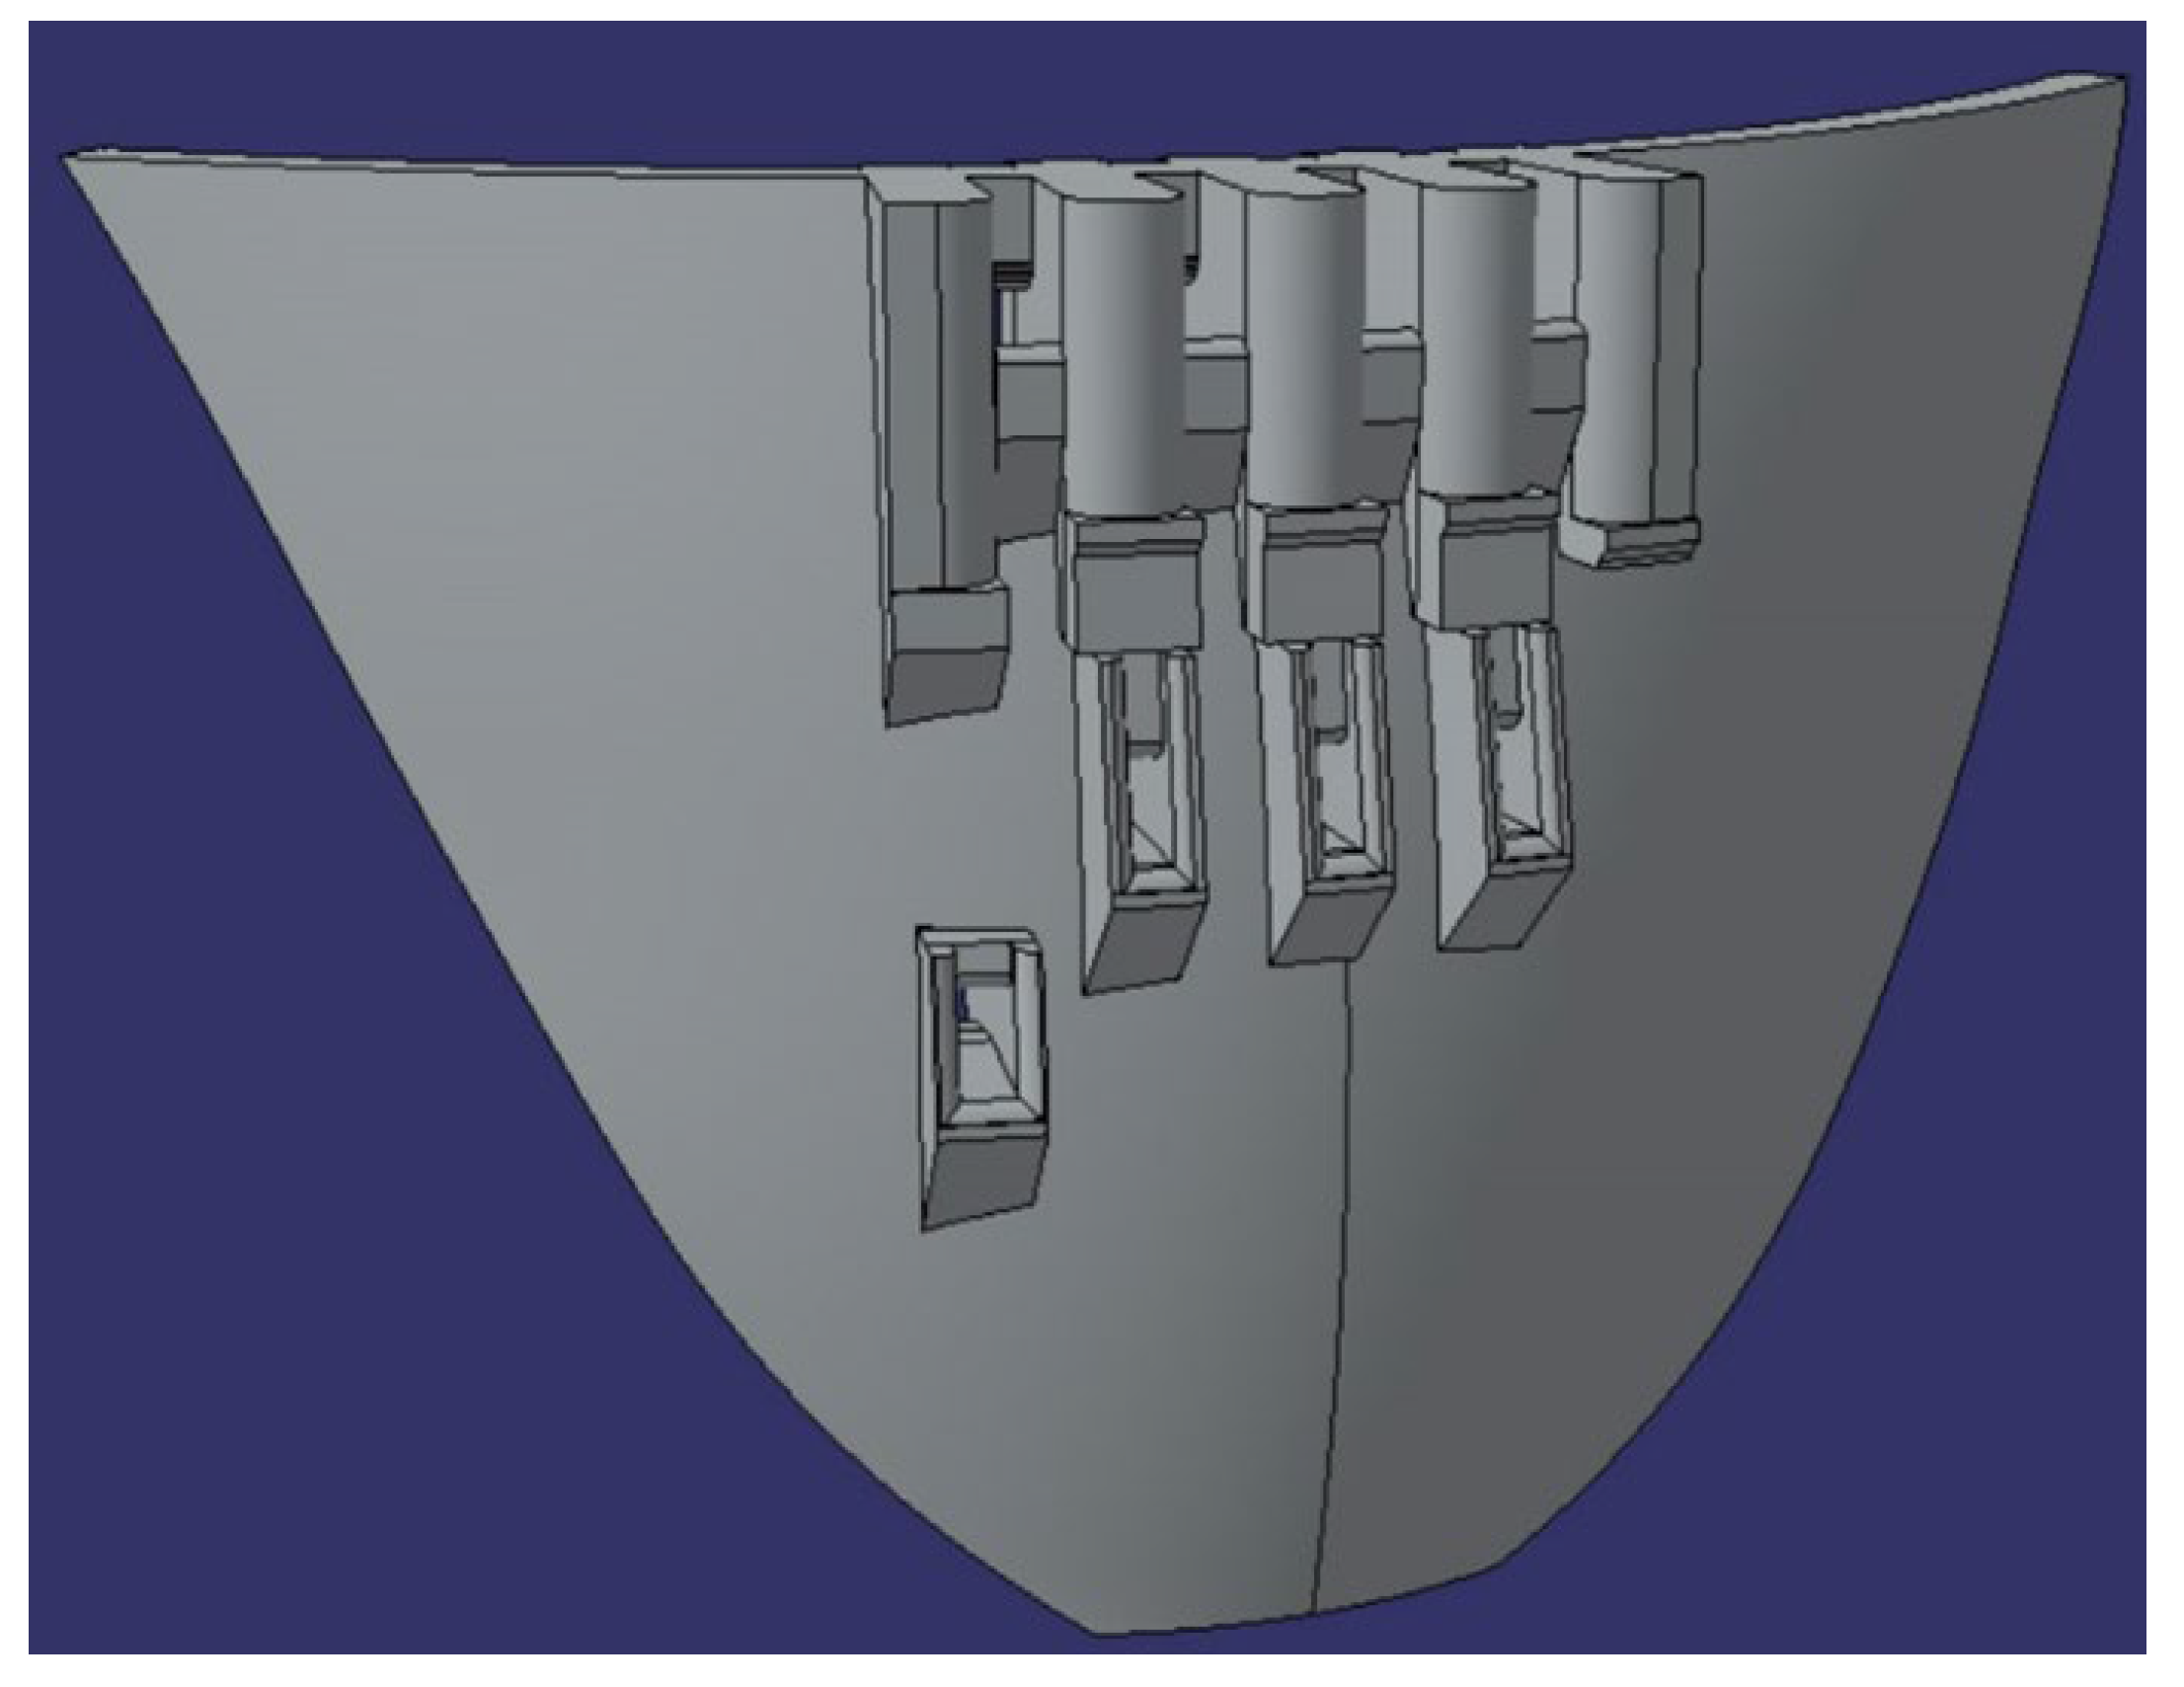
Figure 6 is the three-dimensional model of the Y2 arch dam. The dam is a concrete hyperbolic arch dam, and its concrete volume is 1.51 × 10⁶ m3 with 17 dam monoliths. The dam body has 4 discharge surface holes, 3 middle holes, and 1 diversion bottom hole.
- (2)
- The Y2 RCC gravity dam
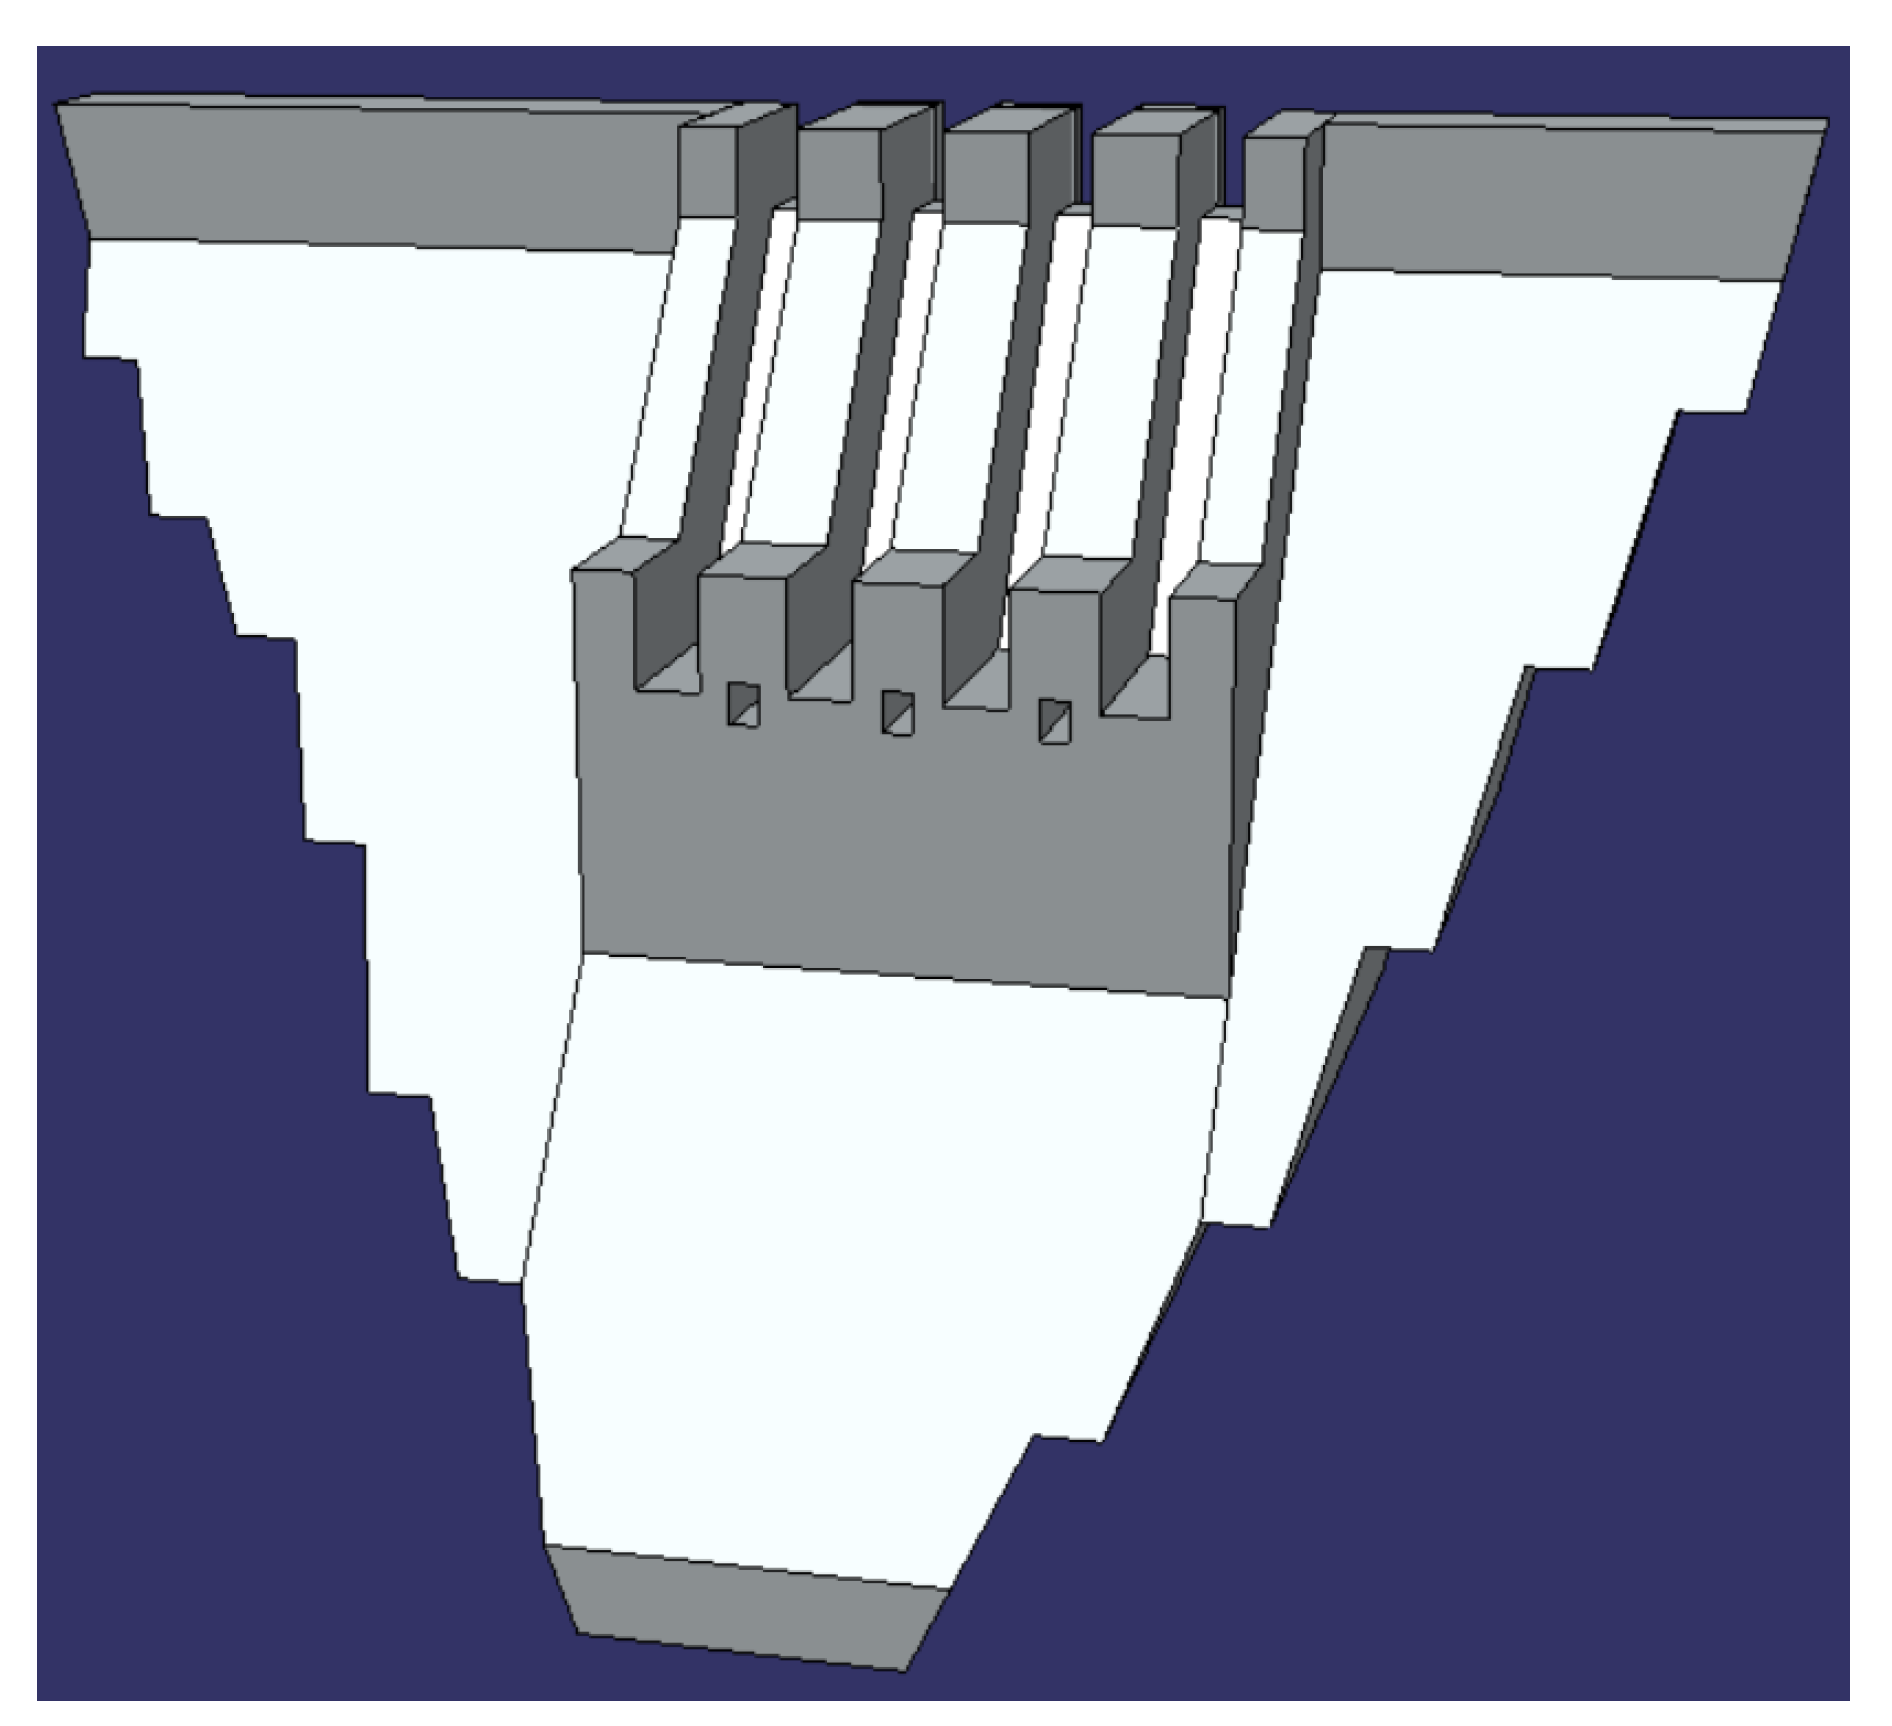
Figure 7 is the three-dimensional model of the Y2 RCC gravity dam. The concrete volume of the gravity dam is 3.27 × 10⁶ m3 with 15 dam monoliths. The dam body has 4 discharge surface holes and 3 middle holes.
4. Comparison Method of Dam Types
The Y2 dam type selection, between the arch dam and the gravity dam, requires quantitative comparison of various progress attributes of typical construction schemes, including the pouring strength of concrete, the rise rate of dam height, the pouring period, and other attributes. These progress attributes, which characterize the construction characteristics, are calculated by construction simulation of the typical construction scheme. Before the dam type selection, it is necessary to determine the typical construction scheme of the arch dam and the gravity dam separately. For each dam type, the typical scheme is selected from the existing construction scheme, according to the principle of optimal progress attributes and minimum construction resource investment. In other words, the smaller the investment of construction resources, the faster the construction progress, and the more likely it is to be selected as a typical scheme. In this paper, a multi-attribute decision-making method was used to select the typical scheme for each dam type. The considered construction resources include the concrete production capacity and the pouring machinery configuration.
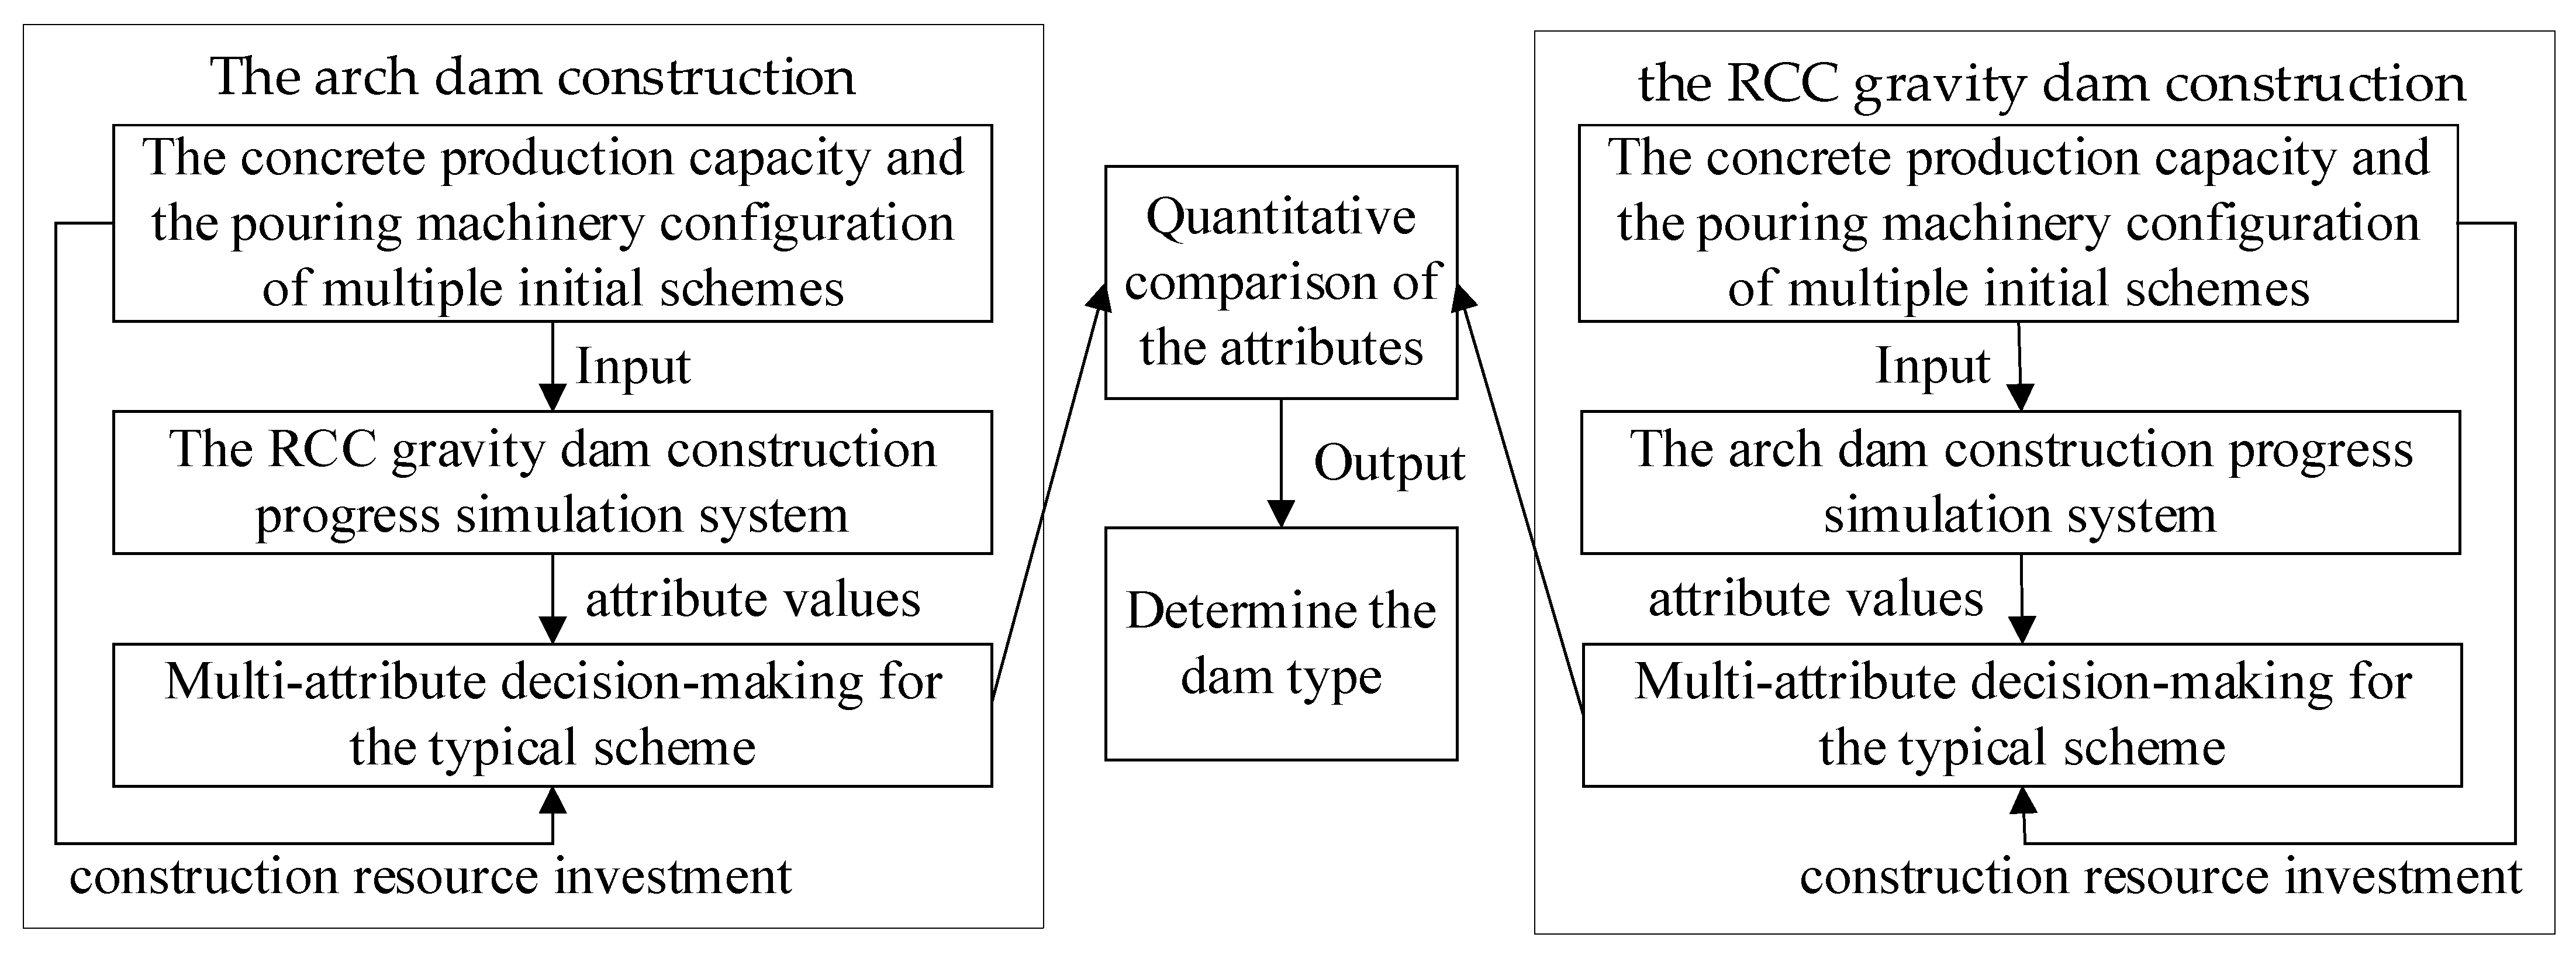
Based on the above analysis, a comparison method of the dam type selection between the arch dam and the RCC gravity dam is proposed, which is shown in Figure 8. First, several initial construction schemes are designed for a dam type, which are the input of the simulation system. Then, the simulation system can calculate the attribute value of each construction scheme. Secondly, based on these attribute values and the construction resource investment of each scheme, a multiattribute decision is used to select the typical schemes for each dam type [27]. Finally, the dam type selection is made by comparing progress attributes of the typical schemes of arch dam and gravity dam.
The comparison steps between the arch dam and the RCC gravity dam are as follows:
Step 1: Simulation calculation for the arch dam construction. Referring to the engineering experience, three sets of initial construction schemes were designed, as shown in Table 4, to analyze the impact of the concrete production capacity and the number of cables on the construction progress. The cable crane is the only machine used to pour concrete for the Y2 arch dam (see Table 5).
Step 2: Simulation calculation for the RCC gravity dam construction. According to the engineering data, the pouring machinery of the medium- and low-line concrete has been determined, and the pouring machinery of the high-line concrete, either the tower belt crane or chute, needs to be compared (see Table 5). In addition, the impact of the concrete production capacity on the construction progress should be analyzed. The pouring parameters of different schemes are shown in Table 6.
Step 3: Multiattribute decision-making. The technique for order preference by similarity to ideal solution (TOPSIS) method [28,29] was adopted to select the typical scheme from multiple schemes for each dam type. The decision-making attributes and the construction resource investment are used to evaluate the construction scheme. The decision-making attributes are listed in Table 7, and their values were calculated using the simulation system. The construction resource investment includes the concrete production capacity and the pouring machinery configuration.
The process of multiattribute decision-making is as follows:
(1) Determining the judgment matrix. According to the attribute values and the construction resource investment of the construction scheme for each dam type, the judgment matrix A (Equation (7)) is established.
where, amn is the n-th progress attribute value or the construction resource investment of the m-th scheme, m is the number of construction schemes, and n is the number of progress attributes.
(2) Standardize the decision-making attributes. The TM, the TD, the PO (see Table 7), and the construction resource investment are all cost-based (reverse direction) indicators. The PV, the PVH, the WRH, and the RH are all benefit-based (positive direction) indicators. Because the TOPSIS method ranks the construction schemes according to the attribute values, converting the cost-based indicators into benefit-based indicators (positive direction) is necessary. The “inverse reciprocal transformation method” is used to change the decision indicators into the benefit-based indicators, which is the reciprocal of the attribute value of each decision indicator. Then, “the mathematical vector normalization method” is used to standardize the attributes to eliminate the dimensional effects of different indicators [30,31].
(3) Ranking the construction schemes. Based on the judgment matrix A, the ideal solution Z+ and the negative-ideal solution Z− are calculated using Equations (8) and (9), respectively. Then, we calculate the weighted distance of each scheme according to Equations (10) and (11). Finally, we calculate the relative closeness to the ideal solution using Equation (12), and rank the schemes based on the score. The scheme with the largest Sm value is optimal, which is selected as the typical scheme for each day type.
where, is the weighted distance of the n-th scheme from the ideal solution, is the weighted distance of the n-th scheme from the negative-ideal solution, is the relative closeness of the n-th scheme, , and is weight of the decision-making attribute, which can be obtained by the subjective weighing methods.
Step 4: Select dam type. Based on the typical construction schemes of the arch dam and the RCC gravity dam obtained in the first three steps, the Y2 dam type is determined by quantitatively comparing the progress attributes.
5. Results
5.1. Calculation Results of the Arch Dam Construction
The results calculated by the arch dam construction progress simulation system are listed in Table 8, with each attribute explained in Table 7. The results of the calculations adopting the TOPSIS method are shown in Table 9. Obviously, scheme 3 is optimal, and is selected as the typical scheme of the arch dam construction.
Analysis of the results: values of the progress attributes for the three schemes are relatively close. The pouring period of scheme 1 is the shortest, 12 days shorter than that of scheme 3, and the difference is small compared to the entire construction period. It is known that increasing concrete production capacity and the number of cables have little effect on speeding up the construction progress, but the cost of doing so is very high, based on engineering experience. In general, the cost of schemes 1 and 2 is much higher than that of scheme 3, but the construction period of the three schemes is close. Therefore, scheme 3 is optimal in comparison, which is also consistent with the results of the multiattribute decision-making.
5.2. Calculation Results of the RCC Gravity Dam Construction
The results calculated by the RCC gravity dam construction progress simulation system are listed in Table 10, with each attribute explained in Table 7. The results of the calculations adopting the TOPSIS method are shown in Table 11. Obviously, scheme 1 is optimal, and is selected as the typical scheme of the RCC gravity dam construction. The reasons are as follows:
(1) In schemes 1 and 2, values of the progress attributes are close, and the difference in construction period is only ten days. Therefore, increasing concrete production capacity has little effect on speeding up the construction progress. However, the cost of scheme 2 is higher than that of scheme 1 because of increasing concrete production capacity. From the economic point of view, scheme 1 is better.
(2) The difference between scheme 1 and scheme 3 is only that at the high-line elevation of the gravity dam, scheme 1 uses the chute to pour concrete, while scheme 3 uses the tower belt crane to pour concrete. The conclusion is that the concrete pouring capacity of the chute is stronger, and the construction period of scheme 2 is shorter.
6. Discussion and Dam Type Selection
To verify the correctness and reliability of the simulation results, the typical schemes selected by the construction simulation were compared with construction schemes of similar dams that have been built in China. These selected dam projects were completed within recent decades, and represent the current level of construction technology.
The key construction parameters of the Y2 arch dam and similar arch dam projects are in Table 12. The Y2 Arch dam has a lower dam height, number of monoliths, and concrete volume compared to other projects, but its average monthly rising height is similar to that of the Jinping I dam, and lower than that of the Wudongde dam. It can be reasonably inferred that the selected typical scheme of the arch dam is feasible and in line with the current level of construction technology.
Table 13 lists the 200 m RCC dams that have been built in China. Through comparative analysis, it can clearly be found that the dam height, concrete volume, and RCC volume of the Y2 RCC gravity dam are similar with those of the Huangdeng dam and the Guangzhao dam. Furthermore, for the Y2 RCC gravity dam, the average monthly rising height is between the average rising height of the Huangdeng dam and the Guangzhao dam, which indicates that its typical scheme is also feasible and in line with the current level of construction technology.
Based on the above analysis, the typical schemes of the arch dam and the gravity dam, in this case, accord with actual engineering. The correctness of the simulation results is verified. The final conclusion is as follows:
For the Y2 dam, the reliable construction period of the arch dam is 34 months, and that of the RCC gravity dam is 28 months. Therefore, from the perspective of construction progress, the Y2 dam type should select the RCC gravity dam in this case.
7. Conclusions
In this paper, construction simulation is adopted to calculate the construction progress of the Y2 dam to support the dam type selection between the arch dam and the RCC gravity dam. First, by changing the construction resource investment, including the concrete production capacity and the pouring machinery configuration, multiple initial construction schemes are set up for each dam type. These initial construction schemes are used as the input of the simulation systems that are developed independently. The output of the simulation system is the values of construction progress attributes, including the pouring strength of concrete, the rise rate of dam height, the pouring period, and other attributes. Secondly, these attribute values and the construction resource investment are used as evaluation indicators of construction schemes. The multiattribute decision-making method was used to select the typical scheme for each dam type. Finally, for the arch dam and the RCC gravity dam, the simulation results of the typical schemes are compared, to determine the optimal dam type of the Y2 dam in terms of the construction progress. The main conclusions of this paper are as follows:
- (1)
- For each dam type in the arch dam and the RCC gravity dam, the construction progress attributes of the Y2 dam are compared to those of similar dams that have been built. It can be found that the construction period of the Y2 dam is rather close to that of the completed dam, in the case of having almost the same height and concrete volume. This indicates that the simulation results of the Y2 dam are consistent with actual construction, and verifies the reliability and accuracy of the simulation methods and systems used in this paper.
- (2)
- According to the simulation results, for the Y2 dam, the construction period of the arch dam is 34 months, and that of the RCC gravity dam is 28 months. From the perspective of construction progress, the Y2 dam type should select the RCC gravity dam.
The construction simulation in this paper has been successfully applied to dam type selection of the Y2 project in China, which shows that the simulation methods and systems can provide technical support for construction engineering and management.
Author Contributions
Conceptualization, C.Z., Q.L. and H.W.; methodology, H.W. and Q.L.; software, Q.L.; validation, C.Z., J.C. and Q.L.; formal analysis, H.W. and Q.L.; investigation, C.Z., F.L. and M.W.; resources, J.C. and F.L.; data curation, M.W. and F.L.; writing—original draft preparation, H.W.; writing—review and editing, Q.L. and C.Z.; visualization, Q.L.; supervision, M.W.; project administration, J.C. and F.L. All authors have read and agreed to the published version of the manuscript.
Funding
This research received no external funding.
Data Availability Statement
Not applicable.
Conflicts of Interest
The authors declare no conflict of interest.
References
- Salehi, M. Global water shortage and potable water safety; Today’s concern and tomorrow’s crisis. Environ. Int. 2022, 158, 106936. [Google Scholar] [CrossRef] [PubMed]
- Qin, Y.; Mueller, N.D.; Siebert, S.; Jackson, R.B.; AghaKouchak, A.; Zimmerman, J.B.; Tong, D.; Hong, C.; Davis, S.J. Flexibility and intensity of global water use. Nat. Sustain. 2019, 2, 515–523. [Google Scholar] [CrossRef]
- Shi, H.; Chen, J.; Liu, S.; Sivakumar, B. The role of large dams in promoting economic development under the pressure of population growth. Sustainability 2019, 11, 2965. [Google Scholar] [CrossRef] [Green Version]
- Ansar, A.; Flyvbjerg, B.; Budzier, A.; Lunn, D. Should we build more large dams? The actual costs of hydropower megaproject development. Energy Policy 2014, 69, 43–56. [Google Scholar] [CrossRef] [Green Version]
- Schulz, C.; Adams, W.M. Debating dams: The World Commission on Dams 20 years on. Wiley Interdiscip. Rev.-Water 2019, 6, e1396. [Google Scholar] [CrossRef]
- Korkmaz, S. Evaluation of Concrete Face Rockfill Alternative for Dam Type Selection: A Case Study on Gökçeler Dam. Ph.D. Thesis, Middle East Technical University, Ankara, Turkiye, 2009. [Google Scholar]
- Jurecha, W.; Widmann, R. Optimization of dam concreting by cable-cranes. In Proceedings of the 11th International Congress on Large Dams, Madrid, Spain, 11–15 June 1973; pp. 43–49. [Google Scholar]
- Halpin, D.W. CYCLONE–method for modeling job site processes. J. Constr. Div. 1977, 103, 489–499. [Google Scholar] [CrossRef]
- Kalk, A. INSIGHT: Interactive Simulation of Construction Operations Using Graphical Techniques; Stanford University, Department of Civil Engineering: Stanford, CA, USA, 1980; Volume 238. [Google Scholar]
- Ioannou, P.G. UM-CYCLONE. Ann Arbor 1990, 1001, 1–29. [Google Scholar]
- McCahill, D.F.; Bernold, L.E. Resource-oriented modeling and simulation in construction. J. Constr. Eng. Manag. 1993, 119, 590–606. [Google Scholar] [CrossRef]
- Lu, M. Simplified discrete-event simulation approach for construction simulation. J. Constr. Eng. Manag. 2003, 129, 537–546. [Google Scholar] [CrossRef]
- Hajjar, D.; AbouRizk, S.M. Application framework for development of simulation tools. J. Comput. Civ. Eng. 2000, 14, 160–167. [Google Scholar] [CrossRef]
- Oloufa, A.A. Modeling operational activities in object-oriented simulation. J. Comput. Civ. Eng. 1993, 7, 94–106. [Google Scholar] [CrossRef]
- AbouRizk, S.; Halpin, D.; Mohamed, Y.; Hermann, U. Research in modeling and simulation for improving construction engineering operations. J. Constr. Eng. Manag. 2011, 137, 843–852. [Google Scholar] [CrossRef]
- Xu, B.; Zou, D.G.; Liu, H.B. Three-dimensional simulation of the construction process of the Zipingpu concrete face rockfill dam based on a generalized plasticity model. Comput. Geotech. 2012, 43, 143–154. [Google Scholar] [CrossRef]
- Zhong, D.; Li, J.; Zhu, H.; Song, L. Geographic Information System-Based Visual Simulation Methodology and Its Application in Concrete Dam Construction Processes. J. Constr. Eng. Manag. 2004, 130, 742–750. [Google Scholar] [CrossRef]
- Kamat, V.R.; Martinez, J.C. Visualizing simulated construction operations in 3D. J. Comput. Civ. Eng. 2001, 15, 329–337. [Google Scholar] [CrossRef]
- Lu, W.; Olofsson, T. Building information modeling and discrete event simulation: Towards an integrated framework. Autom. Constr. 2014, 44, 73–83. [Google Scholar] [CrossRef]
- Zhang, Y.; AbouRizk, S.M.; Xie, H.; Moghani, E. Design and implementation of loose-coupling visualization components in a distributed construction simulation environment with HLA. J. Comput. Civ. Eng. 2012, 26, 248–258. [Google Scholar] [CrossRef]
- Du, R.X.; Zhong, D.H.; Yu, J.; Tong, D.W.; Wu, B.P. Construction Simulation for a Core Rockfill Dam Based on Optimal Construction Stages and Zones: Case Study. J. Comput. Civ. Eng. 2016, 30, 05015002. [Google Scholar] [CrossRef]
- Guan, T.; Zhong, D.H.; Ren, B.Y.; Song, W.S.; Chu, Z.Q. Construction simulation of high arch dams based on fuzzy Bayesian updating algorithm. J. Zhejiang Univ.-Sci. A 2018, 19, 505–520. [Google Scholar] [CrossRef]
- Zhong, D.; Ren, B.; Li, M.; Wu, B.; Li, M. Theory on real-time control of construction quality and progress and its application to high arc dam. Sci. China Technol. Sci. 2010, 53, 2611–2618. [Google Scholar] [CrossRef]
- Flood, I.; Flood, P.D.L. Intelligent control of construction manufacturing processes using deep reinforcement learning. In Proceedings of the 12th International Conference on Simulation and Modeling Methodologies, Technologies and Applications (Simultech), Lisbon, Portugal, 14–16 July 2022; pp. 112–122. [Google Scholar]
- Fu, S.J.; He, T.; Wang, G.J.; Zhang, S.H.; Zou, L.C.; Chen, S.H. Evaluation of cracking potential for concrete arch dam based on simulation feedback analysis. Sci. China-Technol. Sci. 2011, 54, 565–572. [Google Scholar] [CrossRef]
- Fei, W.; Jinfei, L.; Xishuang, Y.; Yaosheng, T.; Tiangang, Z.; Zhiyue, Y.; Bo, F.; Xiaolong, Y. Intelligent scheduling for high arch dams. J. Tsinghua Univ. 2021, 61, 756–767. [Google Scholar]
- Albulescu, A.-C.; Minea, I.; Boicu, D.; Larion, D. Comparative Multi-Criteria Assessment of Hydrological Vulnerability—Case Study: Drainage Basins in the Northeast Region of Romania. Water 2022, 14, 1302. [Google Scholar]
- Axelsson, C.; Giove, S.; Soriani, S. Urban Pluvial Flood Management Part 1: Implementing an AHP-TOPSIS Multi-Criteria Decision Analysis Method for Stakeholder Integration in Urban Climate and Stormwater Adaptation. Water 2021, 13, 2422. [Google Scholar] [CrossRef]
- Wang, Z.; Zhang, H.; Wang, Y.; Zhou, C. Integrated Evaluation of the Water Deficit Irrigation Scheme of Indigowoad Root under Mulched Drip Irrigation in Arid Regions of Northwest China Based on the Improved TOPSIS Method. Water 2021, 13, 1532. [Google Scholar] [CrossRef]
- Kaewfak, K.; Huynh, V.N.; Ammarapala, V.; Charoensiriwath, C. A fuzzy AHP-TOPSIS approach for selecting the multimodal freight transportation routes. In Proceedings of the Knowledge and Systems Sciences, KSS 2019, Da Nang, Vietnam, 29 November–1 December 2019; pp. 28–46. [Google Scholar]
- Wang, H.; Liu, Q.; Zhang, H.Y.; Jin, Y.L.; Yu, W.Z. A Two-Stage Decision-Making Method Based on WebGIS for Bulk Material Transportation of Hydropower Construction. Energies 2022, 15, 1726. [Google Scholar] [CrossRef]
Figure 1.
Description of construction process for concrete dams.

Figure 2.
Flowchart of construction simulation for concrete dams.

Figure 3.
Framework of the arch dam construction progress simulation system.

Figure 4.
Framework of the RCC gravity dam construction progress simulation system.

Figure 5.
Schematic diagram of the demarcation of the dam body.

Figure 6.
Three-dimensional model of the Y2 Arch dam.

Figure 7.
Three-dimensional model of the RCC gravity dam.

Figure 8.
The comparison method process of dam types.


Table 1.
The dam body shape parameters.
| Parameters | Description |
|---|---|
| Dam monoliths | Dam body is divided into several dam sections through transverse joints |
| Elevation | Elevation of the dam block |
| Height | Height of each dam block |
| Area | Upper surface area of each dam block |
| Volume | Volume of each dam block |
| Coordinates | Spatial coordinates of the corner points of each dam block |
Table 2.
Some construction conditions and simulation parameters.
| Parameters | Description |
|---|---|
| Mechanical configuration | Two categories: concrete transportation machinery and pouring machinery, including the type and quantity of machinery. |
| Concrete production system | Includes the layout location, capacity, and quantity of the production system. |
| Meteorological conditions | Includes high winds, heavy rain, high temperature, etc., that affect the construction. |
| Effective working hours | Refers to the actual number of construction days per month and the actual construction hours per day. |
| Concrete cooling temperature | Poured concrete needs to be cooled to a certain temperature by water before subsequent construction can begin. |
| Joint grouting constraint | The horizontal joints that exist after the dam body is poured in blocks are filled with concrete to make the dam form a whole. Generally, this takes 120–180 days. |
| Interlayer intermittent | Waiting time of concrete pouring between upper block and lower block. Generally, this takes 3–7 days. |
| Cantilever height constraint | The gap between the pouring elevation of a single dam monolith and the elevation of the grout cannot exceed a certain limit. Generally, this is 63–72 m. |
| Pouring appearance restrictions | The gap between the pouring elevations between adjacent dam sections should not be excessive. Generally, this is 6–9 m. |
Table 3.
Construction environment conditions and effective working days monthly.
| Environment Condition | Month | |||||||||||
|---|---|---|---|---|---|---|---|---|---|---|---|---|
| 1 | 2 | 3 | 4 | 5 | 6 | 7 | 8 | 9 | 10 | 11 | 12 | |
| Average temperature (°C) | 6.1 | 9.4 | 13.3 | 14.8 | 18.3 | 19.9 | 20 | 20 | 17.4 | 14.5 | 8.1 | 5.1 |
| Maximum temperature (°C) | 22.2 | 29 | 28.8 | 35 | 37.8 | 38 | 36.2 | 39.1 | 33 | 28.4 | 21.4 | 19.5 |
| Minimum temperature (°C) | −5 | −2 | 1 | 5.2 | 6 | 9.5 | 12 | 11.5 | 7.5 | 3.4 | −0.7 | −3.2 |
| Average wind speed (m/s) | 0.4 | 0.5 | 0.6 | 0.8 | 0.6 | 0.4 | 0.3 | 0.3 | 0.2 | 0.5 | 0.3 | 0.2 |
| Maximum wind speed (m/s) | 4 | 3 | 7 | 9 | 6 | 7 | 4 | 4 | 3 | 5 | 4 | 4 |
| Effective working days | 23 | 26 | 24 | 25 | 26 | 25 | 26 | 25 | 28 | 28 | 26 | 25 |
Table 4.
Construction resource investment of the arch dam construction schemes.
| Schemes | The Concrete Production Capacity (m3/h) | The Number of Cables |
|---|---|---|
| 1 | 720 | 4 |
| 2 | 480 | 4 |
| 3 | 480 | 3 |
Table 5.
Table of machinery used for pouring concrete in the Y2 dam.
| Name | Image | Description |
|---|---|---|
| Cable crane |  | The cable crane system uses the bearing cable tensioned between the main and auxiliary towers as the driving track of the load trolley to lift the concrete tank. It is usually arranged on both sides of the river valley, and plays a long-term role throughout the construction period. |
| Dump truck |  | Dump trucks are commonly used machinery in hydropower for transporting concrete, and are relatively mobile and flexible. For the low-line concrete of the dam body, dump trucks are often used to transport it directly into the storehouse surface from the concrete production system. |
| Vacuum chute |  | The vacuum chute is a concrete conveying machine with a simple structure, which is usually arranged on the dam shoulder, relying on the slope to convey concrete down quickly and safely, and is especially suitable for roller-compacted concrete. |
| Belt conveyor |  | The belt conveyor is a handling machine that continuously conveys concrete on a certain line. It can carry out horizontal, inclined, and vertical conveying, and can also form a space conveying line, and the conveyor line is generally fixed. The belt conveyor has a strong conveying capacity and a long transportation distance. |
| Tower belt crane |  | The tower belt crane is a consortium formed by adding a set of suspension belt conveyor systems to the tower crane. Pouring concrete with the tower belt crane integrates horizontal transportation and vertical transportation, and has a strong pouring concrete capacity, and is a commonly used concrete transportation machinery in recent years. |
Note: These images are all from Baidu Image Search: https://image.baidu.com (accessed on 20 March 2023).
Table 6.
Construction resource investment of the RCC gravity dam construction schemes.
| Schemes | The Concrete Production Capacity (m3/h) | The Pouring Machinery of Concrete | ||
|---|---|---|---|---|
| Low-Line Elevation | Medium-Line Elevation | High-Line Elevation | ||
| 1 | 600 | Dump trucks | Chute and dump trucks | Chute and belt conveyors |
| 2 | 720 | Dump trucks | Chute and dump trucks | Chute and belt conveyors |
| 3 | 600 | Dump trucks | Chute and dump trucks | Tower belt crane |
Table 7.
Table of progress attributes used for assessing the dam construction schemes.
| Name | Description |
|---|---|
| TM | Total months of dam concrete construction |
| TD | Total days of dam concrete construction |
| PV | Pouring volume of concrete in the month with the highest pouring strength |
| PVH | PV, at the high-line elevation of the RCC gravity dam |
| PO | Proportion of old concrete in the dam body concrete |
| WRH | Water retaining height before the flood period in the second year from the construction beginning |
| RH | Average monthly rising height of the dam concrete |
Table 8.
Values of the progress attributes for the arch dam construction.
| Schemes | CPC (m3/h) | NC | TM (months) | TD (Days) | PV (m3/Month) | PO | WRH (m) |
|---|---|---|---|---|---|---|---|
| 1 | 720 | 4 | 34 | 1009 | 68282 | 1.843 | 63 |
| 2 | 480 | 4 | 34 | 1016 | 61767 | 2.135 | 63 |
| 3 | 480 | 3 | 34 | 1021 | 63571 | 2.074 | 63 |
Notes: CPC is the concrete production capacity; NC is the number of cables.
Table 9.
Results of the calculations adopting the TOPSIS method for the arch dam.
| Schemes | CPC | NC | TM | TD | PV | PO | WRH | Sm | ||
|---|---|---|---|---|---|---|---|---|---|---|
| 1 | 1.374 | 1.601 | 1.732 | 1.743 | 0.610 | 1.900 | 1.732 | 0.151 | 0.004 | 0.025 |
| 2 | 2.062 | 1.601 | 1.732 | 1.731 | 0.552 | 1.640 | 1.732 | 0.061 | 0.094 | 0.609 |
| 3 | 2.062 | 2.134 | 1.732 | 1.722 | 0.568 | 1.688 | 1.732 | 0.003 | 0.152 | 0.984 |
Table 10.
Values of the progress attributes for the RCC gravity dam construction.
| Schemes | CPC (m3/h) | MC (High-Line Elevation) | TM (Months) | TD (Days) | PV (m3/Month) | PVH (m3/Month) | RH (m/Month) | WRH (m) |
|---|---|---|---|---|---|---|---|---|
| 1 | 600 | Chute and belt conveyors | 28 | 851 | 237550 | 103474 | 7.5 | 115 |
| 2 | 720 | Chute and belt conveyors | 28 | 841 | 242980 | 116020 | 7.5 | 118 |
| 3 | 600 | Tower belt crane | 31 | 934 | 237550 | 88377 | 6.77 | 115 |
Notes: PVH is the pouring volume of concrete in the month with the highest pouring strength at the high-line elevation of the RCC gravity dam. In schemes 1 and 2, concrete at the high-line elevation is poured with the chute, while in scheme 3, the concrete is poured with the tower belt crane. PV is the pouring volume of concrete in the month with the highest pouring strength for the entire construction period. According to the simulation results, in the three schemes, the location of PV is at the lower-line elevation of the dam where concrete is poured with dump trucks. PMC is the machinery configuration of pouring concrete. In the low- and medium-line elevations, the pouring machinery configuration is the same for the three schemes. Therefore, we only compare the differences of the pouring mechanical configuration in the high-line elevation.
Table 11.
Results of the calculations adopting the TOPSIS method for the RCC gravity dam.
| Schemes | CPC | MC | TM | TD | PV | PVH | RH | WRH | Sm | ||
|---|---|---|---|---|---|---|---|---|---|---|---|
| 1 | 1.855 | 2.062 | 1.796 | 1.784 | 0.569 | 0.579 | 0.596 | 0.572 | 0.001 | 0.123 | 0.995 |
| 2 | 1.546 | 2.062 | 1.796 | 1.805 | 0.582 | 0.649 | 0.596 | 0.587 | 0.019 | 0.106 | 0.848 |
| 3 | 1.855 | 1.374 | 1.622 | 1.625 | 0.582 | 0.494 | 0.538 | 0.572 | 0.106 | 0.019 | 0.153 |
Notes: The investment of the pouring machinery is quantified using an expert scoring method.
Table 12.
The key construction parameters of arch dams in China.
| Dam Name | Height (m) | Number of Dam Monoliths | Concrete Volume (10,000 m3) | Average Rising Height Monthly (m/Month) | Pouring Period (Month) |
|---|---|---|---|---|---|
| Y2 dam | 210 | 17 | 150 | 6.18 | 34 |
| Jinping I dam | 305 | 26 | 571 | 6.10 | 50 |
| Baihetan dam | 289 | 31 | 892 | 5.67 | 51 |
| Wudongde dam | 270 | 15 | 273 | 6.92 | 39 |
| Dagangshan dam | 210 | 29 | 320 | 5.68 | 37 |
Table 13.
The key construction parameters of RCC gravity dams in China.
| Dam Name | Height (m) | Concrete Volume (10,000 m3) | RCC Volume (10,000 m3) | Average Rising Height Monthly (m/Month) | Pouring Period (Month) |
|---|---|---|---|---|---|
| Y2 dam | 210 | 327.1 | 277.8 | 7.50 | 28 |
| Longtan dam | 216.5 | 736.0 | 495.0 | 5.15 | 42 |
| Huangdeng dam | 203 | 350.7 | 275.3 | 5.64 | 36 |
| Guangzhao dam | 200.5 | 278.8 | 242.0 | 8.35 | 24 |
| Guandi dam | 168 | 297.0 | 253.5 | 6.86 | 24.5 |
Disclaimer/Publisher’s Note: The statements, opinions and data contained in all publications are solely those of the individual author(s) and contributor(s) and not of MDPI and/or the editor(s). MDPI and/or the editor(s) disclaim responsibility for any injury to people or property resulting from any ideas, methods, instructions or products referred to in the content. |
© 2023 by the authors. Licensee MDPI, Basel, Switzerland. This article is an open access article distributed under the terms and conditions of the Creative Commons Attribution (CC BY) license (https://creativecommons.org/licenses/by/4.0/).
Share and Cite
MDPI and ACS Style
Zhang, C.; Wang, H.; Cao, J.; Liu, Q.; Liu, F.; Wang, M. Type Selection between Arch Dam and Gravity Dam Based on Construction Simulation: A Case Study. Water 2023, 15, 1482. https://doi.org/10.3390/w15081482
AMA Style
Zhang C, Wang H, Cao J, Liu Q, Liu F, Wang M. Type Selection between Arch Dam and Gravity Dam Based on Construction Simulation: A Case Study. Water. 2023; 15(8):1482. https://doi.org/10.3390/w15081482
Chicago/Turabian StyleZhang, Chao, Hao Wang, Jiayun Cao, Quan Liu, Fang Liu, and Mingtao Wang. 2023. "Type Selection between Arch Dam and Gravity Dam Based on Construction Simulation: A Case Study" Water 15, no. 8: 1482. https://doi.org/10.3390/w15081482
Note that from the first issue of 2016, this journal uses article numbers instead of page numbers. See further details here.