Article

Evolution of the Chenglingji–Datong Channel in the Middle and Lower Reaches of the Yangtze River and Its Drivers

1
College of Earth Science, Chengdu University of Technology, Chengdu 610059, China
2
Institute of Multipurpose Utilizationg of Mineral Resources, China Academy of Geological Science, Chengdu 610042, China
*
Author to whom correspondence should be addressed.
Water 2023, 15(8), 1484; https://doi.org/10.3390/w15081484
Submission received: 1 February 2023 / Revised: 28 March 2023 / Accepted: 6 April 2023 / Published: 11 April 2023

Abstract

:
In recent years, the water–sand composition of the Yangtze River channel has changed due to the influence of human factors, especially the construction of water reservoirs such as the Three Gorges Project. Changing water–sand conditions have a long-term impact on the shaping of the river channel morphology in the middle and lower reaches of the Yangtze River, and the erosion retreat of local river sections has caused great harm to embankment projects. This paper focuses on the river evolution mechanism of the river channel from Chenglingji to Datong in the middle and lower reaches of the Yangtze River over the past 31 years. Landsat remote sensing images from 1989–2019 were used to extract and interpret water bodies, river shorelines, and central bars in the study area using the Modified Normalized Difference Water Index (MNDWI) combined with visual interpretation. We used near analysis to study the morphological evolution characteristics of the river, the channel, and selected typical river reaches for comparative analysis. We found out that the overall change in river morphology between 1989 and 2019 was small in the horizontal direction, but the local area changed significantly. Considerable scouring occurred in the vertical direction. Combining hydrological and meteorological data, we investigated the effects of the Three Gorges Dam, instream sand mining, boundary conditions, vegetation cover on both sides of the riverbanks, and aspects of storm flooding in the watershed on the evolution of the river. The study indicated that the geological conditions on both sides of the river, the implementation of the bank protection project, and the improvement of vegetation cover on both sides of the river have made the riverbanks more resistant to scouring. However, heavy rainfall floods, the operation of the Three Gorges Reservoir, and sand mining activities in the river channel make the river channel more susceptible to scouring. Based on the calculation of the slope change rate of the accumulated volume, it was found that the runoff is mainly influenced by precipitations, while the sand transport is mainly affected by human activities. This study shows that natural and anthropogenic activities affect the equilibrium state of the river’s water and sediment to varying degree.

1. Introduction

Human development and rivers have been closely linked since ancient times. Rivers have created the ecological environment for human survival, and in turn, human development of civilization has been facilitated by the increasing understanding and use of rivers [1]. In recent years, the water–sand combination of the Yangtze River channel has been changed due to anthropogenic factors, especially the construction of water conservancy facilities such as the Three Gorges Project, and the changes are not transient. Changing water–sand conditions have a very long-term impact on the shaping of river morphology in the middle and lower reaches of the Yangtze River [2]. The main river channels in the middle and lower reaches of the Yangtze River have undergone drastic evolution, showing serious bank collapses, which pose a threat to flood safety and affect the operation of national economic facilities along the river [3]. For the management and control of unstable river sections, the law of river evolution and its evolution mechanism need to be used as a reference, so that reasonable planning and remediation can be made to stabilize the river [4].
The changes in water and sand in the river channel are closely related to the river evolution process. Once the river water and sand conditions change, the river channel adjusts accordingly [5]. River evolution can be studied from both horizontal and vertical dimensions. Studies on the evolution of the Yellow River have focused on its vertical changes and have analyzed changes in the scouring and deposition of the river channel, the shape of the longitudinal section, and the spatial and temporal evolution of the flow and water level [6,7,8,9]. There are also some studies on the horizontal evolution, such as shoreline change, beach scouring, and deposition [10,11,12,13,14]. The analysis of river channel evolution of small rivers in China, such as the Gan and Xiang Rivers, has also focused on river channel scouring and deposition changes [15,16,17]. Outside of China, river channel evolution studies are also about horizontal changes (e.g., shoreline migration and river area) and vertical changes (e.g., channel scouring, deposition changes, and river section shape), such as the Mississippi, Nile, the Ganges, and other large rivers [18,19,20,21]. On the whole, many scholars tend to analyze river evolution from both horizontal and vertical points of view.
As remote sensing and GIS technologies advance by leaps and bounds, they have been increasingly used in river evolution studies.more and more widely used in the field of river evolution research. Remote sensing and GIS technologies have become the main research tools in the evolution of the middle and lower reaches of the Yangtze River in terms of shoreline evolution, the evolution of beaches, and continental siltation. The research results have important reference values for river regulations. Landsat imagery and related actual measurement data were used to calculate the meander coefficient, bank, and island erosion accumulation area of the Nile River in Egypt from 1987 to 2000, and to analyze the processes associated with sediment accumulation and new islands formation [22]. The corresponding Landsat images were selected from the upper Amazon River water level data based on the principle of homogeneous water level interpretation [23]. The interpreted data were compared to analyze the characteristics of the evolution of the river planform. The relationship between runoff volume and river evolution was also explored. The CAESAR-Lisflood model was used to study the channel evolution of ten river floodplains in northern England, quantifying channel erosion, accretion, and lateral migration rates [24]. The driving forces behind the evolution of the Sharda River were analyzed using GIS techniques based on remote sensing data collected between 1977 and 2001 [25]. The morphological characteristics of the Gumara River watercourse in the upper Blue Nile basin, Ethiopia, over 50 years were analyzed through GIS using multi-year measured data from hydrological stations [26]. The change in channel planform of the Ganges and Padma rivers in Bangladesh was studied by GIS technique using multi-period satellite remote sensing imagery from 1973 to 2011 as the base data [27]. It was found that the barrage in the upper Ganges had a negative impact on the downstream channel through the study of the relationship between multi-year flow data and channel evolution characteristics. The GIS technique was used to calculate the river migration rate, meander coefficient of erosion-prone channels, and to predict the distance of the lateral movement of the river centerline based on multi-temporal satellite remote sensing imagery of the Pajilti River in West Bengal, India. Multi-temporal Landsat remote sensing images and Google Earth (GE) images were used to digitize the river channel on the ArcGIS 10.2 platform according to the image features [28]. The vector layer of the river channel in different years was obtained, and the evolution characteristics of the river channel and the change pattern of flushing and siltation in the first big bend of the Yellow River during the past 26 years were obtained through comparative analysis. Remote sensing technologies have outstanding advantages such as large area monitoring, simultaneous monitoring, long time series monitoring, and repeatable observation of the same area, which can be used for long-term and flexible investigation independent of the sea and surface conditions. The use of remote sensing technology can effectively monitor the evolution of sandbars, and by superimposing remote sensing images of different phases, the evolution of sandbars can be quickly detected.
The river channel oscillation is vulnerable to bank erosion and collapse, and a large amount of agricultural land in the beach area is destroyed. Compared with the previous methods of river evolution research, remote sensing application technology, with its advantages of wide monitoring range, long time series of data archiving, and low application costs, provides an intuitive and complete interpretation of river shape characteristics and has great potential for historical river change mapping. The Yangtze River is the first in Asia and the third largest in the world for length and flow, after the Amazon and the Nile. Although its natural conditions are superior, there are some problems that need to be solved: the mainstream line of each local section of the river is still oscillating; the erosion of local sections of the river is very harmful to the lives of residents on both sides of the river and embankment projects; the swimming accumulation of some sections of the river adversely affects the setting of ports, docks, and factories. The Three Gorges Dam is the world’s largest river hydroelectric project. Its impact on the Yangtze River and its basin environment has been the focus of research in China and abroad [29,30].
The study of the evolution mechanism of the middle and lower reaches of the Yangtze River is mainly approached from the following five directions: the influencing factors of scouring-deposition evolution of the beach in the Yangtze River [31]; the influence of water and sediment transport on the evolution of the branch channel in the braided reach of the Yangtze River [32]; the planar morphological characteristics of the evolution of the Yangtze River channel in terms of riverbanks [33], mid-channel bars [34], and point bars [35]; the longitudinal evolution of the river channel through changes in river scouring and siltation [36]; the mechanism of the river evolution through both natural and human factors. Additionally, some scholars focus on the evolution of local river sections with severe local changes, mainly analyzing the longitudinal thalweg, beach area, and the rise and fall of branch channels, predicting river changes by exploring its evolution mechanisms, as it washas been done for Qigongling River [37] and Chengtong River [38].
Based on remote sensing images, the GIS technology is used to extract the evolution of the river planes. Combined with the measured data, the characteristics of the river evolution are analysed to investigate the inner mechanism behind the evolution, which is a relatively scientific research process of river evolution [39,40]. Socioeconomic development has caused and increased pressure on the water and sand conditions of the river through the effect of human activities, such as the construction of defense structures, land reclamation, water conservancy projects, and sand mining [41]. For example, the construction and use of the Three Gorges Dam inevitably led to changes in the water and sand content in the river section near the dam [42]. Therefore, it is urgent to study the impact on the river section at a certain distance from the dam.
These studies on the analysis of the river channel evolution have informed the research about the evolution of the Chenglingji–Datong Channel in the middle and lower reaches of the Yangtze River and its driving mechanisms. Previous studies have mainly focused on water and sand characteristics, tidal currents, riverbed, and river evolution. There are fewer studies on the evolution of the sandbar in the northern branch of the Yangtze estuary, and they are mainly based on information on hydrology, sediment, and river topography. It is difficult to obtain field data for large areas of the river channel [43]. Remote sensing imagery can address this problem. Current research methods are based on remote sensing imagery combined with visual interpretation, using a single image acquisition [44,45], whereas we have combined the modified normalized difference water index (MNDWI), taking into account precipitation and runoff, to analyze channel variability. Previous studies on the Yangtze River have focused on the Jiangxi and Jiangsu sections in the lower reaches of the Yangtze [46,47], with less emphasis on the section of the river between Chenglingji and Datong, which links the middle and lower reaches of the Yangtze.
This study used GIS and remote sensing techniques to analyze multi-temporal satellite images of the middle and lower reaches of the Yangtze River from Chenglingji to Datong from 1989 to 2019, to study the river evolution patterns and water–sand characteristics, as well as the relationship between the two, and to explore the mechanisms and driving forces behind the river evolution. This study focuses on quantifying the morphological changes in the riverbank movement, erosion/absorption rates, and the lateral alluvial area over more than 30 years. By quantifying the spatial extent, rate of shoreline changes, and river cores in the middle and lower reaches of the Yangtze River from Chenglingji to Datong, we aim to better understand the erosion and siltation processes in the Yangtze River from the perspective of river width and curvature, as well as the impact of human interventions, such as the construction of the Three Gorges Dam. The results of this study will help us to understand and predict the morphological behavior of the Chenglingji to Datong River section, which can help mitigate the potential adverse socioeconomic impacts of river channel changes in the Yangtze. The study also aims at developing a set of intelligent and rapid tracking methods for river channel changes, explore the driving factors of river channel changes from natural and human factors, and provide decision-making support for the Yangtze River channel to achieve a new balance of water and sand. The research results will provide a reference and a theoretical basis for the regulation of the Yangtze River waterway, the utilization of shoreline resources, flood control safety, river management, and other aspects.

2. Study Area and Data

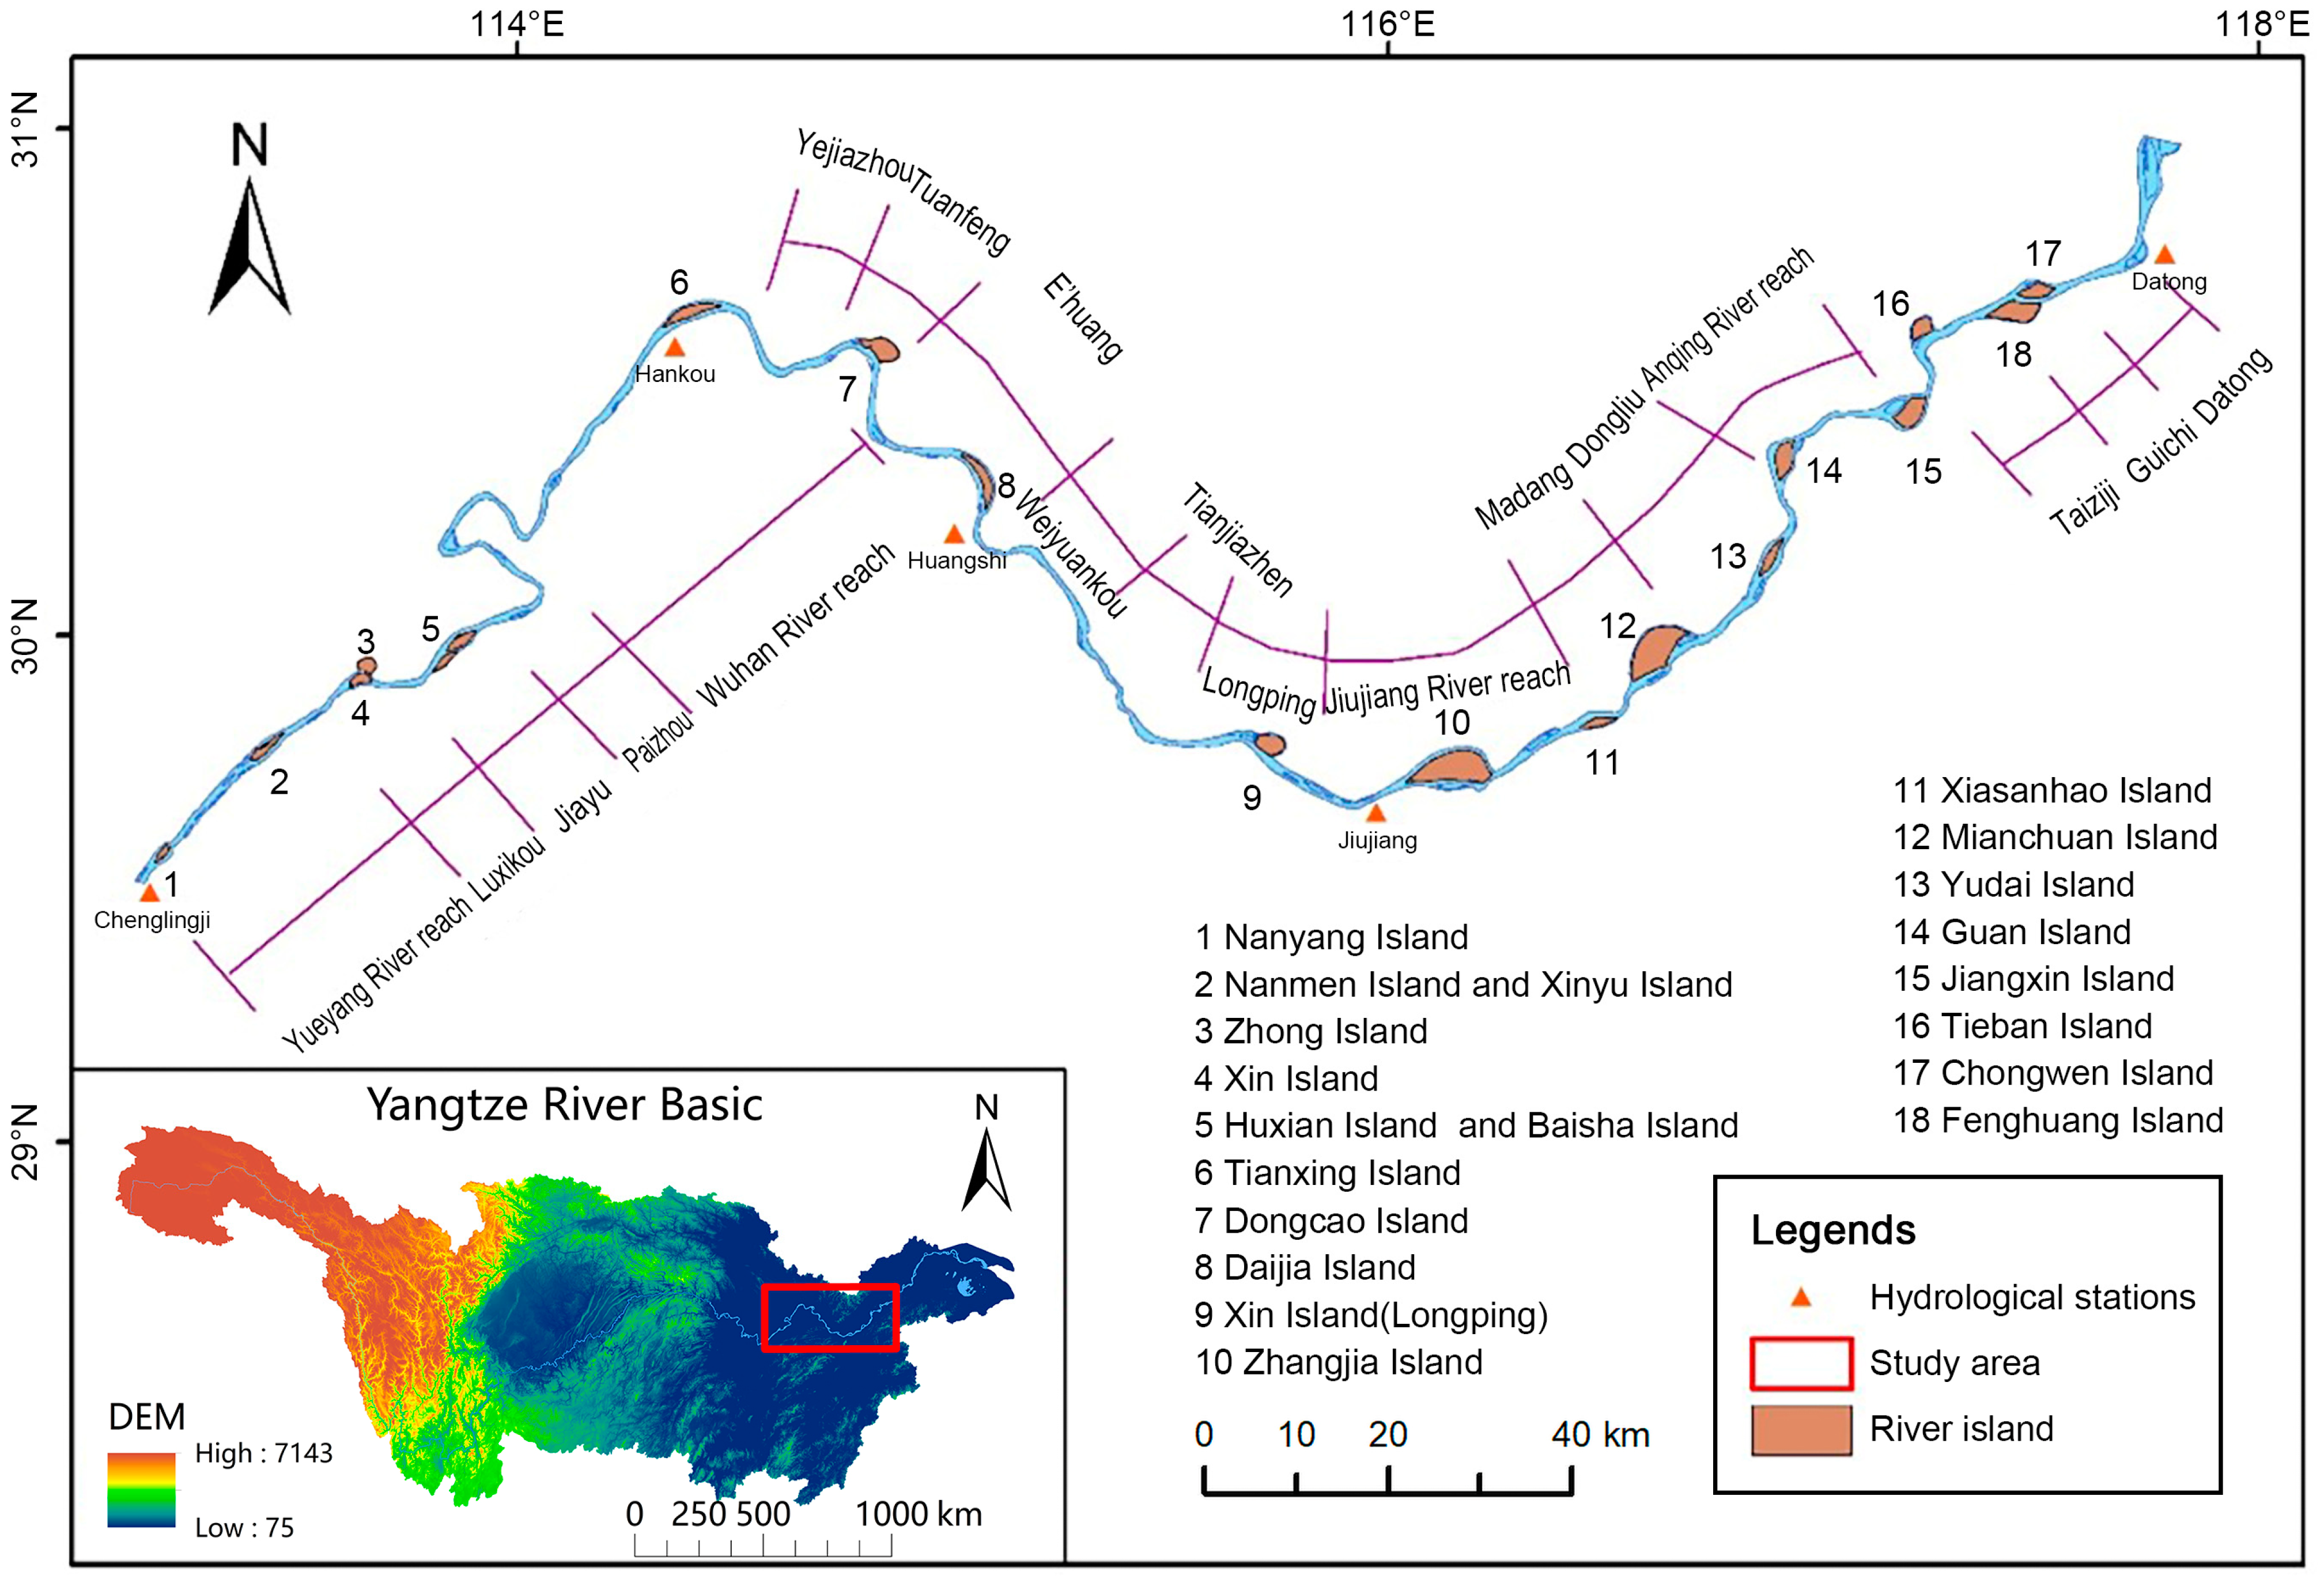
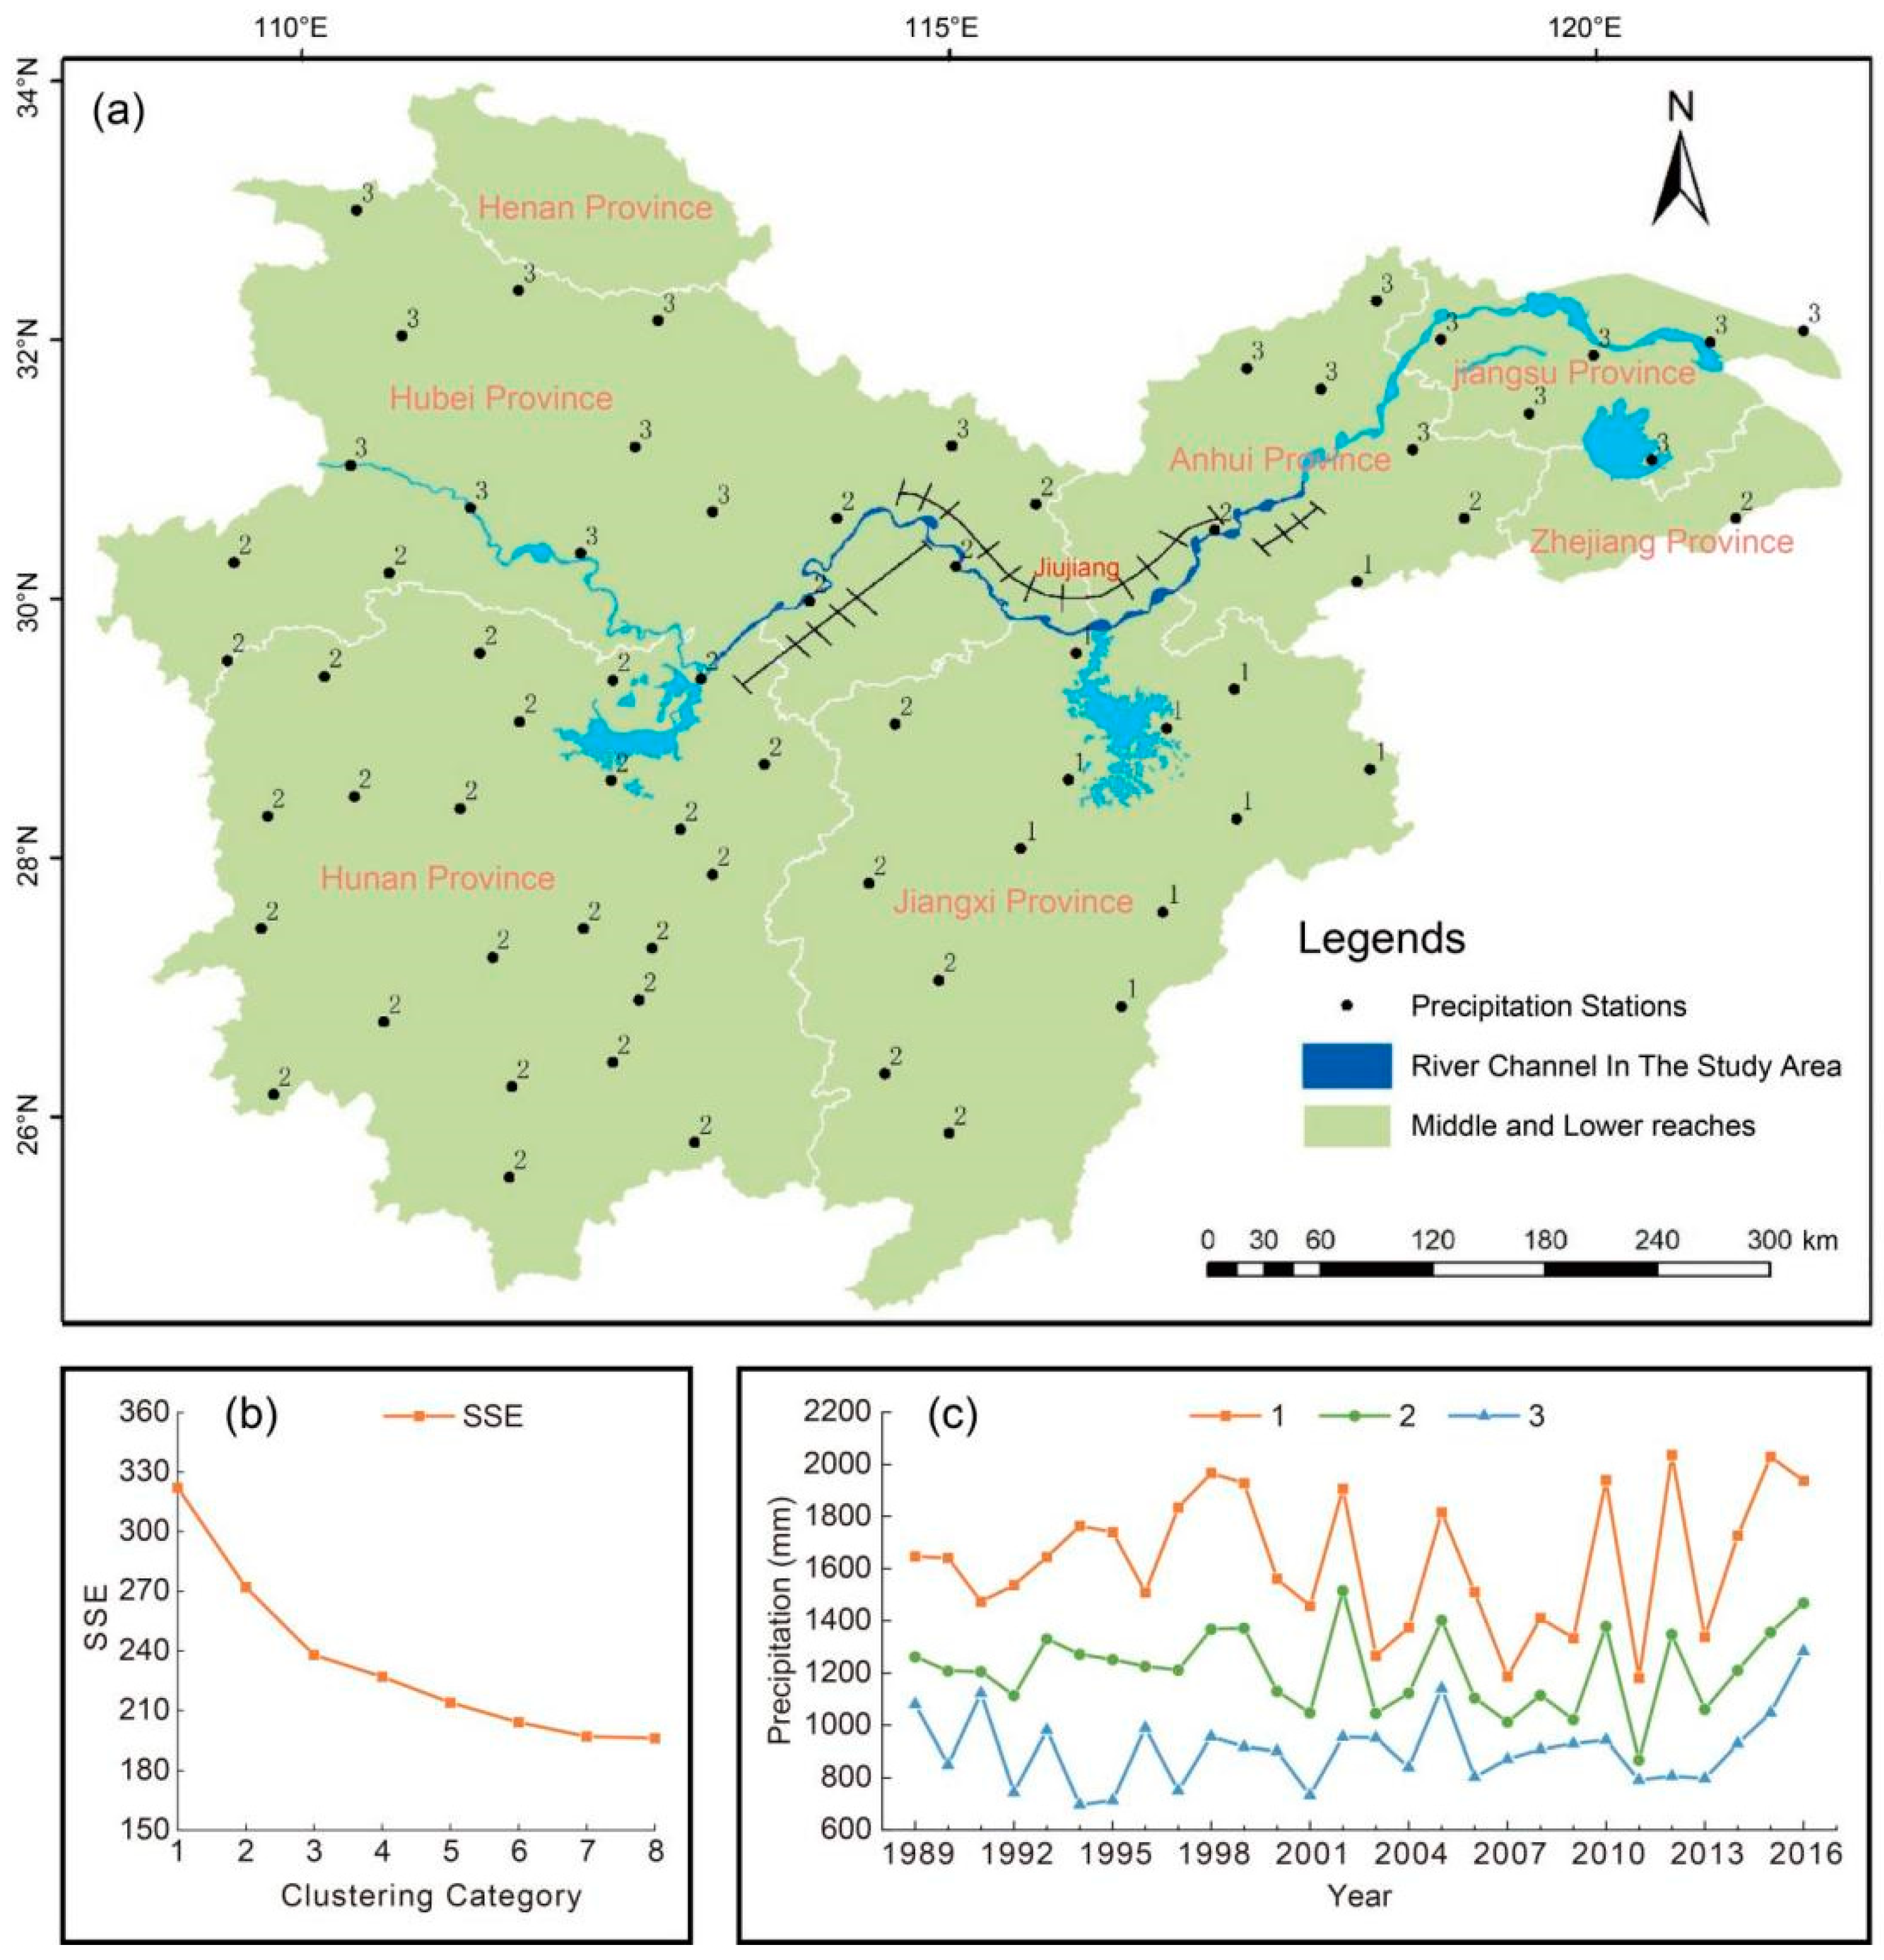
With a length of more than 6300 km, the Yangtze River is the longest river in both China and Asia and the third longest in the world. The reaches of the Yangtze River are divided into middle and lower at the boundary with Hukou County. The study area of this paper is the Chenglingji to Datong River section, which contains both the middle and lower reaches of the river (Figure 1). The channel section from Chenglingji (29°26′ N, 113°08′ E) to Datong River (30°46′ N, 117°37′ E) is about 753.4 km long and is one of the most densely populated areas in the middle and lower reaches of the Yangtze River. The evolution process of the river course is very complicated, even in the same river, but because of the different river reach, its evolution law will be different. The rivers in the study area are so long that they need to be studied in segments. The main purpose of studying the river course evolution is to provide a reference for river course management. Therefore, the river course management plan of the middle and lower reaches of the Yangtze River is referred to when the river course is segmented. According to its division principle, the section of the river is divided into three categories, of which the first category is the river segment that needs to be controlled, the second category and the third category are the river segment that needs to be controlled generally [48]. River channel changes refer to the changes that occur in the river channel under natural conditions or under the influence of human factors. River channel changes can be divided into two categories, vertical and horizontal changes, from the manifestation. The riverbed in the middle and lower reaches of the Yangtze River from Chenglingji to Datong has an overburden layer on top of the bedrock with an average thickness of about 10–12 m. The overburden layer consists of sand, gravel, and pebbles. We conducted a comparative analysis of the changes in river morphology and the changes in the amount of flushing and siltation. Most of the areas on the left and right sides of the river in the study area are alluvial plains, and the coastal boundary is mainly made up of the river terraces, hills, and low hills; the width of the riverbanks varies, with different widths, showing a coupling-like bending pattern. A typical geomorphic feature exists in the section from Chenglingji to Datong, namely nodes, which makes the riverbanks with nodes have strong scouring resistance, can make the riverbanks have strong stability, and plays a stabilizing role in the evolution of the river. The shoreline of the middle and lower reaches of the Yangtze River from Chenglingji to Datong is mainly an alluvial shoreline composed of Holocene loose sediments, and is weak in alluvial resistance, with frequent shoreline oscillations under the action of water and sand, and obvious changes in lateral alluvium and siltation of the river channel, leaving the river in an unstable state, and sometimes even the banks collapse, causing threats to people’s personal safety and property.
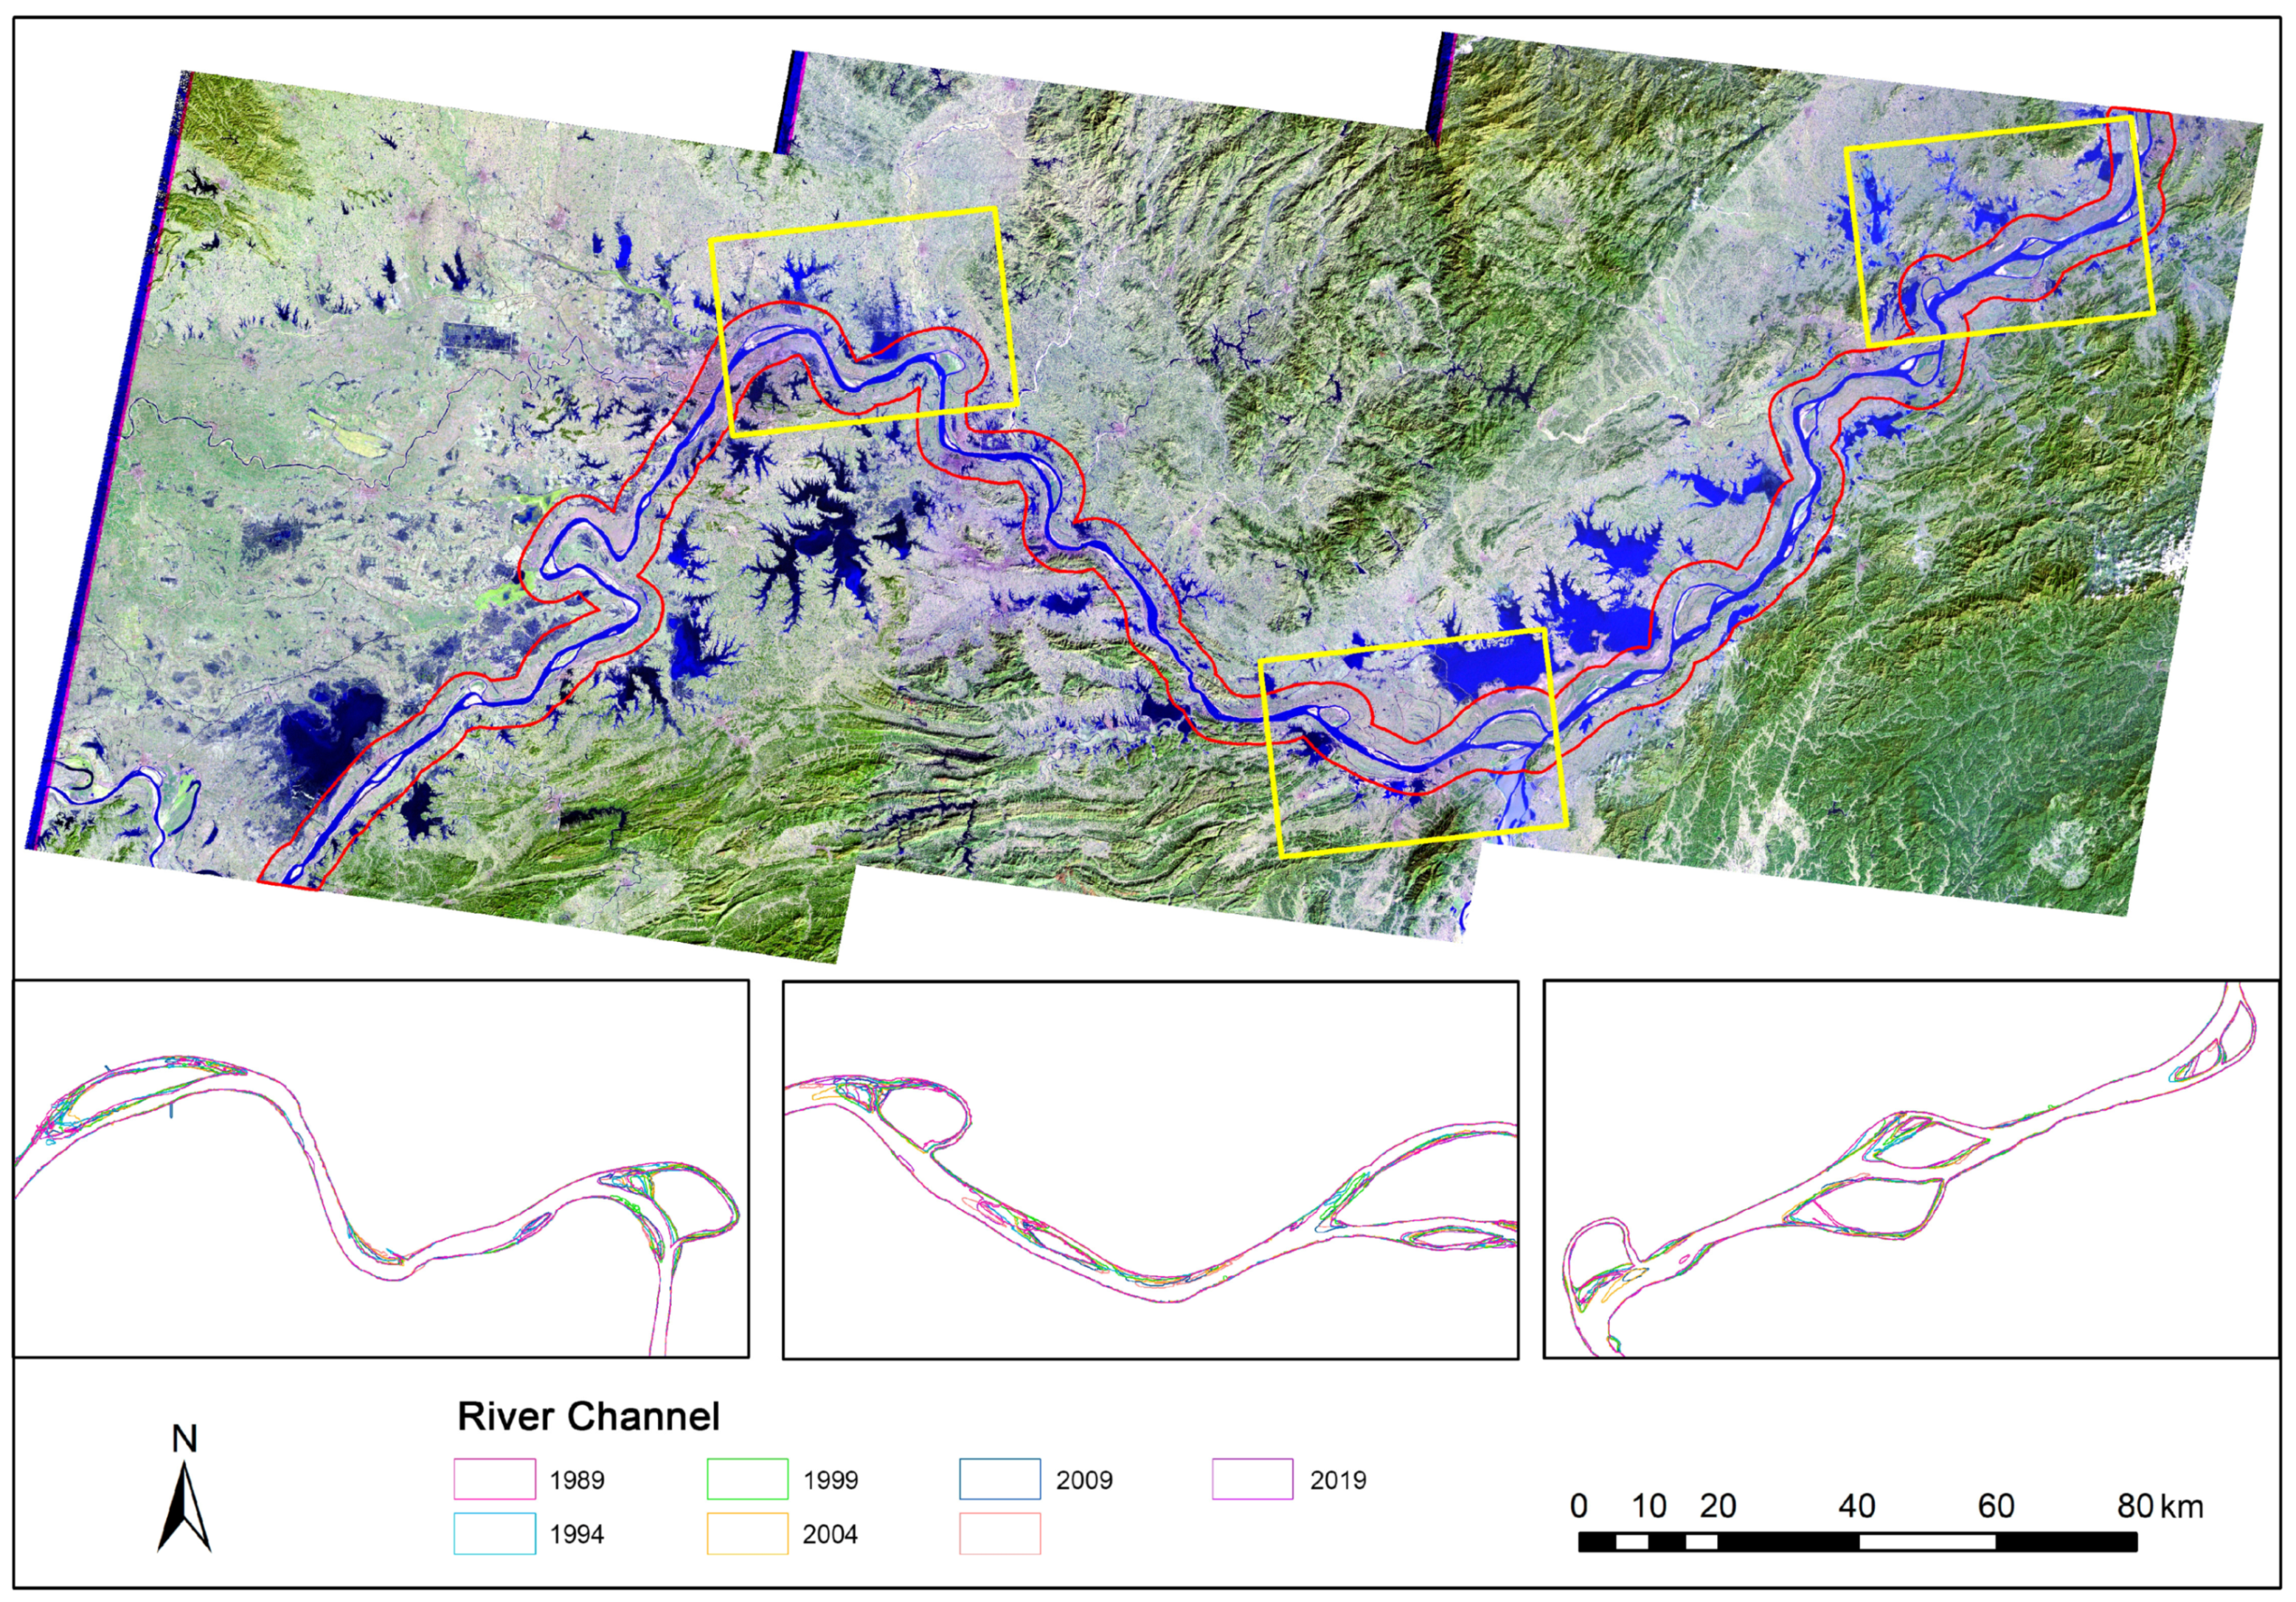
The section of the Chenglingji to Datong River in the middle and lower reaches of the Yangtze River spans the footprint of three Landsat scenes (path/row numbers 123/39, 122/39, and 121/39). In order to analyze the temporal and spatial evolution of the river, we selected seven time-series images (1989, 1994, 1999, 2004, 2009, 2013, 2019).
This paper used the dry season water level data of Hankou, Huangshi, and Jiujiang hydrological stations in the study area. Normally, the dry season is from December to April each year. The daily water levels were very close to each other. The daily water levels for the days of the selected remote sensing images are shown in Table 1. The maximum water level difference during these days was less than 2 m.
This study also collected a series of additional hydrological data. The annual runoff volume, annual sand transport volume, and annual median particle size data came from the Yangtze River Sediment Bulletin; beach flushing volume and flushing intensity data come from the Statistical Yearbook; annual precipitation data from 68 precipitation stations in the middle and lower reaches of the Yangtze River region were derived from the National Meteorological Information Center. All data are from official sources, with high accuracy and authority. The data periods are shown in Table 2.

3. Method

3.1. Modified Normalized Difference Water Index (MNDWI)

This paper used MNDWI to extract water information in the study area [49]. The calculation formula is shown in Formula (1):
WNDWI = Band Green Band MIR Band Green + Band MIR
where   Band Green represents the green band (0.52–0.60 μm),   Band MIR (1.55–1.75 μm) represents the mid-infrared band. By experimenting with the images, 0.2 was selected as the threshold value for segmenting water and land (i.e., pixels with MNDWI greater than 0.2 were identified as water).

3.2. Morphological Feature Parameter Calculation Method

3.2.1. Shoreline Change Rate

The study of river shoreline change processes can be done by setting up fixed digital cross sections on the river and calculating the shoreline oscillation rate. Since there are not enough measured river cross sections in the study area, it is difficult to study the change of the whole river shoreline. Therefore, we used a fixed section to calculate the shoreline change rate and analyze the characteristics of the river evolution process. We recorded the intersection coordinate position of the river shoreline and river cross-section in different periods and estimated the change rate of river shoreline by transforming the spatial location of the intersection in different years. The specific processes are as follows:
Use of the 1989 river shoreline as a benchmark for river centerline extraction.
Set up of fixed digital cross sections on the 1989 river conditions. The set section was roughly perpendicular to the center line of the river; the interval distance was about 5 km, and the number of reaches was 138. In order to facilitate subsequent research, we numbered each section as 111–248.
Use the average change amplitude and change rate of the shoreline. The overall trend of the shoreline was studied from the average change rate and the total average change rate of 138 river cross sections.
The calculation formulas are as follows:
  F i , j = S i , j t i , j
v i , j = F i , j VY i , j
V i , j =   S i , j t i , j VY i , j VT i , j
where F i , j , v i , j , and V i , j are the average change amplitude, average change rate, and average change rate of 138 sections, respectively; S i , j is the sum of the distance of the shoreline moving in or out of the river in two adjacent periods; t i , j is the number of sections of the shoreline moving inward or outward; T i , j is the total number of sections; VY i , j is the year-difference between two adjacent periods. The total average change rate is the sum of the absolute values of the average change rates of 138 sections.

3.2.2. Area Change Rate of Mid-Channel Bar

The mid-channel bar selected in this paper took 1989 as the benchmark to calculate the area change rate of the mid-channel bar in different years. The positive and negative values indicate the increase and decrease in the area, respectively. The area change rate indicates the relative difference between the area using two periods, expressed in %.

3.2.3. Sediment Deposition Amount of Beach Trough

In this paper, the data on sediment deposition were from the statistical yearbook information and are based on the river terrain data and the measured fixed section data from 1975 to 2017 in the Chenglingji to Datong section, calculated by the cross-section method. This method calculates the water area of each section under a certain water level, and then calculates the amount of storage between the two adjacent sections (as shown in Equation (5)). The sediment deposition amount is obtained through the difference of the amount of storage in different periods. Finally, we obtained the beach trough flushing volume of the river in different years by adding up:
V i (   A i ) = VY i (   S i +   S i + 1 +   S i   S i + 1 ) / 3
where, A i is the water level benchmark, Y i is the distance between sections, and S i is the flow area.

3.3. Vegetation Fraction Coverage

The vegetation Fraction Coverage (VFC) is the ratio of the vertical projected area of vegetation to the total area of the region. It has a very wide range of applications [50,51]. The calculation of vegetation cover by normalized vegetation index (NDVI) using the pixel dichotomy is one of the mainstream methods. It has more applications because it does not require actual measurement data for the calculation and the estimation results are more accurate [52]. The following formula is used to calculate the corresponding coverage data based on NDVI from 1989 to 2019. The specific calculation process is as follows:
VFC = NDVI NDVI soil NDVI veg NDVI soil
NDVI soil = VFC max * NDVI min VFC min * NDVI max VFC max VFC MIN
NDVI veg = ( 1 VFC min ) * NDVI max ( 1 VFC max ) * NDVI min VFC max VFC min
where, VFC is the vegetation fraction coverage, NDVI soil represents the NDVI value of the soil area, and NDVI veg represents the NDVI value of the vegetation area. NDVI min and NDVI max are the cumulative frequencies below 5% and above 95% of all NDVI data in the study area, respectively. We first calculated NDVI for the soil area and NDVI for the vegetation area, and then calculated VFC.

3.4. Cluster Analysis

K-means clustering is a classification method based on distance, which classifies those close to each other into one class and those far away into other classes with great similarity between similar classes [53]. In this paper, the K-means clustering method is used to cluster and analyze the annual precipitation data of a total of 68 points × 28 years in the middle and lower reaches of the Yangtze River. The specific operation procedure is as follows.
The 28 years of annual precipitation data are pre-processed using the “Z-score” normalization.
x = x i m d   ( i   =   1 ,   2 , ,   n )
where xi is the rainfall data for the ith station, n is the number of stations in the space, m is the mean of the rainfall data, and d is the standard deviation.
The data objects are assigned to the cluster centroid class with the smallest Euclidean distance, calculated as follows:
d ( x i ,   x j ) = ( x i 1 x j 1 ) 2 + ( x i 2 x j 2 ) 2 + + ( x ip x jp ) 2
where, xi and xj denote data objects with two p-dimensional properties. Where xi = (xi1, xi2, …, xip), xj = (xj1, xj2, …, xjp).
The mean vector of each class in the above initial classification result is used as the new clustering centroid, and the Euclidean distance calculation is reperformed to adjust the previous division results.
Meandist ( N ) = 2 n ( n 1 ) i j ,   i ,   j = 1 n d ( x i , x j )
where, n is the total sample size and d ( x i , x j ) is the Euclidean distance between sample points xi and xj.
E = i = 1 k j M i x j C i 2
where, Mi is the set of the ith cluster, Ci is the center of the ith cluster, and E is the sum of squares of the Euclidean distances of all data from its corresponding cluster center. If the E value converges or the cluster center no longer changes, the whole clustering process is finished, otherwise the iteration is continued.
The elbow method is used to select the k-value by means of a graph of the relationship between the sum of squared errors (SSE) and the number of categories. In this paper, the elbow method is used for the determination of the number of clustering categories. The SSE calculation process is as follows.
SSE = i = 1 k p C i p C i 2
where, p denotes the data sample in group Ci of class i, Ci denotes the average of all data in class i, and k represents the number of classification categories.

3.5. Cumulative Slope Change Ratio

The slope of the runoff hydrograph before and after the time of the turning point is represented by Y Ra and Y Rb , respectively, and the cumulative slope of the precipitation before and after this point in time is represented by Y Pa and Y Pb , respectively.
The contribution rate of human activities to runoff change C H ( % ) is:
C H = 100 C P
where, C P ( % ) is the contribution rate of the precipitation changes to runoff change, which can be expressed as:
C P = | K p / K R | * 100 %
where, K R ( % ) is the change rate of the cumulative runoff slope; K P ( % ) is the change rate of the cumulative precipitation slope. They can be expressed as:
K R = Y Ra Y Rb Y Ra * 100 %
K p = Y Pa Y Pb Y Pa * 100 %
According to the above principles, the contribution rate of climate and human activities to the change of river sediment transport can also be obtained.

3.6. Visual Interpretation

When carrying out visual interpretation, it is necessary to first establish corresponding remote sensing interpretation markers according to the unique characteristics of different features, such as the hue, shape, and size of the feature. As shown in Table 3, central bars are usually relatively isolated on remote sensing images, showing regular or irregular shapes, and surrounded by the river water. There is some vegetation cover on the river cores, which usually shows as green areas on the images, and most of the river cores have a part of sandy beaches, which usually shows as grayish or light yellow on the images.

4. Results

4.1. River Morphology Change Analysis

4.1.1. Analysis of Shoreline Evolution

The spatial and temporal evolution of the left and right bank shoreline oscillations is analysed by calculating the rate of river shoreline oscillation in different periods. Overall, the change rate of the left shoreline was small. The change rate fluctuated around 10 m/year (meter per year) in 1989–2013 and decreased to 7.7 m/year in 2013–2019. However, according to the maximum change in Table 4, the shoreline change was in stages and regional. The right bank shoreline oscillation rates are all low, with the shoreline in equilibrium as the oscillation rate fluctuates around 7 m/year from 1989–2019. The right bank change was consistent with the left bank in time and change trend, but the change of the right bank was smaller and more stable. The evolution of the right bank was also regional. The overall shoreline change was small (Figure 2), but some areas showed dramatic changes at times, such as the Yueyang River reach, where the shoreline advanced out of the river from 1989 to 1994, changed little from 1994 to 2004, advanced in the river from 2004 to 2009, and then advanced out of the river from 2009 to 2013; the change in the Tuanfeng reach was small in 1989–1994, and there were large shoreline changes in 1994–2013.

4.1.2. Lateral Scouring-Deposition Area Variation

We overlaid the polygon area formed by the left bank shoreline and the fixed boundary in the adjacent years in the study area to obtain the area of scouring and accretion on the left and right banks in different periods (Table 5). On the whole, the left bank experienced accretion to scouring, scouring to accretion, and then scouring. The right bank experienced scouring to accretion and then scouring. On both sides of the channel, lateral scouring and accumulation changes occurred alternately. However, in general, the lateral scouring or accretion area on both sides changed little (Figure 3). During the 30 years from 1989 to 2019, the cumulative scouring area on the left bank was 113.30 km2. The cumulative scouring area on the right bank was 88.81 km2. The change of lateral scouring accumulation on the left bank was larger than that on the right bank, but the overall change of horizontal scouring and deposition on the left and right banks was basically in a balanced state.

4.1.3. Change Trend of Mid-Channel Bar

After obtaining the area size information of the mid-channel bar map in ArcGIS, we found that the area of the mid-channel bar frequently changes. Figure 4 shows that the area of the nine mid-channel bars in the middle reaches of the Yangtze River decreased from 1994 to 1999, except for Xinzhou, where the area increased; increased from 2004 to 2009 except for Xinzhou (Longping); decreased from 2009 to 2013, and increased from 2013 to 2019 (except Zhongzhou and Zhangjiazhou). Overall, the area of the 10 river cores in the middle reaches of the Yangtze has changed from decreasing to increasing, to decreasing again. Moreover, in recent years, there has been a trend towards an increase again.

4.1.4. Morphological Evolution Characteristics of Typical River Reach

In this paper, the Xinzhou of Luxikou Rivers section were selected as a typical river core for the analysis. By comparing the positions of the maximum oscillation amplitude of the left and right riverbanks in different periods, the river sections of Jiujiang, Yueyang, and Anqing, which oscillated significantly during the study period, were analyzed.
From Figure 5a, it can be seen that, from 1989 to 1994, the area of Xinzhou increased by 47.2%. The position of Xinzhou moved towards the left bank as the concave bank receded. In 2004, the image shows that Xinzhou was cut into the heart beach and the old Xinzhou, which means that a new round of evolution began. From 2004 to 2009, the area of Xinzhou increased by 40.6%. The concave shore did not show a scouring retreat like the previous evolution, and the Xinzhou position moved slightly to the left shore; the Xinzhou area decreased less from 2009 to 2013 but grew by 20.7% from 2013 to 2019. The Xinzhou head area expanded, and its position moved slightly to the left.
Between 1989 and 2009, the areas of Zhangjiazhou and Xiasanhaozhou in the Jiujiang River increased by 2.32 km2 and 1.66 km2, respectively, compared to 1989 (Figure 5b). There was varying siltation of the two river cores, which were significantly washed between 2009 and 2013 and receded in recent years. The changes around Zhangjiazhou are not significant, while Xiasanhaozhou has become narrower. The siltation at the end and the head of the continent have grown, and the heartland at the end of the continent in 1989 and the head of the continent in 1994 were merged into Xiasanhaozhou, gradually changing the morphology of the continent. The branch channels on both sides of Zhangjiazhou are relatively stable, and the main branch divergence ratio does not change significantly.
The bank slope of the right bank of the Yueyang River channel near Xinzhounao, which is about 5 km long, swung more towards the middle of the river during 1989–2019 (Figure 5c). The shoreline moved out of the river by about 744.45 m between 1989 and 1994, and in the river by 211.981 m between 2004 and 2009. During the period 1989–2019, Nanmenzhou was less scoured and silted, but Xinyuzhou had obvious scouring and silting changes in the boundary river section. Compared to 1989, the area of Nanmenzhou and Xinyuzhou decreased by about 4.97 km2. The left edge of the new siltation island washed and receded between 2009 and 2013, which reduced the area by about 0.87 km2, and the left edge of Xinyuzhou silted up between 2013 and 2019, which increased the area by about 1.64 km2. For many years, the right branch has been the main branch and the left branch has been the branch in the vicinity of Xinyuzhou and Nanmenzhou. According to the data of the measured branching channels, the right branch accounts for a larger proportion, and there is no displacement of the main branching channels.
The generation of submerged continents in the Anqing River section was mainly due to the continuous downward extension of the deep trough at the location of the branching channel diversion area. This caused the water to cut the tip of the left edge of the river core continent, forming a submerged continent. With the collapse of the left edge of the river core, the submerged continent began to develop. The continent gradually increased in size and siltation, and its control of the current also increased, accelerating the collapse of the left edge of the river core. The velocity of the collapse of the river core and the siltation of the submerged continent were basically the same from a planar point of view (Figure 5d). Before the generation and development of the submerged continent, the river channel was mainly divided into left and right branching, but with the expansion of the siltation height of the submerged continent and the collapse of the river core continent, a new branching channel was formed between the submerged continent and the river core continent, namely the new middle branching.

4.2. Change of Scouring-Deposition Amount of Beach Trough

The Chenglingji–Datong section of the middle and lower reaches of the Yangtze River is divided by Hankou and Hukou. We have calculated the scouring-deposition amount of the three sections in different periods. The scouring-deposition amount changes in the Chenglingji–Hankou section and the Hankou–Hukou section between 1975 and 2019 are shown in Table 5. Before the beginning of the impoundment of the Three Gorges Dam, the overall beach trough changes from Chenglingji to Hukou were mainly in a siltation state. The cumulative amount of siltation under the bankfull water level from 1975 to 2002 was about 273 million m3. After the impoundment of the Three Gorges Dam, the beach trough changes from Chenglingji to Hukou were mainly in a scouring state. The cumulative amount of scouring under the bankfull water level from 2002 to 2019 was about 906 million m3.
Table 6 shows the scouring and deposition changes of beach trough under the bankfull water level in the section from Hukou to Datong from 1975 to 2019. Before the beginning of the impoundment of the Three Gorges Dam, the overall beach trough changes in the river section were mainly in a silting state. The cumulative siltation under the bankfull water level from 1975 to 2001 was about 280 million m3. After the impoundment of the Three Gorges Dam, the beach trough changes in the river section were mainly in a scouring state. The cumulative scouring under the bankfull water level from 2001 to 2019 was about 372 million m3. In summary, after the impoundment of the Three Gorges Dam, there were obvious scours in these three river sections, and the amount of scours has increased significantly in recent years.

4.3. Analysis of Factors Influencing River Flow Production and Sand Production

Through the annual variation of cumulative distance of the runoff and sediment load in Hankou station from 2000 to 2016 (Figure 6), which is widely used, we can see that the cumulative distance distribution of the runoff and sediment load showed an upward trend before 2005 and a downward trend after 2005. This is in relation to the completion of the Three Gorges Dam in its entirety and its commissioning in 2006. Since the runoff and sediment load have the same inflection point, we divided the runoff and sediment transport into two periods (Figure 6), namely Ta: 2000–2005, Tb: 2006–2016.
The cumulative curves of precipitation, runoff, and sediment load in the two periods of 2000–2005 and 2006–2016 are shown in Figure 6. In the fitting relationship equation between the cumulative amount and the year, the correlation coefficients (R) are very high, with the values above 0.99, and only one is 0.97. The results show that when there are good linear relationships between the cumulative precipitation, cumulative runoff, cumulative sediment load, and year, that is, the correlation coefficients of the fitting relationship are higher than 0.95, it is effective to calculate the change rate of each parameter by using the slope changing ratio of the cumulative quantity [54]. The contribution rates of precipitation and human activities to the annual runoff and sediment load at Hankou station are shown in Table 7. Compared with the Ta and Tb periods of Hankou station, the contribution rate of precipitation to the change of annual runoff is 101.70%. Without considering the influence of other climatic conditions on the runoff change, the contribution rate of human activities to the change of annual runoff is 1.70%. This result shows that the change of the annual runoff in Hankou station is mainly affected by the precipitation change, human activities have some effect on the change of the annual runoff in Hankou station. The impact of the Three Gorges Dam on the runoff in the downstream region decreases with increasing distance from the Three Gorges Project [55]. Compared with the Tb and Ta periods, the contribution rate of human activities to the annual sediment load reached 86.99%, and the contribution rate of precipitation was only 13.01%. Therefore, the sharp decrease in annual sediment load in Hankou station was mainly affected by human activities.

4.4. Analysis of the Driving Forces of River Evolution

4.4.1. Three Gorges Dam

According to the data on the sand transport from the China Rivers Sediment Bulletin (2000–2019) (Ministry of Water Resources of the People’s Republic of China, 2000), the analysis found that the average annual sand transport at Hankou Station was 404 million tons during 1954–2000 before the impoundment of the Three Gorges Reservoir, while the average annual sand transport decreased by 82.9% during 2003–2019 after the impoundment. The average annual sand transport at the Datong Station was 433 million tons during 1950–2000, while the average annual sand transport decreased by 69.0% during 2003–2019 after water storage. After the Three Gorges Dam impoundment, the annual median grain size of sediment at Yichang station changed from 0.009 mm to 0.0065–0.003 mm, which shows that the grain size of sediment out of the reservoir is fine. The annual median grain size of suspended sand at Hankou and Datong stations during 2000–2019 is significantly larger than that at Yichang station (Figure 7), while the grain size of suspended mass sediment discharged from Three Gorges Dam is significantly finer, so that the sediment content can be found to recover along the course.

4.4.2. River Sand Mining

Sand mining in the river will cause the sand mining area to undercut the riverbed and create a height difference with the surrounding area, forming a sand mining pit, which will increase the overwater area and make it easier for the sand from upstream to silt up there, thus causing a reduction in the sediment content of the downstream river. Sand mining activities on the Yangtze River began in 1970, and by 1980 sand mining was prevalent and large-scale mining had begun. By 1990, the demand for river sand in the market further expanded, leading to serious indiscriminate dredging and mining on the river. By 2004, the ban on sand mining was lifted in an orderly manner, and the total amount of sand mining control in the river between 2004 and 2009 showed an upward trend, as shown in Figure 8. For the period of 2004–2012, the average annual sand mining volume of the middle and lower reaches of the Yangtze River reached 35.5 million tons at the Datong station. In 2009, the proportion of the actual sand mining to the sand transported from the Datong station was 63.82%, which was the highest value in the period, and the actual sand mining amounted to 70.2 million tons, while the sand transported was only 11.0 million tons.

4.4.3. Boundary Conditions

The section from the Chenglingji to Datong River has greatly strengthened the stability and impact resistance of the riverbanks, due to the existence of natural nodes on both sides of the riverbanks and the implementation of bank protection projects, which limit the scope and magnitude of lateral deformation of the river. Overall, the distance and rate of shoreline movements on both sides are small, and the stability of the right bank is higher than that of the left bank. The rate of shoreline movement on the left bank fluctuates around 9 m/year during 1989–2019, and the rate of shoreline movement on the right bank fluctuates around 7 m/year. While the overall river potential tends to be stable, some sections of the river have dramatic changes in shoreline movement. The natural nodes and bank protection works make the lateral erosion/accretion of riverbanks weak, with the maximum erosion rate of 7.41 km2/year (1994–1999) and the maximum accretion rate of 6.95 km2/year (1999–2004) on the left bank. The maximum erosion rate and maximum accretion rate of right bank are 5.30 km2/year (2009–2013) and 3.60 km2/year (2004–2009). In general, the lateral erosion and siltation of the riverbank in the section from Chenglingji to Datong are less variable, and the lateral erosion/accumulation area is not very variable, and it is in a stable state, but some of the local erosion and siltation changes are more drastic.

4.4.4. Vegetation Fraction Coverage on Both Sides of the River

The vegetation surface structure changes the channel flow resistance, bed shear stress, flow velocity distribution, and flow turbulence characteristics. Vegetation roots increase the strength and stability of the bank soils [56]. Since there is no consensus in the current academic community on the class distinction of the vegetation cover, this paper refers to the relevant literature in the process of classification and also considers the domestic soil class classification norms [57,58,59]. After combining the two, the vegetation cover within 5 km of the river channel from Chenglingji to Datong in the middle and lower reaches of the Yangtze River was classified according to the criteria, and the images of vegetation cover in 1989, 2009, and 2019 were drawn (Figure 9). In general, the vegetation cover between 2009 and 2019 changed significantly compared to 1989, and the vegetation cover improved; the vegetation condition between 2009 and 2019 did not change much, and the high vegetation cover in the bend from Chenglingji to Yuzhou increased significantly compared to 1989, especially near the Yuzhou bend; compared to 1989, the high vegetation cover and medium-high vegetation cover of the Hankou–Jiujiang River section have increased significantly. The proportion of the area covered by medium-high cover and high cover vegetation within 5 km on both sides of the river increased, and the vegetation cover improved compared with the previous situation.

4.4.5. Heavy Rainfall and Flooding

In this paper, a total of 68 points × 28 years of annual average precipitation data in the middle and lower reaches of the Yangtze River are used to try to cluster them into 1, 2, …, 10 categories. The number of clustering categories is determined by elbow method (Figure 10b), and the maximum curvature of the relationship between SSE and the number of categories is the true number of clusters, i.e., this paper chooses to classify the annual average precipitation data in the middle and lower reaches of Yangtze River into three categories, which are 1–3 in order from high to low according to the precipitation amount.
There is a certain pattern of annual precipitation in the middle and lower reaches of the Yangtze River in space, which is manifested in the distribution of the annual precipitation showing a gradual decrease from south to north (Figure 10a). The high value of the annual precipitation is mostly located in the area around southeastern Jiangxi, and the average precipitation of category 1 after classification can reach 1631 mm. It indicates that the region is most prone to extreme precipitation and is a sensitive area susceptible to flooding in the middle and lower reaches of the Yangtze River, and the Jiujiang River section in the study area is located within this region. The low values of the annual precipitation are mostly located in the areas around northwestern Hubei, northern Anhui, and northern Jiangsu, with an average precipitation of 908 mm in the three categories after classification. The other areas are mostly areas of median annual precipitation, with an average precipitation of 1215 mm in category 2 after classification, and most of the river sections in the study area are located within this area, which is a sub-sensitive area susceptible to flooding. The trends of the average precipitation for each cluster category from 1989 to 2016 are shown in Figure 10c. The interannual trends of the annual precipitation for categories 1 and 3 are basically consistent, especially after 1996, and the cyclical oscillations of precipitation for the two categories are basically synchronized. The high value points of the annual precipitation for categories 1 and 2 occurred in 1998, 1999, 2002, 2005, 2010, 2012, and 2015. By comparing the locations of the maximum swing amplitude of the left and right riverbanks in different periods, it is found that the maximum swing amplitude in all four time periods is within the Jiujiang River section, which is consistent with the location of flood-prone sensitive areas of the precipitation clustering analysis. It indicates that the shoreline adjustment occurs after experiencing heavy rainfall floods.

5. Discussion

5.1. Morphological Evolution Characteristics of River Reach

Currently, there is a wide range of applications for the study of the river planform through remote sensing imagery from several time periods. The planform changes of the riverbanks can be analyzed by estimating the oscillation rates of the left and right banks. The calculation of this parameter allows both quantitative analysis of the overall trend of riverbank changes and the identification of local areas of dramatic change, while avoiding the inconvenience caused by the small number of measured river cross-sections [60,61]. The analysis of 
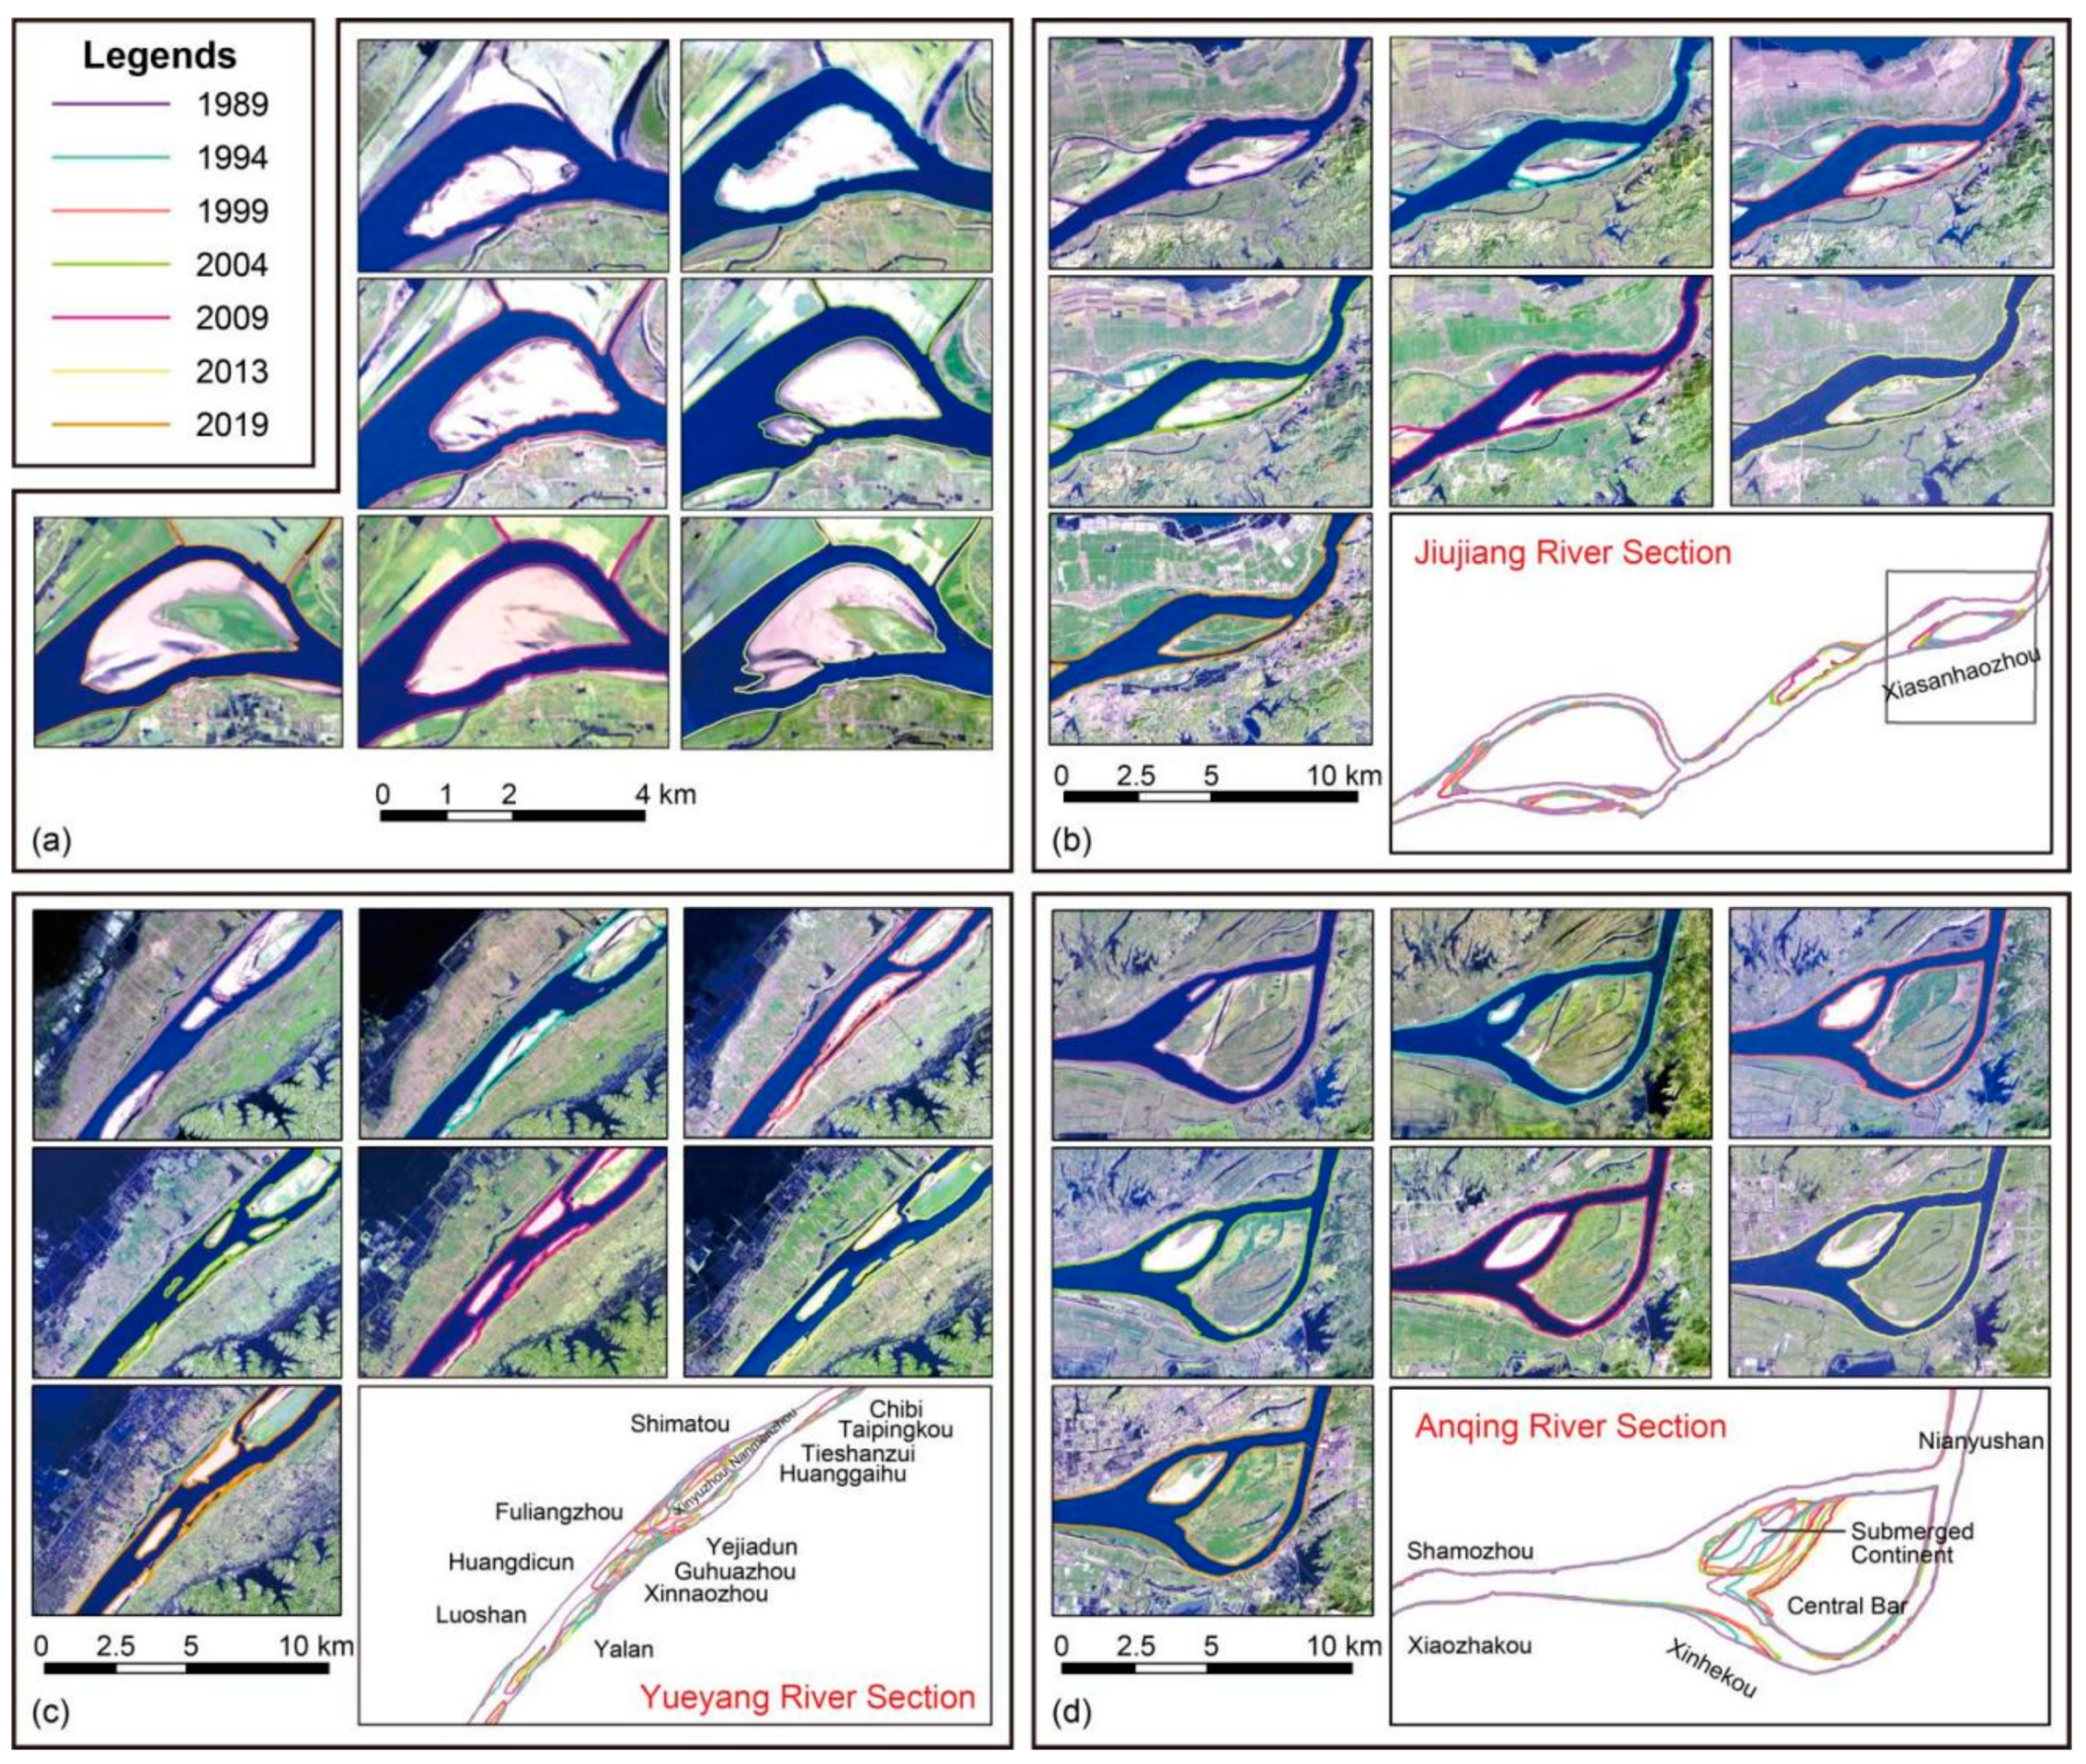
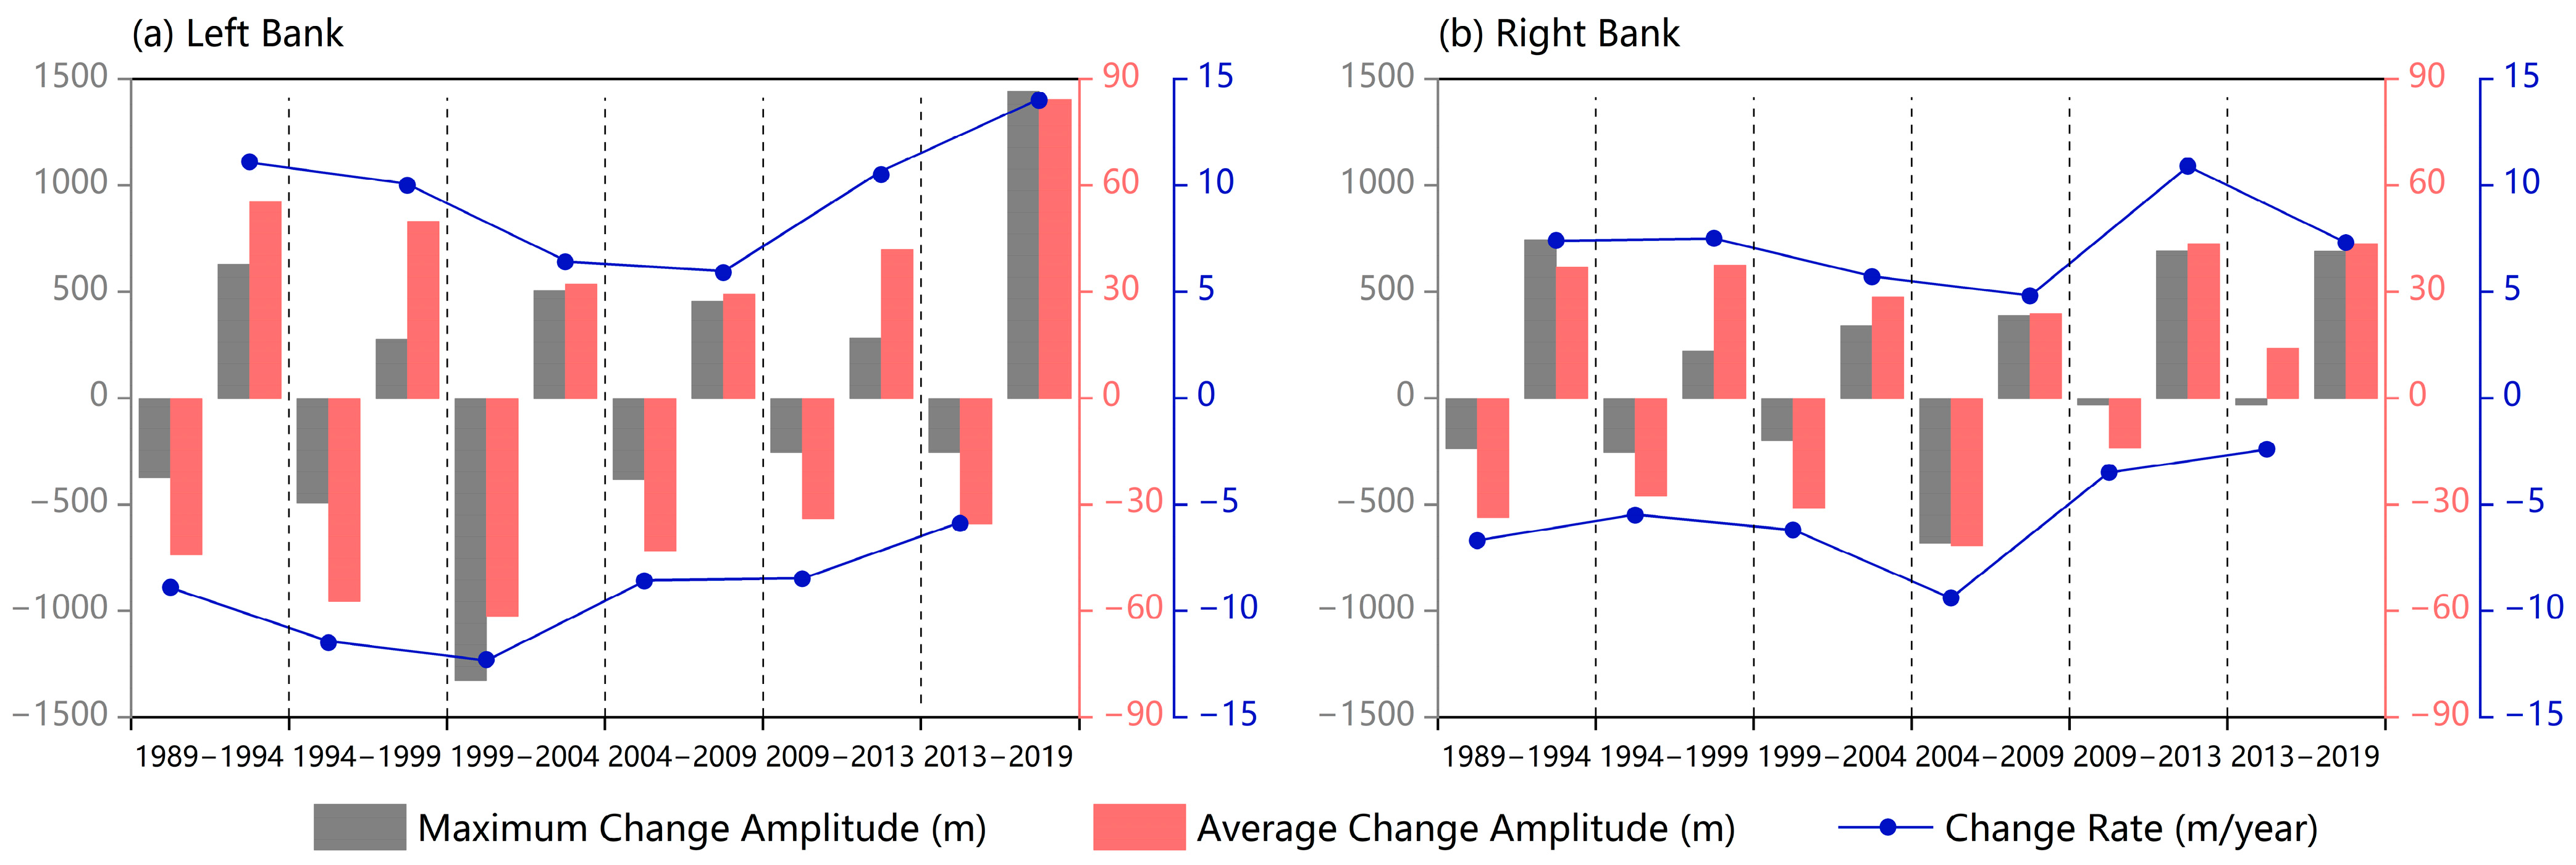
Figure 11 and the left and right shoreline changes show that there are phases and regions of shoreline oscillation. For example, the shoreline of the Luxikou River section shifts sharply between 1989 and 1999, but changes return to equilibrium with less oscillation in the later stages. The Jiujiang River section has less shoreline changes from 1989 to 1994, but more dramatic changes with larger oscillations from 1994 to 2019. These reflect the regional nature of shoreline oscillations.
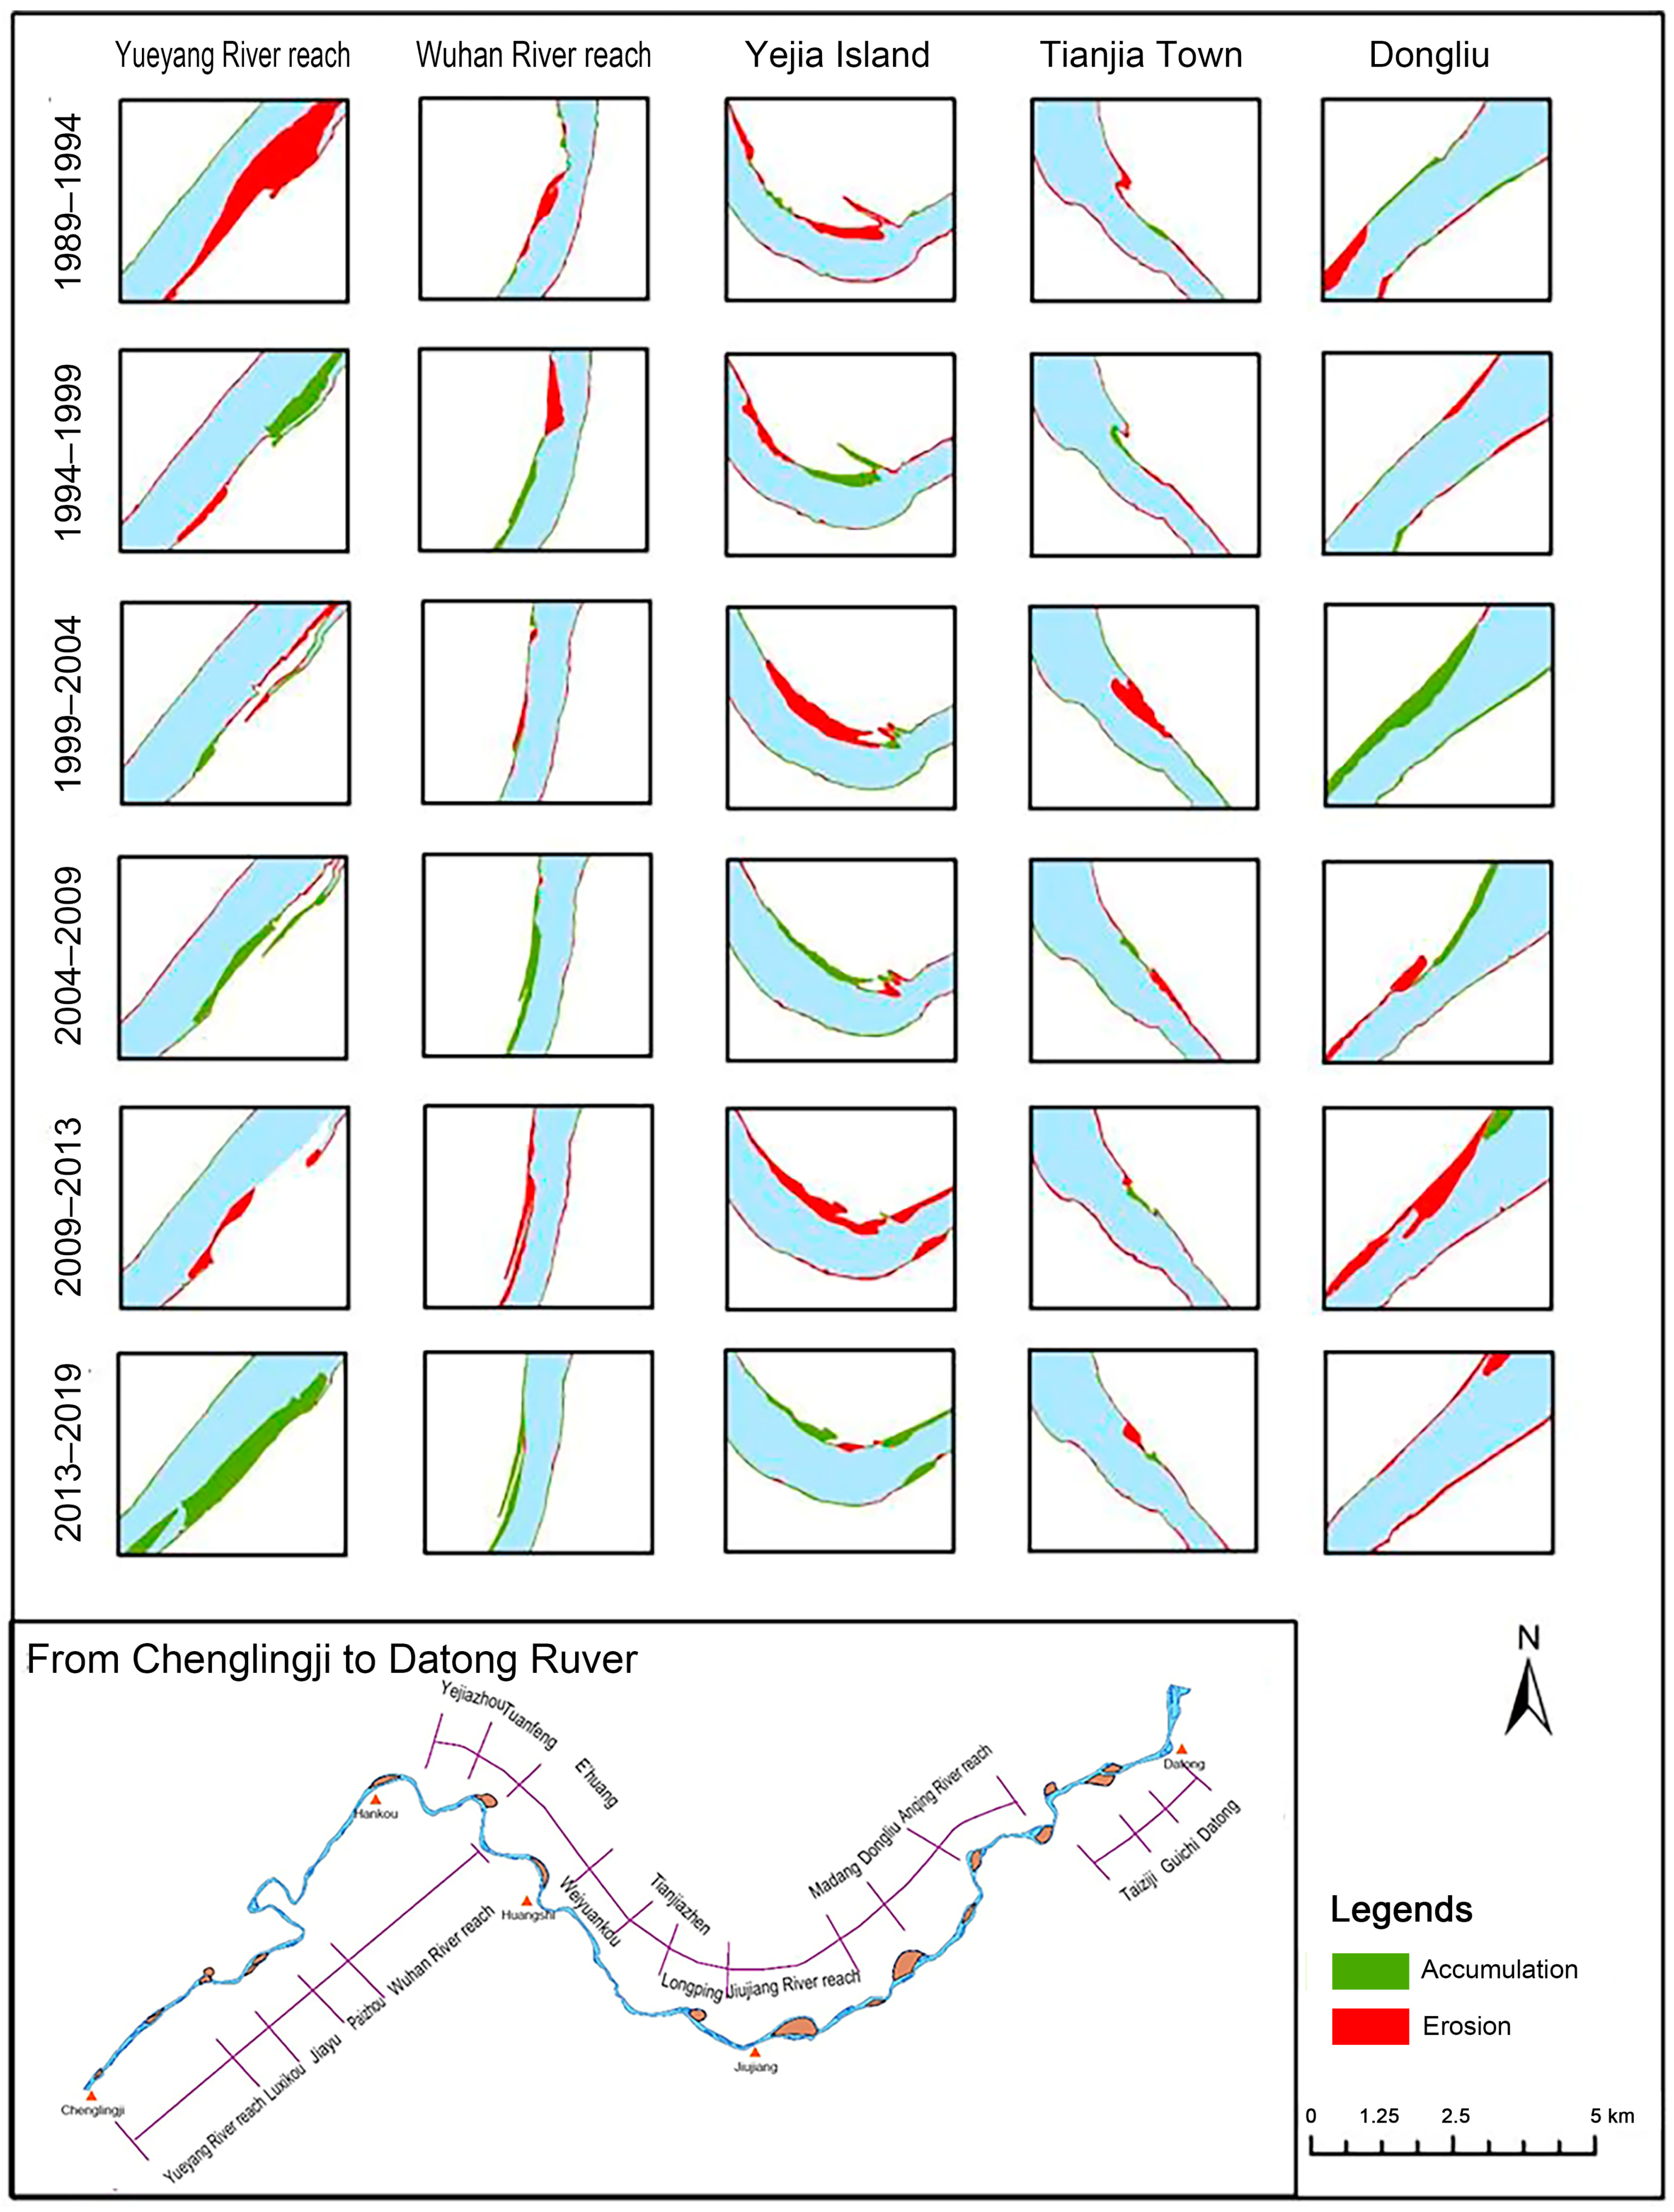
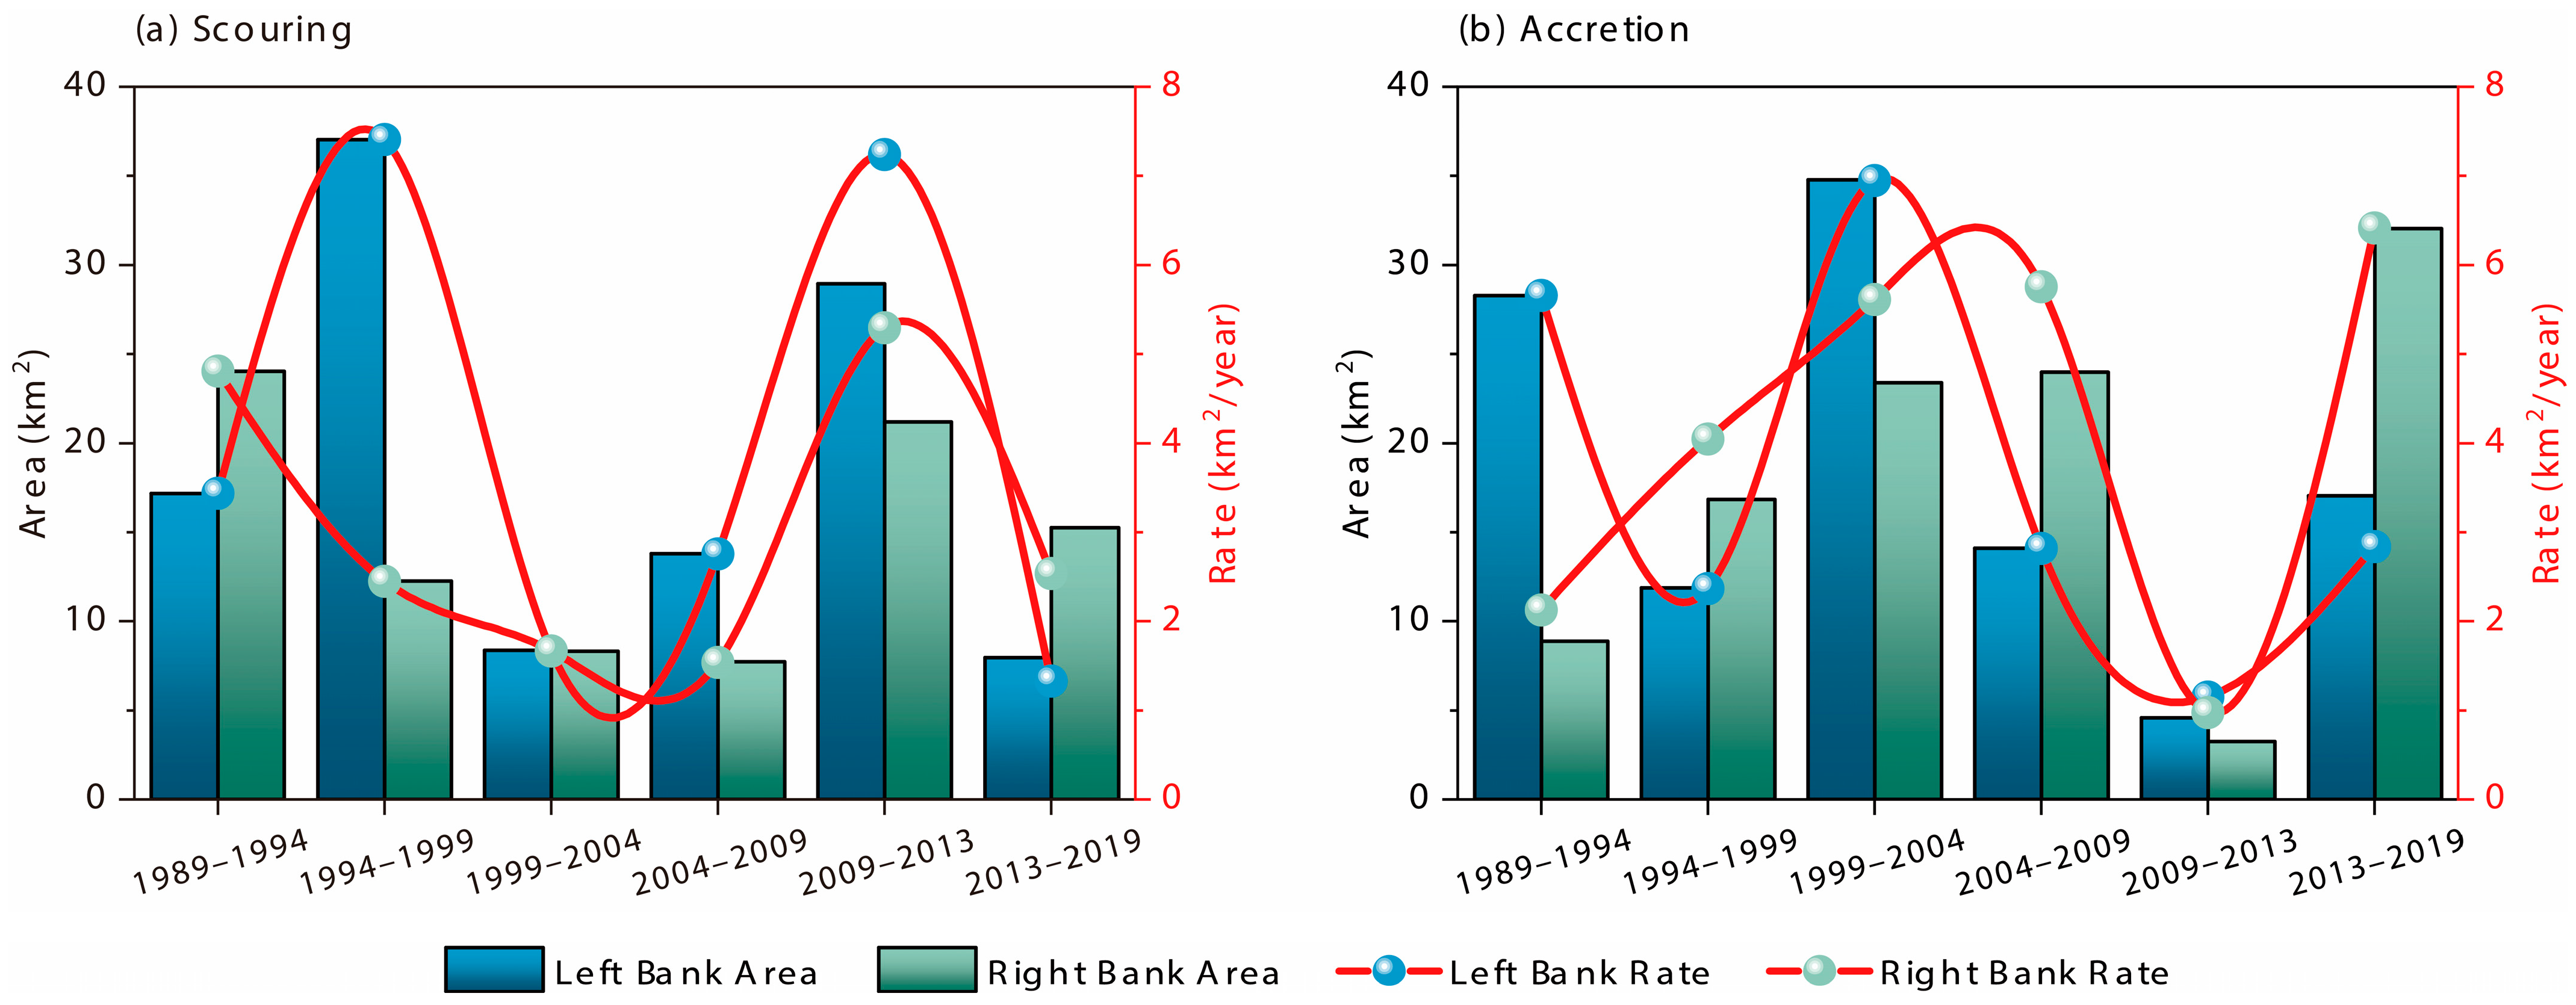
By quantifying the lateral erosion/accretion area of the river and analyzing its spatial and temporal evolution, the evolutionary characteristics of the river can be revealed [62]. Combining the results of lateral alluvial area changes with Figure 12, the maximum lateral erosion on the left bank occurred from 1994 to 1999 and the maximum lateral accretion occurred from 1999 to 2004, with little change in erosion accretion rates between the periods. On the right bank, the maximum erosion occurred in 1989–1994, the maximum accretion occurred in 2013–2019, and the area and rate of lateral erosion and accretion were smaller than those on the left bank.
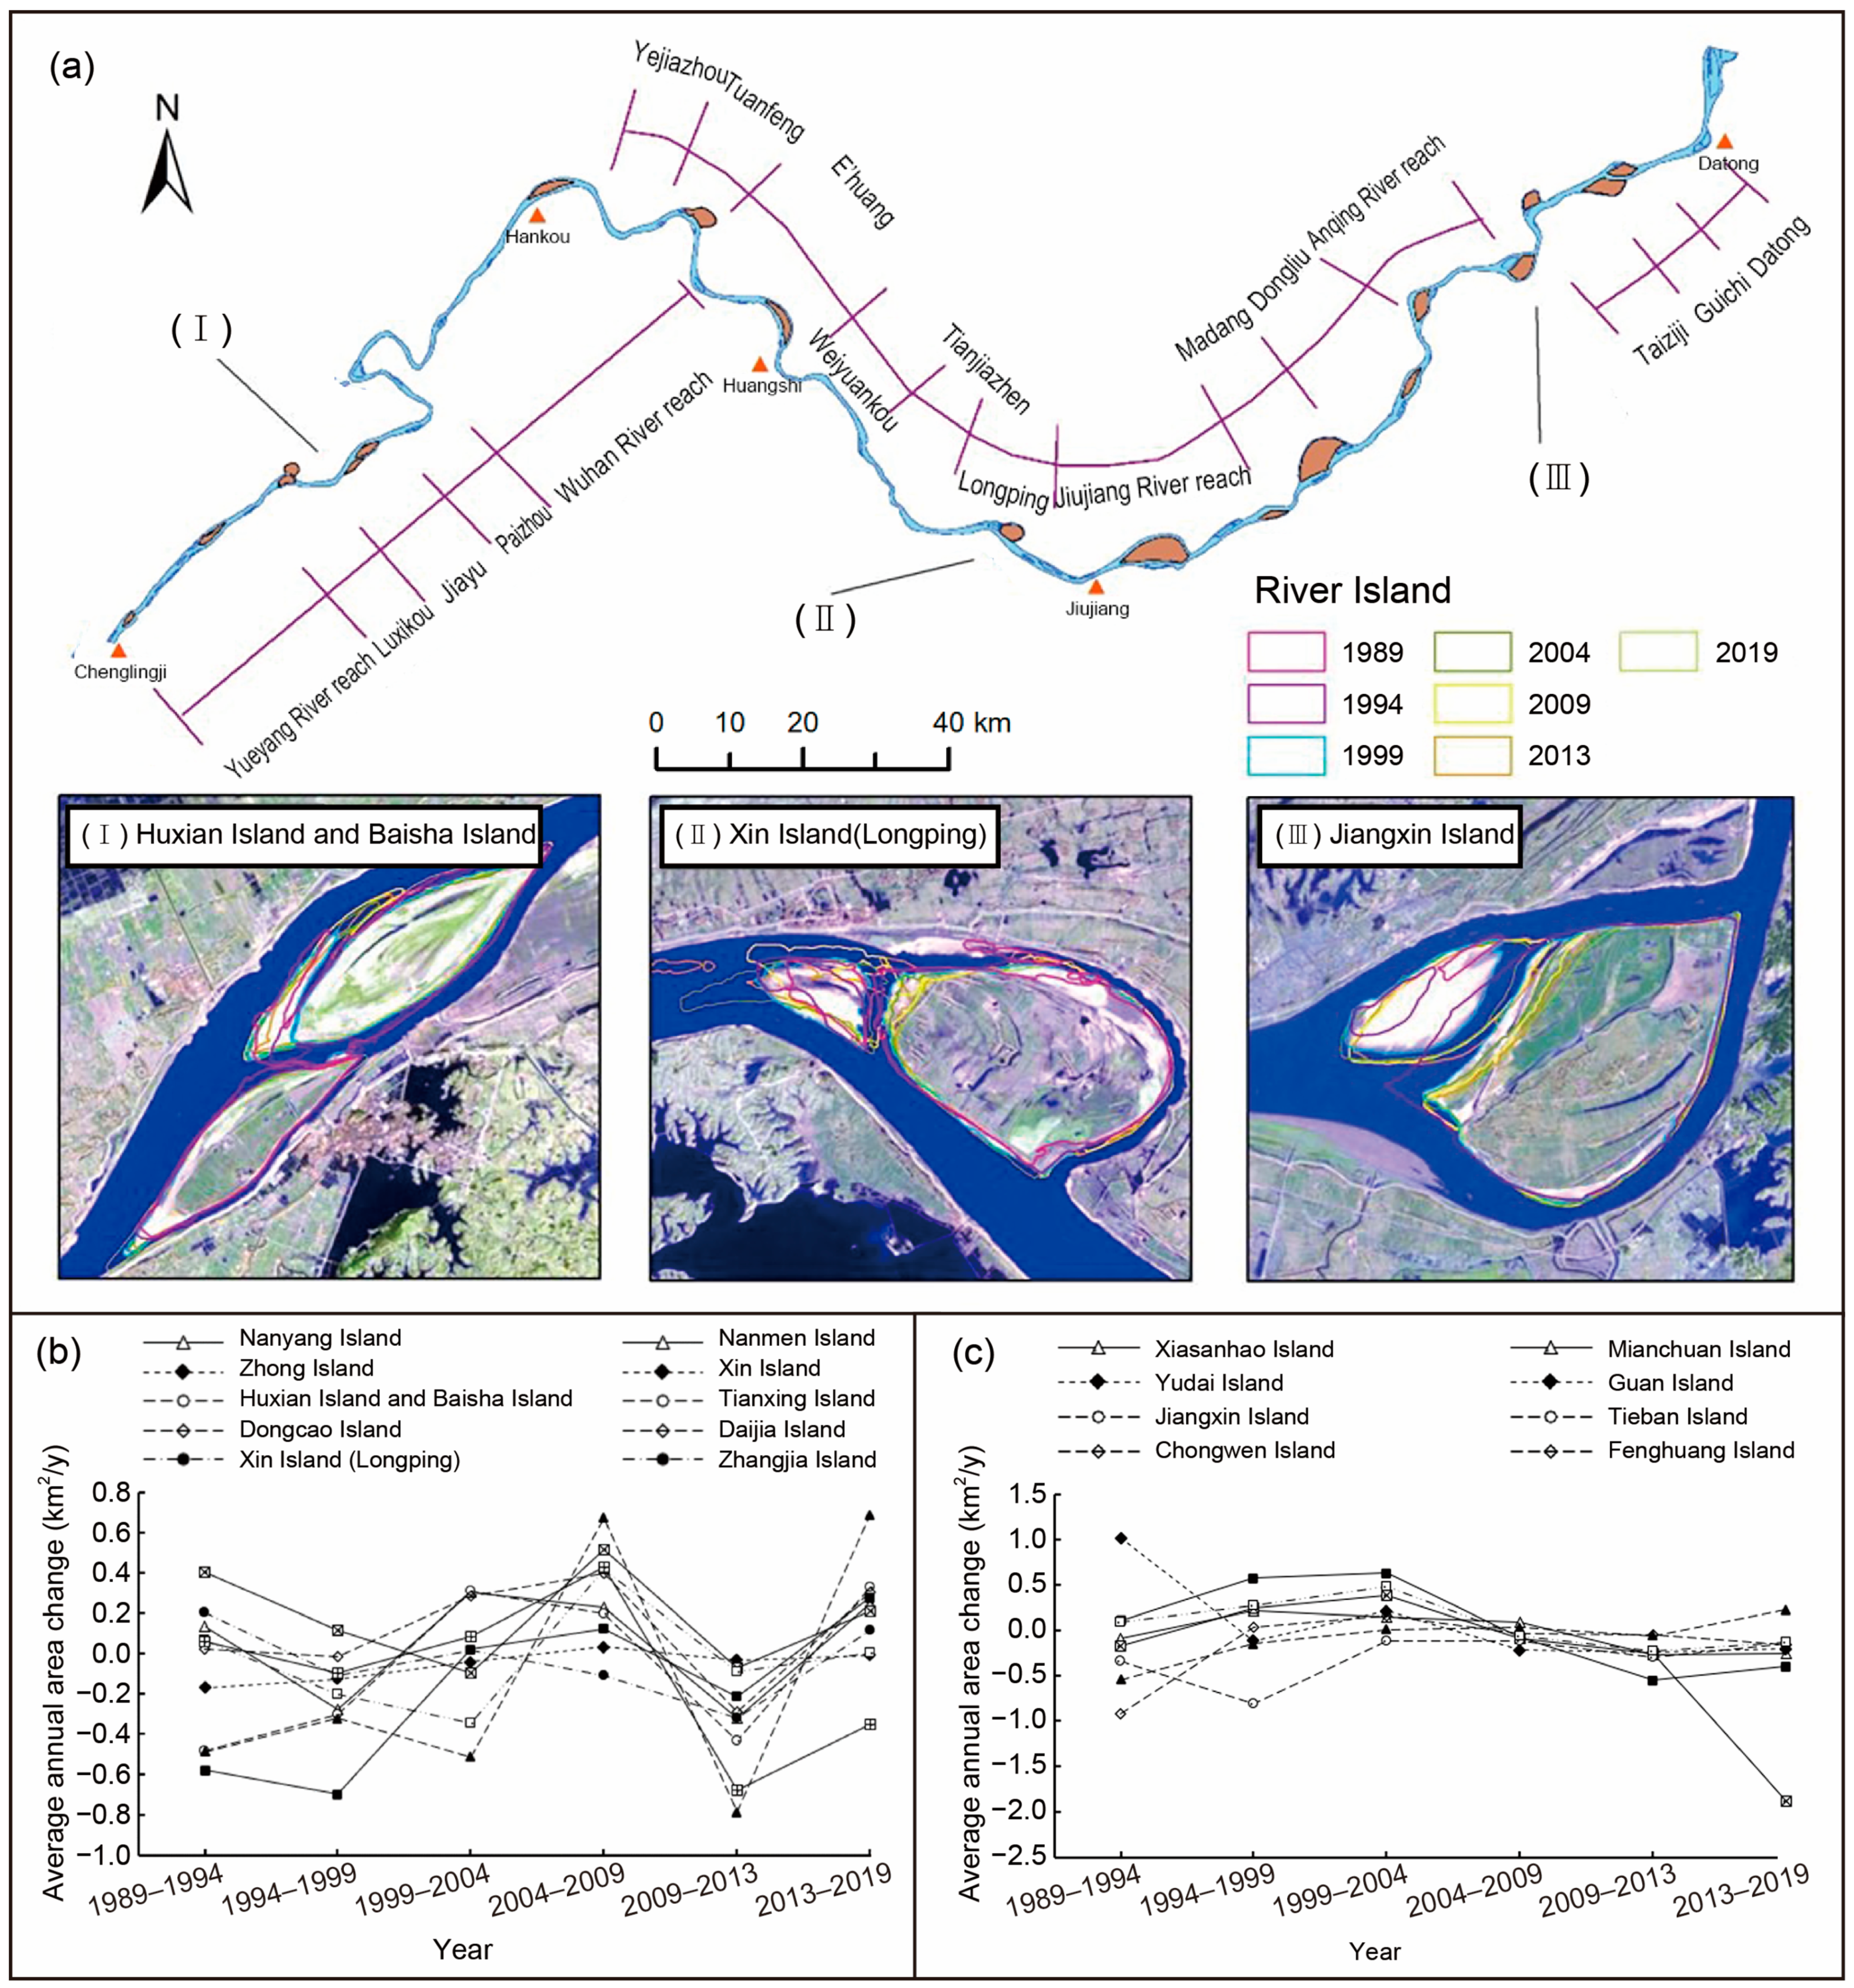
We analyzed the evolution of the middle and lower reaches of the Yangtze River from Chenglingji to Datong. The results show that the overall change of river shoreline is not significant, but the local area changes dramatically; the lateral scouring and siltation area of the river is basically the same; the area of the river core continents has been reduced in recent years and is in a shrinking state; the amount of siltation in the riverbank has changed from siltation to scouring. The river channel from Chenglingji to Datong is mainly of the goose head branching type, with the river channel separated by a river core continent to form a branching section, which is often unstable and evolves periodically, and during the alternating evolution of the branching channel, the continental beaches in the river channel will also change in position, merge, and grow with the changes.

5.2. Effects of Human Activities on River Channel Change

Based on the above evolution characteristics, we discuss the driving force of the river channel evolution from natural and human factors. The results show that the geological conditions on both sides of the river, the implementation of the revetment project, and the improvement of the vegetation cover all enhanced the scour resistance of the riverbank [63], while rainstorm floods, the operation of the Three Gorges Dam, and sand mining activities caused scouring of the river channel. The construction of water conservancy projects can lead to discontinuous changes in river morphology, destroying the stability of the ecosystem. They can also change the relationship between water and sand in downstream rivers. For example, after the completion of the key project hub to restore navigation in the Shaying River, a large amount of siltation occurred in the approach channel, which seriously affected the restoration of navigation in the Shaying River and restricted the economic development [64]. Because the Three Gorges Dam intercepted a large amount of sediments in recent years, the sediment load from Chenglingji to Datong in the middle and lower reaches of the Yangtze River has decreased sharply. There was an increasing trend of sand mining in the river that caused the release of clear water and led to an unsaturated state of the sediment-carrying capacity [65]. In order to achieve a balanced state, the riverbank, the bar, and the riverbed were scoured to recharge the sediment [66].
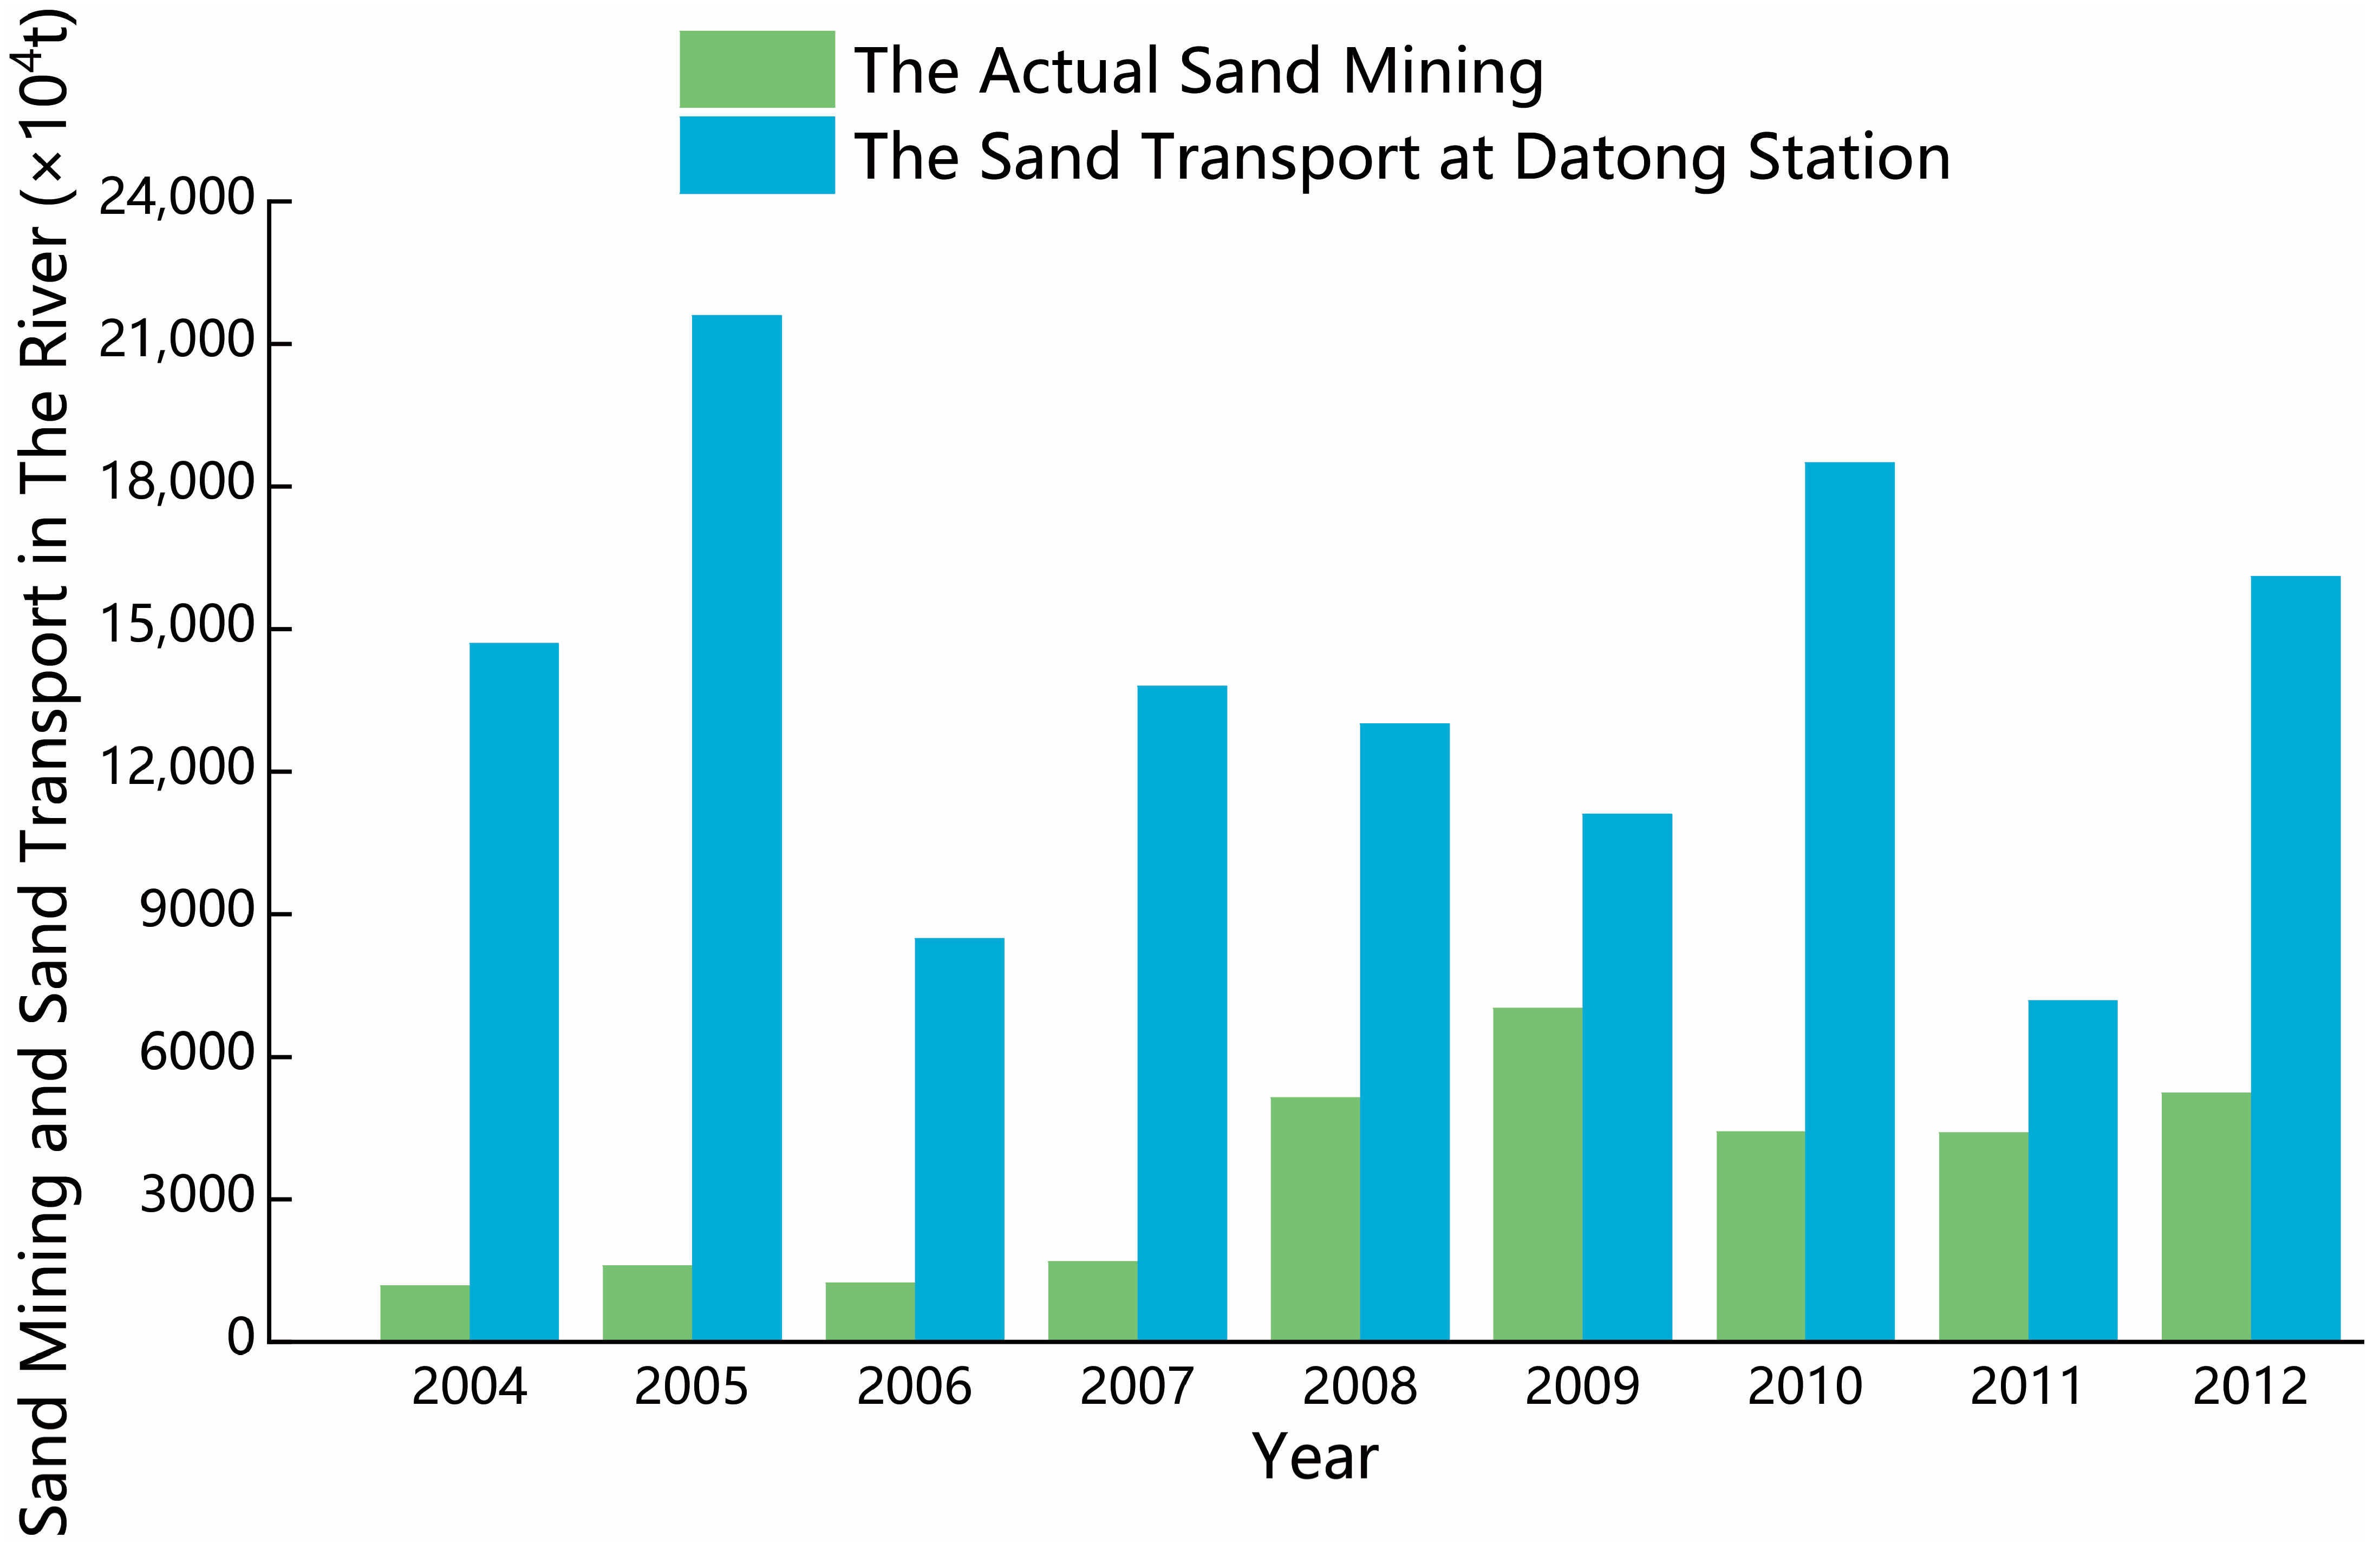
Sand mining in the river will cause the riverbed in the sand mining area to be undercut and create a height difference with the surrounding area, forming a sand mining pit. It will make the overwater area increase, and the sand from the upstream will tend to silt in this area, thus causing the sediment content of the downstream river to decrease. Looking at the process of sand mining activities in the middle and lower reaches of the Yangtze River, it can be divided into three main stages. From the beginning of indiscriminate mining, to the ban, and then to the orderly lifting of the ban, each process will cause changes in the amount of sand transport in the river [67].
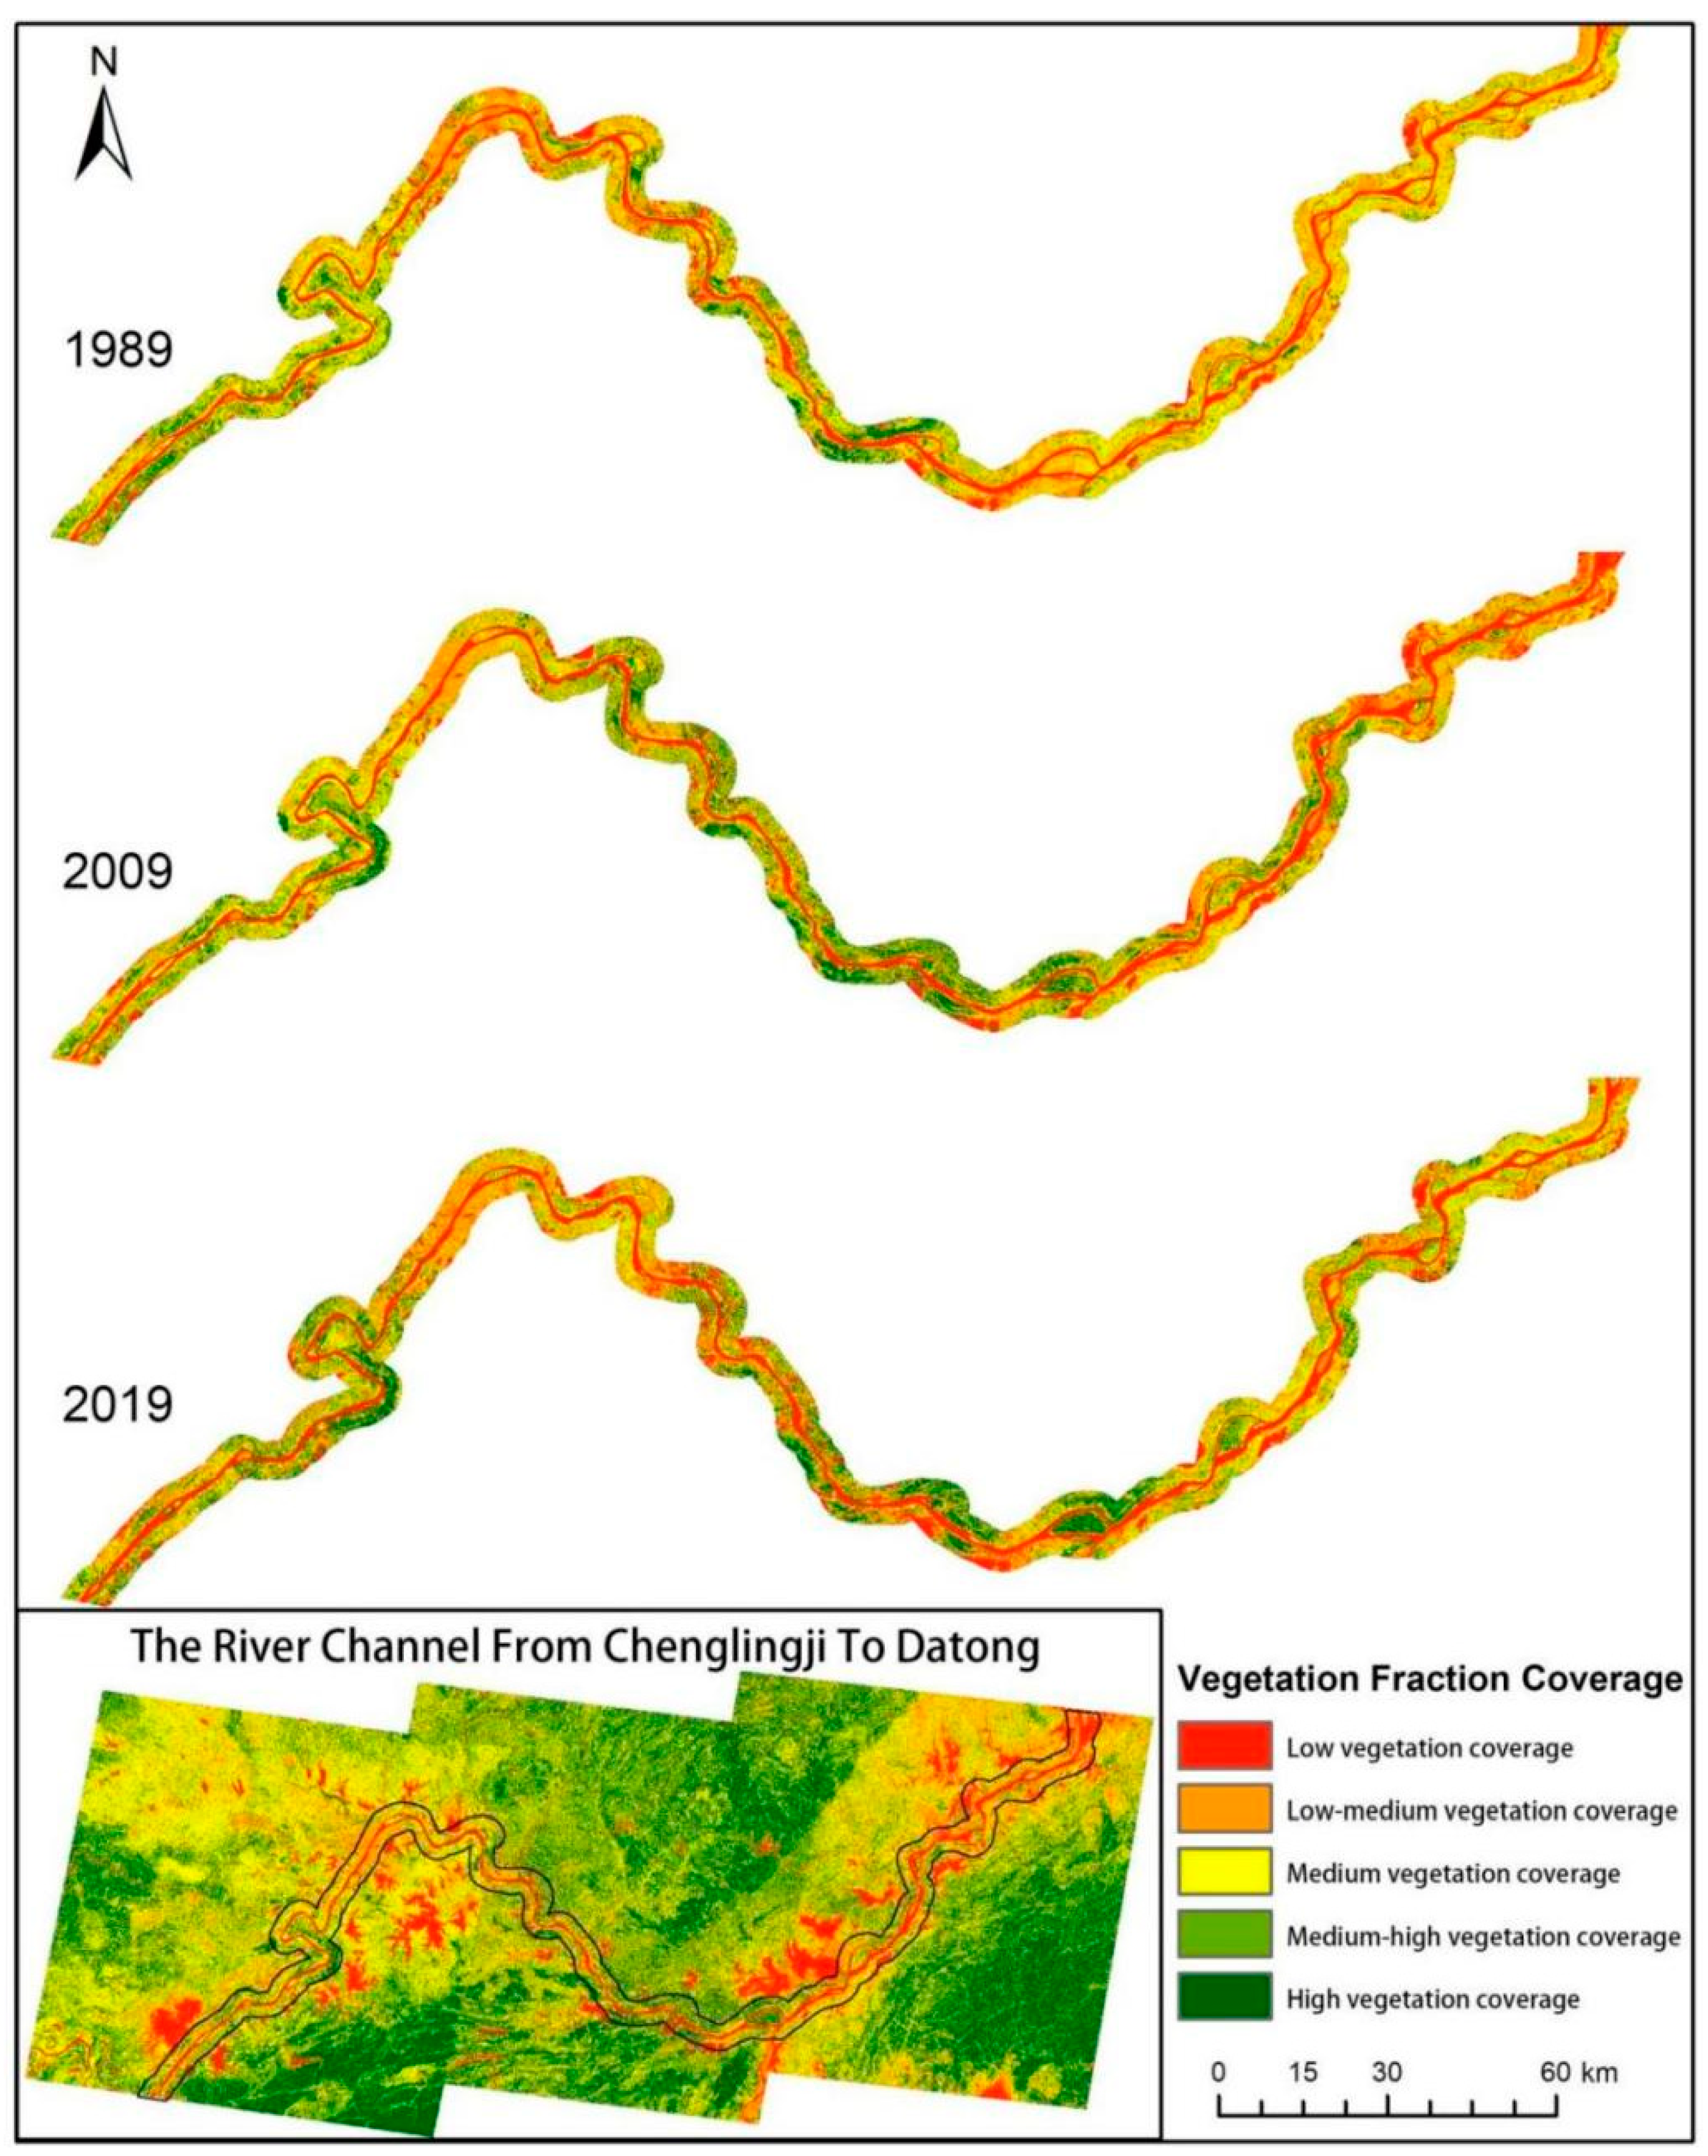
In the process of river scouring, the riverbank is generally maintained in a stable state, mainly because there are many natural nodes on the riverbank from the Chenglingji to Datong River section, and the stability of the riverbank is strong. Secondly, a series of revetment projects have been implemented to maintain the stability of the river. The roots of riparian vegetation have the effect of stabilizing the riverbank silt, while the presence of vegetation reduces the velocity of the water flow, making it easier for river sediment to silt up there. Compared to 1989, the vegetation cover on both sides of the river has improved. It was found that the riparian vegetation not only stabilized the riverbanks, but also inhibited the bank erosion, thus slowing down the lateral evolution of the river channel. The improvement of the vegetation cover in the section from Chenglingji to Datong has led to an increase in streambank impact resistance and streambank stability.
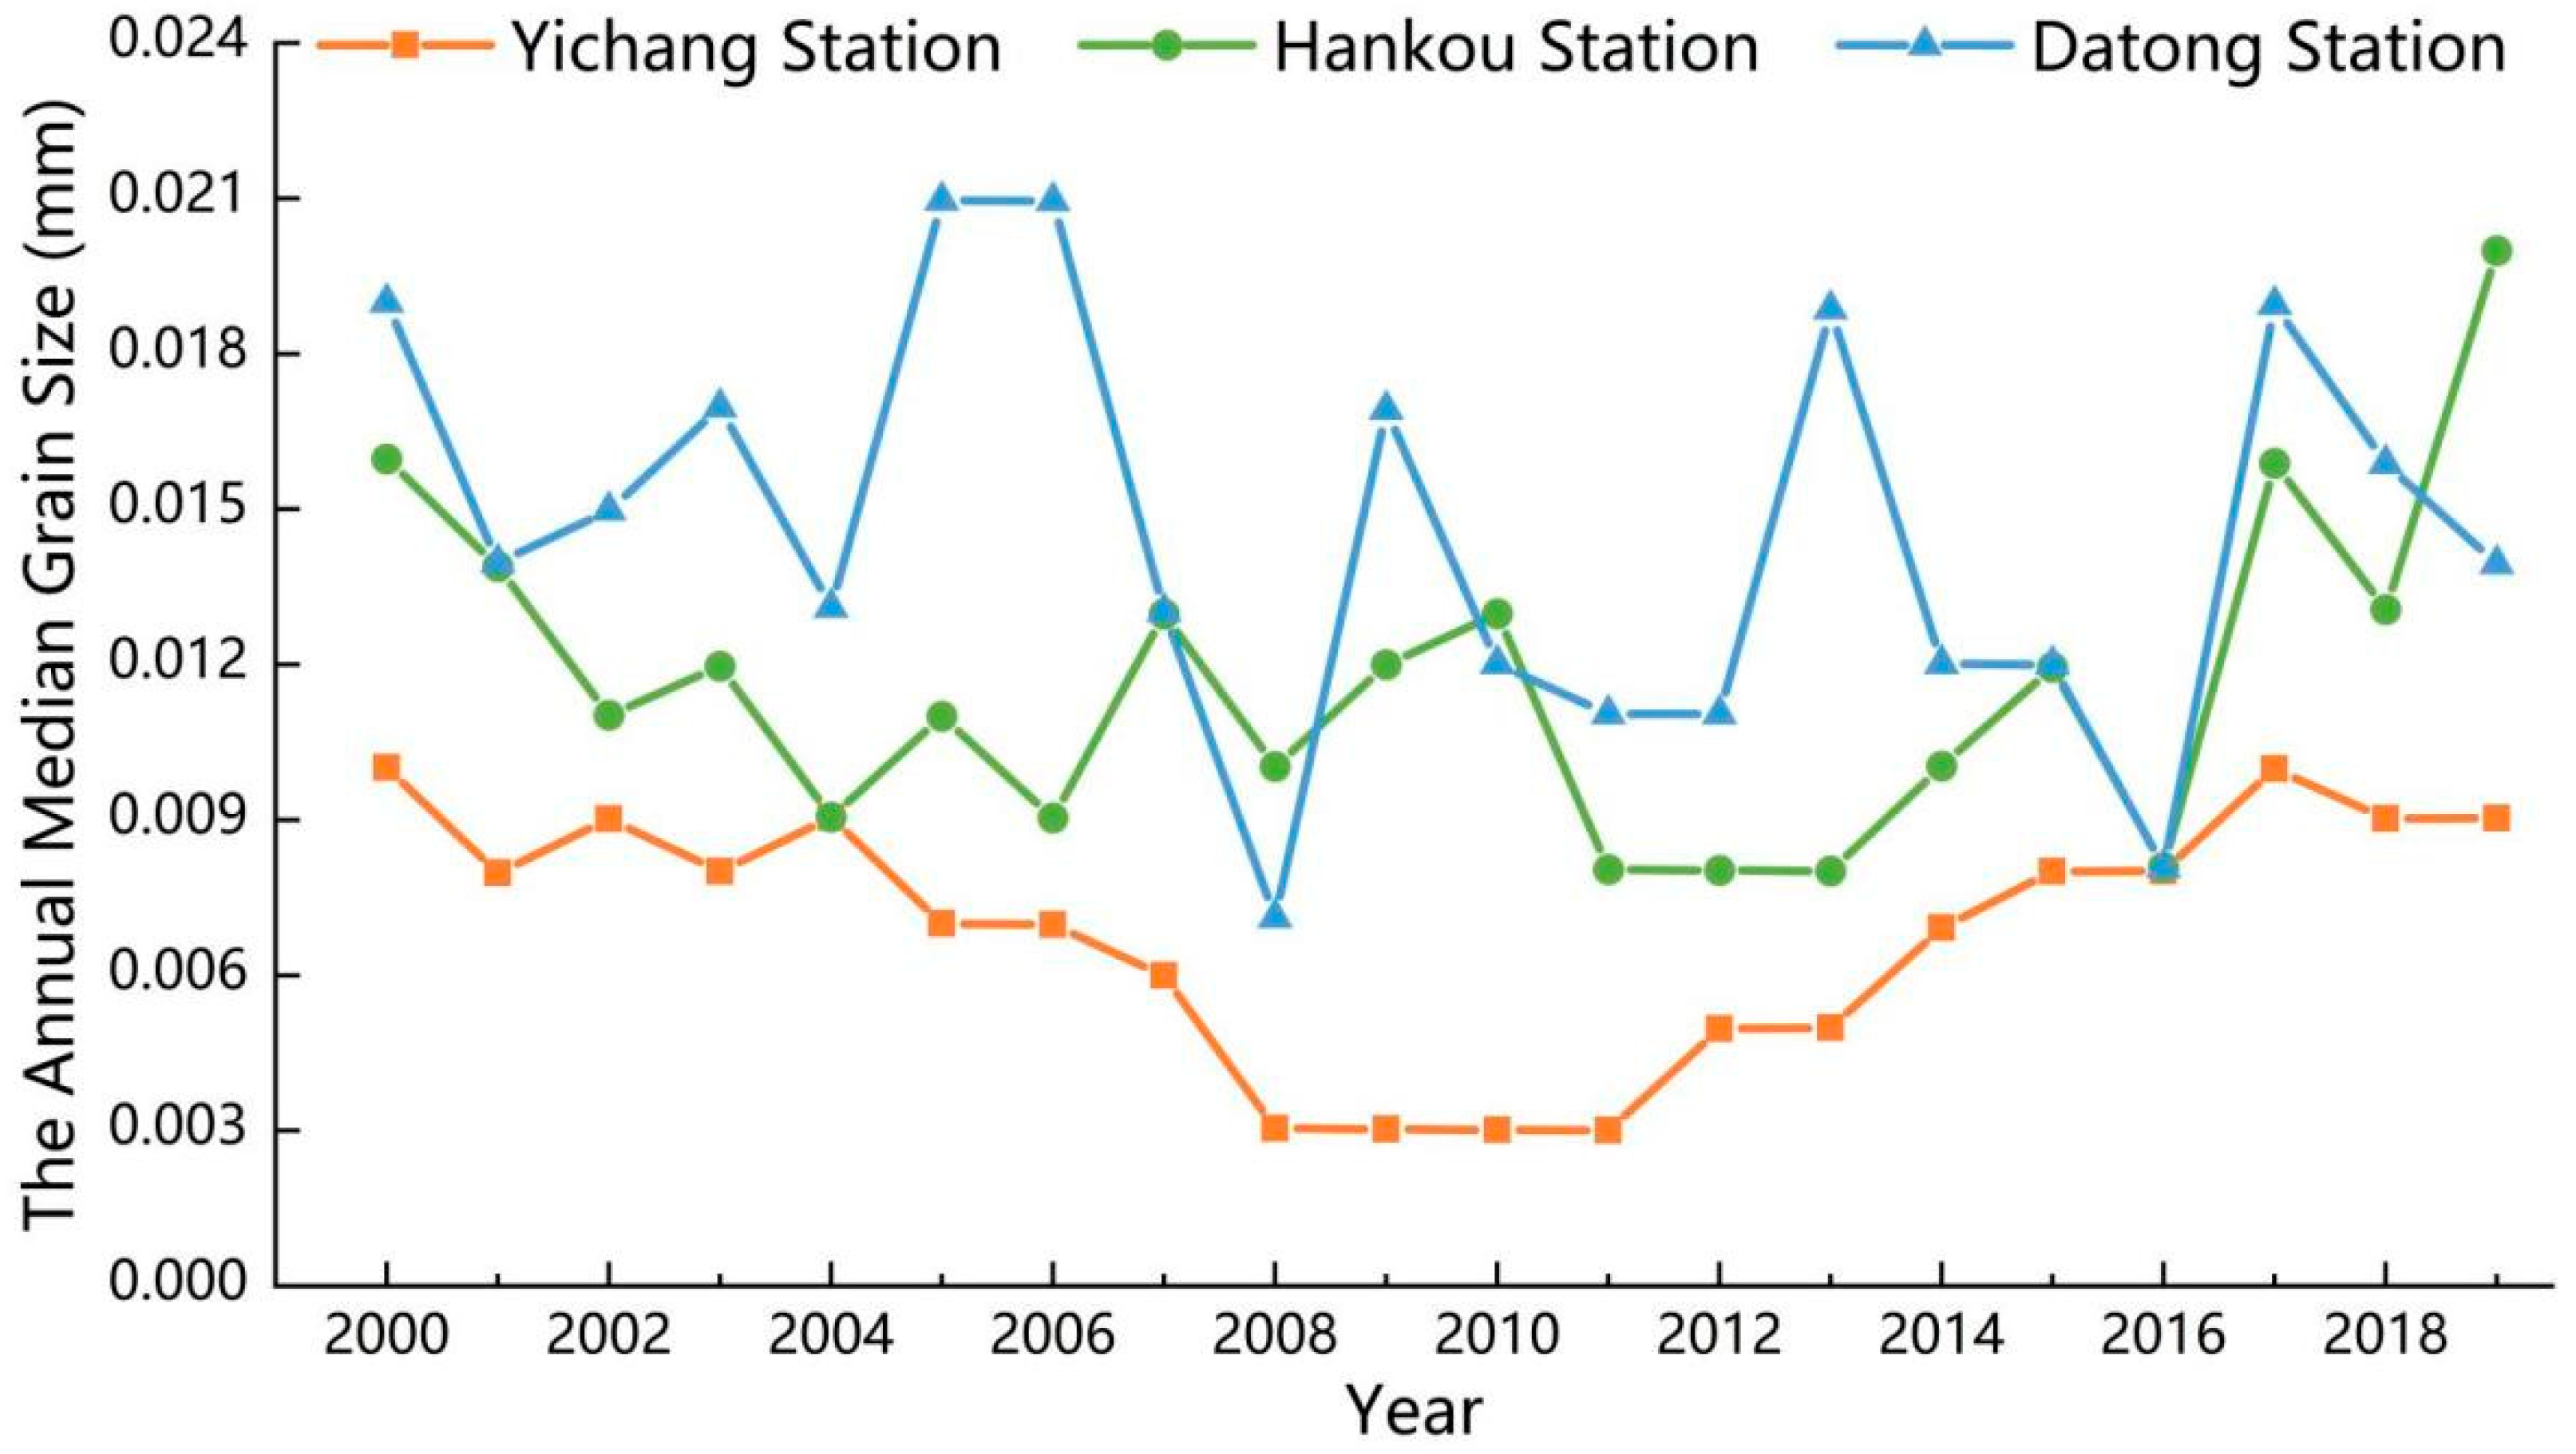
The scouring of the river channel was mainly manifested in the scour depth and coarsening of the riverbed. Over time, the vertical scour drops the water level, reduces the water surface slope, weakens the scour capacity, and finally the channel begins to silt up.

5.3. Uncertainty Analysis

Remote sensing images from several periods were used, but the accuracy of the results was low due to some positional biases in local areas. The water extraction was based on the use of MNDWI, which, compared to NDWI, has higher values over water and lower values over buildings. Thus, MNDWI facilitates the distinction between buildings and water bodies, increasing the accuracy of the extracting water. Bathymetric data were too expensive to obtain for the study of the mid-channel bar evolution, and its quantification by remote sensing is not accurate. Therefore, the measured data will need to be supplemented in subsequent research to enhance the accuracy of the results. The acquisition and quantification of natural factor data for the analysis of their impact on the river channel evolution were challenging. Therefore, we only considered precipitation as a component of climate change because water evapotranspiration, which is difficult to obtain, has little effect on runoff and sediment, and groundwater has little effect on inter-annual changes, mainly manifesting as intra-annual distribution. Additional influencing factors should be taken into consideration in a follow-up study. The impoundment of the Three Gorges Dam sharply decreased the sediment content in the river, while the runoff changed little. In future research, we should continue to pay attention to the water and sediment situation in the river, especially the impact of reservoir impoundment.

6. Conclusions

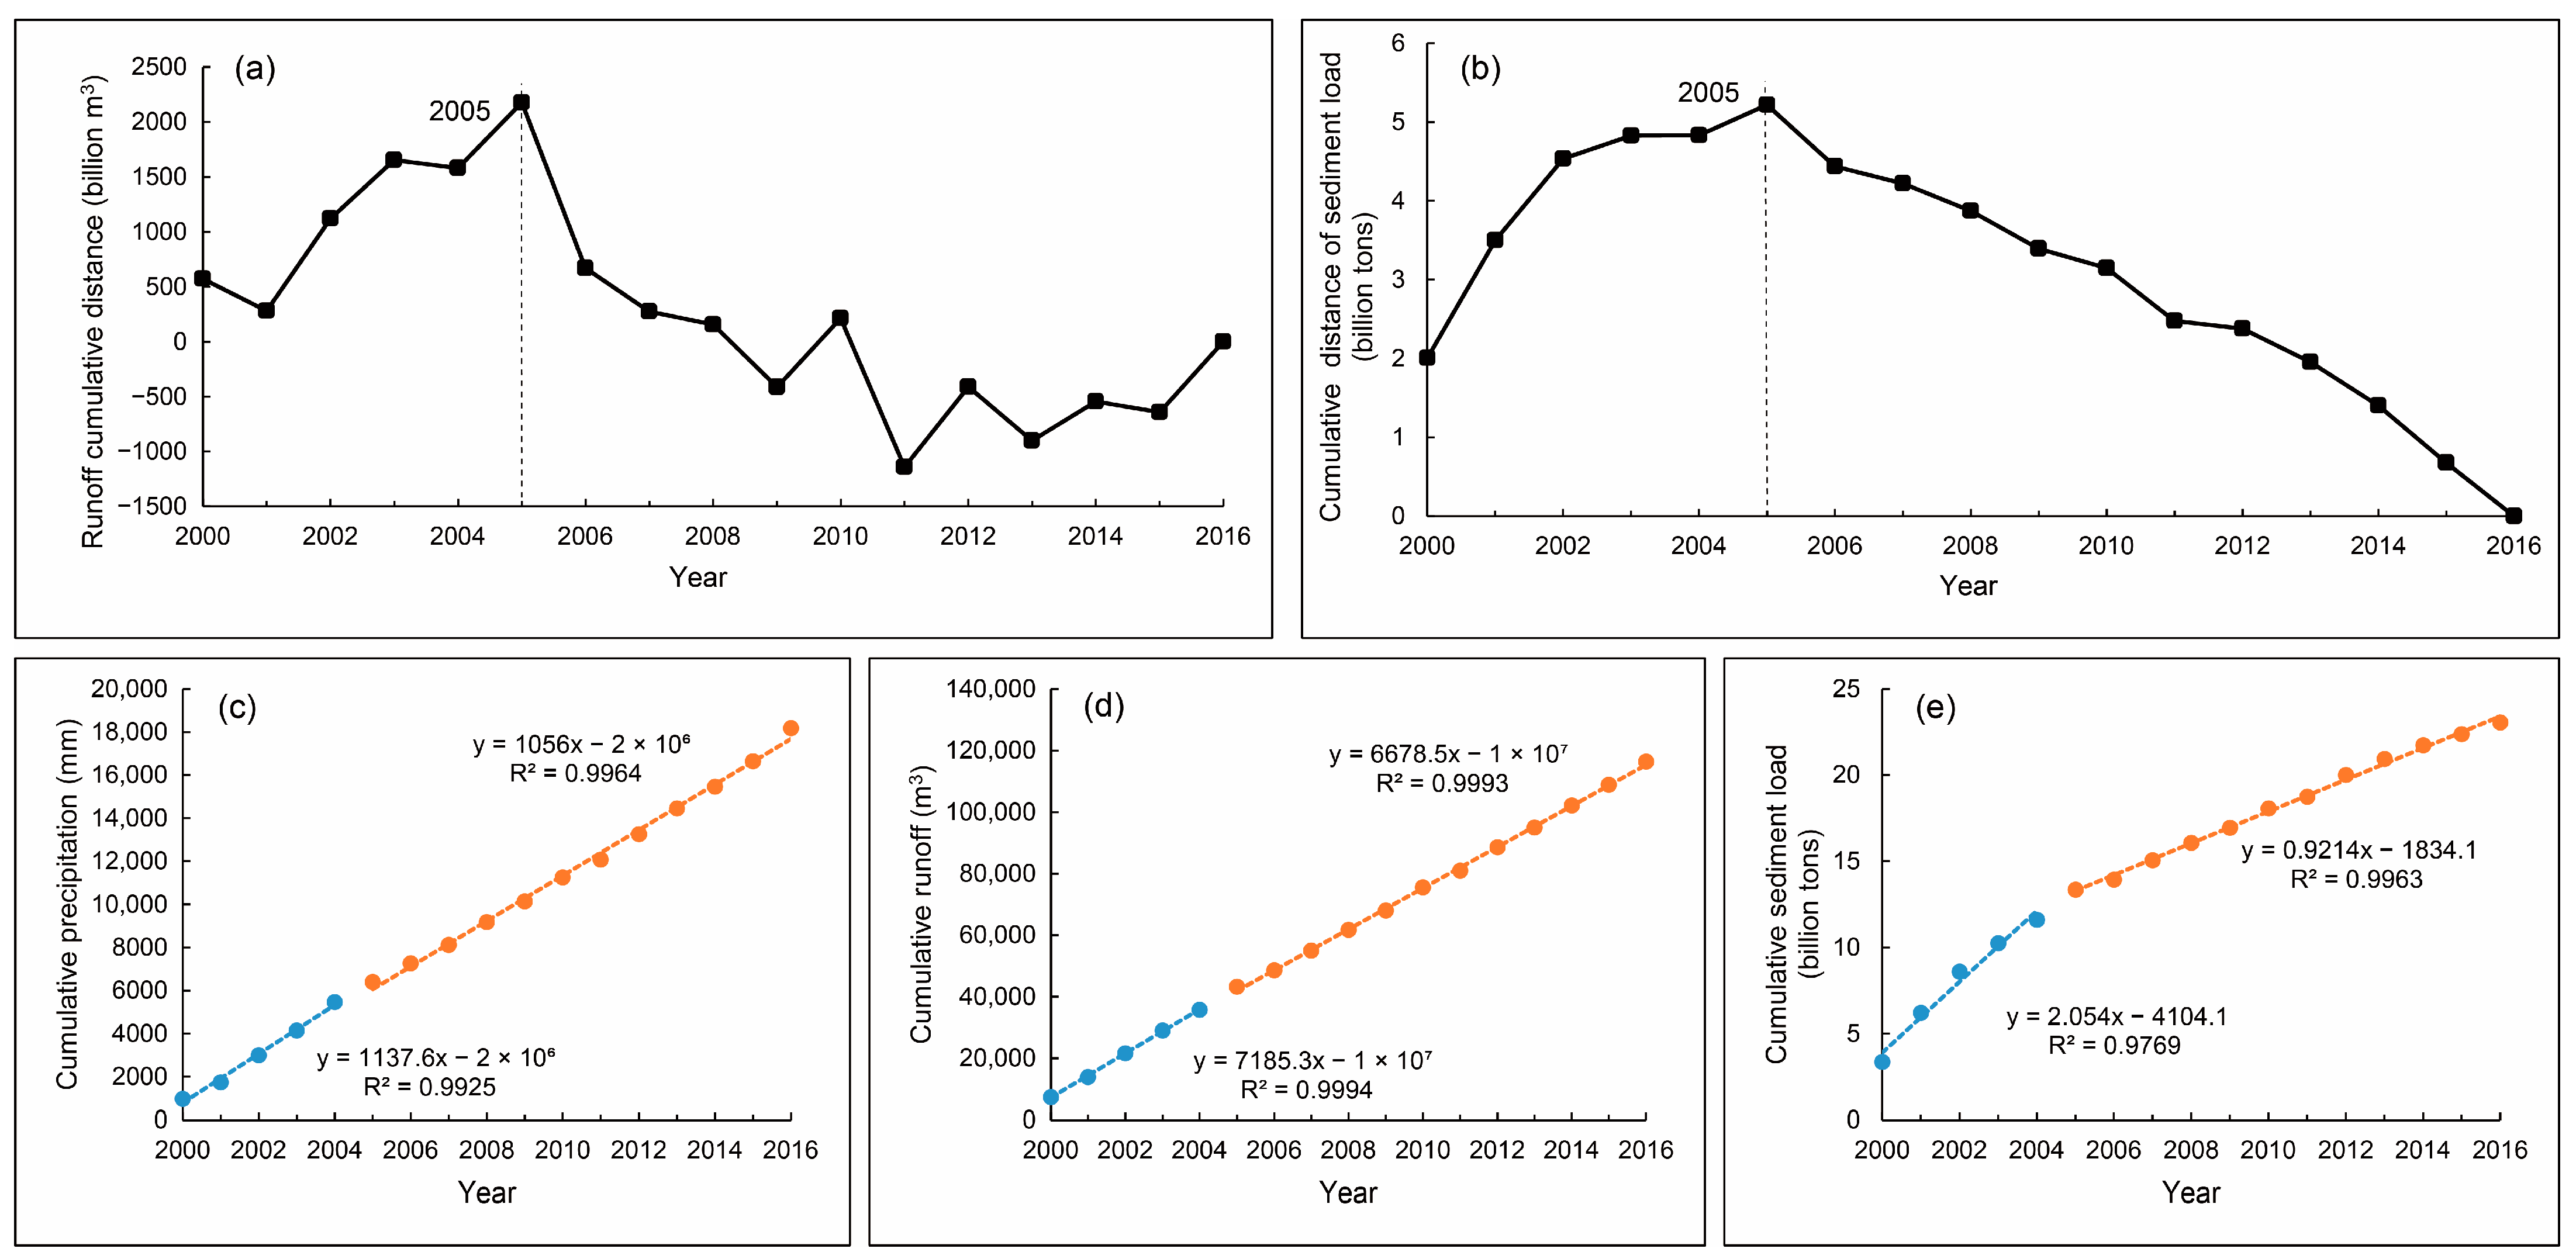
In recent years, the total lateral erosion and total accretion area of the riverbank in the middle and lower reaches of the Yangtze River from Chenglingji to Datong has been basically the same in terms of the evolution of the river channel. The lateral erosion and siltation of riverbanks have not changed significantly. The river core is in the process of shrinkage by scouring in recent years. The mid-channel bars have been shrinking by scouring in recent years. The river trough was silting before 2003, with a siltation volume of about 553 million m3; after 2003, the process reverted to scouring, with a volume of about 1.278 billion m3. The longitudinal evolution of the river channel changed from the original siltation state to the scouring state. The annual river runoff has not changed much in recent years, but the amount of sand transported has decreased sharply since 2003. The annual runoff variation is mainly influenced by precipitation, while the annual sand transport variation is mainly influenced by human activities. Based on the analysis of the evolutionary characteristics and mechanisms of the river channel, we expect it to remain in a scouring state for some time.
The analysis of the morphological evolution characteristics and driving forces of the Chenglingji to Datong River section indicates that it is influenced by fluvial geomorphological processes and human activities at different spatial and temporal scales. Different geomorphological processes and human activities have led to an increase in siltation and a sudden decrease in sand transport, due to the felling and erosion of loose sediments in the catchment area, and the erosion and excavation of riverbanks by an increasing amount of engineering constructions. These have changed the morphology and dynamics of the river. Changes in vegetation cover and rainfall on both sides of the river reflect the influence of natural factors on the river morphology. Changes in river water and sand conditions will inevitably lead to adjustments in the river morphology, which will have a negative impact on the river embankments, navigation channels, and shoreline resource use. Studies on the influence of geomorphic processes and anthropogenic factors on flood behavior in the Chenglingji–Datong River section should inform and guide flood prevention and mitigation strategies for the entire Yangtze River and other river systems with similar geomorphic, tectonic, and socioeconomic contexts.
Based on Landsat series satellite remote sensing images, MNDWI is used to extract the river potential of the middle and lower reaches of Yangtze River. It can overcome the limitations of various factors, such as natural conditions and hardware equipment, track the river potential changes in real time, and provide systematic scientific support for river potential evolution research. The continuous development of China’s domestic satellite remote sensing program will lead to an increase in the number of remote sensing platforms, the abundance of remote sensing data sources, and the spatial and temporal resolution of remote sensing images, making more accurate river remote sensing monitoring results possible. Additionally, the study of this section of the river complements related studies of the middle and lower reaches of the Yangtze River, contributing to a comprehensive understanding of the relevant Yangtze River channels.
The development of the Yangtze River section has gone through a stage from natural role as the dominant role, to joint role of nature and human, to human control as the dominant role, and natural influence as the secondary role. It also adds more uncertainties to the prediction of river channel changes. Therefore, it is necessary to adhere to the principle of comprehensive management in accordance with the branching river section: stabilize the branching river potential, rationalize the use of side beaches, reduce harmful branching, strengthen supervision and cooperation, and improve management. The whole river potential will remain relatively stable.

Author Contributions

Conceptualization, X.D. and J.Z. (Jiayun Zhou); Data curation, X.D., W.L., and S.C.; Formal analysis, X.D., S.C., J.Z. (Jianwen Zeng), and T.X.; Funding acquisition, J.Z. (Jiayun Zhou) and X.D.; Investigation, X.D., S.C., W.L., and J.Z. (Jianwen Zeng); Methodology, X.D.; Project administration, X.D.; Resources, X.D. and Y.Y.; Software, C.L. and J.Z. (Junjun Zhang); Supervision, X.D. and J.Z. (Jiayun Zhou); Validation, L.X. and X.J.; Visualization, X.D., C.L., and J.Z. (Jianwen Zeng); Writing—original draft, X.D., W.L., and C.T.; Writing—review & editing, X.D. and W.L. All authors have read and agreed to the published version of the manuscript.

Funding

This work was supported by the Foundation of China Geological Survey (Grant No. DD20221809, No. DD20190446), the National Key Research and Development Program of China (Grant No. 2021YFC3000401), the National Natural Science Foundation of China (Grant No. 41941019), Sichuan Mineral Resources Research Center (Grant No. SCKCZY2021-ZC003), Sichuan Provincial Department of Education Humanities and Social Sciences (Zhang Daqian research) key project (Grant No. ZDQ2021-01), Open Foundation of Sichuan Center for Disaster Economic Research (Grant No. ZHJJ2021-ZD001) and College Students’ Innovative Entrepreneurial Training Plan Program (Grant Nos. 202210616003, 202210616006).

Data Availability Statement

The data that support the findings of this study are available from the corresponding author upon reasonable request.

Conflicts of Interest

The authors declare no conflict of interest.

References

  1. Xu, S.; Chen, Z. Similarity and discrepancy of major delta processes on eastern coast of China. Acta Geogr. Sin. 1995, 50, 481–490. [Google Scholar]
  2. Luan, H.; Liu, T.; Gao, H.; Yang, G.; Lin, M. River bank protection of middle and lower reaches of Yangtze River under new flow and sediment condition: Case of levee collapse in Yangzhou City in 2017. Yangtze River 2019, 50, 14–19. [Google Scholar] [CrossRef]
  3. Ang, Z. Study on the Migration of channel and the bank collapse formation mechanism along the MOS section of the Yangtze River. J. Anhui Univ. Sci. Technol. 2018, 38, 72–76. [Google Scholar]
  4. Yang, L. Treatment and effect analysis of Qiujiangwei bank collapse in Taiziji reach of the Yangtze River under new water and sand condition. Water Conserv. Constr. Manag. 2021, 41, 11–16. [Google Scholar] [CrossRef]
  5. Zhang, B.; Lu, W.; Zhu, L. Analysis for water and sand conditions of Lower Yellow River in typical year and its evolution characters of river bed. Heilongjiang Hydraul. Sci. Technol. 2017, 45, 5–7. [Google Scholar] [CrossRef]
  6. Jiuhe, B.; Shuiling, Z.; Chunhui, L.; Xiangen, X.; Xuan, W.; Qiang, L.; Xuesong, W. A longitudinal functional connectivity comprehensive index for multi-sluice flood control system in plain urban river networks. J. Hydrol. 2022, 613, 128362. [Google Scholar]
  7. EuiJeong, K.; Eunsong, J.; Yuno, D.; GeaJae, J.; HyunWoo, K.; Hyunbin, J. Impact of River-Reservoir Hybrid System on Zooplankton Community and River Connectivity. Sustainability 2022, 14, 5184. [Google Scholar]
  8. YeonMoon, C.; JiMin, K.; IkTae, A. Research on the Longitudinal Section of River Restoration Using Probabilistic Theory. Entropy 2021, 23, 965. [Google Scholar]
  9. Giona Bucci, M.; Schoenbohm, L.M. Tectono-Geomorphic Analysis in Low Relief, Low Tectonic Activity Areas: Case Study of the Temiskaming Region in the Western Quebec Seismic Zone (WQSZ), Eastern Canada. Remote Sens. 2022, 14, 3587. [Google Scholar] [CrossRef]
  10. Li, Q.; Cai, Q.; Fang, H. Channel evolvement and influence factors in Ningxia-Inner Mongolia reach of the Yelloe River. J. Arid. Land Resour. Environ. 2012, 26, 68–73. [Google Scholar] [CrossRef]
  11. Li, J.; Xia, J.; Deng, S.; Zhang, X. Recent bank retreat processes and characteristics in the braided reach of the Lower Yellow River. Adv. Water Sci. 2015, 26, 517–525. [Google Scholar] [CrossRef]
  12. Tian, S.; Wang, W.; Xie, B.; Zhang, M. Fluvial processes of the downstream reaches of the reserviors in the Lower Yellow River. J. Geogr. Sci. 2016, 26, 1321–1336. [Google Scholar] [CrossRef]
  13. Zheng, S.; Wu, B.; Zhou, Y.; Wang, K.; Han, S. Erosion and aggradation processes and calculation method for the Qingshuigou channel on the Yellow River Delta. Adv. Water Sci. 2018, 29, 322–330. [Google Scholar] [CrossRef]
  14. Zheng, S.; Edmonds, D.A.; Wu, B.; Han, S. Backwater controls on the evolution and avulsion of the Qingshuigou channel on the Yellow River Delta. Geomorphology 2019, 333, 137–151. [Google Scholar] [CrossRef]
  15. Chen, J.; Ji, M.; Lin, J.; Chen, J. Runoff-sediment characteristics and riverbed evolution of Ganjiang River sink. Adv. Sci. Technol. Water Resour. 2012, 32, 1–5. [Google Scholar]
  16. Jiang, C.; Li, C.; Li, Z.; Long, Y. Study of fluvial processes in Xiangtan-Haohekou Section of Xiangjiang River. J. Sediment Res. 2013, 3, 19–26. [Google Scholar] [CrossRef]
  17. Long, Y.; Liu, J.; Li, Z.; Jiang, C. Processes of typical mid-channel bars in the middle and lower Xiang River since 1980s. J. Sediment Res. 2017, 42, 8–15. [Google Scholar] [CrossRef]
  18. Steenhuis, T.S.; Tilahun, S.A.; Tesemma, Z.K.; Tebebu, T.Y.; Mohamed, Y.A. Soil Erosion and Discharge in the Blue Nile Basin: Trends and Challenges; Springer International Publishing: Berlin/Heidelberg, Germany, 2014. [Google Scholar]
  19. Ikeuchi, H.; Hirabayashi, Y.; Yamazaki, D.; Kiguchi, M.; Koirala, S.; Nagano, T.; Kotera, A.; Kanae, S. Modeling complex flow dynamics of fluvial floods exacerbated by sea level rise in the Ganges–Brahmaputra–Meghna delta. Environ. Res. Lett. 2015, 10, 124011. [Google Scholar] [CrossRef]
  20. Yuill, B.T.; Gaweesh, A.; Allison, M.A.; Meselhe, E.A. Morphodynamic evolution of a lower Mississippi River channel bar after sand mining. Earth Surf. Process. Landf. J. Br. Geomorphol. Res. Group 2016, 41, 526–542. [Google Scholar] [CrossRef]
  21. Downs, P.W.; Piégay, H. Catchment-scale cumulative impact of human activities on river channels in the late Anthropocene: Implications, limitations, prospect. Geomorphology 2019, 338, 88–104. [Google Scholar] [CrossRef]
  22. Ahmed, A.A.; Gaber, A. Meandering and bank erosion of the River Nile and its environmental impact on the area between Sohag and El-Minia, Egypt. Geosci. J. 2019, 4, 1–11. [Google Scholar] [CrossRef]
  23. Rozo, M.G.; Nogueira, A.; Castro, C.S. Remote sensing-based analysis of the planform changes in the Upper Amazon River over the period 1986–2006. J. S. Am. Earth Sci. 2014, 51, 28–44. [Google Scholar] [CrossRef]
  24. Feeney, C.J.; Chiverrell, R.C.; Smith, H.G.; Hooke, J.M.; Cooper, J.R. Modelling the decadal dynamics of reach-scale river channel evolution and floodplain turnover in CAESAR-Lisflood. Earth Surf. Process. Landf. 2020, 45, 1273–1291. [Google Scholar] [CrossRef]
  25. Midha, N.; Mathur, P.K. Channel characteristics and planform dynamics in the Indian Terai, Sharda River. Environ. Manag. 2014, 53, 120–134. [Google Scholar] [CrossRef] [PubMed]
  26. Abate, M.; Nyssen, J.; Steenhuis, T.S.; Moges, M.M.; Tilahun, S.A.; Enku, T.; Adgo, E. Morphological changes of Gumara River channel over 50 years, upper Blue Nile basin, Ethiopia. J. Hydrol. 2015, 525, 152–164. [Google Scholar] [CrossRef]
  27. Dewan, A.; Corner, R.; Saleem, A.; Rahman, M.M.; Haider, M.R.; Rahman, M.M.; Sarker, M.H. Assessing channel changes of the Ganges-Padma River system in Bangladesh using Landsat and hydrological data. Geomorphology 2017, 276, 257–279. [Google Scholar] [CrossRef]
  28. Gao, C.; Wang, S. Evolution of the gravel-bedded anastomosing river within the Qihama reach of the First Great Bend of the Yellow River. J. Geogr. Sci. 2019, 29, 306–320. [Google Scholar] [CrossRef] [Green Version]
  29. Li, P.; Feng, Z.; Jiang, L.; Liu, Y.; Hu, J.; Zhu, J. Natural water surface of poyang lake monitoring based on remote sensing and the relationshipo with water level. J. Nat. Resour. 2013, 28, 1556–1568. [Google Scholar]
  30. Dai, S.; Yang, S.; Li, P. Regulation of the main river channel to the sediment discharge of the Yangtze River. Acta Geogr. Sin. 2006, 61, 461–470. [Google Scholar]
  31. Xu, T.; Wang, M.; Zhou, M.; Xiang, Y.; Huang, R. Effect of different regulation modes on river channel evolution in downstream of Three Gorges dam. Yangtze River 2016, 47, 6–11. [Google Scholar] [CrossRef]
  32. Xiao, Y.; Li, W.; Yang, S. Study and simulation of fine sediment behavior in permanent backwater zone of Three Gorges Reservoir. J. Chongqing Jiaotong Univ. 2019, 38, 74–80+108. [Google Scholar]
  33. Shiming, Y.; Hongyan, Y.; Ligang, L. Analysis on Current Situation and Development Trend of Ecological Revetment Works in Middle and Lower Reaches of Yangtze River. Procedia Eng. 2012, 28, 307–313. [Google Scholar] [CrossRef] [Green Version]
  34. Meirong, Z.; Junqiang, X.; Shanshan, D.; Zhiwei, L. Two-dimensional modeling of channel evolution under the influence of large-scale river regulation works. Int. J. Sediment Res. 2022, 37, 424–434. [Google Scholar]
  35. Yan, N.; Colombera, L.; Mountney, N.P. Evaluation of Morphodynamic Controls on the Preservation of Fluvial Meander-Belt Deposits. Geophys. Res. Lett. 2021, 48, e2021GL094622. [Google Scholar] [CrossRef]
  36. Yuanfang, C.; Yunping, Y.; Jinyun, D.; Zhaohua, S.; Yitian, L.; Lingling, Z. Evolution characteristics and drivers of the water level at an identical discharge in the Jingjiang reaches of the Yangtze River. J. Geogr. Sci. 2021, 30, 1633–1648. [Google Scholar]
  37. Lu, J.Y.; Huang, Y.; Wang, J. The analysis on reservoir sediment deposition and downstream river channel scouring after impoundment and operation of TGP. Eng. Sci. 2011, 9, 113–120. [Google Scholar]
  38. Chai, Y.; Li, Y.; Li, S.; Zhu, B.; Wang, J. Analysis of recent variation trend and cause of runoff and sediment load variations in the Yangtze River. J. Irrig. Drain. 2017, 36, 94–101. [Google Scholar] [CrossRef]
  39. Zhang, Q.; Chen, Y.D.; Jiang, T.; Li, M. Channel changes of the Makou-Tianjiazhen reach in the middle Yangtze River during the past 40 years. J. Geogr. Sci. 2007, 17, 442–452. [Google Scholar] [CrossRef]
  40. Yin, P.; Dai, S.; Yu, X. Remote sensing analysis of evolution of the Yangtze River in Anhui province based on GIS. Surv. Mapp. 2011, 34, 28–33. [Google Scholar]
  41. Jia, L.-w.; Pan, S.-q.; Wu, C.-y. Effects of the anthropogenic activities on the morphological evolution of the Modaomen Estuary, Pearl River Delta, China. China Ocean. Eng. 2013, 27, 795–808. [Google Scholar] [CrossRef]
  42. Shuwei, Z.; Hao, H.; Shujian, X.; Heqin, C.; Zijun, L.; Enfeng, L. Spatial distribution and response of dunes to anthropogenic factors in the lower Yangtze River. Catena 2022, 212, 106045. [Google Scholar]
  43. Liu, X.; Yang, S.; Zhao, C.; Guan, Y. Analysis of factors affecting accuracy of snowmelt runoff model based on multi sourceremote sensing in the Yarlung Zangbo River Basin. J. Beijing Norm. Univ. 2015, 51, 606–612. [Google Scholar] [CrossRef]
  44. Yang, D.; Huang, X.; Shi, L.; Li, S. Erosin and siltation Monitoring Along the River Bank of Yangzhong City During 1973-2017 by Remote Sensing and Analyzing the Bank Collapse. Resour. Environ. Inthe Yangtze Basin 2018, 27, 2796–2804. [Google Scholar]
  45. Song, Z.; Ma, Y.; Tang, C. Remote-sensing Explanation of the Yangtze River Channel in Jiangxi Province. Remote Sens. Technol. Appl. 2005, 20, 415–419. [Google Scholar]
  46. Huang, J.; Lv, G. Application of Remote Sensing the Experiment of Digital Yangtze River Course. Resour. Environ. Inthe Yangtze Basin 2002, 11, 40–42. [Google Scholar]
  47. Gu, Y.; Qian, Y. Remote sensing monitoring in the Yangtze River in Jiangsu Application in Monitoring Management Information System. Jiangsu Water Resour. 2006, 3, 24–25. [Google Scholar] [CrossRef]
  48. Hu, C.; Hou, W. Study on treatment planning of main channels of middle and lower Yangtze River. Yangtze River 2013, 44, 52–55+79. [Google Scholar] [CrossRef]
  49. Xu, H. A study on information extraction of water body with the modified normalized difference water index (MNDWI). J. Remote Sens. 2005, 9, 589–595. [Google Scholar]
  50. Lü, Y.; Zhang, L.; Feng, X.; Zeng, Y.; Fu, B.; Yao, X.; Li, Y.; Wu, B. Recent ecological transitions in China: Greening, browning, and influential factors. Sci. Rep. 2015, 5, 1–8. [Google Scholar] [CrossRef] [Green Version]
  51. Kun, Z.; Yihe, L.; Bojie, F.; Ting, L. The effects of restoration on vegetation trends: Spatiotemporal variability and influencing factors. Earth Environ. Sci. Trans. R. Soc. Edinb. 2019, 109, 473–481. [Google Scholar]
  52. Wang, Y.; Zhang, J.; Tong, S.; Guo, E. Monitoring the trends of aeolian desertified lands based on time-series remote sensing data in the Horqin Sandy Land, China. Catena 2017, 157, 286–298. [Google Scholar] [CrossRef]
  53. Liu, Y.; Wang, Y.; Liu, H.; Du, L.; Liu, S.; Chai, F. Study on temporal distribution of precipitation in Beijing City during flooding period based on dynamic cluster analysis and fuzzy pattern recognition. J. China Hydrol. 2019, 39, 73–77. [Google Scholar]
  54. Wang, S.; Yan, Y.; Yan, M.; Zhao, X. Quantitative estimation of the impact of precipitation and human activities on runoff change of the Huangfuchuan River Basin. J. Geogr. Sci. 2012, 22, 906–918. [Google Scholar] [CrossRef]
  55. Li, N. The Impact of Human Activities on Stream Flow and Sediment in the Yangtze River Estuarine Area. Ph.D. Thesis, Nanjing University, Nanjing, China, 2016. [Google Scholar]
  56. Hao, Y.; Jia, D.; Zhang, X.; Wu, L.; Chen, C. Advances in research on the influnence of vegetation on river flow and bank morphology evolution. Hydro-Sci. Eng. 2022, 193, 1–11. [Google Scholar]
  57. Gan, C.; Wang, X.; Li, B.; Liang, Z.; Li, Z.; Wen, X. Changes of vegetation coverage during recent 18 years in Lianjiang River Watershed. Sci. Geogr. Sinica 2011, 31, 1019–1024. [Google Scholar] [CrossRef]
  58. Tao, S.; Kuang, T.; Peng, W.; Wang, G. Analyzing the spatio-temporal variation and drivers of NDVI in upper reaches of the Yangtze River from 2000 to 2015: A case study of Yibin City. Acta Ecol. Sinica 2020, 40, 5029–5043. [Google Scholar]
  59. Qi, Y.; Zhang, F.; Chen, R.; Wang, Y. Vegetation coverage dynamics in northern slope Tianshan Mountains from 2001 to 2015. Acta Ecol. Sinica 2020, 40, 3677–3687. [Google Scholar]
  60. Wang, S.; Li, L.; Chen, W. Variations of bank shift rates along the Yinchaun Plain reach of the Yellow River and their influencing factors. J. Geogr. Sci. 2014, 24, 703–716. [Google Scholar] [CrossRef] [Green Version]
  61. Li, J.; Gou, J.; Dong, Z.; Wu, J.; Jia, X.; Zhao, Z.; Wang, W. Dynamics Change of River Bank and Factor Analysis in Ulan Buh Desert Section of the Yellow River. Res. Soiland Water Conserv. 2016, 23, 117–122. [Google Scholar] [CrossRef]
  62. Mei, Y.; Wang, J. Variation of channel lateral erosion/accretion and channel shrinkage rate in the Linhe Reach of Yellow River since1977. Acta Geogr. Sinica 2016, 71, 1509–1519. [Google Scholar]
  63. Wu, F.; Tong, C.; Torkelson, M.; Wang, Y. Evolution of shoals and vegetation of Jiuduansha in the Changjiang River Estuary of China in the last 30 years. Acta Oceanol. Sinica 2020, 39, 71–78. [Google Scholar] [CrossRef]
  64. Yuan, P.; Liu, J.; Zhao, Y. A review of studies on the impact of hydraulic hub operations on downstream rivers. Technol. Manag. 2017, 545, 95–96. [Google Scholar]
  65. Peng, Y.; Xia, J.; Peng, J.; Shen, J. Response of the nearshore riverbed evolution to flow and sediment conditions in Jingjiang Reach. J. China Hydrol. 2018, 38, 11–16. [Google Scholar]
  66. Zhao, Z.; Yao, S.; Tang, F.; Qu, G.; Zhuang, L. Evolution law and trend of river bed in Xiongjiazhou to Chenglingji reach under erosion condition. Port Waterw. Eng. 2019, 8, 134–140. [Google Scholar] [CrossRef]
  67. Wang, Y.; Hu, C.; Liu, X.; Shi, H. Study on varations of runoff and sediment load in the Upper Yangtze River and mainInfluence factors. J. Sediment Res. 2016, 1, 1–8. [Google Scholar] [CrossRef]
Figure 1. Location of the study area.
Water 15 01484 g001
Figure 2. Changes in shoreline movement from the Chenglingji to Datong River section at different periods.
Water 15 01484 g002
Figure 3. Changes of scouring and accumulation in different periods from Chenglingji to Datong.
Water 15 01484 g003
Figure 4. (a): Changes of mid-channel bars in different periods of the Chenglingji to Datong River section from 1989 to 2019; (b,c): Changes in the area of the central bar in the Chenglingji to Datong River section from 1989 to 2019.
Water 15 01484 g004
Figure 5. River channel changes in different periods of the river sections. (a): Evolution of planar morphology in Xinzhou from 1989 to 2019; (b): Jiujiang River section; (c): Yueyang River section; (d): Anqing River section.
Water 15 01484 g005
Figure 6. Hankou station: (a) Variation characteristics of runoff cumulative distance; (b) Variation characteristics of cumulative distance of sediment load; (c) Relationship between cumulative precipitation and year; (d) Relationship between cumulative runoff and year; (e) Relationship between cumulative sediment load and year.
Water 15 01484 g006
Figure 7. Annual median grain size changes at three hydrological stations from 2000–2019.
Water 15 01484 g007
Figure 8. Comparison of sand mining and sand transport in the river at Datong Station.
Water 15 01484 g008
Figure 9. Map of vegetation coverage within 5 km from the Chenglingji to Datong River channel. Note: Low vegetation coverage: VFC < 15%; Low-medium vegetation coverage: 15% < VFC < 40%; Medium vegetation coverage: 40% < VFC < 60%; Medium-high vegetation coverage: 60% < VFC < 75%; High vegetation coverage: VFC > 75%.
Water 15 01484 g009
Figure 10. Cluster Analysis. (a): Clustering distribution of average precipitation in the middle and lower reaches of the Yangtze River basin; (b): Clustering category selection; (c): Changes in precipitation by clusters in the middle and lower reaches of the Yangtze River basin.
Water 15 01484 g010
Figure 11. Change rates of the left and right banks from 1989 to 2019. (a): Left Bank; (b): Right Bank.
Water 15 01484 g011
Figure 12. Scouring and accretion on the left and right banks, 1989–2019. (a): Scouring; (b): Accretion.
Water 15 01484 g012
Table 1. Water levels of the Chenglingji to Datong River section on imaging days during the dry season (m).
Imaging DateWater Level at HankouImaging DateWater Level at HuangshiImaging DateWater Level at Jiujiang
11 February 198914.204 February 198911.0713 February 19899.72
5 March 199415.0025 January 199410.952 January 19949.97
12 December 199915.4725 December 199911.9818 December 199910.11
13 December 200415.929 March 200412.3530 January 20048.15
25 November 200914.4922 February 201011.3112 February 20098.31
20 November 201315.775 March 201412.346 November 20138.89
7 December 2019-15 January 2019-23 January 2019-
Table 2. Hydrological observation data from the Chenglingji to Datong River.
Serial NumberLocationContent of InformationTime of DataData Source
1Hankou, DatongRunoff volume, sediment load, annual median particle size2001–2018Changjiang Sediment Bulletin
2Chenglingji-Hankou, Hankou-Hukou, Hukou-DatongFlushing volume, flushing intensity1975–2019Hydrological Yearbook of the Middle and Lower Reaches of the Yangtze River
368 meteorological stationsprecipitation1989–2016National meteorological center
Table 3. Image interpretation of central bars.
Remote Sensing ImageInterpretation Key of Central Bar
Water 15 01484 i001Central bars take on an island-like shape and usually have some vegetation cover, such as trees and grass.
Water 15 01484 i002Surrounded by river water, a part of the river’s core is a sandy beach, which usually appears light yellow or brown in the image.
Table 4. Change rates of the left and right banks from 1989 to 2019.
TimeMaximum Change Amplitude (m)Average Change Amplitude (m)Change Rate (m/year)
Left BankRight BankLeft BankRight BankLeft BankRight Bank
1989–1994−373.8−238.8−44.3 (69)−33.7 (46)−8.9 (69)−6.7 (46)
629.3744.555.5 (69)37.0 (92)11.1 (69)7.4 (92)
1994–1999−492.8−255.8−57.4 (37)−27.6 (72)−11.5 (37)−5.5 (72)
275.8221.649.8 (101)37.5 (66)10.0 (101)7.5 (66)
1999–2004−1326.5−198.4−61.5 (96)−31.1 (79)−12.3 (96)−6.2 (79)
504.9341.732.2 (42)28.5 (59)6.4 (42)5.7 (59)
2004–2009−382.4−681.8−43.1 (61)−41.7 (80)−8.6 (61)−9.4 (80)
456.0387.729.3 (77)23.8 (58)5.9 (77)4.8 (58)
2009–2013−255.7−33.5−34.0 (21)−14.1 (28)−8.5 (21)−3.5 (28)
281.1690.941.9 (117)43.6 (110)10.5 (117)10.9 (110)
2013–2019−255.5−33.5−35.5 (104)14.1 (28)−5.9 (104)−2.4
1442.7690.884.2 (34)43.6 (110)14.0 (34)7.3
Table 5. Scouring and accretion on the left and right banks, 1989–2019.
TimeLocationScouringAccretion
Area (km2)Rate (km2/year)Area (km2)Rate (km2/year)
1989–1994Left bank17.183.4428.295.66
Right bank24.044.816.661.33
1994–1999Left bank37.047.4111.872.37
Right bank12.272.4512.632.53
1999–2004Left bank8.371.6734.776.95
Right bank8.331.6717.543.51
2004–2009Left bank13.802.7614.102.82
Right bank7.721.5417.983.60
2009–2013Left bank28.957.244.581.15
Right bank21.195.302.440.61
2013–2019Left bank7.961.3317.052.84
Right bank15.262.5424.034.01
Table 6. Comparison of erosion–deposition amount from Chenglingji to Datong in the middle reaches of the Yangtze River in different periods ( 10 4 m3).
ProjectPeriodsChenglingji-HankouHankou-HukouHukou-Datong
Total scouring-deposition amount1975–199627,38024,408−2270
1996–1998−996025,63216,600
1998–2002−6694−33,43313,700
2002–2006−5990−14,679−7986
2006–20081974693−7611
2008–2019−33,380−41,439−21,569
2002–2019−39,173−51,425−37,166
Notes: A negative value indicates erosion, a positive value is deposition; Bankfull channel is the channel below the water level when the flow of Yichang station is 30,000 m3/s and the flow of Hankou station is 35,000 m3/s; The statistical years of the Chenglingji to Hukou River section from 1966 to 1981 were 1970–1981, there were no topographic data in October 2002; the actual statistics were for October 2001; The calculated water level of Hukou–Datong River section is 15.47 m (Hukou) −10.06 m (Datong), the flow of Datong station is 45,000 m3/s.
Table 7. Contribution rates of precipitation and human activities to runoff and sediment load at Hankou station in different periods (billion tons).
Contribution Rate
Data
TaTbPrecipitation (CP)Human Activities (CH)
Precipitation (YP)1137.61056--
Runoff volume (YR)7185.36678.5101.70%−1.70%
Sediment load (YS)2.0540.921413.01%86.99%
Disclaimer/Publisher’s Note: The statements, opinions and data contained in all publications are solely those of the individual author(s) and contributor(s) and not of MDPI and/or the editor(s). MDPI and/or the editor(s) disclaim responsibility for any injury to people or property resulting from any ideas, methods, instructions or products referred to in the content.

