
Study of Urban Flooding Response under Superstandard Conditions


School of Water Conservancy, North China University of Water Resources and Electric Power, Zhengzhou 450046, China
*
Author to whom correspondence should be addressed.
Water 2023, 15(8), 1492; https://doi.org/10.3390/w15081492
Submission received: 1 March 2023
/
Revised: 31 March 2023
/
Accepted: 2 April 2023
/
Published: 11 April 2023
(This article belongs to the Special Issue Flooding in Urban Areas: Risks and Responses)
Abstract
:Superstandard conditions refer to extreme rainfall and river flooding that exceed the flood control system or flood control works. In order to explore the influence of superstandard conditions on urban waterlogging, based on the MIKE FLOOD platform, this paper takes the downtown area of Zhoukou as the research object, and it conducts waterlogging simulation in this area under the extreme rainfall conditions of once in 20 years and once in 50 years combined with the ultra-high water level of the river. The simulation results of inundation depth, inundation range and drainage capacity of a self-flowing river are compared and analyzed. The results show that heavy rainfall is the main cause of waterlogging disaster. When extreme rainfall and river flood occur at the same time, the artesian drainage capacity of the pipeline is seriously affected due to the high water level of the river. The city has a large amount of water, and when the river embankment overflows, it poses a serious threat to the safety of the city.
1. Introduction
In recent years, with the rapid development of global climate change and urbanization, more and more cities in China have been experiencing flooding disasters of unprecedented severity and frequency, causing huge socio-economic losses and seriously threatening the lives and property of residents [1,2]. For example, the extreme rainstorms in Beijing on 21 July 2012, and in Hefei on 27 July 2014, have caused serious flooding problems, and in July 2021, Zhengzhou City was hit by a once-in-a-millennium rainstorm, causing 380 deaths and disappearances and direct economic losses of 17.5 billion dollars, accounting for 34.1% of the province [3]. In the 14th Five-Year Plan, the Ministry of Housing and Construction emphasized that the functions of urban lifeline projects and important municipal infrastructure must not be lost under conditions of excessive rainfall. In the context of global climate change, although the impact varies from region to region, there is an overall trend of increasing frequency and intensity of extreme heavy precipitation, putting greater pressure on regional flood prevention and drainage and urban municipal drainage [4,5]. It is evident that research into urban flooding under superstandard conditions is important.
There has been a lot of research on urban flooding and urban flood control and urban flood protection. Tian Ziyang et al. [6] developed a multi-scale urban flooding risk evaluation technique to address the lack of multi-scale evaluation in urban flooding risk assessment. The technique employs an entropy weighting method for macro-scale flooding evaluation in planning and management, hydrological and hydrodynamic simulations for neighborhood early warning and emergency flooding evaluation in meso-scale, and a disaster loss curve method for flooding evaluation in micro-scale based on damage insurance assessment. Taking Beijing as an example from the perspective of catchment units, Sun Zhe found a significant positive linear correlation between average slope, river network density and inundation depth [7]. Brendel et al. used the SWMM and GSSHA models to compare the hydrological response of two adjacent communities within the City of Roanoke and showed the high value of the ‘SWMM’ model in providing detailed information on the hydraulic conditions of the urban storm drain network [8]. McRoberts and Nielsen-Gammon [9], Wu [10] and Walsh et al. [11] showed an increasing trend in extreme precipitation, precipitation frequency and intensity in the United States. Gambolati et al. used simulations to assess coastal lowland flood risk using rainfall scenarios with different return periods [12]. Husnain et al. obtained critical flood depths by simulating rainfall scenarios with return periods of 5a, 10a, 25a,(The meaning of "a" here is the recurrence period in years. Same as below.) etc. [13]. Hai et al. [14] simulated the flooding of a section of the Tone River in Tokyo caused by Typhoon Catherine in 1974 based on a two-dimensional finite element hydrodynamic model and compared the simulation results with hydrological data to verify the applicability of their model. Junqiang Xia [15] et al. constructed a comprehensive numerical model for estimating flood risk in urban areas based on the finite volume method with unstructured triangular meshes. The two-dimensional hydrodynamic module of the model was validated against the actual flood processes in the urban area of the river based on experimental data, and the model was also applied to the Boscastle 2004 flood simulation. Sarkar et al. conducted simulations of surface runoff, inundation levels, drainage capacity, and the impact of urban flooding on municipal traffic and building structures in four areas of Khulna, Bangladesh, based on the MIKE model [16]. The MIKE software series, known for its user-friendly interface, convenient operation, and powerful pre-processing and post-processing functions, has been favored by many researchers [17,18].
This study utilizes the MIKE FLOOD platform to simulate the impact of superstandard conditions on urban flooding in the central city of Zhoukou with the objective of providing fundamental support for urban superstandard flood defense and planning. Specifically, this research employs inundation depth, extent, and pipeline self-flow into river drainage capacity as indicators to compare and analyze the flooding situation under different return periods and various ephemeral intense rainfall scenarios. Moreover, this study goes beyond traditional approaches by considering the downstream section of the river’s impact on the study area under superstandard flood levels, thus providing a more comprehensive simulation. Notably, the study’s innovation lies in incorporating both superstandard rainfall and superstandard river level as conditions, resulting in a more realistic and informative assessment of the impact of urban flooding.
2. Materials and Methods
2.1. Overview of the Study Area
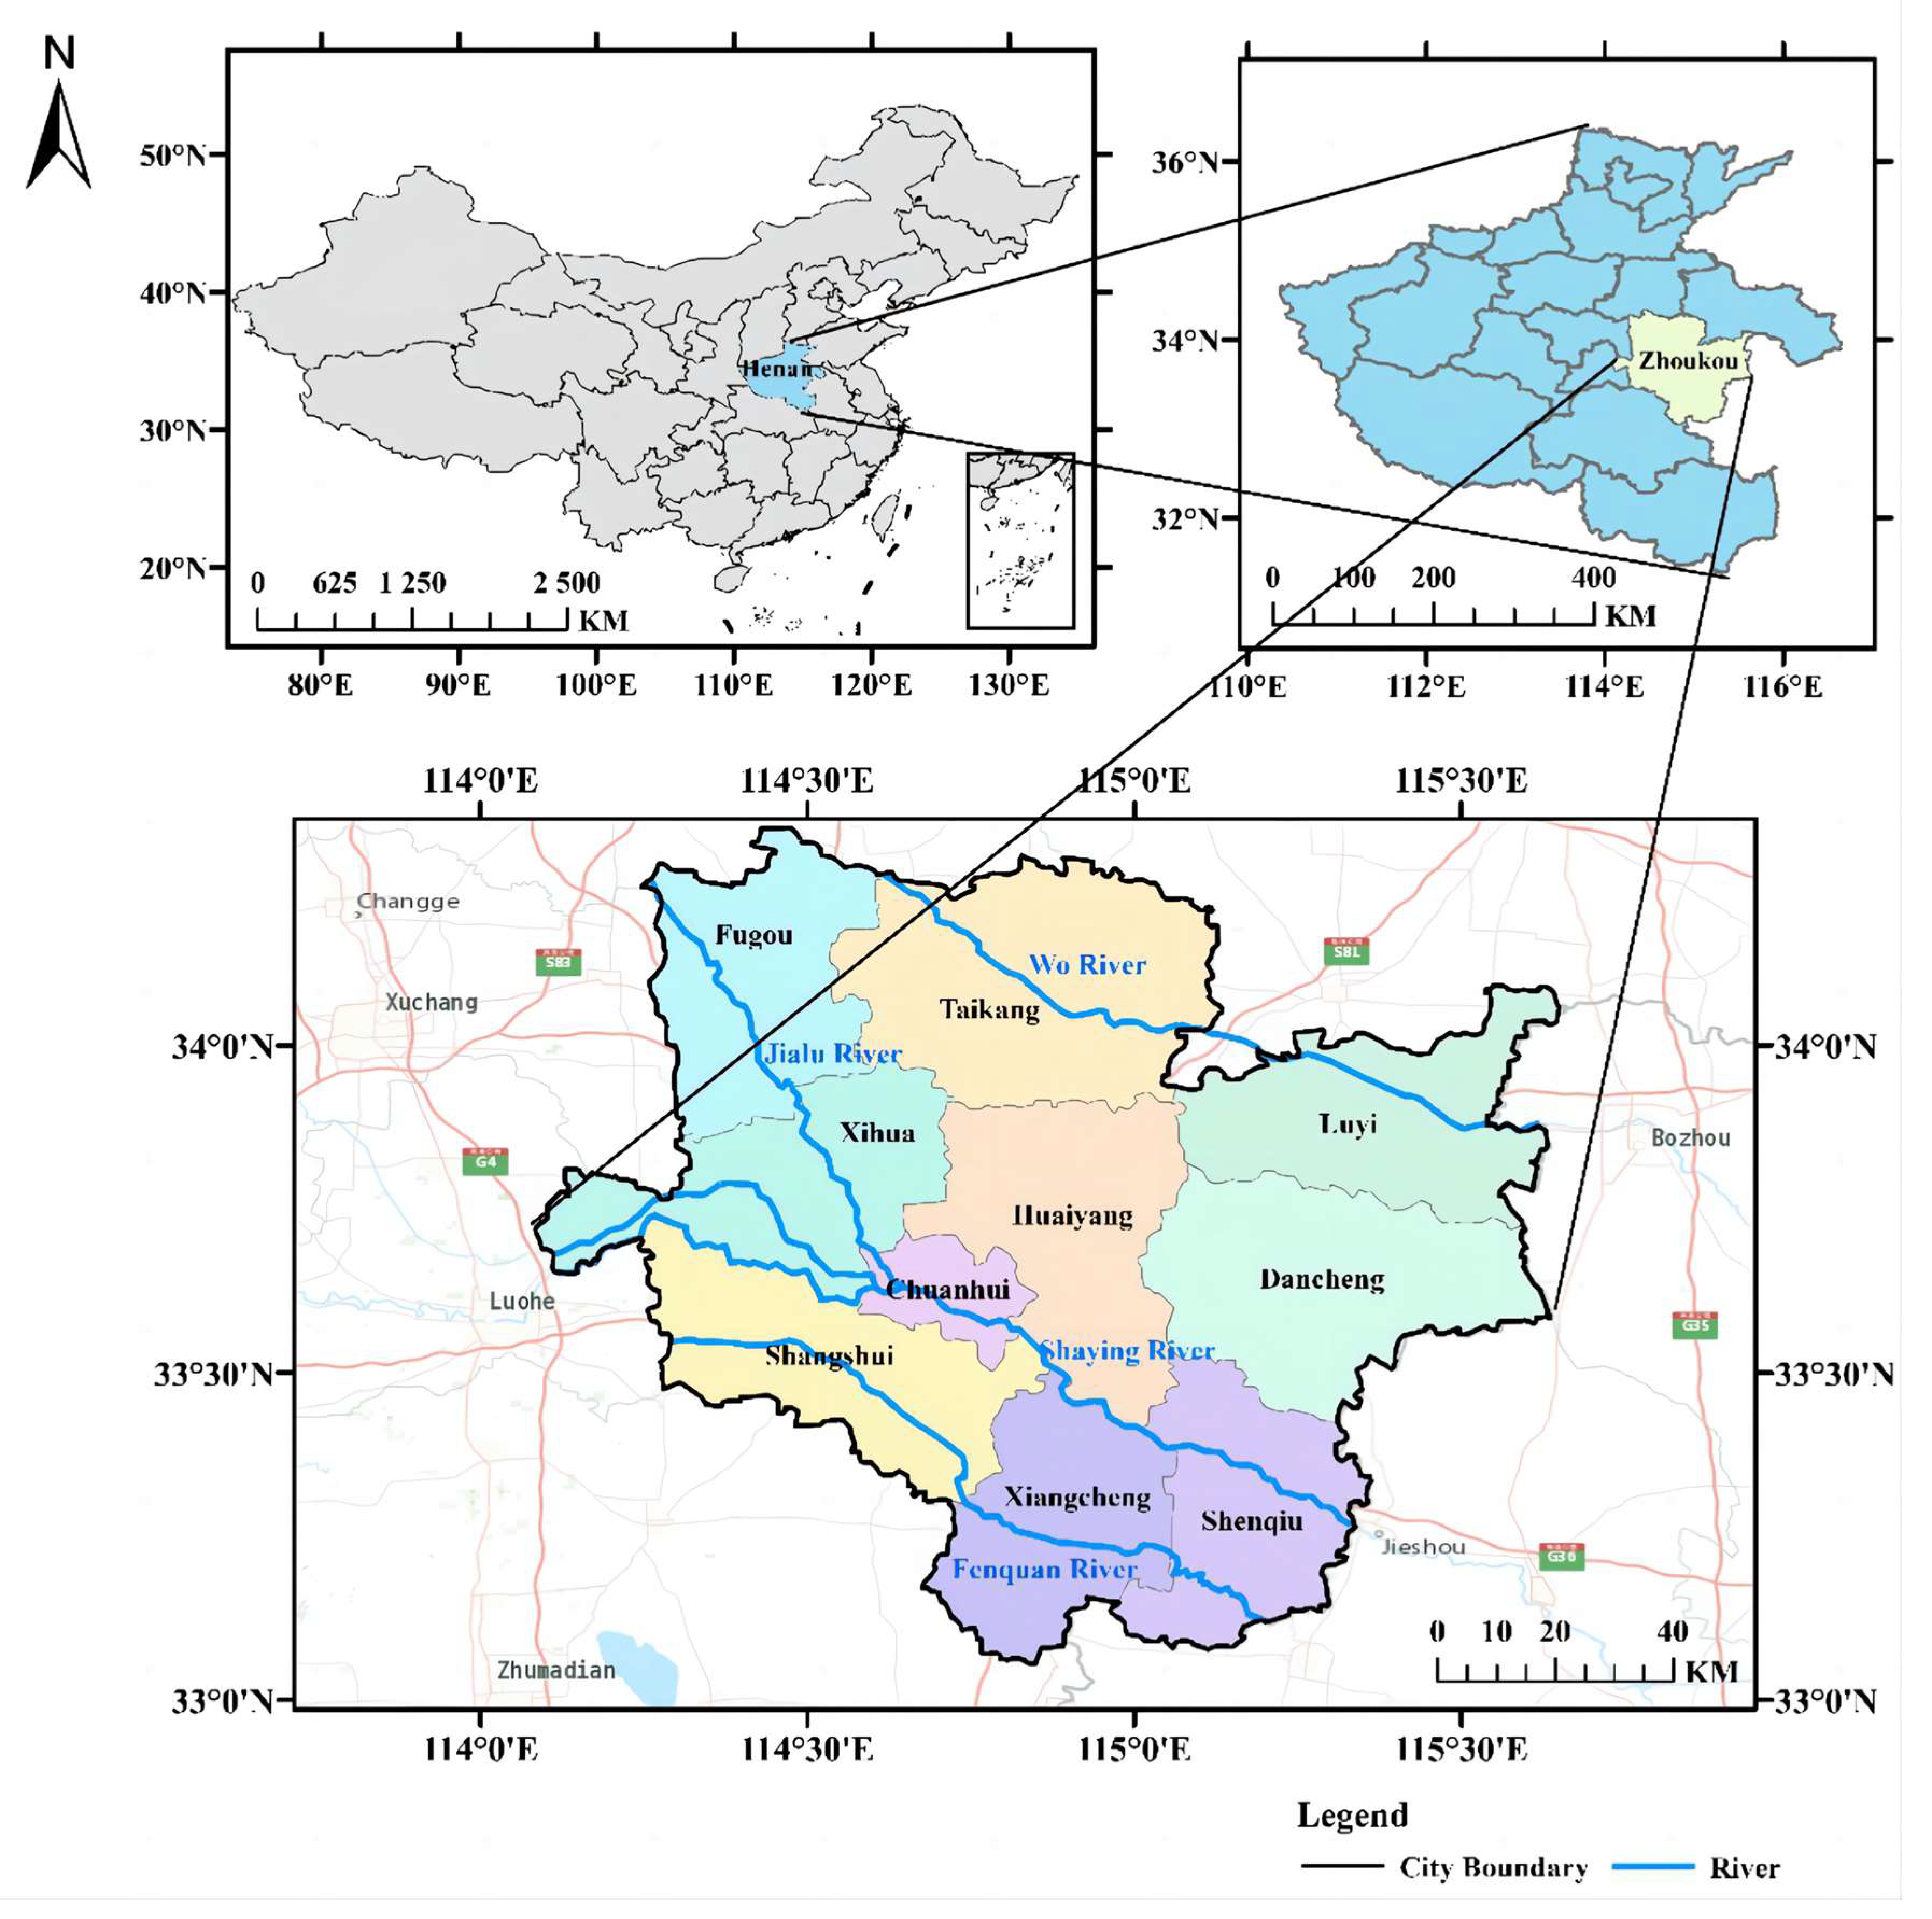
Zhoukou is located in the East Henan Plain in the southeast of Henan Province. The location map of Zhoukou City is shown in Figure 1. Its geographical coordinates are 33°03′–34°20′ north latitude, 114°05′–115°39′ east longitude, 135 km wide from north to south and 140 km long from east to west. Zhoukou’s central city area is south of the Ningluo Expressway, east to the Dagang Expressway, and northwest to the Shangzhou Expressway—the actual area enclosed by three expressways, with a total area of about 271 km2. The area is under the jurisdiction of Qililu Road Office, Hehua Road Office, Chenzhou Street Hui Office, Renhe Office, Xiaoqiao Office, Taihao Road Office, Li Bukou Township, Xuwan Township, Jinhai Road Office, Huaihe Road Office, Chengnan Office, Chengbei Office, and Movingkou Office. The current urban construction land area is about 70 km2; the rest is mainly agricultural land and village construction land.
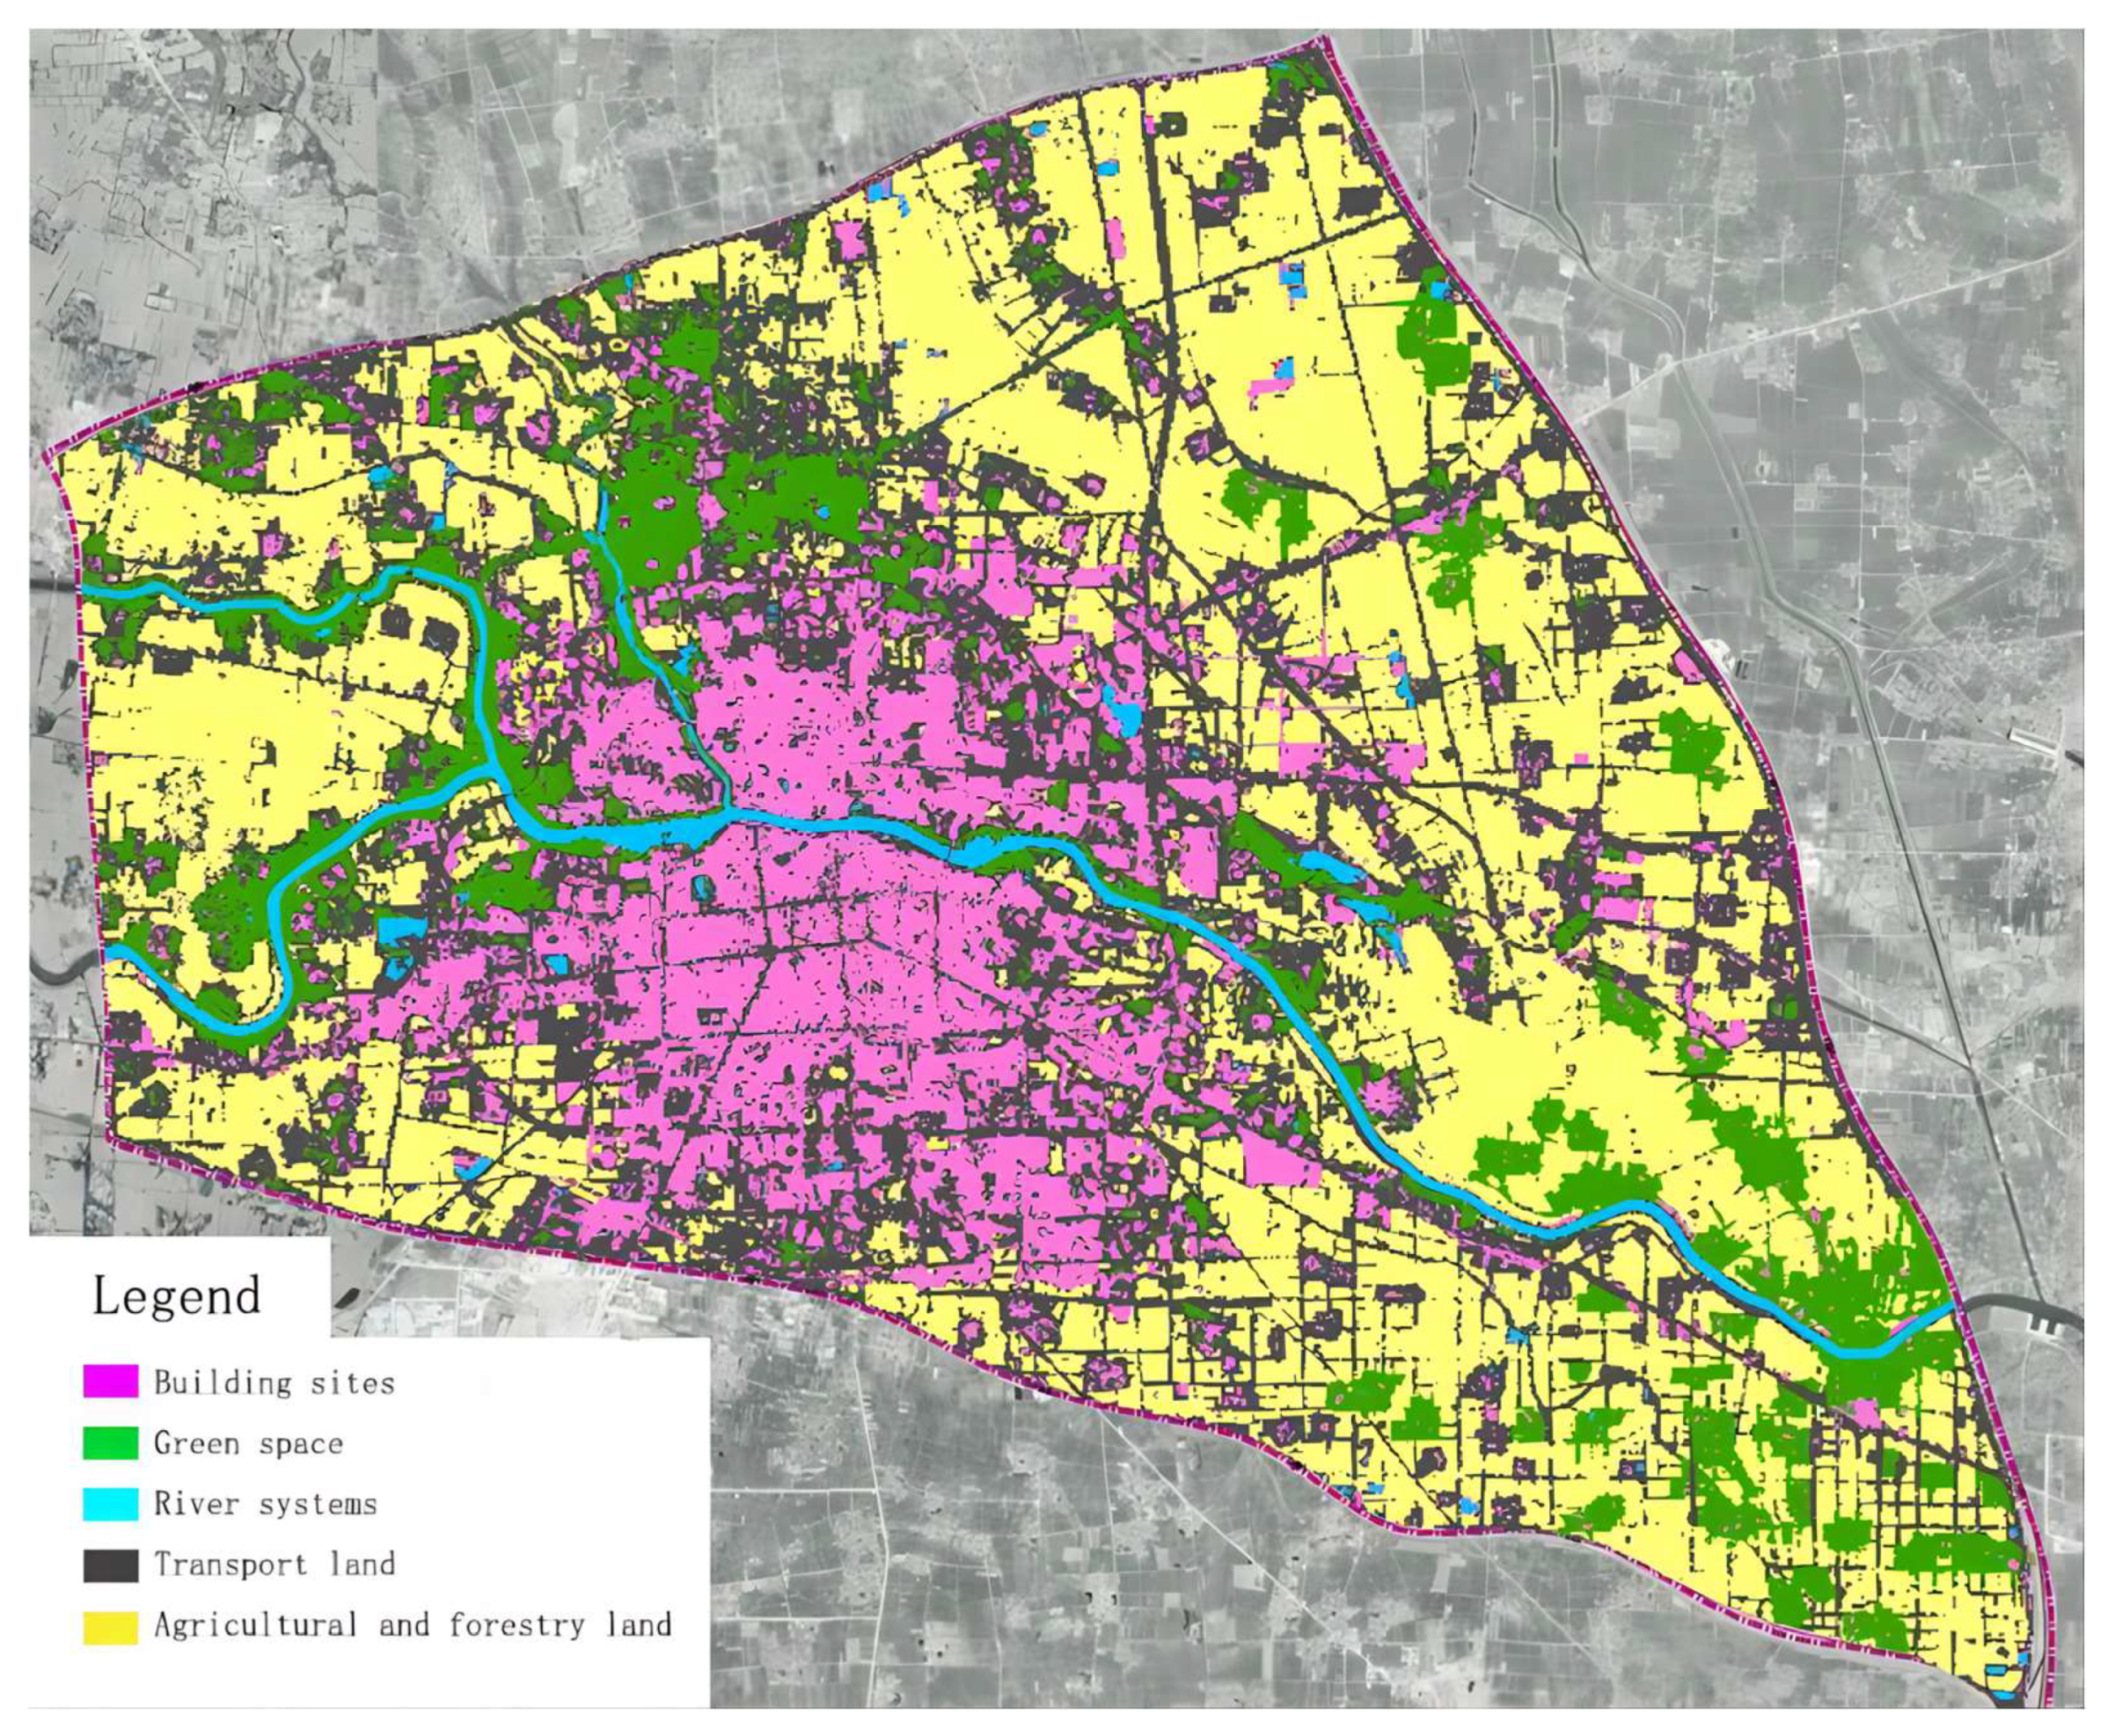
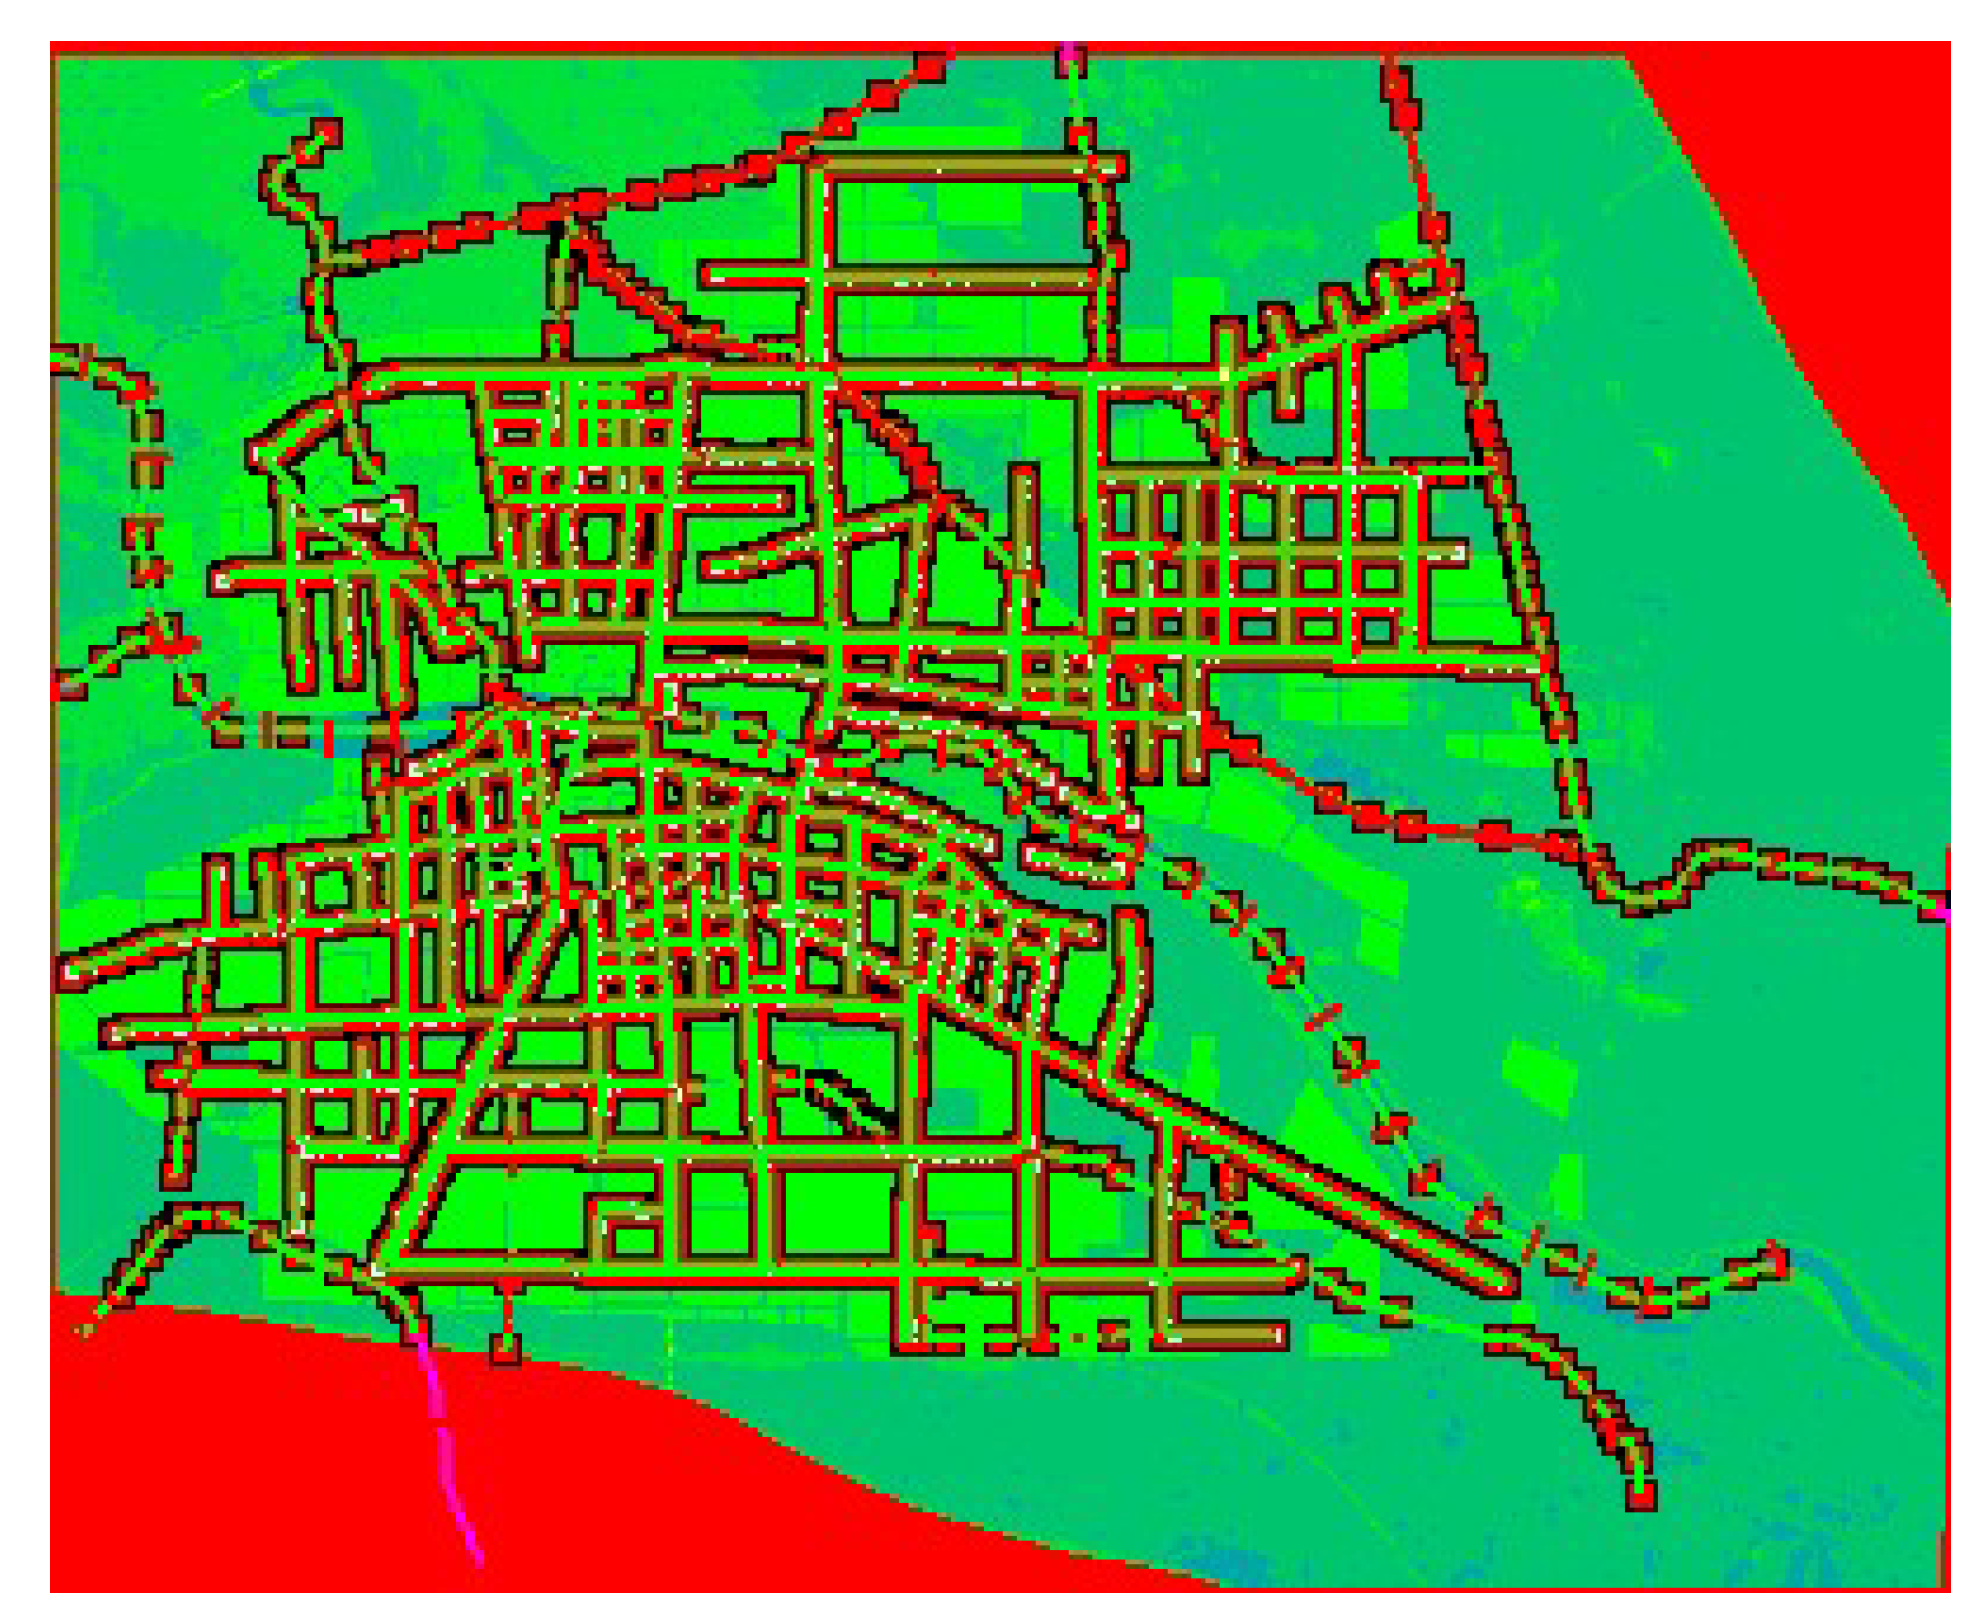
The analysis of the current situation of Zhoukou city in the urban built-up area shows that the proportion of hardening of the lower mat surface is high, and the indicators for green areas and squares are obviously low, accounting for about 4% of the total urban land, with less than 5 m2 per capita, which is far below the indicator of 10 m2 per capita. The current situation of Zhoukou city’s central urban area is shown in Figure 2.
2.2. Basic Data
2.2.1. Basic Geographic Data
The basic geographic data includes a 1:1000 electronic topographic map of the central city of Zhoukou, major layers such as settlements, road traffic, buildings, farmland vegetation, river systems, embankments and green areas, topography and landforms, river systems and traffic roads in the Chuanhui district of the central city of Zhoukou.
2.2.2. Lower Bedding Surface Information
The surface runoff of urban rainfall is mainly influenced by rainfall intensity and the subsurface characteristics. This study employed a combination of field surveys, large-scale topographic maps, and high-resolution remote sensing images to analyze the subsurface conditions within the planning area of the central city of Zhoukou. Based on the types of land cover such as water bodies, green areas, roads, construction land, and bare land, the subsurface was classified into five major categories. See Table 1 for details.
2.2.3. Drainage Network
Zhoukou city has a total of 769 km of drainage pipes, including 423 km of rainwater pipes and 346 km of sewage pipes, with pipe diameters of 800~1800 mm. Overall, 110 drainage outfalls are counted, including 38 in the traffic main canal, 9 in the Yangnao main canal, 13 in the Yunliang River, 16 in the Wachong Ditch, 19 in the Liusha River, 4 in the Happiness River, and 11 in other rivers and ponds.
2.2.4. River Information
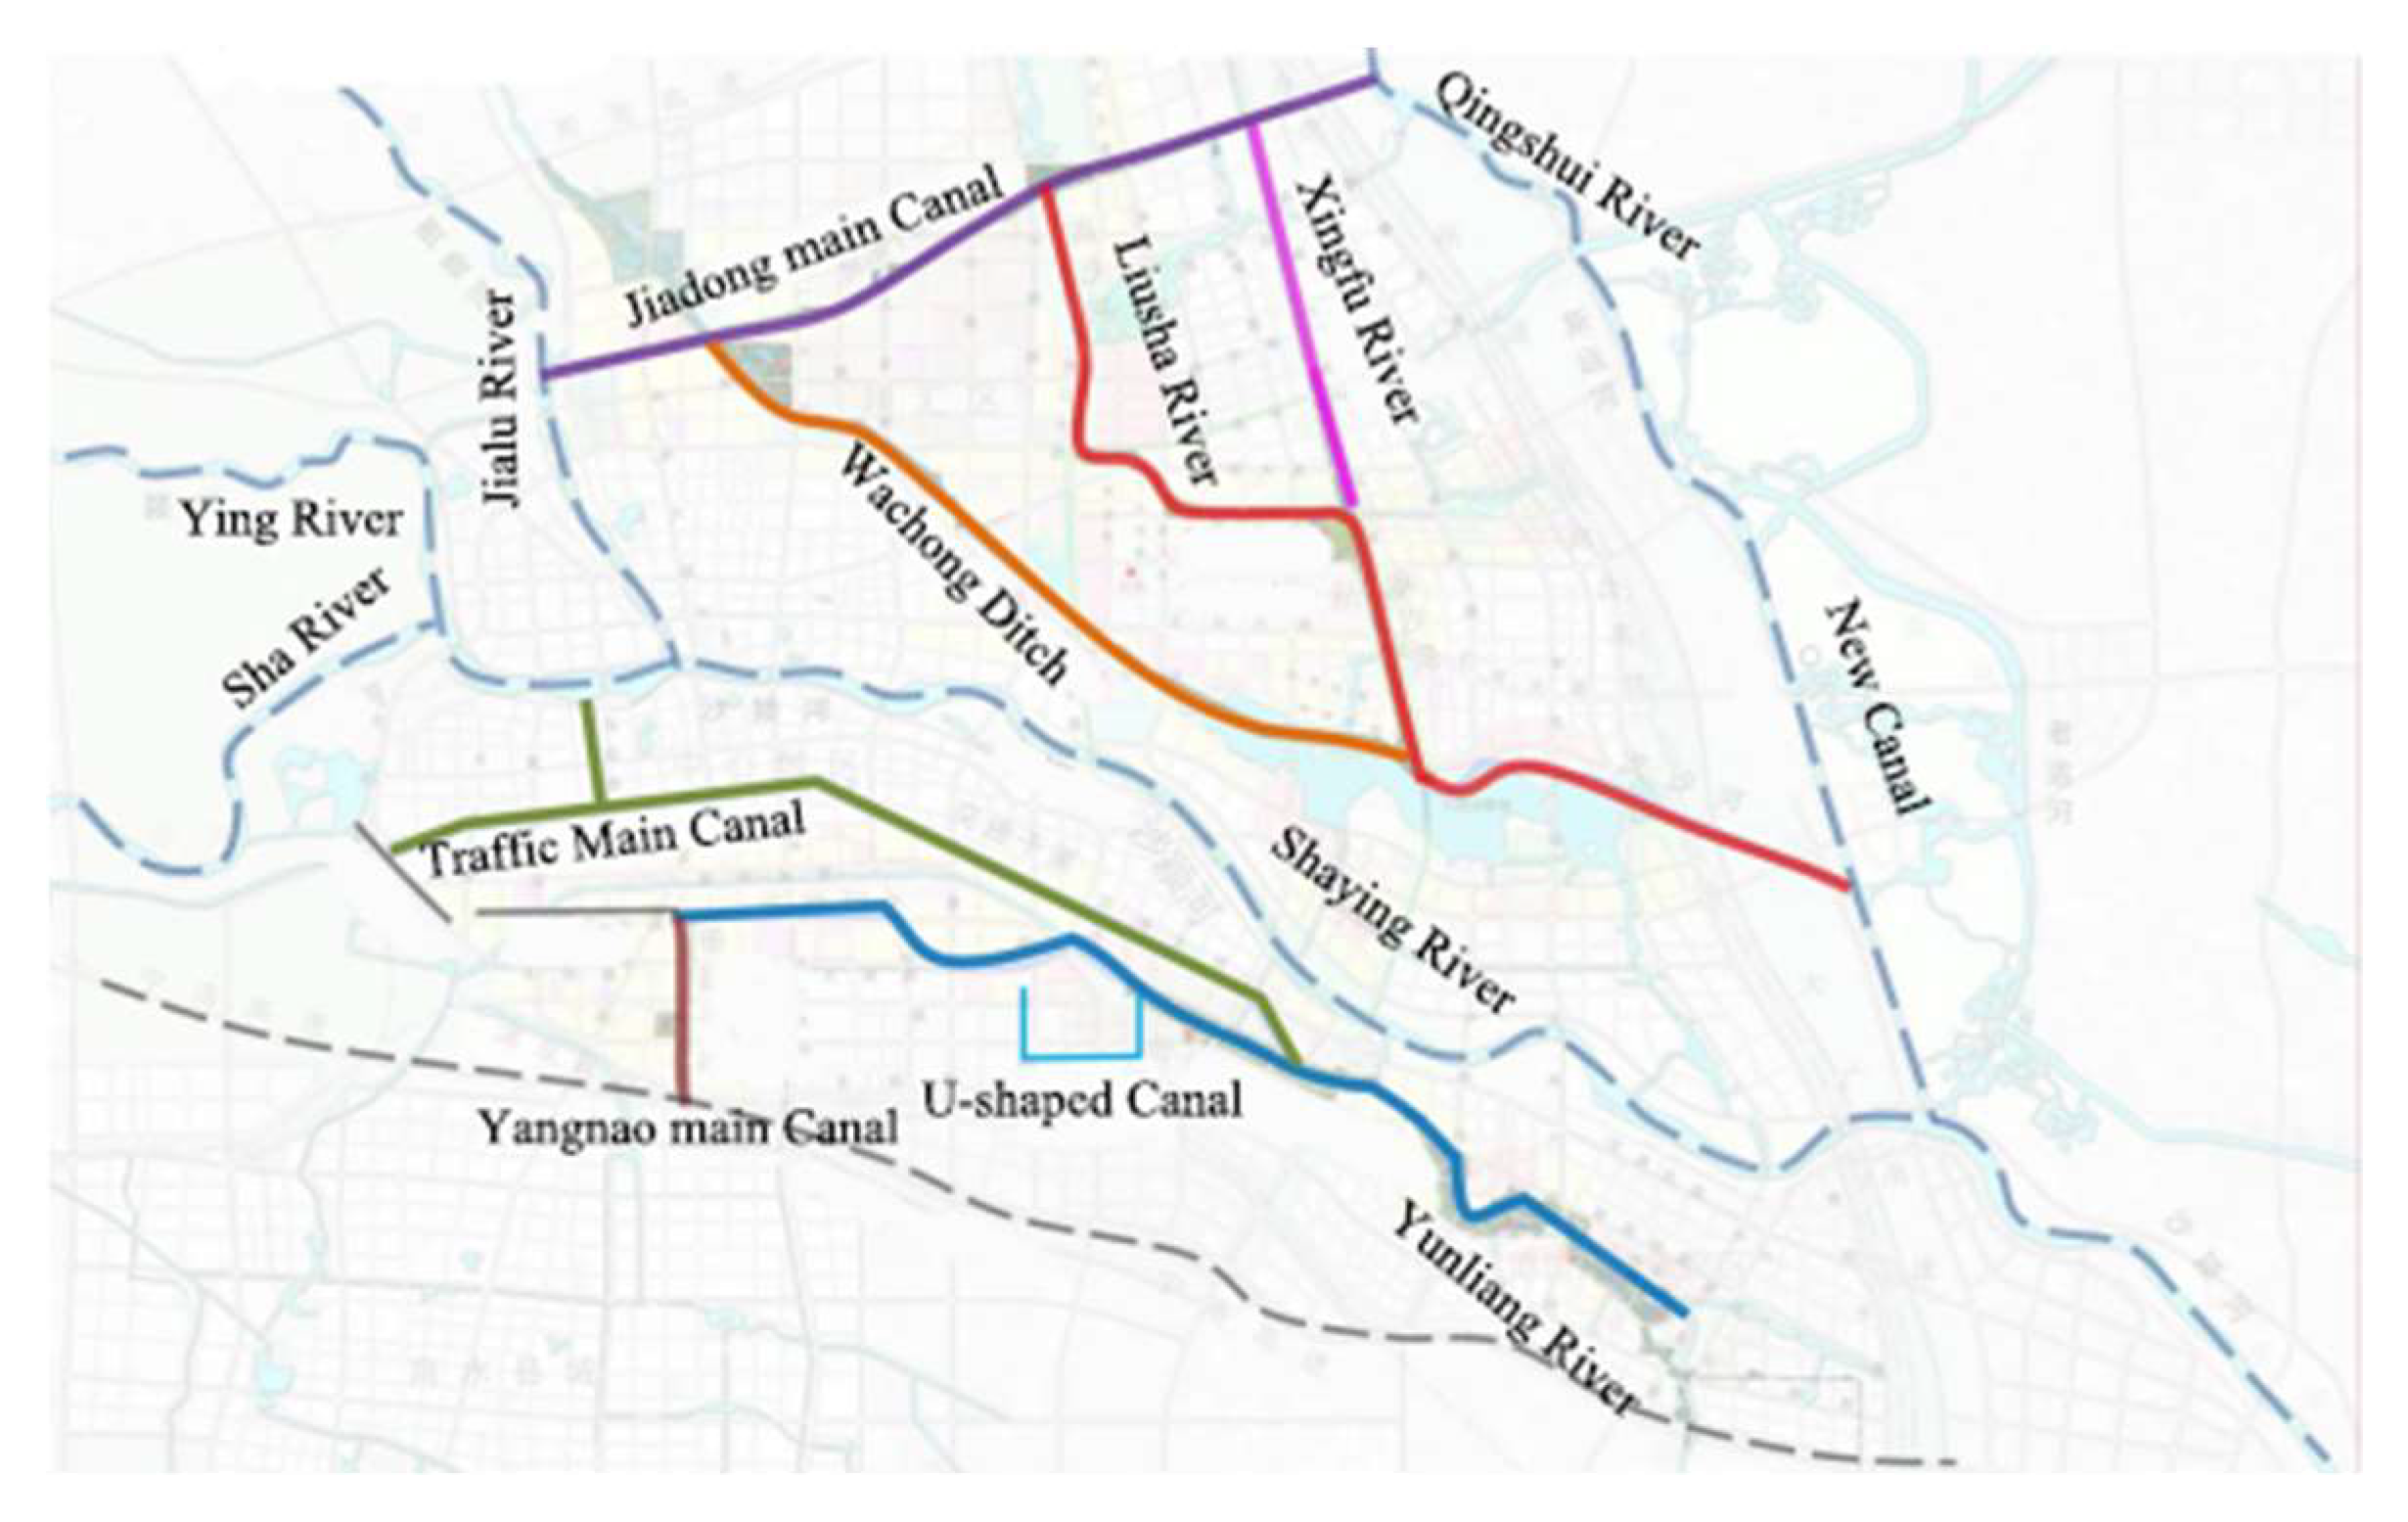
The main stormwater receiving water bodies in the central city of Zhoukou are the Wachong Ditch, Jialu River, Shaying River, the Jiaoying River, the Traffic Main Canal, the Qingshui River, the Yangnao Main Canal, the North–South Main Canal, the Yongfeng Main Canal, the U-shaped Canal and the Yunliang River, among more than ten other rivers and canal. Rainwater discharge in the central city of Zhoukou mainly relies on facilities such as roadside covered drains or concealed pipes and culverts buried under roads to collect and convey rainwater, which is then discharged into the rivers and canals in the city, which eventually merge into the Wachong Canal, the Happiness River, the Yunliang River, the Jiadong Main Canal and the Qingshui River, before being discharged into the Shaying River. See Figure 3 for the river system.
2.3. Design Storm Calculations
2.3.1. Storm Intensity Formula
Storm intensity equation for the central city of Zhoukou
Mean absolute standard deviation: 0.039 mm/min.
Mean relative standard deviation: 4.92%.
In the formula, q is the intensity of the storm (L/(s·hm2), q = I × 10,000/(60 t).
I indicates precipitation (mm);
t is the duration of the rainfall (min),Range of values from 5–180 min;
P is the recurrence period, Range of values from 2–100a.
2.3.2. Design Storm Extrapolation
The Chicago rain pattern, also known as the K&C rain pattern, is a non-uniform design rain pattern introduced by Keifer and Chu in 1957 [19]. Short-term precipitation processes are based on storm intensity equations and peak position coefficients for specified ephemeral and recurrence periods [20].
Using the Chicago rain pattern as the design rain pattern for this occasion, firstly, the parameters of the storm intensity formula are determined; then, the rain intensity of the rising section (pre-peak) and falling section (post-peak) are calculated separately using the formulae listed below for certain minute moments, and finally, the instantaneous rainfall process line is obtained.
In the formula, a, b and c have the same meaning as in the formula for storm intensity. r is the moment when the rain peak occurs, b is the pre-peak rain intensity, ia is the post-peak rain intensity, tb is the pre-peak rainfall calendar time and ta is the post-peak rainfall calendar time.
The values of the relevant parameters in the Chicago rainfall model are all consistent with the storm intensity equation except for the peak location r, which is a new parameter, but this parameter will have a large impact on the simulation results, which is mainly due to the fact that the pipe itself has a large internal storage space, which causes more runoff to overflow onto the ground because the rainfall exceeds the drainage capacity of the pipe. The peak location parameter ‘r’ is typically found to be between 0.3 and 0.5 based on a large amount of domestic and international information. To ensure safety, this planning uses a peak location of r = 0.5 to derive the design rainfall situation.
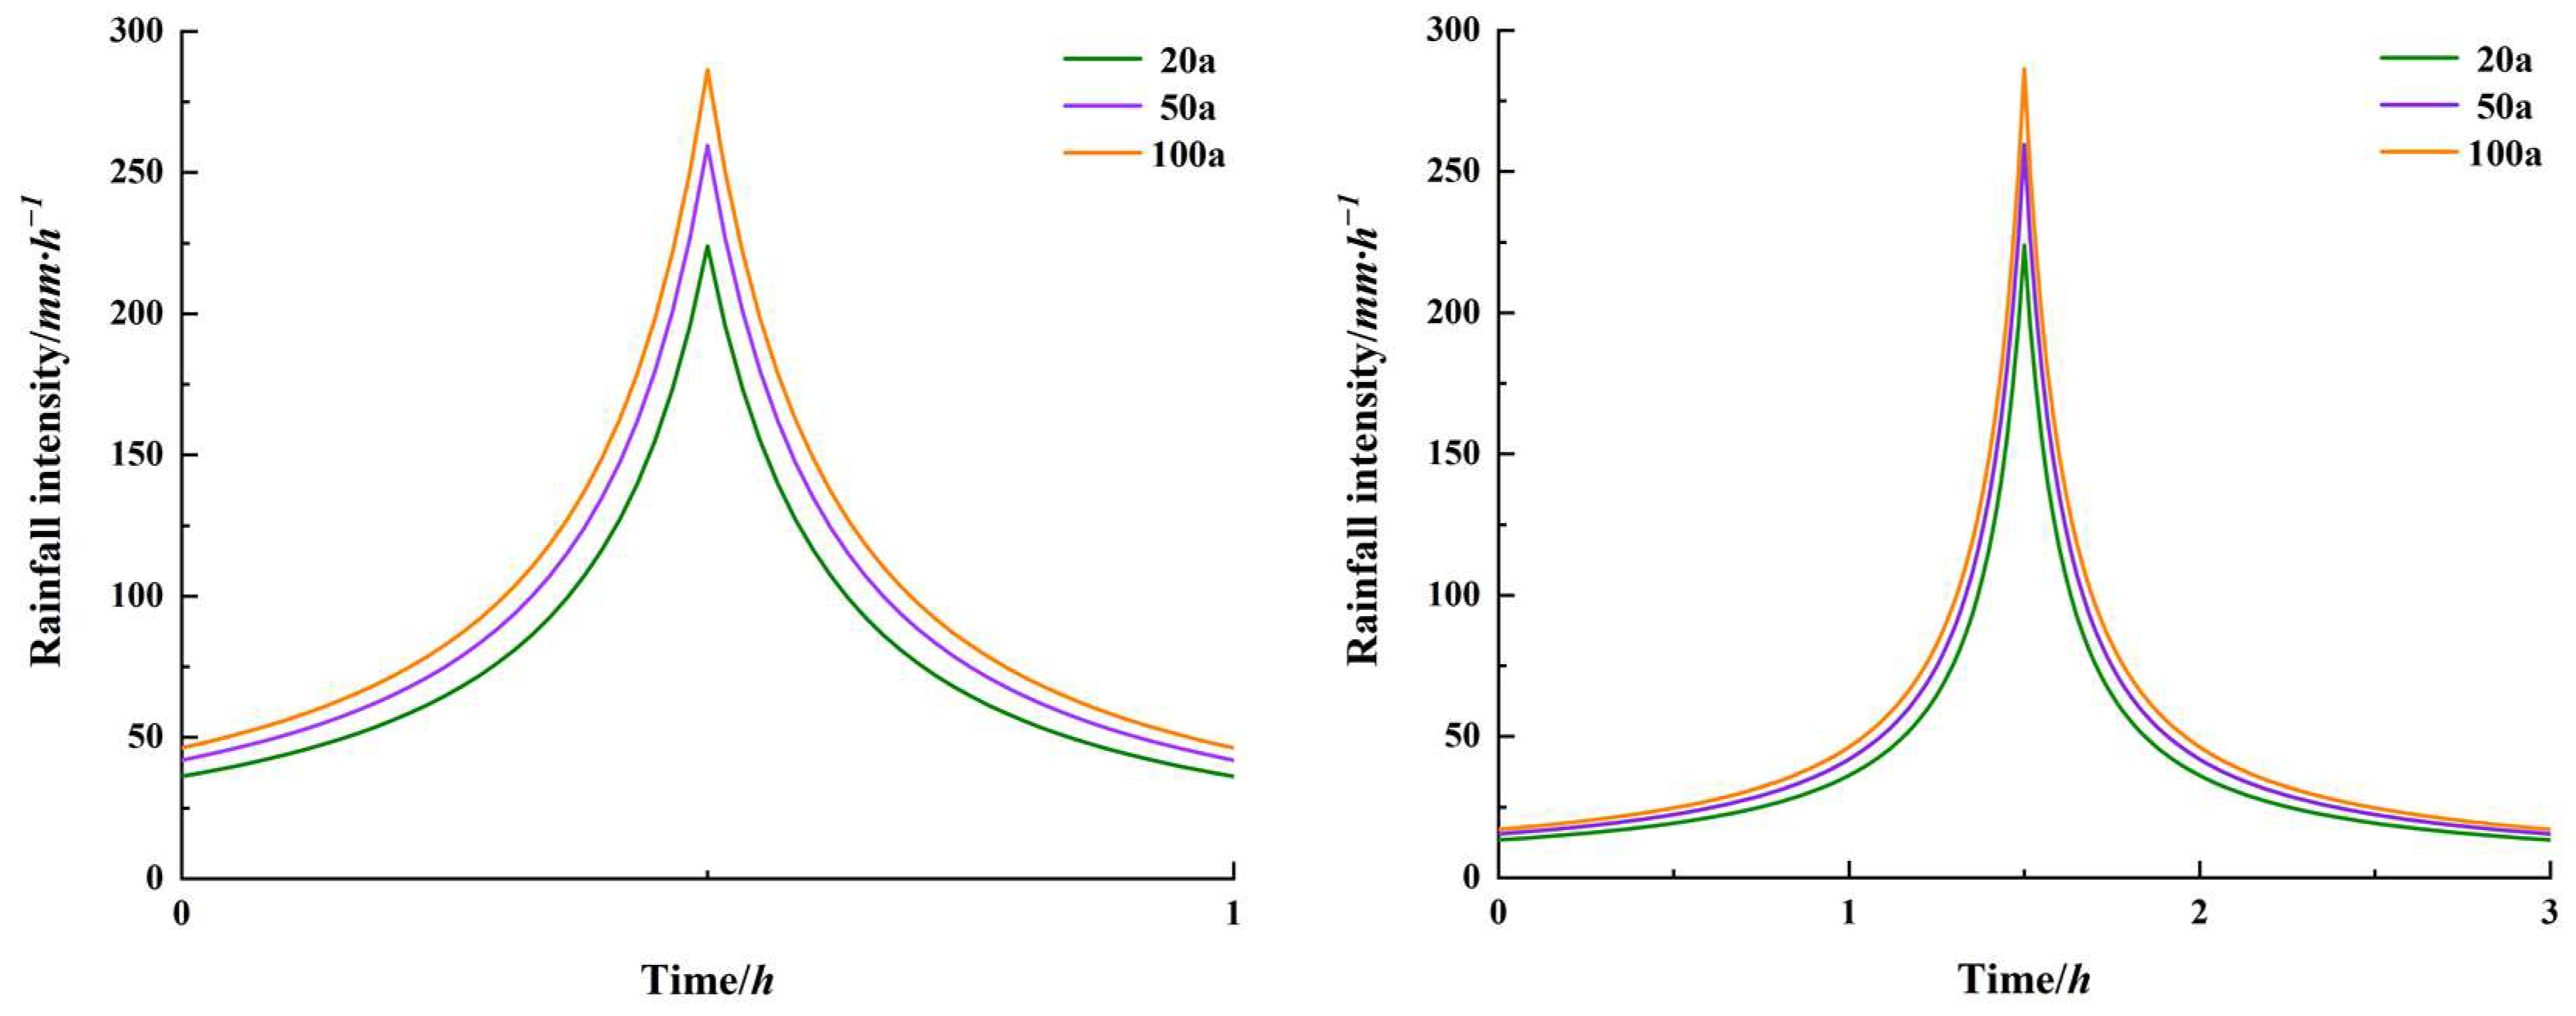
According to the above method to derive the 20-year rainfall for 1 h and 3 h epochs, the peak rainfall is 223.95 mm/h, and the total precipitation is 82.37 mm and 123.97 mm, respectively; there is 50-year rainfall lasting 1 h and 3 h, with peak rainfall of 259.47 mm/h and total precipitation of 95.44 mm and 143.64 mm, respectively. The 100-year rainfall lasted for 1 h and 3 h, the peak rainfall was 286.344 mm/h, and the total precipitation was 105.32 mm and 158.51 mm, respectively. The design rainfall is shown in Figure 4.
2.4. River Flooding
The design standard for rivers in the central city of Zhoukou is 10 years and 20 years. Under extreme conditions river flooding conditions, the flowing sand river itself basin and the new canal have a 20-year flood at the same time; at this time, the flood level of the new canal is higher than the flowing sand river, and the flowing sand river discharges into the new canal by the high water level of the top support effect, making the water level of the flowing sand river 1–2 m higher than the two banks.
2.5. Urban Flooding Model
The urban flooding models include the MIKE 11 1D river hydrodynamic model, the MIKE URBAN 1D stormwater network model and the MIKE 21 2D surface diffuse flow model. The steps for building the flood analysis model are as follows.
- (1)
- Constructing a one-dimensional river hydrodynamic model of the Sha Ying River, Jialu River and inner rivers in the urban area.
- (2)
- Constructing a two-dimensional hydrodynamic production and confluence model for the central urban area of Zhoukou City, analyzing the flooding process of internal and external flooding on the ground in the central urban area of Zhoukou City, andconsidering the difference in demand for different types of sites within the simulation area, while fitting the actual inundation of urban inundation.
- (3)
- Constructing a model of the drainage network in the central city of Zhoukou according to the actual construction of the drainage network in the central city of Zhoukou, focusing on the simulation and analysis of the drainage process of the underground pipe network in the city.
- (4)
- Finally, according to the requirements of each flood analysis scheme, the above models are coupled to construct a coupled flood analysis model, and the calculation results of the model are analyzed.
2.5.1. MIKE 11
The one-dimensional river hydrodynamic model will simulate the evolution of floods within the main and tributary streams through the generalization of the river channel within the study area. According to the model requirements, the centerline and river cross-sections within the central city are extracted, a river network is established and river crossings are identified. The rivers in the central city study area include the Sha River, Ying River, Shaying River, Jialu River, Yunliang River, Jiadong Main Canal, Liusha River, Happiness River, Wachong Ditch, Jiaotong Main Canal, Yangnao Main Canal and U-shaped Canal, totaling 12 rivers.
2.5.2. MIKE URBAN
MIKE URBAN mainly includes rainfall runoff simulations and pipe network hydraulics simulations. The actual stormwater network is generalized into a pipe network model via Arcgis, and the relevant attributes of the inspection wells and pipes are checked and refined through the data topology. The pipe network model consists of 11,029 inspection wells, 5526 pipes, and 11 pump stations.
2.5.3. MIKE 21
The construction of the 2D surface diffuse flow model consists mainly of the construction of the underlying terrain and the processing of the subsurface data. The dem terrain data are mainly processed by Arcgis and converted to the ASCII text format, overlaying land use data such as buildings, roads, green spaces etc. on the terrain. The area simulated by the two-dimensional surface diffuse flow model in the central city of Zhoukou is about 145.75 km2, using a rectangular grid with a grid size of 2 m × 2 m, resulting in a total of 3.64 × 10⁷ grid cells with an area of 4 m2 each
2.5.4. Coupling Models
Based on the MIKE FLOOD platform, a 1D river hydrodynamic model, a 1D stormwater pipe network model and a 2D surface diffuse flow model are coupled to construct a flooding model for the central city of Zhoukou. See Figure 5 for a schematic diagram of the coupling links.
2.6. Model Calibration and Validation
This paper takes the period of 20 July 2021 in Zhoukou City as an example, choosing 20 major waterlogging points in the central city, and the distribution of waterlogging points is shown in Figure 6. The measured maximum ponding depth data were compared with the maximum ponding depth simulated by the numerical model, as shown in Table 2.
The comparison between the simulated and measured ponding depths shows a good agreement with a difference of less than 6 cm. This indicates that the model parameters and validation results are reasonable, and the degree of fit is high, accurately reflecting the actual situation.
3. Results and Discussion
3.1. Flood-Prone Spots
Flood-prone spots are an important object of study, and urban flood prevention is the main goal of prevention and control. The analysis of the results for the 1-in-20-year calendar 1 h and 3 h, 1-in-50-year calendar 1 h and 3 h and 1-in-100-year calendar 1 h and 3 h shows the depth and area of water at the main flood prone points in Table 3 and Table 4.
The main reasons for the analysis of the above-mentioned flood-prone points are:
- (1)
- Inadequate drainage capacity of pipes
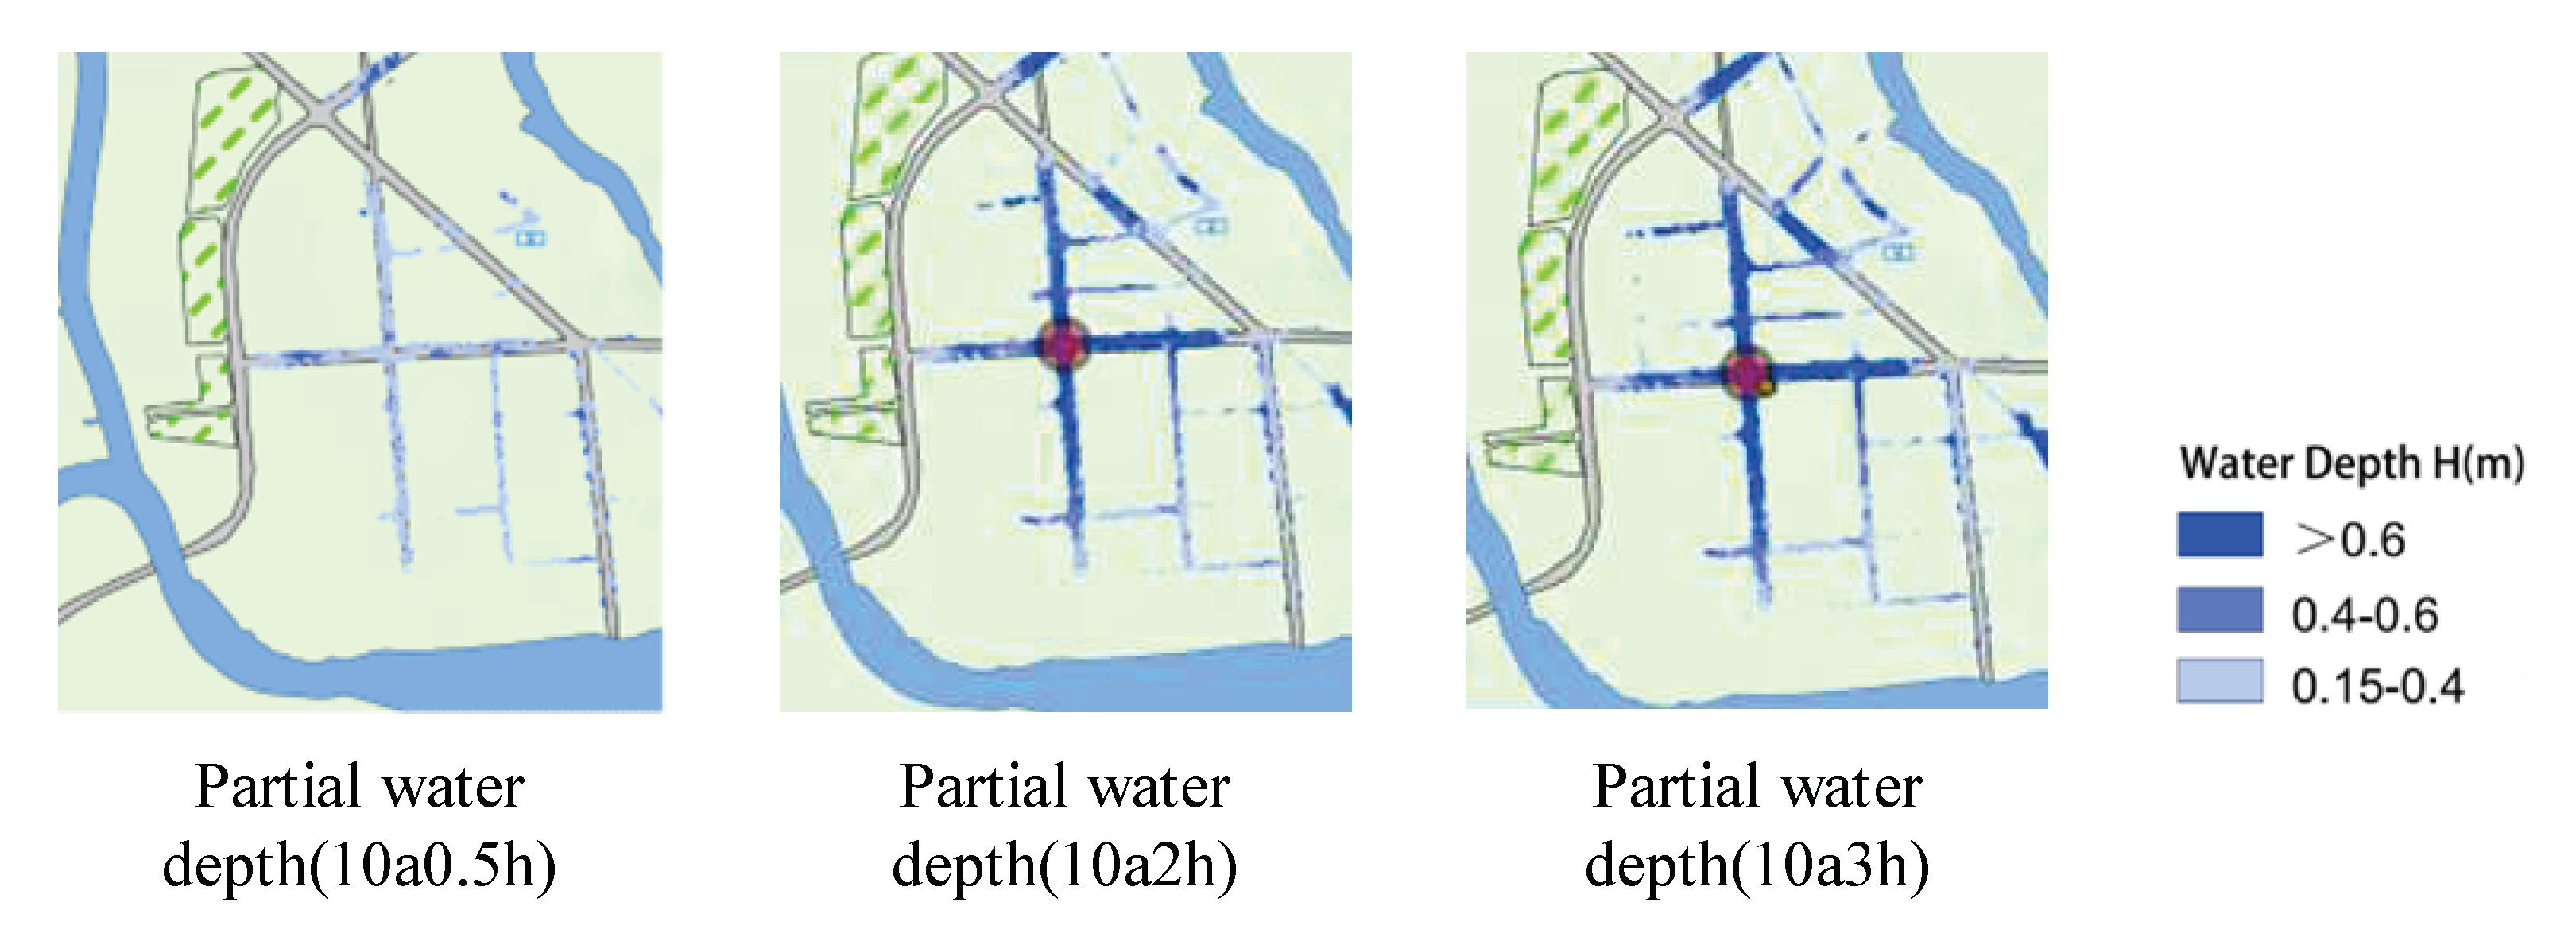
For example, near the intersection of Yinzhu Road and Construction Road, precipitation in the area is discharged to the Jalu River via a stormwater pipe via the Dongfengdi drainage pumping station. There is gradual waterlogging when the once-in-a-decade rainfall lasts for more than two hours. See Figure 7 for a map of the water depth at this condition. The diameter of the rainwater pipes in the area is 600–800 mm. There is maximum power of 3.78 m3/s at the current state of the Dongfengdi drainage pumping station. It can be seen that the main reason for the water on the roads when the pumping station is not operating at full power is that some of the catchment network pipe diameters do not meet the actual drainage of the urban area.
- (2)
- Inadequate pumping and drainage capacity of pumping stations
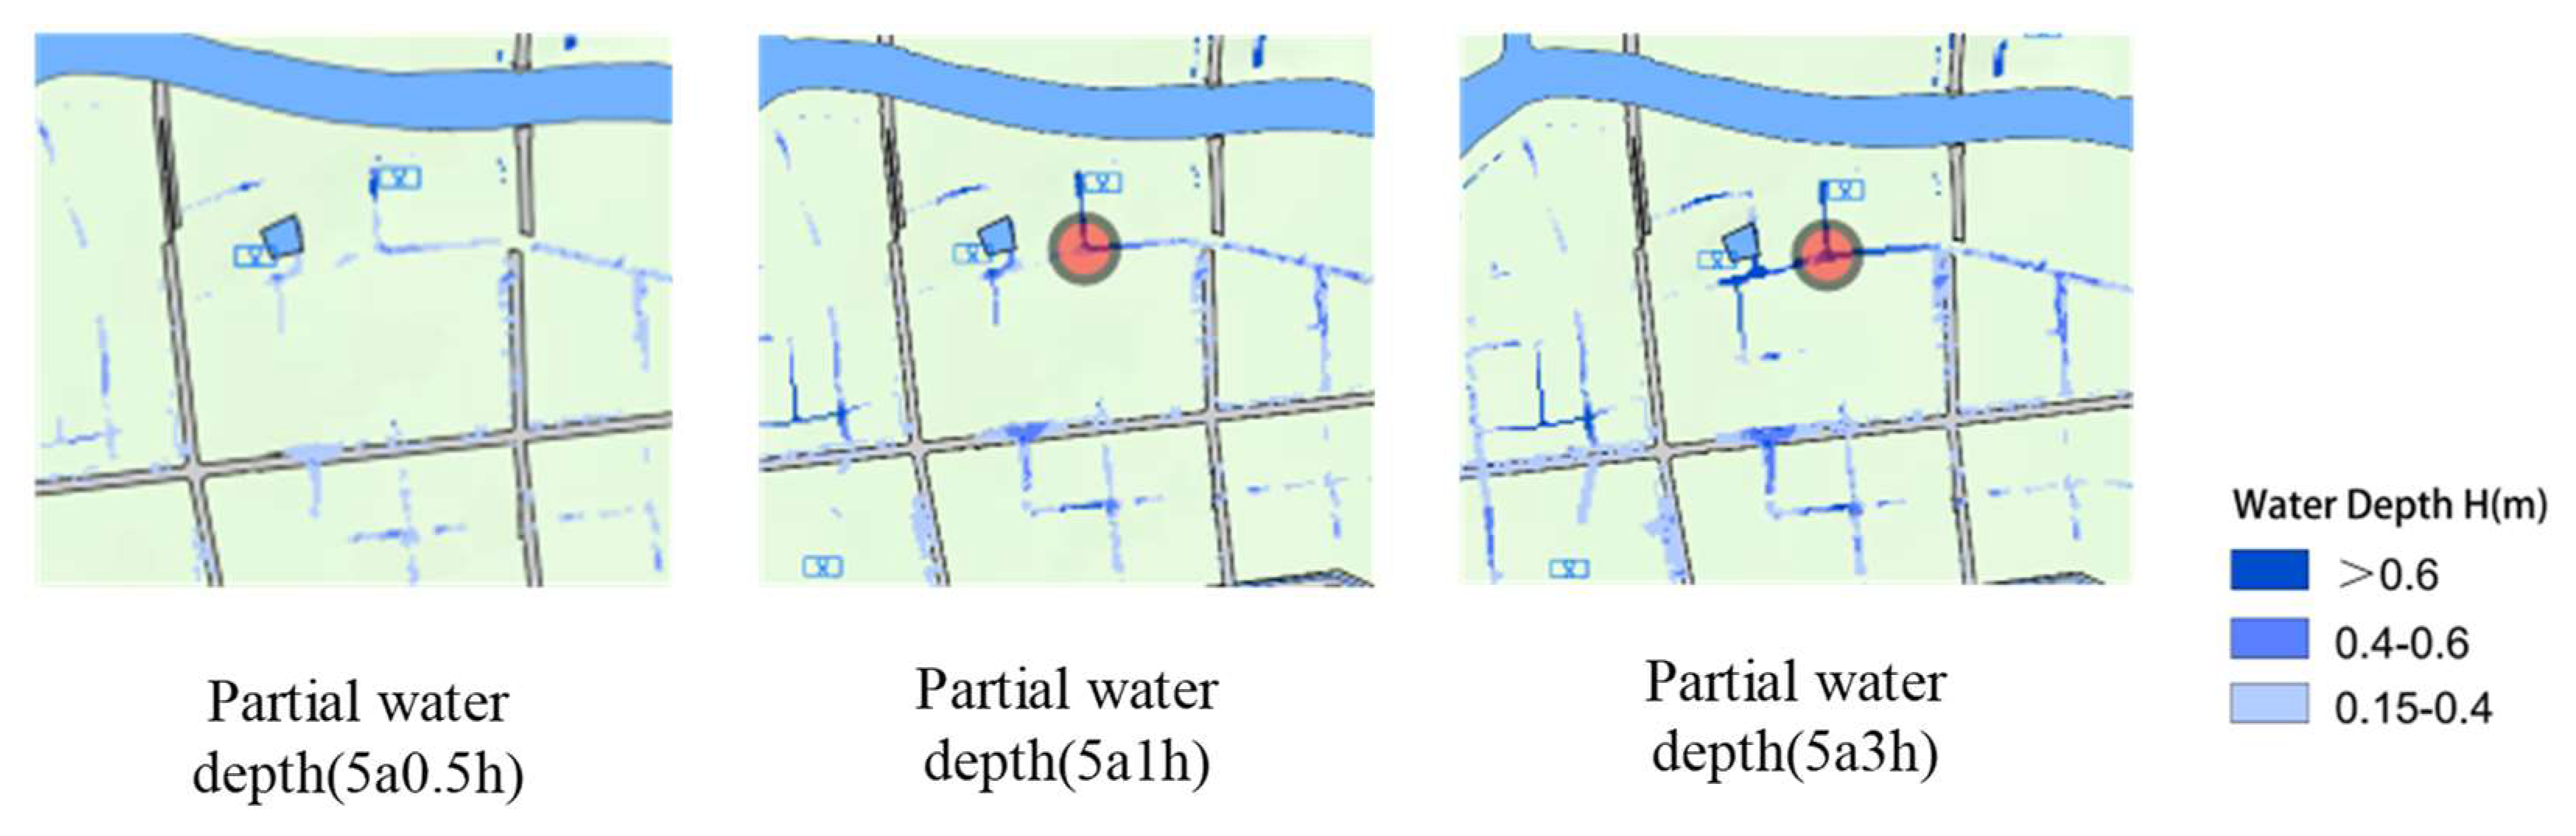
For example, in the area around Sanlian Hang, precipitation in the area is discharged via rainwater pipes to the Sha Ying River via the San Lian Hang rainwater pumping station. When the five-year rainfall reaches one hour or more, the water accumulation becomes progressively more severe. See Figure 8 for a map of the water depth at this condition.There is maximum power of 1.73 m3/s at the current state of the Sanlian Hang Stormwater Pumping Station. When the rainfall is 62.61 mm (five-year rainfall lasts for one hour), the Sanlian Hang Stormwater pumping station has been working at full power, but there is still waterlogging, indicating that at this time, the pumping station pumping capacity is insufficient to meet the actual drainage of the area.
- (3)
- Low-lying terrain
For example, near Zhoukou Normal College, as the elevation of the east and west sides of Wenchang Avenue is higher (the elevation of the west side is between 47.7 and 48.2 m and the elevation of the east side is between 47.2 and 47.7 m, while the elevation of the middle is lower than the sides and rainfall tends to collect in the low areas), water accumulation in the middle is more serious.
- (4)
- Reduced pipeline self-flow capacity into the river
Rainwater in the area near Daqing Road North and Taiqing Road flows through pipes to the Wachong ditch. The rainwater pipes have a diameter of 600–1000 mm. When the water level at the Wachong Ditch discharge is high, the pipe discharge is subjected to top wash, which impedes drainage capacity.
3.2. Analysis of Pipeline Self-Flow Capacity under Flooding in Oversized Rivers
A 20-year flood occurred at the same time in the New Canal and the Liusha River, and the flood level at the mouth of the Liusha River into the New Canal was 47.66 m. This caused the water level in the Liusha River and the Wachong Ditch to be higher than the two banks, and the phenomenon of a diffuse dike appeared. Due to the high water level of the river, there was a top-supporting effect on the self-flow outlet of the pipeline, and the discharge capacity was reduced.
- (1)
- Daqing Road Drainage Outlet
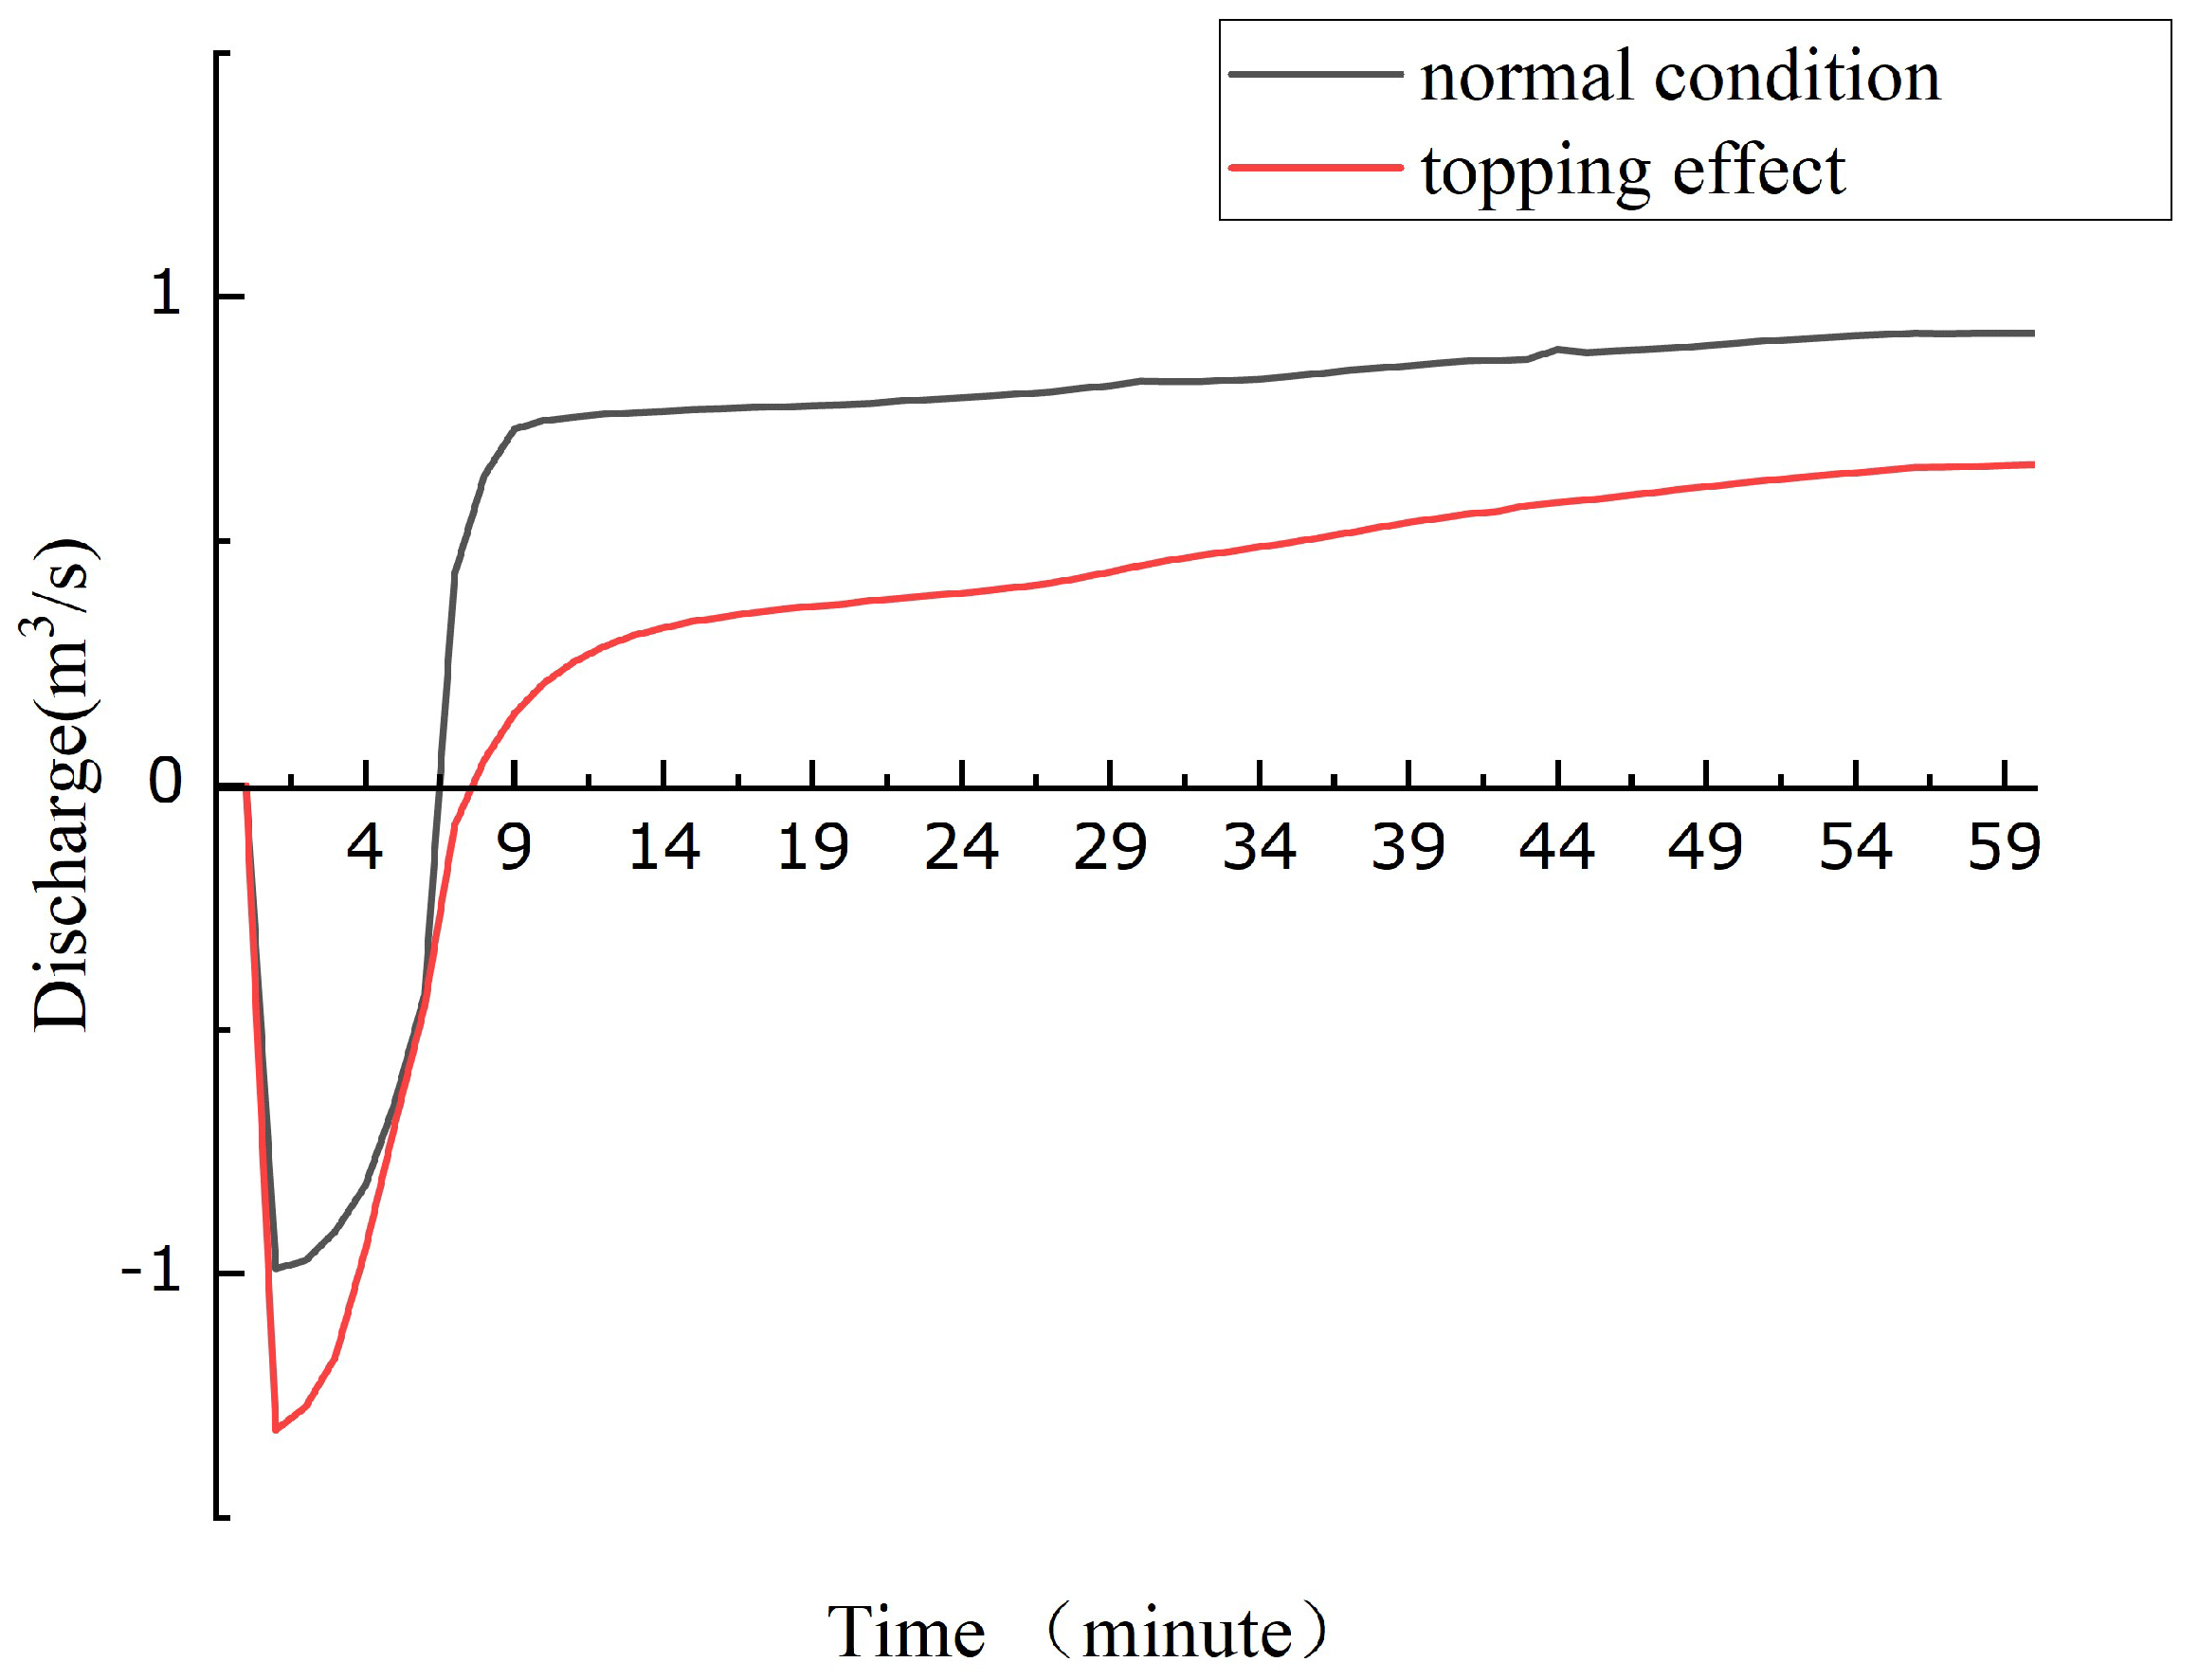
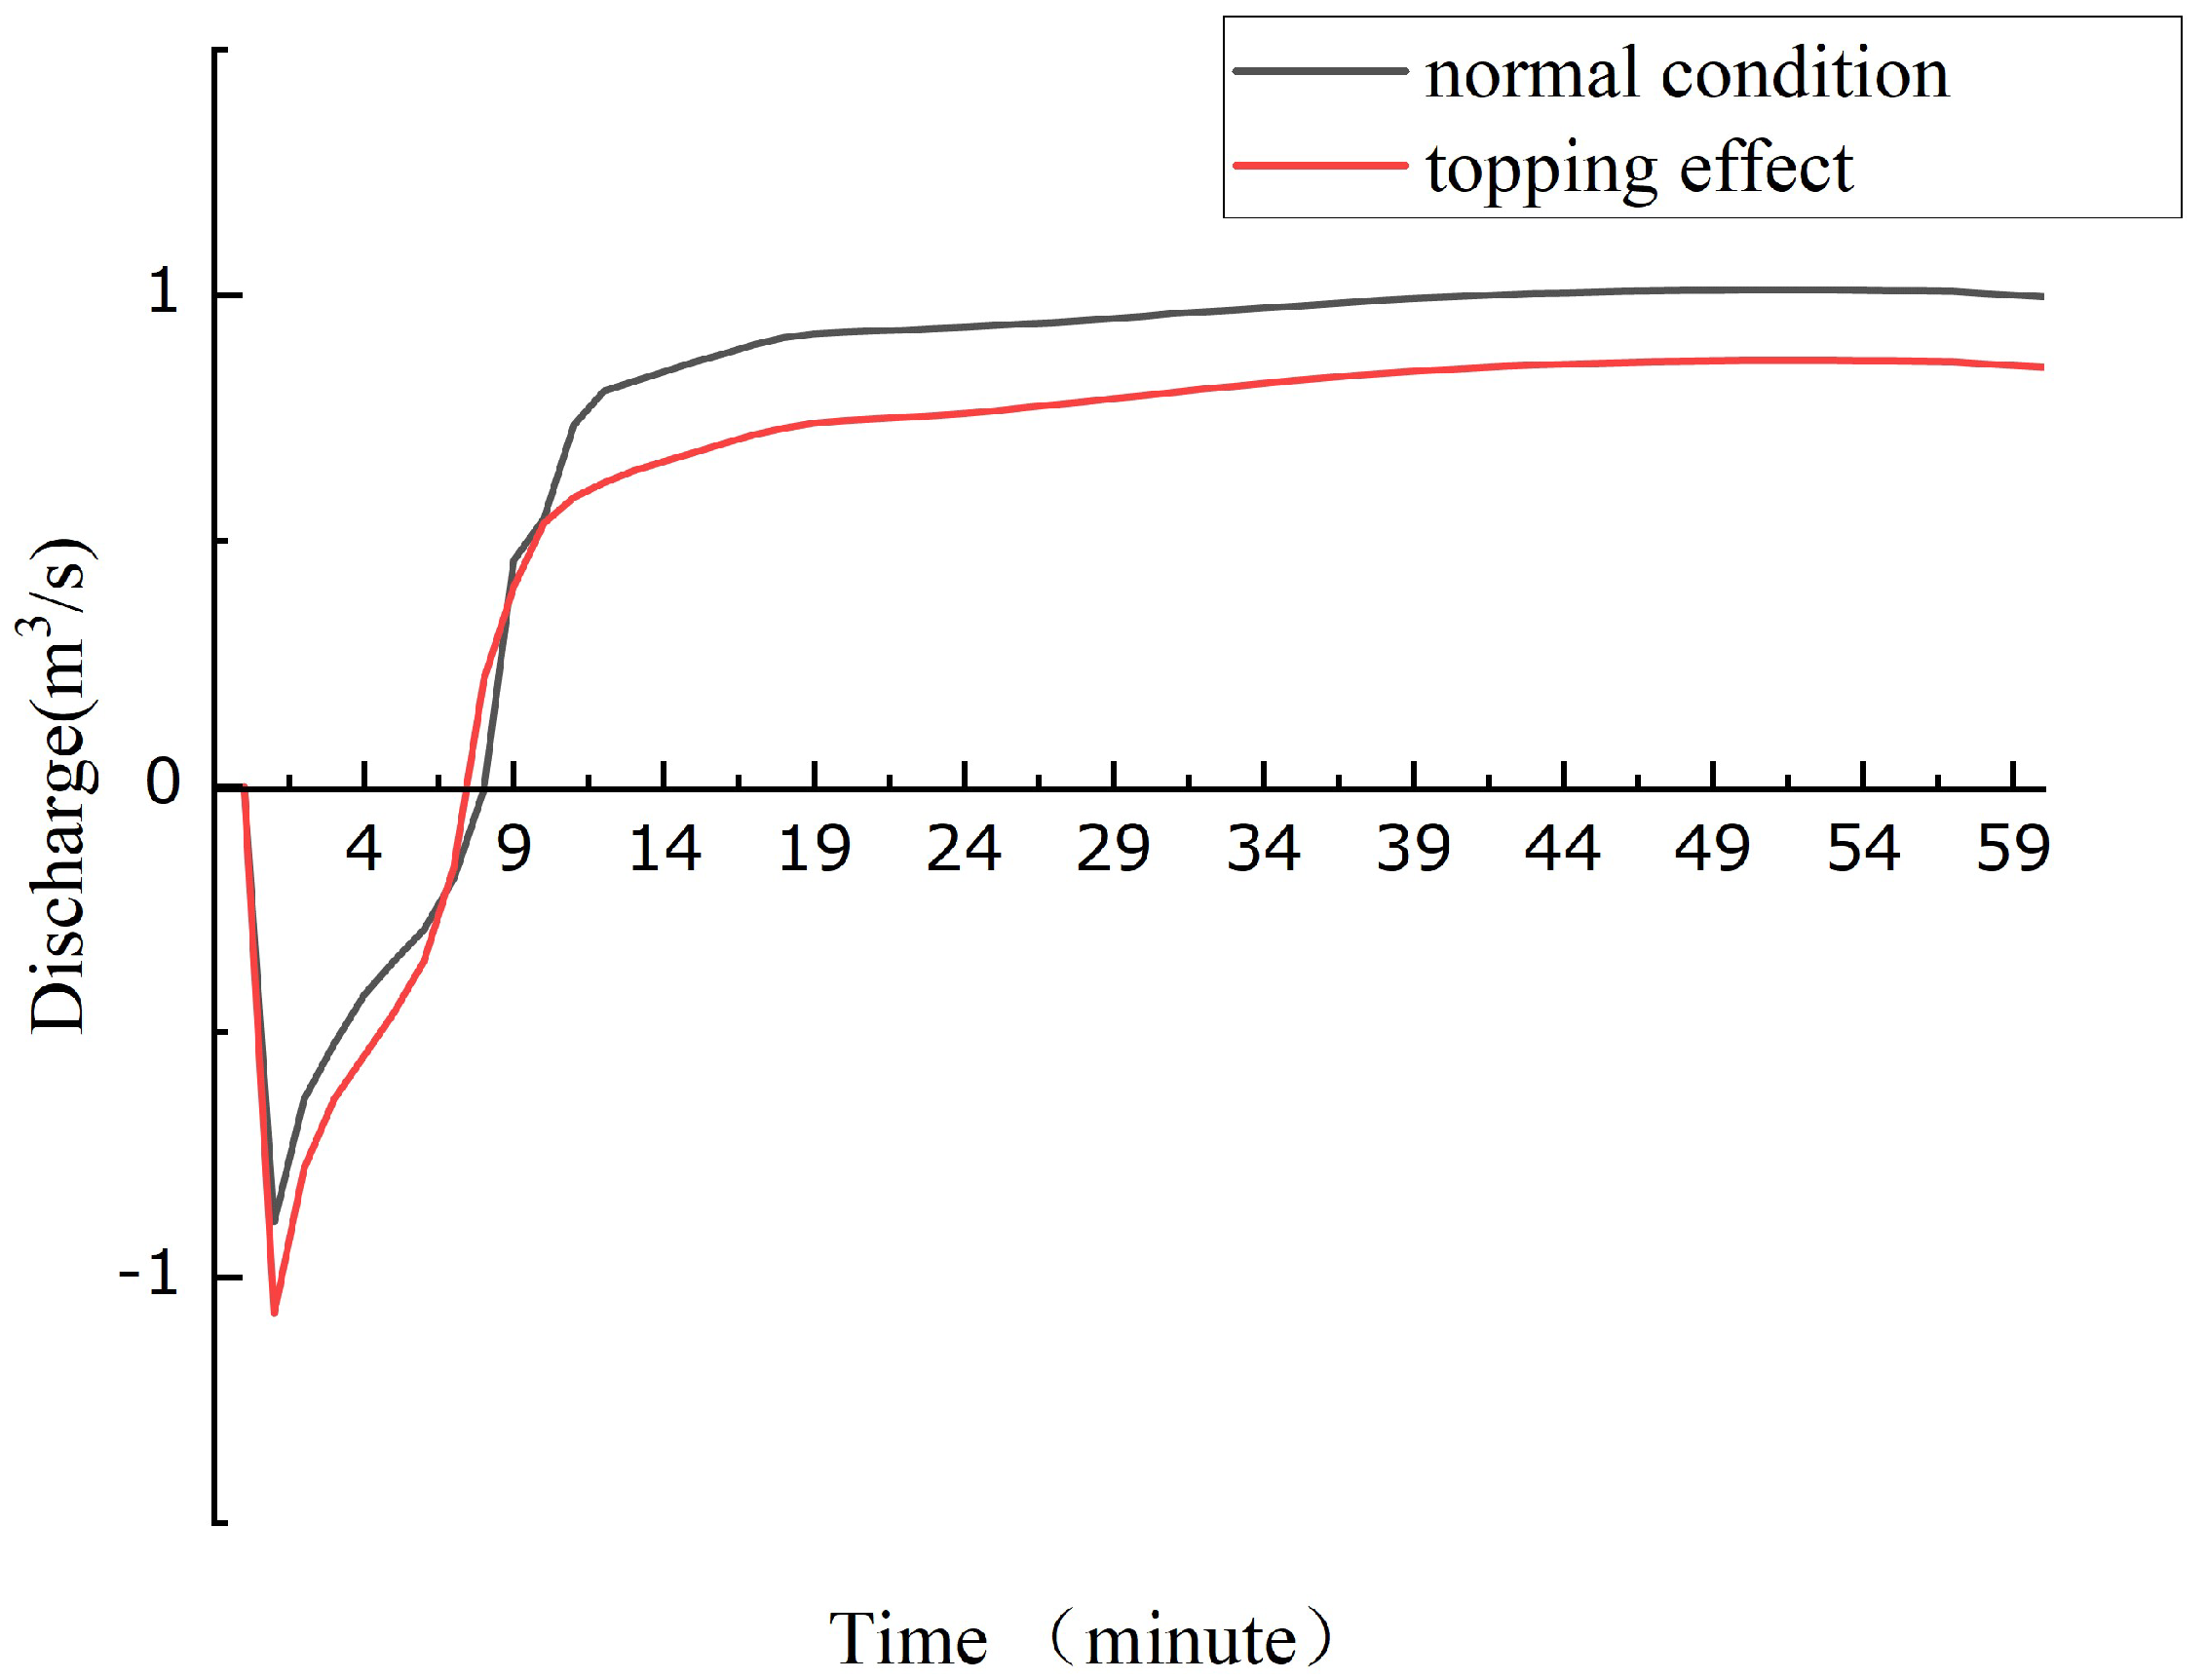
Description of working condition A: This scenario is for one hour of rainfall with a cumulative rainfall of 82.37 mm under 1-in-20 year rainfall intensity conditions. There was simultaneous 20-year flooding of the New Canal and the Liu Sha River, creating a flood level of 47.66 m at the mouth of the Liu Sha River into the New Canal. See Figure 9 for a comparison of the discharge flow at the Daqing Road outfall before and after the water level rises under condition A.
When the water level in the Wachong ditch rises, there is a topping effect on the outflow of the pipe. Initially, backflow occurs in the pipe, and the drainage capacity is reduced by approximately 0.3 m3/s. There was simultaneous 20-year flooding of the New Canal and the Liu Sha River, creating a flood level of 47.66 m at the mouth of the Liu Sha River into the New Canal.
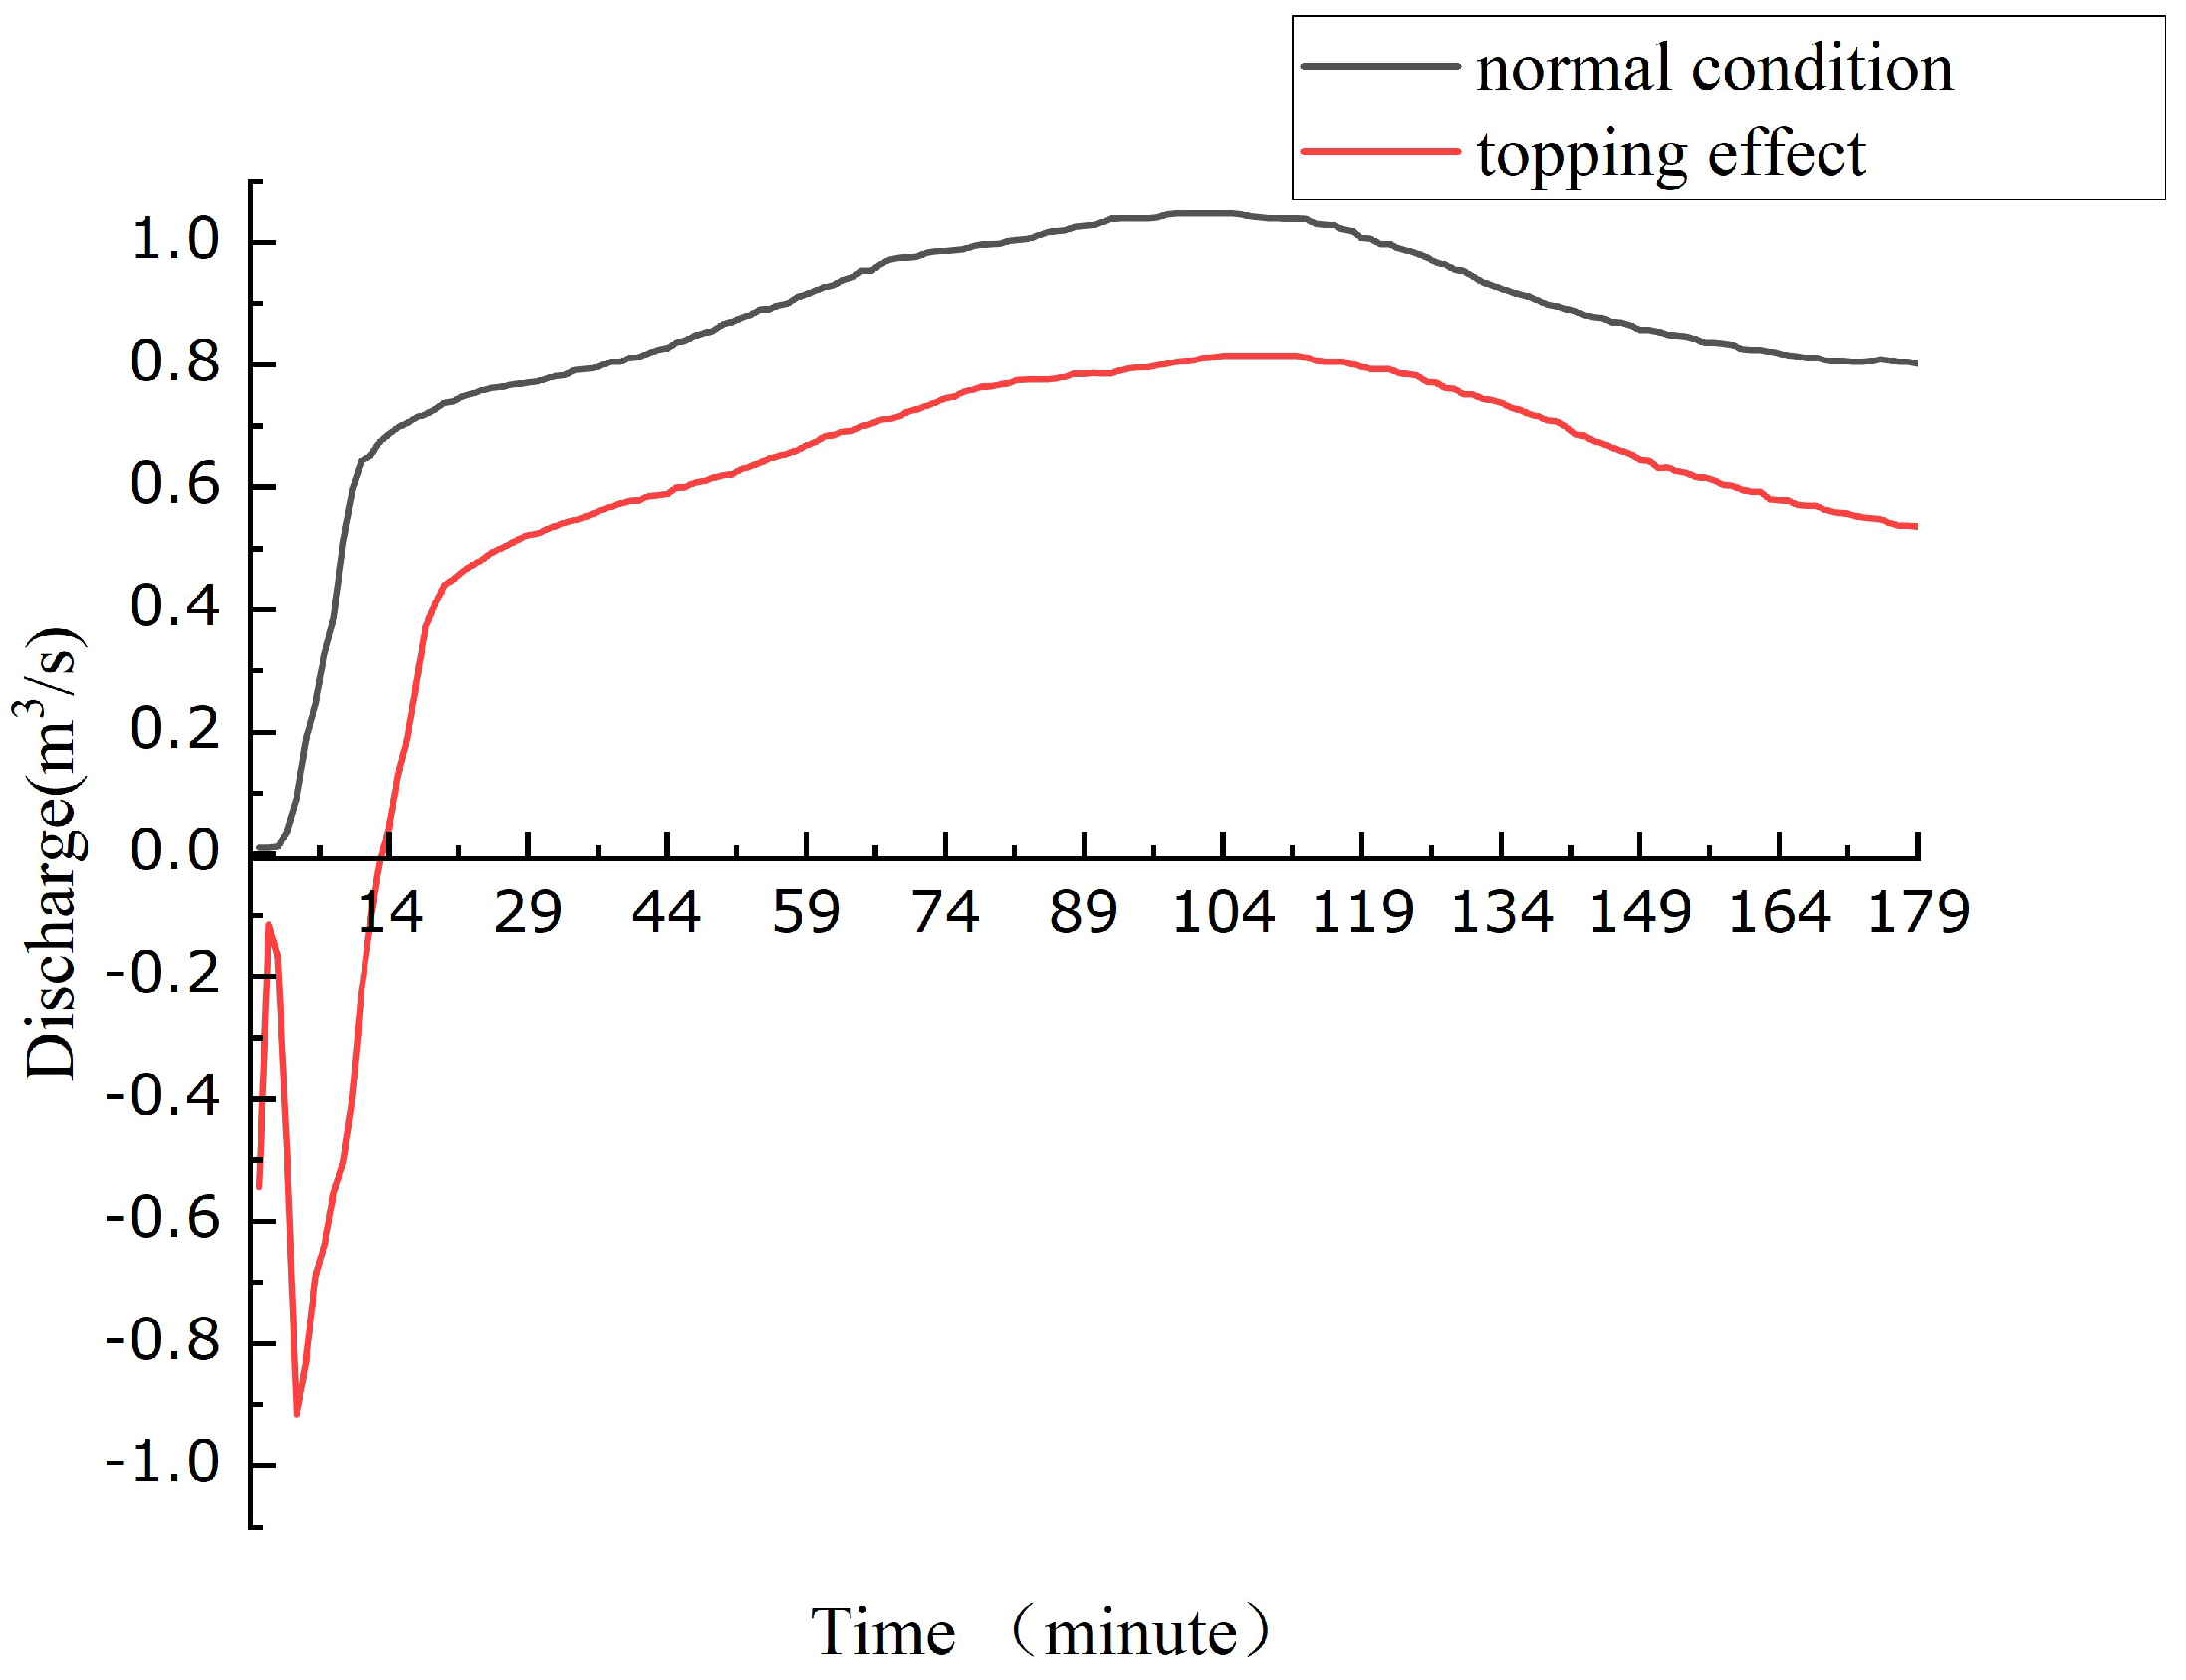
Description of working condition B: This scenario is for 3 h of rainfall with a cumulative rainfall of 143.64 mm under 1-in-50 year rainfall intensity conditions. There was simultaneous 20-year flooding of the New Canal and the Liu Sha River, creating a flood level of 47.66 m at the mouth of the Liu Sha River into the New Canal. See Figure 10 for a comparison of the discharge flow at the Daqing Road outfall before and after the water level rises under condition B.
In this case, the water level of the river in Wachong Ditch rises and the drainage outlet of the Wachong Ditch pipe is subjected to a topping effect, which significantly reduces the drainage capacity by approximately 0.4 m3/s. With the increase in time and intensity of the storm, the outlet flow capacity gradually decreases.
- (2)
- Taiqing Road Drainage Outlet
Description of working condition C: This scenario is for one hour of rainfall with a cumulative rainfall of 82.37 mm under 1-in-20 year rainfall intensity conditions. There was simultaneous 20-year flooding of the New Canal and the Liu Sha River, creating a flood level of 47.66 m at the mouth of the Liu Sha River into the New Canal. See Figure 11 for a comparison of the discharge flow at the Taiqing Road outfall before and after the water level rises under condition C.
In this case, the water level of the river in Wachong Ditch rises and the drainage outlet of the Wachong Ditch pipe is subjected to a topping effect, which significantly reduces the drainage capacity by approximately 0.2 m3/s.
Description of working condition D: This scenario is for 3 h of rainfall with a cumulative rainfall of 143.64 mm under 1-in-50 year rainfall intensity conditions. There was simultaneous 20-year flooding of the New Canal and the Liu Sha River, flood level of 47.66 m at the mouth of the Liu Sha River into the New Canal. See Figure 12 for a comparison of the discharge flow at the Taiqing Road outfall before and after the water level rises under condition D.
In this case, the water level of the river in Wachong Ditch rises and the drainage outlet of the Wachong Ditch pipe is subjected to a topping effect, which significantly reduces the drainage capacity by approximately 0.2 m3/s.
With the increase in time and intensity of the storm, the outlet flow capacity gradually decreases.
It is calculated that the depth of water in the urban area under the superstandard rainfall scenario in the study area is large, the area is extensive and the impact of flooding is severe. In the event of a superstandard flood, emergency response is unsustainable and temporary drainage is not adequate. In order to cope with the superstandard flooding in the study area, the following defensive measures were developed based on the results of the superstandard flooding simulations in this paper combined with the actual situation in the study area: ① Flood control sandbags were arranged in advance to protect the key protection areas. The flood-prone areas in the study area are mainly located in the gentle terrain, and the ground elevation is generally lower than that of the surrounding areas, which is prone to waterlogging. ② Develop a relocation plan in advance to protect people’s safety. In order to minimize the damage caused by flooding, the study area will be combined with information on terrain and road traffic to develop a relocation plan for residents in the event of flooding, and emergency evacuation measures will be taken if necessary to avoid unnecessary casualties and property damage.
4. Conclusions
As the urban development process accelerates, the standard of coping with flooding is gradually raised. This paper couples a 1D river hydrodynamic model, a 1D stormwater pipe network model and a 2D surface diffuse flow model in the central city of Zhoukou based on the MIKE FLOOD platform. The results show that the model simulation results are generally in line with reality and that the model is suitable for urban flood risk assessment in excess of the standard. The results show that:
- When the rainfall exceeds the exceedance, for the same return period, the depth and area inundated by a 3 h calendar storm are greater than that of a 1 h calendar storm; for the same calendar rainfall, the greater the return period, the greater the depth and area inundated.
- When the river level exceeds the standard and the rainfall exceeds the standard, the river level is higher than the self-flowing outlet of the pipeline, the pipeline is flooded outflow, and the drainage capacity is obviously hindered compared with the drainage capacity under the free outflow of the pipeline, dropping about 0.2 m3s/–0.4 m3s, and the higher the river level, the lower the drainage capacity of the pipeline.
- When superstandard conditions of rainfall occur in a city, the causes of waterlogging may include: inadequate drainage capacity of pipes, inadequate pumping station pumping capacity, low-lying terrain and reduced self-flow capacity of pipes into rivers. Among them, river topping and the backing up of drainage outlets are important reasons for aggravating urban flooding, for which a multi-sectoral joint drainage and coordination mechanism should be improved to ensure urban drainage capacity.
This study can help to carry out more reasonable and effective flood control work, and it has some application prospects. It has certain guiding significance for urban flood forecasting.
Author Contributions
All authors contributed to the study conception and design. Writing and editing: J.C. and Y.T.; chart editing: S.Z.; All authors have read and agreed to the published version of the manuscript.
Funding
This research was funded by National Natural Science Foundation of China, grant number U22A20237.
Data Availability Statement
Data and materials are available from the corresponding author upon request.
Conflicts of Interest
The authors declare no conflict of interest.
References
- Song, X.; Zhang, J.; Wang, G.; He, R.; Wang, X. Development and challenges of urban hydrology in a changing environment: II: Urban stormwater modeling and management. Adv. Water Sci. 2014, 25, 752–764. [Google Scholar]
- Chun, F.; Yaozong, F.; Cunyan, X. The effect of drainage and water logging control in different lid arrangements under different heavy rain intensities in Changbei Industrial Park. Water Resour. Power 2020, 38, 69–73. [Google Scholar]
- Li, Y.; Zhao, S. Research on the loss and risk of flood disasters in China from 2001 to 2020. Clim. Chang. Res. 2022, 18, 154–165. [Google Scholar]
- Zhang, J.; Wang, Y.; He, R.; Hu, Q.; Song, X. Analysis of urban flooding in China and its causes. Adv. Water Sci. 2016, 27, 485–491. [Google Scholar]
- Wang, J. Research on the design of rainstorms and storm characteristics in China. Adv. Water Sci. 1999, 10, 328–336. [Google Scholar]
- Tian, Z.; Chu, J.; Lin, Y.; Zhou, Z. Multi-scale urban flooding risk assessment techniques in Xining. Water Resour. Prot. 2022, 1–13. [Google Scholar]
- Zhe, S. Causes of flooding in central Beijing. Geogr. Res. 2014, 33, 1668–1679. [Google Scholar]
- Ribeiro, L.; Kretschmer, N.; Nascimento, J.; Buxo, A.; Rötting, T.; Soto, G.; Señoret, M.; Oyarzún, J.; Maturana, H.; Oyarzún, R. Evaluating Piezometric Trends Using the Mann-Kendall Test on the Alluvial Aquifers of the Elqui River Basin, Chile. Hydrol. Sci. J. 2015, 60, 1840–1852. [Google Scholar] [CrossRef] [Green Version]
- McRoberts, D.B.; Nielsen-Gammon, J.W. Anew homogenized climate division precipitation dataset for analysis of climate variabilityand climate change. J. Appl. Meteorol. Climatol. 2011, 50, 1187–1199. [Google Scholar] [CrossRef] [Green Version]
- Wu, S.Y. Changing characteristics of precipitation for the contiguous United States. Clim. Chang. 2015, 132, 677–692. [Google Scholar] [CrossRef]
- Walsh, J.; Wuebbles, D.; Hayhoe, K. Our Changing Climate, Chapter 2 of the US National Climate Assessment Report; US Global Change Research Program: Washington, DC, USA, 2014.
- Gambolati, G.; Teatini, P.; Gonella, M. GIS simulations of the inundation risk in the coastal lowlands of the Northern Adriatic Sea. Math. Comput. Model. 2002, 35, 963–972. [Google Scholar] [CrossRef]
- Husnain, T.; Muhammad, B.; Surchai, L.K. Flood inundation modeling and hazard assessment in Lower Ping River Basin using mike flood. Arab. J. Geosci. 2020, 13, 934. [Google Scholar]
- Hai, P.T.; Magome, J.; Yorozuya, A.; Inomata, H.; Fukami, K.; Takeuchi, K. Large-scale flooding analysis in the suburbs of Tokyo Metropolis caused by levee breach of the Tone River using a 2D hydrodynamic model. Water Sci. Technol. 2010, 62, 1859–1864. [Google Scholar] [CrossRef] [PubMed]
- Xia, J.; Falconer, R.A.; Lin, B.; Tan, G. Modelling flash flood risk in urban areas. In Water Management; Thomas Telford Ltd.: London, UK, 2011. [Google Scholar]
- Sarkar, S.K.; Rahman, M.A.; Esraz-Ul-Zannat, M.; Islam, M.F. Simulation-based modeling of urban waterlogging in Khulna city. J. Water Clim. Chang. 2021, 12, 566–579. [Google Scholar] [CrossRef]
- Mao, S.; Jia, Y.; Jia, D.; Zheng, X.; Fan, B.; Zhang, J. Analysis of flood evolution and impact on floodplain vegetation in the lower reaches of the Nengjiang River. Adv. Sci. Technol. Water Resour. 2021, 41, 27–33+40. [Google Scholar]
- Luan, M.; Yuan, W.; Liu, J.; Zhou, Y.; Kulejiang, D. Risk assessment of flooding in Tonglu County based on the SWMM-MIKE11 coupled model. Water Resour. Prot. 2016, 32, 57–61. [Google Scholar]
- Keiferc, J.; Chuh, H.H. Synthetic storm pattern for drainage design. J. Hydraul. Div. 1957, 83, 1332. [Google Scholar]
- Liao, D.; Zhu, H.; Zhou, J.; Wang, Y.; Sun, J. Study of the natural rainstorm moving regularity method for hyetograph design. Theor. Appl. Climatol. 2019, 138, 1311–1321. [Google Scholar] [CrossRef]
Figure 1.
Zhoukou city location map.

Figure 2.
Zhoukou city center current sub-bedding surface map.

Figure 3.
River system map of Zhoukou city center.

Figure 4.
Design rainfall for each condition.

Figure 5.
Schematic diagram of the coupling links.

Figure 6.
Distribution of major waterlogged site on 20 July 2021.

Figure 7.
Water depth map for 1 in 10-year rainfall.

Figure 8.
Water depth map for 1 in 5 year rainfall.

Figure 9.
Comparison of discharge flow at the Daqing Road outfall before and after the water level rises under condition A.
Figure 9.
Comparison of discharge flow at the Daqing Road outfall before and after the water level rises under condition A.

Figure 10.
Comparison of discharge flow at the Daqing Road outfall before and after the water level rises under condition B.
Figure 10.
Comparison of discharge flow at the Daqing Road outfall before and after the water level rises under condition B.

Figure 11.
Comparison of discharge flow at the Taiqing Road outfall before and after the water level rises under condition C.
Figure 11.
Comparison of discharge flow at the Taiqing Road outfall before and after the water level rises under condition C.

Figure 12.
Comparison of discharge flow at the Taiqing Road outfall before and after the water level rises under condition D.
Figure 12.
Comparison of discharge flow at the Taiqing Road outfall before and after the water level rises under condition D.


Table 1.
Surface types (lower bedding surface) in the central city of Zhoukou.
| No. | Name | Surface Type (Subsurface) Area Statistics (ha) | |||||
|---|---|---|---|---|---|---|---|
| Water Body | Greenfield | Road | Building Sites | Bare Ground | Total | ||
| 1 | Jialu River Drainage Subdivision | 68.66 | 0 | 47.1 | 293.81 | 307.75 | 717.32 |
| 2 | Wachong Ditch Drainage Subdivision | 32.28 | 57.17 | 108.21 | 705.24 | 1065.94 | 1968.84 |
| 3 | Shaying River Drainage Subdivision | 38.39 | 1.10 | 72.44 | 578.28 | 56.12 | 746.33 |
| 4 | Traffic Main Canal Drainage Subdivision | 119.13 | 15.94 | 264.55 | 1088.98 | 684.98 | 2173.58 |
| 5 | Qingshui River Drainage Subdivision | 7.88 | 1.90 | 43.60 | 178.59 | 173.23 | 405.20 |
| 6 | Yangnao Main Canal Drainage Subdivision | 2.40 | 31.58 | 51.28 | 342.71 | 147.27 | 575.24 |
| 7 | Yunliang River Drainage Subdivision | 8.72 | 0 | 52.41 | 533.98 | 268.34 | 863.45 |
Table 2.
Comparison of measured and numerically modeled ponding depths at inundated water points on 20 July 2021.
Table 2.
Comparison of measured and numerically modeled ponding depths at inundated water points on 20 July 2021.
| Serial Number | Location of Ponded Water | Measured Water Depth/cm | Simulated Water Depth/cm | Difference/cm |
|---|---|---|---|---|
| 1 | Bayi Road North | 60 | 65 | 5 |
| 2 | Junction of Qi Yi Road and Da Qing Road | 40 | 42 | 2 |
| 3 | Near Gongnong Road and Yuxin Street | 55 | 58 | 3 |
| 4 | Intersection of Construction Road and Yinzhu Road | 30 | 31 | 1 |
| 5 | Area around Sanlian Hang | 80 | 76 | −4 |
| 6 | West Street Community | 80 | 84 | 4 |
| 7 | Jianxi Street area | 60 | 56 | 6 |
| 8 | Area near Anju Road | 40 | 45 | 5 |
| 9 | Fumin Road South area | 40 | 43 | 3 |
| 10 | Hanyang Road South area | 40 | 41 | 1 |
| 11 | Jiancai Road area | 40 | 38 | −2 |
| 12 | Gao Zhuang Community | 40 | 42 | 2 |
| 13 | Wenchang road | 60 | 58 | −2 |
| 14 | Bayi Road and Construction | 60 | 63 | 3 |
| 15 | Zhou Shi gate | 40 | 42 | 2 |
| 16 | Civil Service District A | 60 | 63 | 3 |
| 17 | Yuxin Street East | 40 | 42 | 2 |
| 18 | Tai Hao Road, Zijingcheng District | 35 | 39 | 4 |
| 19 | Junction of Chaoyang Road | 30 | 34 | 4 |
| 20 | Tai Hao Road, Wu Yi junction | 30 | 36 | 6 |
| 21 | Yellow River Road West | 40 | 37 | −3 |
Table 3.
Depth and area of water at major flood prone points during a 20-year rainfall event.
| Serial Number | Location of Ponded Water | 20a 1 h | 20a 3 h | ||
|---|---|---|---|---|---|
| Ponded Area/ha | Water Depth/cm | Ponded Area/ha | Water Depth/cm | ||
| 1 | Intersection of Construction Road and Yinzhu Road | 2.16 | 71 | 2.96 | 73 |
| 2 | Bayi Road and Construction | 0.71 | 69 | 1.52 | 76 |
| 3 | Bayi Road North | 0.88 | 63 | 1.79 | 101 |
| 4 | Wenchang road | 0.78 | 76 | 1.32 | 126 |
| 5 | Zhoukou Normal College | 0.51 | 57 | 2.25 | 63 |
| 6 | Intersection of North Binhe Road and Zhongyuan Road | 0.47 | 73 | 0.81 | 83 |
| 7 | Near West Street and Hibiscus Street | 0.17 | 42 | 0.26 | 47 |
| 8 | Sanlian Hang Area | 0.27 | 81 | 0.36 | 92 |
| 9 | Bayi Road South | 0.63 | 57 | 2.16 | 93 |
| 10 | Chaoyang Road | 1.32 | 57 | 1.99 | 60 |
| 11 | Zhongyuan Road South | 0.64 | 66 | 1.2 | 69 |
| 12 | Intersection of Huanghe Road and Fumin Road | 1.5 | 62 | 2.45 | 77 |
| 13 | Intersection of Huanghe Road and Hanyang Road | 1.13 | 56 | 1.89 | 74 |
| 14 | Near Jiancai Road | 1.16 | 64 | 1.67 | 91 |
| 15 | Junction of Fu Min Road and Tai Hao Road | 1.13 | 52 | 1.85 | 65 |
| 16 | Intersection of Bayi Avenue and Kaiyuan Avenue | 1.41 | 58 | 1.7 | 67 |
Table 4.
Depth and area of water at major flood prone points during a 50-year rainfall event.
| Serial Number | Location of Ponded Water | 50a 1 h | 50a 3 h | ||
|---|---|---|---|---|---|
| Ponded Area/ha | Water Depth/cm | Ponded Area/ha | Water Depth/cm | ||
| 1 | Intersection of Construction Road and Yinzhu Road | 4.89 | 93 | 4.99 | 95 |
| 2 | Intersection of Zhongzhou Avenue and Construction Avenue | 1.98 | 45 | 2.73 | 84 |
| 3 | Bayi Road and Construction | 0.68 | 82 | 1.79 | 112 |
| 4 | Bayi Road North | 2.71 | 72 | 3.39 | 120 |
| 5 | Wenchang road | 1.7 | 89 | 1.76 | 147 |
| 6 | Daqing Road North | 1.7 | 57 | 2.14 | 66 |
| 7 | Zhoukou Normal College | 3.32 | 56 | 3.78 | 75 |
| 8 | Intersection of North Binhe Road and Zhongyuan Road | 0.88 | 99 | 0.97 | 105 |
| 9 | Near West Street and Hibiscus Street | 0.42 | 49 | 0.48 | 63 |
| 10 | Sanlian Hang Area | 0.59 | 99 | 0.77 | 120 |
| 11 | Intersection of Qiyi Road and Daqing Road | 0.37 | 55 | 2.9 | 74 |
| 12 | Yuxin Road and Zhongyuan Road | 0.43 | 68 | 0.51 | 78 |
| 13 | Bayi Road South | 1.79 | 61 | 2.57 | 101 |
| 14 | Chaoyang Road | 2.37 | 62 | 4.09 | 74 |
| 15 | Zhongyuan Road South | 1.69 | 66 | 1.81 | 85 |
| 16 | Intersection of Huanghe Road and Fumin Road | 3.21 | 68 | 3.34 | 93 |
| 17 | Intersection of Huanghe Road and Hanyang Road | 2.53 | 68 | 2.69 | 87 |
Disclaimer/Publisher’s Note: The statements, opinions and data contained in all publications are solely those of the individual author(s) and contributor(s) and not of MDPI and/or the editor(s). MDPI and/or the editor(s) disclaim responsibility for any injury to people or property resulting from any ideas, methods, instructions or products referred to in the content. |
© 2023 by the authors. Licensee MDPI, Basel, Switzerland. This article is an open access article distributed under the terms and conditions of the Creative Commons Attribution (CC BY) license (https://creativecommons.org/licenses/by/4.0/).
Share and Cite
MDPI and ACS Style
Chen, J.; Tian, Y.; Zhang, S.; Li, Y.; Guo, Z. Study of Urban Flooding Response under Superstandard Conditions. Water 2023, 15, 1492. https://doi.org/10.3390/w15081492
AMA Style
Chen J, Tian Y, Zhang S, Li Y, Guo Z. Study of Urban Flooding Response under Superstandard Conditions. Water. 2023; 15(8):1492. https://doi.org/10.3390/w15081492
Chicago/Turabian StyleChen, Jian, Yangyang Tian, Shanju Zhang, Yaowei Li, and Zhikai Guo. 2023. "Study of Urban Flooding Response under Superstandard Conditions" Water 15, no. 8: 1492. https://doi.org/10.3390/w15081492
Note that from the first issue of 2016, this journal uses article numbers instead of page numbers. See further details here.