
Assessment of the Spatial Variations of Mercury and Methylmercury in the Sediment of a Lake and Its Inflow River Estuaries

1
Shandong Provincial Lunan Geology and Exploration Institute (Shandong Provincial Bureau of Geology and Mineral Resources No.2 Geological Brigade), Yanzhou 272100, China
2
School of Life Science, Qufu Normal University, Qufu 273165, China
*
Author to whom correspondence should be addressed.
Water 2023, 15(8), 1494; https://doi.org/10.3390/w15081494
Submission received: 17 March 2023
/
Revised: 4 April 2023
/
Accepted: 6 April 2023
/
Published: 11 April 2023
(This article belongs to the Section Water Quality and Contamination)
Abstract
:The contents of total mercury (THg) and methylmercury (MMHg) were measured in Nansi Lake and its inflow river estuaries to investigate their spatial distribution characteristics and the geochemical relationships between THg, MMHg, and methylation rate (%MMHg) with mineral phases of the sediment. The contents of THg, MMHg, and %MMHg in the lake sediment were lower than those in the inflow river estuary sediment. Inputting of inflow rivers was primary source to THg and MMHg in Nansi Lake. The THg contents in the sediment decreased from the upper to the lower lake, while the MMHg contents indicated the opposite trends of spatial variations. The THg was significantly positively correlated with MMHg and %MMHg in estuarine sediment but has a significant negative correlation with MMHg and %MMHg in lake sediment. Total organic carbon (TOC), acid volatile sulfide (AVS), and clay have great influence on the distribution of THg in sediment. Methylmercury in the estuary sediment was positively correlated with THg, AVS, TOC, and clay, while these relationships were not revealed in the lake sediment. Cluster and principal component analysis results showed that THg, clay, and TOC were derived from the same sources in the sediment of Nansi Lake. It implied that for improving the water environmental quality of lakes, the environmental management of rivers entering the lake should be strengthened.
1. Introduction
Mercury (Hg) pollution has received increasing attention in recent years because of its persistence, bioaccumulation, and toxicity [1]. Due to the continuous progress of industry and agriculture, the Hg content in various environmental media has significantly increased [2]. Mercury enters water bodies through atmospheric deposition, industrial and agricultural wastewater discharge, and other anthropogenic processes [3]. Mercury has a strong binding force with sediment particles; therefore, sediment is the main repository of Hg [4]. Mercury content in sediment is directly affected by factors such as river input and atmospheric deposition and to a large extent by various geochemical variables, especially the content, type, structure, and size of organic matter [5,6]. High levels of Hg in sediment can be leached into pores or surface water by diffusion, resuspension, desorption, and dissolution. Mercury can also enter into the food web by benthic organisms feeding at the sediment–water interface and damage human health through exposure channels such as food webs, skin contact, and respiratory inhalation [7]. Therefore, it is necessary to investigate the Hg content in sediment to reveal the level of Hg pollution in the aquatic environment.
In addition, more than 90% of Hg accumulates in sediment, of which a small part can be converted to the more toxic methylmercury (MMHg) by microbial methylation and sulfate-reducing bacteria [8]. Methylmercury bioaccumulates and biomagnifies in the food web [9,10] and poses a threat to human and ecological health. Recent studies have shown that even low doses of MMHg also have potential risks to sensitive populations such as newborns and children [11,12]. It is necessary to determine the MMHg content in water environments. Anaerobic sediment in wetlands, lakes, oceans, and rice fields are considered to be hot spots for MMHg production [13]. Methylmercury is commonly detectable in water and sediment, especially in anoxic sediment, because anoxic bacteria such as iron/sulfate-reducing bacteria can convert Hg2+ into MMHg [14]. Some previous studies have shown that the occurrence and activity of methylated microorganisms, the bioavailability, and methylation potential of inorganic mercury species will be reduced due to environmental factors [13,15,16]. For example, sulfur-containing compounds affect Hg methylation, inhibit Hg methylation [17], and promote Hg methylation in soil and sediment [18].
Nansi Lake (34°27′–35°20′ N, 116°34′–117°21′ E), the largest shallow lake in northern China, is about 125 km long from north to south and 6–25 km wide from east to west, with an area of 1266 km2 [19]. Nansi Lake is composed of Nanyang Lake, Zhaoyang Lake, Dushan Lake, and Weishan Lake, and its boundary is not obvious from northwest to southeast. This lake has become an critical buffering reservoir in the eastern route of China’s South-to-North Water Diversion Project. A secondary dam at Zhaoyang Lake divided the whole lake into upper and lower parts from north to south. The area of the upper and lower lakes is 602 and 663 km2, respectively. Cities such as Jining, Zaozhuang, and Heze have experienced rapid economic development around Nansi Lake since the 1970s, which has led to an excessive release of industrial and domestic pollutants. These pollutants were mainly discharged into the inflow rivers of Nansi Lake. Therefore, it is necessary to pay close attention to the current situation of environmental pollution in Nansi Lake and its inflow river estuaries.
The main purpose of this study is to investigate the contents and spatial variations of total mercury (THg) and MMHg in the sediment of Nansi Lake and its inflow river estuaries; explore the relationship between THg, MMHg, and %MMHg with mineral phases of the sediment; and reveal the possible sources of pollutants in the sediment.
2. Materials and Methods
2.1. Sediment Sample Collection
Sediment samples were collected at depths of 0–15 cm from 19 different sites (including 5 sites in the central part of Nansi Lake (L1–L5) and 14 sites in the estuaries of the inflow river of the lake (R1–R14)) in April 2021. Geographic information regarding the sampling sites is presented in Figure 1. We used a stainless-steel grab dredger to collect sediment samples from three to four locations at each sampling site and then mixed them into a sample. Then, we placed the mixed sample in the acid-washed dark polyethylene bag, quickly transferred it to the incubator with an ice bag, and transported it to the laboratory, where it was frozen (FD-1A, Shanghai Huyueming Scientific Instrument Co., Ltd., Shanghai, China), crushed, screened with a 2 mm sieve, and stored in a 4 °C glass bottle for use.
2.2. Analysis Methods
Measurement of total organic carbon (TOC) content of sediments was performed using a total carbon analyzer (TRL-TOC-S-C, TRL, Development Design and Manufacturing Company ODTÜ Teknokent Üniversiteler Mah., Ankara, Turkey). We used Mastersizer 3000 laser particle size analyzer (S3000, Mastersizer, San Diego, CA, USA) to analyze the sediment size of clay (<2 μm), silt (2–63 μm), and sand (63–2000 μm). The acid volatile sulfide (AVS) of the sediment was analyzed by the Environment Protection Agency (EPA) 9215 method [20]. The analysis procedure was as follows: take about 1 g of wet sediment sample, add 20 mL of 6 M deoxy hydrochloric acid, and then distill for 1.5–2.0 h under nitrogen at 25 °C. Sulfide antioxidant buffer (SAOB, 25 mL) was placed into a plastic container to obtain sulfide volatilized from the distillation container. The content of total sulfide (TS) captured in the SAOB solution was measured using a special electrode for sulfide ions (Istek Co., Seoul, Korea).
Next, we took 1 g of sediment sample and digested it with concentrated HNO3 and H2SO4. The mixture was oxidated by 0.2 N BrCl for 12 h. The content of THg in the sediment was analyzed and tested by cold steam atomic fluorescence spectrometry (CVAFS). The MMHg content was determined by a method provided by [20]. In brief, 0.5 mL KCl and 1.0 mL H2SO4 (8 M) were added to 1 g of wet sediment sample, mixed, diluted to 25 mL with ultrapure water, and then distilled. The acetic acid buffer distillate was reacted with 1% sodium tetraethyl borate and purified with N2. Volatile Hg was absorbed on the solid-phase trap (Tenax-TA, Haohan Chromatography (Shandong) Application Technology Development Co., Ltd., Shandong, China), separated on the gas chromatography column, converted to Hg0 through the pyrolysis column, and finally detected by CVAFS. In this method, the detection limit was 0.4 ng/g THg (n = 20) and 0.006 ng/g MMHg (n = 20), calculated using three times the standard deviation of blank sample.
2.3. Quality Assurance and Control
Certified reference materials (GBW07405, National Standard Material Resource Sharing Platform, Beijing, China; IAEA405, International Atomic Energy Agency), duplicates, matrix spikes, and method blanks were used for quality assurance and control in this study. The recoveries of THg and MMHg determined by the reference materials were all in a range of 80–120%, with relative standard deviations (RSDS) < 9%, and the RSDS of parallel samples < 10%.
3. Results and Discussion
3.1. Basic Physicochemical Properties of Sediment
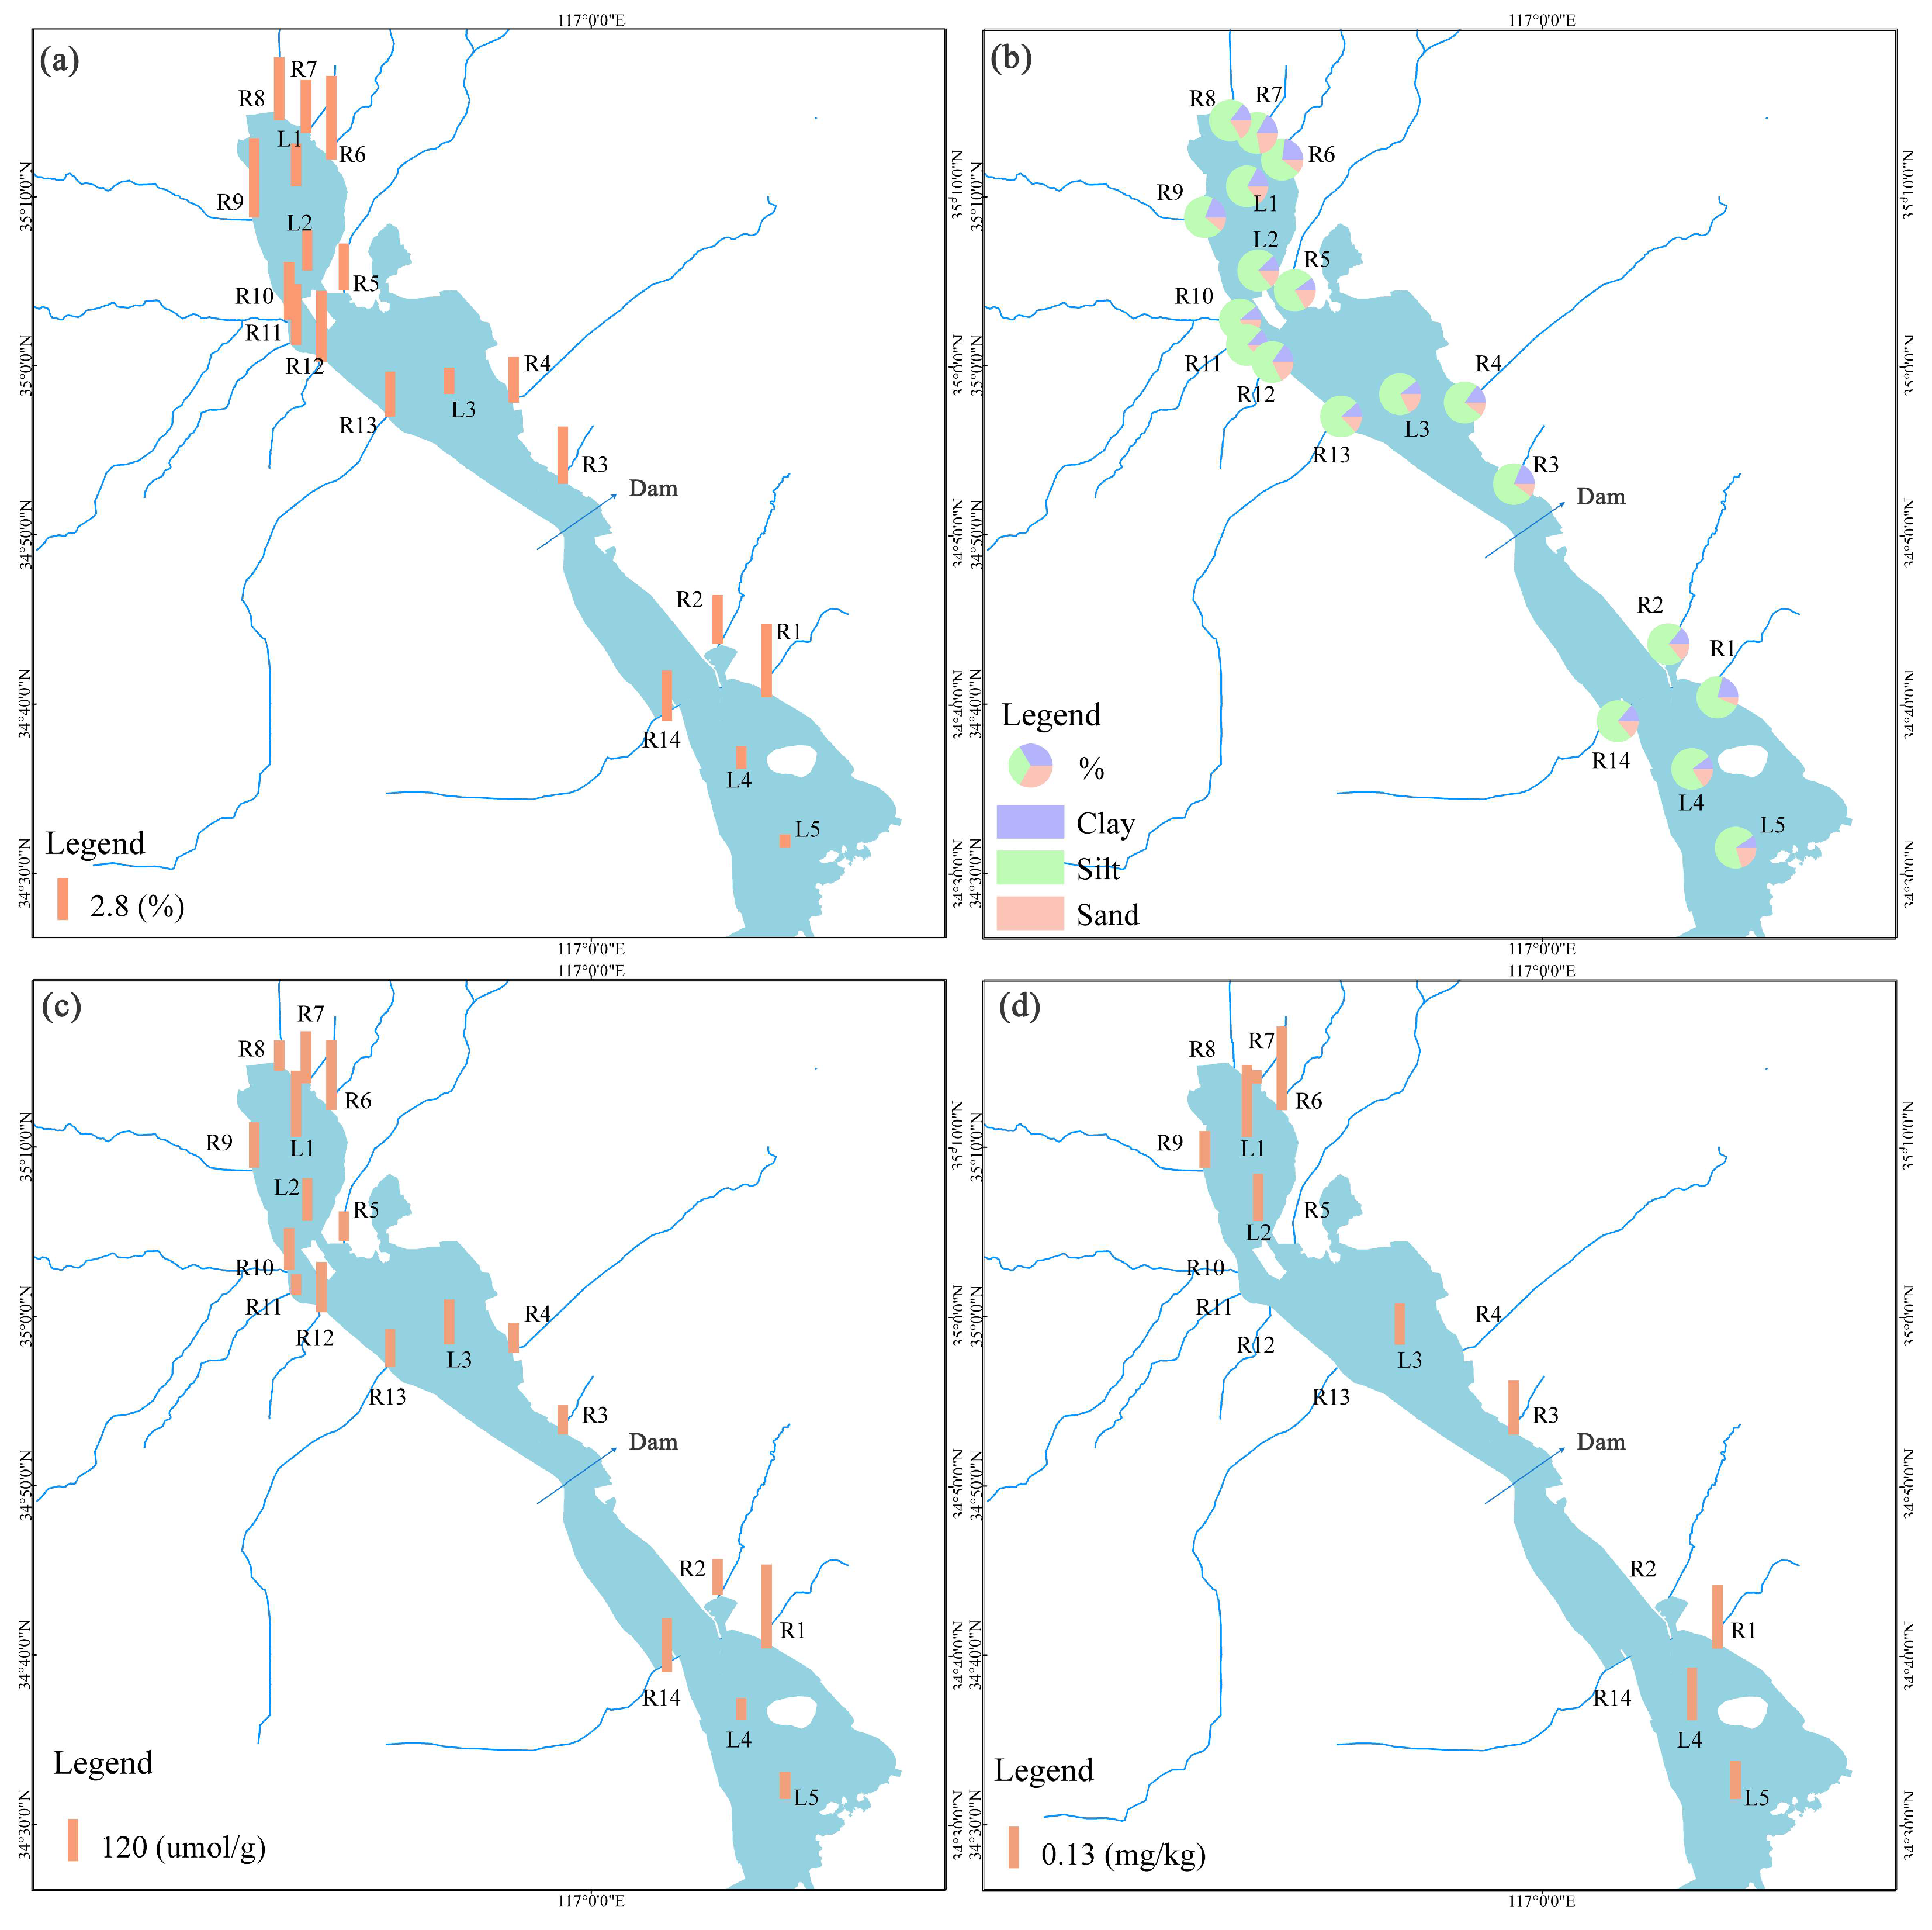
For the lake sediment, the TOC ranged from 0.87% to 2.87%, with an average of 1.96% (Figure 2). However, the TOC of the estuary sediment was in a range of 3.04–5.62% and averaged 4.01%. Thus, the TOC was relatively high in the sediment of inflow river estuaries, which might be related to the discharge of numerous domestic and industrial wastewater from nearby cities and towns. It implies that the riverine input of organic matter (OM) might be the main contributor to the sediment of Nansi Lake. The percentages of clay and silt in the lake sediments were 9.48–17.06% and 67.82–73.65%, with average values of 12.08% and 71.33%, respectively. The contents of clay and silt in the sediments of river estuaries were 10.07–22.76% and 60.84–75.48% and averaged 15.46% and 70.77%, respectively. Acid volatile sulfur (AVS) represents the sulfide content of the sediment [21]. Acid volatile sulfur is the main binder phase for many divalent metals such as copper, lead, zinc, and Hg. Mercury methylation is also affected by AVS. The AVS content ranged from 65.08 to 193.87 µmol/g and averaged 119.18 µmol/g in the lake sediments. Inflow river estuary sediments contained 62.34–246.00 µmol/g of AVS, with an average value of 128.47 µmol/g. Therefore, the AVS content in the sediment of river estuaries was higher than that in the lake sediment, which was consistent with the result that the AVS carried by river water flowed into the central lake, with the velocity sharply decreasing [22]. The pollutant was primarily deposited in the estuary sediment. Therefore, the AVS content in the lake sediments decreased with increasing distance from estuaries, which was similar to the results obtained by our previous research [23]. Obviously, the contents of minerals in the sediment of inflow river estuaries were generally higher than those in the lake sediment. This implied that pollutants might be diluted by the inflow rivers, which led to the lower levels of minerals in the lake sediment than in the sediment of inflow river estuaries.
We also analyzed the detailed spatial distribution of sediment properties. As shown in Figure 2a, the TOC average contents were more than 4% and relatively high in the sediments of estuaries in the upper lake, such as sites R6, R8, R9, R11, and R12. In addition, the TOC of the lake sediment decreased from upper lake to lower lake, which might be affected by OM input from rivers and dilution in lake water flow. As shown in Figure 2b, the clay contents in the estuary sediments were higher in the upper lake. Sites R7, R12, R10, and R8 contained more than 15% clay. However, the lake sediment was relatively coarser than the estuary sediment. As shown in Figure 2c, the AVS content of the estuary sediment was highest at site R1. Furthermore, the AVS contents of sites R6, R14, R7, R12, R9, R10, R13, and R2 were more than 100 µmol/g. Obviously, the sites with high AVS content are mainly concentrated in the estuaries of the upper lake of Nansi Lake. For the lake sediment, AVS generally decreased from the upper lake to the lower lake. As shown in Figure 2d, the TS content of the sediment was observed in five estuaries. However, TS was detectable in all lake sediment samples, with a relatively higher level of more than 0.1 mg/kg or even 0.2 mg/kg (Site L2). Similarly, the TS content in the lake sediment decreased from the upper to the lower lake. Therefore, the results implied that TS was more readily deposited in the sediment of the central lake. The stable anoxic environment of the central lake sediment promoted the reduction of sulfur to H2S, which could be deposited in sediment. In general, the estuary sediments in the upper lake contained more TOC, AVS, and TS; in addition, the sediment texture was relatively coarse.
3.2. Contents of THg and MMHg in Sediment
The THg content was in a range of 0.043–0.168 mg/kg, with an average of 0.103 mg/kg (Figure 3). The MMHg content in all sediments ranged from 0.048 to 0.764 ng/g and averaged 0.298 ng/g. When the solid-phase MMHg content was normalized to the THg level, the corresponding methyl ratio index (%MMHg) was obtained. The results indicated that the values of %MMHg ranged from 0.096% to 0.476%, with an average of 0.269%.
The THg content ranged from 0.051 to 0.113 mg/kg in the sediment of the lake and from 0.043 to 0.168 mg/kg in the sediment of inflow river estuaries, averaging 0.087 and 0.109 mg/kg, respectively. The THg level in the sediment of the lake was obviously lower than that of the estuary. These results indicated that riverine input was one of the main sources of Hg for the lake sediment. There are some large coal mines and coal-fired power plants around Nansi Lake. A previous study showed that the Hg content averaged 0.17 mg/kg in the coals of Shandong Province [24], and more than 80% of the Hg was discharged into the environment. Therefore, coal-mining waste might be an important contributor to Hg pollution in the sediment of Nansi Lake and its inflow river estuaries. Some industries such as mining and quarrying, smelting and pressing of ferrous metals, chemical engineering, and farming can discharge Hg into the environment. In recent years, these industries have developed extremely quickly in cities such as Jining, Zaozhuang, and Heze around Nansi Lake, which has led to the emission of large amounts of Hg pollutants. A long-term monitoring study indicated that some inflow rivers were all contaminated by heavy metals [15]. Thus, industrial emissions might be one of the main pollution sources of Hg for the sediment of Nansi Lake and its inflow river estuaries. In addition, the river-carried Hg contaminants were diluted after flowing into Nansi Lake, which reduced the deposition of Hg from overlying water to sediment. Meanwhile, the high deposition rate of the river estuary (N3 cm/y at 30° N) also contributed to the higher content of THg in the sediment of the estuary [25,26]. These natural and anthropogenic synergy factors caused higher Hg levels in the sediment in estuaries than in the lake. Moreover, water flows from the upper lake to the lower lake; therefore, the sediment in the upper lake is affected first by the pollutants. The sediment of the lower lake revealed a lower-grade level after deposition and decontamination in the upper lake.
For the sediment of Nansi Lake and its inflow river estuaries, the MMHg content was in a range of 0.048–0.764 ng/g and 0.112–0.152 ng/g, averaging 0.358 and 0.131 ng/g, respectively. The %MMHg ranged from 0.096% to 0.476% and from 0.110% to 0.298%, averaging 0.306% and 0.167%, respectively. Obviously, the MMHg and %MMHg levels in the lake sediment were obviously lower than those in the estuary sediment. However, long water retention might promote the anoxic condition of the bottom layer in the central lake, which is necessary for Hg methylation. In this regard, the MMHg content and %MMHg in the central lake should be higher than those at open water sites such as estuaries, but this is just the opposite of the results of this study. Therefore, the redox condition of the water-sediment system was not the determining factor for Hg methylation. Other factors such as the adsorption-desorption process and solar illumination can also affect the production of MMHg, and the specific reasons need to be further explored.
Table 1 shows a comparison of the values of THg, MMHg, and %MMHg in this study to other investigations. The content of THg in the sediment of Nansi Lake was significantly higher than that in the main stream of the Yellow River (average of 0.054 mg/kg). However, Nansi Lake was formed by the deposition of the Yellow River. Obviously, this result indicated that Nansi Lake had been polluted by nearby sources. For the sediment of Nansi Lake, the THg content was similar to that in Chaohu Lake (range of 0.024–0.278 mg/kg, average of 0.096 mg/kg), Taihu Lake (0.076–0.237 mg/kg, average of 0.097 mg/kg), and Superior Lake in Canada (average of 0.088 mg/kg). The THg content of the sediment in Nansi Lake was lower than that in Dianchi Lake (average of 0.18 mg/kg), Amazonian Lake (average of 0.12 mg/kg), Daxingkai Lake (average of 1.66 mg/kg), and Arctic freshwater lakes (average of 22.23 mg/kg). Therefore, the THg level in the central region of Nansi Lake was moderate. For the sediment of inflow river estuaries of Nansi Lake, the THg level was higher than that in the Dagu Estuary (average of 0.109 mg/kg) but lower than those in the Danshuei River Estuary (average of 0.379 mg/kg), Asturias Estuary (average of 0.52 mg/kg), Kaohsiung Estuary (average of 0.149 mg/kg), Scheldt Estuary (average of 0.18 mg/kg), and Pearl River Estuary (average of 0.354 mg/kg). Hence, the THg pollution in the estuary sediment of Nansi Lake was not serious. For the lake sediment of Nansi Lake, the MMHg content was lower than that of other lakes such as Daxingkai Lake, Amazonian Lake, and Dianchi Lake. For the estuary sediment of Nansi Lake, the MMHg content was similar to that in the Kaohsiung Estuary (average of 0.31 ng/g). The %MMHg value in this study was lower than 0.5%, which was similar to the results obtained by some previous studies [27]. Generally, the Hg and MMHg levels in the sediment of Nansi Lake were moderate. However, previous studies suggested that industrial wastewater containing Hg might be a main source of Hg pollution in Nansi Lake. Therefore, the coal-mining and industrial activities around the Nansi Lake Basin should be given more attention.
3.3. Spatial Distribution of THg and MMHg in Sediment
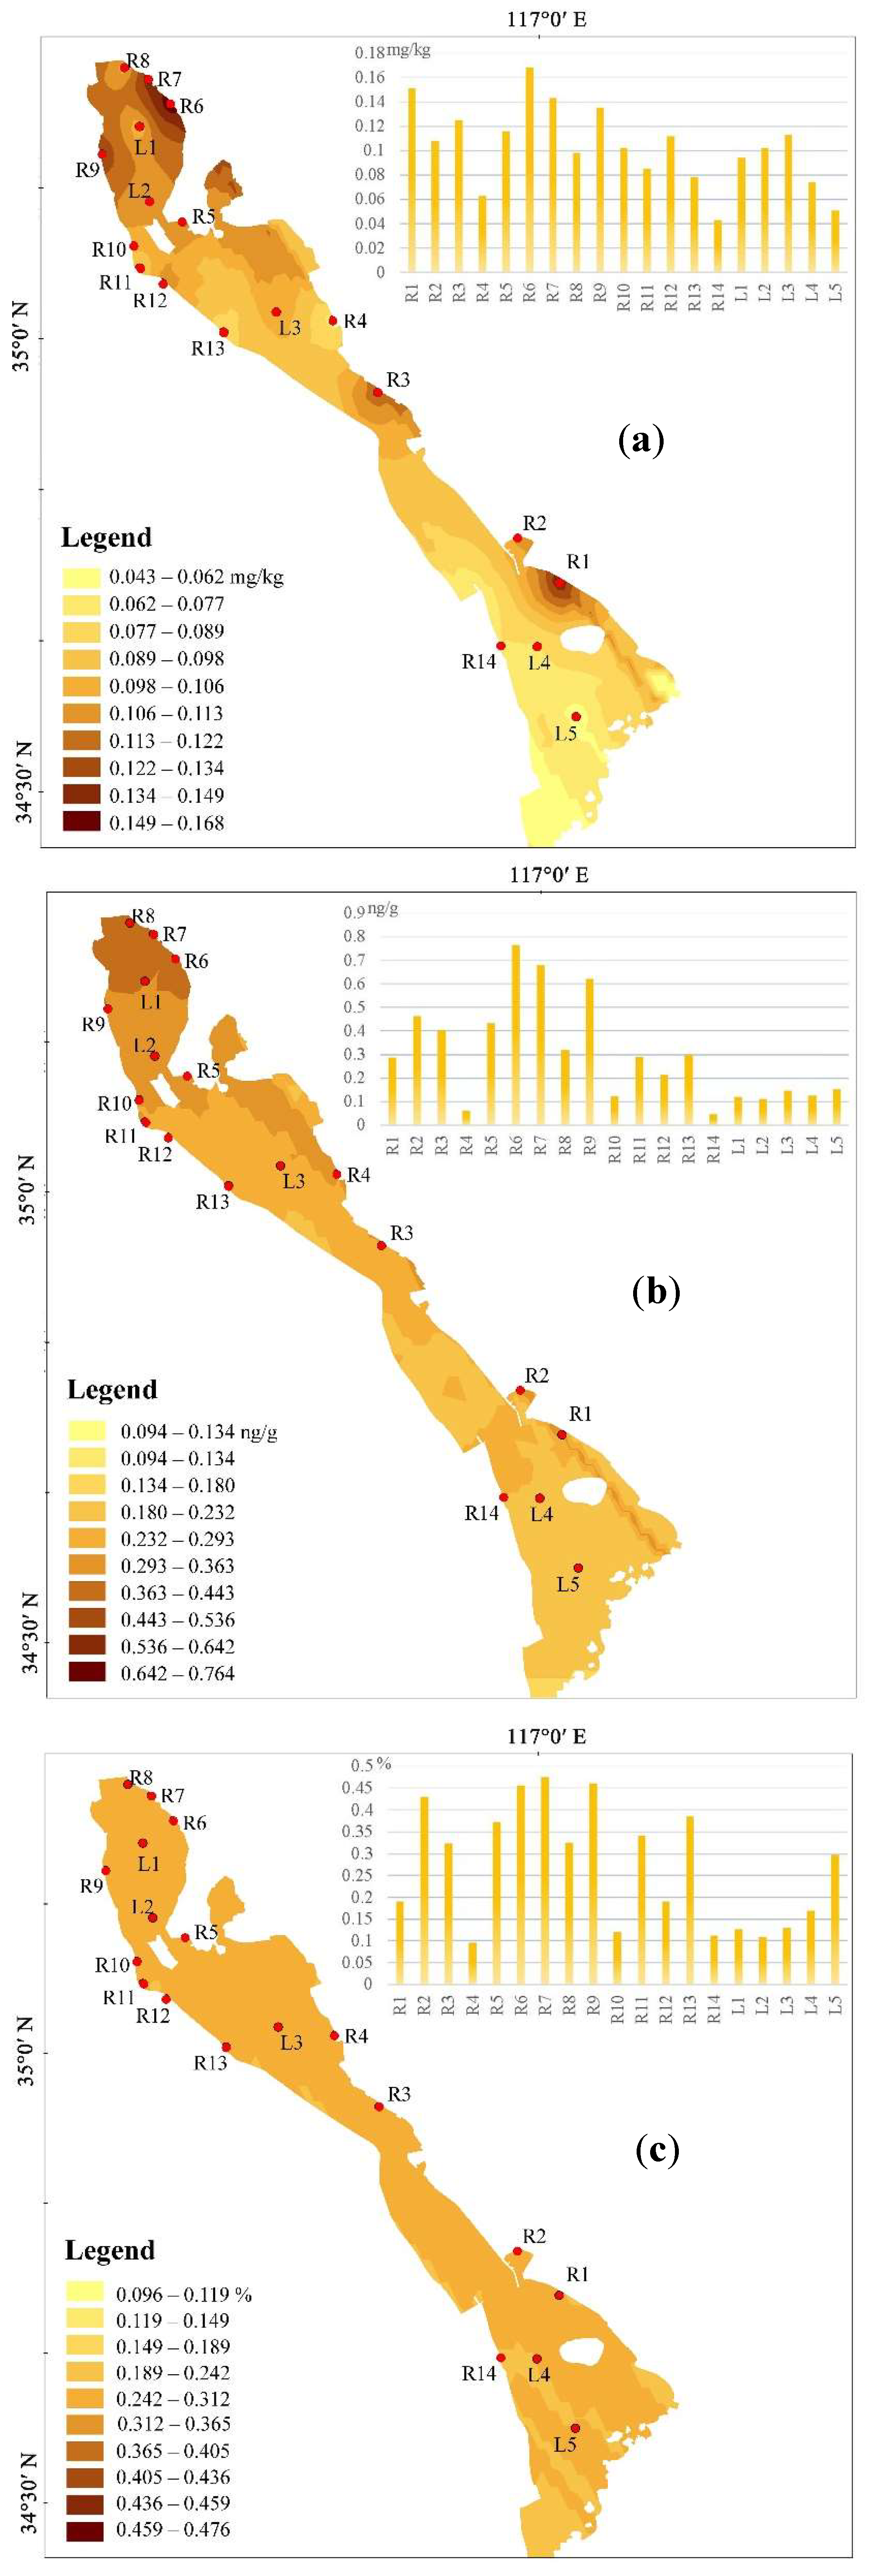
The THg content was higher in the sediment of inflow river estuaries located in the upper lake, which belonged to Nanyang Lake (Figure 4a). In particular, in this area, sites R6, R7, and R9 were heavily polluted with THg contents of 0.168 mg/kg, 0.143 mg/kg, and 0.135 mg/kg, respectively. The maximum content of Hg was found at site R6 (Si River), which might be attributed to the many coal enterprises situated closely on the bank of these rivers, such as Dongliang Coal Enterprise, Xingmei Coal Trading Limited Company, and Wanglou Coal Mining Group. In addition, sites R1 and R3 were heavily polluted by Hg, with THg contents of 0.151 mg/kg and 0.125 mg/kg, respectively. The THg content of the lake sediment was higher in the upper lake than in the lower lake. In conclusion, the Hg pollutants carried by the river had a potential risk of diffusing into the central region of Nansi Lake.
As shown in Figure 4b, the spatial distribution of MMHg was similar to that of THg. For the estuary sediment, the MMHg content was higher in the sediment at sites R6, R7, and R9 than at other sites, with contents of 0.764, 0.681, and 0.621 ng/g, respectively. Therefore, the spatial distribution of MMHg was similar to that of THg. A possible reason for this result was that MMHg was mainly derived from Hg methylation in the upper lake. In this area, the TOC and AVS contents were also relatively high. In particular, the TOC and AVS contents at site R6 were higher than those at the other sites. The abundant TOC in the sediment indicated that the activity of microbes was high, which consumed oxygen and eventually led to a reducing environment. Mercury methylation is mainly a microbiological process in reducing environments. Moreover, sulfate-reducing bacteria also play an important role in this process [40]. Therefore, the geochemical conditions of sites R6, R7, and R9 were suitable for Hg methylation. However, the content of MMHg at sites R1 and R3 was not obviously higher than that at the other sites, which was inconsistent with the spatial trend of THg. This might be attributed to the MMHg in the sediment of sites R1 and R3 being mainly derived from exogenous pollution. For the lake sediment, the MMHg contents were ranked as L5 > L3 > L4> L1 > L2. Sites L1 and L2 were close to the estuaries with low MMHg contents. Therefore, the diffusion risk of MMHg might be acceptable.
As shown in Figure 4c, for the estuary sediment, the %MMHg value was relatively high at sites R2, R5, R6, R7, R9, and R13, with %MMHg of more than 0.35%. For the lake sediment, the %MMHg level was lower at sites L1–L3 than at sites L4 and L5. Therefore, the %MMHg values increased from the upper to the lower lake. In general, the transformation of Hg to methylmercury in the estuary sediment of the upper region of Nansi Lake and the lower region of the Nansi Lake should be given more attention. It is necessary to find out the cause of high conversion as soon as possible to prevent the formation of MMHg.
3.4. Relationship between THg and MMHg and Mineral Phases
Correlation analysis showed that THg was positively correlated with AVS, TOC, and clay for all sediment samples (Figure 5). For the estuary sediment, the correlation coefficients (R2) between THg and AVS, TOC, and clay were 0.274, 0.447 (p < 0.001), and 0.478 (p < 0.001), respectively. For the lake sediment, the R2 values were 0.388, 0.494 (p < 0.001), and 0.185, respectively. Hence, THg in all sediment samples might be influenced by the TOC content of the sediment. A previous study showed that river sediment with a high content of OM had the potential to adsorb and retain Hg [41]. Organic matter plays an important role in controlling the distribution of Hg in sediment [42,43,44]. In addition, OM is known or suspected to be a major reservoir of Hg in many modern and ancient sediments [45,46]. The OM-bound Hg might be a dominant host phase in the sediment of Nansi Lake and its inflow river estuaries. Chakraborty et al. demonstrated that Hg preferentially combined with OM in lacustrine sediment under oxic conditions [45]. However, Hg–sulfide complexes were the main host phase of Hg in sediment under intensely sulfidic and anoxic conditions due to the stronger affinity of Hg for sulfide, with stable constants of 1023 to 1038, which were higher than those of Hg–organic complexes (1022 to 1028) [47]. Therefore, Hg in the estuary and central lake sediment preferred to combine with TOC, which might be due to the relatively oxic conditions and the lack of sulfide. Meanwhile, the positive correlation between AVS and THg is weaker than that between TOC and THg. This supports the conjecture that there is a lack of sulfide in the sediments of the Nansi Lake and its inflow river estuary. In addition, the coprecipitation process of H2S and Hg also determined the positive correlation between AVS and Hg in the sediment, which might be because Hg could be released to pore waters through organic decay and absorbed by authigenic phases. Moreover, the correlation coefficient between AVS and THg is lower in estuarine sediments than in lake sediments. This process occurred in oxic conditions and limited the transfer of Hg to sedimentary sulfides. The estuary sediment generally contained more oxygen due to the fluidity of the overlying water. Therefore, Hg might prefer to combine with sulfide in the central lake sediment rather than in the estuary sediment. Positive correlations between THg and clay in all sediment samples might be attributed to the stronger binding affinity of the finer-grained sediment [26]. This result was consistent with the conclusion reported by Sun et al. [38] and Chen et al. [31] in which clay generally contained abundant OM, which exhibited a higher adsorption capacity for heavy metal ions and immobilized them in sediment. Second, clay minerals are the dominant substance in metal-rich minerals in natural sediment, especially for estuary sediment. The metal-rich minerals also contained small amounts of metal oxides, sulfides, and pyroxenes. The special structure of metal-rich minerals was easily weathered and deposited in sediment. Therefore, heavy metals (Hg) were mostly found in minerals in fine-grained sediment [38].
Methylmercury in the inflow river estuary sediment of Nansi Lake was positively correlated with AVS, TOC, and clay, with R2 values of 0.050, 0.187, and 0.265, respectively (Figure 5). However, the MMHg content in lake sediment was negatively correlated with AVS, TOC, and clay content, which was contrary to the results for the inflow river estuary sediment (Figure 5). The correlation between MMHg and sediment properties was not significant in either estuary or lake sediment, which was different from previous research [3,48,49]. Previous studies have demonstrated that the biochemical cycle of sulfur in river estuary sediment can affect the formation of MMHg [21]. Mirlean et al. showed that MMHg is significantly negatively correlated with AVS [43]. However, King et al. [50] and Cesário et al. [51] observed that MMHg was positively correlated with AVS. Therefore, the effect of AVS on microbial Hg methylation is complex [52,53]. In this study, we speculated that MMHg in the lake sediment might be affected by both terrestrial input and in situ methylation, which is negatively related to the sedimentary properties. In addition, some uncertain factors including microbial methylation and demethylation, reduction by meroperin-mediated pathways, oxidative demethylation processes, and photochemical degradation of MMHg might also affect MMHg in the sediment. Relevant studies also suggested that increasing temperature can release the adsorbed Hg from OM and minerals of sediment and increase the bioavailability and methylation of Hg [54,55,56]. Therefore, the specific reasons need further examination. TOC and clay in the estuary and lake sediment were not significantly correlated with MMHg in this study. Ethier et al. [57] demonstrated that the correlation between MMHg and TOC (clay) likely depended on the correlation between MMHg and THg. Therefore, TOC and clay might have no obvious influence on the Hg methylation process.
For the estuary sediment, %MMHg was not significantly correlated with AVS, TOC, or clay (Figure 5). However, for the lake sediment, %MMHg was significantly negatively correlated with AVS, TOC, and clay. Pyrite and AVS were found to be inversely correlated with MMHg and %MMHg [58]. In addition, the inhibition of inorganic sulfides for Hg methylation occurred under anoxic conditions. The oxygen content was relatively higher in the estuary sediment than in the central lake sediment, which might account for the weaker correlation between% MMHg and AVS in estuarine sediment than lake sediment. The potential of %MMHg in the lake sediment was influenced by the physicochemical properties of sediment (TOC and clay) and exhibited the high negative correlation with TOC, suggesting the key role of OM in governing the process of Hg methylation. The TOC content in the sediment controlled the partitioning of Hg between overlying water and sediment due to the strong binding affinity between OM and Hg. Therefore, TOC exhibited a negative correlation with Hg methylation by reducing Hg bioavailability for Hg-methylation microbes and inhibiting Hg participation in the process of Hg methylation. Wu et al. [59] found that the %MMHg value in the water-sediment system was influenced by the sources of OM. The %MMHg value dominated by autochthonous OM was higher than that dominated by allochthonous OM. In this study, the negative correlation between %MMHg and TOC indicated that TOC in this condition might be allochthonous, which also verified the aforementioned results that the riverine input was a main source for TOC in the lake sediment. In general, the reasons that may influence the %MMHg level were not completely clear. The sedimentary system is complex, and %MMHg is influenced by many factors. Chemical and biological factors might also play a role in addition to redox conditions and the THg content. Studies have shown that Hg demethylation is also a biological process that includes organic Hg lyase, catalytic, and co-metabolic processes [22], which usually occur at the same time as the methylation of Hg and the demethylation of MMHg in the sediment. Therefore, we speculated that %MMHg might also be affected by biological demethylation in the sediment.
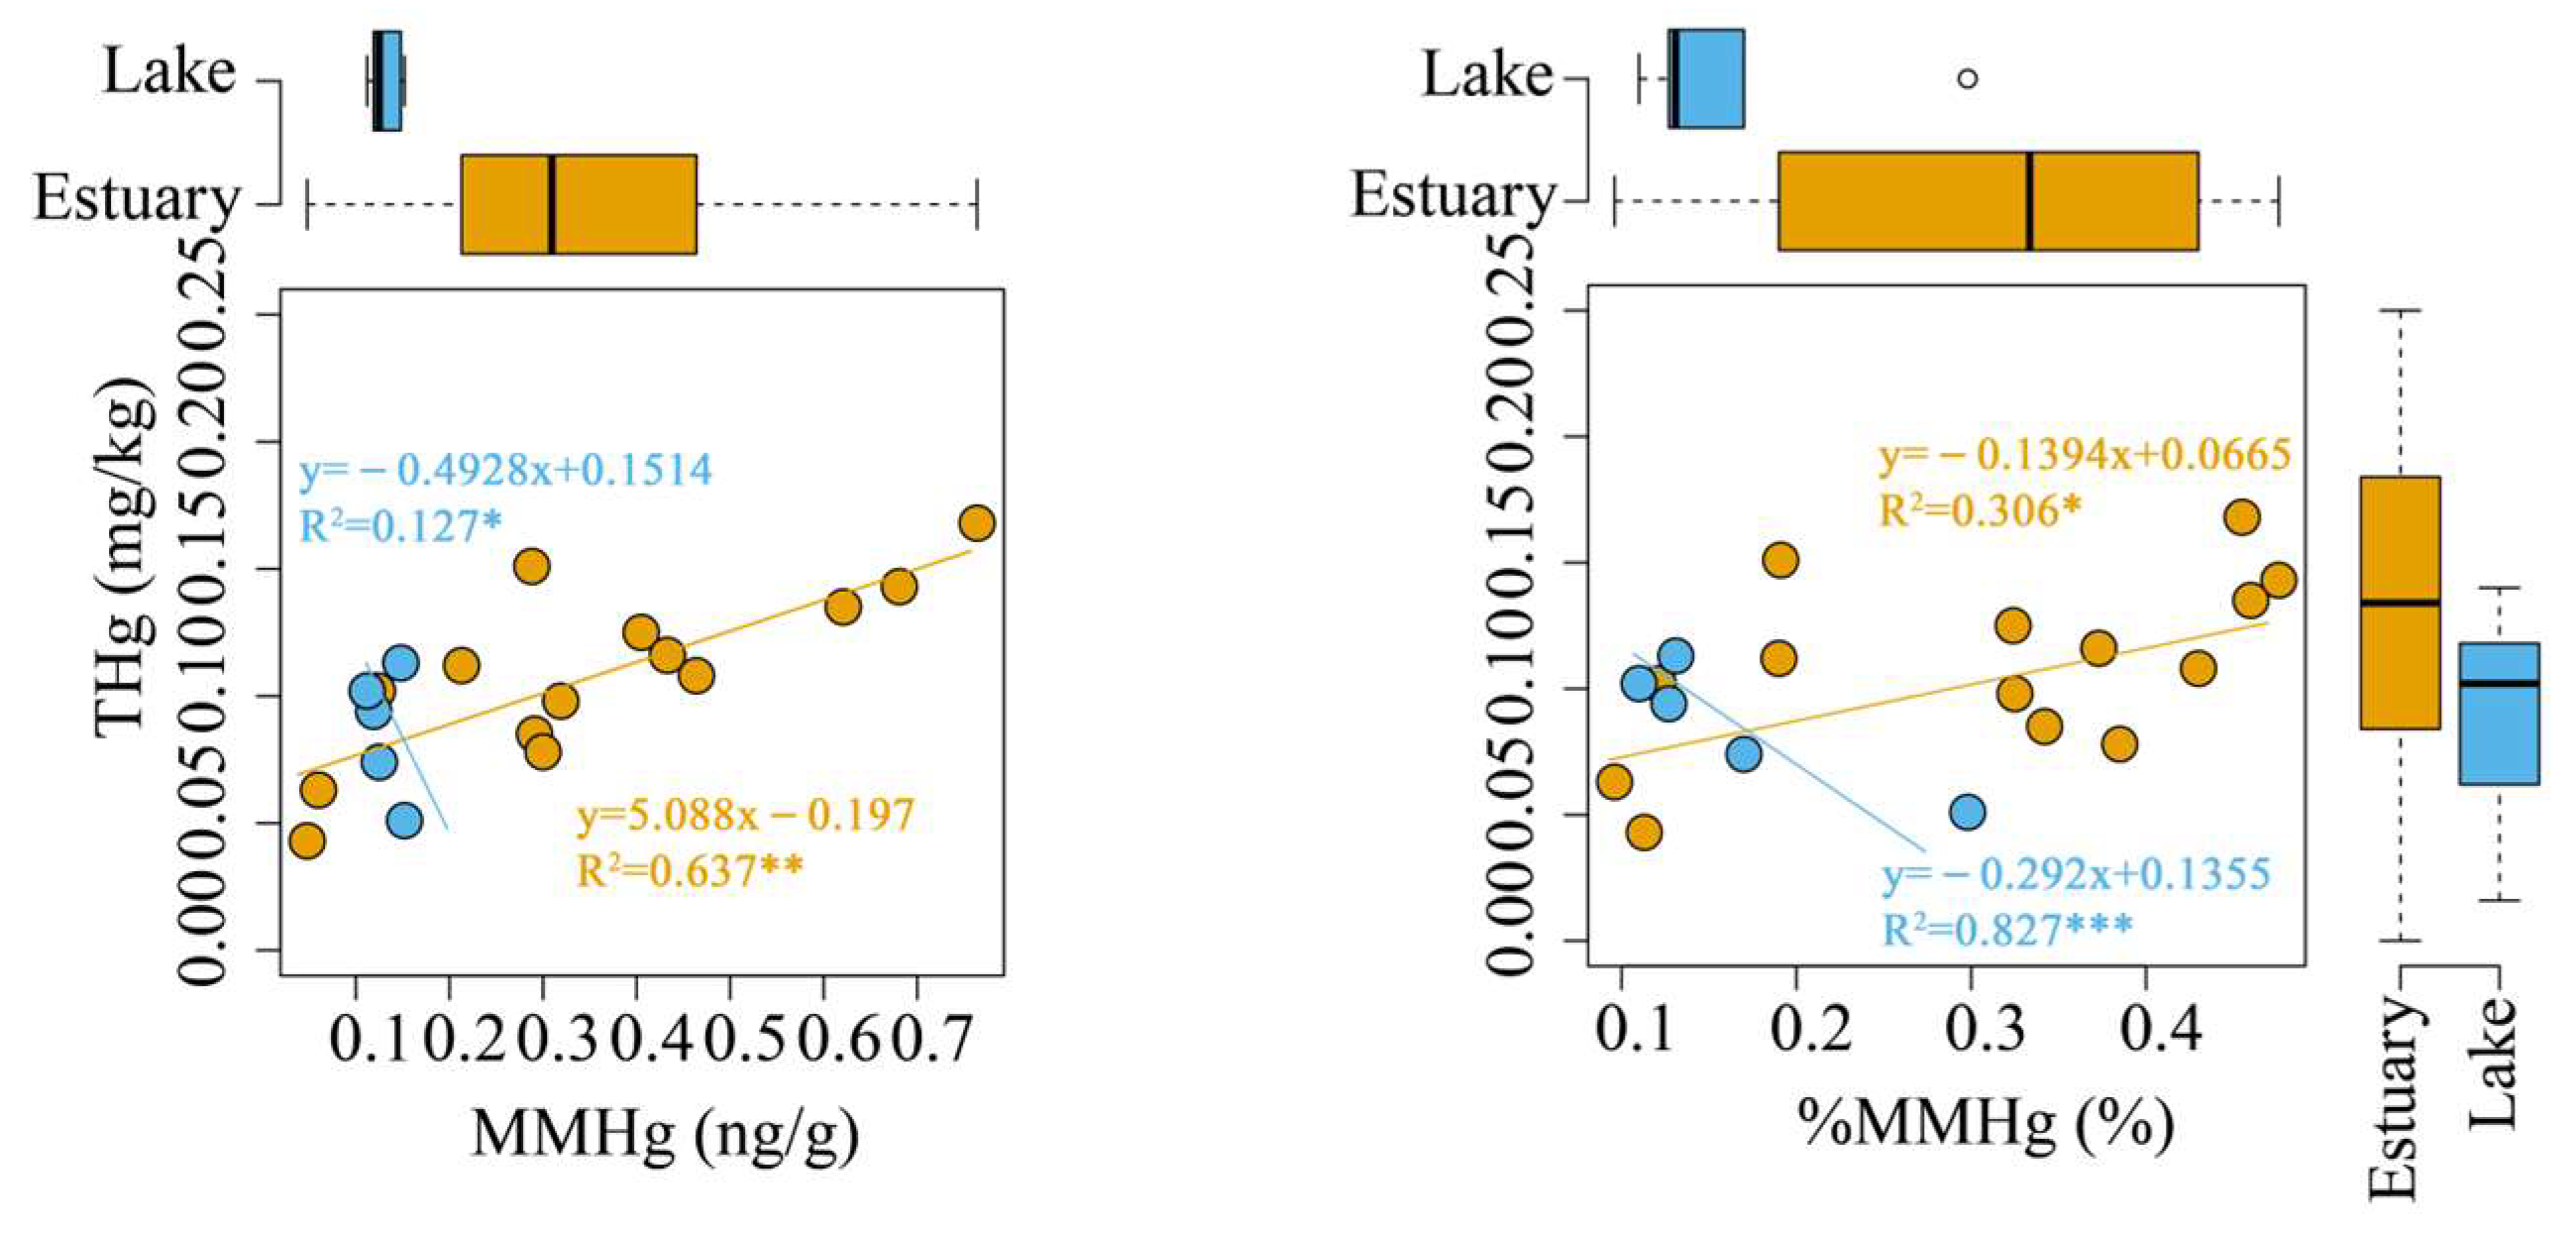
For estuary sediment, THg was significantly positively correlated with MMHg (R2 = 0.637, p < 0.01) and %MMHg (R2 = 0.306, p < 0.05, Figure 6). For the lake sediment, a significant negative correlation was observed between THg and MMHg (R2 = 0.127, p < 0.05) and between THg and %MMHg (R2 = 0.827, p < 0.001), which was inconsistent with the results obtained by Benoit [27], who found that THg was significantly positively correlated with MMHg (and %MMHg) in the sediment of estuaries and lakes. Relevant studies have shown that sediment is the key material for methylation [60], and the transformation of inorganic Hg to MMHg in sediment is mainly in situ by microorganisms in sediment [61]. However, a significantly negative correlation between Hg and MMHg (%MMHg) was observed in the sediment of Nansi Lake, which was consistent with the negative correlation between MMHg and %MMHg with AVS, TOC, and clay at the lake’s sampling sites. This might be because there was a strong demethylation process in the sediment of Nansi Lake; for example, the demethylation process of sulfate-reducing bacteria might occur in the sediment [62], but this conjecture still needs further exploration.
3.5. Potential Source Analysis
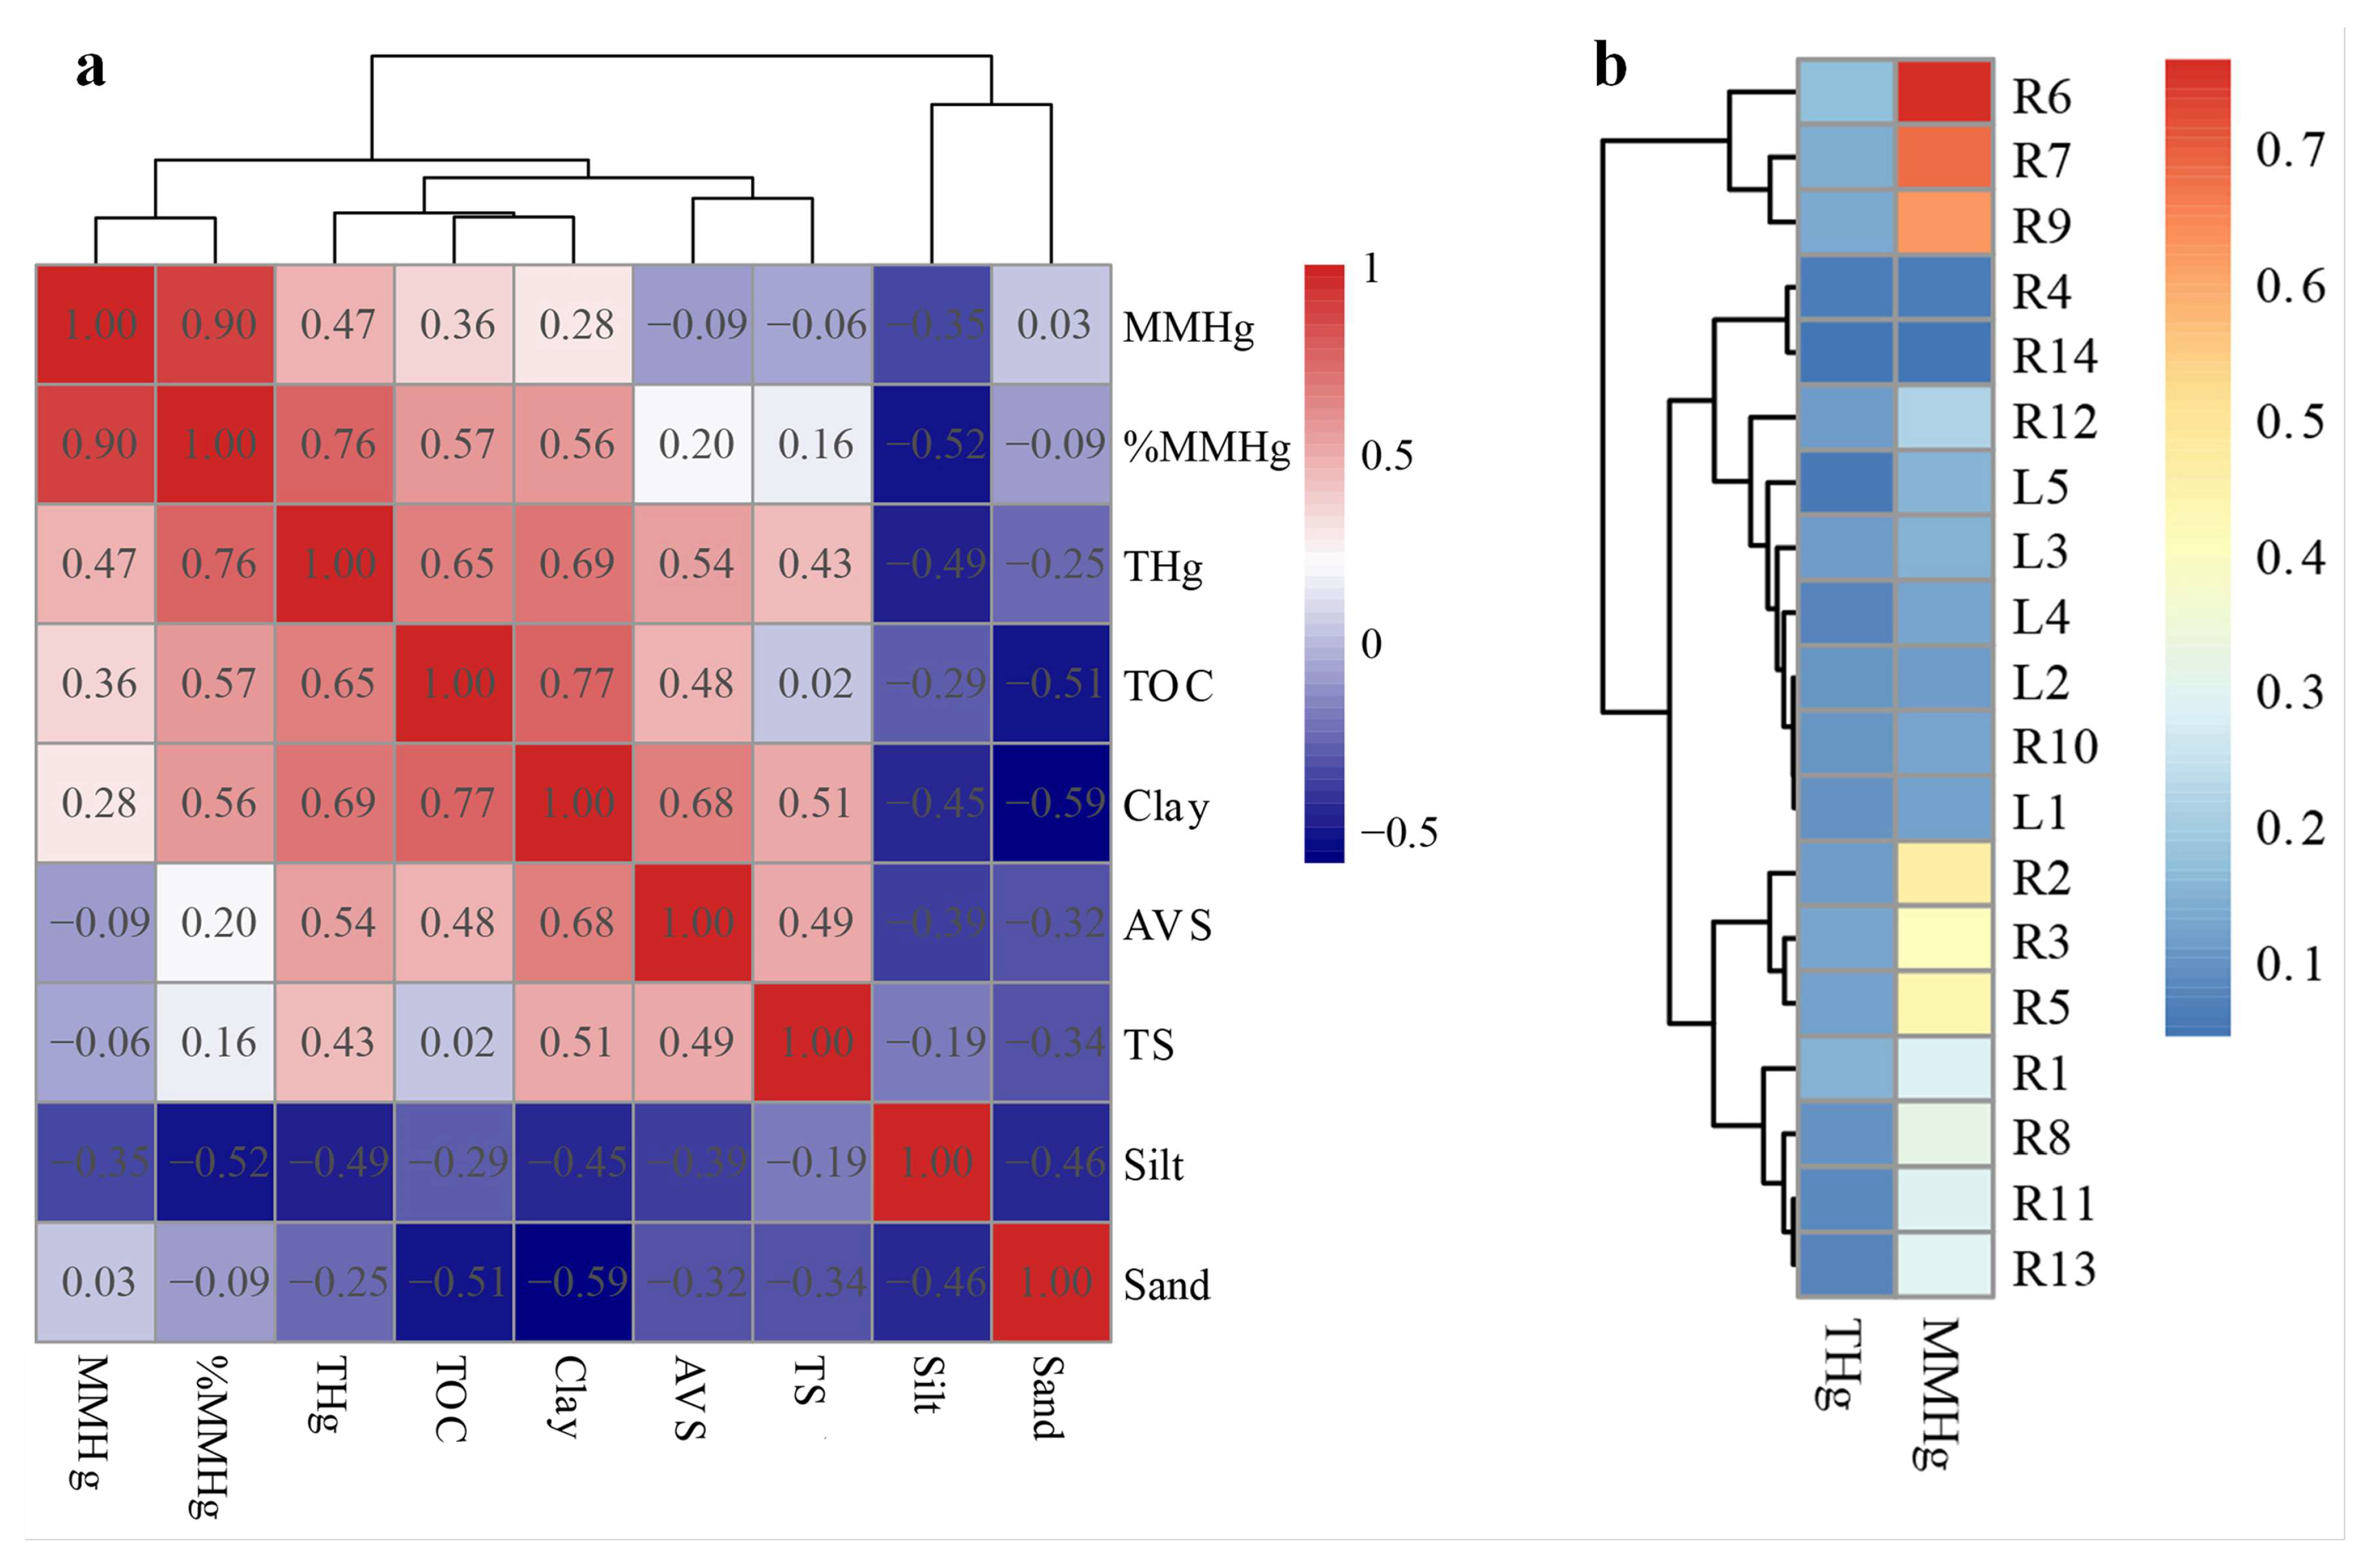
To better understand the sources of THg and MMHg in the sediment, clustering analysis was used to divide pollutants derived from various sources (Figure 7a) and sampling sites with diverse pollution levels (Figure 7b). The AVS and TS contents were classified into the same cluster. MMHg and %MMHg were classified into the same group. THg, clay, and TOC were in the same group. These results demonstrated that TS and AVS in the lake sediment were not derived from the same source as THg and MMHg. The distribution pattern of THg and MMHg was not mainly influenced by AVS. The methylation of Hg was not a dominant way to produce MMHg in the sediment, and MMHg might be derived from other anthropogenic sources near Nansi Lake. Clay and TOC in the sediment exerted a more significant influence on THg than MMHg. Therefore, the adsorption capacity and redox condition of sediment might be the main factors controlling the THg content of sediment. However, the accumulation of MMHg in the sediment of Nansi Lake might be mainly influenced by other environmental factors such as temperature and pH. Based on the THg and MMHg contents in the sediment of the lake and estuary, the content values were normalized as log C, and cluster analysis was carried out with the hot spot graph. All sampling sites were divided into three clusters according to the comprehensive levels of THg and MMHg, which included heavily polluted sites (R6, R7, and R9), moderately polluted sites (R2, R3, and R5), and relatively lightly polluted sites (R1, R8, R11, and R13). Other sampling sites were lightly polluted. Therefore, THg and MMHg in the sediment of Nansi Lake were mostly derived from sites R6, R7, and R9. The waste discharge of coal-mining enterprises along these three river banks should be given more attention.
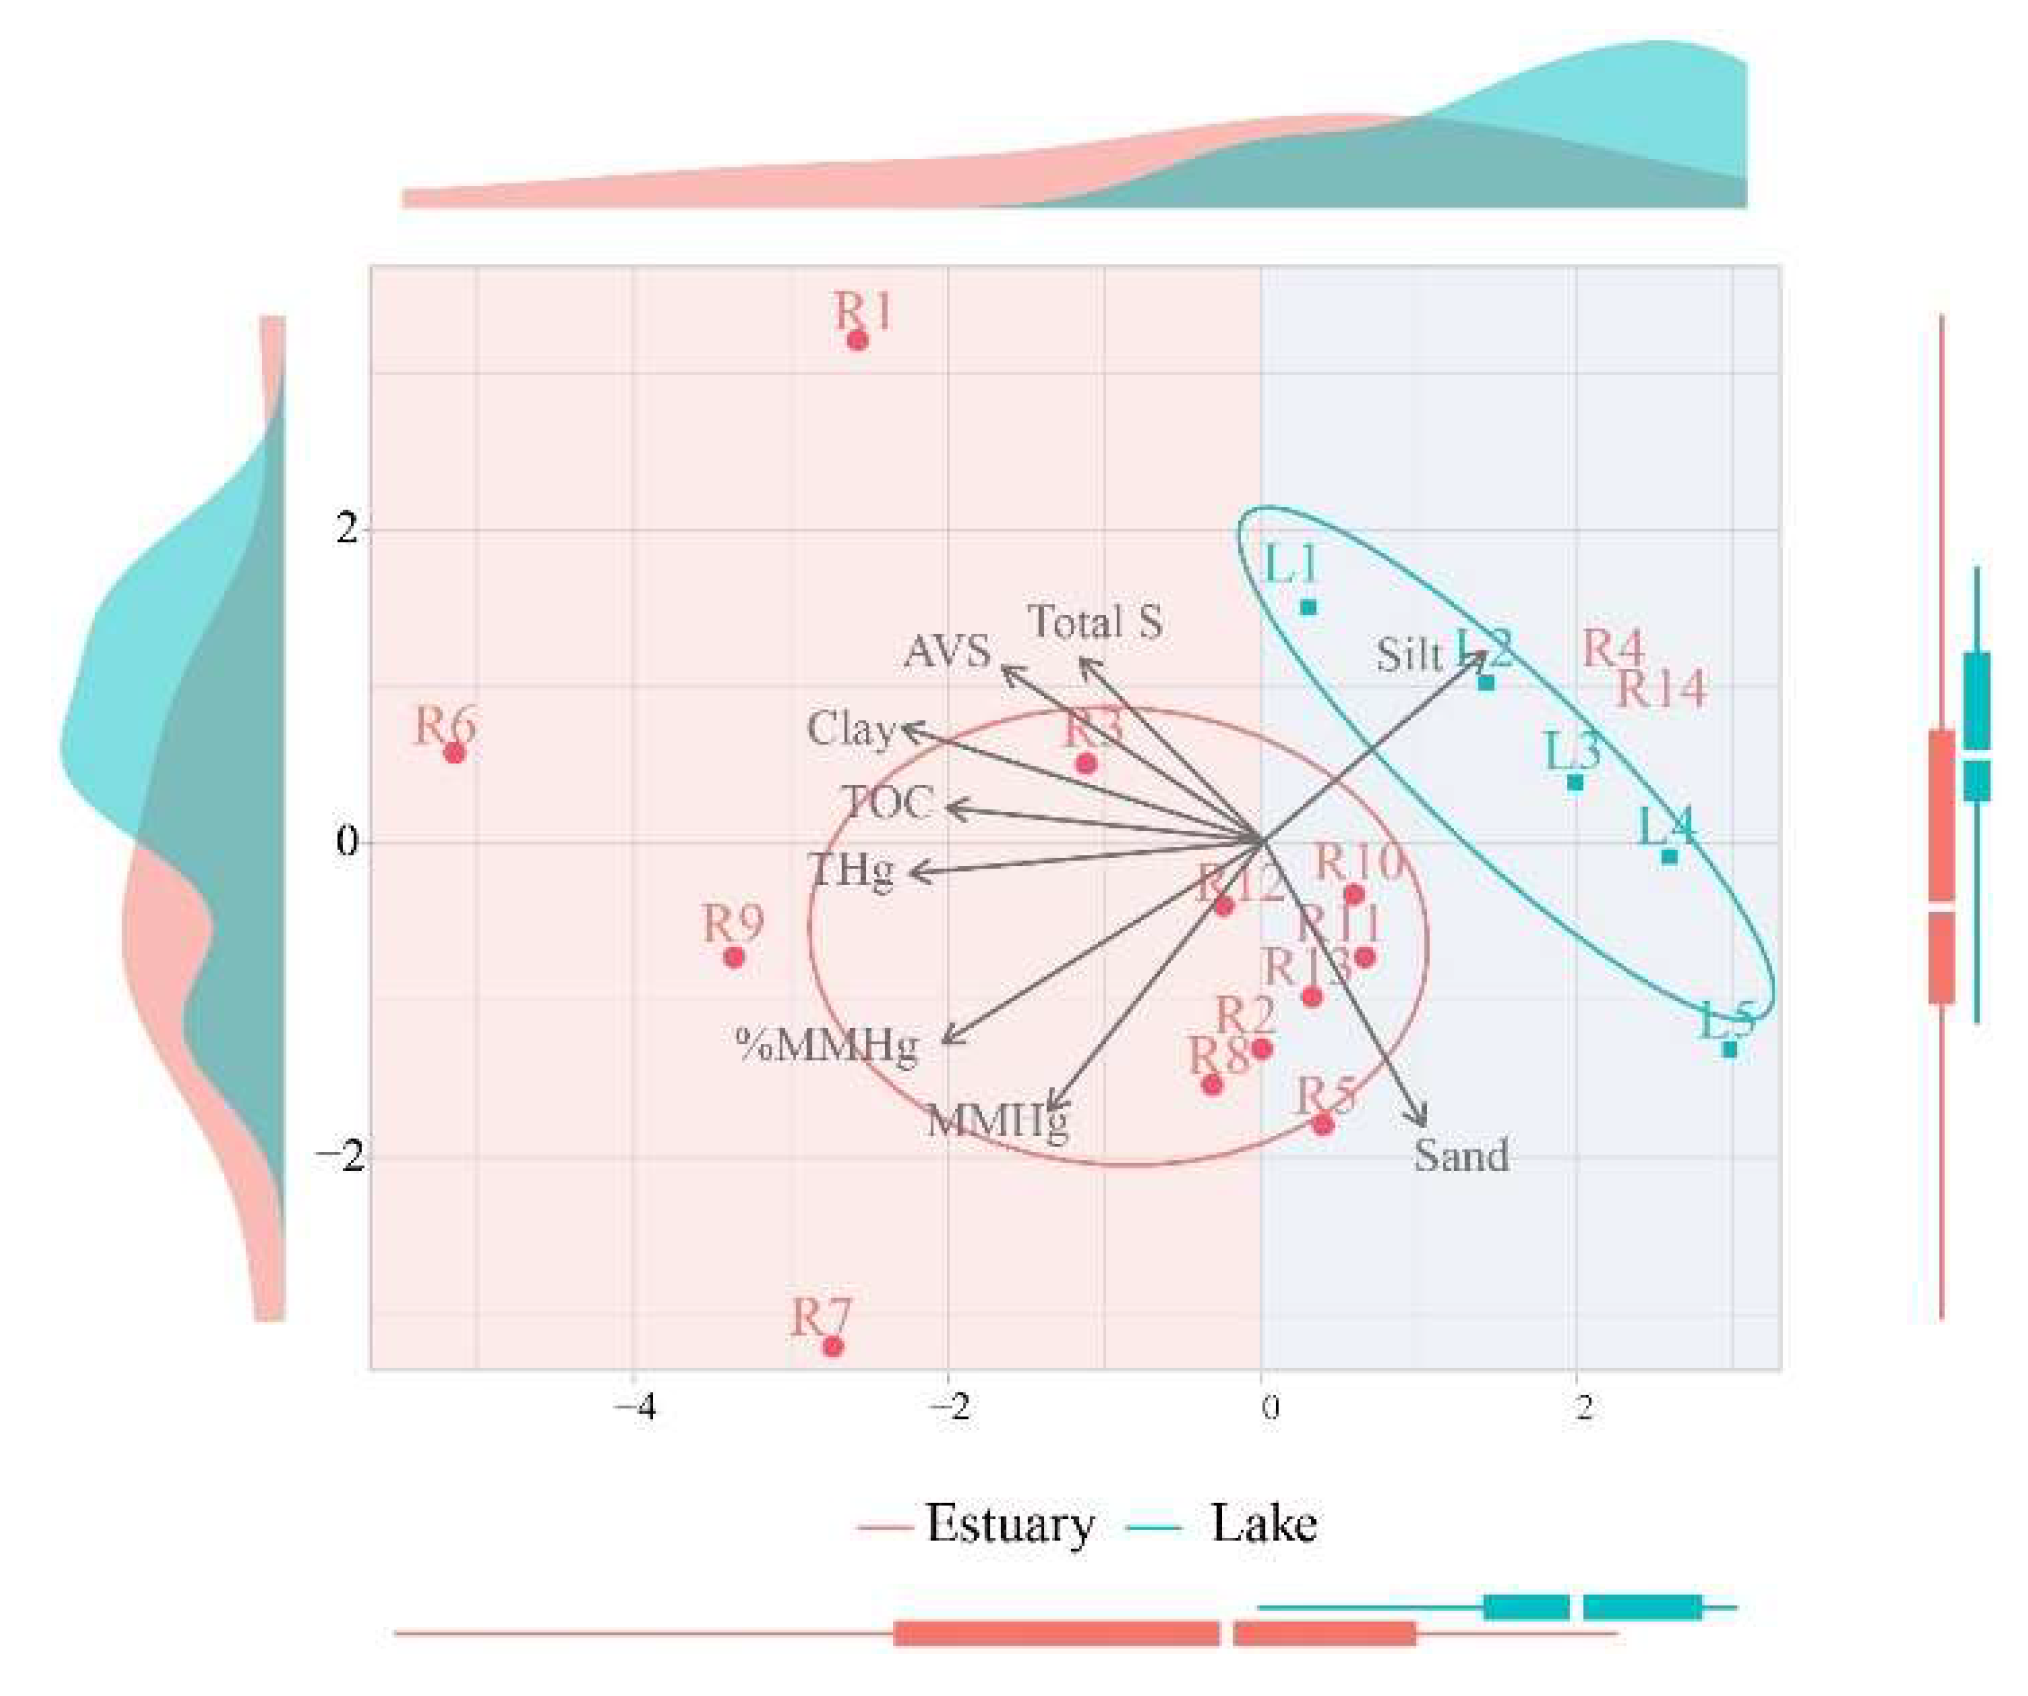
These classification results were validated by using principal component analysis (PCA) (Figure 8). The variables of AVS, clay, TOC, TS, THg, and MMHg were selected for analysis in PCA. The sampling sites of estuaries and the lake were significantly divided in PCA under the 95% confidence level based on the basic properties of sediment and the contents of THg and MMHg. As shown in Figure 8, the negative axis of PC1 indicated one sediment that contained high contents of THg, TOC, clay, AVS, TS, and MMHg. The positive axis of PC1 indicated that the sediment contained a high percentage of silt/sand but low contents of THg, MMHg, TS, and TOC. The sampling sites of the lake were all clustered into the positive part of PC1, which implied that the relatively coarse sediment contained lower contents of Hg, TOC, MMHg, and TS. However, most sampling sites in the estuaries were divided into the negative part of PC1, which was a fine-grained and Hg (S)-rich sediment. Therefore, clay, TOC, TS, THg, and MMHg in the sediment of Nansi Lake were mainly derived from riverine input rather than authigenic input and were sensitive to human activities.
4. Conclusions
The levels of THg, MMHg, and %MMHg in the sediment of inflow river estuaries were obviously higher than those in Nansi Lake. The contents of THg and MMHg in estuarine sediments of upper lakes were higher than those of other regions. The THg content in the sediment of the upper lake was obviously higher than that in the lower lake, which was contrary to the distribution tendency of MMHg. The THg was significantly positively correlated with MMHg and %MMHg in estuarine sediment but had significant negative correlation with MMHg and %MMHg in lake sediment. Correlation analysis showed that THg in all sediment samples was significantly correlated with TOC, clay, and AVS. However, MMHg did not show the same correlations as THg. The %MMHg in the lake sediment was significantly inhibited by the high contents of AVS, clay, and TOC. According to cluster analysis and PCA, THg, clay, and TOC in the sediment of Nansi Lake were derived from the same sources, which were different from TS and MMHg. However, clay, TOC, TS, THg, and MMHg might mostly derive from riverine input and were sensitive to human activities.
Author Contributions
S.X., conceptualization, methodology, software, and writing—original draft; B.W., methodology, software, and investigation; Y.Y., software and investigation; S.W., methodology, writing—review and editing, and supervision. All authors have read and agreed to the published version of the manuscript.
Funding
This work is supported by the China Postdoctoral Science Foundation (No. 2013M540103) and the Project of Natural Science Foundation of Shandong Province, China (No. ZR2018DM007).
Data Availability Statement
All data will be made available on request.
Acknowledgments
We are very grateful for the funding provided by Shandong Lunan Geological Engineering Survey Institute. We are also very grateful to Qufu Normal University for providing us with necessary experimental conditions and environment.
Conflicts of Interest
The authors declare no conflict of interest.
References
- Wang, S.; Jia, Y.; Wang, S.; Wang, X.; Wang, H.; Zhao, Z.; Liu, B. Total mercury and monomethylmercury in water, sediments, and hydrophytes from the rivers, estuary, and bay along the Bohai Sea coast, northeastern China. Appl. Geochem. 2009, 24, 1702–1711. [Google Scholar] [CrossRef]
- Lin, Y.; Vogt, R.; Larssen, T. Environmental mercury in China: A review. Environ. Toxicol. Chem. 2012, 31, 2431–2444. [Google Scholar] [CrossRef] [PubMed] [Green Version]
- Zhang, C. Global distribution and environmental drivers of methylmercury production in sediments. J. Hazard. Mater. 2021, 407, 124700. [Google Scholar] [CrossRef]
- Wang, D.; Yang, Y.; Peng, R.; Huang, L. Distribution Characteristics and Influencing Factors of Mercury in Soil around Some Coal-Fired Power Plant of Inner Mongolia. Chin. J. Environ. Eng. 2015, 9, 6135–6140. [Google Scholar]
- Yu, C.; Xiao, W.; Xu, Y.; Sun, X.; Wang, X. Spatial-temporal characteristics of mercury and methylmercury in marine sediment under the combined influences of river input and coastal currents. Chemosphere 2021, 274, 129728. [Google Scholar] [CrossRef] [PubMed]
- Yu, C.; Xu, Y.; Yan, Y.; Xiao, W.; Liu, M.; Cheng, M.; He, W.; Xu, F.; Wang, X. Mercury and methylmercury in China’s lake sediments and first estimation of mercury burial fluxes. Sci. Total Environ. 2021, 770, 145338. [Google Scholar] [CrossRef]
- Li, X.N.; Jiao, W.T.; Xiao, R.B.; Chen, W.P.; Chang, A.C. Soil pollution and site remediation policies in China: A review. Environ. Rev. 2015, 23, 150318143344008. [Google Scholar] [CrossRef]
- Haris, H.; Aris, A.Z.; bin Mokhtar, M. Mercury and methylmercury distribution in the intertidal surface sediment of a heavily anthrophogenically impacted saltwater-mangrove-sediment interplay zone. Chemosphere 2017, 166, 323–333. [Google Scholar] [CrossRef]
- Sperfeld, M.; Diekert, G.; Studenik, S. Community dynamics in a nitrate-reducing microbial consortium cultivated with p-alkylated vs. non-p-alkylated aromatic compounds. FEMS Microbiol. Ecol. 2018, 95. [Google Scholar] [CrossRef]
- Zhang, M.; Li, C.; Ma, X.; Yang, L.; Ding, S. Evaluating the mercury distribution and release risks in sediments using high-resolution technology in Nansi Lake, China. J. Soils Sediments 2021, 21, 3466–3478. [Google Scholar] [CrossRef]
- Myers, G.J.; Davidson, P.W.; Cox, C.; Shamlaye, C.F.; Palumbo, D.; Cernichiari, E.; Sloane-Reeves, J.; Wilding, G.E.; Kost, J.; Huang, L.S.; et al. Prenatal methylmercury exposure from ocean fish consumption in the Seychelles child development study. Lancet 2003, 361, 1686–1692. [Google Scholar] [CrossRef] [PubMed]
- Zhao, H.; Yan, H.; Zhang, L.; Sun, G.; Li, P.; Feng, X. Mercury contents in rice and potential health risks across China. Environ. Int. 2019, 126, 406–412. [Google Scholar] [CrossRef] [PubMed]
- Tang, W.-L.; Liu, Y.-R.; Guan, W.-Y.; Zhong, H.; Qu, X.-M.; Zhang, T. Understanding mercury methylation in the changing environment: Recent advances in assessing microbial methylators and mercury bioavailability. Sci. Total Environ. 2020, 714, 136827. [Google Scholar] [CrossRef] [PubMed]
- Jia, Q.; Zhu, X.-M.; Wang, Q.; Fu, H.-H.; Hao, Y.-Q.; He, J.; Yang, Z.-L. Effects of Microbial Activities on Mercury Methylation in Farmland near Mercury Mining Area. Huan Jing Ke Xue Huanjing Kexue 2017, 38, 3020–3027. [Google Scholar] [CrossRef] [PubMed]
- Paranjape, A.R.; Hall, B.D. Recent advances in the study of mercury methylation in aquatic systems. Facets 2017, 2, 85–119. [Google Scholar] [CrossRef]
- Ma, M.; Du, H.; Wang, D. Mercury methylation by anaerobic microorganisms: A review. Crit. Rev. Environ. Sci. Technol. 2019, 49, 1893–1936. [Google Scholar] [CrossRef]
- Han, S.; Obraztsova, A.; Pretto, P.; Deheyn, D.D.; Gieskes, J.; Tebo, B.M. Sulfide and iron control on mercury speciation in anoxic estuarine sediment slurries. Mar. Chem. 2008, 111, 214–220. [Google Scholar] [CrossRef]
- Hollweg, T.A.; Gilmour, C.C.; Mason, R.P. Methylmercury production in sediments of Chesapeake Bay and the mid-Atlantic continental margin. Mar. Chem. 2009, 114, 86–101. [Google Scholar] [CrossRef]
- Ren, H.; Ma, F.; Yao, X.; Shao, K.; Yang, L. Multi-spectroscopic investigation on the spatial distribution and copper binding ability of sediment dissolved organic matter in Nansi Lake, China. J. Hydrol. 2020, 591, 125289. [Google Scholar] [CrossRef]
- Oh, S.; Kim, M.-K.; Yi, S.-M.; Zoh, K.-D. Distributions of total mercury and methylmercury in surface sediments and fishes in Lake Shihwa, Korea. Sci. Total Environ. 2010, 408, 1059–1068. [Google Scholar] [CrossRef]
- Wang, J.; Dai, J.; Chen, G.; Jiang, F. Role of Sulfur Biogeochemical Cycle in Mercury Methylation in Estuarine Sediments: A Review. J. Hazard. Mater. 2021, 423, 126964. [Google Scholar] [CrossRef] [PubMed]
- Yin, J.; Yin, D.; Rui, W. Research Progress on Mercury Methylation in Sediments. Asian J. Ecotoxicol. 2014, 5, 819–831. Available online: http://en.cnki.com.cn/Article_en/CJFDTOTAL-STDL201405003.htm (accessed on 3 June 2022).
- Shi, T.; Cao, X.; Wang, S.; Dong, C.; Wang, R.; Liu, C.; Ren, Z. Distribution of Total Mercury and Methylmercury in the Sediment of the Nansi Lake, China. Fresenius Environ. Bull. 2012, 21, 2722–2729. [Google Scholar]
- Wang, Q.; Shen, W.; Ma, Z. Estimation of Mercury Emission from Coal Combustion in China. Environ. Sci. Technol. 2000, 34, 2711–2713. [Google Scholar] [CrossRef]
- Liu, J.P.; Li, A.C.; Xu, K.H.; Velozzi, D.M.; Yang, Z.S.; Milliman, J.D.; Demaster, D.J. Sedimentary features of the Yangtze River-derived along-shelf clinoform deposit in the East China Sea. Cont. Shelf Res. 2006, 26, 2141–2156. [Google Scholar] [CrossRef]
- Zhao, L.; Wang, R.; Zhang, C.; Yin, D.; Yang, S.; Huang, X. Geochemical controls on the distribution of mercury and methylmercury in sediments of the coastal East China Sea. Sci. Total Environ. 2019, 667, 133–141. [Google Scholar] [CrossRef]
- Benoit, J.M.; Gilmour, C.C.; Mason, R.P.; Riedel, G.S.; Riedel, G.F. Behavior of mercury in the Patuxent River estuary. Biogeochemistry 1998, 40, 249–265. [Google Scholar] [CrossRef]
- Wang, C.C.; Pan, D.W.; Han, H.T.; Hu, X.P. Distribution and contamination assessment of arsenic and mercury in surface sediments from the intertidal zone of Yantai Sishili Bay, China. Hum. Ecol. Risk Assess. 2018, 24, 2024–2035. [Google Scholar] [CrossRef]
- Fang, T.-H.; Lien, C.-Y. Different Mercury Species Partitioning and Distribution in the Water and Sediment of a Eutrophic Estuary in Northern Taiwan. Water 2021, 13, 2471. [Google Scholar] [CrossRef]
- García-Ordiales, E.; Covelli, S.; Braidotti, G.; Petranich, E.; Pavoni, E.; Acquavita, A.; Loredo, J. Mercury and arsenic mobility in resuspended contaminated estuarine sediments (Asturias, Spain): A laboratory-based study. Sci. Total Environ. 2020, 744, 140870. [Google Scholar] [CrossRef]
- Chen, C.-F.; Ju, Y.-R.; Lin, G.-T.; Chen, C.-W.; Dong, C.-D. Methylmercury in Industrial Harbor Sediments in Taiwan: First Observations on its Occurrence, Distribution, and Measurement. Int. J. Environ. Res. Public Health 2018, 15, 1765. [Google Scholar] [CrossRef] [PubMed] [Green Version]
- Baeyens, W.; Leermakers, M. Elemental mercury concentrations and formation rates in the Scheldt estuary and the North Sea. Mar. Chem. 1998, 60, 257–266. [Google Scholar] [CrossRef]
- Liu, F.; Yan, W.; Wand, W.; Gu, S.; Chen, Z. Pollution of heavy metals in the Pearl River Estuary and its assessment of potential ecological risk. Mar. Environ. Sci. 2002, 21, 34–38. [Google Scholar] [CrossRef]
- Ge, M.; Liu, G.; Liu, H.; Liu, Y. Distribution, bioavailability and contamination assessment of mercury and arsenic in the surface sediments from the Yellow River Estuary, China. Hum. Ecol. Risk Assess. Int. J. 2020, 27, 274–288. [Google Scholar] [CrossRef]
- Rolfhus, K.R.; Sakamoto, H.E.; Cleckner, L.B.; Stoor, R.W.; Babiarz, C.L.; Back, R.C.; Manolopoulos, H.; Hurley, J.P. Distribution and Fluxes of Total and Methylmercury in Lake Superior. Environ. Sci. Technol. 2003, 37, 865–872. [Google Scholar] [CrossRef]
- Wang, S.; Zhang, M.; Li, B.; Xing, D.; Wang, X.; Wei, C.; Jia, Y. Comparison of mercury speciation and distribution in the water column and sediments between the algal type zone and the macrophytic type zone in a hypereutrophic lake (Dianchi Lake) in Southwestern China. Sci. Total Environ. 2012, 417, 204–213. [Google Scholar] [CrossRef]
- Gomes, D.F.; Moreira, R.A.; Sanches NA, O.; do Vale, C.A.; Daam, M.A.; Gorni, G.R.; Bastos, W.R. Dynamics of (total and methyl) mercury in sediment, fish, and crocodiles in an Amazonian Lake and risk assessment of fish consumption to the local population. Environ. Monit. Assess. 2020, 192, 101. [Google Scholar] [CrossRef]
- Sun, X.; DFan Ming, L.; Yuan, T.; Yue, P.; Liao, H. Source identification, geochemical normalization and influence factors of heavy metals in Yangtze River Estuary sediment. Environ. Pollut. 2018, 241, 938. [Google Scholar] [CrossRef]
- Gopikrishna, V.G.; Kannan, V.M.; Binish, M.B.; Shu Kk Ur, M.A.; Mohan, M. Mercury in the sediments of freshwater lakes in Ny-lesund, Arctic. Environ. Monit. Assess. 2020, 192, 538. [Google Scholar] [CrossRef]
- Gilmour, C.C.; Elias, D.A.; Kucken, A.M.; Brown, S.D.; Palumbo, A.V.; Schadt, C.W.; Wall, J.D. Sulfate-Reducing Bacterium Desulfovibrio desulfuricans ND132 as a Model for Understanding Bacterial Mercury Methylation. Appl. Environ. Microbiol. 2011, 77, 3938–3951. [Google Scholar] [CrossRef] [Green Version]
- Parkpoin, P.; Thongra-Ar, W.; Delaune, R.D.; Jugsujinda, A. Adsorption and desorption of mercury by Bangpakong River sediments as influenced by salinities. Environ. Lett. 2001, 36, 623–640. [Google Scholar] [CrossRef] [PubMed]
- Kainz, M.; Lucotte, M.; Parrish, C.C. Relationships between Organic Matter Composition and Methyl Mercury Content of Offshore and Carbon-Rich Littoral Sediments in an Oligotrophic Lake. Can. J. Fish. Aquat. Sci. 2003, 60, 888–896. [Google Scholar] [CrossRef]
- Mirlean, N.; Andrus, V.E.; Baisch, P. Mercury pollution sources in sediments of Patos Lagoon Estuary, Southern Brazil. Mar. Pollut. Bull. 2003, 46, 331–334. [Google Scholar] [CrossRef]
- Sanei, H.; Goodarzi, F. Relationship between organic matter and mercury in recent lake sediment: The physical–geochemical aspects. Appl. Geochem. 2006, 21, 1900–1912. [Google Scholar] [CrossRef]
- Chakraborty, P.; Vudamala, K.; Coulibaly, M.; Ramteke, D.; Chennuri, K.; Lean, D. Reduction of mercury (II) by humic substances—Influence of pH, salinity of aquatic system. Environ. Sci. Pollut. Res. 2015, 22, 10529–10538. [Google Scholar] [CrossRef] [PubMed]
- Shen, J.; Feng, Q.; Algeo, T.J.; Liu, J.; Zhou, C.; Wei, W.; Liu, J.; Them, T.R., II; Gill, B.C.; Chen, J. Sedimentary host phases of mercury (Hg) and implications for use of Hg as a volcanic proxy. Earth Planet. Sci. Lett. 2020, 543, 116333. [Google Scholar] [CrossRef]
- Ravichandran, M. Interactions between mercury and dissolved organic matter—A review. Chemosphere 2004, 55, 319–331. [Google Scholar] [CrossRef]
- Duan, D.; Lei, P.; Lan, W.; Li, T.; Pan, K. Litterfall-derived organic matter enhances mercury methylation in mangrove sediments of South China. Sci. Total Environ. 2020, 765, 142763. [Google Scholar] [CrossRef]
- Gray, J.E.; Hines, M.E. Biogeochemical mercury methylation influenced by reservoir eutrophication, Salmon Falls Creek Reservoir, Idaho, USA. Chem. Geol. 2009, 258, 157–167. [Google Scholar] [CrossRef]
- King, J.K.; Harmon, S.M.; Fu, T.T.; Gladden, J.B. Mercury removal, methylmercury formation, and sulfate-reducing bacteria profiles in wetland mesocosms. Chemosphere 2002, 46, 859–870. [Google Scholar] [CrossRef]
- Cesário, R.; Hintelmann, H.; O’Driscoll, N.J.; Monteiro, C.E.; Caetano, M.; Nogueira, M.; Canário, J. Biogeochemical Cycle of Mercury and Methylmercury in Two Highly Contaminated Areas of Tagus Estuary (Portugal). Water Air Soil Pollut. 2017, 228, 257. [Google Scholar] [CrossRef]
- King, J.K.; Kostka, J.E.; Frischer, M.E.; Saunders, F.M. Sulfate-Reducing Bacteria Methylate Mercury at Variable Rates in Pure Culture and in Marine Sediments. Appl. Environ. Microbiol. 2000, 66, 2430–2437. [Google Scholar] [CrossRef] [Green Version]
- Liu, J.; Jiang, T.; Huang, R.; Wang, D.; Zhang, J.; Qian, S.; Yin, D. A simulation study of inorganic sulfur cycling in the water level fluctuation zone of the Three Gorges Reservoir, China and the implications for mercury methylation. Chemosphere 2017, 166, 31–40. [Google Scholar] [CrossRef] [PubMed]
- Bravo, A.G.; Bouchet, S.; Tolu, J.; Björn, E.; Mateos-Rivera, A.; Bertilsson, S. Molecular Composition of Organic Matter Controls Methylmercury Formation in Boreal Lakes. Nat. Commun. 2017, 8, 14255. [Google Scholar] [CrossRef] [Green Version]
- Regnell, O.; Watras, C.J. Microbial Mercury Methylation in Aquatic Environments: A Critical Review of Published Field and Laboratory Studies. Environ. Sci. Technol. 2019, 53, 4–19. [Google Scholar] [CrossRef] [PubMed]
- Lavoie, R.A.; Amyot, M.; Lapierre, J. Global Meta-Analysis on the Relationship Between Mercury and Dissolved Organic Carbon in Freshwater Environments. J. Geophys. Res. Biogeosci. 2019, 124, 1508–1523. [Google Scholar] [CrossRef] [Green Version]
- Ethier, A.L.M.; Scheuhammer, A.M.; Blais, J.M.; Paterson, A.M.; Mierle, G.; Ingram, R.; Lean, D.R.S. Mercury empirical relationships in sediments from three Ontario lakes. Sci. Total Environ. 2010, 408, 2087–2095. [Google Scholar] [CrossRef]
- Rickard, D.; Morse, J.W. Acid volatile sulfide (AVS). Mar. Chem. 2005, 97, 141–197. [Google Scholar] [CrossRef]
- Wu, Z.; Li, Z.; Shao, B.; Zhang, Y.; He, W.; Lu, Y.; Gusvitskii, K.; Zhao, Y.; Liu, Y.; Wang, X.; et al. Impact of dissolved organic matter and environmental factors on methylmercury concentrations across aquatic ecosystems inferred from a global dataset. Chemosphere 2022, 294, 133713. [Google Scholar] [CrossRef]
- DeLaune, R.D.; Jugsujinda, A.; Devai, I.; Patrick, W.H.J. Relationship of sediment redox conditions to methyl mercury in surface sediment of Louisiana Lakes. J. Environ. Sci. Health Part A 2004, 39, 1925–1933. [Google Scholar] [CrossRef]
- Gilmour, C.C.; Henry, E.A.; Mitchell, R. Sulfate stimulation of mercury methylation in freshwater sediments. Environ. Sci. Technol. 1992, 26, 2281–2287. [Google Scholar] [CrossRef]
- Huang, H.; Mangal, V.; Rennie, M.D.; Tong, H.; Simpson, M.J.; Mitchell, C.P.J. Mercury Methylation and Methylmercury Demethylation in Boreal Lake Sediment with Legacy Sulphate Pollution. Environ. Sci. Process. Impacts 2022, 24, 932–944. [Google Scholar] [CrossRef] [PubMed]
Figure 1.
Location map of the sampling sites.

Figure 2.
Spatial distribution of basic properties of sediment including (a) the total organic carbon (TOC) content, (b) the sediment grain composition, (c) the acid volatile sulfide (AVS) content, and (d) the total sulfide (TS) content.
Figure 2.
Spatial distribution of basic properties of sediment including (a) the total organic carbon (TOC) content, (b) the sediment grain composition, (c) the acid volatile sulfide (AVS) content, and (d) the total sulfide (TS) content.

Figure 3.
The content of (a) total Hg, (b) methylmercury, and (c) methylation rate of Hg.

Figure 4.
The spatial distribution of (a) total mercury (THg), (b) methylmercury (MMHg), and (c) methylation rate (%MMHg) in the estuarine and lake sediment.
Figure 4.
The spatial distribution of (a) total mercury (THg), (b) methylmercury (MMHg), and (c) methylation rate (%MMHg) in the estuarine and lake sediment.

Figure 5.
Correlation between THg, MMHg, and %MMHg and sediment properties. Blue dots represent sampling sites for lakes, while yellow dots represent sampling sites for estuaries. The box chart represents the concentration range of various substances in the lake or estuary, the lines in the box represent the average value, the bottom and top of the box represent the 25th and 75th percentile quantile, and the short lines at both ends represent the maximum and minimum values. ** represented significant level p < 0.01, and *** represented significant level p < 0.001.

Figure 6.
Correlation between THg with MMHg and %MMHg. Blue dots represent sampling sites for lakes, while yellow dots represent sampling sites for estuaries. The box chart represents the concentration range of various substances in the lake or estuary, the lines in the box represent the average value, the bottom and top of the box represent the 25th and 75th percentile quantile, and the short lines at both ends represent the maximum and minimum values. * represented significant level p < 0.05, ** represented significant level p < 0.01, and *** represented significant level p < 0.001.

Figure 7.
Cluster analysis of different pollutants (a) and sampling sites (b).

Figure 8.
Principal component analysis (PCA) of basic properties and Hg pollution levels of each sediment sampling site.
Figure 8.
Principal component analysis (PCA) of basic properties and Hg pollution levels of each sediment sampling site.


Table 1.
Comparation of estuary and lake sediment in Nansi Lake and other area.
| Site | Lake | THg | MMHg | %MMHg | Reference |
|---|---|---|---|---|---|
| mg/kg | ng/g | % | |||
| Estuary | Dagu Estuary, China | 0.036 | - | - | [28] |
| Danshuei River Estuary, China | 0.379 | - | - | [29] | |
| Asturias Estuary, Spain | 0.52 | - | - | [30] | |
| Kaohsiung Estuary, China | 0.149 | 0.31 | - | [31] | |
| Scheldt Estuary, Belgium | 0.18 | - | - | [32] | |
| Pearl River Estuary, China | 0.354 | - | - | [33] | |
| Lake | Yellow River, China | 0.015 | - | [34] | |
| Superior Lake, Canada | 0.088 | 0.21 | - | [35] | |
| Dianchi, China | 0.18 | 1.2 | - | [36] | |
| Amazonian Lake | 0.12 | 2 | 1.7 | [37] | |
| Chao Lake, China | 0.096 | - | - | [38] | |
| Tai Lake, China | 0.097 | - | - | [39] | |
| Daxingkai Lake, China | 1.66 | 1.66 | - | [6] | |
| Xiaoxingkai Lake, China | - | 0.78 | - | [6] | |
| Arctic freshwater lakes | 22.23 | 0.41 | - | [38] |
Disclaimer/Publisher’s Note: The statements, opinions and data contained in all publications are solely those of the individual author(s) and contributor(s) and not of MDPI and/or the editor(s). MDPI and/or the editor(s) disclaim responsibility for any injury to people or property resulting from any ideas, methods, instructions or products referred to in the content. |
© 2023 by the authors. Licensee MDPI, Basel, Switzerland. This article is an open access article distributed under the terms and conditions of the Creative Commons Attribution (CC BY) license (https://creativecommons.org/licenses/by/4.0/).
Share and Cite
MDPI and ACS Style
Xin, S.; Wang, B.; Yuan, Y.; Wang, S. Assessment of the Spatial Variations of Mercury and Methylmercury in the Sediment of a Lake and Its Inflow River Estuaries. Water 2023, 15, 1494. https://doi.org/10.3390/w15081494
AMA Style
Xin S, Wang B, Yuan Y, Wang S. Assessment of the Spatial Variations of Mercury and Methylmercury in the Sediment of a Lake and Its Inflow River Estuaries. Water. 2023; 15(8):1494. https://doi.org/10.3390/w15081494
Chicago/Turabian StyleXin, Shuhan, Bingbing Wang, Yin Yuan, and Shiliang Wang. 2023. "Assessment of the Spatial Variations of Mercury and Methylmercury in the Sediment of a Lake and Its Inflow River Estuaries" Water 15, no. 8: 1494. https://doi.org/10.3390/w15081494
Note that from the first issue of 2016, this journal uses article numbers instead of page numbers. See further details here.