3.1. Hydrochemical Characteristics of Groundwater
The physicochemical characteristics of the Al-Jawf groundwater were examined to analyze the physicochemical quality of the Quaternary aquifer waters. Samples of GW had an average temperature of 20.7 °C. The pH of the water indicated that the type of terrain being traversed affected whether it was acidic or alkaline. TDS concentrations vary from 378.42 and 5012 mg/L. The GW samples may be classified as fresh to moderately saline by TDS, and 18.5% of them exceeded the FAO [
75] water criteria. The measured water had a pH between 6.5 and 7.5, with a mean of 7.13. The FAO [
75] standards were met based on these results (
Table 3). The pH value also showed that the water was low in alkalinity and that the mechanisms that fix dolomite and calcite predominated between the pH values of 6.5 and 8.5. S19 well had the highest pH value, whereas S7 had the lowest.
As a result, the EC provides data on the degree of water mineralization. With a range of 542–6628 μS/cm, GW has an average EC of 2361.72 μS/cm. Notably, this study found results above the FAO recommendation of 3000 S/cm in 18.5% of the water samples [
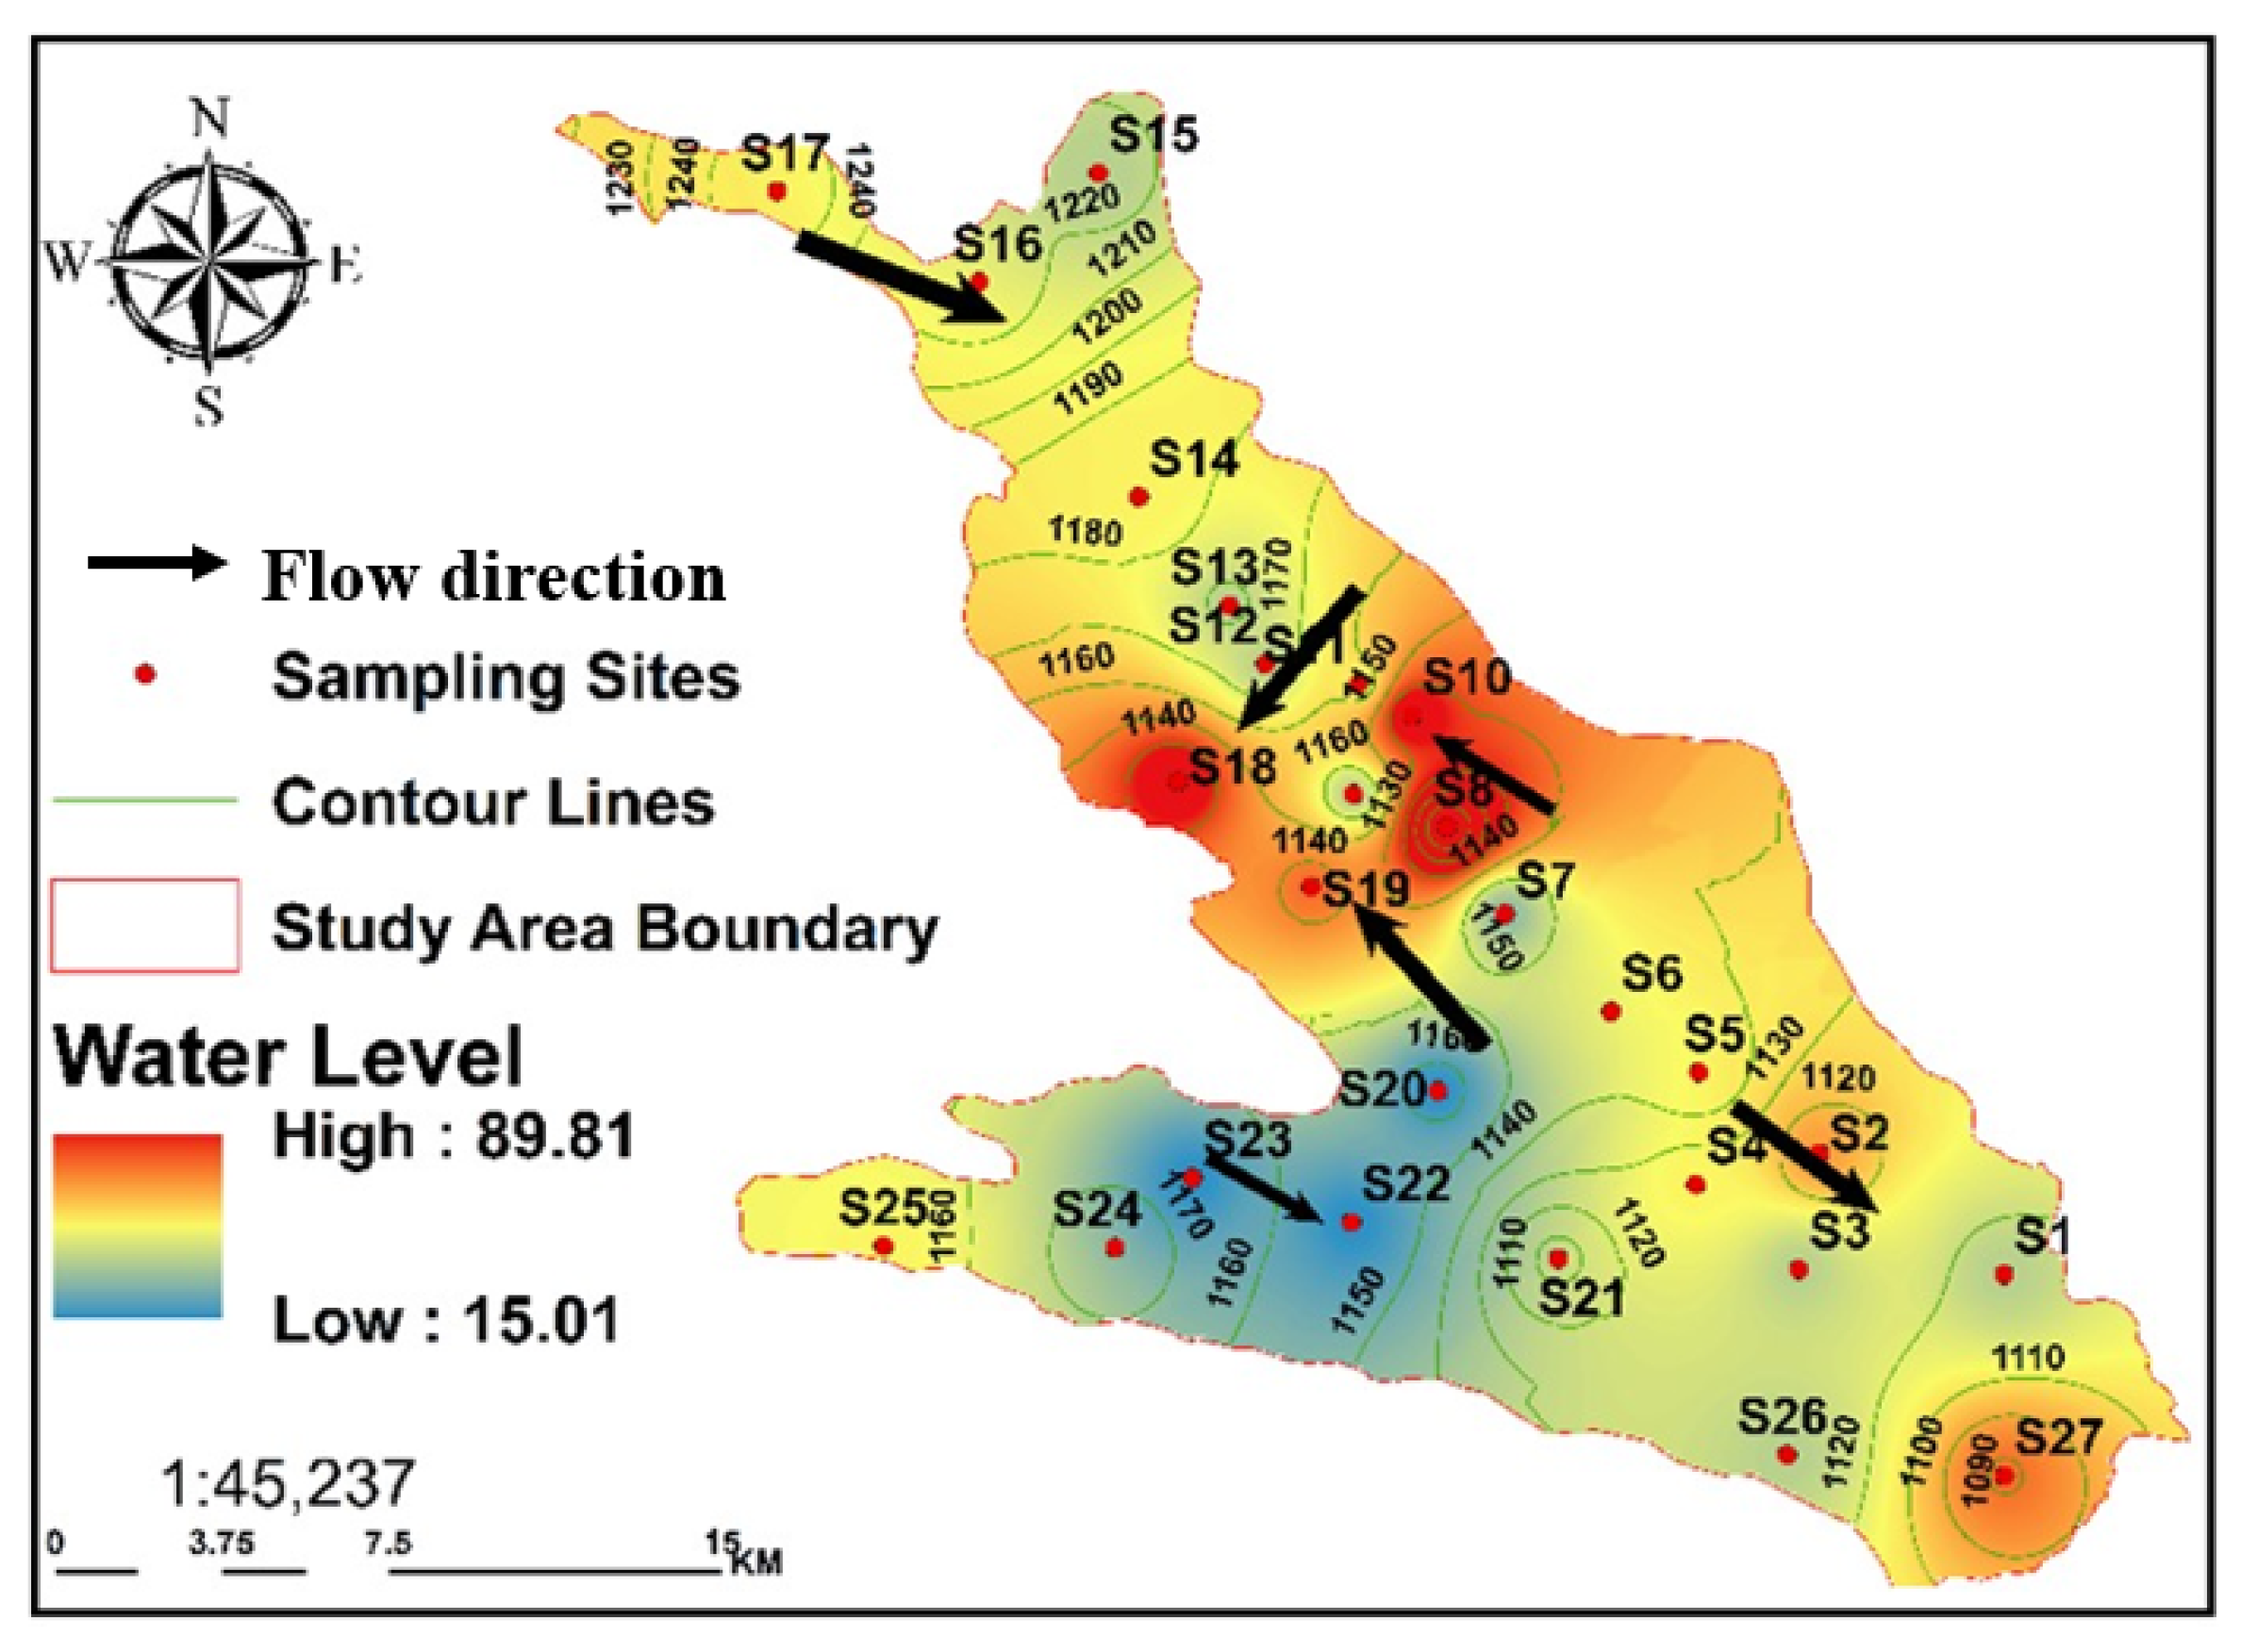
75]. All GW in the Al-Jawf region had higher EC ratings when the subsurface flows were directed toward the discharge areas southwest of Al-Jawf. The Ca
2+ levels in the water samples ranged from 40 to 460 mg/L. For irrigation water, the FAO establishes a 400 mg/L maximum acceptable threshold. The average number of water sites was below the FAO recommendation, with Mg
2+ concentrations ranging from 32.81 and 328 mg/L [
75]. Water hardness is primarily caused by high amounts of alkaline earth elements. Soil type affected their concentrations. The amount of Ca
2+ reached its peak towards the southeast and southwest. Similarly, the southeast and southwest of the Al Jawf area had the highest Mg
2+ concentrations, reaching a maximum of 114.5 mg/L. The dolomites from the Cretaceous and Tawilah groups were altered and dissolved, resulting in this concentration. In general, the breakdown of dolomitic rocks (CaMg (CO
3)
2), gypsum (CaSO
4), and calcium carbonate (CaCO
3) in the aquifer produces Ca
2+ (Equations (14)–(16)):
The alkaline elements Na
+ and K
+ are naturally found in irrigation water and the Earth’s crust. The Na
+ concentration in the Al-Jawf GWvaried from 24.15 to 724.5 mg/L. All the examined water samples were below the FAO limit of 919 mg/L [
75]. The K
+ concentrations ranged from 2.34 to 23.40 mg/L. The Food and Agriculture Organization (FAO) standard establishes a maximum permissible concentration of 2 mg/L for irrigation water. The breakdown of KCl and NaCl in rock-water interactions, saline seeps, and minor air inputs are the causes of this enrichment [
76]. The highest potassium concentrations were found in samples collected from wells in the central and southern parts of the study area.
The concentration of Cl
− ranged from 35.5 to 1136 mg/L, with the latter being the maximum value. A previous study [
52] suggested that the high chloride concentration could be due to the types of formations through which the water passes, or it may be a result of inadequate sewage waste treatment. Some numbers do not meet the FAO requirements (1036 mg/L) [
75]. In the water boreholes, the highest Cl
− concentrations were found in two samples from the southwest of the study area. High Cl
− concentrations make metals rust, make water taste salty, and reduce the strength of concrete.
The FAO guidelines [
75] state that the HCO
3− concentration should be approximately 610 mg/L. Nevertheless, the GW samples from the study area revealed levels between 150 and 915 mg/L, which fell within the previously specified range, except for four samples that exceeded the limit. The samples with the highest HCO
3− contents were S7, S17, S22, and S23, with values of 915, 730, 780, and 823.5 mg/L. In this study, SO
42− levels varied from 19.2 and 1939 mg/L and complied with FAO standards except for two samples in the southwest of the Al-Jawf region that exceeded the limits [
75]. The use of chemical fertilizers by farmers, which is an intensive agricultural practice, has led to an increase in the concentration of SO
42− [
77]. High concentrations of sulfate in irrigation water can seriously harm public health [
78]. In the southwestern part of the research area, SO
42− concentrations were the highest. These typically increase in the direction of the subsurface flow. The gypsum and anhydrite in the mineral dissolved, resulting in the highest SO
42− concentrations. Sulfate ions can also be derived from the weathering of sulfide minerals such as pyrite, which requires further investigation to confirm the presence of pyrite in the aquifer [
79].
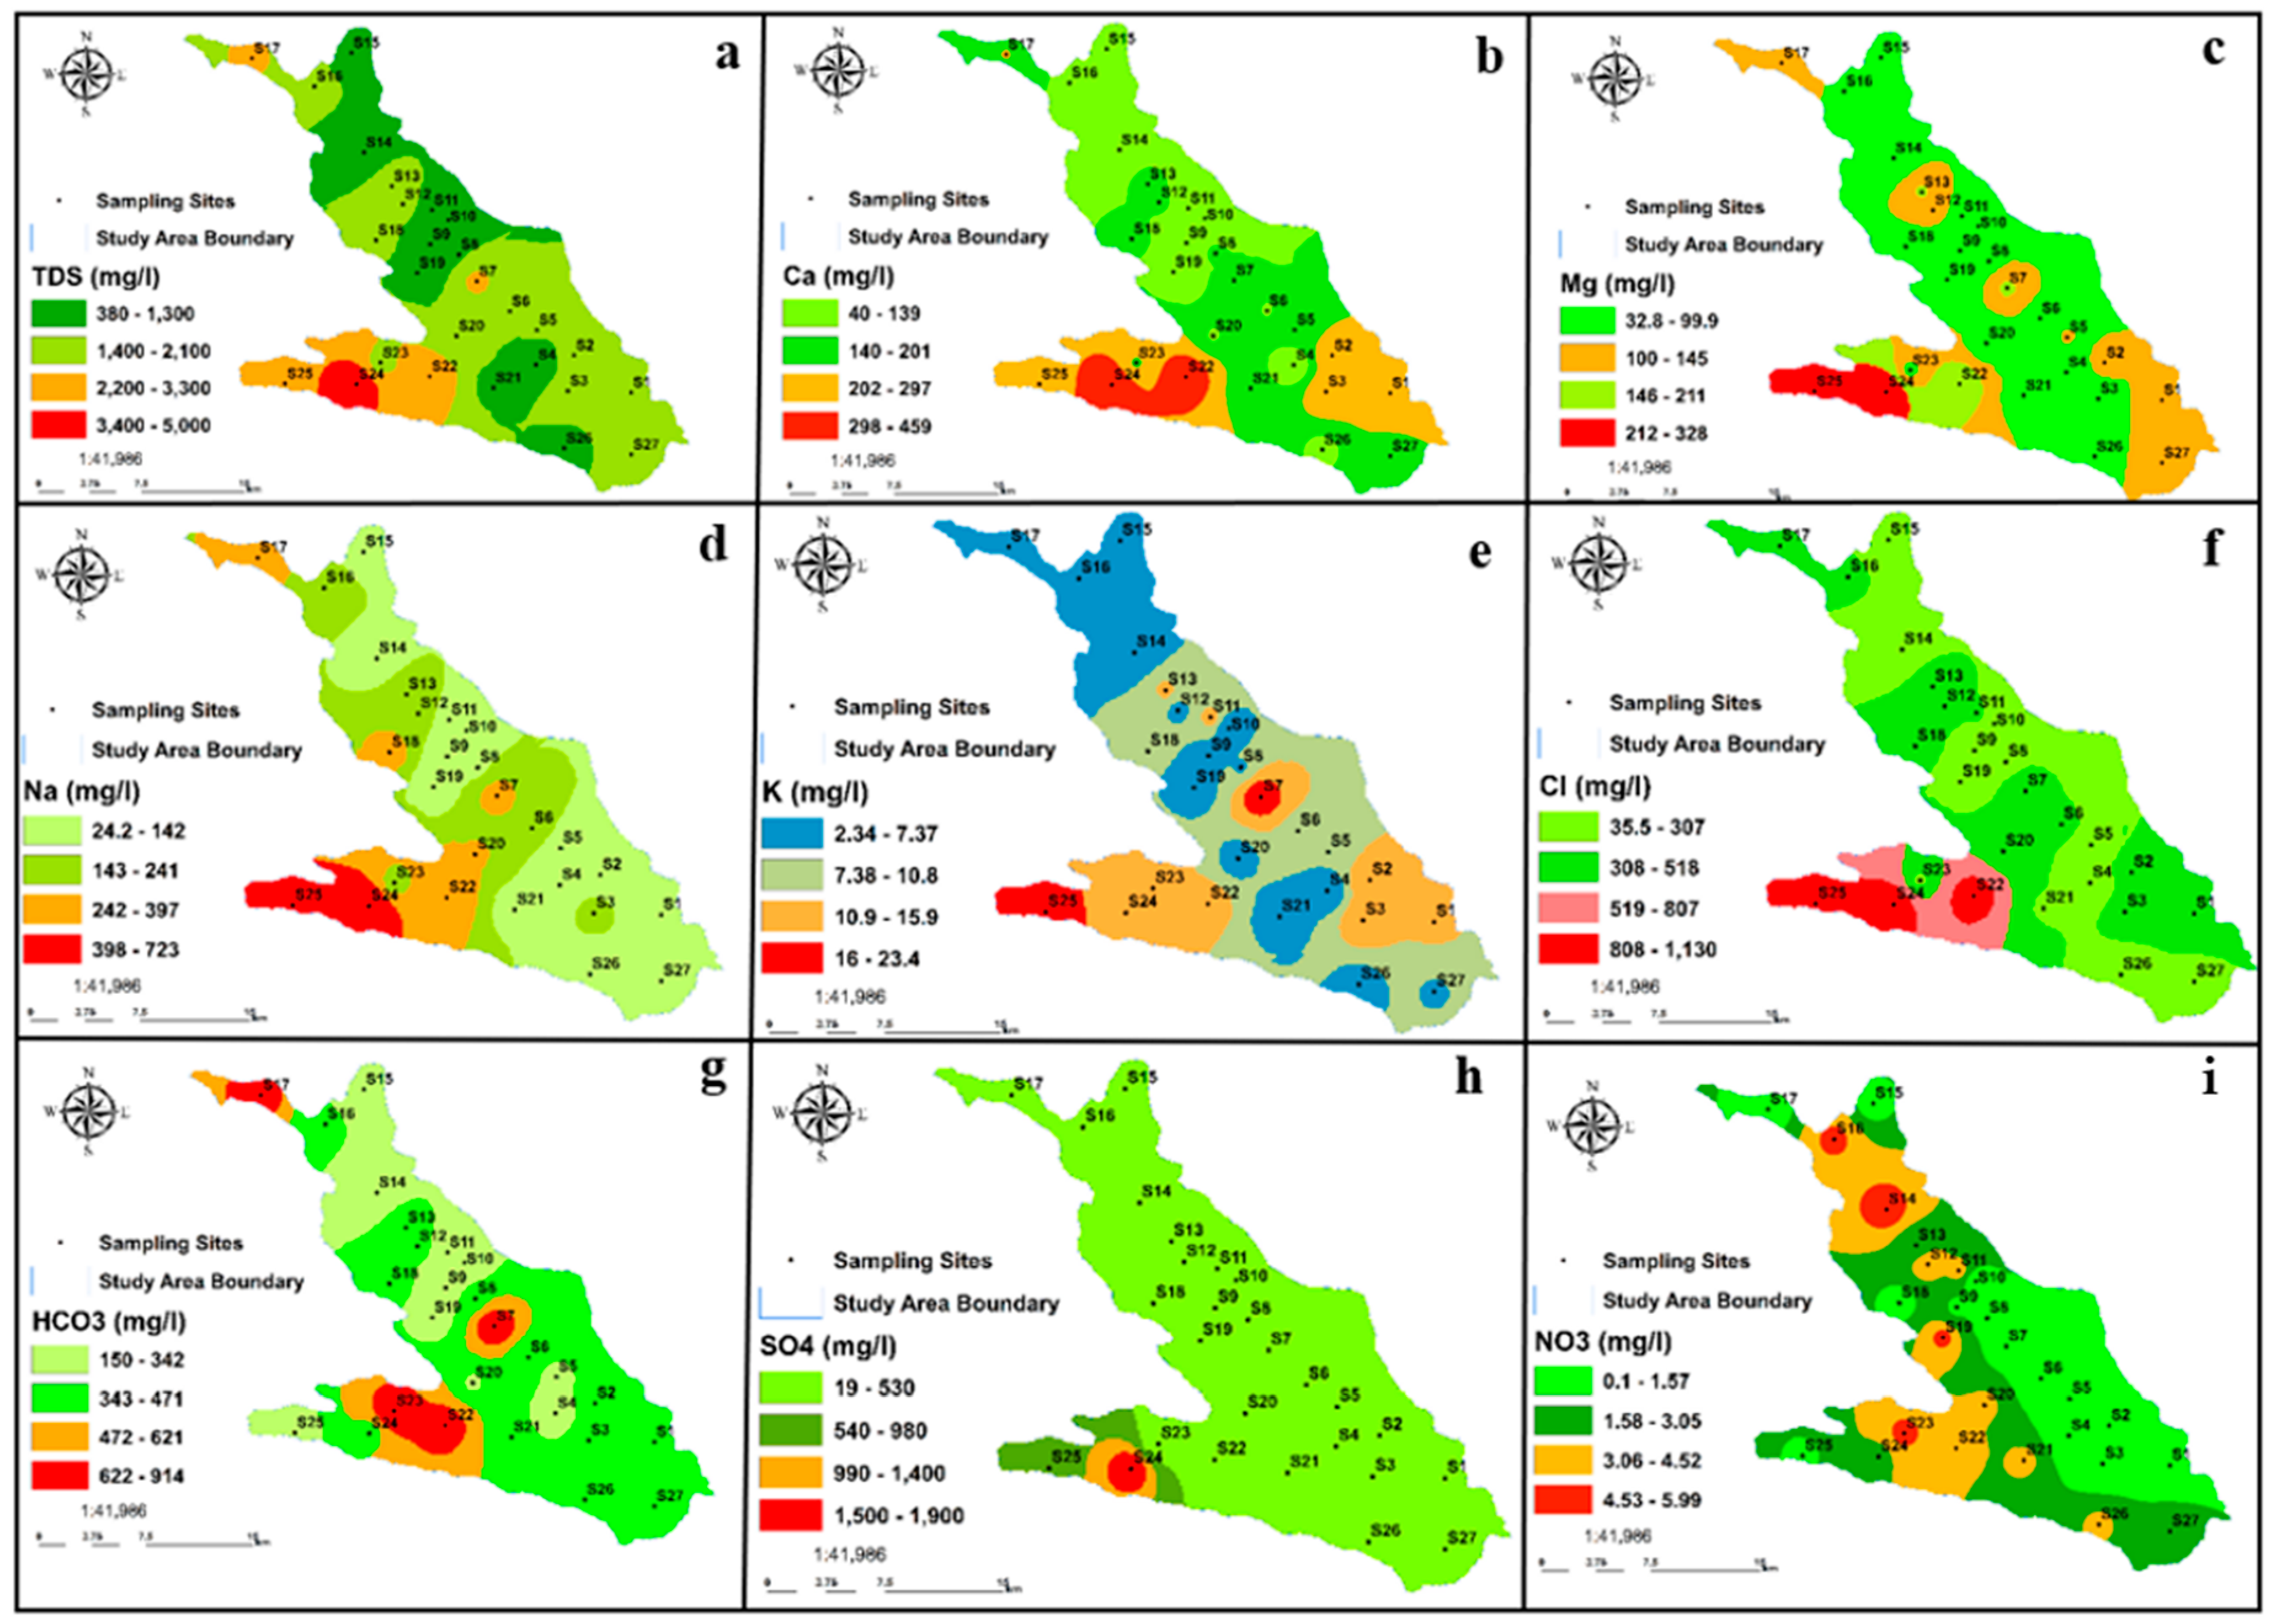
The water samples analyzed in the Al-Jawf region had NO
3− concentrations ranging from 0.1 to 6 mg/L. These values were below the recommended FAO range (10 mg/L) [
75]. According to
Table 3, the low value of nitrates in the study area indicates that there was no nitrate contamination from anthropogenic activities.
Figure 8 shows the distribution maps of the physicochemical parameters in the study area.
3.2. Groundwater Facies and Processes Influencing Groundwater Chemistry
Hydrochemical processes occurring in aquifers may affect groundwater chemistry [
80]. The distribution of groundwater facies is primarily attributed to local geology and lithology, particularly in arid to semi-arid regions [
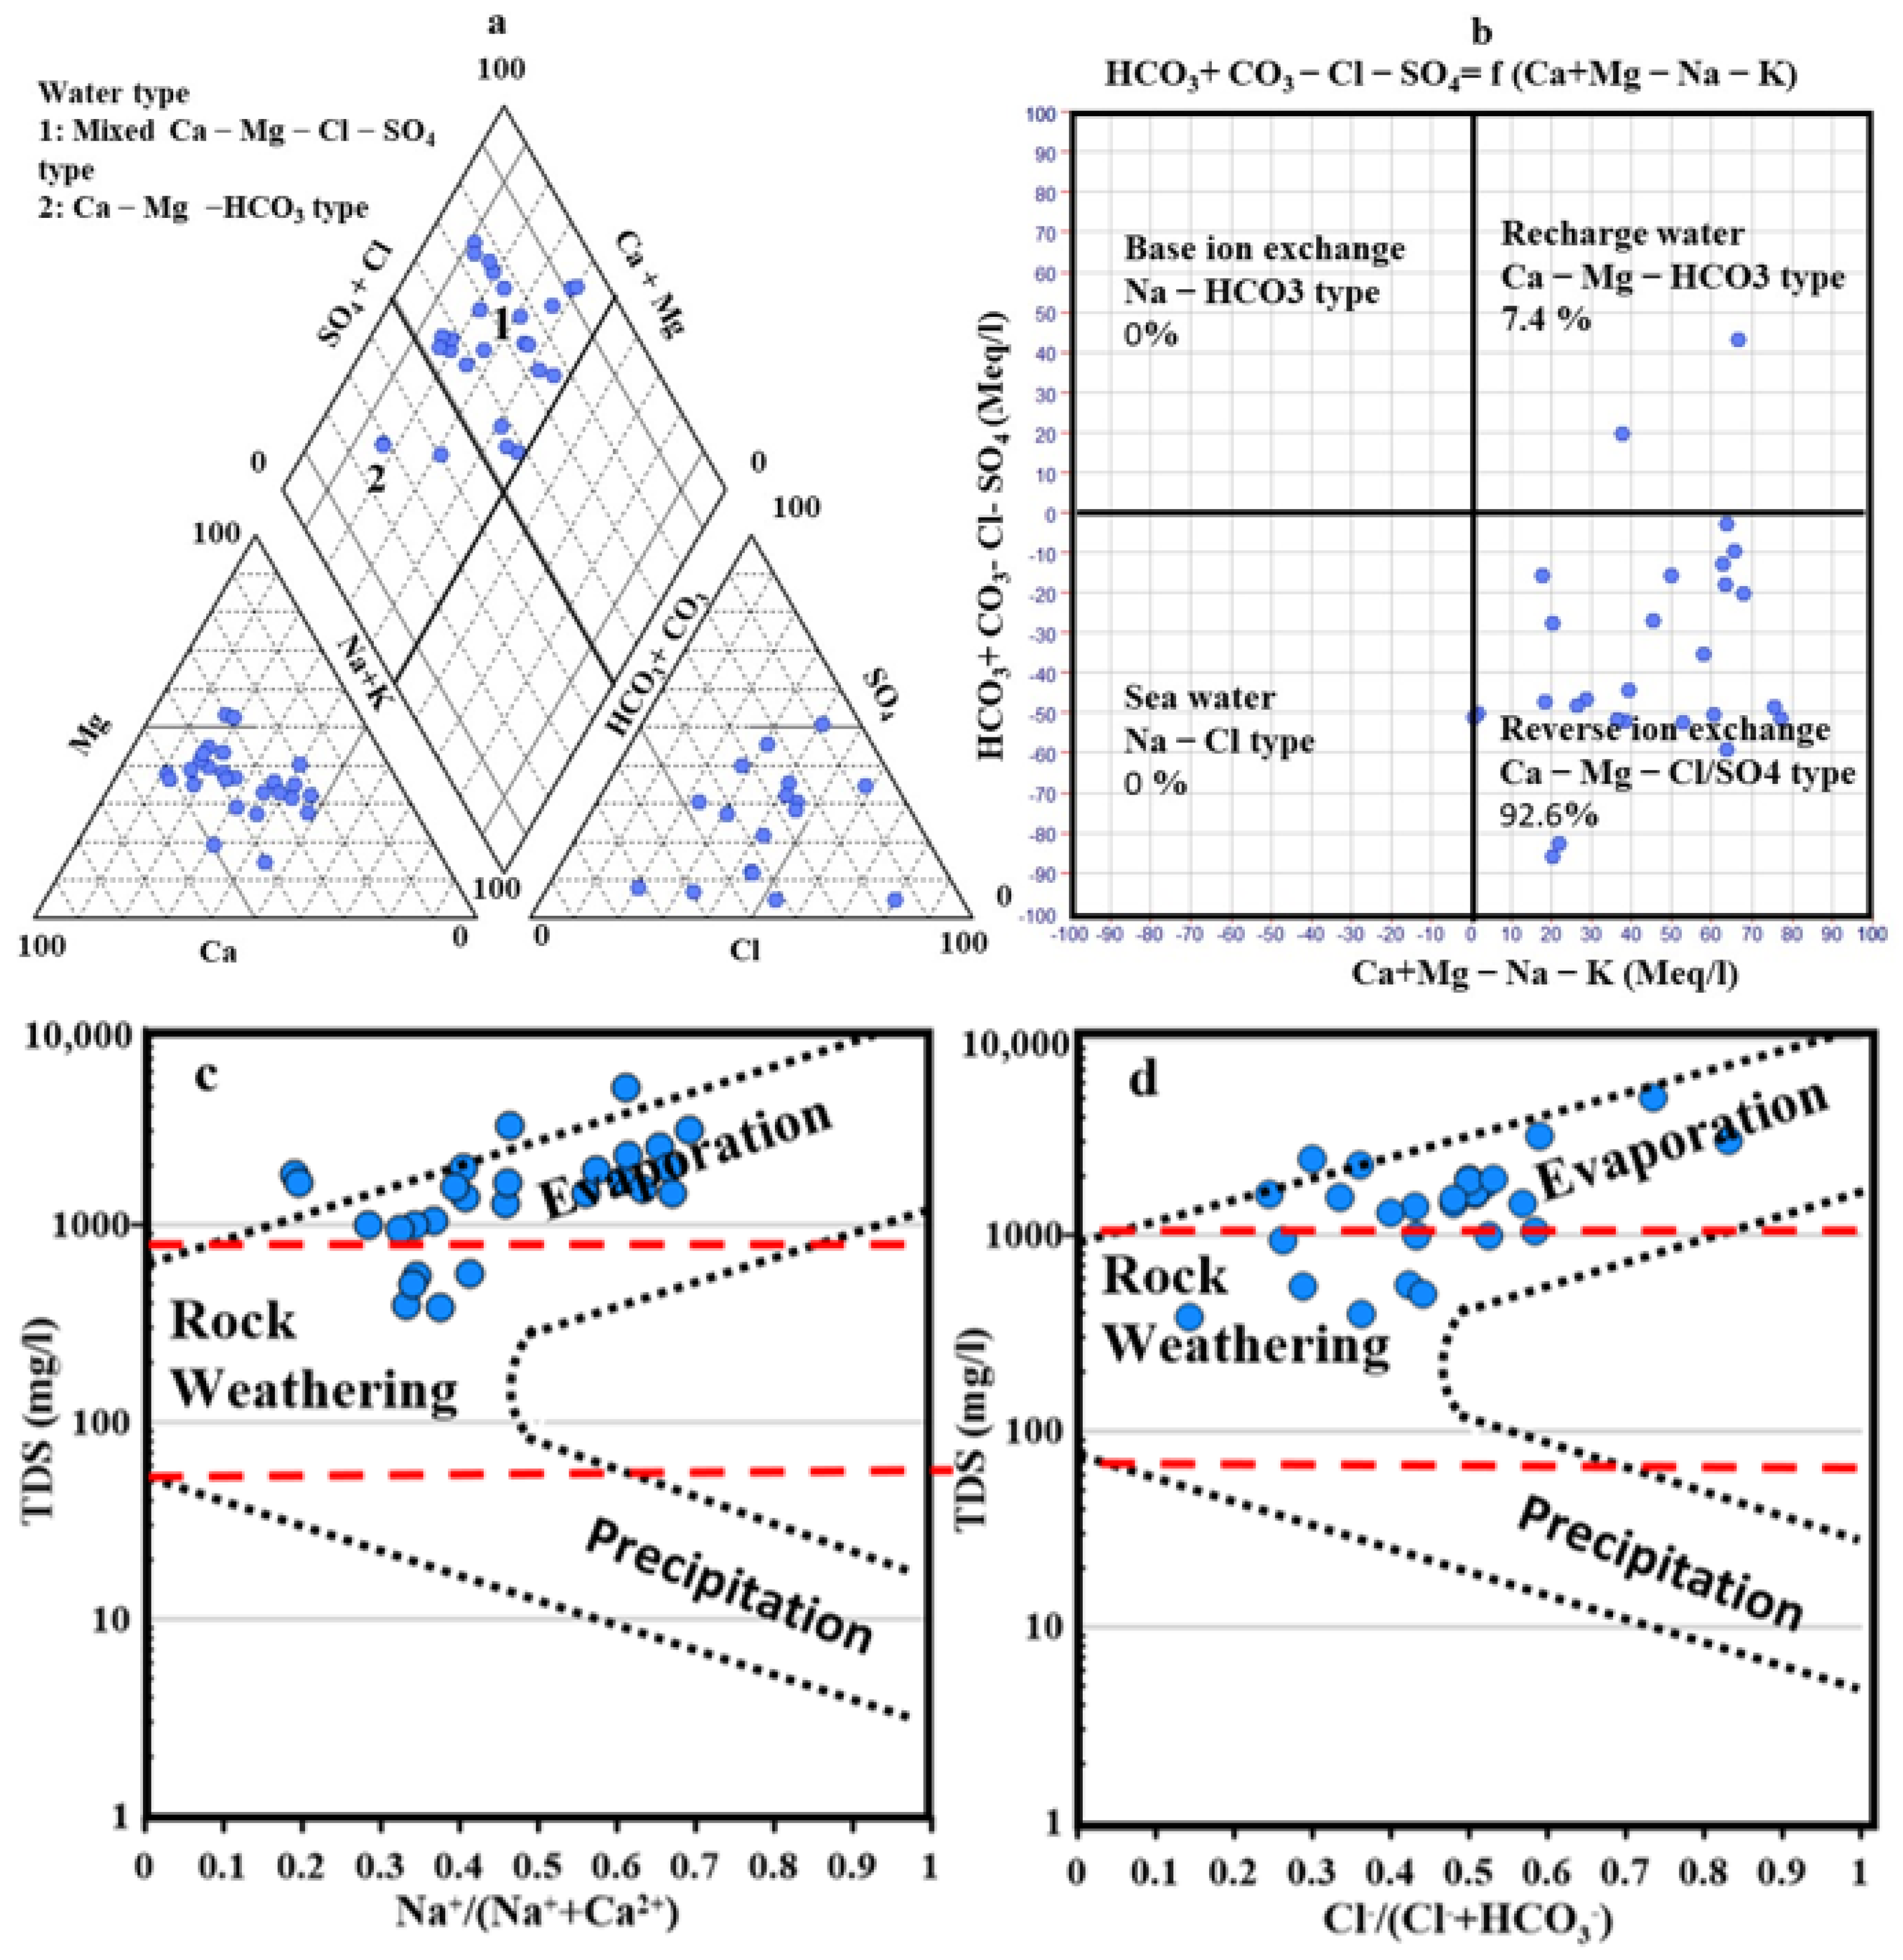
81]. Major ions regulate hydrochemical processes, which is why Chadha’s diagram and the Piper diagram [
20,
22] were employed in this study (
Figure 9a,b). The relative composition of the GW can be determined based on cation-anion pairings and the position of the plot [
82]. Most of the samples used in this investigation fell into Field 3, and only two samples fell into Field 2 in Chadha’s diagram (
Figure 9b). In the Piper diagram (
Figure 9a), 25 samples fell into zone 1 and two samples into zone 2 of the diamond shape. Both diagrams confirm the same water type, which is represented by the Ca-Mg-Cl/SO
4 type and Ca-Mg-HCO
3 type, respectively, where alkaline metals are more abundant than alkaline earth metals and weakly acidic anions are more prevalent than strongly acidic anions. Several diagrams have been used by different researchers to determine the chemical composition of groundwater or water types, such as the TIS salinity diagram [
83], ionic ratio relationships, Chadha’s diagram, and the Piper diagram. Ionic ratios, gibbs diagram, and chadha’s diagram were applied alongside the Piper diagram to show the geochemical evolution of groundwater from the recharge area to the discharge area. The results revealed that the water type in the recharge area was Ca-Mg-HCO
3, and during the flow and water-rock interaction, the water type changed to Ca-Mg-Cl/SO
4 in the discharge zone. Furthermore, saturation indices could reflect the mineral composition of the aquifer. A Gibbs diagram could reflect the relationship between the ionic ratio and salinity.
Analysis of the local concentrations of several elements revealed that the cations developed as follows: Ca2+ > Mg2+ > Na+ > K+, whereas the anion evolution was as follows: SO42− > Cl− > HCO3− > NO3−. The breakdown of evaporitic deposits revealed calcium and magnesium sulfate facies in the chemical profile. The lithology of the region and anthropogenic factors, such as unrestricted fertilization and irrigation water quality, significantly affect the distribution of major ions (Ca2+, Mg2+, and SO42−). Calcium and magnesium sulfates can provide both calcium and magnesium upon breakdown. Nevertheless, the change from one dominant ion to another might have been caused by dilution following the mixing or precipitation of one of the ions.
The two primary sources of SO
42− that have been identified are organic matter decomposition in the soil and the addition of leachable organic matter in the highly intensively cultivated regions of the Al-Jawf plain. The dissolution of gypsum is also recognized as a secondary source of sulfate [
84]. According to Equation (17), the evaporite sequence’s existence permits the dissolution of gypsum.
The fundamental mechanisms governing the evolution of water and the numerous hydrogeochemical processes affecting GW chemistry in the study region were examined using Gibbs plots [
21]. Evaporation and rock weathering are significant components in the evolution of water chemistry, as shown by the Gibbs plots (
Figure 9c,d), which show that the majority of the GW samples under study lie in the top portion of the diagrams (evaporation-dominant), and five samples fall in the rock weathering zone.
Figure 9c,d shows that the evaporation process is responsible for the plots’ redirection to the Al-Jawf plain’s evaporation dominance zone, which is located in a region with an arid climate and shallow GWat depth. However, human activity can also affect the groundwater hydrochemical evolutionary processes, which Gibbs diagrams cannot explain [
85].
Nonetheless, the shallow water depth in the area was related to the improvement in water levels caused by increased irrigation and effective rainfall. The ion concentrations were primarily influenced by evaporation. In addition, the approaching saturated zone is particularly wet and rich in evaporites, which causes the evaporites to precipitate through evaporation and ultimately leak into the saturated zone. The upshot of this is an increase in salinity (TDS
max = 5012 mg/L) as evaporation from the earth becomes more severe as the water level increases, and sulfate GW is more influenced by evaporation than bicarbonate GW [
86]. These results are complemented by other experiments that demonstrated that the sulfate-type GW in the alluvial plain is subject to high evaporation [
87].
The lack of a balanced association between Na
+ and Cl
− ions indicated that there was no equilibrium between them. This could be attributed to the prevalent sources of these ions, including halite dissolution. Only a few samples fell on the 1:1 line graph (
Figure 10a). The majority of the samples fell below the 1:1 line graph, suggesting an excess of chloride, indicating either an additional source of chloride ions or the removal of Na
+ from the GW via ion exchange. The high levels of chloride might be ascribed to human activities such as waste disposal, seepage of excess irrigated water from agricultural land, or deposition of chloride from the atmosphere. Anthropogenic disturbances, rather than variability in climate parameters, have been identified as the primary cause of surface freshwater shortage in the country, rather than variability in climate parameters [
88]. Both reverse ion exchange and ion exchange have an impact on aquifer chemistry in the research region of Al-Jawf, as illustrated in
Figure 10b through the scatter plot between Ca
2+ + Mg
2+ and HCO
3− + SO
42−. The samples that were close to the 1:1 line demonstrated that the most frequent reactions in the research region system were calcite, dolomite, and gypsum dissolution. However, below the 1:1 line, the ion exchange mechanism is evident, with Ca
2+ remaining in the soil and Na
+ returning to the GW. In contrast, those above line 1:1 show reverse ion exchange, in which Na
+ was held in the soil, and Ca
2+ was released into the GW. The samples with ratios above 1:1 were calcium- and magnesium-enhanced. This suggests that evaporites are a better source of Ca
2+ and Mg
2+ than carbonates. The Ca
2+ + Mg
2+ interactions of most of the GW samples with HCO
3− + SO
42− did not indicate that carbonate weathering was the primary process in the study area, as shown in
Figure 10b). Additionally, the plot of Ca
2+ + Mg
2+ versus HCO
3− (
Figure 10c) shows an excess of Ca
2+ and Mg
2+ caused by silicate weathering, which is a key process in releasing HCO
3− into the GW [
89].
Figure 10d, which displays the ratios of SO
42−/Ca
2+, supports this. With a coefficient of correlation value of 0.6 between SO
42− and Ca
2+, there is a strong association between the two ions as an indication of gypsum and anhydrite dissolution. Most samples were above the equiline 1:1 in the scatter plot between Ca
2+ and SO
42− (
Figure 10d), suggesting that another source of calcium, calcite, and dolomite, was dissolved in the GW [
28]. Samples that deviated from the line 1:1 point to a source of SO
42− other than agriculture, such as mineral weathering, ion exchange reactions, or mineral processes.
Chloro-alkaline was used to identify if ion exchange or reverse ion exchange had a greater contribution as a controlling mechanism between the minerals in the aquifer and water [
90,
91]. In general, the CAI values, such as CAI-I and CAI-II, were positive for all water samples (
Figure 10e,f), indicating a significant tendency for reverse ion exchange between Na
+ and K
+ in the groundwater of the study area and Ca
2+ and Mg
2+ in the surrounding rock. From the different ionic ratios relationship, The reverse ion exchange was the main controlling process governing the groundwater chemistry.
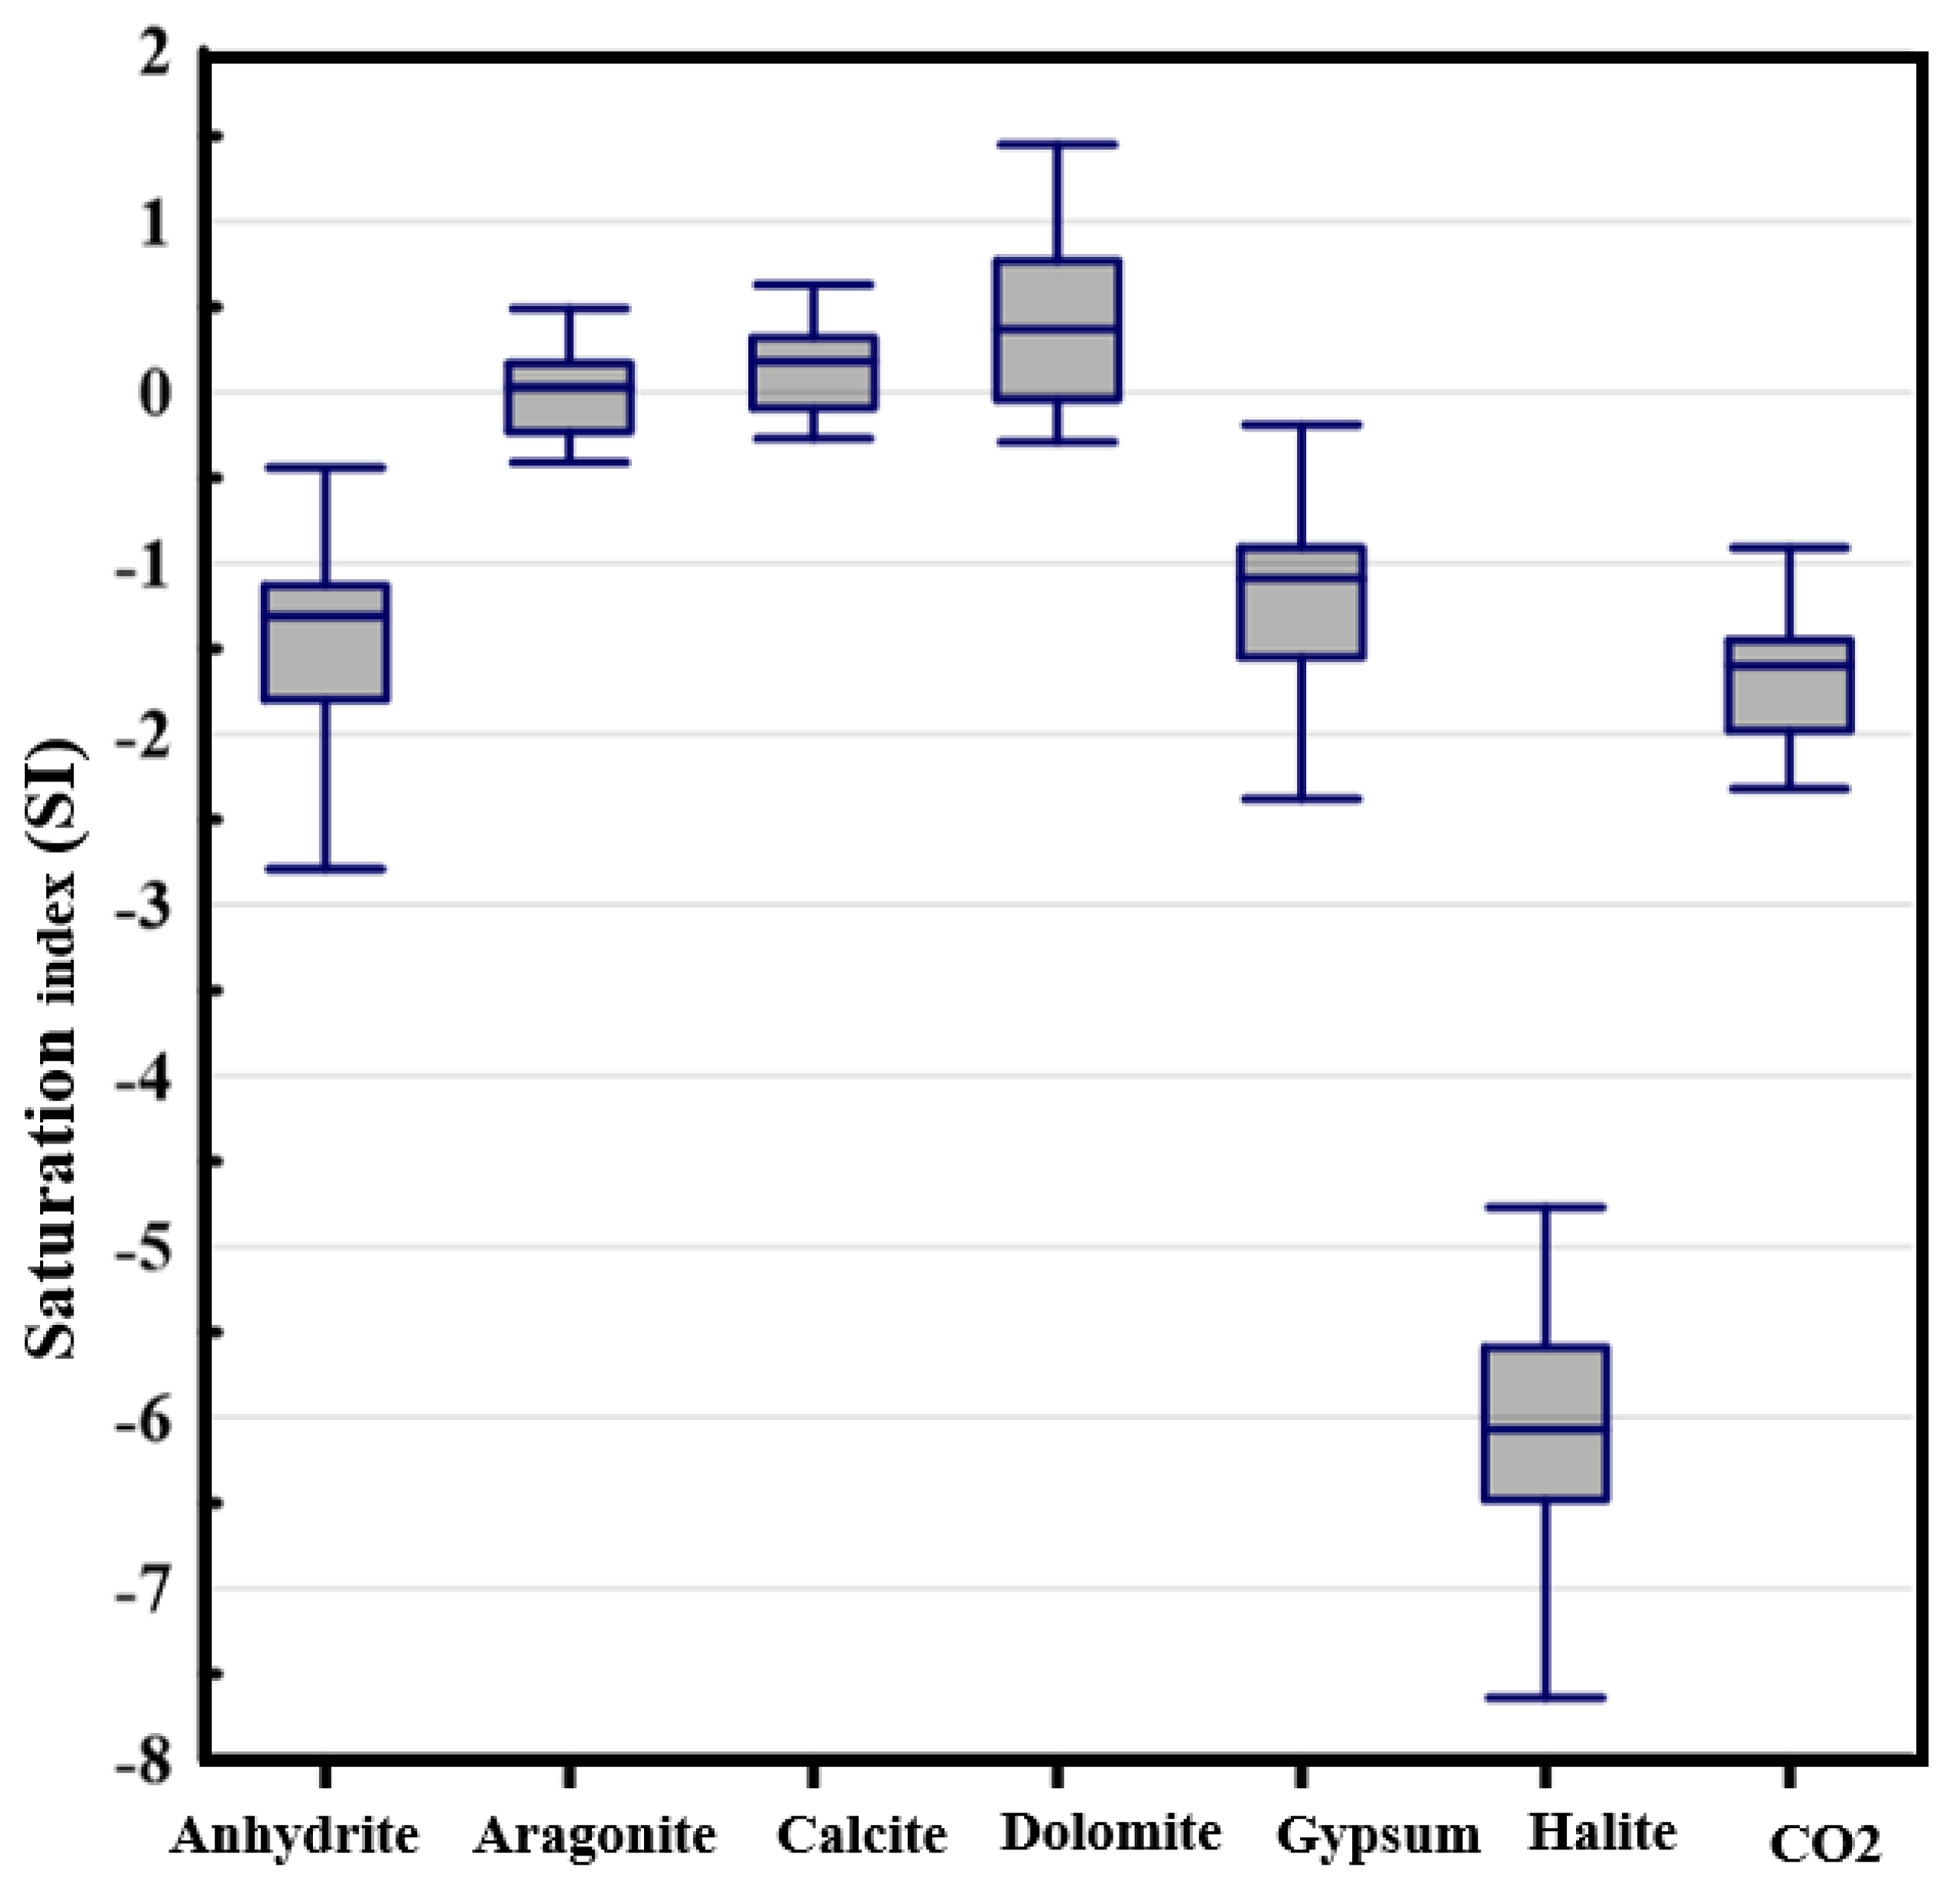
3.4. Geochemical Modeling and Mineral Saturation
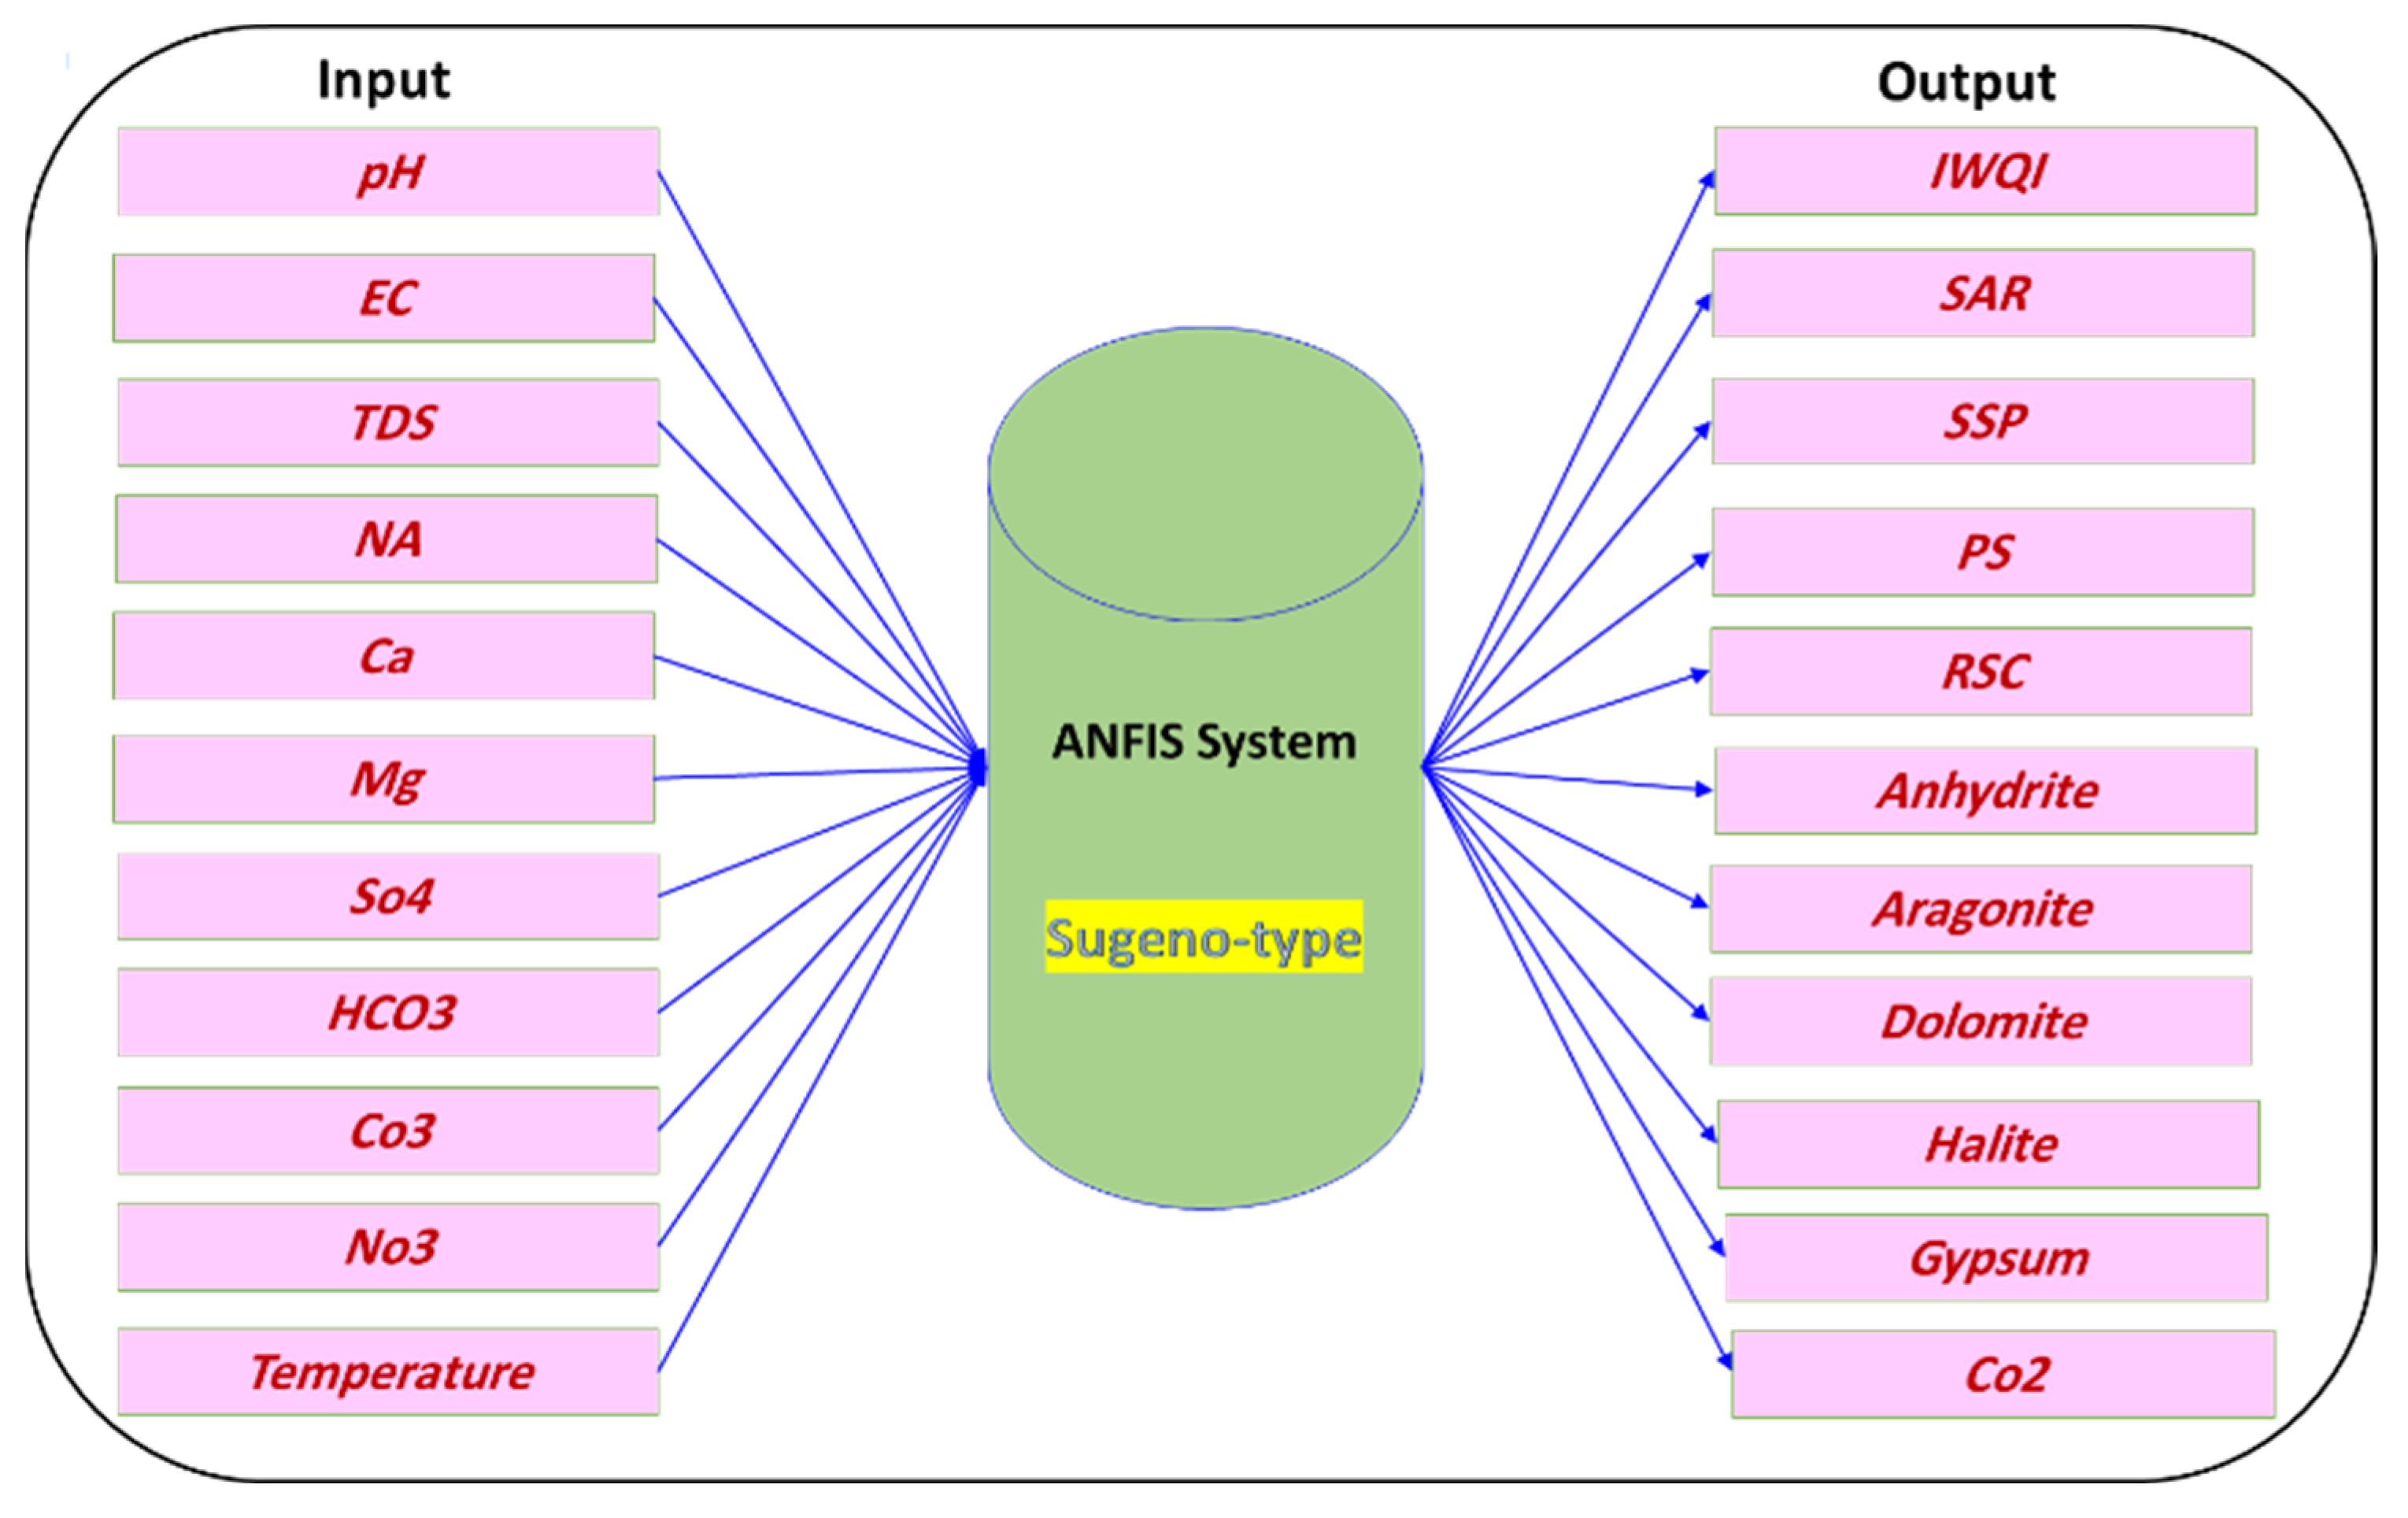
The mineral concentrations, saturation indices, and tendency of the GW to dissolve or precipitate minerals were assessed using the PHREEQC model [
96]. The model outputs included the saturation indices of relevant minerals such as calcite, dolomite, halite, gypsum, aragonite, and anhydrite, as well as the partial pressure of CO
2. The input data used included physical and chemical parameters, such as temperature, pH, EC, TDS, and major cations and anions, as shown in
Figure 5. The findings for the selected groundwater samples from the Quaternary aquifer are shown in
Table 5 and
Figure 13. The partial pressure of CO
2 was negative and below saturation, indicating that the amount of water recharged was lower than the quantity of water extracted from the production wells in the Quaternary aquifer. The study also showed that carbon dioxide decreases with the direction of water flow, owing to the same-direction decline in ground water recharging.
Water quality can be affected by the presence of various solutes originating from soil erosion, atmospheric deposition, and rock weathering [
97]. The dissolution of minerals in water occurs primarily through water-rock interactions, and if water becomes oversaturated with a particular mineral, precipitation can occur [
98].
The minimum, maximum, and average SI values for calcite, dolomite, halite, gypsum, aragonite, anhydrite, and CO
2 are listed in
Table 5. According to the SI results of the groundwater in the Quaternary aquifer, all water samples were undersaturated with halite, anhydrite, and gypsum minerals, which means that the GW could dissolve more of these minerals. However, most of the water samples were oversaturated with calcite, dolomite, and aragonite, indicating the possibility of water precipitating these mineral species. This finding is consistent with the Gibbs plot results. Only nine, eight, and 12 samples had negative values for calcite, dolomite, and aragonite, respectively, and these samples were located in the central part of the Al-Jawf area. The semi-arid climate in the study area may have led to the precipitation of dolomite, calcite, and aragonite owing to low rainfall and high evaporation. Calcium, sodium, sulfate, and chloride components are not limited by the mineral equilibrium with anhydrite, gypsum, and halite [
99].
3.5. Irrigation Water Quality Indices
Several key indicators need to be studied to determine the impact of agricultural soil water quality on the quality of the produced crops. These indicators can either be individual chemical indicators [
100,
101] or a group of indicators [
31,
102]. From the results of these indicators, decision-makers can develop an appropriate method for managing irrigation water, which the current study deals with through the following indicators: Considering the typical value intervals for the parameters, the water quality classification for irrigation was applied using the six IWQIs (
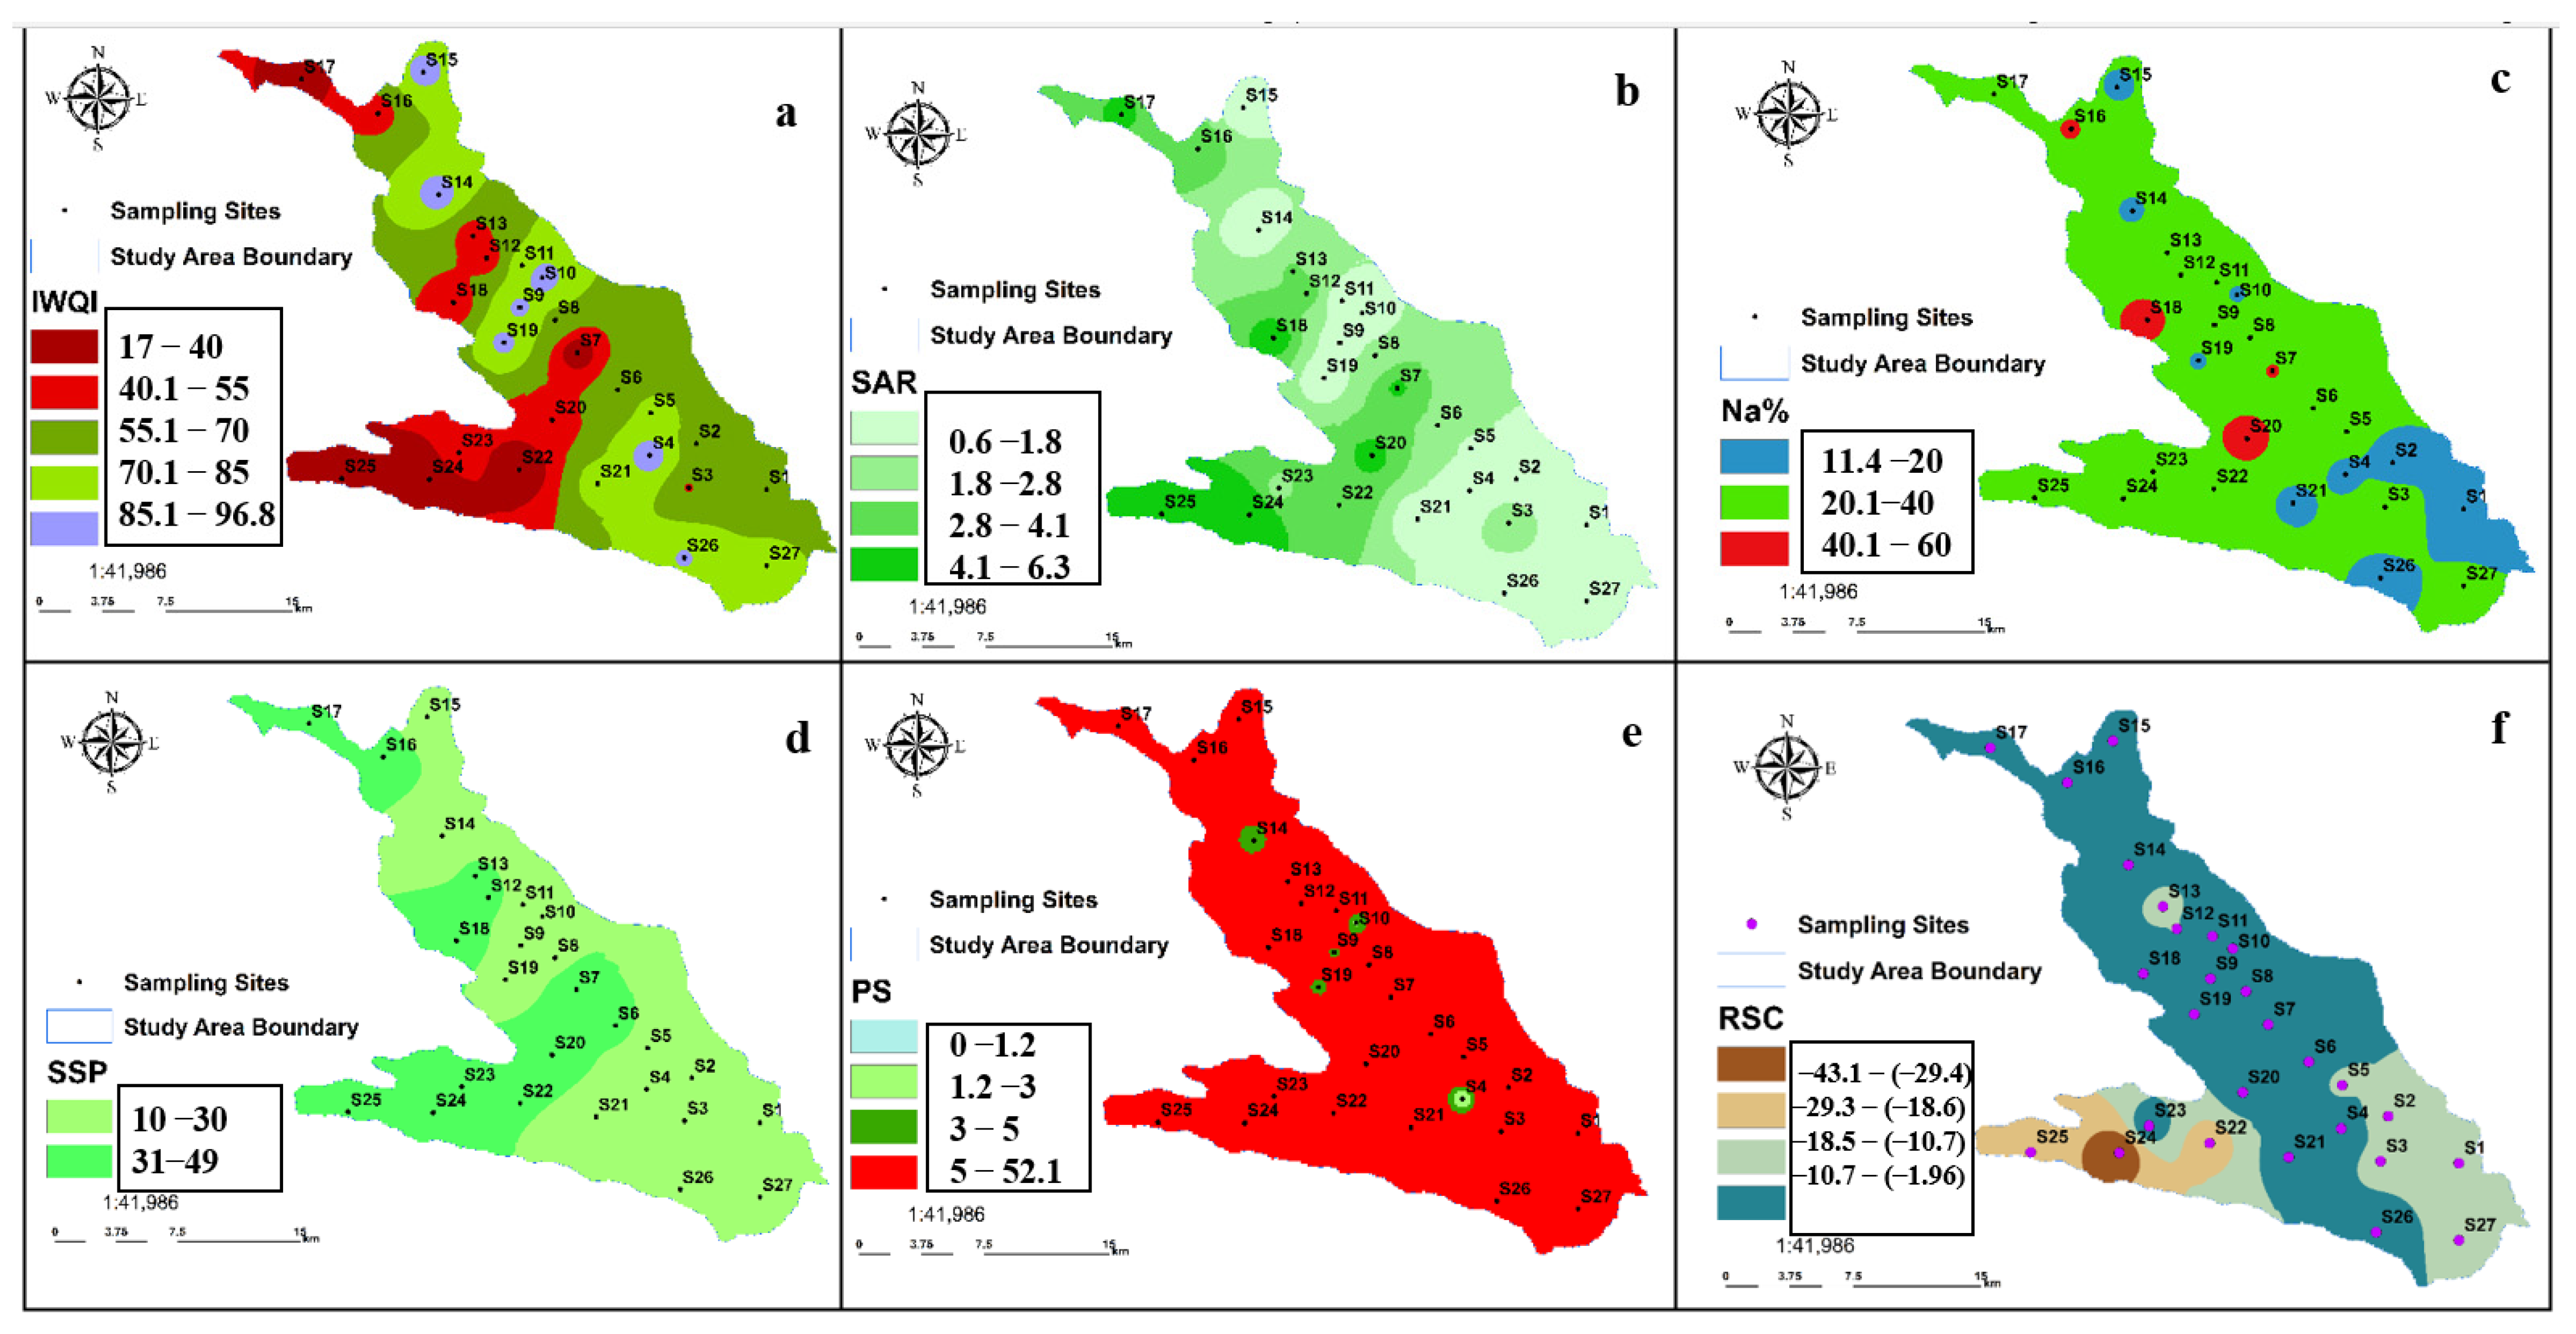
Table 6).
The IWQI, which was calculated using the equation in
Table 1 [
31], showed that the water quality in the study area was classified into five criteria [
75] and arranged according to the percentage of total samples as follows: 14.8% of samples had a low restriction for irrigation, 14.8% of samples had a moderate restriction for irrigation, 25.9% of samples were highly restricted, and 18.5% of samples were severely restricted, as shown on the map (
Figure 14a). The values of the first indicator range from a small value to a maximum value, as shown in
Table 6, as follows: 17.03–96.77, with an average of 61.03. Water deterioration, according to the IWQ indicator, was recorded in the far north and southwest of the study area.
The quality of irrigation water plays an important role in the composition of the soil and its ability to improve or deteriorate agricultural production, as it affects the permeability, rate of filtration, and aeration through the chemical characteristics of irrigation water [
103]. Among the constituent elements of water, the concentration of sodium ions is the most influential on agricultural soils because high concentrations of sodium in irrigation water reduce the filtration rate through soil adsorption of sodium and removal of calcium and magnesium ions [
98]. Therefore, SAR, Na%, and SSP indicators were calculated to estimate the water quality through the concentrations of sodium, calcium, and magnesium to determine whether it is suitable for irrigation of agricultural lands [
64,
65,
66] and to determine the most affected and degraded areas to implement appropriate management to avoid soil degradation.
Table 1 shows the method for calculating the four indicators and distributing their values on the maps to determine the areas where soil degradation is expected. The results of the indicators,
Table 6, confirmed that all water samples were classified as excellent for the SAR, permissible to excellent for the Na%, and suitable for the SSP index. The average SAR, Na %, and SSP values were 2.56, 28.29, and 27.57%, respectively. From the index distribution maps,
Figure 14b–d), it is evident that every sample of water is appropriate for the irrigation of agricultural regions, that there is no negative effect on the soil permeability and infiltration rate, and that there is no need for the application of calcium fertilizers due to the low sodium concentrations in the irrigation water.
The quality of irrigation water can deteriorate in the case of precipitation of alkali elements such as calcium and magnesium. This is due to the increase in the concentration of carbonates in relation to calcium and magnesium in the irrigation water. The concentration of sodium ions increased, followed by an increase in the sodium absorption ratio in the irrigation water due to the precipitation of calcium and magnesium ions in the form of carbonate minerals. Therefore, it is necessary to calculate the RSC index, which evaluates whether water is suitable for irrigation because an increase in the concentration of RSC can cause the dissociation of organic matter and deterioration of the physical properties of the soil, ultimately leading to the appearance of black stains on the surface of the soil when it dries [
104,
105]. The value of the RSC indicator,
Table 1, was calculated to determine the probability of calcium and magnesium ion precipitation on soil surface particles and their removal from the soil solution. The results of the indicator in all study samples,
Table 6, and its distribution on the map (
Figure 14f), confirmed that the water in the study area is suitable for the irrigation of agricultural lands, as all samples belong to a good classification, and the indicator value ranges from −43.21 to −1.96. Another indicator, the potential salinity index (PS), depends on the calculation of the concentrations of chloride and sulfate ions [
67] to assess the suitability of water for the irrigation of agricultural lands. According to its value (
Table 6), it is divided into three categories: Excellent to Good (PS < 3.0), Good to Injurious (PS = 3.0–5.0), and Injurious to Unsatisfactory (PS > 5.0). The PS index results showed that two samples belonged to the Excellent to Good classification, three samples belonged to the good class, and 22 samples belonged to the Injurious to unsatisfactory (
Figure 14e).
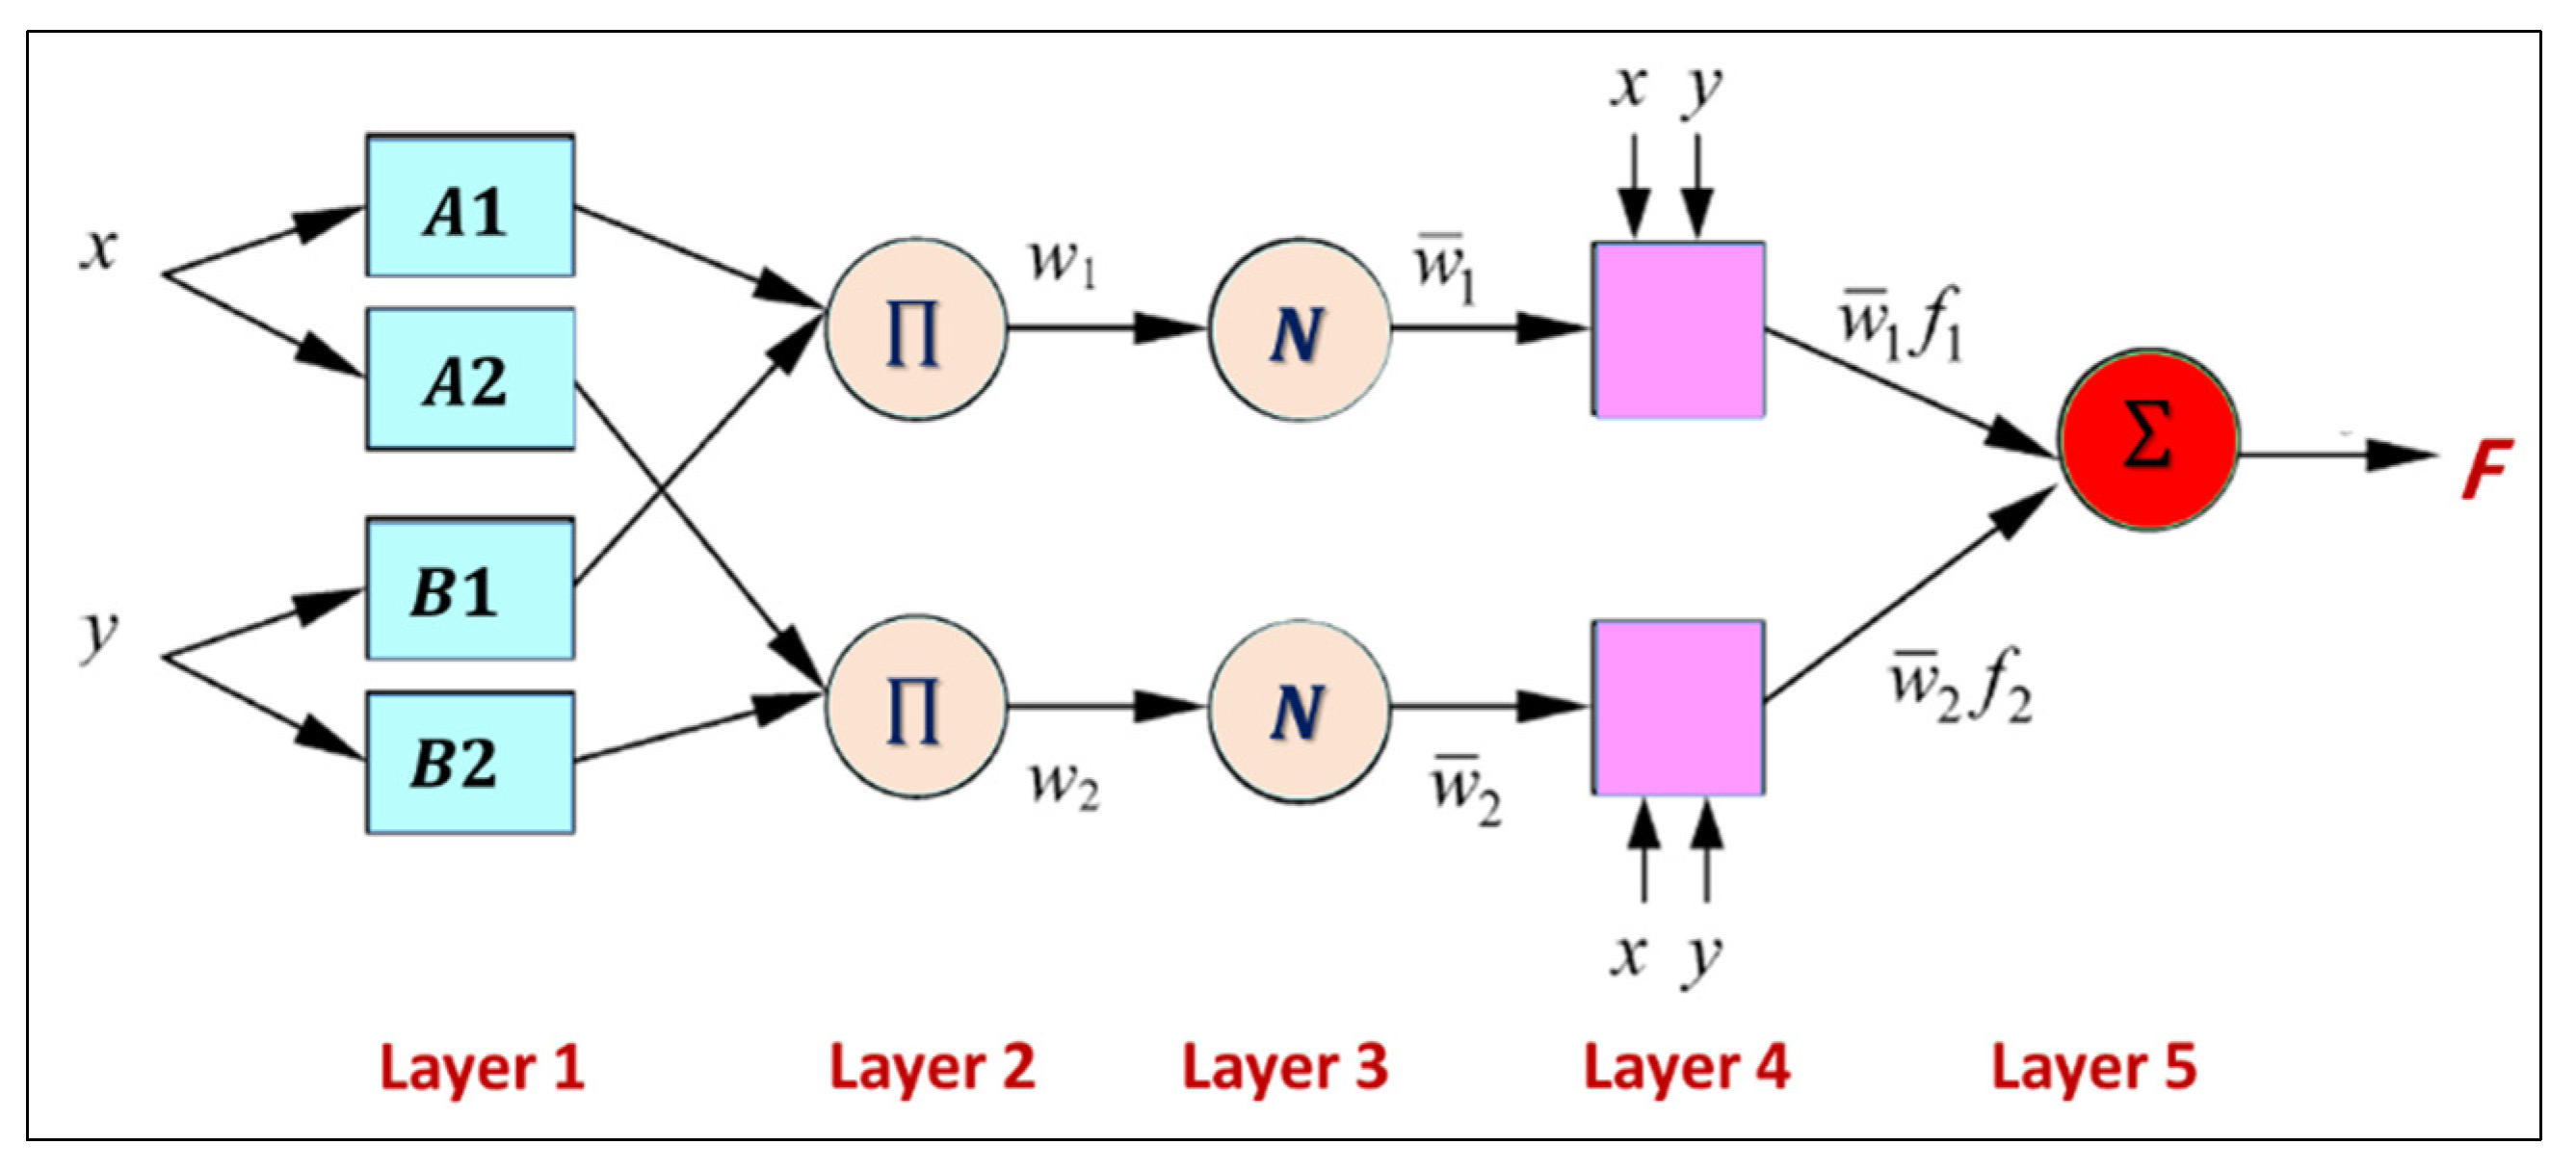
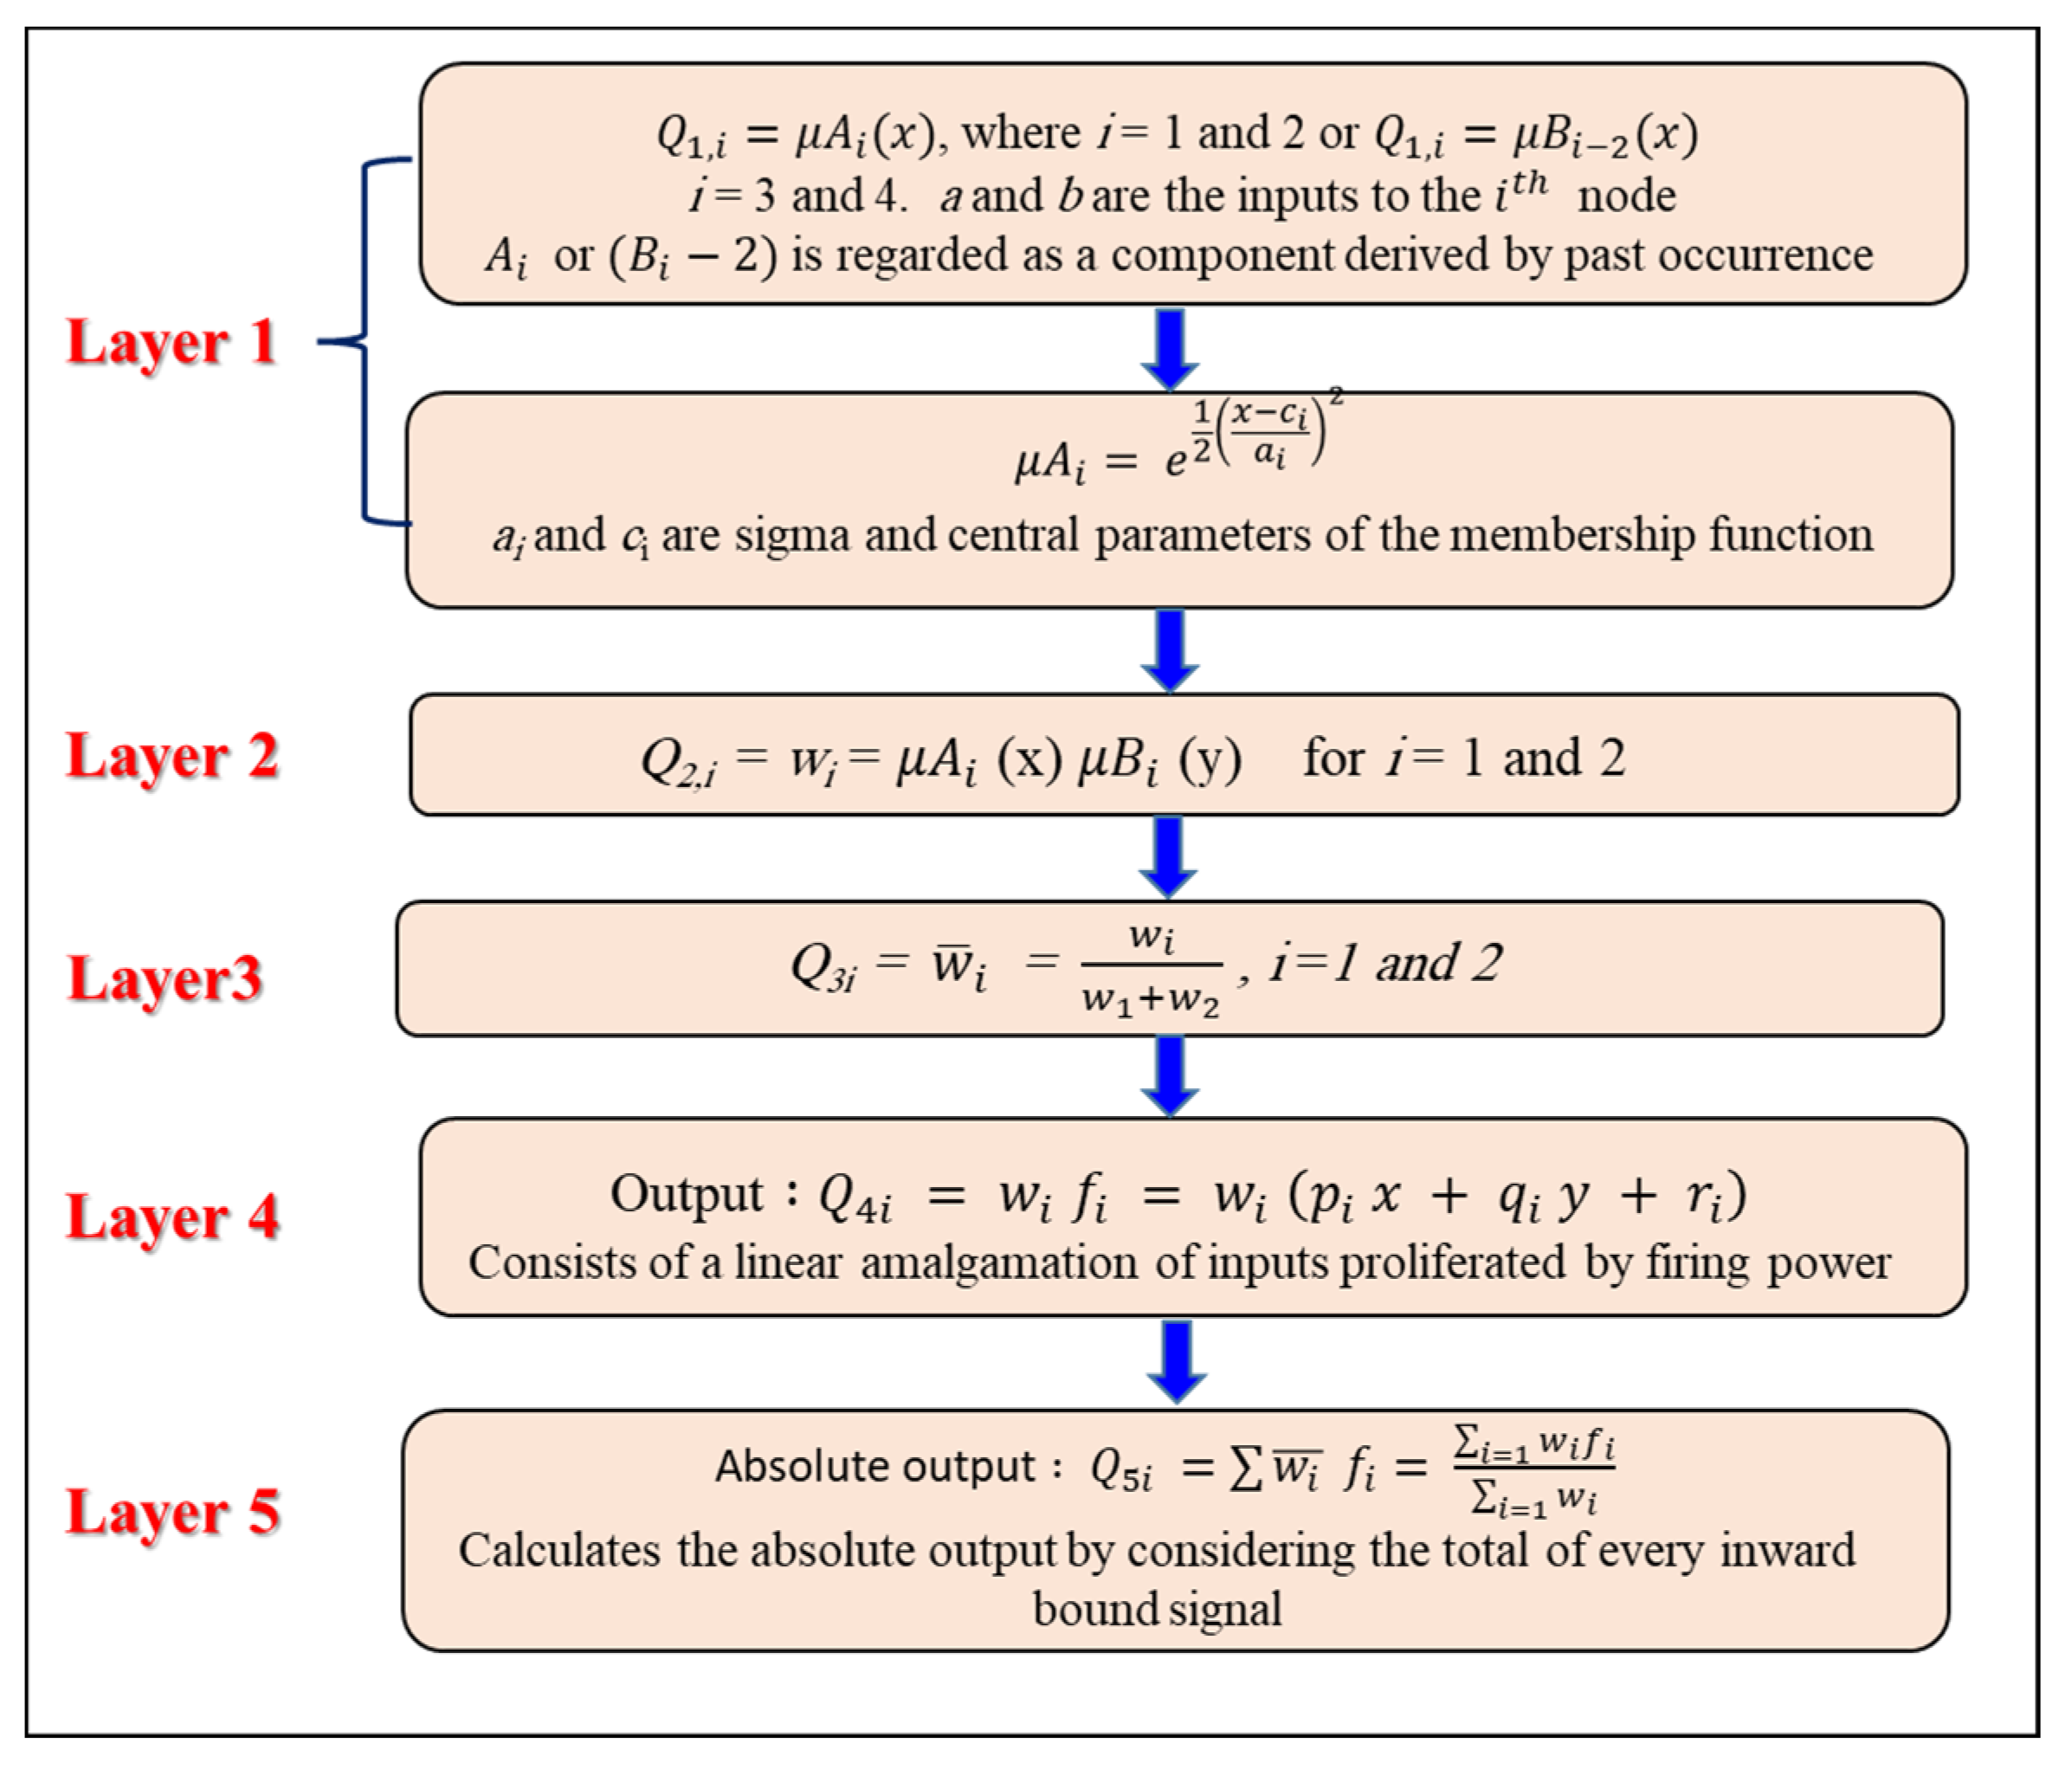
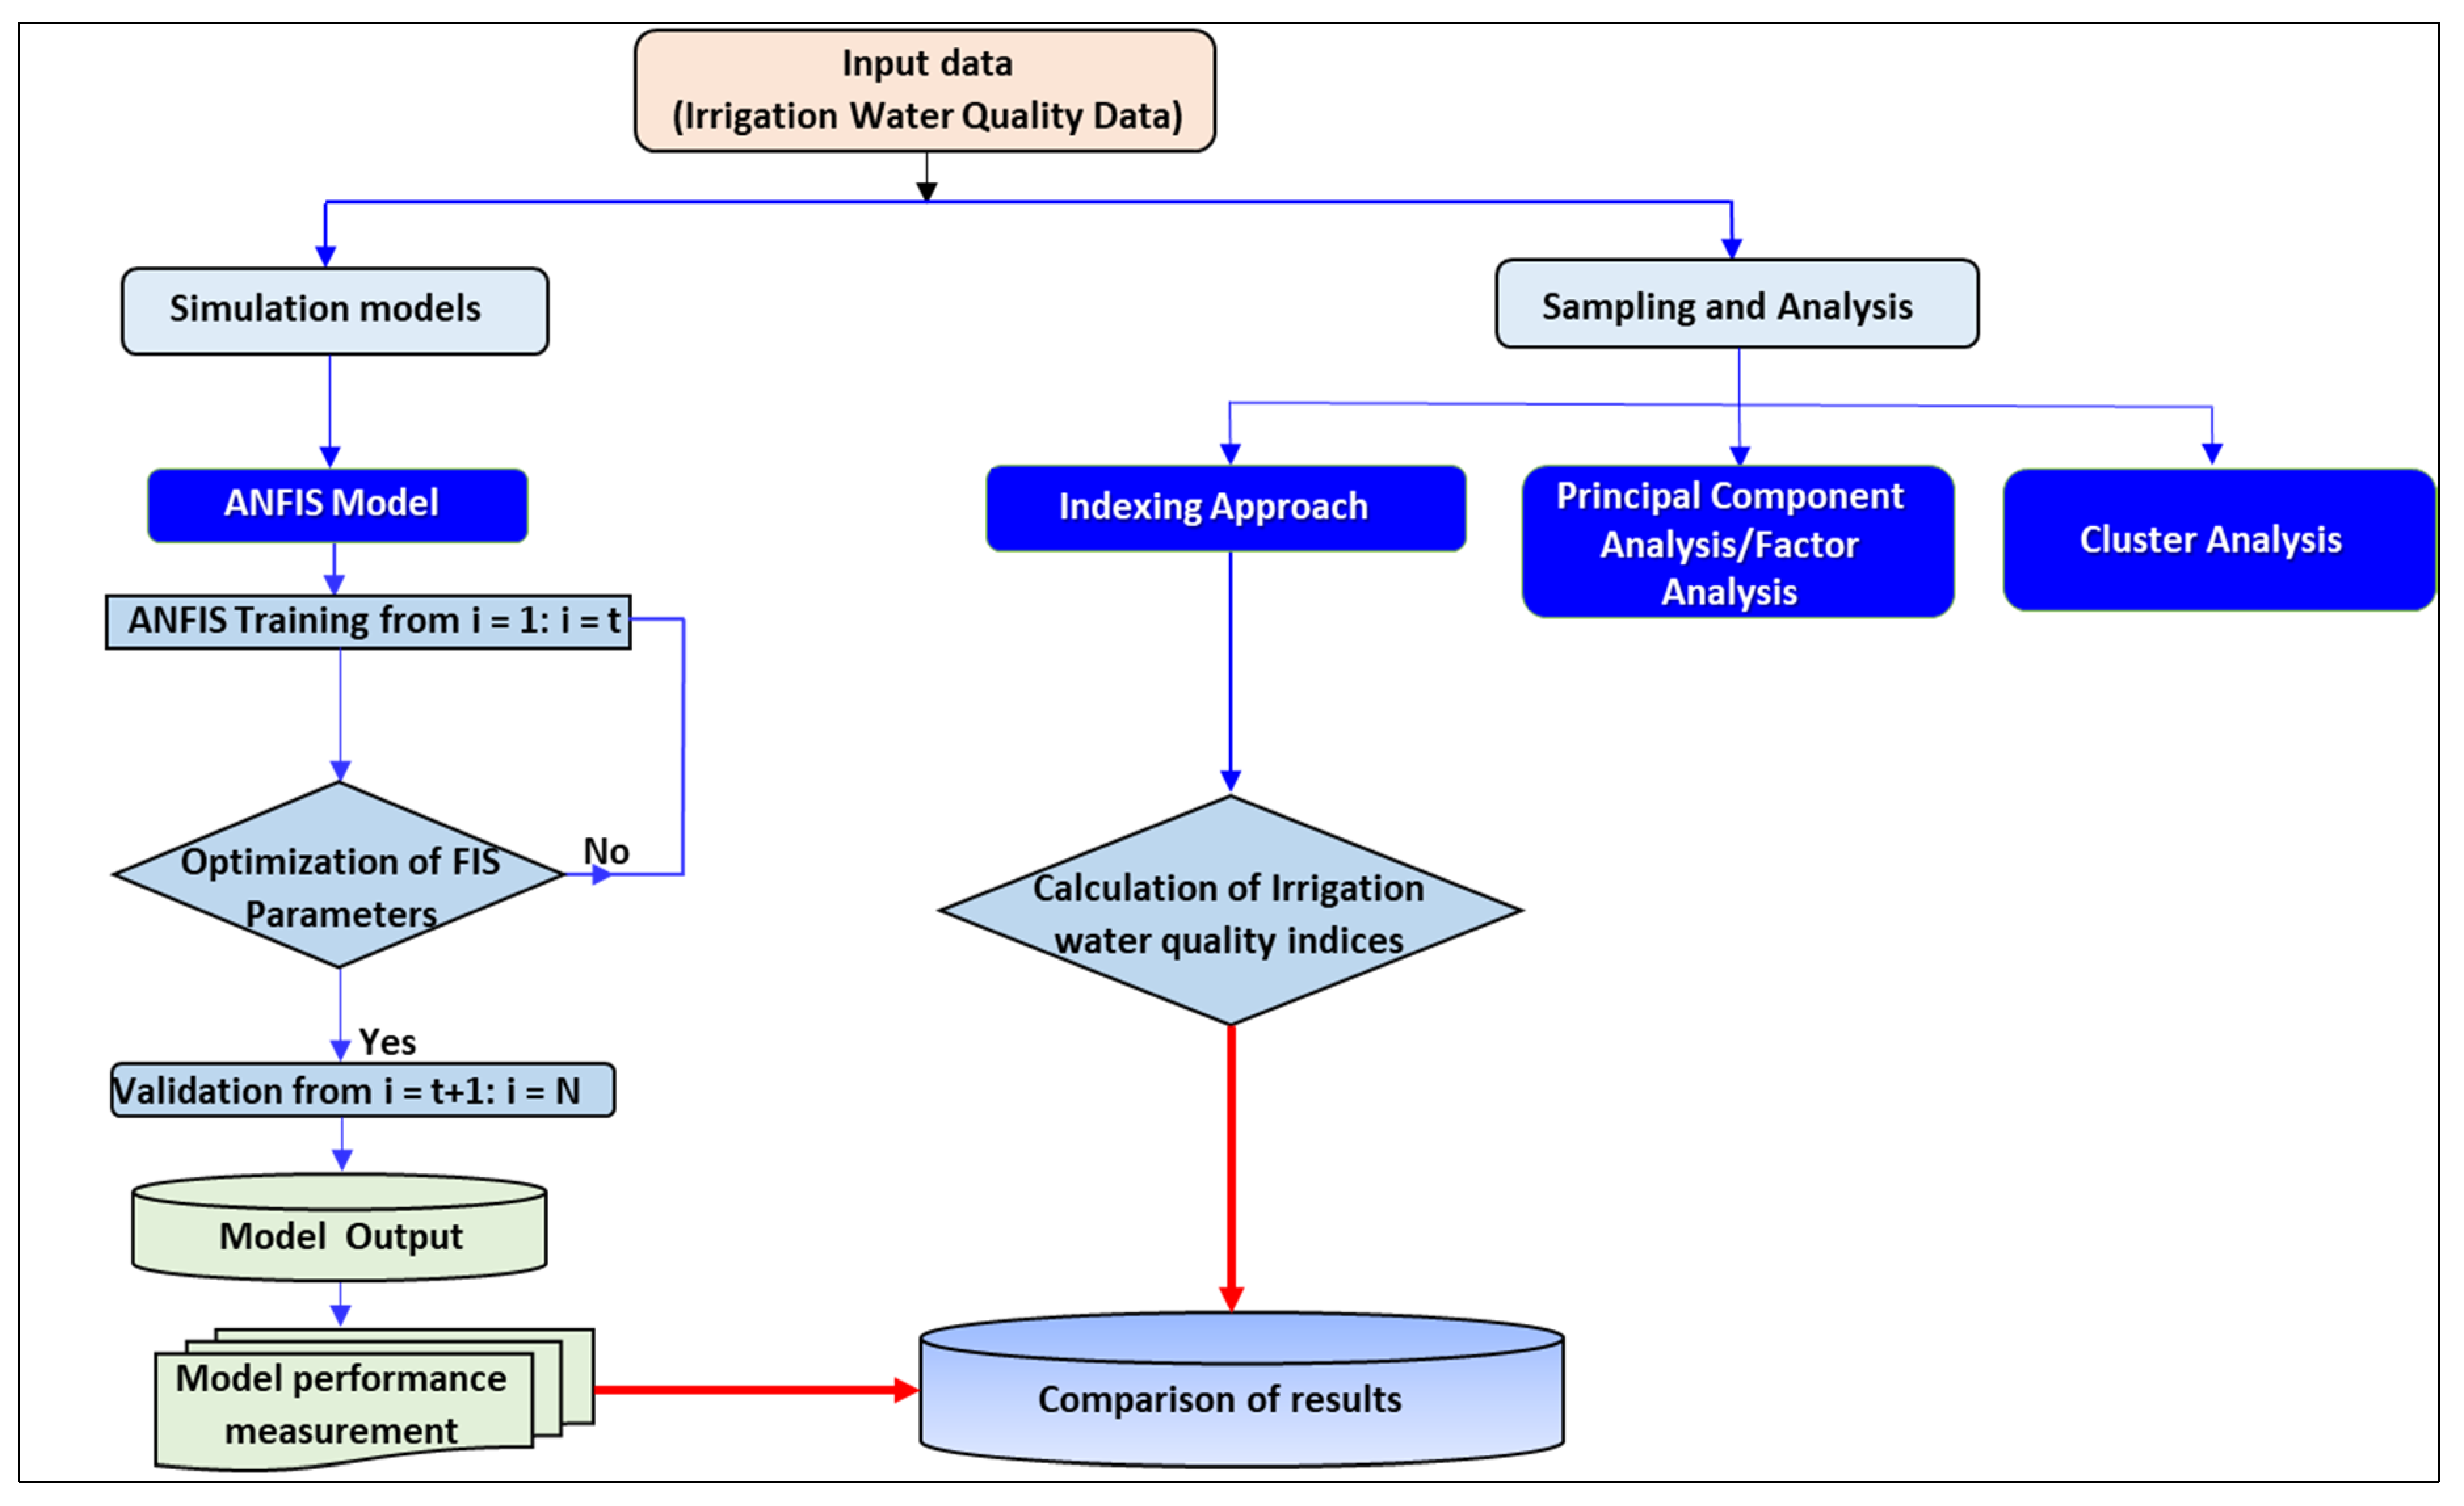
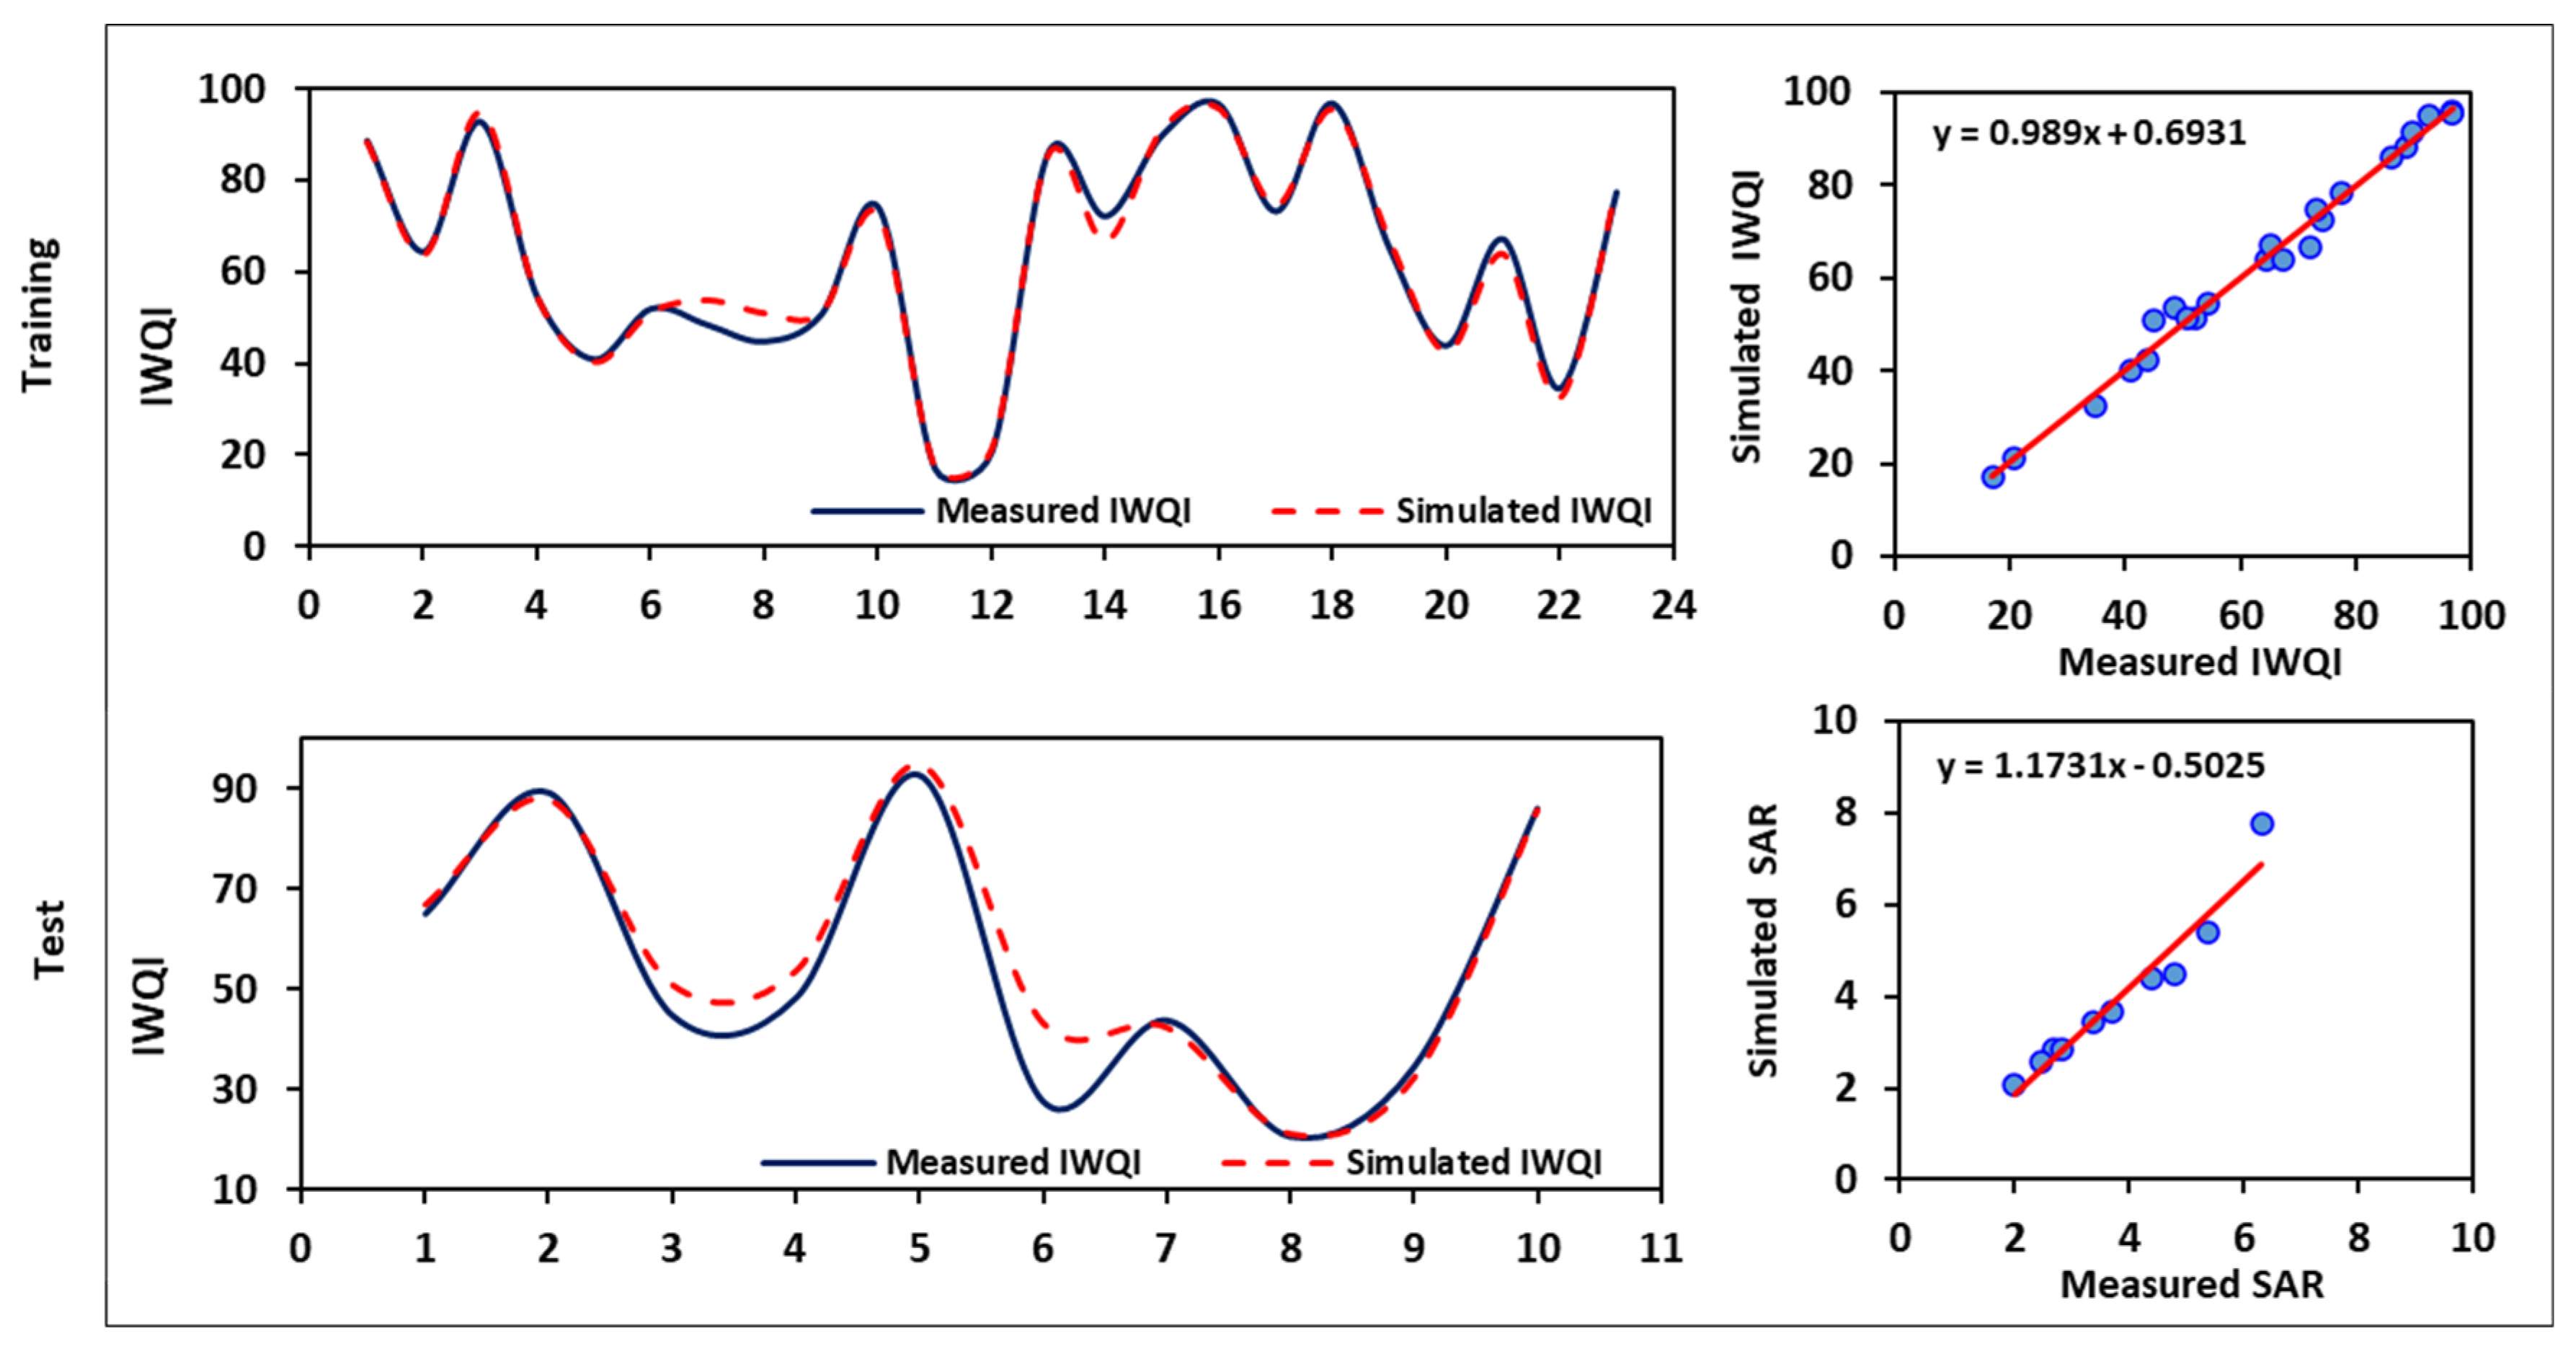
3.6. Simulation Model (ANFIS)
Because the ANFIS model makes predictions based on patterns in the data, the first step in ANFIS prediction is to identify the input variables that will be used for the prediction. These variables should be carefully chosen because they have a direct impact on prediction accuracy. Therefore, a correlation analysis between the input data and the desired output was performed to select the best input variable. This step was repeated for each IWQ index (output), as shown in
Figure 5. Once the preprocessing was complete, the best-performing model was selected using ANFIS training for each IWQ index. After the training was complete, the model was tested against new data to determine the accuracy of predicting future values. The values of the IWQ indices predicted during the training and testing phases are listed in
Table 7.
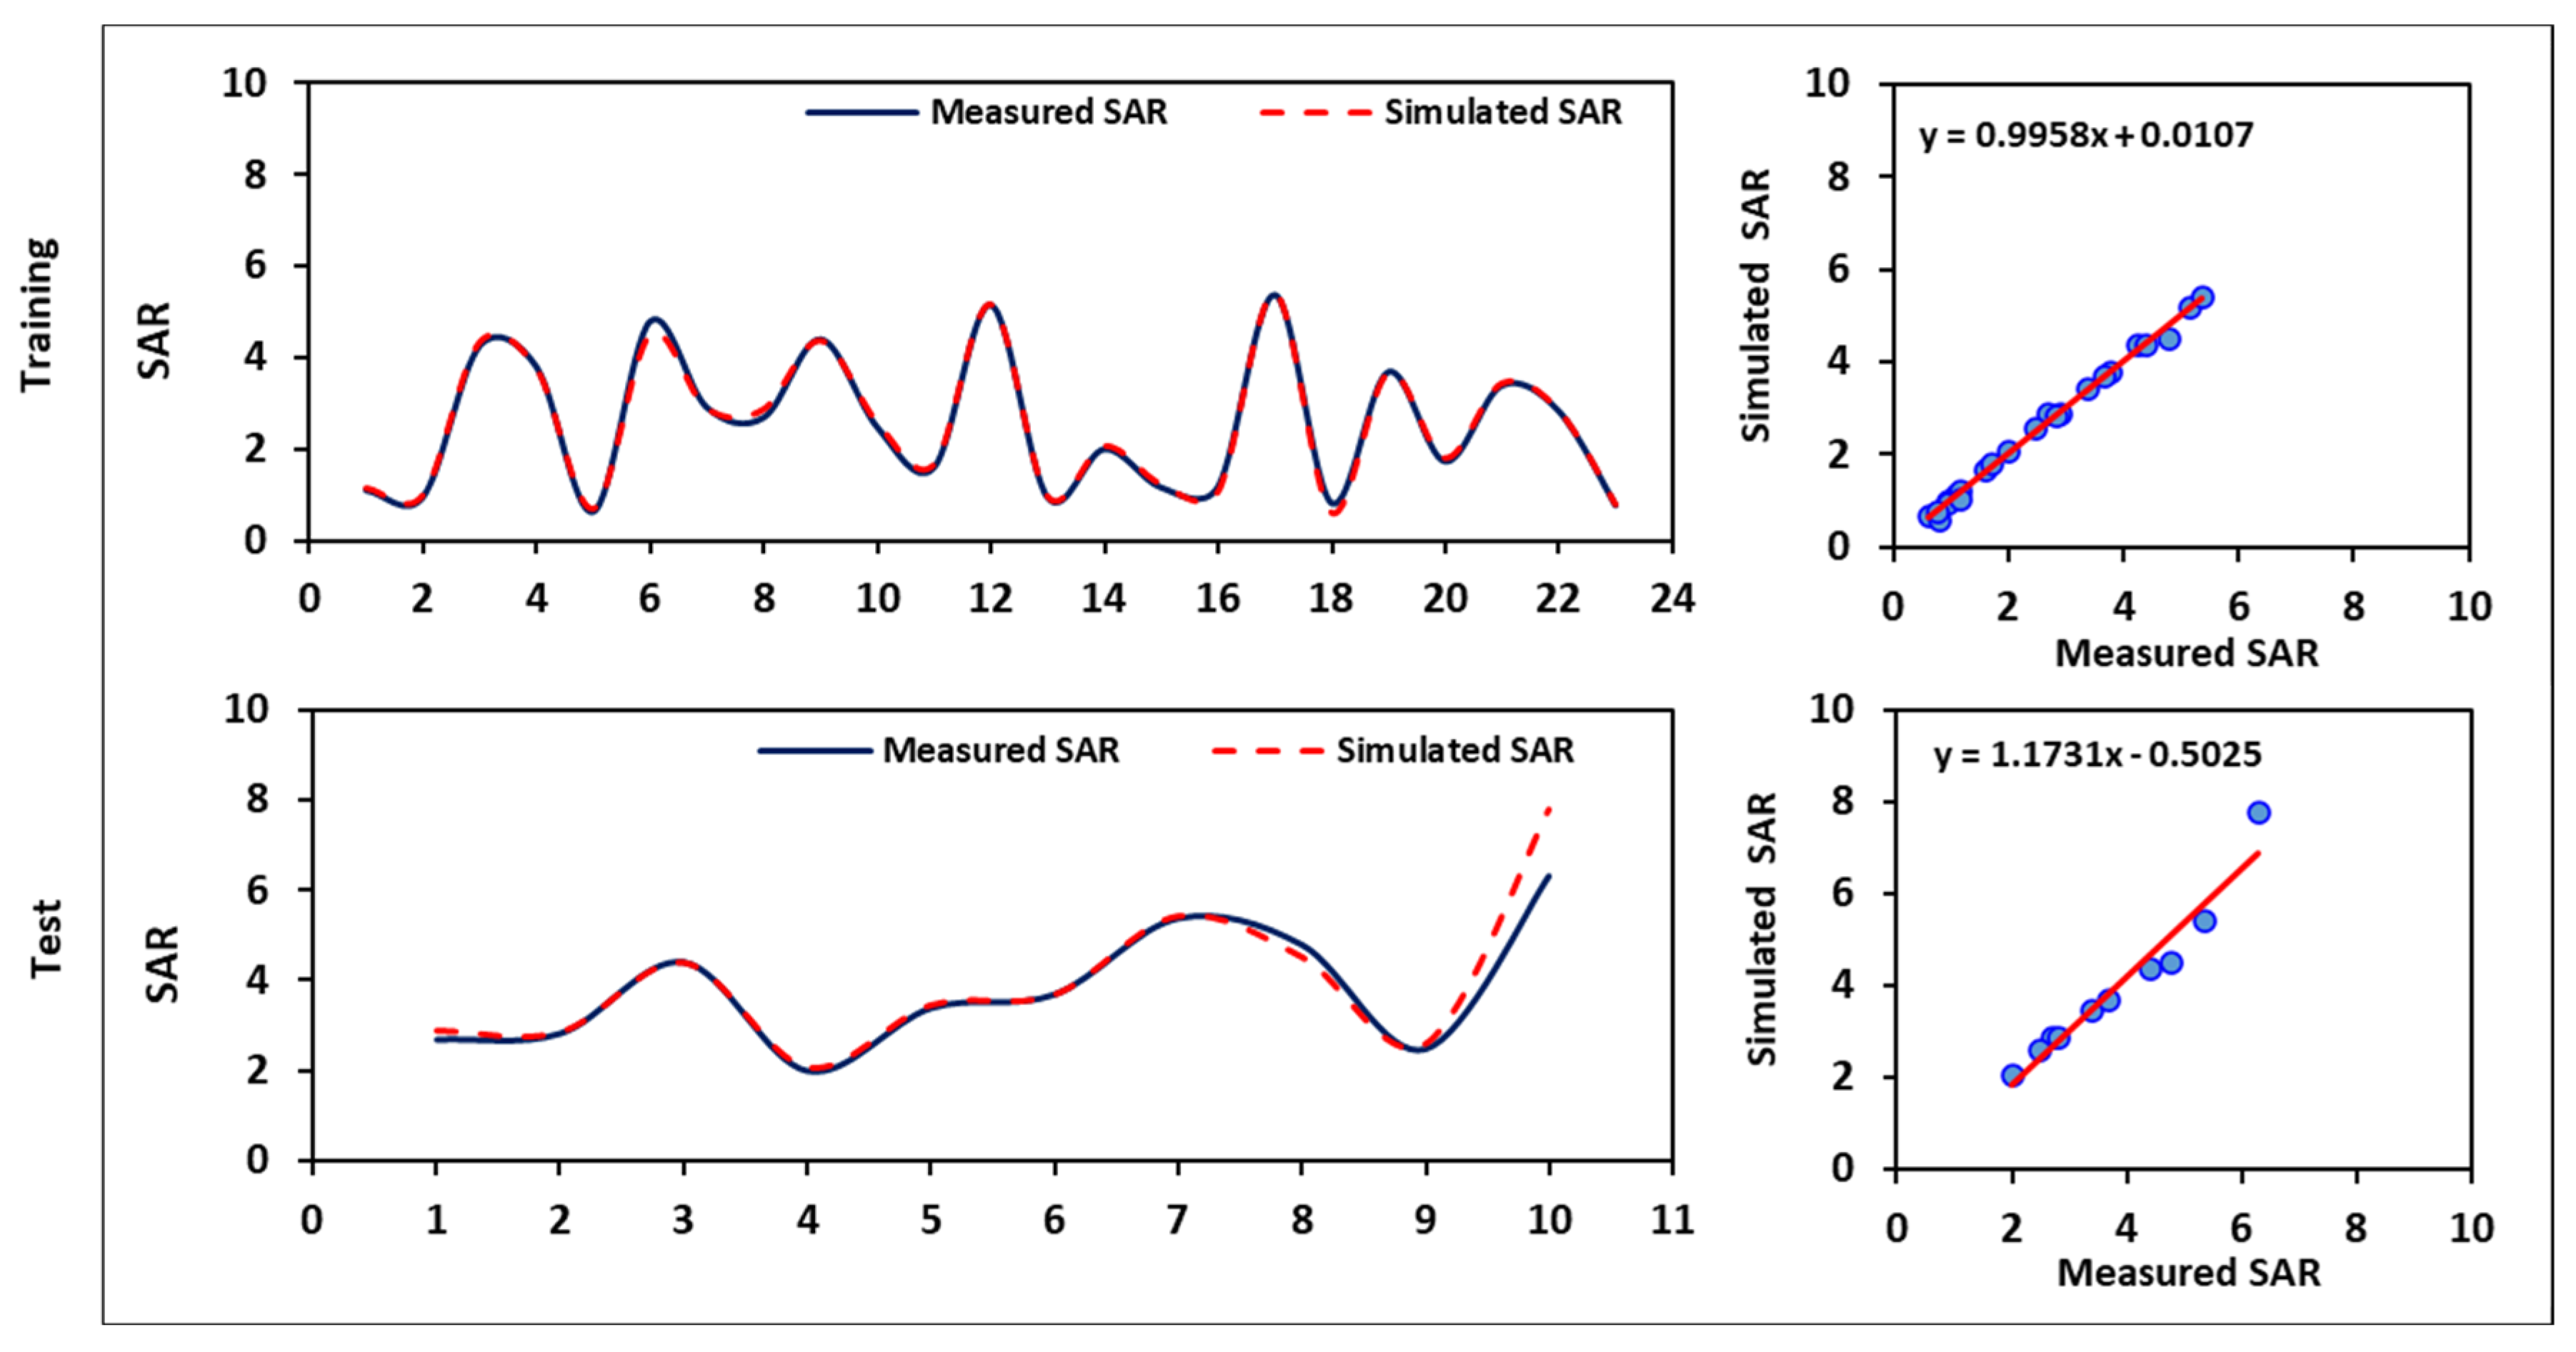
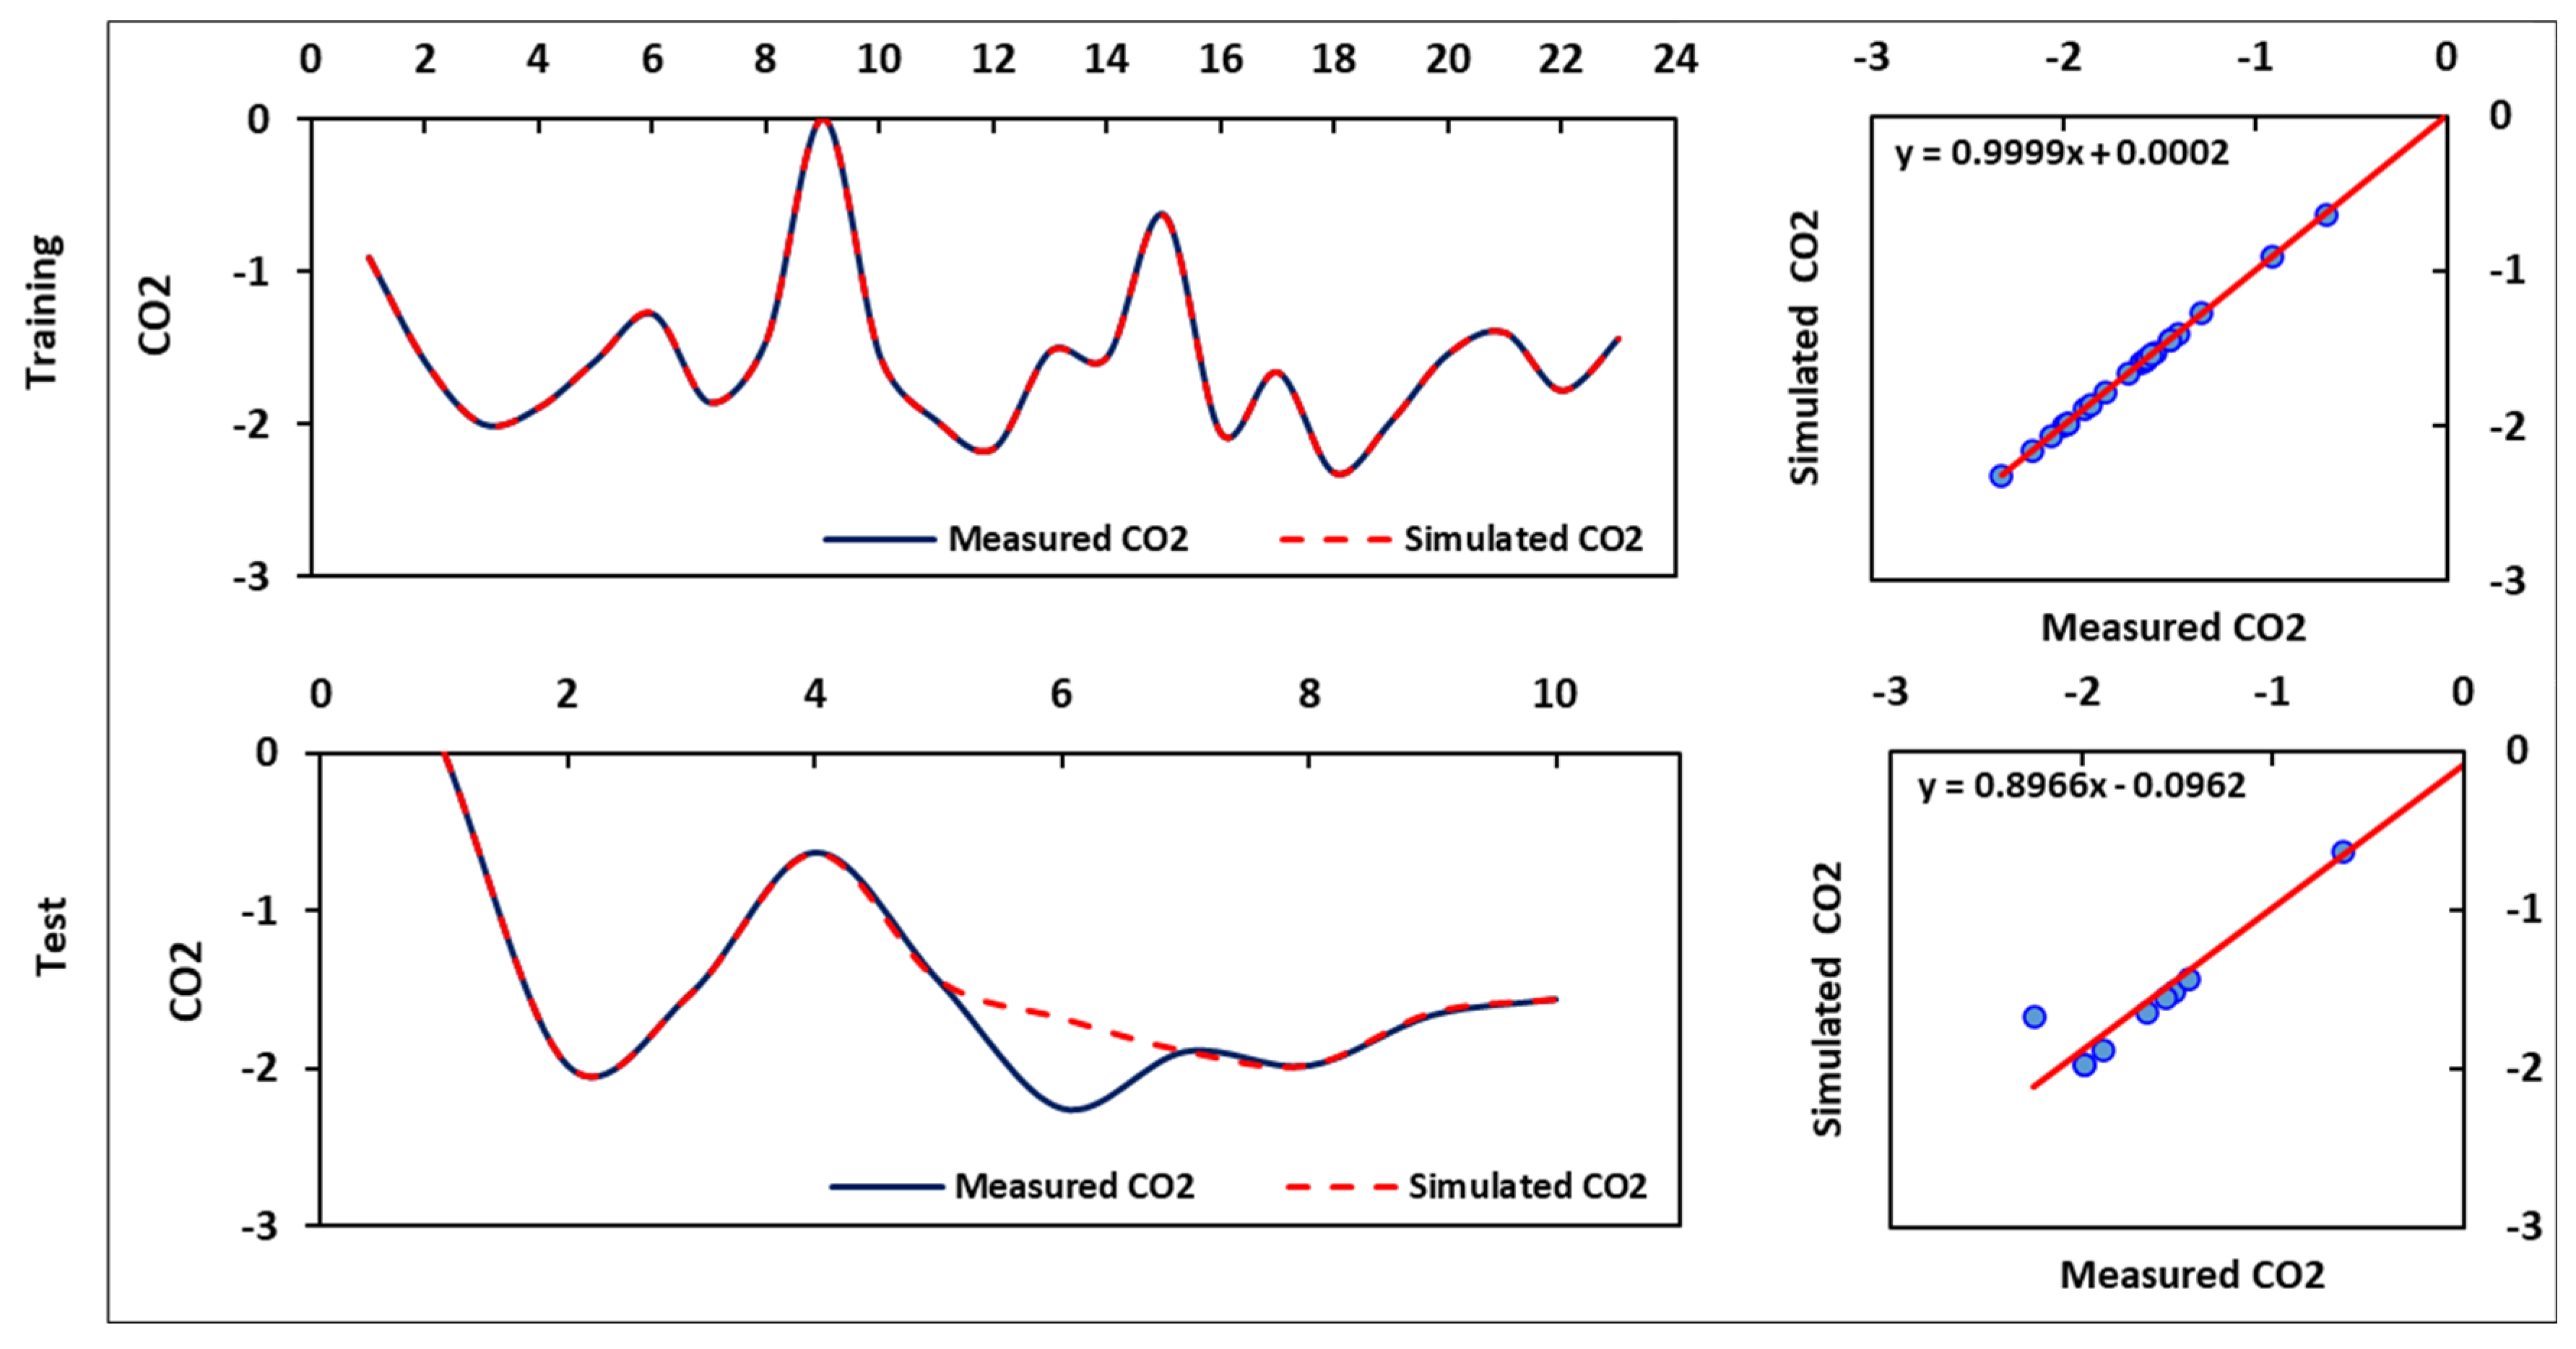
Figure 15,
Figure 16 and
Figure 17 show the results of the predictions of IWQI, SAR, and CO
2 in the training and testing phases, respectively.
Figure 15,
Figure 16 and
Figure 17 show a strong overlap between the predicted and actual values, with some deviations from the measured values. Excellent agreement between the observed and predicted IWQI values as indicated by the high R
2 value (>0.95). In terms of performance evaluation metrics for the ANFIS model, the ANFIS model had a good fit for IWQIs in both the training and testing stages, as evidenced by the E values in
Table 7 being over 0.90. The ANFIS model was successfully used in terms of accuracy for all the indices. The performance of the ANFIS model decreased slightly from the training phase to the testing phase, as indicated by the R
2, RMSE, and MAD values in
Table 7.
Figure 13 and
Figure 14 depict the differences between the predicted and measured IWQIs in the training and testing stages, respectively, as well as the comparative scatter plots. The ANFIS model effectively captured the varying patterns of the observed IWQI data in the time-series plots. The findings of our study support and agree with those of previous studies [
38,
39,
40,
41,
106], which reported that employing the ANFIS model enhanced the prediction accuracy of the standalone model. Overall, the ANFIS is a powerful tool for predictive modeling owing to its ability to capture nonlinear relationships between inputs and outputs while also being able to adapt quickly when new data points are added or removed from the training set.


 ,
, 


