
Study on Prevention and Control Measures of Water–Sand Inrushes Based on Adaptive Adjustment of Mined Thickness

1
College of Mining Engineering, Taiyuan University of Technology, Taiyuan 030024, China
2
Lu’an Chemical Group Co., Ltd., Jinzhong 032600, China
*
Author to whom correspondence should be addressed.
Water 2023, 15(8), 1497; https://doi.org/10.3390/w15081497
Submission received: 22 February 2023
/
Revised: 6 April 2023
/
Accepted: 9 April 2023
/
Published: 11 April 2023
(This article belongs to the Section Hydrogeology)
Abstract
:There have been frequent occurrences of water–sand inrushes in underground mines due to irregular mining activities under thick loose gravel layers. The morphological development characteristics of the caving zone and the changes in the geological conditionsin the working face under a thick loose sedimentlayerof the Pingan Coal Mine have been studied. The empirical formula and numerical simulations are carried out to explore the effect of different thicknesses of the bedrock on the height of the caving zoneand mining thickness. The method of solving the water-sand inrush of the fully mechanized caving face by adjusting the mining thickness was proposed. The results indicate that there is a linear relationshipbetween the height of the caving zone and the mined thickness. The caving height ratio decreases with an increase in the mined thickness and the correlation can be described by a power function. The maximum allowable height of the caving zone and mined thickness are determined based on the thickness of the bedrockand the changed tendency of the caving height ratio. This provides a mean to control the stability of the sand layer on the roof of the working face by adjusting the mined thickness of coal. The method has been applied in the Pingan mine to prevent water-sand inrushes successfully.
1. Introduction
Coal is the main source of energy in China, having great importance in economic development. With the progress of mining technology, more mining activities will be carried out in the loose geological strata where resource depletion occurs.However, there is a lack of studies on the disaster prevention and control of water–sand inrushes under a thick loose layer and weak rock caused by irregular mining activities. Water–sand inrushes occur when a mixture of water and sand bursts into the working face. This can cause damage to mining equipment, fatalities, and loss of production. For instance, 20 people died due towater–sand inrushin the Chaidaer coal mine of Qinghai Province.Water and sedimentcollapsed into the gateways in the Haojialiang coal mine of the Shanxi Province. Table 1 shows some of the water–sand inrush accidents in the last 10 years.
A number of studies have been carried out to understand the mechanisms ofwater–sand inrushes, reducing the impact of water–sand inrushes in coal mines. Tang et al. (1999) [1] found that the sand inrush is caused by sand breaking, seepage, and potential erosion of silt, and proposed a method to reduce the risk of inrush. Chen et al. (2021) [2] studied the controlling factors that cause water–sand inrushes with different clay contents in a loose soil layer, and a new fractional rheological model has been proposed by Zhang et al. (2020) [3], who analyzed the process of water–sand inrushes caused by mining near a loose stratum to explain the critical conditions of water inrush and sand runout with the arching theory. Xu et al. (2021) [4] found that the fracture orientation in rock mass affects the seepage characteristics of water–sand inrushes, and rock mass permeability is related to the fracture orientation in an exponential relationship. Ma et al. (2022) [5,6] investigated the hydraulic characteristics of fault rock during water–silt inrush, and the mass conservation and continuity equations of the three-phase flow were obtained in the one-dimensional radial three-phase flow model.
Coal mining will inevitably cause deformation of the surrounding rock, resulting in ground movement, fractures, and even collapse of the upper strata. Depending on the degree of damage to the rock and the ability of water and sand to flow into the mine from the roof or the coal seams, damage to the mine can be divided into three zones from the bottom to the top, namely: the caving, fractured, and sagging zones. A large number of studies that focus on the height of these three zones provide important information on rock stability and the amount of resource recovery. In terms of rock failure, many studies have used FLAC3D [7,8,9], Universal Distinct Element Code [10,11], Particle Flow Code [12,13], and 3D similarity simulation testing [14] to analyze the rock movement. Based on field observations and statistical analysis, Xu et al. (2011) [15] proposed an empirical formula to calculate the height of “two zones” of a fully developed caving face. Chen et al. (2021) [16] proposed a new fractional rheological model, which can better describe the rheological characteristics of broken mudstone.
In summary, many in-depth studies have been carried out with some successes on the mechanism of water–sand inrushes from a rock mechanics perspective by using experimental simulation to develop preventive measures. A large number of field incidents show that water–sand inrushes are predominately controlled by the geological conditions at the mine. In this paper, numerical simulation and empirical formula are used to determine the controlling factors and mining techniques of sudden water and sand inrushes in a thick layer of gravel and thin bedrock. The thickness of the bedrock and mined coal seam are varied to determine the optimum rate of mining at the working face. The study has been used in the Pingan coal mine to improve safety at the working face.
2. Study Area
The Pingan Coal Mine is located in Shouyang County in Shanxi Province (Figure 1). The mine field is 8.42 km2 and the No. 15 Coal Seam is the study area of this work. The terrain of the Pingan mine area is composed of low mountains and hills and is part of the Shanxi plateau, located at the northern edge of the Qinshui coalfield. The ground surface is covered with Quaternary loess with hills and gullies. The terrain is generally higher in the northeast and lower in the southwest. The highest point is located in Dadongliang near the eastern boundary, with an elevation of 1133.0 m. The lowest point is located in the riverbed in the middle of the southern boundary, with an elevation of 1065.2 m and the maximum difference in relative elevation is about 67.8 m.
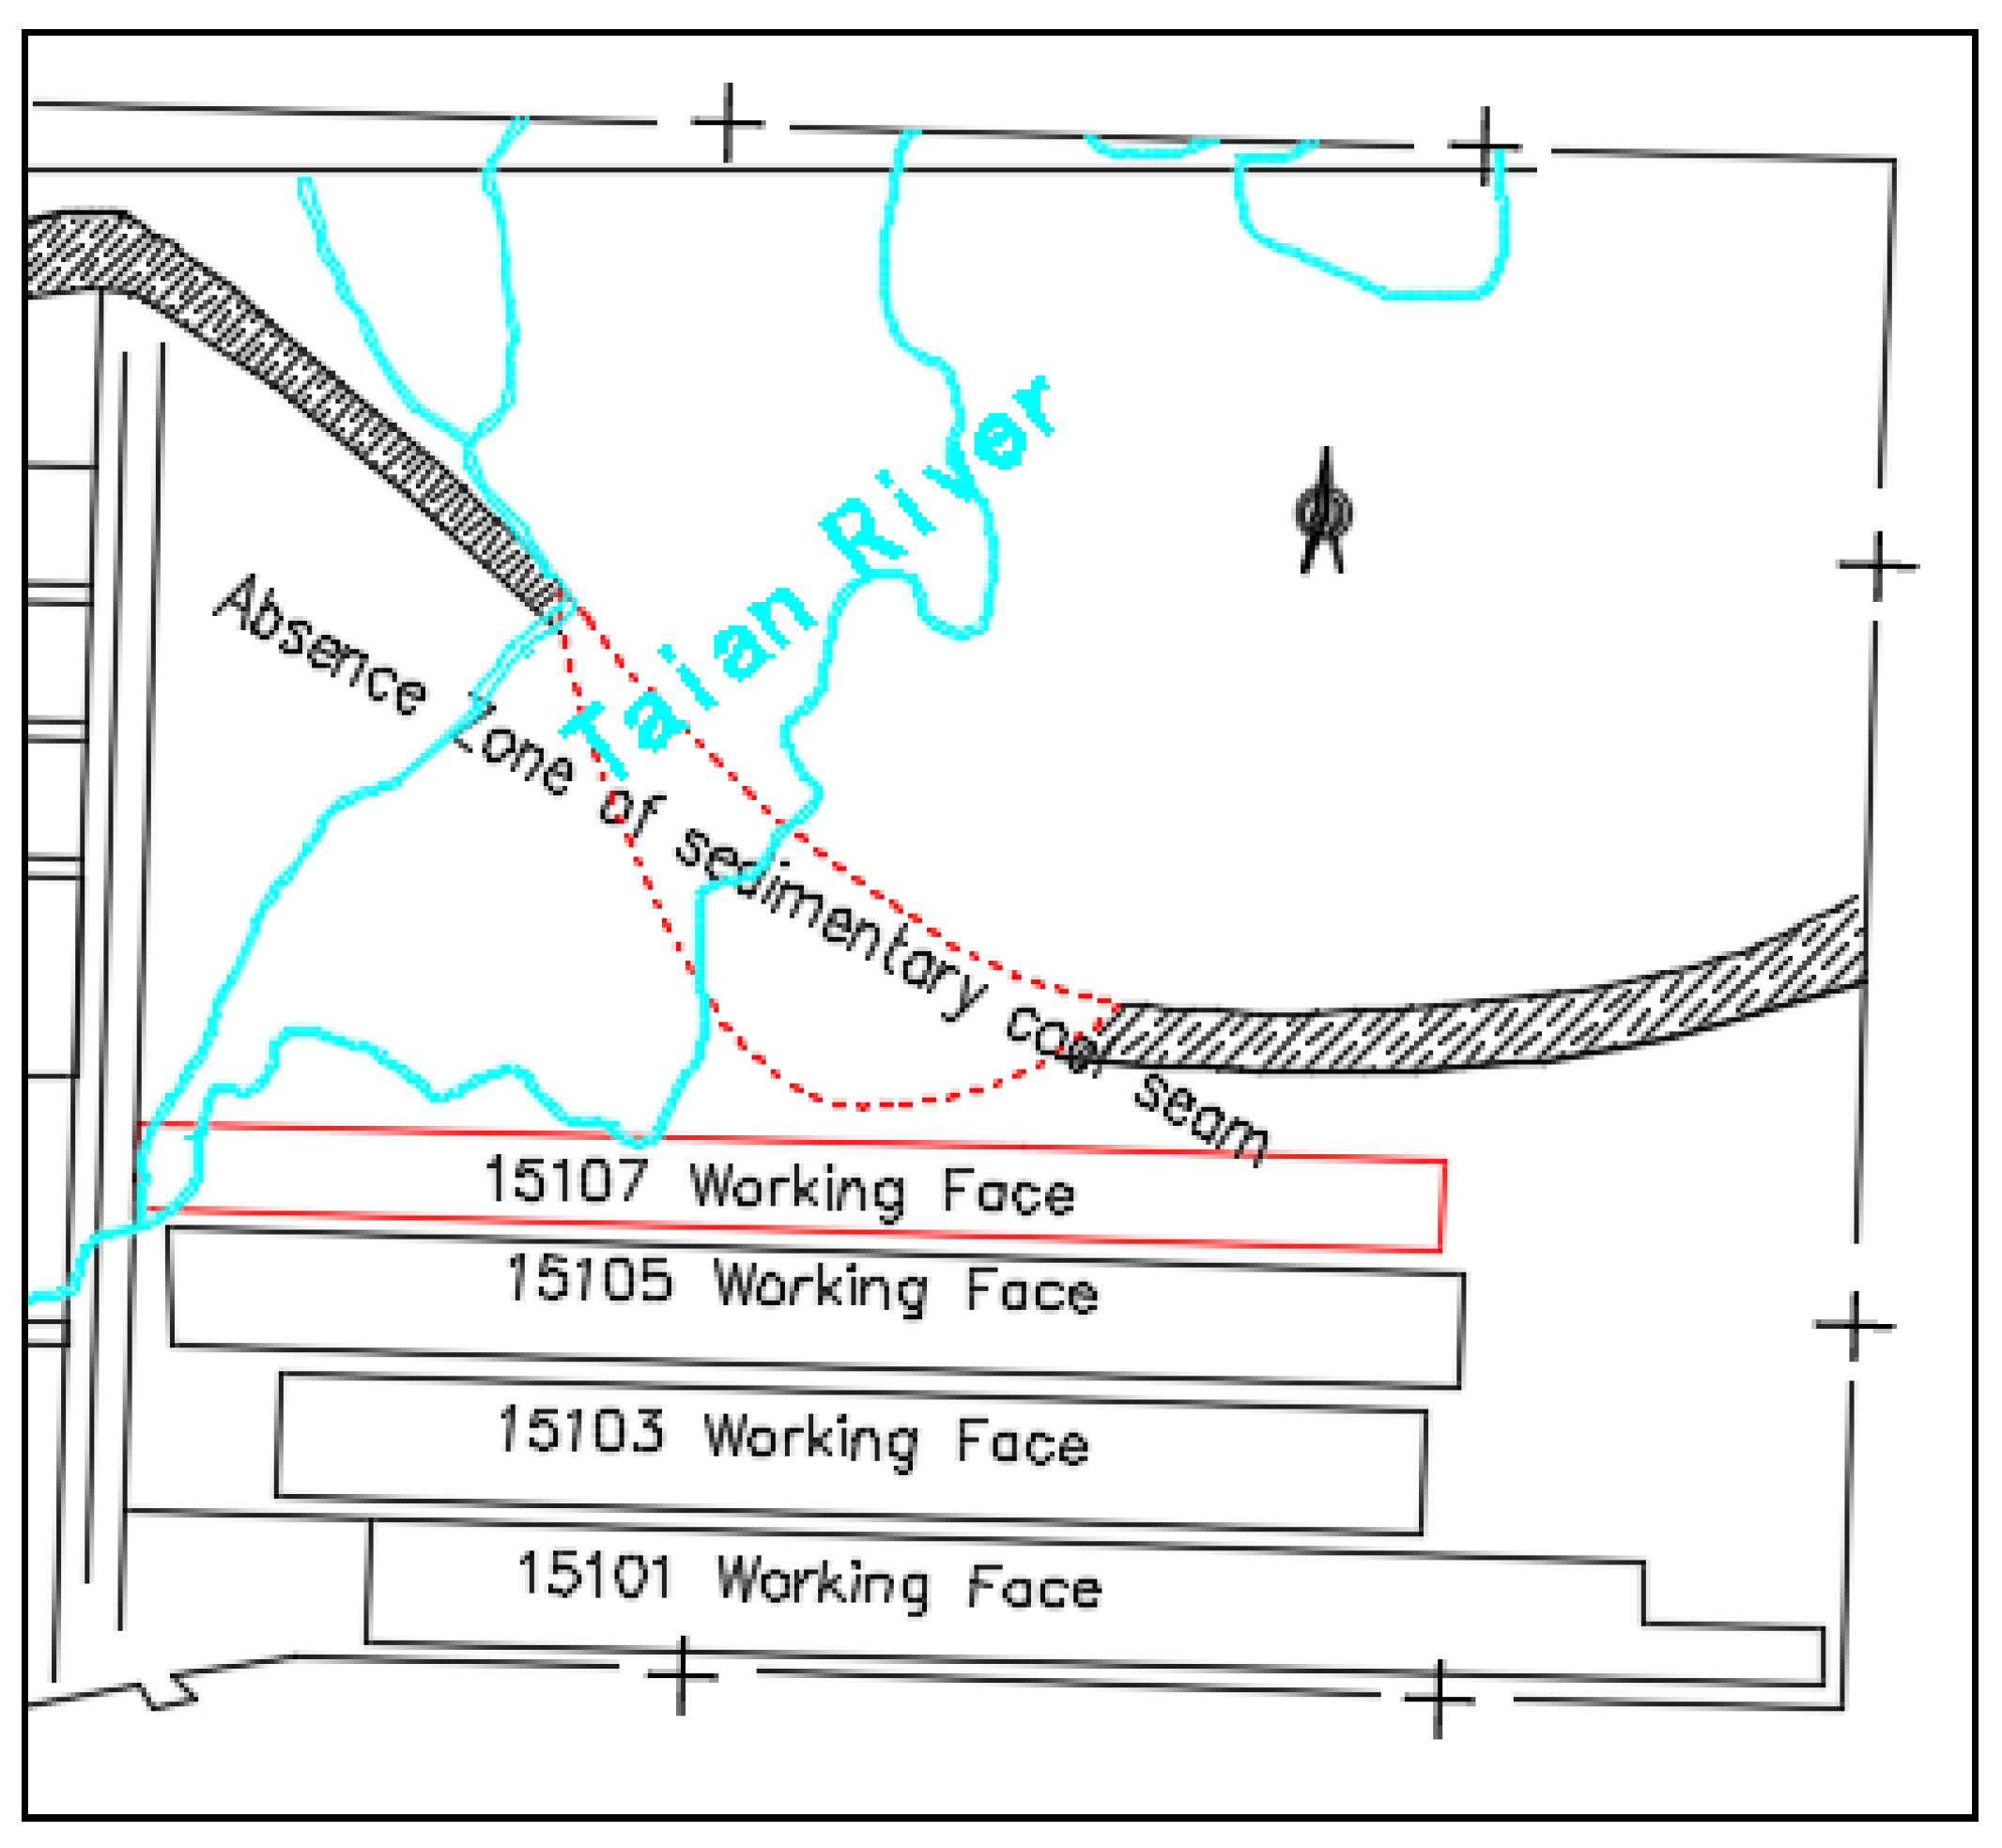
Work Face (WF) 15107 is located at the east of the coal mine, which is adjacent tothe loose layer and oxidized zone (Figure 2). The strike length of WF15107 is 1760 m, with slope lengths of 51–106 m and a recoverable area of 124,185 m2. The thickness of the No. 15 Coal Seam exposed after excavating the roadway ranges from 3.6 m to 5.8 m. The average thickness of the seam is 4.7 m. The average north–south dip angle of the coal seam is 8°. The rock at the top of WF15107 is fine sandstone and at the bottom is sandy mudstone. Overall, the working face is stable, and higher on the northeast side and lower on the southwest side. Most of the geological structures are small and medium size collapsed columns and fault structures. Five collapsed columns and three faults have been exposed during the excavation of the working face.
Most of the field of investigation wells are overlain by loose sediment. The loose sediment is mainly composed of silt and fine sand. The average thickness of the sand layers is about 29.14 m, which accounts for 25.93% of the total thickness of loose sediment (Figure 3). Due to the large number of sand layers, accidents such as sticking and burying occur frequently during drilling construction. The thick gravel layer at the bottom of the loose sediment layer is the main source of water and sand in the working faces. The lack of a clay layer locally at the bottom of the loose sediment leads to direct contact between the water–sand layer and the weathered bedrock zone. A sand inrush occurred at this coal mine on 13 October 2016, with a total discharge of 2072 m3.
Overlying Bedrock of Coal Seam
In order to explore the lithology and frequency of water–sand inrushes of the roof strata in WF15107, 49 exploratory boreholes were drilled at the roof during the excavation process. An additional 27 exploratory boreholes were drilled at the roof during the excavation in WF15105.
The roof strata of WF15107 are dominated by sandstone with some mudstone. Based on physical and mechanical testing of the roof rock, the compressive strength of the mudstone and sandy mudstone of the No. 15 Coal Seam is basically less than 3.9 to 26.4 MPa under a saturated state. The compressive strength is less than 12.9 to 41.9 MPaunder dry conditions, which belongs to soft to medium-hard rocks.
The thickness of the bedrock of WF15107 is thin near the concealed outcrop area, and the top of the bedrock is weathered to some extent. There are watery sand layers in some areas. The thinner the bedrock, the greater the threat of sand and mud collapse.Based on drilling data, the contours of the bedrock thickness of WF15107 are shown in Figure 4. The bedrock thickness of the roof varies between 14 and 59 m. The bedrock thickness is relatively thin in a small range of blue areas in the middle and the eastern areas of the working face, facing greater water–sand inrush risks. The exploratory borehole of WF15107 shows that the bottom of the loose layer is mostly a layer of watery sand with a thickness of about 5.3 m.
3. Study on the Principle of Caving Zone
According to the above analysis, the required height of the sand-proof pillar is closely related to the thickness of the mined coal seamand the bedrock. In the actual mining process of the working face, due to variousmining techniques, mined thickness, bedrock thickness, and lithology, the shapes and heights of the caving zone are diverse.The mining thickness should be adjusted based on the thickness of the bedrock so that the height of the sand-proof coal pillar is less than the thickness of the roof bedrock, which keeps the watery sand layer stable. The production rate can be improved by controlling the mined thickness of the coal seam. By combining empirical formulas and numerical simulation, changes in the morphological characteristics and the caving height ratio (ratio of the height of the caving zone to the mining thickness) are discussed.
3.1. Calculation of the Height of the Caving Zone
The roof of WF15107 is predominately sandstone with interbedded mudstone. By using regression analysis, Xu et al. (2011) [4] proposed an empirical formula to calculate the height of the caving zone for medium-hard and soft rocks. The height of the caving zone can be calculated by the following formula. This formula has been proven to haveuniversal applicability and serves as a reference for this paper.
where M (m) is the effective mining thickness of the coal seam.
The height of the sand pillar is greater than or equal to the sum of the maximum height of the caving zone and the thickness of the protective layer:
where Hs (m) is the height of the sand pillar, Hk (m) is the maximum height of the caving zone, and Hb (m) is the thickness of the protective layer.
Hs ≥ Hk + Hb
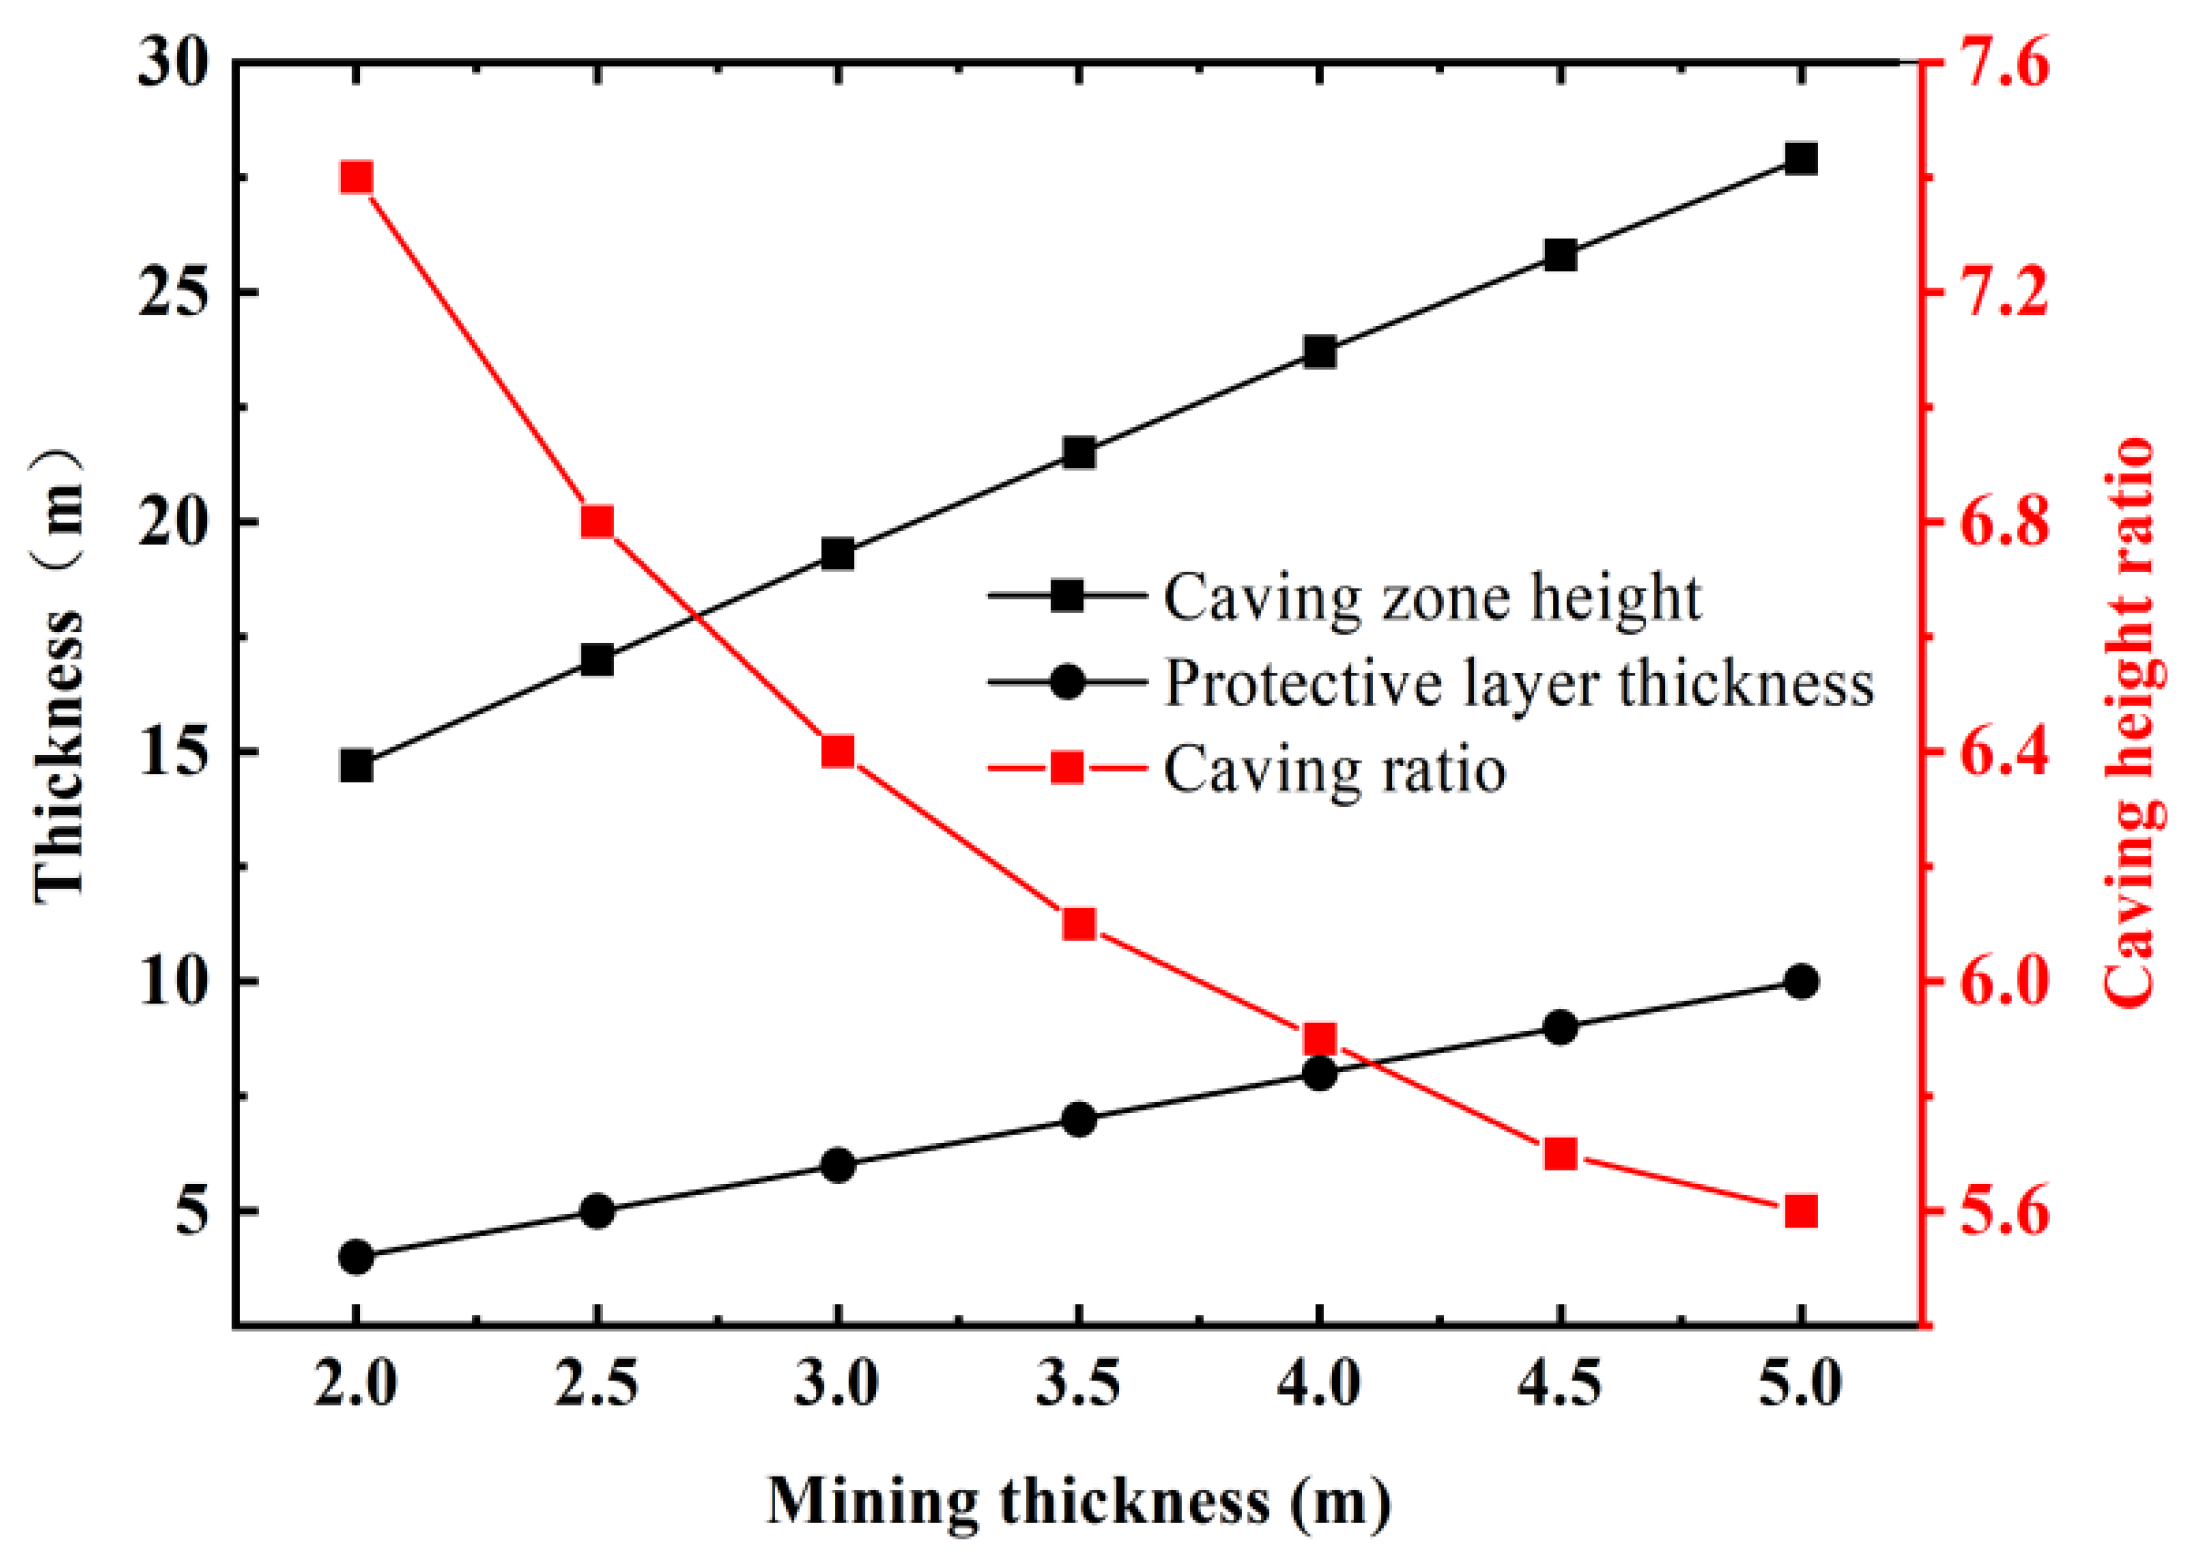
According to the data from the exploratory borehole at the roof of the return air duct in WF15107, there is soft cohesive soil at the bottom of the loose layer. The thickness of the loose layer is greater than the total mined thickness of the coal seam. Additionally, the thickness of the protective layer is twice the mined thickness of the coal seam, which is planned in the coal mine through engineering experience. As shown in Figure 5, the thickness of the protective layer and the height of the caving zone have a linear relationship with respect to the thickness of the mined coal seam. When the thickness of the mined coal seam is equal to 5 m, the height of the caving zone reaches the maximum value of 27.9 m. When the mining thickness is equal to 2 m, the minimum height of the caving zone is 14.7 m. The caving height ratio decreases with an increase in the thickness of the mined coal seam which can be described by a power function.
3.2. Numerical Simulation
The UDEC is a numerical model that simulates discrete block movements and rotations with complete separation and is used to study fracture development and rock failure in mines. Based on the geological and mining conditions of WF15107, the UDEC model was developed to study the morphology and caving of the mine roof. The model calculates the size of the caving zone with different bedrock thicknesses of the roof of the coal seam at the working face to study different mining techniques and controlling factors on efficient and safe mining practices. In this study, the working face is basically divided into three areas according to the bedrock thickness (Figure 6). The average thickness of the sufficient bedrock, the thin bedrock, and the deficiency bedrock are about 45 m, 25 m, and 18 m, respectively.
3.2.1. Numerical Calculation Model
The dimensions of the numerical model are 200 m (W) × 140 m (H). The weathered bedrock is considered to be the loose layer and watery sand layers. The model parameters of each rock layer are based on the bedrock lithology and physical and mechanical tests. To minimize the boundary effects in the model, the left and right boundaries are set to be 30 m away from the coal pillars. Different caving methods are considered to study the stability of the roof bedrock. The UDEC models for the three areas are shown in Figure 7.
Three sides of those models were fixed along the X and Y directions. The allowable vertical displacement was bounded to zero at the bottom of the model. The self-weight of the rock in the above models is applied to the upper boundary as uniformly distributed stress. The depth of this working face is 180 m below the ground surface. The gravitational acceleration is taken as 10 m/s2 and the density of the rock above the model is assumed to be 1600 kg/m3. The applied load on the upper boundary is 0.8 MPa. The rock mass is considered to be elastic–plastic with a yield criterion based on the Mohr–Coulomb yield criterion. The physical and mechanical parameters of the coal and rock strata in the numerical model are shown in Table 2.
3.2.2. Simulation Results
The simulation of Region 1 is first carried out, and it has a thick layer of rock above the roof. When there is sufficient bedrock with a mined thickness of 5 m, the entire coal seam can be fully extracted with maximum recovery. Although the height of the caving zone is 27.9 m, it does not reach the top of the bedrock layer with sufficient thickness to protect the mine from the watery gravel layer above. The caving zone is saddle-shaped, as shown in Figure 8. The collapse of the bedrock causes large-scale deformation and failure of the overlying strata, thus showing an intermediate integral collapse with ground surface subsidence. The shape of the collapsed zone is uneven on both sides of the rock mass, with obvious cracks and flow channels. There is a separation of the thick watery gravel layer at the bottom of the Quaternary formation and the top of the bedrock, with interlaminar fractured zones.
Secondly, the numerical calculations are carried out in the area with thin bedrock (Region 2). When the mining thickness is set to 5 m, the developed height of the caving zone is 28.1 m (Figure 9a). The developed height of the saddle-shaped top interface of the caving zone exceeds that of the watery gravel layer, so the caving zone affects the watery gravel layer. Rocks on both sides of the saddle-shaped top interface are unevenly fractured. Therefore, there will be the occurrence of water–sand inrushes. When the mined thickness is set to 4 m, the developed height of the caving zone is 24.3 m. The saddle-shaped top interface of the caving zone extends to the sandy mudstone layer but not into the aquifer at the bottom of the loose layer. However, the thickness of the protective layer is seriously inadequate. As it is affected by the instability of coal mining conditions, there is still the large possibility of water–sand inrush (Figure 9b). The size of the fracture flow channels formed by rocks on both sides of the saddle-shaped caving zone is less than 5 m of the mined thickness. When the mined thickness is equal to 3 m, the height of the caving zone is 18.2 m (Figure 9c). In this case, the top of the caving zone does not reach the bottom of the loose layer, and the protective layer is sufficient to protect water and sand inrush from above. The size of the flow channel formed by uneven rock collapse on both sides of the saddle type interface is smaller than those in the two above cases, so the threat of water–sand inrushes has been reduced.
Finally, a numerical simulation of the area with insufficient bedrock thickness (Region 3) is carried out. The average thickness of the coal seam in this area is about 5 m, and the minimum mining thickness with mining equipment is 2.3 m. Based on the simulation results, the height of the caving zone is 16.2 m (Figure 10). The height of the caving zone is higher than the thickness of the bedrock, and the saddle-top interface extends to the bottom of the watery gravel layer. The overall collapsed subsidence in the middle of the caving zone is not obvious. The rock on both sides of the saddle-shaped interface causes uneven fractures and collapses.
4. Analysis and Discussion
4.1. Failure Characteristics of Mining-Induced Rock
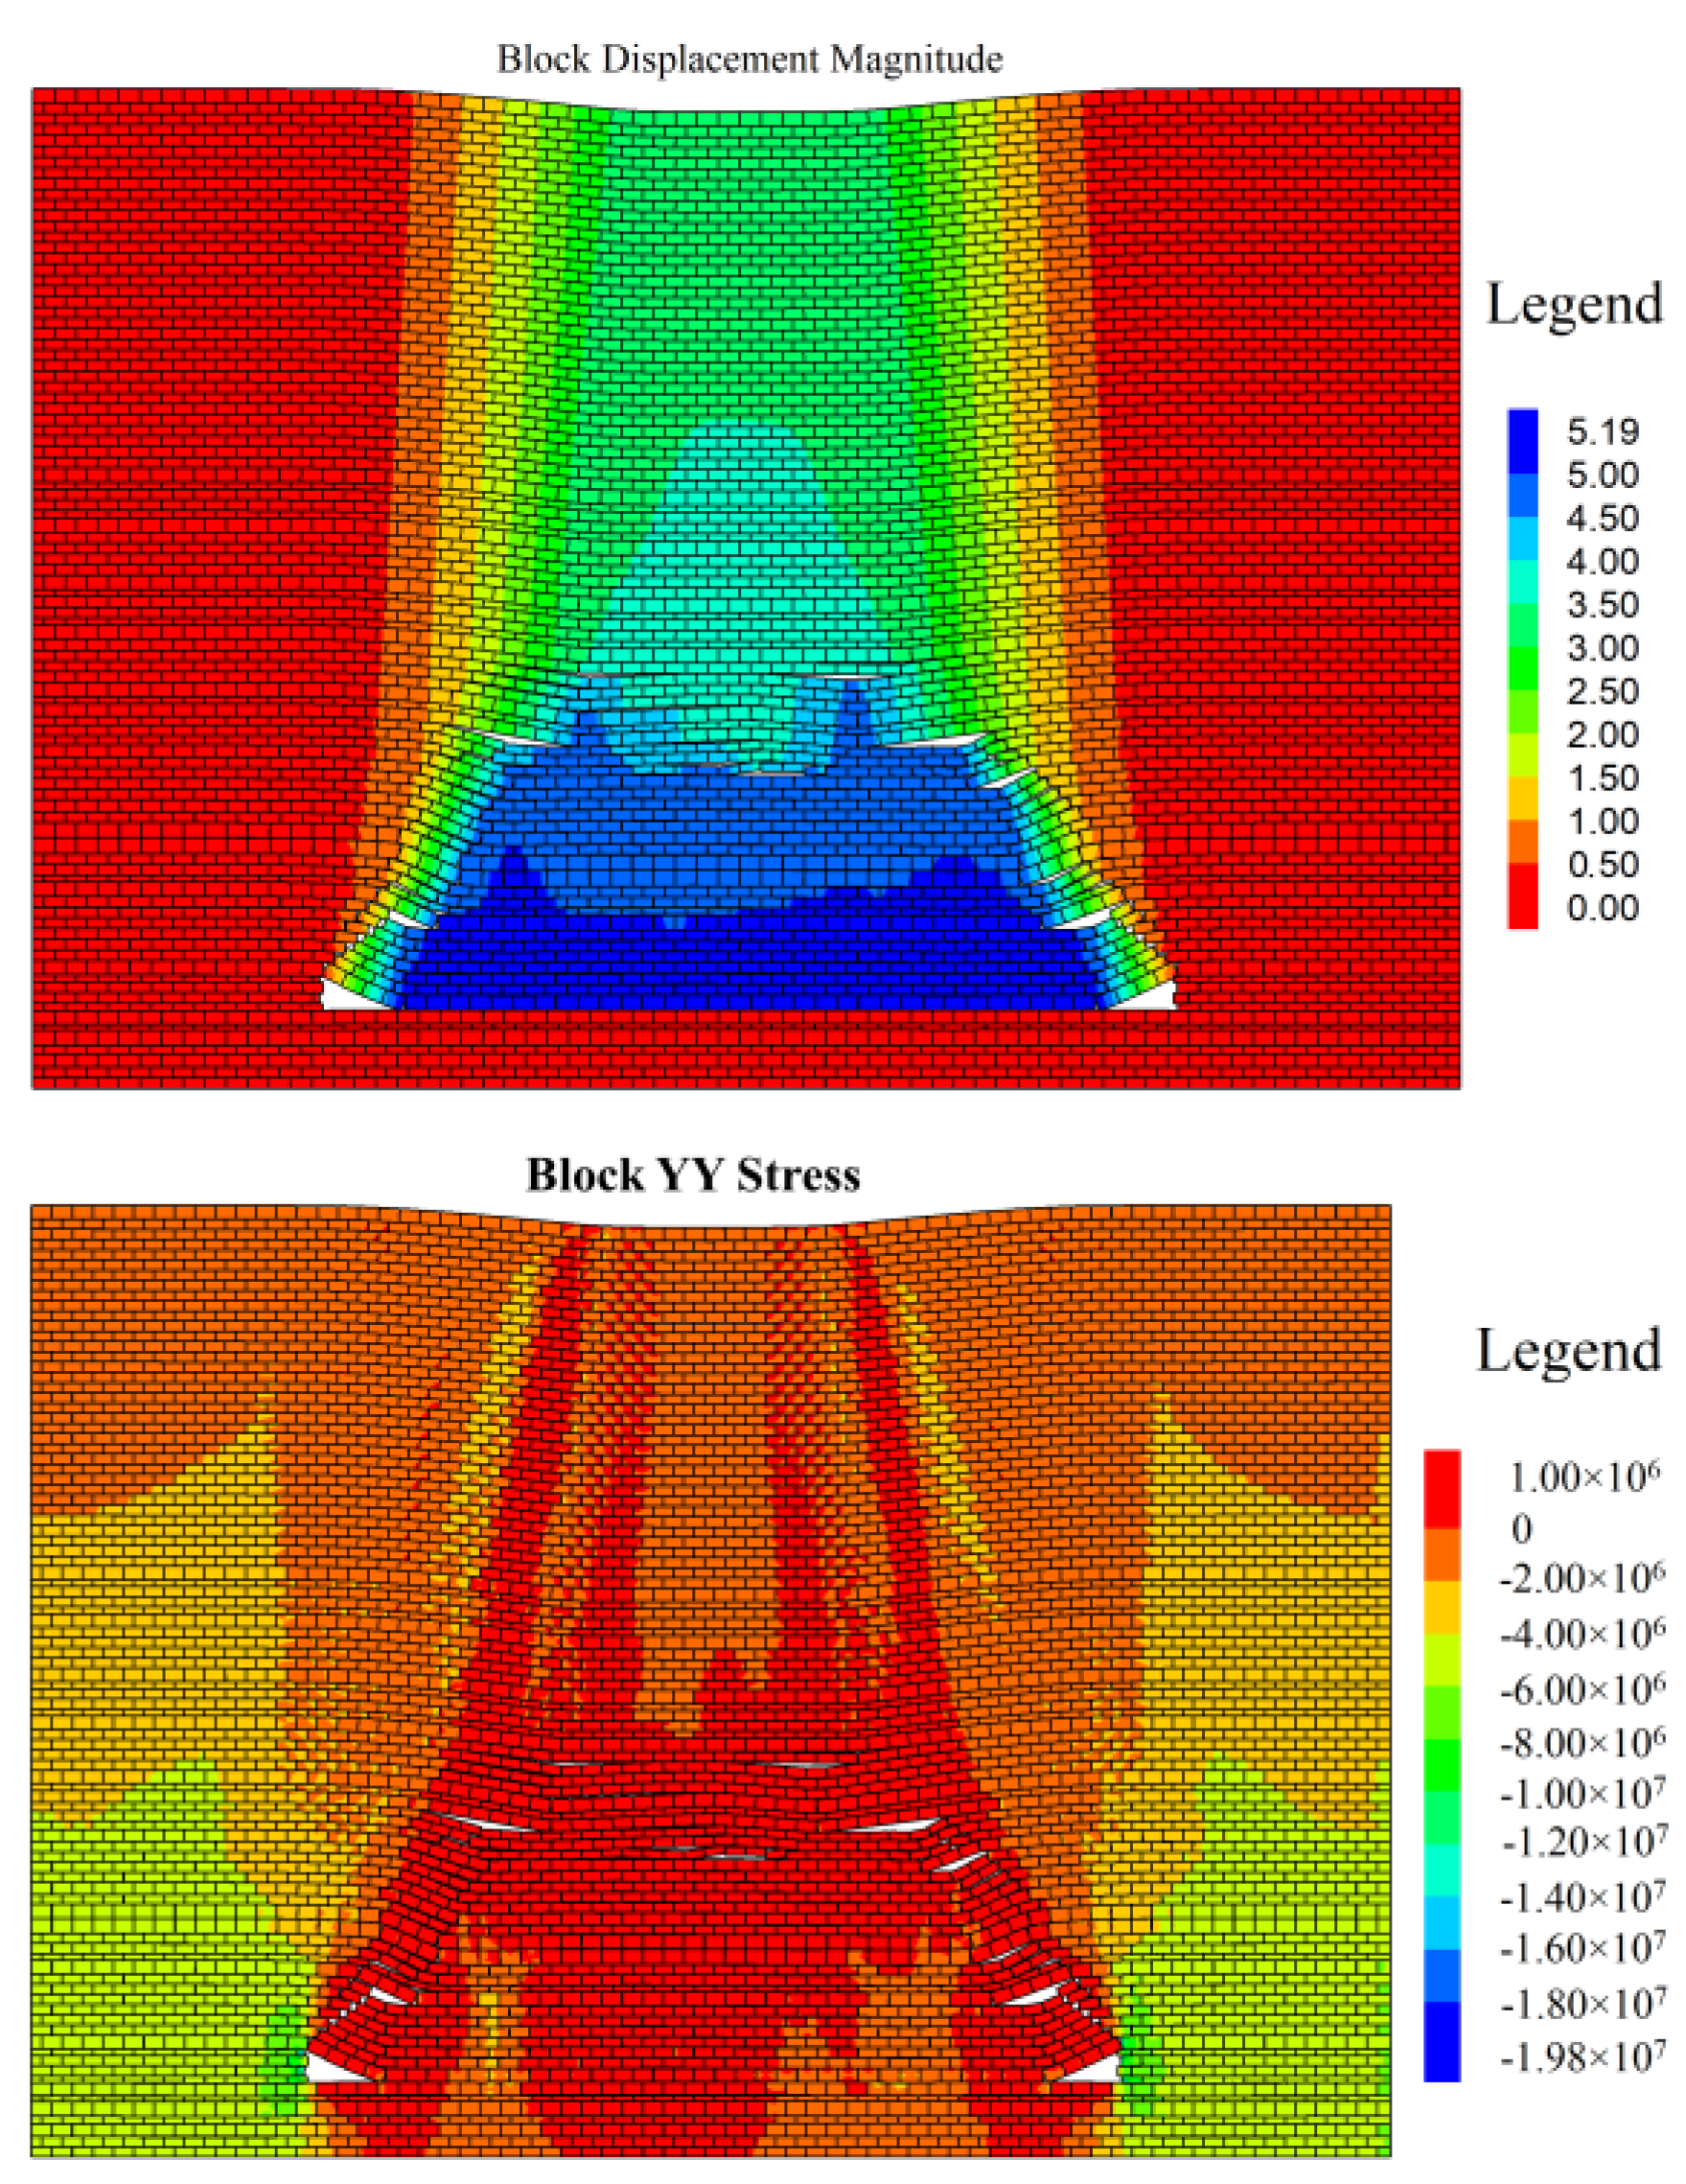
Based on numerical simulations, the stress and displacement contours in the y direction after excavation of the coal seam with thin bedrock are shown in Figure 11 When the coal seam is not mined, the roof and floor strata are in a state of stress equilibrium, and the internal stress distribution is uniform. Due to the mining of the coal seam, the stress equilibrium of the overlying bedrock on the roof is not satisfied and the stresses are redistributed. The rock mass in the caving zone cannot transfer the horizontal stresses and the caving zone cannot transfer the gravity of the rock mass to the coal wall owing to the changes in stress. The failure mode of the overlying bedrock can be described as a saddle shape [17,18,19]. The vertical stress distribution shows that the stress on both sides increasedbecause of the compaction of the gangue falling in the middle of the goaf. The rock on both sides of the saddle type is the compressive zone with a maximum stress of 19.7 MPa, and the middle is in a bidirectional tensile zone.
The nephogram shows that the displacement of the rock in the saddle type interface is the largest. Based on the degree of damage and rock mass condition in the caving zone, the caving zone is generally divided into two parts, namely the irregular and the regular caving zones. In the irregular caving zone, the original rock structure is completely destroyed and the broken rock is more disorderly. The regular caving zone is found above the irregular caving zone, and the rocks retain the original structure. The expansion of the rock mass causes the volume of rocks in the caving zone to increase significantly, and the expansion coefficient reaches 1.3. Due to the increase in the height of the caving zone, the void below the uncaved roof strata becomes smaller, and the caving stops.
Figure 11 shows that the bulges on both sides of the saddle-shaped interface extend to the bottom of the watery gravel layer at the front, which is the main water–sand inrush channel. The interlayer and horizontal cracks on both sides of the caving zone are much more developed, with good hydraulic connectivity. Water, water–sand mixture, and other fluids can easily flow through the caving zone. Due to the high quartz content of the clastic minerals in the bedrock, the size of the rock in the collapsed block is large with a small expansion coefficient and good hydraulic connectivity. If the caving zone extends to the aquifer, it will cause water–sand inrushes. Therefore, it is important to select the appropriate mined thickness and caving height ratio to prevent water–sand inrushes.
4.2. Determination of Caving Height Ratio
Based on numerical simulation and the empirical formula, the height of the caving zone is calculated to be 27.9 m when the bedrock thickness is sufficient, and the maximum caving height ratio is 7.4. When the bedrock is fairly thin, the mined thickness can be adjusted. If the mined thickness is equal to 3 m, there will be no water–sand inrush with sufficient thickness of the protective layer. In this case, the height of the caving zone is calculated to be 18.2 m, and the height of the caving zone calculated by using the empirical formula is 19.3 m. The area with insufficient bedrock thickness faces a high risk of water-sand inrush, and a poor mine design can lead to serious water–sand inrush incidents. The height of the caving zone and caving height ratio are shown in Figure 12. There is a positive correlation between the height of the caving zone and the mining thickness, and the caving height ratio decreases with the increase of mined thickness. When the mined thickness is less than 3.5 m, the caving zone height and the caving height ratio based on numerical simulation are less than that using the empirical formula. When the coal seam mining thickness is greater than 3.5 m and less than 5.0 m, the height of the caving zone and the caving height ratio based on numerical simulation are greater than the empirical value. When the mined thickness of the coal seam is 3.0–4.0 m, the caving height ratio of the numerical simulation is stable with a value of 6. For the purpose of safety, a larger caving height ratio is used to calculate the mined thickness of coal. Therefore, when the mined thickness is less than 3.5 m, the empirical formula should be used. When the mining thickness is greater than 3.5 m and less than 5 m, numerical simulation should be used.
4.3. Adaptive Adjustment of Mined Thickness of Coal Seam
Based on the calculated height of the caving zone and caving height ratios, the mined thicknessis adjusted to minimize the risk of water–sand inrushes at the working face. The WF15107 working face is affected by the concealed outcrop area, which shows that the thickness of the bedrock at both ends is large, the middle is thin, and the thickness of the bedrock varies considerably. In this study, the working face is divided into eight parts according to the maximum allowable developed height of the caving zone and the caving height ratio. The bedrock thickness at both ends of the working face is large (1 and 7), and the maximum height allowed to develop in the caving zone is 28 m. Based on the height of the caving zone and the caving height ratio, the mined thickness of the coal seam in this area is set to 5 m, which allows complete mining of the coal seam. The maximum allowable height of the caving zone is 25 m in the thick bedrock area (2, 6, and 8). According to the changes in the caving zone height and the caving height ratio, the mined thickness of the coal seam in this area is set to 4 m. In the case with a thin layer of bedrock at the working face (3, 5), the maximum allowable height of the caving zone is 20 m, and the coal mined thickness is 3 m. In the thinnest bedrock area (4), the bedrock thickness is seriously insufficient, which creates a serious threat from water and sand inrushes at this working face. The maximum allowable height of the caving zone is 14 m. Based on the calculated height of the caving zone and the caving height ratio, the mined thickness of coal is 1.8 m in this area. In places where bedrock thickness is dangerously thin, the mining of coal is prohibited.
The adaptive adjustment chart of the mined thickness at this working face is shown in Figure 13. Mining of the working face is adjusted eight times by pulse line mode. The danger area can behighly efficiently mined, which is estimated to be about 67,200 tons of coal. At present, the water–sand inrush problem at the roof of the Pingan coal mine has been resolved by adjusting the mined thickness of coal. This has led to a safer mining environment at the Pingan coal mine. The core innovation of this technology lies in the real-time adjustment of mining thickness based on the thickness of the coal seam and bedrock. The method of adjusting the mined thickness can be applied to all complex mining conditions in coal mines.
5. Conclusions
A method has been proposed to control the upper boundary of the caving zone by adjusting the mined thickness of coal under a watery gravel layer and thin bedrock.
It is found that there is a linear positive correlation between the height of the caving zone and mined thickness. The ratio of the caving height decreases with the increase of the mined thickness, and the correlation can bedescribed by a power function.
The empirical formula should be selected when the mined thickness is less than 3.5 m. The numerical simulation should be selected when the mined thickness is greater than 3.5 m but less than 5 m. The mined thickness of coal can be adjusted to minimize the risk of water and sand inrushes into the mine.
The adaptive adjustment diagram of the mined thickness has been developed. The application has been successfully used at the WF15107 work face in the Pingan mine.
Author Contributions
Methodology, Q.L.; Software, Y.L.; Data curation, T.L.; Writing—review & editing, J.W. All authors have read and agreed to the published version of the manuscript.
Funding
This work was financially supported by the Science Foundation for Youths of Shanxi Province (20210302124108), the Science Foundation for Youths of Shanxi Province (20210302124438), Joint Funds of the National Natural Science Foundation of China and Shanxi Province (U1710258).
Data Availability Statement
This article contains no data or material other than the articles used for the review and referenced.
Conflicts of Interest
The authors declare that they have no conflict of interest.
References
- Tang, A.P.; Dong, Y.; Tan, Z. Mechanism of sandy-silt seepage deformation in mine under vibration. Earthq. Eng. Eng. Vib. 1999, 19, 132–135. [Google Scholar]
- Chen, B.; Zhang, S.; Li, Y.; Li, J. Experimental study on water and sand inrush of mining cracks in loose layers with different clay contents. Bull. Eng. Geol. Environ. 2021, 80, 663–678. [Google Scholar] [CrossRef]
- Zhang, G.B.; Zhang, W.Q.; Wang, H.; Cao, S. Research on Arch Model and Numerical Simulation of Critical Water and Sand Inrush in Coal Mine near Unconsolidated Layers. Geofluids 2020, 8, 6644849. [Google Scholar] [CrossRef]
- Xu, Y.C.; Liu, S.Q. Study on method to set safety coal and rock pillar for top coal caving mining under water body. Coal Sci. Technol. 2011, 36, 6699726. [Google Scholar]
- Ma, D.; Duan, H.; Zhang, J.; Liu, X.; Li, Z. Numerical simulation of water–silt inrush hazard of fault rock: A three-phase flow model. Rock Mech. Rock Eng. 2022, 55, 5163–5182. [Google Scholar] [CrossRef]
- Ma, D.; Duan, H.Y.; Zhang, J.X. Solid grain migration on hydraulic properties of fault rocks in underground mining tunnel: Radial seepage experiments and verification of permeability prediction. Tunn. Undergr. Space Technol. 2022, 126, 104525. [Google Scholar] [CrossRef]
- Wang, R.; Meng, Z.P.; Xie, X.T. Waterproof coal pillar reasonable design and numerical simulation under extremely thick unconsolidated strata. Coal Geol. Explor. 2011, 39, 31–35. [Google Scholar]
- Liu, W.T.; Pang, L.F.; Xu, B.; Sun, X. Study on overburden failure characteristics in deep thick loose seam and thick coal seam mining. Geomat. Nat. Hazards Risk 2020, 11, 632–653. [Google Scholar] [CrossRef]
- Wu, L.Y.; Wang, Z.F.; Ma, D.; Zhang, J.; Wu, G.; Wen, S.; Zha, M.; Wu, L. A Continuous Damage Statistical Constitutive Model for Sandstone and Mudstone Based on Triaxial Compression Tests. Rock Mech. Rock Eng. 2022, 55, 4963–4978. [Google Scholar] [CrossRef]
- Wang, G.; Wu, M.; Wang, R.; Xu, H.; Song, X. Height of the mining-induced fractured zone above a coal face. Eng. Geol. 2017, 216, 140–152. [Google Scholar] [CrossRef]
- Liu, Y.; Yuan, S.; Yang, B.; Liu, J.; Ye, Z. Predicting the height of the water-conducting fractured zone using multiple regression analysis and GIS. Environ. Earth Sci. 2019, 78, 422. [Google Scholar] [CrossRef]
- Lei, S.; Feng, X.; Shidong, W. Water-sand mixture inrush through weakly cemented overburden at a shallow depth in the Yili coal mining area. Arab. J. Geosci. 2021, 14, 1103. [Google Scholar] [CrossRef]
- Wu, L.Y.; Ma, D.; Wang, Z.F.; Zhang, J.; Zhang, B.; Li, J.; Liao, J.; Tong, J. A Deep CNN-Based Constitutive Model for Describing of Statics Characteristics of Rock Materials. Eng. Fract. Mech. 2023, 279, 109054. [Google Scholar] [CrossRef]
- Wu, L.Y.; Ma, D.; Wang, Z.F.; Zhang, J.W. Prediction and prevention of mining-induced water inrush from rock strata separation space by 3D similarity simulation testing: A case study of Yuan Zigou coal mine, China. Geomech. Geophys. Geo Energy Geo Resour. 2022, 8, 202. [Google Scholar] [CrossRef]
- Xu, Y.C.; Li, J.C.; Liu, S.Q.; Zhou, L. Calculation formula of "Two-zone" height of overlying strata and its adapt ability analysis. Coal Min. Technol. 2011, 16, 4–7. [Google Scholar]
- Chen, J.; Pu, H.; Liu, J.; Zhang, J. Experimental Study on Water-Sand Seepage Characteristics in Fractured Rock Mass under Rheological Effect. Geofluids 2021, 6, 5593448. [Google Scholar] [CrossRef]
- Wang, X.L.; Qin, Q.R.; Fan, C. Failure Characteristic and Fracture Evolution Law of Overburden of Thick Coal in Fully Mechanized Sub-level Caving Mining. Sains Malays. 2017, 46, 2041–2048. [Google Scholar] [CrossRef]
- Wu, Y.; Huang, Z.; Li, X.Z.; Jiang, C.L. Deformation and Failure Characteristics of Overburden Under Thin Bedrock and Thick Alluvium: A Case Study in Baodian Coal Mine. Geotech. Geol. Eng. 2020, 38, 5213–5228. [Google Scholar] [CrossRef]
- Xu, J.C.; Pu, H.; Chan, J.; Sha, Z. Experimental Study on Sand Inrush Hazard of Water-Sand Two-Phase Flow in Broken Rock Mass. Geofluids 2021, 3, 5542440. [Google Scholar] [CrossRef]
Figure 1.
Location of Pingan underground coal mine.

Figure 2.
WF15107 and the oxidized zone.

Figure 3.
Cenozoic stratigraphic column of the auxiliary shaft.

Figure 4.
Contour map of bedrock thickness.

Figure 5.
Protective layer thickness, caving zone height, and caving height ratio versus mining thickness.
Figure 5.
Protective layer thickness, caving zone height, and caving height ratio versus mining thickness.

Figure 6.
Schematic diagram of different bedrock thickness zones.

Figure 7.
Two dimensional UDEC model of regions 1, 2, and 3. (a) Thickbedrock region. (b) Thin bedrock region. (c) Insufficient bedrock region.
Figure 7.
Two dimensional UDEC model of regions 1, 2, and 3. (a) Thickbedrock region. (b) Thin bedrock region. (c) Insufficient bedrock region.

Figure 8.
Collapsed shape of thick bedrock.

Figure 9.
Simulation results of the collapse pattern of thin bedrock under different mining thicknesses.
Figure 9.
Simulation results of the collapse pattern of thin bedrock under different mining thicknesses.

Figure 10.
Simulation results of collapsed mine with insufficient bedrock.

Figure 11.
Nephogram ofstress and displacement in the y direction.

Figure 12.
Curves of height and caving height ratio of the caving zone.

Figure 13.
Schematic of mined thicknesses of coal at the working face. Not upper limit—upper boundary in diagram.
Figure 13.
Schematic of mined thicknesses of coal at the working face. Not upper limit—upper boundary in diagram.


Table 1.
Water–sand inrush accidents in China in recent 10 years.
| Date | Site | Cause |
|---|---|---|
| 14 August 2021 | Chaidar Coal Mine in Qinghai Province | Water–sand inrush due to roof collapse |
| 15 July 2021 | Hao Jialiang Coal Mine in Shaanxi Province | Water accumulation in ground subsidence area brings sediment to two flow channels of working face |
| 24 April 2019 | Zhao Gu Coal Mine in Henan Province | Damaged roof continues to cave to form a gob |
| 2 November 2018 | Yun Zhou Coal Mine in Shandong Province | Sand burst in return-air well |
| 25 April 2016 | Zhao Jin Coal Mine in Shannxi Province | Caving of coal wall caused by cutting of top of working face |
| 19 October 2014 | Yu Chang Coal Mine in Shanxi Province | Yellow mud formed by deposition of loess inrushes into the working face |
Table 2.
Numerical model parameters.
| Name | Density /kg·m−3 | Tensile Strength/MPa | Adhesion/MPa | Internal Friction Angle/° | Bulk Modulus/GPa | Shear Modulus/Gpa | Normal Stiffness/Gpa | Shear Stiffness/Gpa |
|---|---|---|---|---|---|---|---|---|
| Mudstone | 2420 | 0.80 | 1.50 | 40 | 2.50 | 1.72 | 0.04 | 0.04 |
| Siltstone | 2580 | 3.50 | 3.50 | 37 | 4.50 | 2.80 | 0.40 | 0.40 |
| Sandy mudstone | 2600 | 0.80 | 0.53 | 32 | 3.50 | 1.80 | 0.50 | 0.50 |
| Coal | 1400 | 0.03 | 1.20 | 20 | 2.08 | 0.54 | 0.10 | 0.10 |
| Fine sandstone | 2200 | 1.34 | 1.21 | 38.4 | 7.35 | 6.63 | 0.02 | 0.02 |
| Yellow soil layer | 1600 | 0.12 | 0.92 | 18 | 3.71 | 1.51 | 0.10 | 0.01 |
| Red soil layer | 1600 | 0.12 | 0.92 | 40 | 3.71 | 1.51 | 0.09 | 0.09 |
Disclaimer/Publisher’s Note: The statements, opinions and data contained in all publications are solely those of the individual author(s) and contributor(s) and not of MDPI and/or the editor(s). MDPI and/or the editor(s) disclaim responsibility for any injury to people or property resulting from any ideas, methods, instructions or products referred to in the content. |
© 2023 by the authors. Licensee MDPI, Basel, Switzerland. This article is an open access article distributed under the terms and conditions of the Creative Commons Attribution (CC BY) license (https://creativecommons.org/licenses/by/4.0/).
Share and Cite
MDPI and ACS Style
Liu, Q.; Lian, Y.; Wang, J.; Li, T. Study on Prevention and Control Measures of Water–Sand Inrushes Based on Adaptive Adjustment of Mined Thickness. Water 2023, 15, 1497. https://doi.org/10.3390/w15081497
AMA Style
Liu Q, Lian Y, Wang J, Li T. Study on Prevention and Control Measures of Water–Sand Inrushes Based on Adaptive Adjustment of Mined Thickness. Water. 2023; 15(8):1497. https://doi.org/10.3390/w15081497
Chicago/Turabian StyleLiu, Qin, Ye Lian, Jun Wang, and Tao Li. 2023. "Study on Prevention and Control Measures of Water–Sand Inrushes Based on Adaptive Adjustment of Mined Thickness" Water 15, no. 8: 1497. https://doi.org/10.3390/w15081497
Note that from the first issue of 2016, this journal uses article numbers instead of page numbers. See further details here.