


Investigating the Potential of Cosmic-Ray Neutron Sensing for Estimating Soil Water Content in Farmland and Mountainous Areas
 , and
, and
Abstract
:1. Introduction
2. Experimental Site and Instrumentation
2.1. Cosmic-Ray Neutron Sensing Probe and Meteorological Equipment
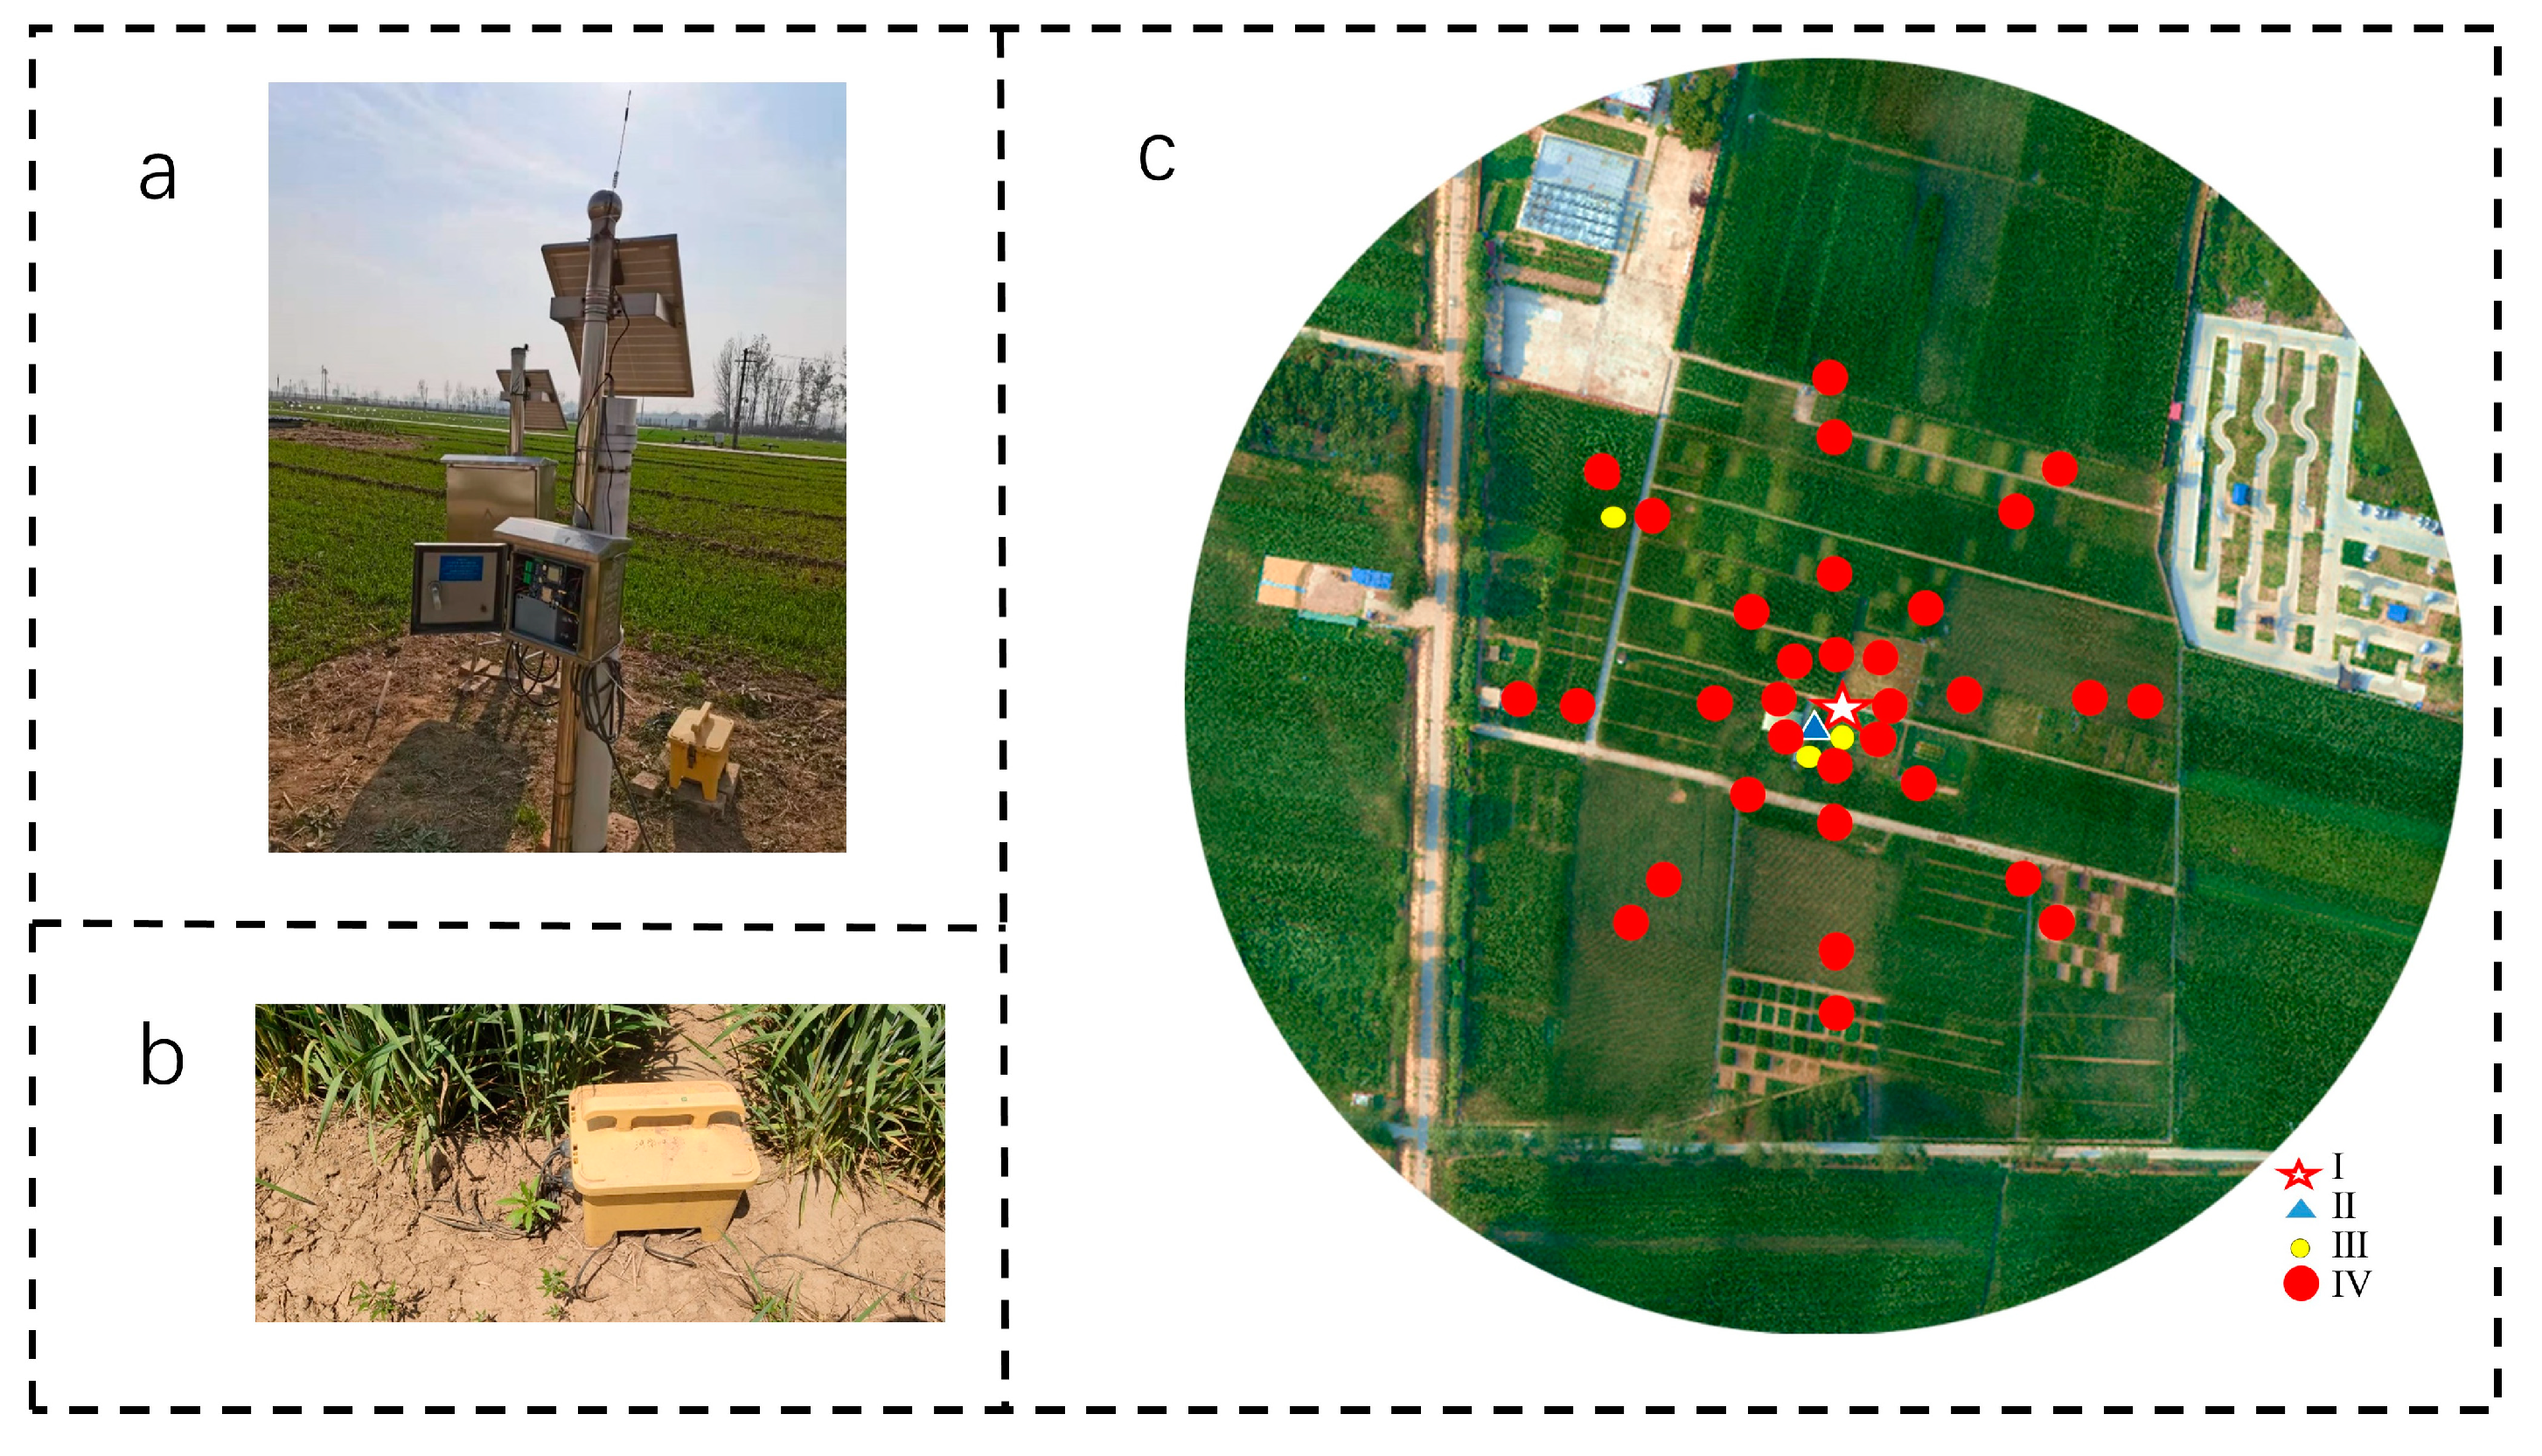
2.2. Study Site 1
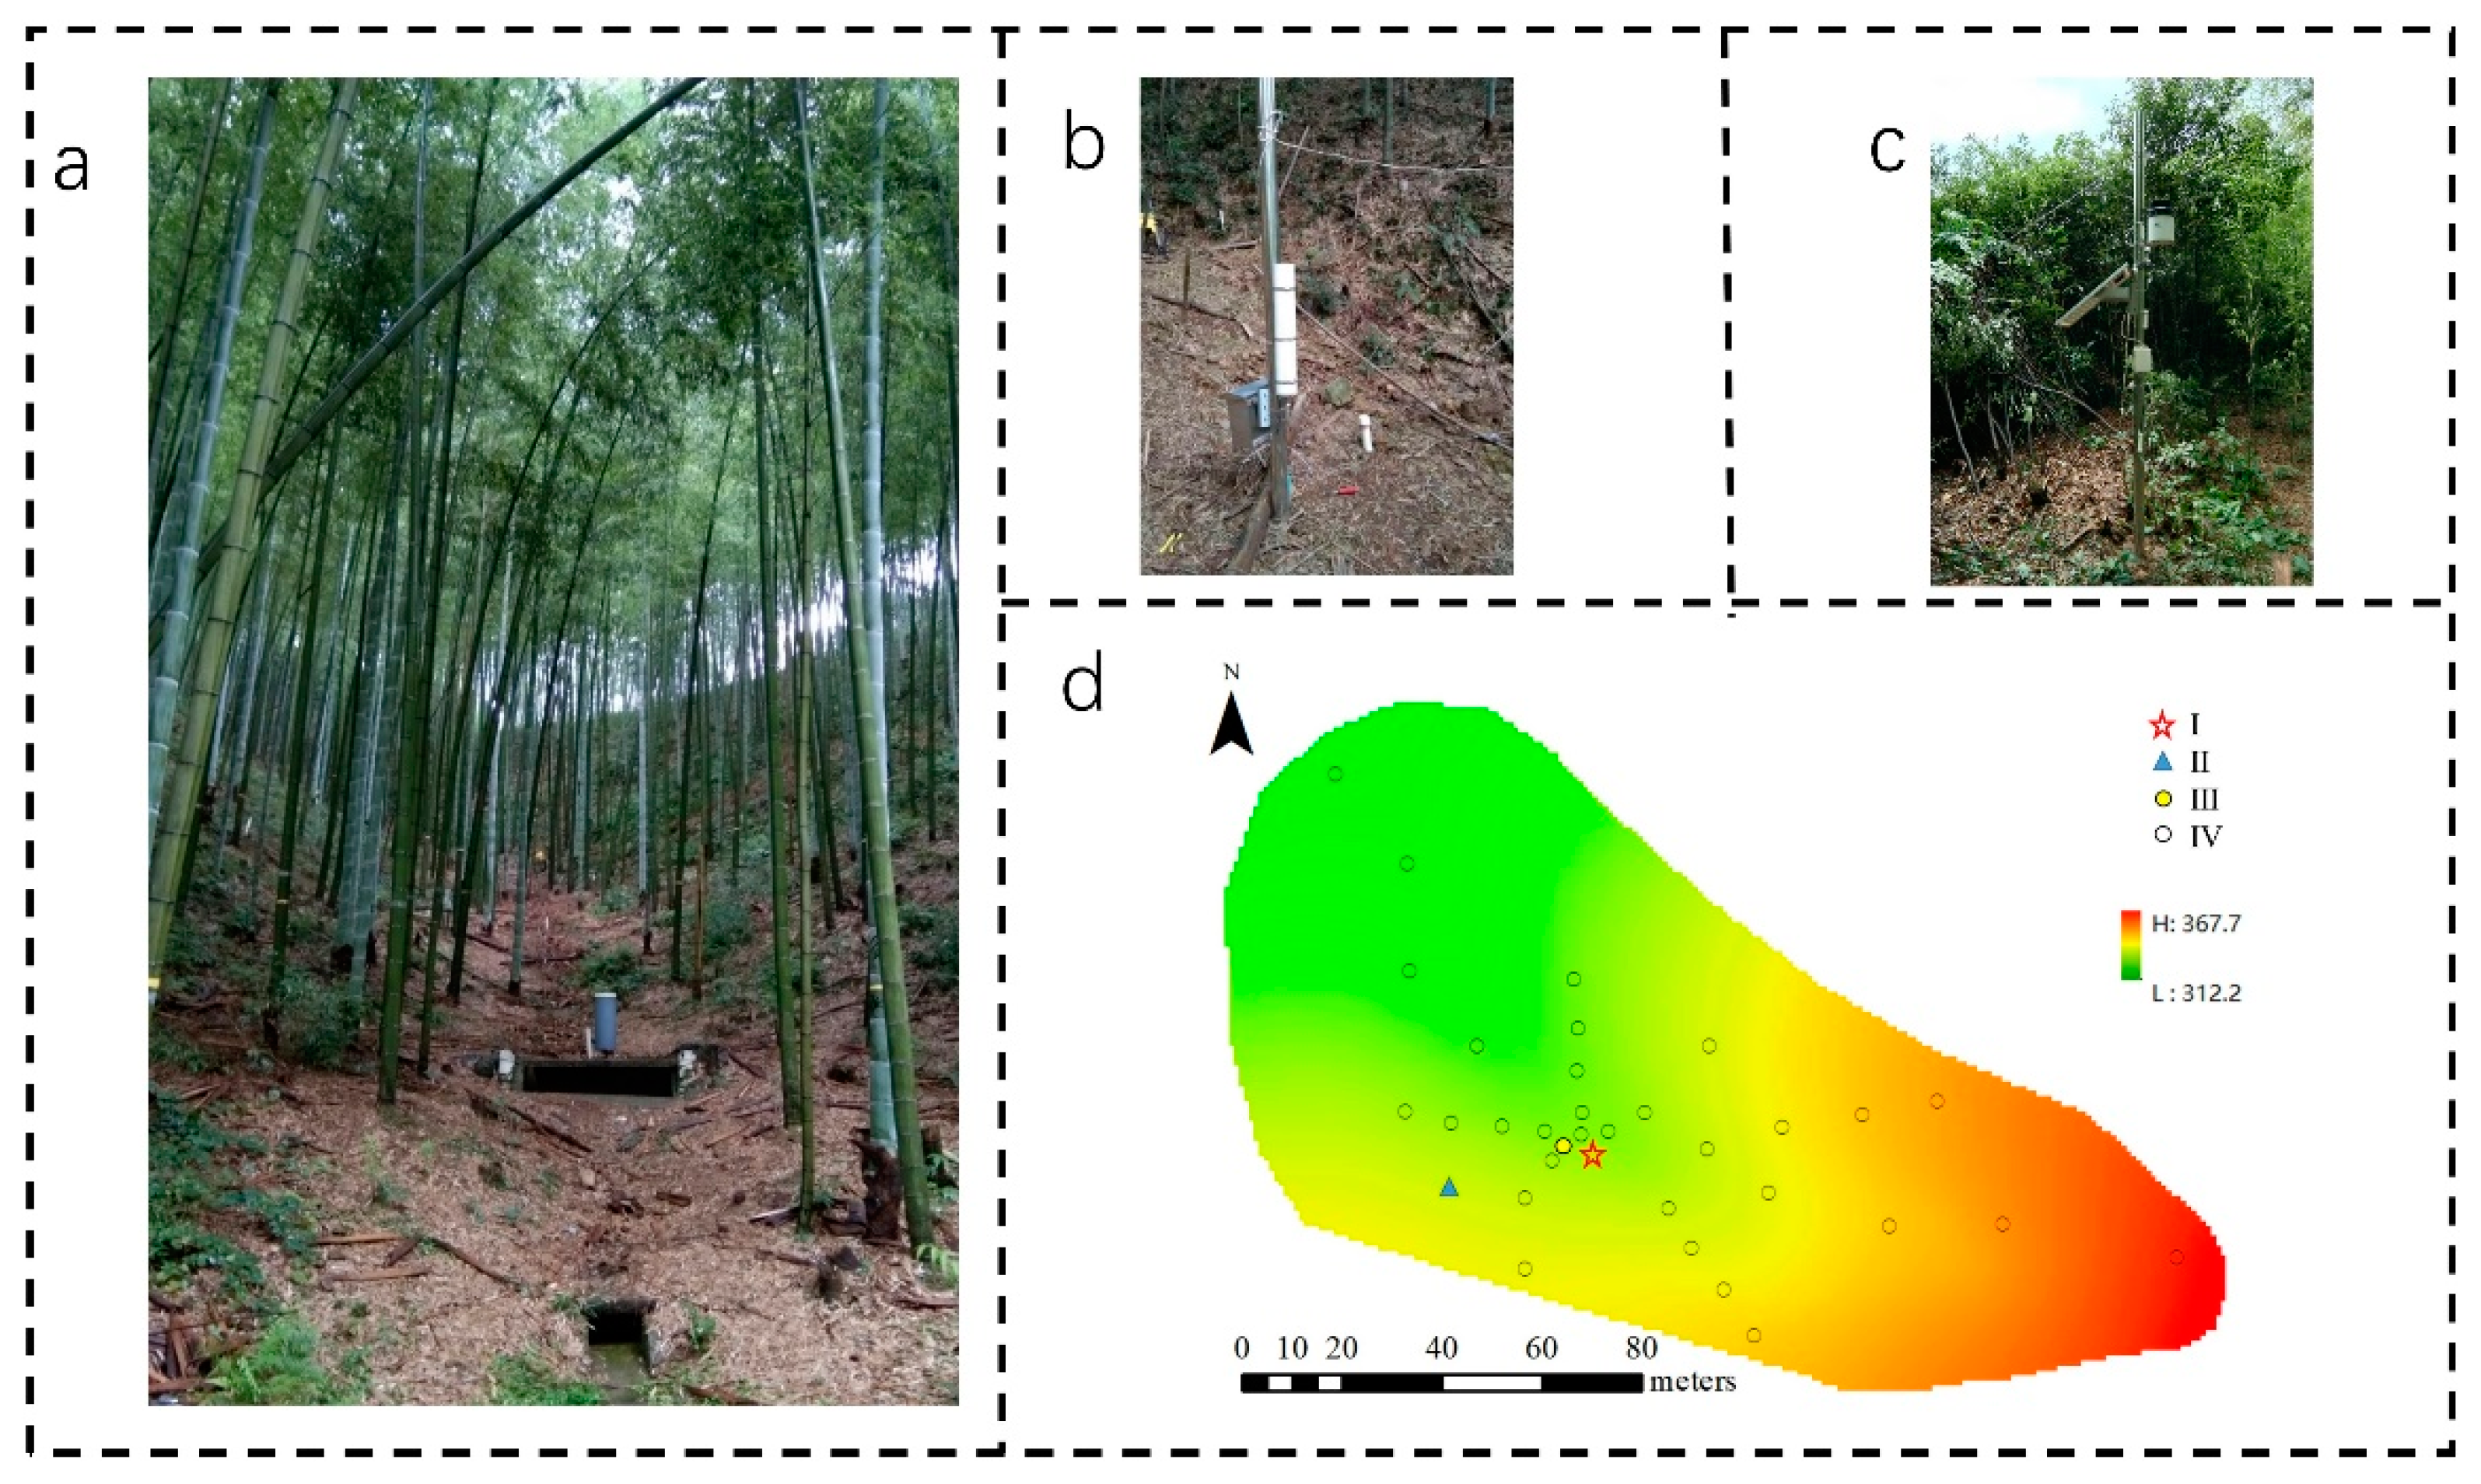
2.3. Study Site 2
3. Methodology
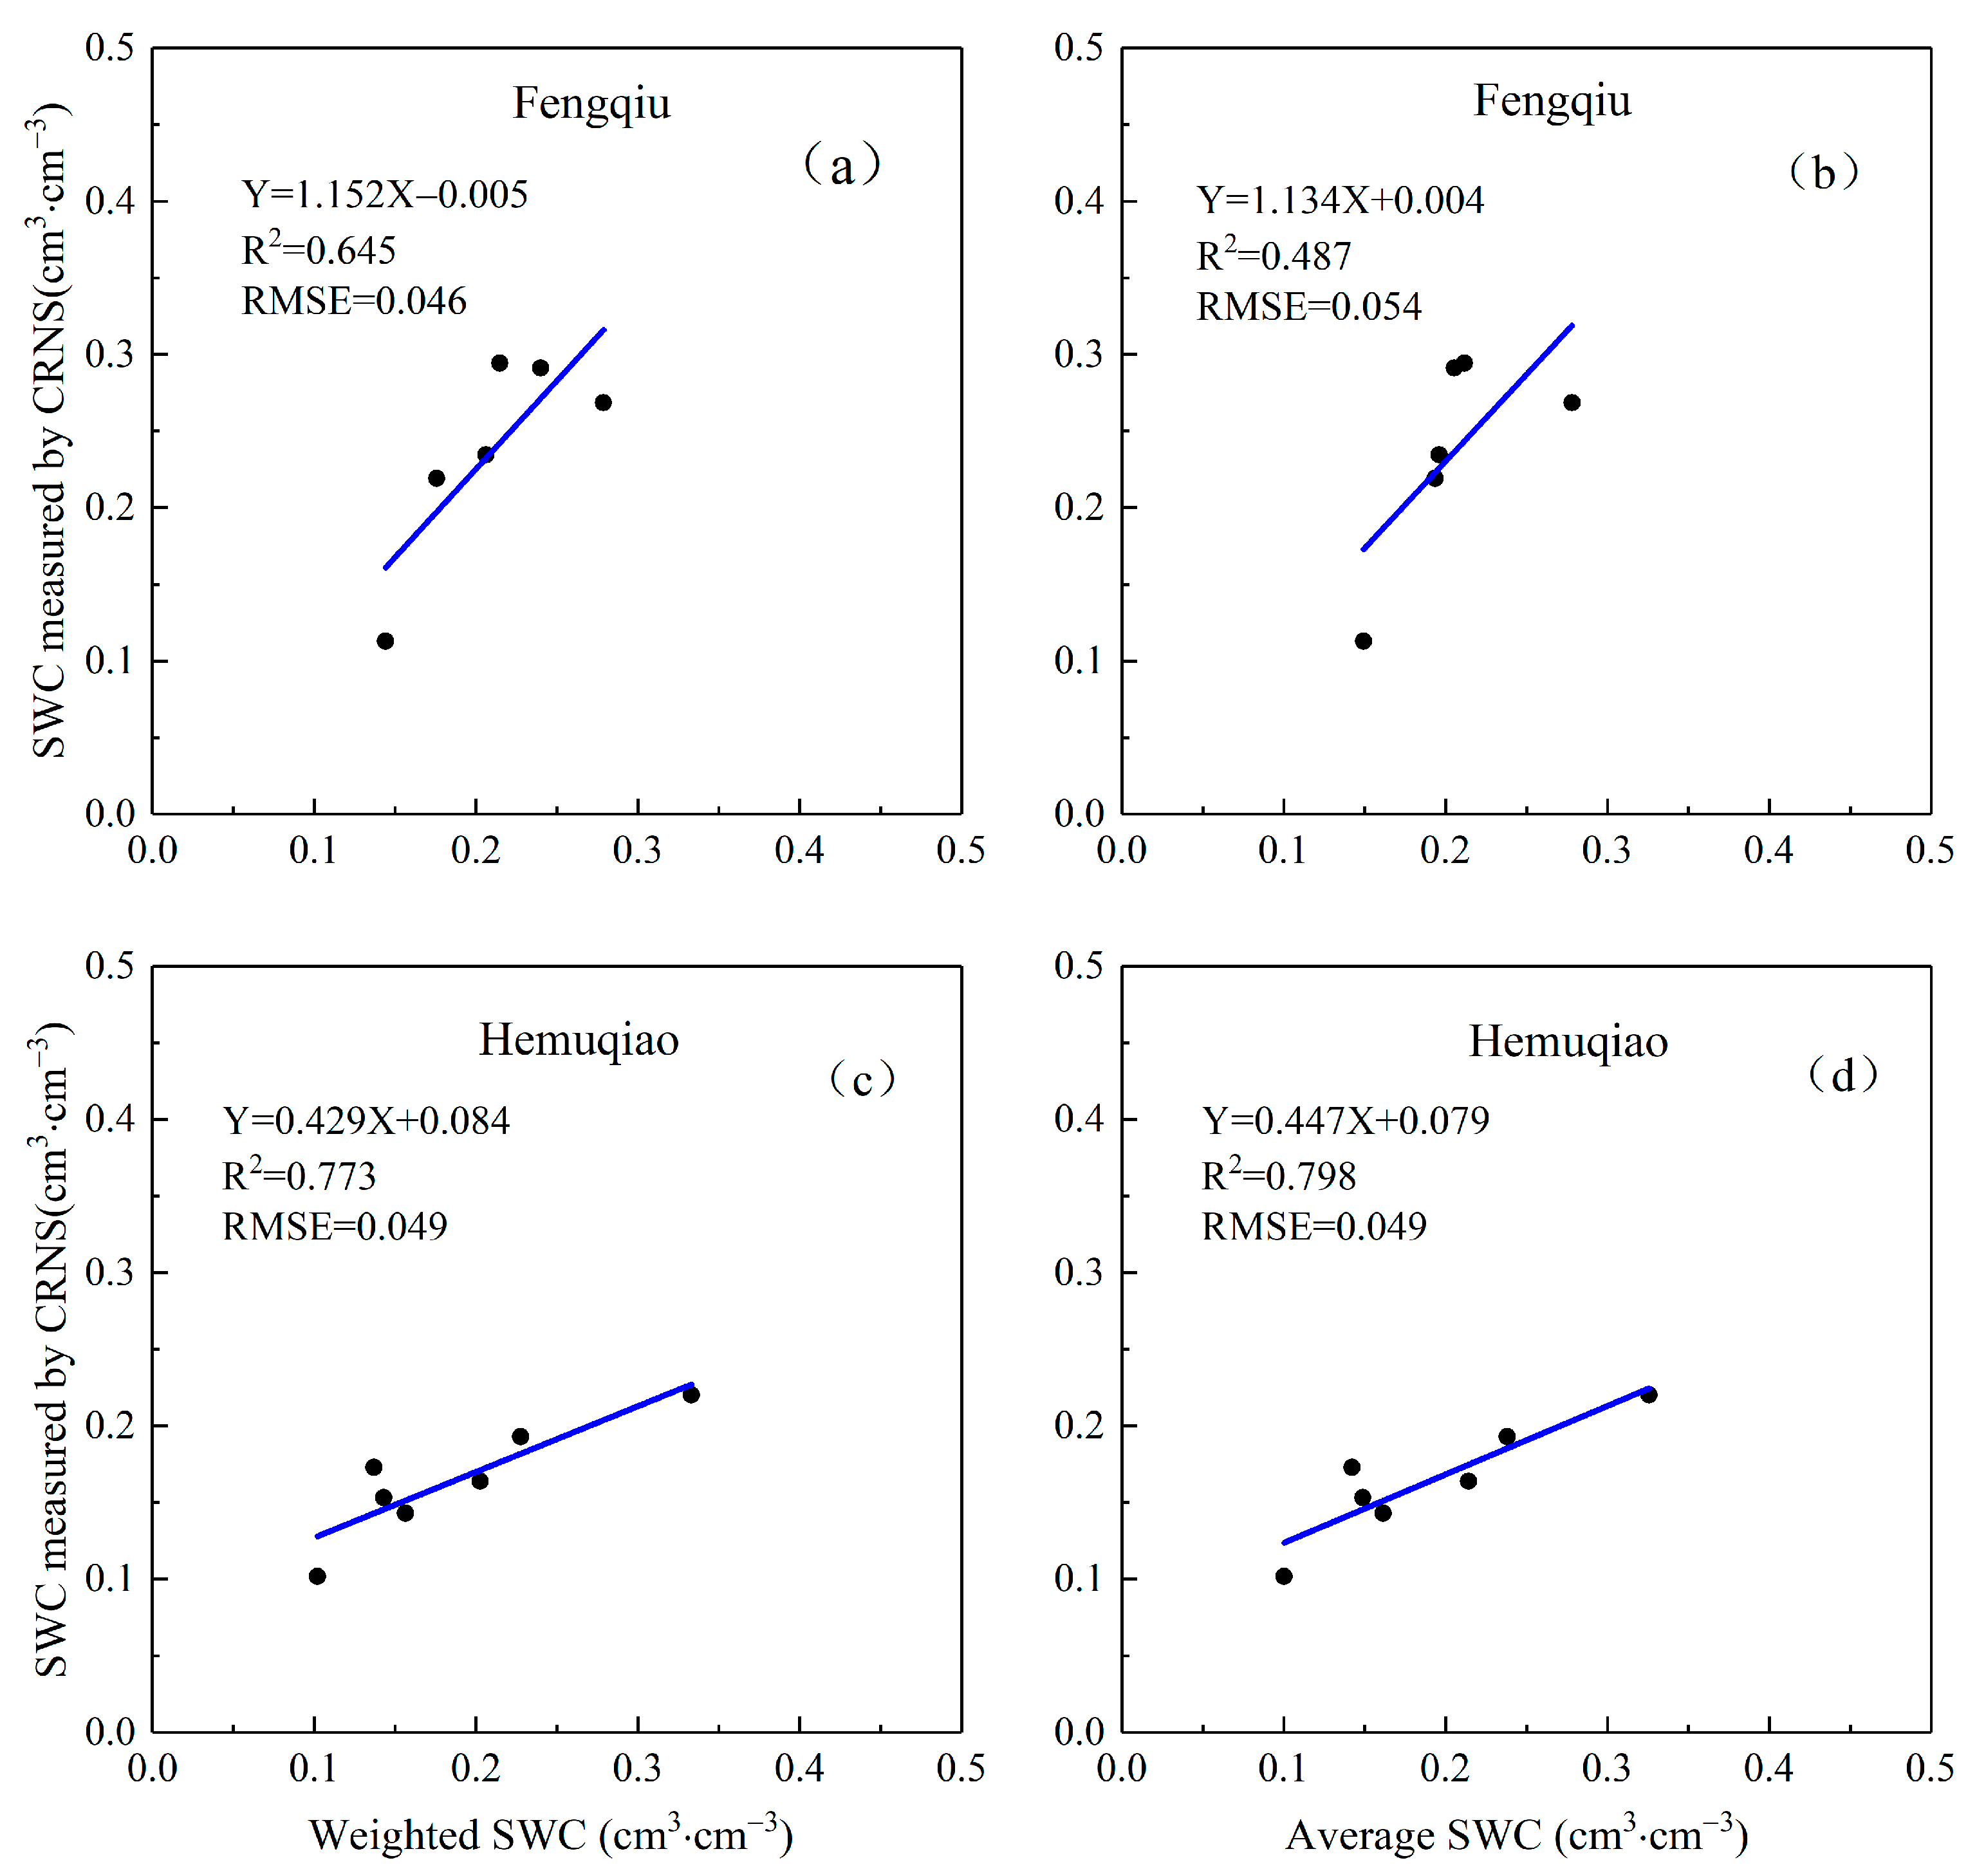
3.1. Calibration
3.2. Estimation of SWC
3.3. Horizontal Weight
3.4. Vertical Weight
3.5. Estimation of Measurement Accuracy
4. Results and Discussion
4.1. Footprint Estimation at Different Study Sites
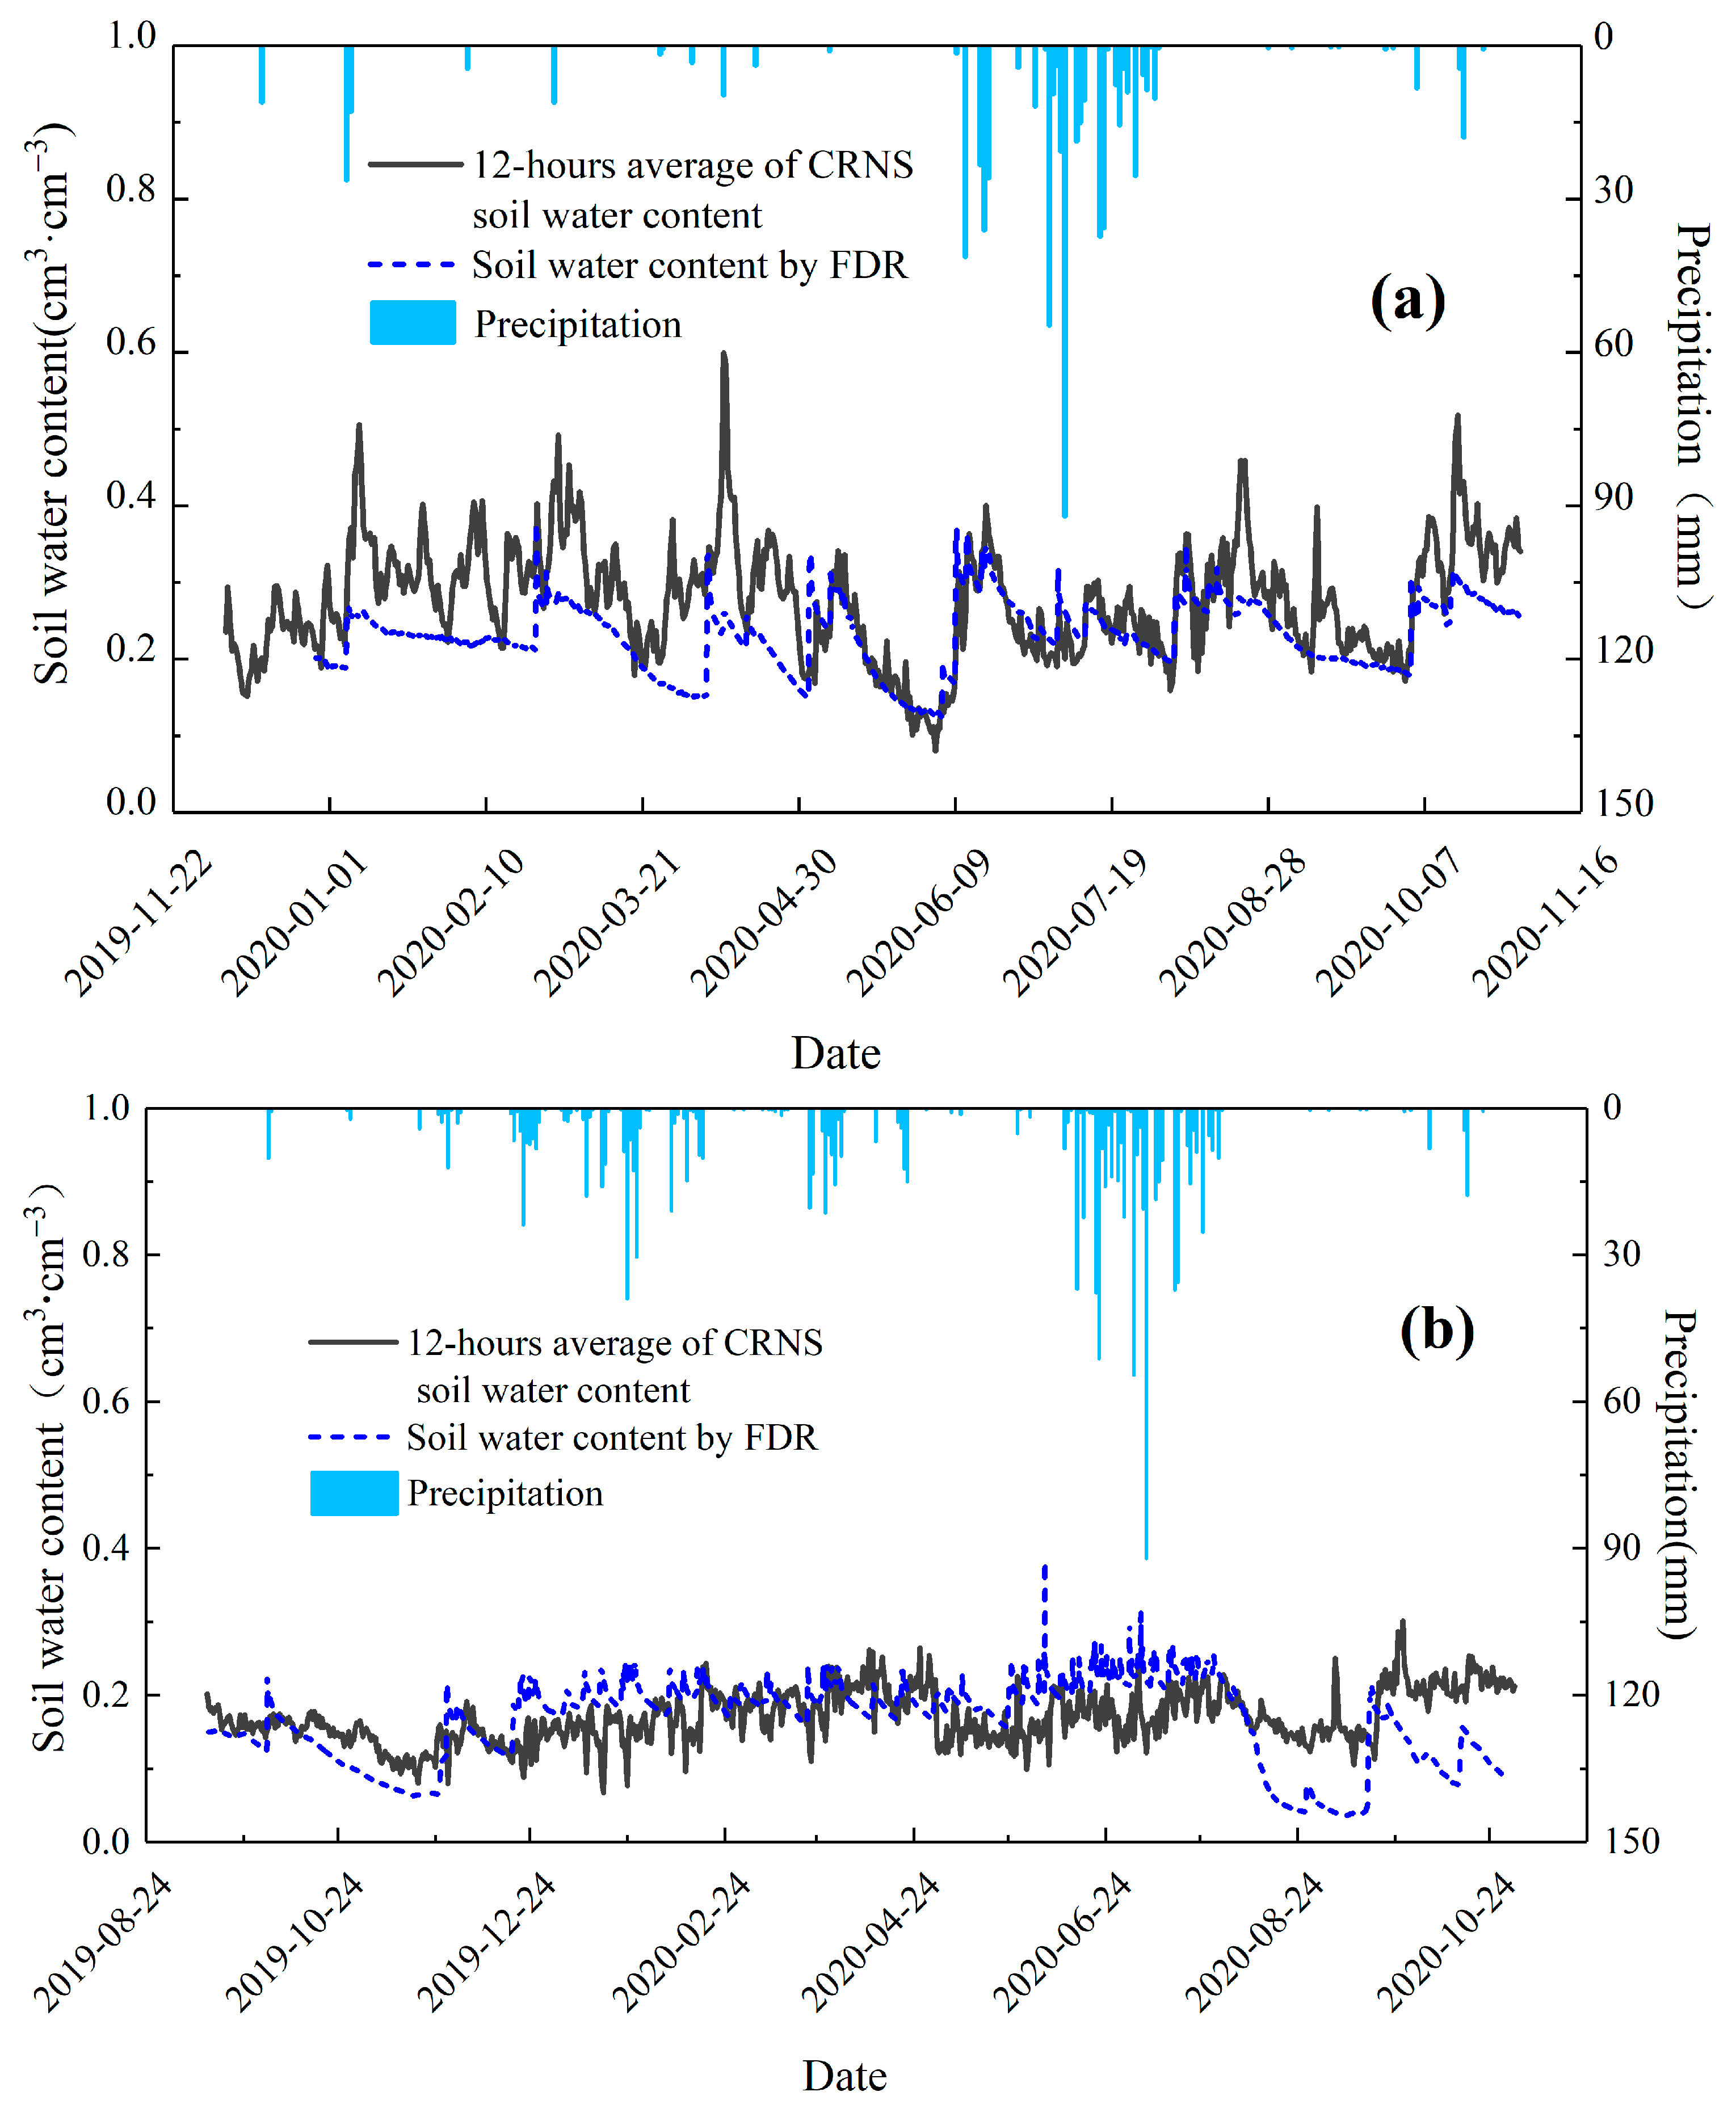
4.2. SWC Variation and Seasonal Characteristics at Different STUDY Sites
4.3. Spatial Characteristics of SWC at Different Study Sites
5. Conclusions
Author Contributions
Funding
Data Availability Statement
Acknowledgments
Conflicts of Interest
Appendix A. Detection Radius (m) of Simulations at Different SWCs (cm3·cm−3) and air Humidities (g·cm−2)

| SWC | 0.10 | 0.15 | 0.20 | 0.25 | 0.30 | 0.35 | 0.40 | 0.45 |
| Radius with the air humidity of 10 | 187 | 178 | 172 | 166 | 161 | 157 | 153 | 150 |
| Air humidity | 5 | 10 | 15 | 20 | 25 | 30 | 33 | |
| Radius with SWC of 0.15 | 184 | 178 | 173 | 168 | 164 | 160 | 158 |
Appendix B. Detection Depth (cm) of Simulations at Different SWCs (cm3·cm−3) and air Humidities (g·cm−2)
| SWC | 0.10 | 0.15 | 0.20 | 0.25 | 0.30 | 0.35 | 0.40 | 0.45 |
| Depth with the air humidity of 10 | 35.3 | 29.2 | 24.8 | 21.6 | 19.1 | 16.9 | 15.2 | 13.7 |
| Air humidity | 5 | 10 | 15 | 20 | 25 | 30 | 33 | |
| Depth with SWC of 0.15 | 29.1 | 29.2 | 29.2 | 29.2 | 29.3 | 29.4 | 29.4 |
References
- Friel, R.; Or, D. Frequency analysis of time-domain reflectometry (TDR) with application to dielectric spectroscopy of soil constituents. Geophysics 1999, 64, 707–718. [Google Scholar] [CrossRef]
- Huisman, J.A.; Bouten, W.; Vrugt, J.A.; Ferre, P.A. Accuracy of frequency domain analysis scenarios for the determination of complex dielectric permittivity. Water Resour. Res. 2004, 40, W02401. [Google Scholar] [CrossRef] [Green Version]
- Vreugdenhil, M.; Dorigo, W.; Broer, M.; Haas, P.; Eder, A.; Hogan, P.; Bloeschl, G.; Wagner, W. Towards a High-Density Soil Moisture Network for the Validation of Smap in Petzenkirchen, Austria. In Proceedings of the 2013 IEEE International Geoscience and Remote Sensing Symposium (Igarss), Melbourne, Australia, 21–26 July 2013; pp. 1865–1868. [Google Scholar]
- Yang, Z.W.; Crow, W.; Hu, L.; Di, L.P.; Mueller, R. Smap Data for Cropland Soil Moisture Assessment—A Case Study. In Proceedings of the 2017 Ieee International Geoscience and Remote Sensing Symposium (Igarss), Fort Worth, TX, USA, 23–28 July 2017; pp. 1996–1999. [Google Scholar]
- Li, D.; Schrön, M.; Köhli, M.; Bogena, H.; Weimar, J.; Jiménez Bello, M.A.; Han, X.; Martínez Gimeno, M.A.; Zacharias, S.; Vereecken, H.; et al. Can Drip Irrigation be Scheduled with Cosmic-Ray Neutron Sensing? Vadose Zone J. 2019, 18, 190053. [Google Scholar] [CrossRef]
- Mujumdar, M.; Goswami, M.M.; Morrison, R.; Evans, J.G.; Ganeshi, N.; Sabade, S.S.; Krishnan, R.; Patil, S.N. A study of field-scale soil moisture variability using the COsmic-ray Soil Moisture Observing System (COSMOS) at IITM Pune site. J. Hydrol. 2021, 597, 126102. [Google Scholar] [CrossRef]
- Zreda, M.; Desilets, D.; Ferré, T.P.A.; Scott, R.L. Measuring soil moisture content non-invasively at intermediate spatial scale using cosmic-ray neutrons. Geophys. Res. Lett. 2008, 35, L21402. [Google Scholar] [CrossRef] [Green Version]
- Hendrick, L.D.; Edge, R.D. Cosmic-Ray Neutrons near Earth. Phys Rev. 1966, 145, 1023–1025. [Google Scholar] [CrossRef]
- Kodama, M.; Kudo, S.; Kosuge, T. Application of Atmospheric Neutrons to Soil-Moisture Measurement. Soil Sci. 1985, 140, 237–242. [Google Scholar] [CrossRef]
- Sato, T.; Niita, K. Analytical functions to predict cosmic-ray neutron spectra in the atmosphere. Radiat Res. 2006, 166, 544–555. [Google Scholar] [CrossRef]
- Desilets, D.; Zreda, M.; Ferré, T.P.A. Nature’s neutron probe: Land surface hydrology at an elusive scale with cosmic rays. Water Resour. Res. 2010, 46, W11505. [Google Scholar] [CrossRef]
- Köhli, M.; Schrön, M.; Zreda, M.; Schmidt, U.; Dietrich, P.; Zacharias, S. Footprint characteristics revised for field-scale soil moisture monitoring with cosmic-ray neutrons. Water Resour. Res. 2015, 51, 5772–5790. [Google Scholar] [CrossRef] [Green Version]
- Schrön, M.; Kohli, M.; Scheiffele, L.; Iwema, J.; Bogena, H.R.; Lv, L.; Martini, E.; Baroni, G.; Rosolem, R.; Weimar, J.; et al. Improving calibration and validation of cosmic-ray neutron sensors in the light of spatial sensitivity. Hydrol. Earth Syst. Sci. 2017, 21, 5009–5030. [Google Scholar] [CrossRef] [Green Version]
- Schrön, M.; Rosolem, R.; Köhli, M.; Piussi, L.; Schröter, I.; Iwema, J.; Kögler, S.; Oswald, S.E.; Wollschläger, U.; Samaniego, L.; et al. Cosmic-ray Neutron Rover Surveys of Field Soil Moisture and the Influence of Roads. Water Resour. Res. 2018, 54, 6441–6459. [Google Scholar] [CrossRef]
- Badiee, A.; Wallbank, J.R.; Fentanes, J.P.; Trill, E.; Scarlet, P.; Zhu, Y.C.; Cielniak, G.; Cooper, H.; Blake, J.R.; Evans, J.G.; et al. Using Additional Moderator to Control the Footprint of a COSMOS Rover for Soil Moisture Measurement. Water Resour. Res. 2021, 57, e2020WR028478. [Google Scholar] [CrossRef]
- Baroni, G.; Oswald, S.E. A scaling approach for the assessment of biomass changes and rainfall interception using cosmic-ray neutron sensing. J. Hydrol. 2015, 525, 264–276. [Google Scholar] [CrossRef]
- Li, X.; Xu, X.; Li, X.; Xu, C.; Wang, K. Field scale soil water prediction based on areal soil moisture measurements using cosmic-ray neutron sensing in a karst landscape. J. Hydrol. 2022, 605, 127395. [Google Scholar] [CrossRef]
- Tan, X.; Zhang, L.; He, C.; Zhu, Y.; Han, Z.; Li, X. Applicability of cosmic-ray neutron sensor for measuring soil moisture at the agricultural-pastoral ecotone in northwest China. Sci. China Earth Sci. 2020, 63, 1730–1744. [Google Scholar] [CrossRef]
- Bogena, H.R.; Huisman, J.A.; Baatz, R.; Franssen, H.J.H.; Vereecken, H. Accuracy of the cosmic-ray soil water content probe in humid forest ecosystems: The worst case scenario. Water Resour. Res. 2013, 49, 5778–5791. [Google Scholar] [CrossRef] [Green Version]
- Heidbüchel, I.; Güntner, A.; Blume, T. Use of cosmic-ray neutron sensors for soil moisture monitoring in forests. Hydrol. Earth Syst. Sci. 2016, 20, 1269–1288. [Google Scholar] [CrossRef] [Green Version]
- Peterson, A.M.; Helgason, W.D.; Ireson, A.M. Estimating field-scale root zone soil moisture using the cosmic-ray neutron probe. Hydrol. Earth Syst. Sci. 2016, 20, 1373–1385. [Google Scholar] [CrossRef] [Green Version]
- Tian, Z.C.; Li, Z.Z.; Liu, G.; Li, B.G.; Ren, T.S. Soil water content determination with cosmic-ray neutron sensor: Correcting aboveground hydrogen effects with thermal/fast neutron ratio. J. Hydrol. 2016, 540, 923–933. [Google Scholar] [CrossRef]
- Mwangi, S.; Zeng, Y.; Montzka, C.; Yu, L.; Su, Z. Assimilation of Cosmic-ray Neutron Counts for the Estimation of Soil Ice Content on the Eastern Tibetan Plateau. J. Geophys. Res. Atmos. 2020, 125, e2019JD031529. [Google Scholar] [CrossRef] [Green Version]
- Franz, T.E.; Zreda, M.; Ferre, T.P.A.; Rosolem, R.; Zweck, C.; Stillman, S.; Zeng, X.; Shuttleworth, W.J. Measurement depth of the cosmic ray soil moisture probe affected by hydrogen from various sources. Water Resour. Res. 2012, 48, W08515. [Google Scholar] [CrossRef] [Green Version]
- Zreda, M.; Shuttleworth, W.J.; Zeng, X.; Zweck, C.; Desilets, D.; Franz, T.; Rosolem, R. COSMOS: The COsmic-ray Soil Moisture Observing System. Hydrol. Earth Syst. Sci. 2012, 16, 4079–4099. [Google Scholar] [CrossRef] [Green Version]
- Rosolem, R.; Shuttleworth, W.J.; Zreda, M.; Franz, T.E.; Zeng, X.; Kurc, S.A. The Effect of Atmospheric Water Vapor on Neutron Count in the Cosmic-Ray Soil Moisture Observing System. J. Hydrometeorol. 2013, 14, 1659–1671. [Google Scholar] [CrossRef] [Green Version]
- Iwema, J.; Schrön, M.; Koltermann Da Silva, J.; Schweiser De Paiva Lopes, R.; Rosolem, R. Accuracy and precision of the cosmic-ray neutron sensor for soil moisture estimation at humid environments. Hydrol. Process. 2013, 35, e14419. [Google Scholar] [CrossRef]
- Liu, J.; Han, X.; Chen, X.; He, R.; Wu, P. Prediction of soil thicknesses in a headwater hillslope with constrained sampling data. Catena 2019, 177, 101–113. [Google Scholar] [CrossRef]
- Dimitrova-Petrova, K.; Geris, J.; Wilkinson, M.E.; Rosolem, R.; Verrot, L.; Lilly, A.; Soulsby, C. Opportunities and challenges in using catchment-scale storage estimates from cosmic ray neutron sensors for rainfall-runoff modelling. J. Hydrol. 2020, 586, 124878. [Google Scholar] [CrossRef]
- Desilets, D.; Zreda, M. Spatial and temporal distribution of secondary cosmic-ray nucleon intensities and applications to in situ cosmogenic dating. Earth Planet. Sci. Lett. 2003, 206, 21–42. [Google Scholar] [CrossRef]
- Shuttleworth, J.; Rosolem, R.; Zreda, M.; Franz, T.E. The COsmic-ray Soil Moisture Interaction Code (COSMIC) for use in data assimilation. Hydrol. Earth Syst. Sci. 2013, 17, 3205–3217. [Google Scholar] [CrossRef] [Green Version]
- Kohli, M.; Schron, M.; Schmidt, U. Response functions for detectors in cosmic ray neutron sensing. Nucl. Instrum. Meth. A 2018, 902, 184–189. [Google Scholar] [CrossRef] [Green Version]
- Rivera Villarreyes, C.A.; Baroni, G.; Oswald, S.E. Integral quantification of seasonal soil moisture changes in farmland by cosmic-ray neutrons. Hydrol. Earth Syst. Sci. 2011, 15, 3843–3859. [Google Scholar] [CrossRef] [Green Version]
- Zreda, M.; Shuttleworth, W.J.; Zweck, C.; Zeng, X.; Ferre, T. The Cosmic-ray Soil Moisture Observing System (COSMOS): A non-invasive, intermediate scale soil moisture measurement network. In Proceedings of the BHS Third International Symposium, Managing Consequences of a Changing Global Environment EGU General Assembly Conference Abstracts, Newcastle, UK, 19–23 July 2010. [Google Scholar]
- Francke, T.; Heistermann, M.; Köhli, M.; Budach, C.; Schrön, M.; Oswald, S.E. Assessing the feasibility of a directional cosmic-ray neutron sensing sensor for estimating soil moisture. Geosci. Instrum. Methods Data Syst. 2022, 11, 75–92. [Google Scholar] [CrossRef]


| Study Site | Maxim Radius | Minimum Radius | Maxim Depth | Minimum Depth |
|---|---|---|---|---|
| Fengqiu | 139 m | 127 m | 31.2 cm | 16.9 cm |
| Hemuqiao | 153 m | 125 m | 45.9 cm | 19.1 cm |
| Theoretically | 218 m | 123 m | 65.9 cm | 13.8 cm |
Disclaimer/Publisher’s Note: The statements, opinions and data contained in all publications are solely those of the individual author(s) and contributor(s) and not of MDPI and/or the editor(s). MDPI and/or the editor(s) disclaim responsibility for any injury to people or property resulting from any ideas, methods, instructions or products referred to in the content. |
© 2023 by the authors. Licensee MDPI, Basel, Switzerland. This article is an open access article distributed under the terms and conditions of the Creative Commons Attribution (CC BY) license (https://creativecommons.org/licenses/by/4.0/).
Share and Cite
Jiang, Y.; Xuan, K.; Gao, C.; Liu, Y.; Zhao, Y.; Deng, H.; Li, X.; Liu, J. Investigating the Potential of Cosmic-Ray Neutron Sensing for Estimating Soil Water Content in Farmland and Mountainous Areas. Water 2023, 15, 1500. https://doi.org/10.3390/w15081500
Jiang Y, Xuan K, Gao C, Liu Y, Zhao Y, Deng H, Li X, Liu J. Investigating the Potential of Cosmic-Ray Neutron Sensing for Estimating Soil Water Content in Farmland and Mountainous Areas. Water. 2023; 15(8):1500. https://doi.org/10.3390/w15081500
Chicago/Turabian StyleJiang, Yifei, Kefan Xuan, Chen Gao, Yiren Liu, Yuan Zhao, Haodong Deng, Xiaopeng Li, and Jianli Liu. 2023. "Investigating the Potential of Cosmic-Ray Neutron Sensing for Estimating Soil Water Content in Farmland and Mountainous Areas" Water 15, no. 8: 1500. https://doi.org/10.3390/w15081500