
Modelling of the Fate of 137Cs and 90Sr in the Chornobyl Nuclear Power Plant Cooling Pond before and after the Water Level Drawdown

 , , , , ,
Abstract
:1. Introduction
2. Materials and Methods
2.1. 3D Model THREETOX
2.2. Box Model POSEIDON-F
3. Results and Discussion
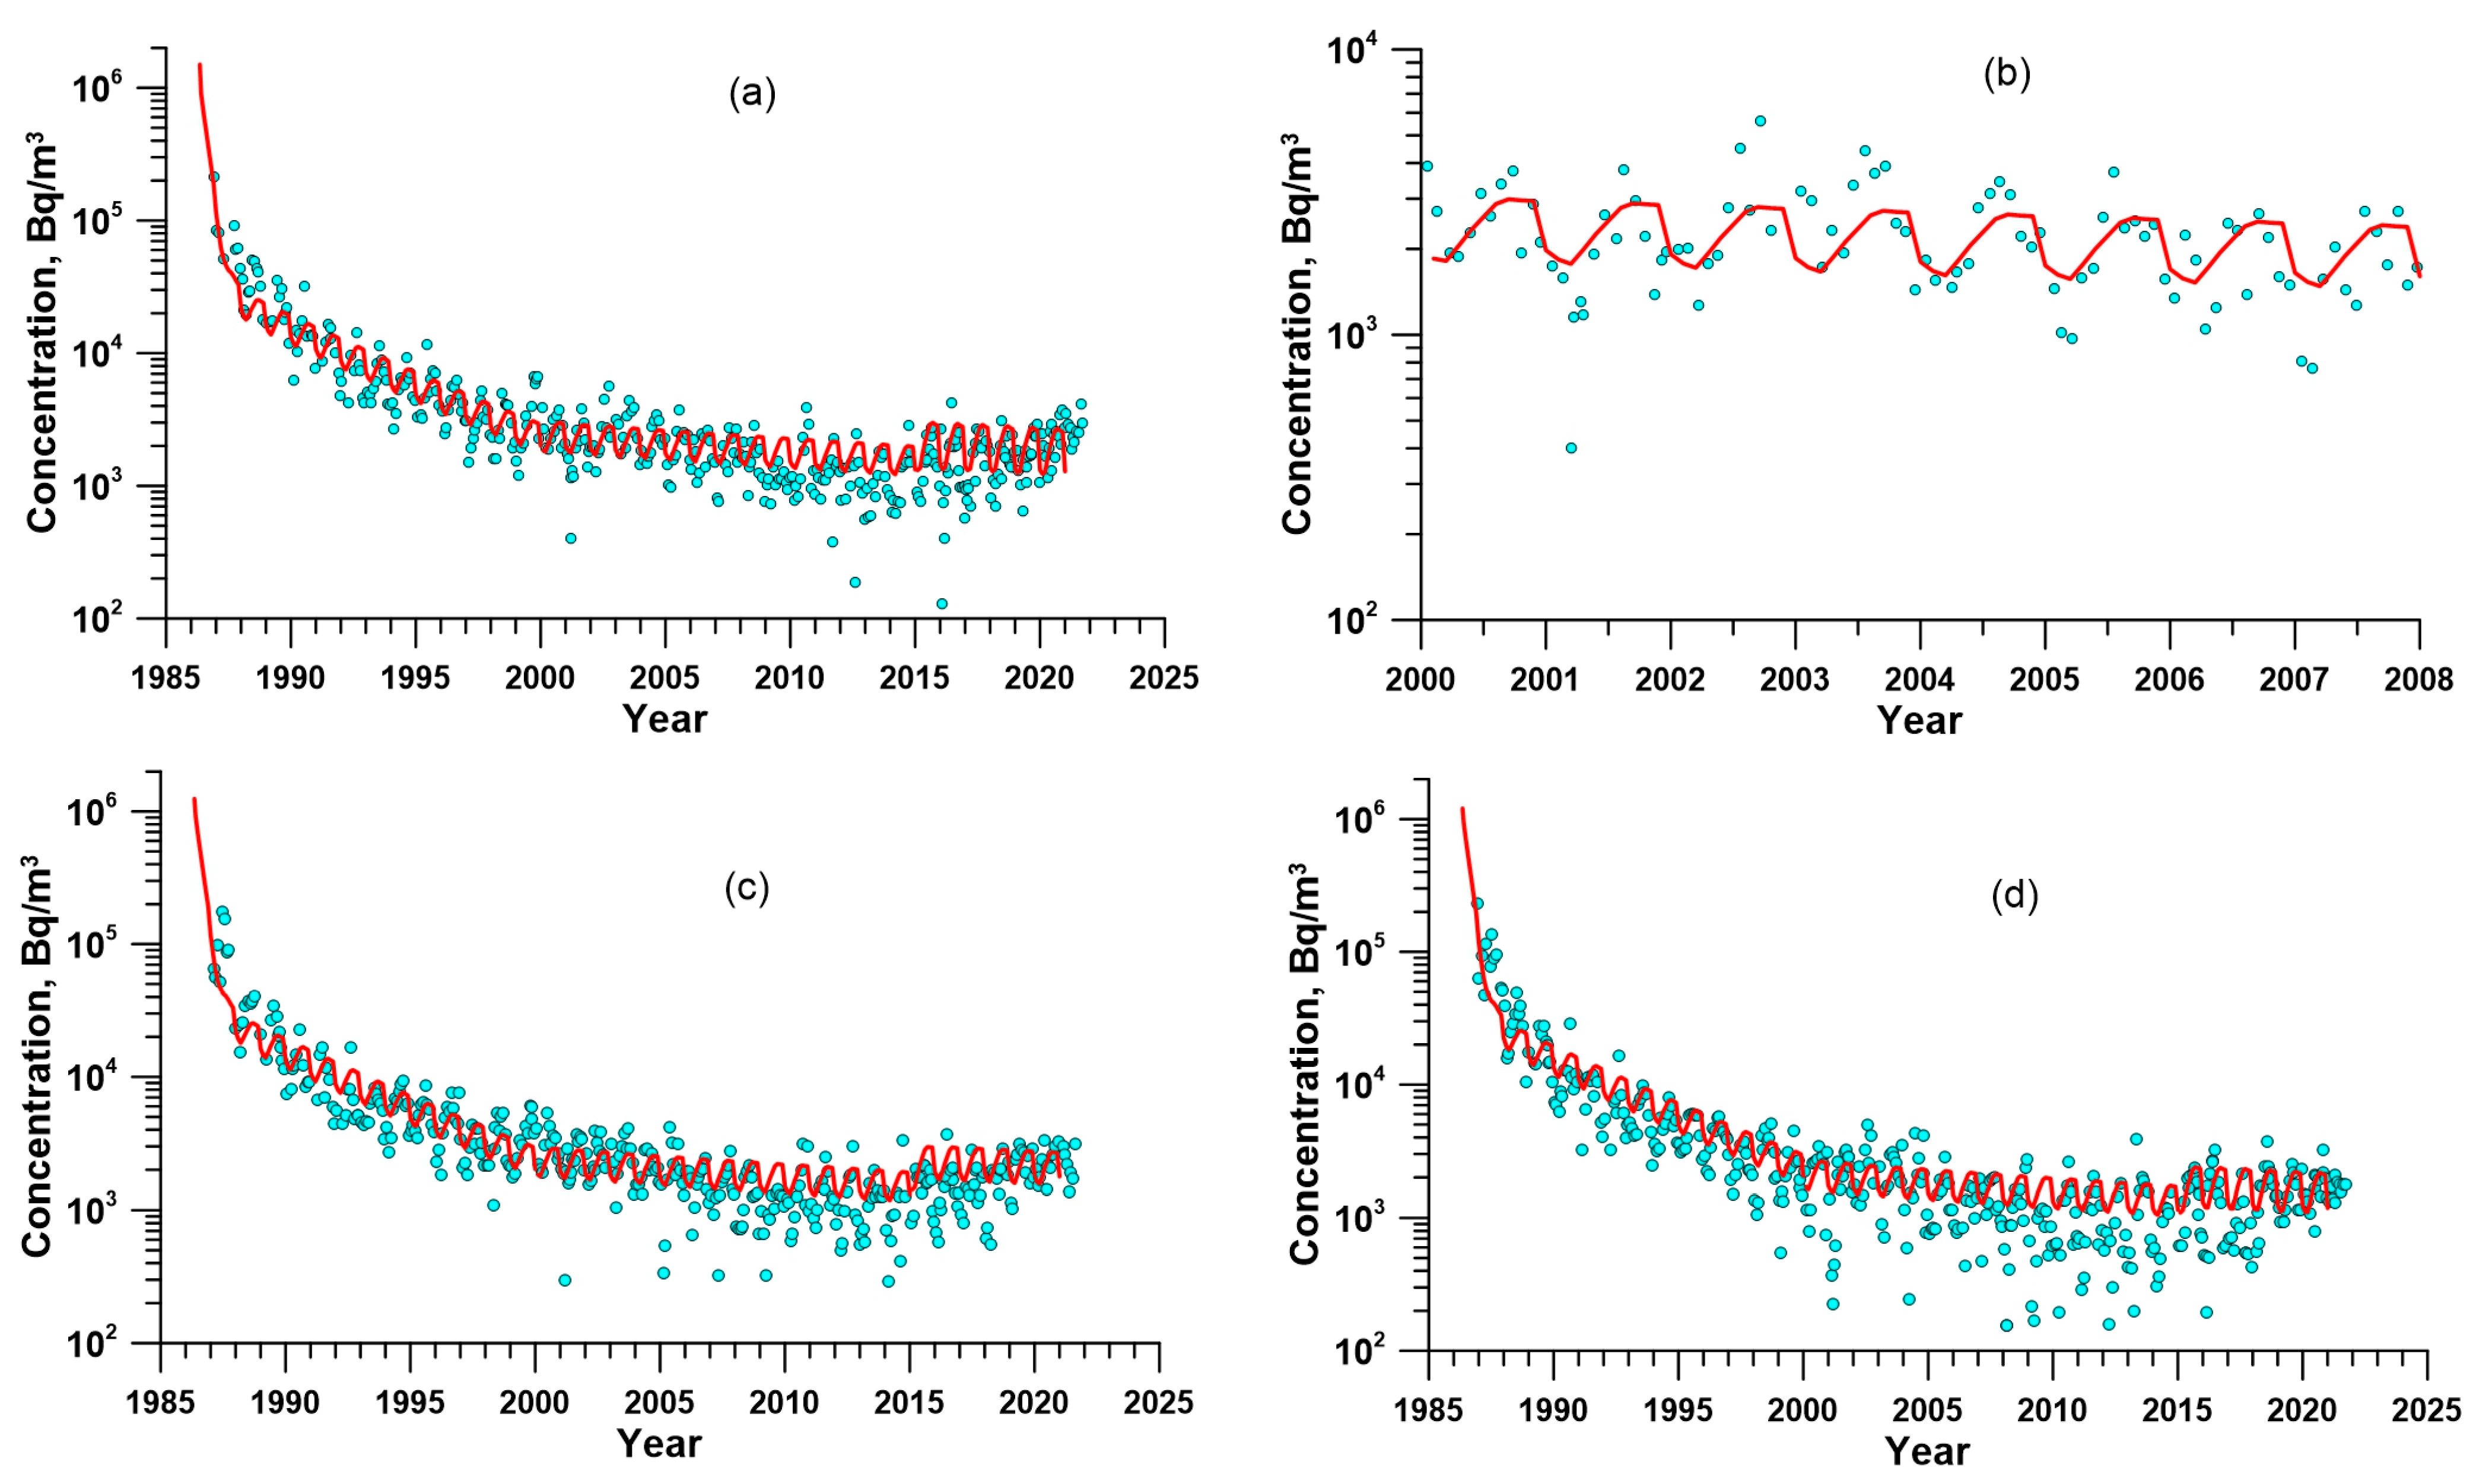
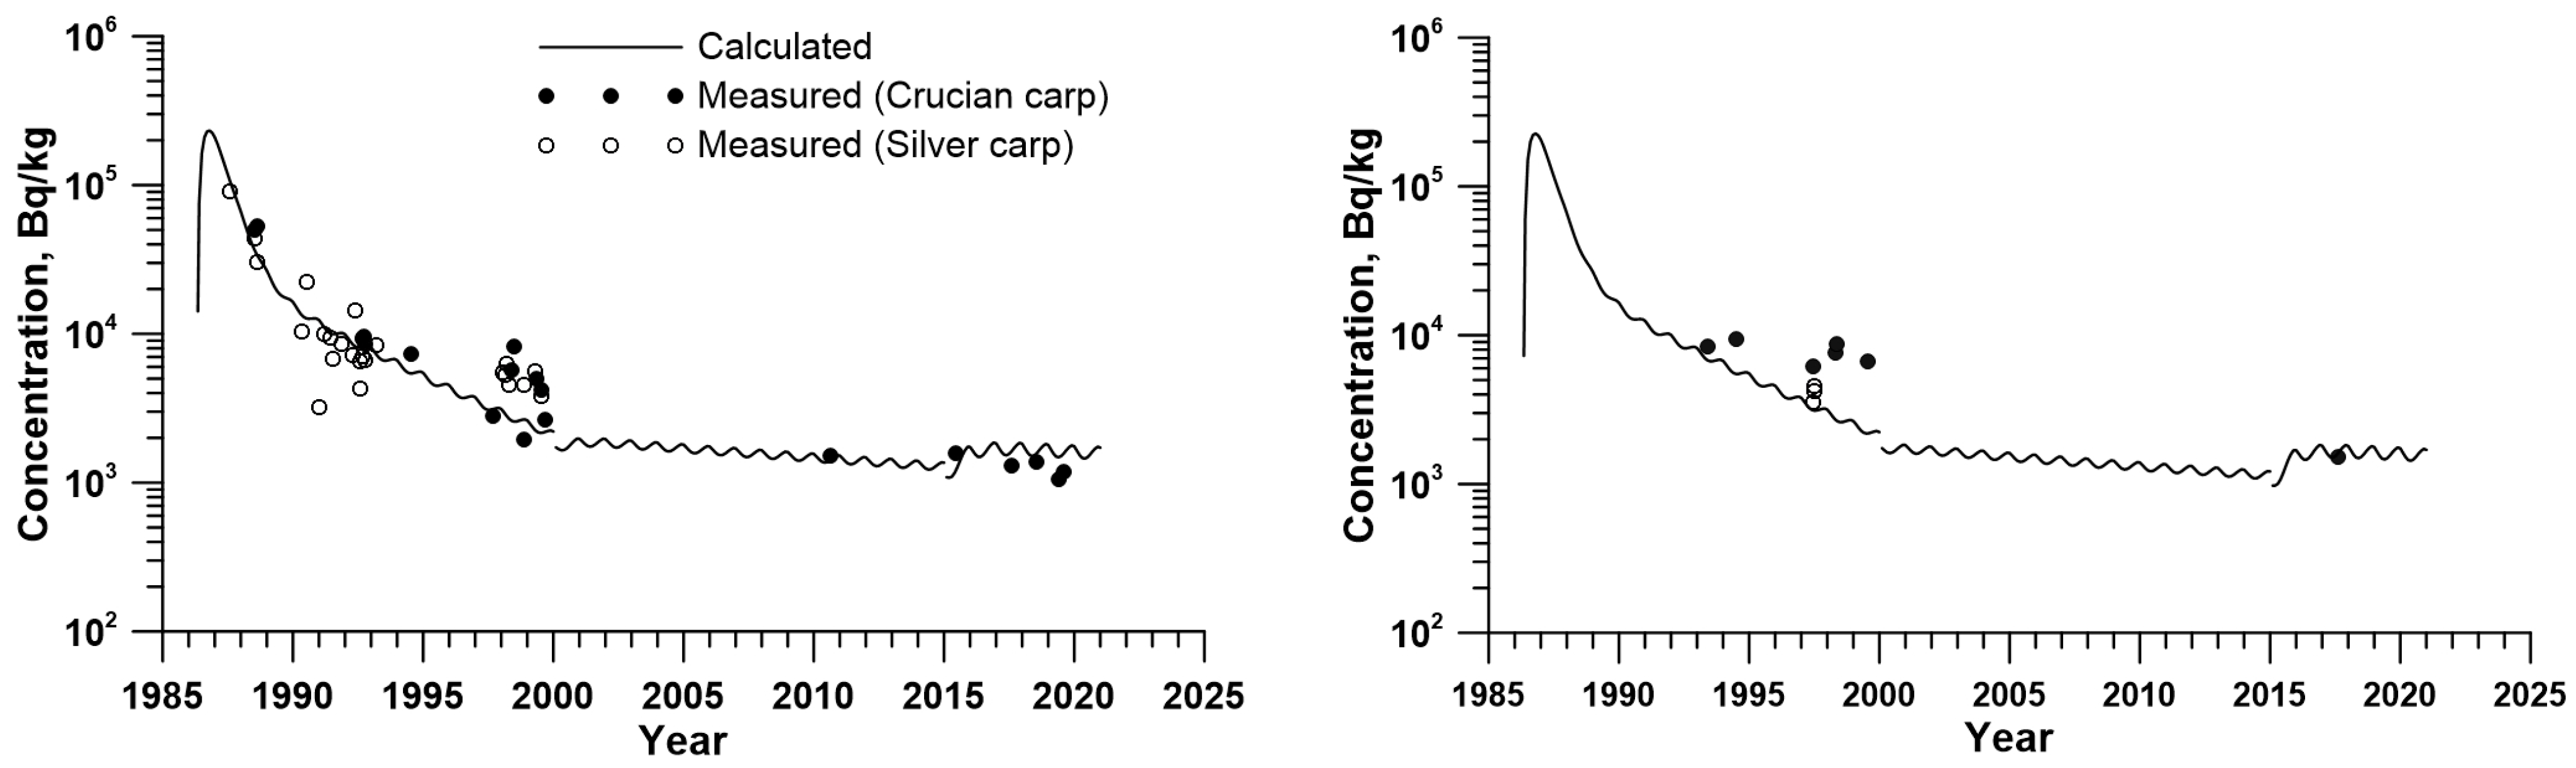
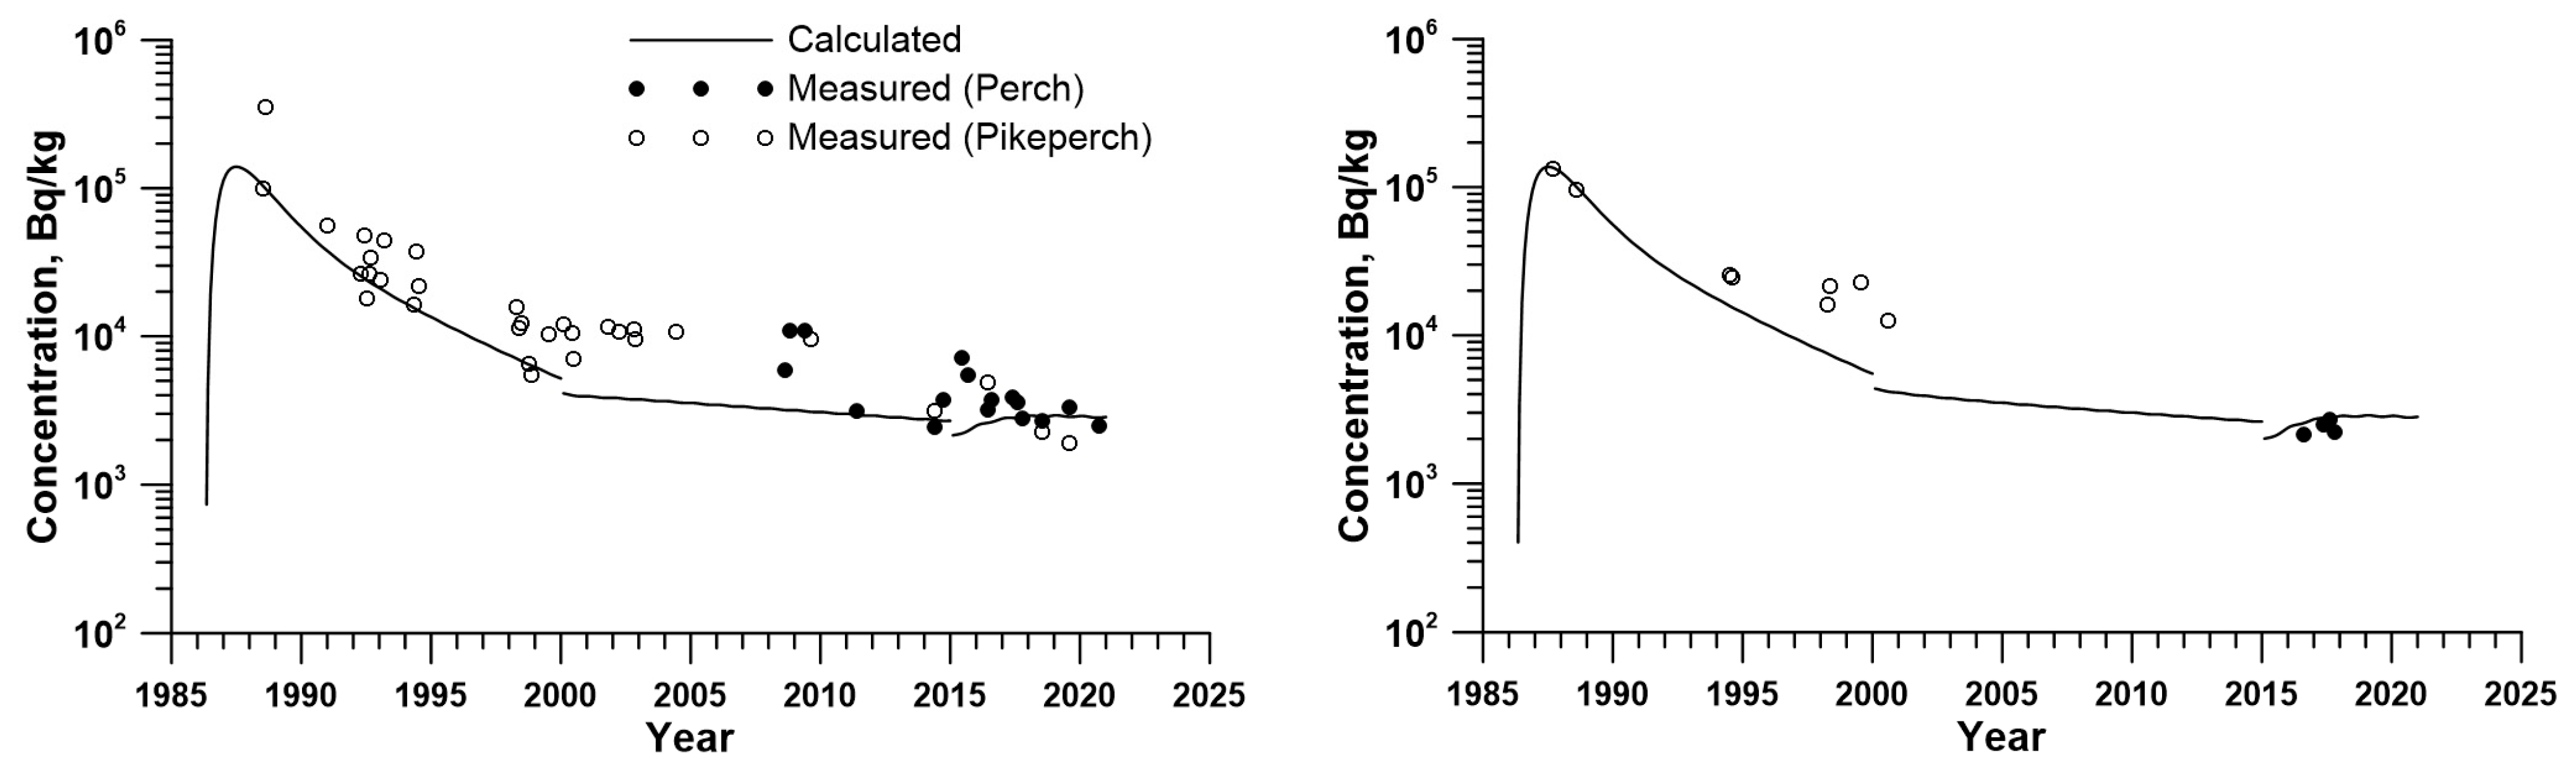
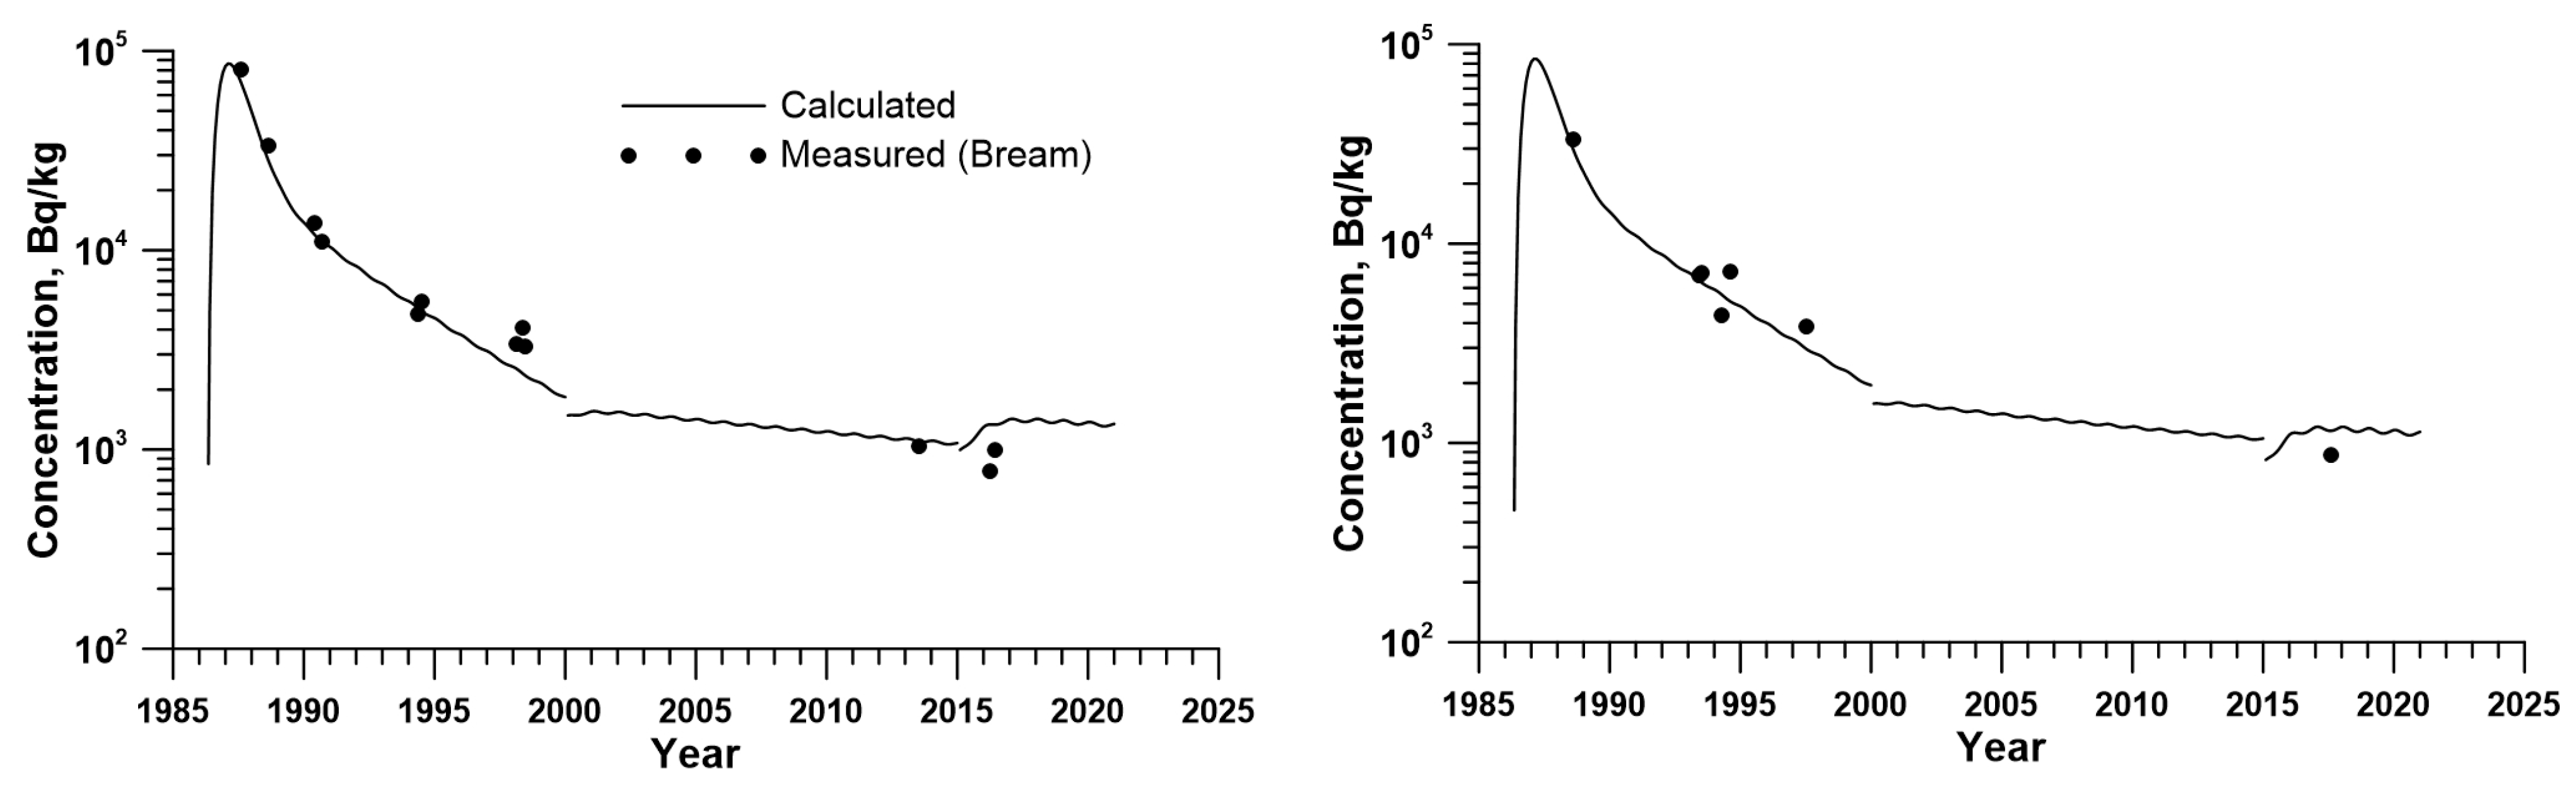
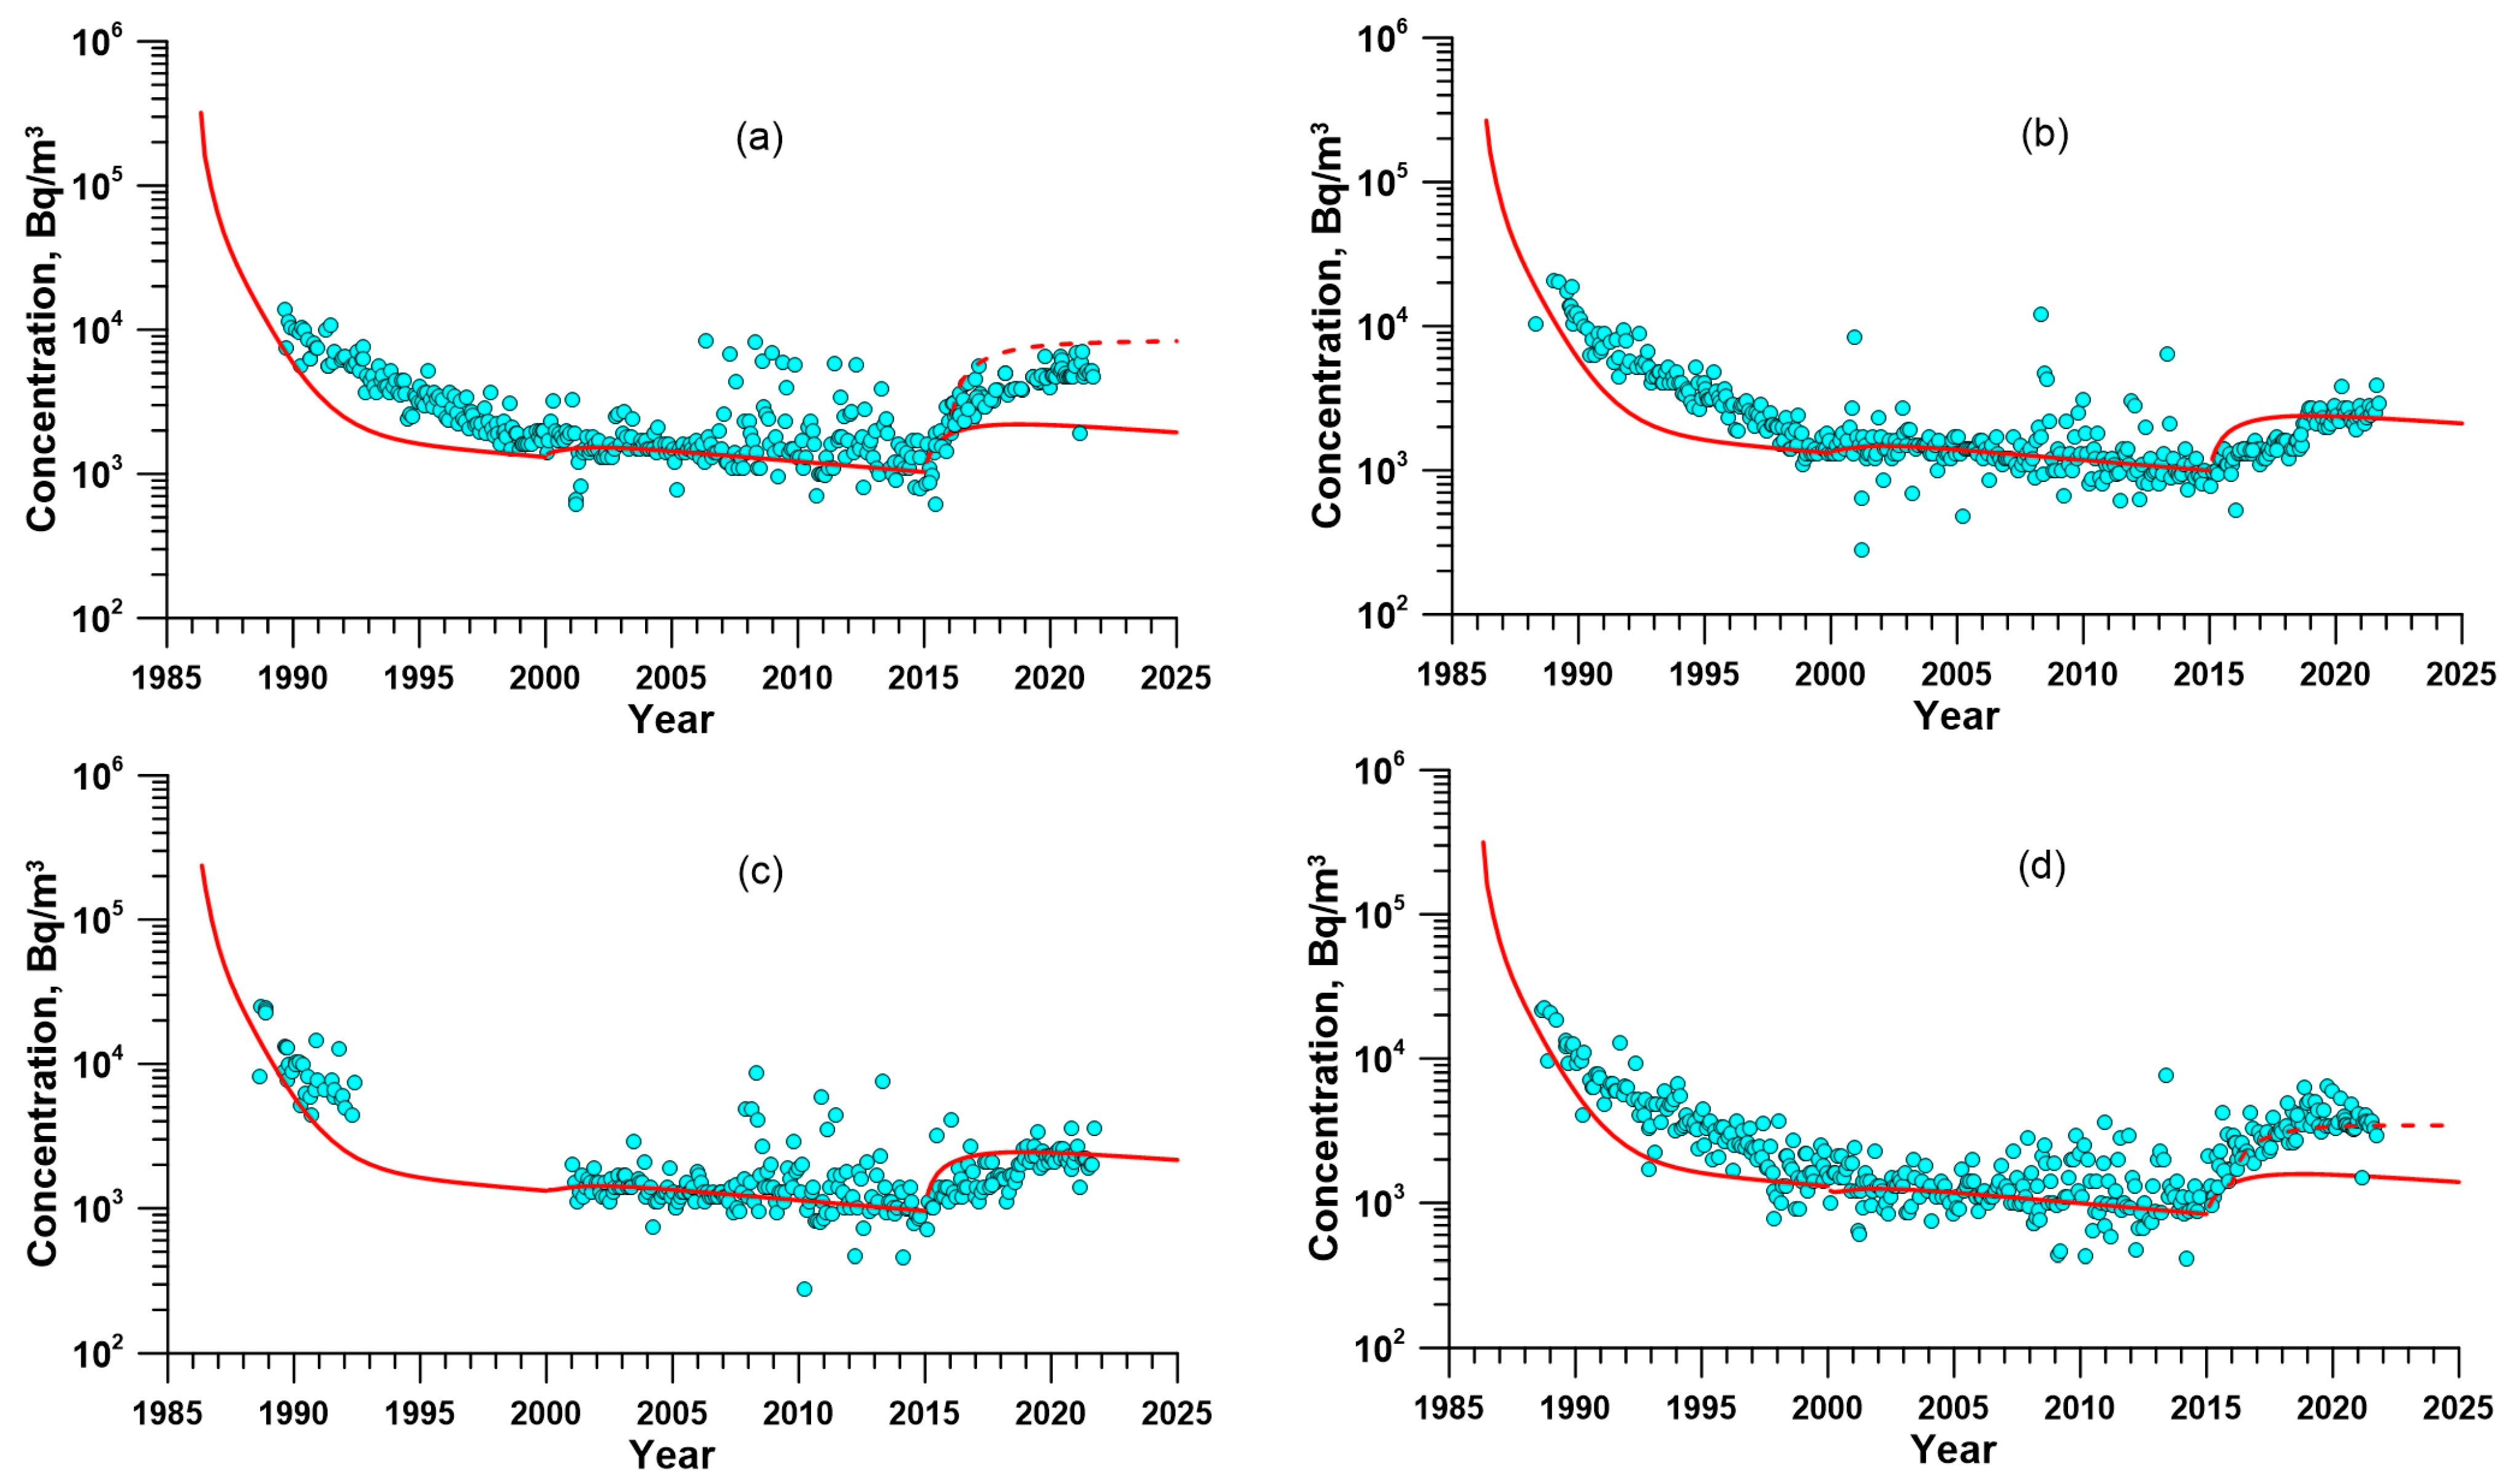
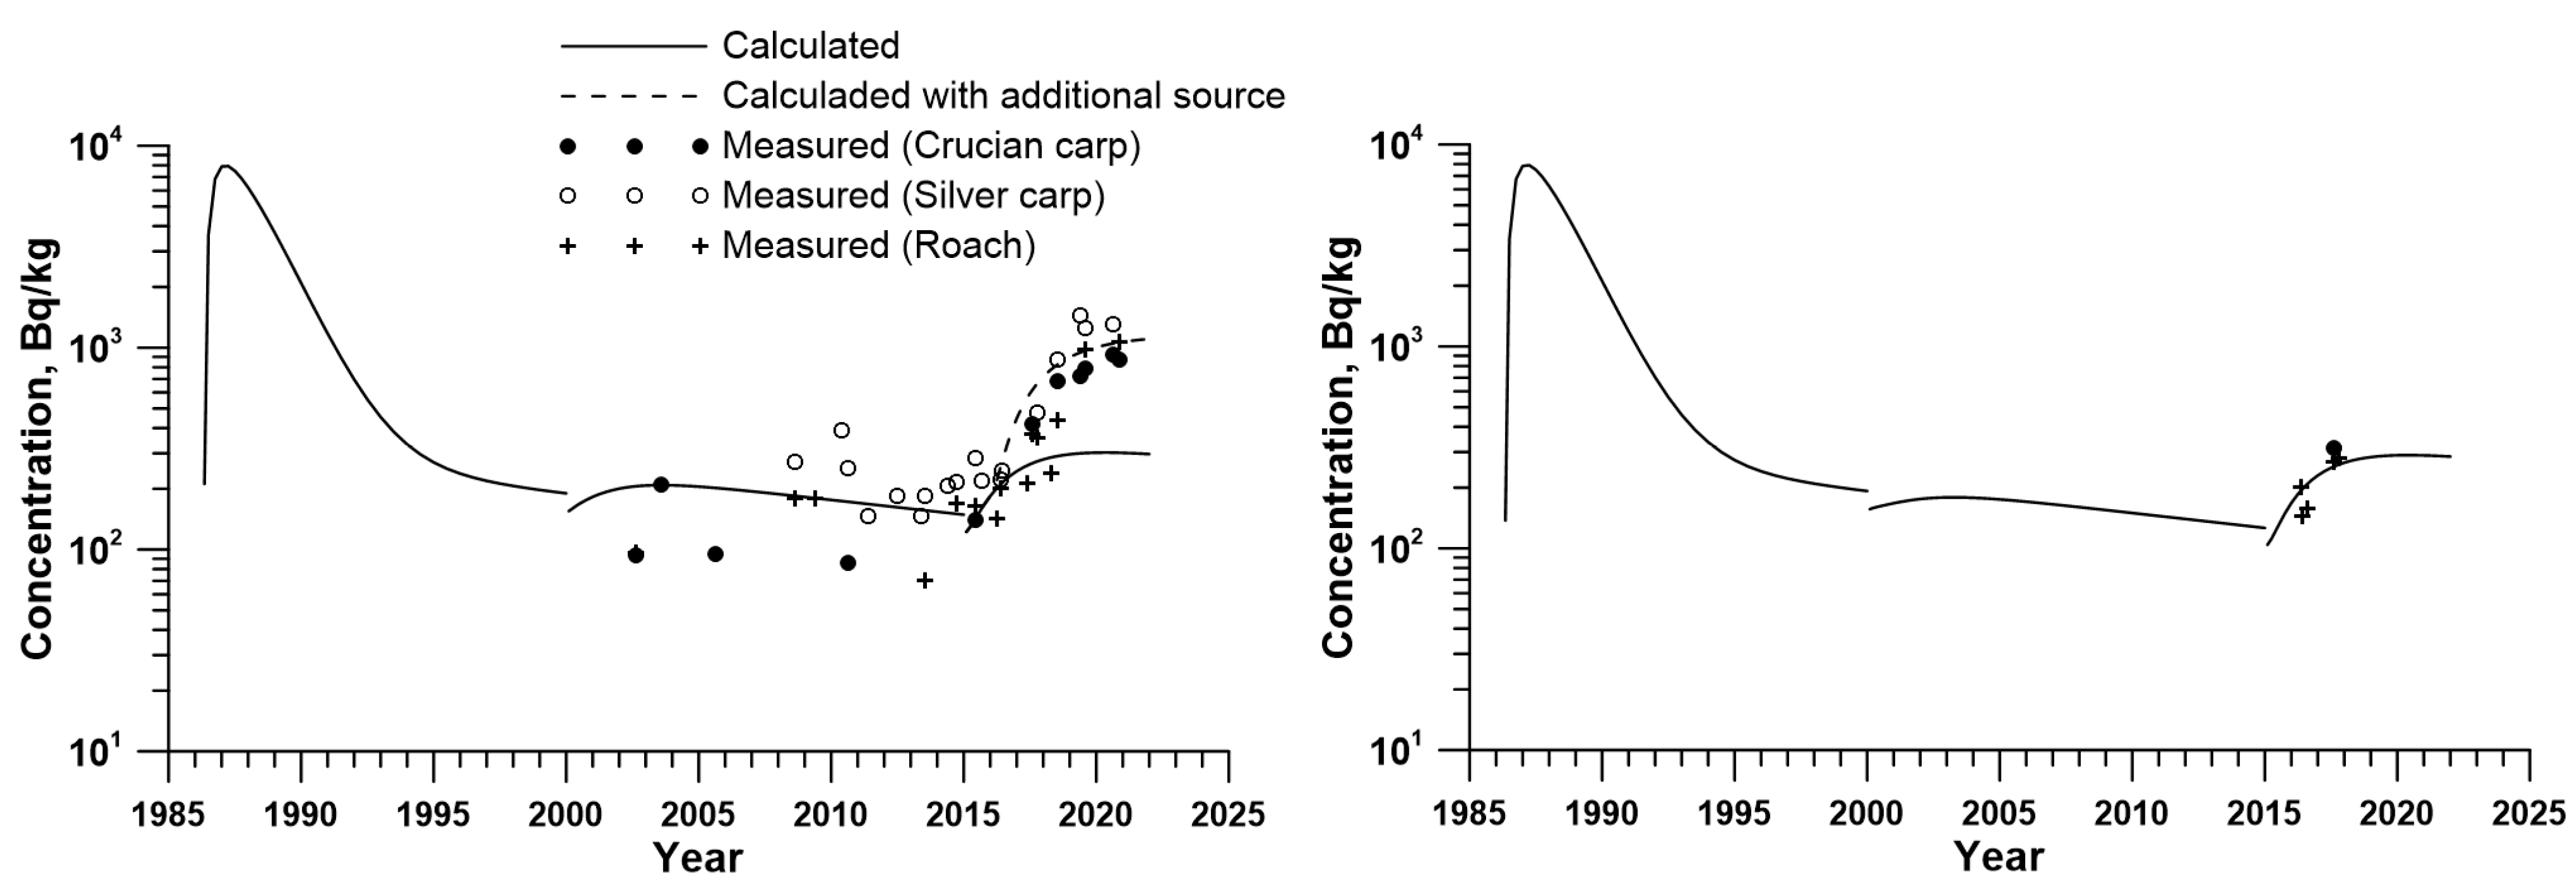
3.1. Concentrations of 137Cs in the CP Environment for the Period 1986–2021
3.2. Concentrations of 90Sr in the CP Environment for the Period 1986–2021
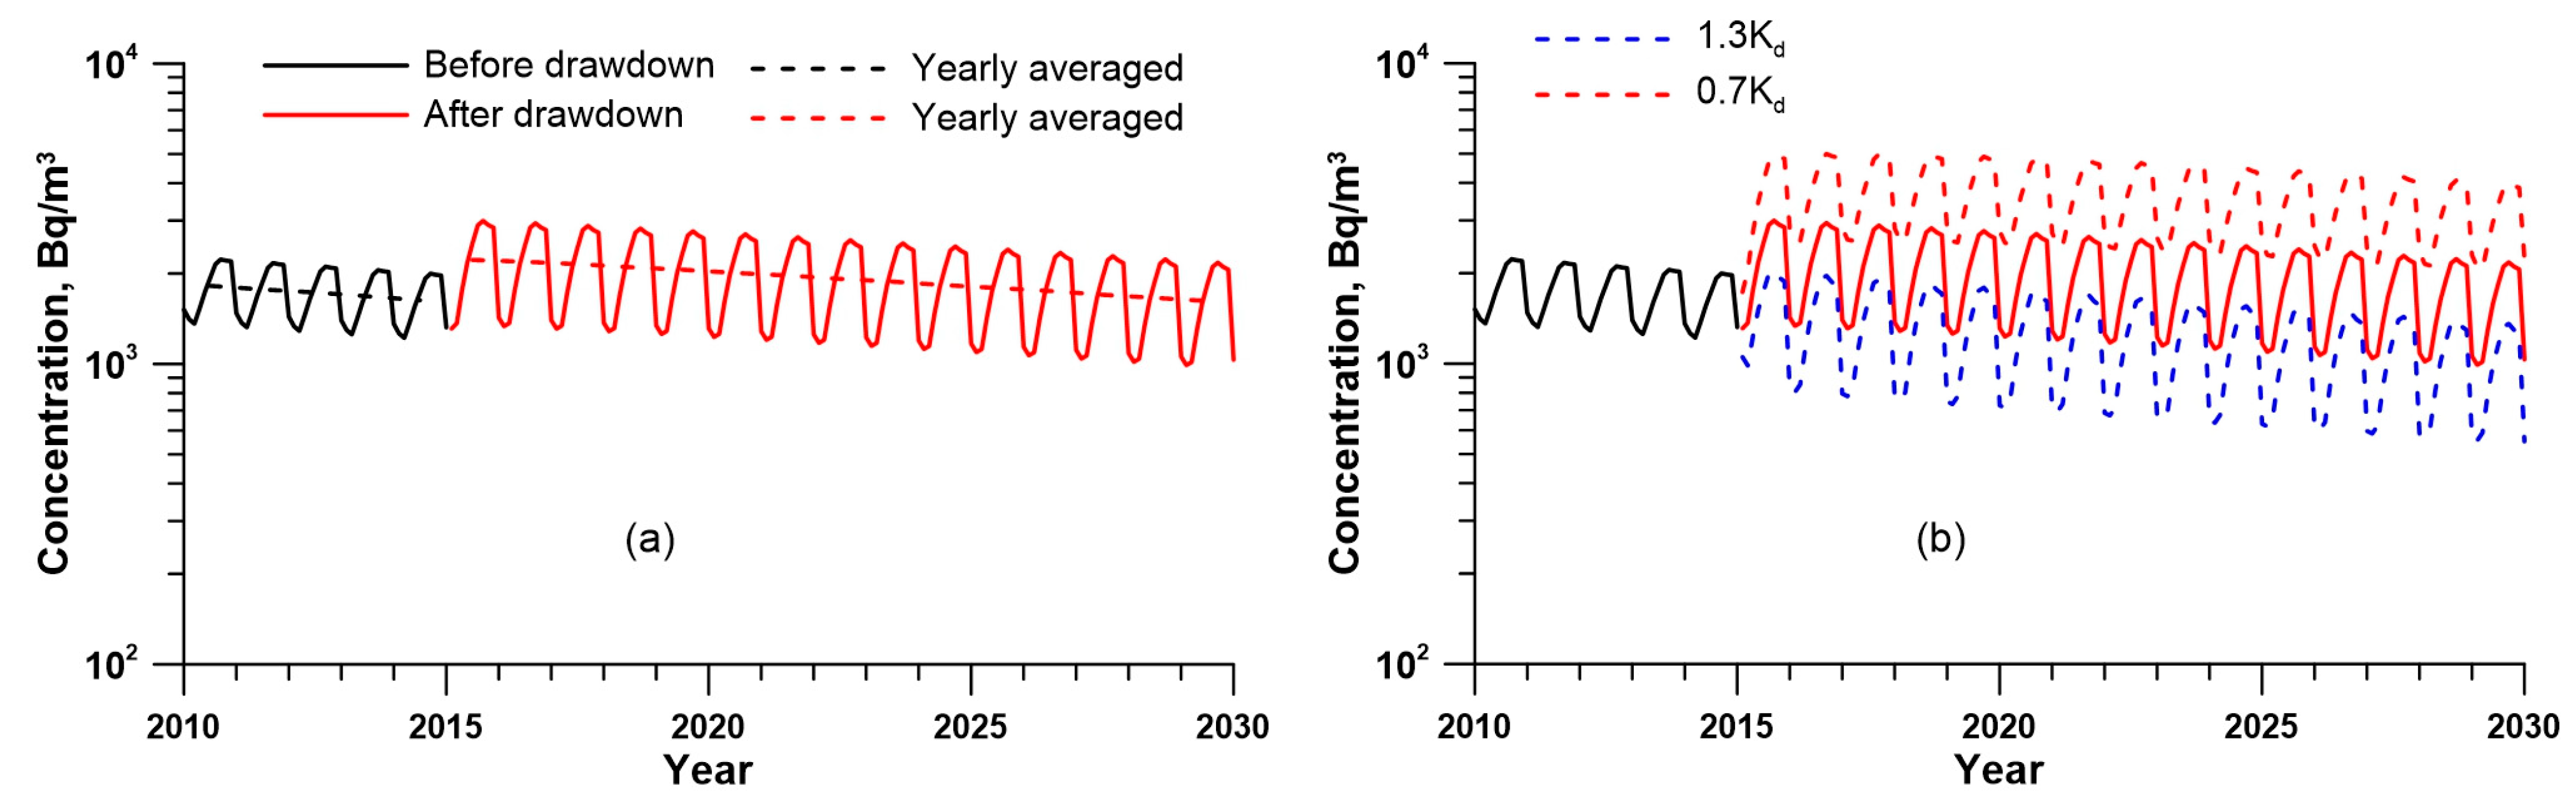
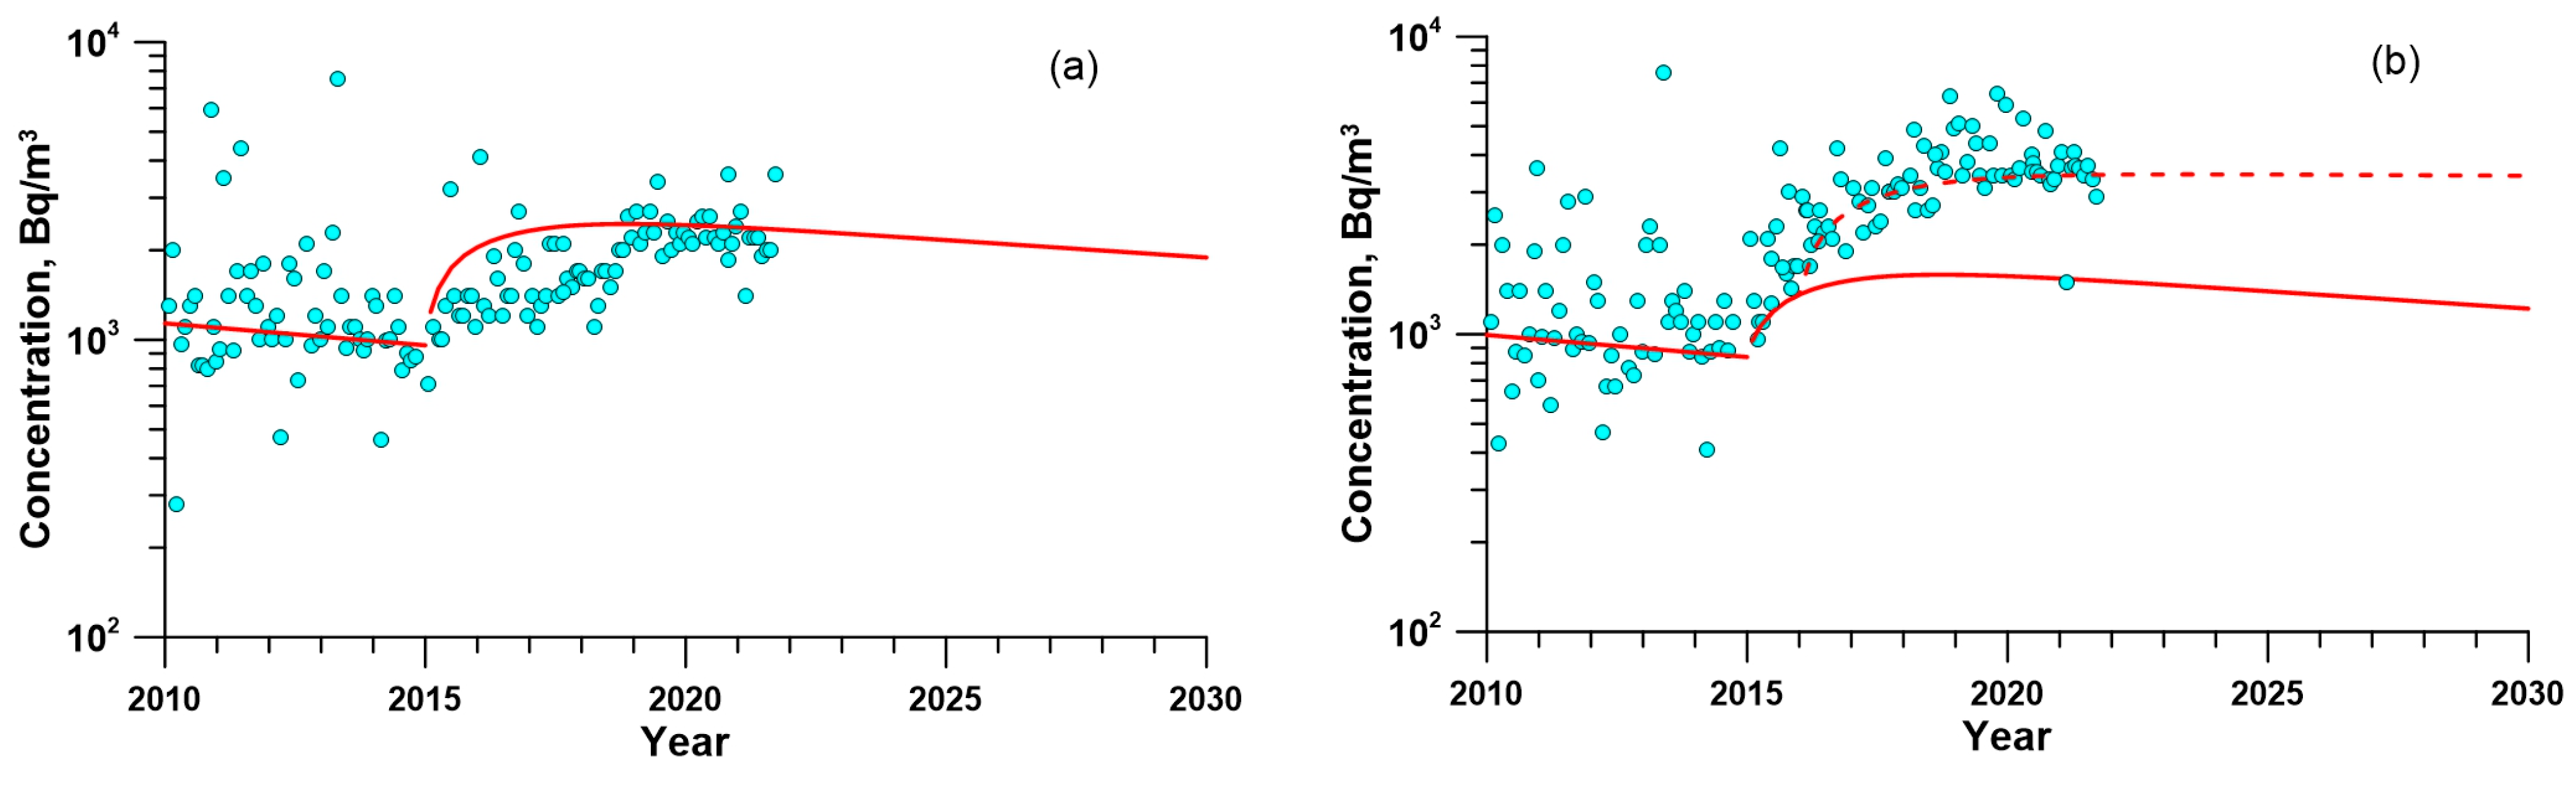
3.3. Near-Future Forecast of 137Cs and 90Sr Concentrations in the CP Water
4. Conclusions
Supplementary Materials
Author Contributions
Funding
Data Availability Statement
Conflicts of Interest
References
- Bugai, D.A.; Waters, R.D.; Dzhepo, S.P.; Skalsk’ij, A.S. The cooling pond of the Chernobyl nuclear power plant: A groundwater remediation case history. Water Resour. Res. 1997, 33, 677–688. [Google Scholar] [CrossRef]
- Kanivets, V.; Laptev, G.; Konoplev, A.; Lisovyi, H.; Derkach, G.; Voitsekhovych, O. Distribution and Dynamics of Radionuclides in the Chernobyl Cooling Pond. In Behavior of Radionuclides in the Environment II Chernobyl; Konoplev, A., Kato, K., Kalmykov, S., Eds.; Springer: Singapore, 2020; pp. 349–405. [Google Scholar]
- Kryshev, I. Radioactive contamination of aquatic ecosystems following the Chernobyl accident. J. Environ. Radioact. 1995, 27, 207–219. [Google Scholar] [CrossRef]
- Gudkov, D.I.; Derevets, V.V.; Kuzmenko, M.I.; Nazarov, A.B. Radioactive contamination of aquatic ecosystem within the Chernobyl NPP exclusion zone: 15 years after accident. In Protection of the Environment from Ionising Radiation: The Development and Application of a System of Radiation Protection for the Environment; IAEA-CSP-17; IAEA: Vienna, Austria, 2003; pp. 224–231. [Google Scholar]
- Margvelashvili, N.; Maderich, V.; Yuschenko, S.; Zheleznyak, M. 3-D numerical modelling of mud and radionuclide transport in the Chernobyl Cooling Pond and Dnieper-Boog Estuary. In Fine Sediments Dynamics in the Marine Environment; Winterwerp, J.C., Kranenburg, C., Eds.; Elsevier: Amsterdam, The Netherlands, 2002; Volume 5, pp. 595–610. [Google Scholar]
- Kryshev, I.I.; Sazykina, T.G.; Kryshev, A.I. Radioactivity of aquatic biota in water bodies impacted with the Chernobyl-derived radionuclides. In Behavior of Radionuclides in the Environment II Chernobyl; Konoplev, A., Kato, K., Kalmykov, S., Eds.; Springer: Singapore, 2020; pp. 407–440. [Google Scholar]
- Kryshev, A.I.; Ryabov, I.N. A dynamic model of 137Cs accumulation by fish of different age classes. J. Environ. Radioact. 2000, 50, 221–233. [Google Scholar] [CrossRef]
- Smith, J.T.; Sasina, N.V.; Kryshev, A.I.; Belova, N.V.; Kudelsky, A.V. A review and test of predictive models for the bioac-cumulation of radiostrontium in fish. J. Environ. Radioact. 2009, 100, 950–954. [Google Scholar] [CrossRef] [PubMed]
- Bezhenar, R.; Zheleznyak, M.; Gudkov, D.; Kanivets, V.; Laptev, G.; Protsak, V.; Sakaguchi, A.; Nanba, K.; Wada, T.; Kanasashi, T.; et al. Model & data based assessment of the impacts of drawdown of the Chornobyl NPP Cooling Pond on the Cs-137 concentrations in water, sediments and biota. In Proceedings of the European Geophysical Union Copernicus Meetings, No. EGU21-12329, Virtual, 19–30 April 2021. [Google Scholar] [CrossRef]
- Beresford, N.; Beaugelin-Seiller, K.; Burgos, J.; Cujic, M.; Fesenko, S.; Kryshev, A.; Pachal, N.; Real, A.; Su, B.; Tagami, K.; et al. Radionuclide biological half-life values for terrestrial and aquatic wildlife. J. Environ. Radioact. 2015, 150, 270–276. [Google Scholar] [CrossRef] [PubMed]
- Maderich, V.; Heling, R.; Bezhenar, R.; Brovchenko, I.; Jenner, H.; Koshebutskyy, V.; Kuschan, A.; Terletska, K. Development and application of 3D numerical model THREETOX to the prediction of cooling water transport and mixing in the inland and coastal waters. Hydrol. Process. 2008, 22, 1000–1013. [Google Scholar] [CrossRef]
- Johannessen, O.M.; Volkov, V.A.; Pettersson, L.H.; Maderich, V.S.; Zheleznyak, M.J.; Gao, Y.; Bobylev, L.P.; Stepanov, A.V.; Neelov, I.A.; Tishkov, V.P.; et al. Radioactivity and Pollution in the Nordic Seas and Arctic Region; Springer Science & Business Media: Berlin/Heidelberg, Germany, 2010. [Google Scholar] [CrossRef]
- Bezhenar, R.V.; Koshebutsky, V.I.; Kovalets, I.V.; Maderich, V.S.; Zheleznyak, M.J. Model-based analysis of effectiveness of engineering solutions designed to increase cooling capacity of Tashlyk water reservoir of South-Ukrainian Nuclear Power Plant. Int. J. Energy A Clean Environ. 2012, 13, 39–51. [Google Scholar] [CrossRef]
- Rosati, A.; Miyakoda, K. A general circulation model for upper ocean simulation. J. Phys. Oceanogr. 1988, 18, 1601–1626. [Google Scholar] [CrossRef]
- ECMWF (European Centre for Medium-Range Weather Forecasts). ERA Interim Daily Datasets. Available online: https://apps.ecmwf.int/datasets/data/interim-full-daily/levtype=sfc/ (accessed on 21 February 2023).
- Lepicard, S.; Raffestin, D.; Rancillac, F. POSEIDON: A dispersion computer code for assessing radiological impacts in European seawater environment. Radiat. Prot. Dosim. 1998, 75, 79–83. [Google Scholar] [CrossRef]
- Heling, R.; Koziy, L.; Bulgakov, V. On the dynamical uptake model developed for the uptake of radionuclides in marine or-ganisms for the POSEIDON-R model system. Radioprotection 2002, 37, 833–838. [Google Scholar] [CrossRef]
- Bezhenar, R.; Jung, K.T.; Maderich, V.; Willemsen, S.; de With, G.; Qiao, F. Transfer of radiocaesium from contaminated bottom sediments to marine organisms through benthic food chains in post-Fukushima and post-Chernobyl periods. Biogeosciences 2016, 13, 3021–3034. [Google Scholar] [CrossRef]
- Lepicard, S.; Heling, R.; Maderich, V. POSEIDON-R/RODOS models for radiological assessment of marine environment after accidental releases: Application to coastal areas of the Baltic, Black and North Seas. J. Environ. Radioact. 2004, 72, 153–161. [Google Scholar] [CrossRef] [PubMed]
- Bezhenar, R.; Heling, R.; Ievdin, I.; Iosjpe, M.; Maderich, V.; Willemsen, S.; de With, G.; Dvorzhak, A. Integration of marine food chain model POSEIDON in JRODOS and testing versus Fukushima data. Radioprotection 2016, 51, S137–S139. [Google Scholar] [CrossRef]
- Maderich, V.; Bezhenar, R.; Tateda, Y.; Aoyama, M.; Tsumune, D.; Jung, K.; de With, G. The POSEIDON-R compartment model for the prediction of transport and fate of radionuclides in the marine environment. Methodsx 2018, 5, 1251–1266. [Google Scholar] [CrossRef] [PubMed]
- Konoplev, A. Mobility and Bioavailability of the Chernobyl-Derived Radionuclides in Soil–Water Environment. In Behavior of Radionuclides in the Environment II Chernobyl; Konoplev, A., Kato, K., Kalmykov, S., Eds.; Springer: Singapore, 2020; pp. 157–193. [Google Scholar]
- Heling, R.; Bezhenar, R. Modification of the dynamic radionuclide uptake model BURN by salinity driven transfer parameters for the marine foodweb and its integration in POSEIDON-R. Radioprotection 2009, 44, 741–746. [Google Scholar] [CrossRef]
- Shigenobu, Y.; Ambe, D.; Kaeriyama, H.; Sohtome, T.; Mizuno, T.; Koshiishi, Y.; Yamasaki, S.; Ono, T. Investigation of radiocesium translation from contaminated sediment to benthic organisms. In Impacts of the Fukushima Nuclear Accident on Fish and Fishing Grounds, Chapter 7; Nakata, K., Sugisaka, H., Eds.; Springer: Tokyo, Japan, 2015; pp. 91–98. [Google Scholar]
- Wang, C.; Baumann, Z.; Madigan, D.J.; Fisher, N.S. Contaminated Marine Sediments as a Source of Cesium Radioisotopes for Benthic Fauna near Fukushima. Environ. Sci. Technol. 2016, 50, 10448–10455. [Google Scholar] [CrossRef] [PubMed]
- Sundbom, M.; Meili, M.; Andersson, E.; Östlund, M.; Broberg, A. Long-term dynamics of Chernobyl 137Cs in freshwater fish: Quantifying the effect of body size and trophic level. J. Appl. Ecol. 2003, 40, 228–240. [Google Scholar] [CrossRef]
- Kasamatsu, F.; Ishikawa, Y. Natural variation of radionuclide 137Cs concentration in marine organisms with special reference to the effect of food habits and trophic level. Mar. Ecol. Prog. Ser. 1997, 160, 109–120. [Google Scholar] [CrossRef]
- Bugai, D.; Kireev, S.; Hoque, M.A.; Kubko, Y.; Smith, J. Natural attenuation processes control groundwater contamination in the Chernobyl exclusion zone: Evidence from 35 years of radiological monitoring. Sci. Rep. 2022, 12, 18215. [Google Scholar] [CrossRef] [PubMed]
- Sato, H.; Gusyev, M.; Veremenko, D.; Laptev, G.; Shibasaki, N.; Onda, Y.; Zheleznyak, M.; Kirieiev, S.; Nanba, K. Evaluating changes in radionuclide concentrations and groundwater levels before and after the cooling pond drawdown in the Chernobyl Nuclear Power Plant vicinity. Sci. Total Environ. 2023, 872, 161997. [Google Scholar] [CrossRef] [PubMed]


| Type of Input Data | Model | Source |
|---|---|---|
| Meteorological data | THREETOX | ERA-Interim reanalysis data |
| ChNPP cooling system release rate | THREETOX | Average value for such type of reactor |
| Water heating rate in the ChNPP cooling system | THREETOX | Average value for such type of reactor |
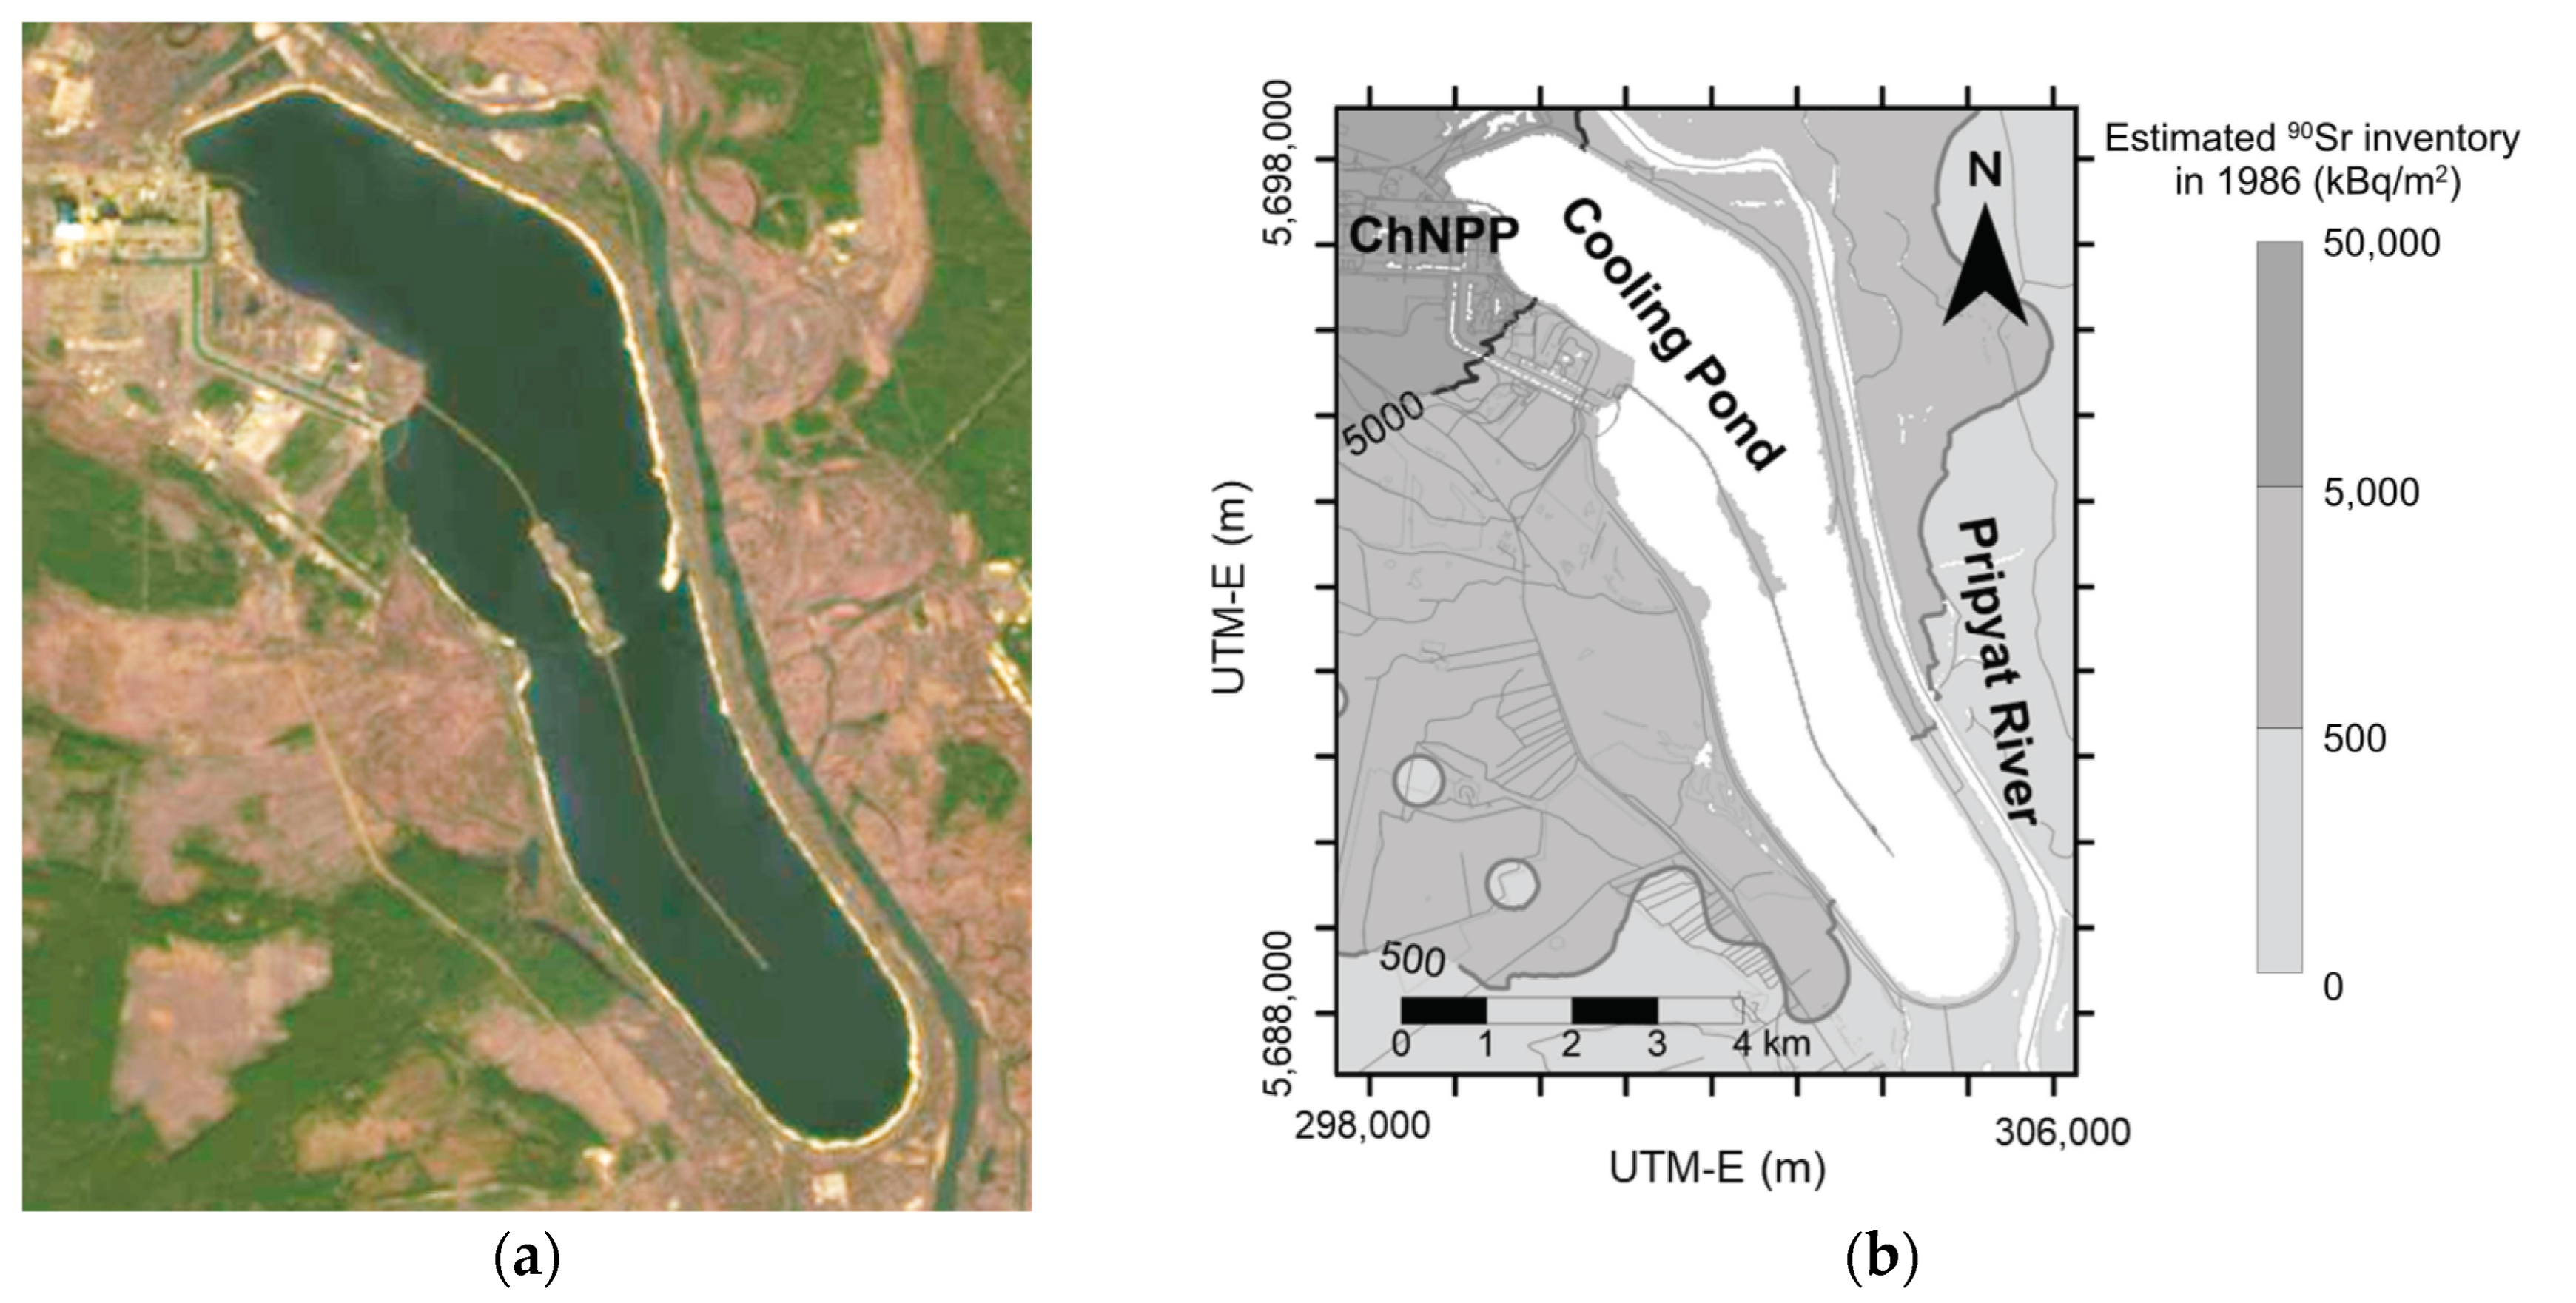
| Bathymetry data | THREETOX, POSEIDON-F | Digital map reported in [2] |
| Water fluxes between boxes | POSEIDON-F | Calculated from the THREETOX model output |
| Water losses and their replenishment from the Prypiat River | POSEIDON-F | Estimations from [1] |
| Deposition densities of radionuclides and their total activity | POSEIDON-F | Estimations from [2] |
| Seasonal changes in ammonium and potassium ions concentration | POSEIDON-F | Measurement data from authors’ own databases |
| Concentration Factors for phytoplankton and macro-algae | POSEIDON-F | Calculated as a ratio of radionuclide concentrations in corresponding organism and water from authors’ own databases |
| Biological half-lives of radionuclides in aquatic organisms | POSEIDON-F | Data for freshwater biota adopted from [10] |
| Month | Jan | Feb | Mar | Apr | May | Jun | Jul | Aug | Sep | Oct | Nov | Dec |
|---|---|---|---|---|---|---|---|---|---|---|---|---|
| [K], mg L−1 | 1.16 | 2.19 | 1.49 | 1.20 | 2.25 | 3.12 | 2.86 | 1.61 | 2.15 | 1.29 | 1.34 | 1.42 |
| [NH4], mg L−1 | 0.27 | 0.11 | 0.45 | 0.35 | 0.40 | 0.29 | 0.42 | 0.60 | 0.23 | 0.20 | 0.07 | 0.01 |
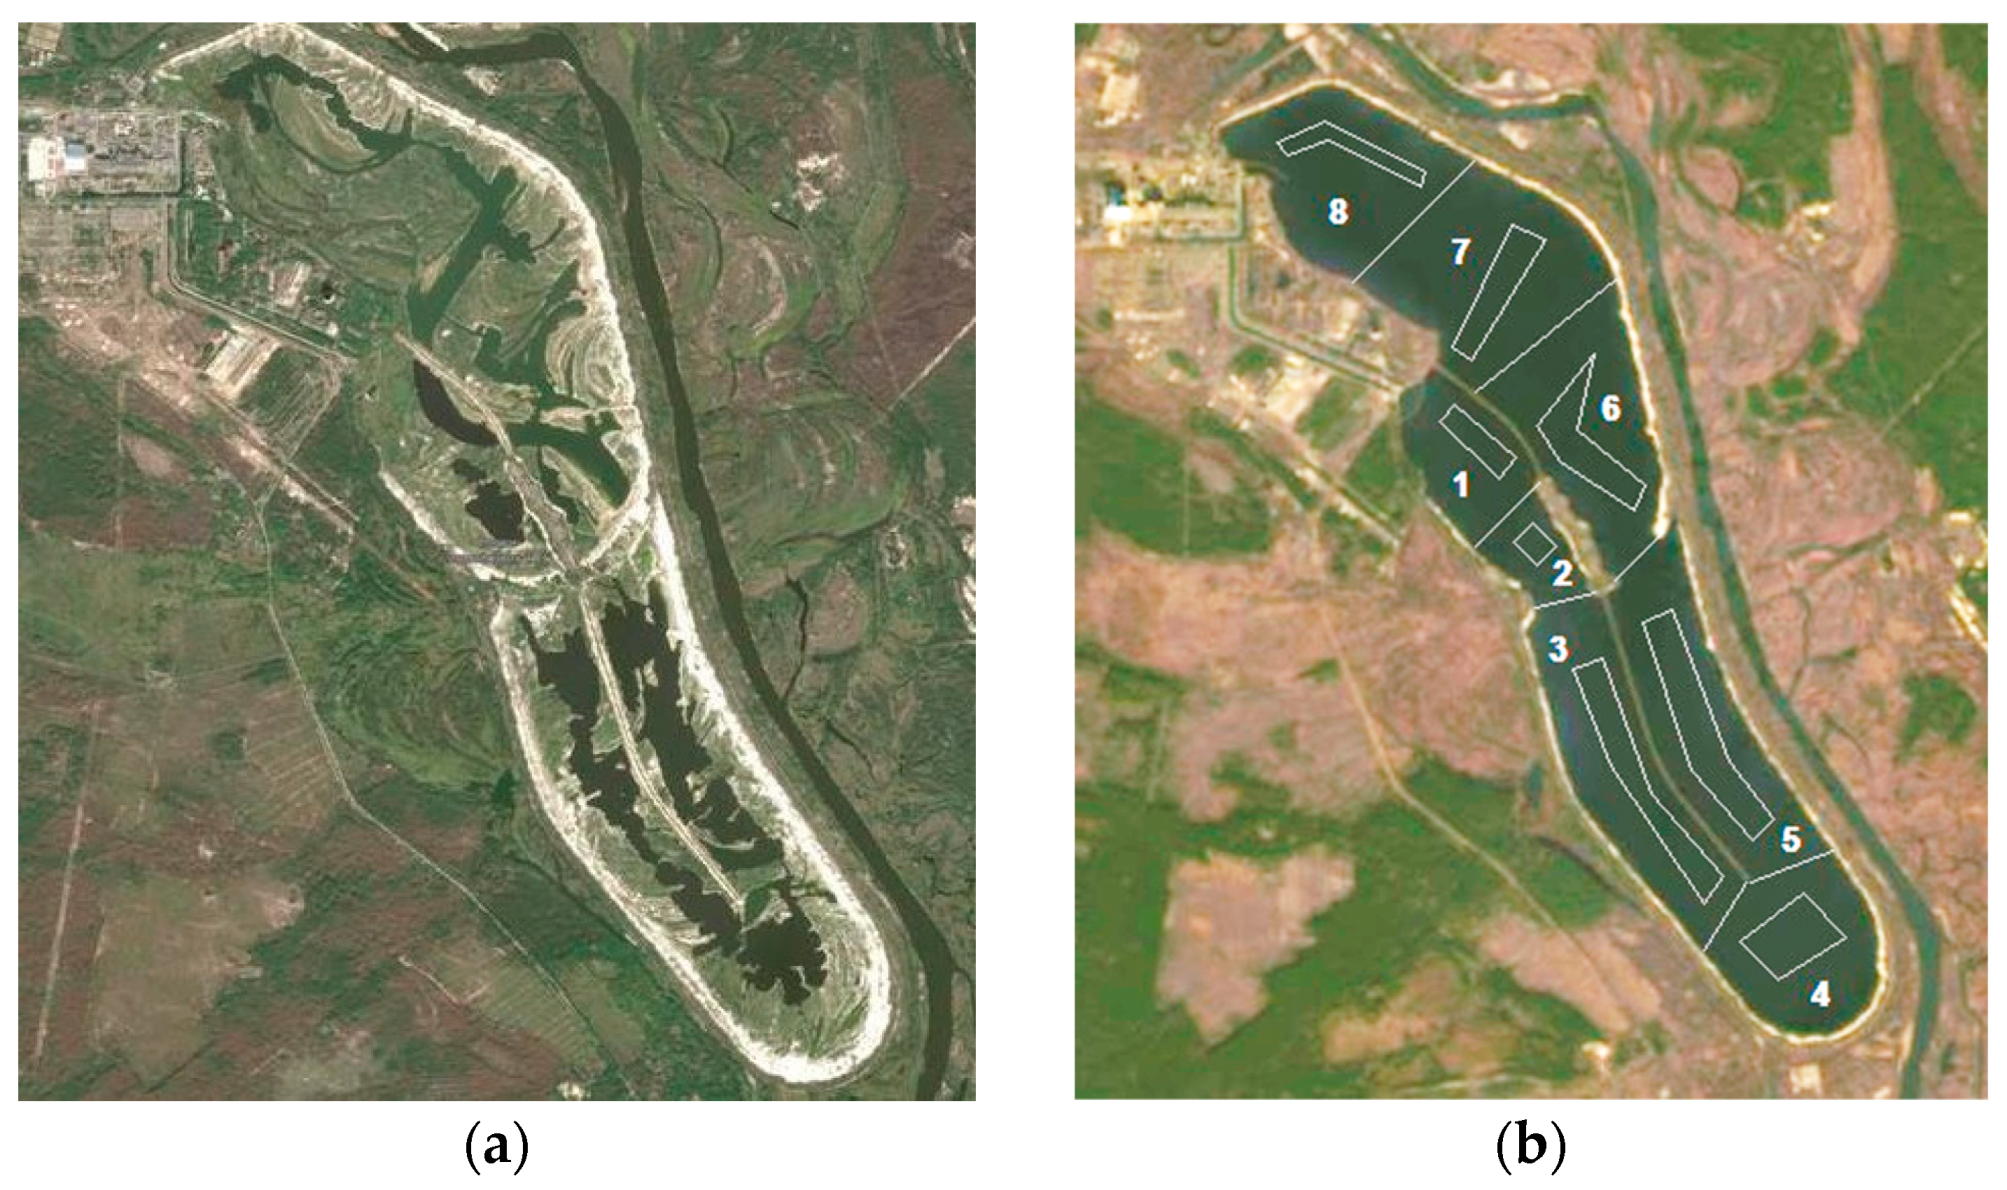
| Sector | 1 | 2 | 3 | 4 | 5 | 6 | 7 | 8 |
|---|---|---|---|---|---|---|---|---|
| Activity based on model results, TBq | 8.5 | 6.3 | 22.8 | 23.4 | 25.6 | 22.6 | 18.2 | 23.2 |
| Activity based on measurement data, TBq | 11.0 | 25.1 | 58.8 | 25.3 | 38.0 | 19.6 | 25.4 | 20.0 |
| Sector | 1 | 2 | 3 | 4 | 5 | 6 | 7 | 8 |
|---|---|---|---|---|---|---|---|---|
| Activity based on model results, TBq | 0.47 | 0.36 | 1.36 | 1.46 | 1.63 | 1.30 | 1.04 | 1.30 |
| Activity based on measurement data, TBq | 3.21 | 4.80 | 13.1 | 3.95 | 4.70 | 3.02 | 4.00 | 3.80 |
Disclaimer/Publisher’s Note: The statements, opinions and data contained in all publications are solely those of the individual author(s) and contributor(s) and not of MDPI and/or the editor(s). MDPI and/or the editor(s) disclaim responsibility for any injury to people or property resulting from any ideas, methods, instructions or products referred to in the content. |
© 2023 by the authors. Licensee MDPI, Basel, Switzerland. This article is an open access article distributed under the terms and conditions of the Creative Commons Attribution (CC BY) license (https://creativecommons.org/licenses/by/4.0/).
Share and Cite
Bezhenar, R.; Zheleznyak, M.; Kanivets, V.; Protsak, V.; Gudkov, D.; Kaglyan, A.; Kirieiev, S.; Gusyev, M.; Wada, T.; Udovenko, O.; et al. Modelling of the Fate of 137Cs and 90Sr in the Chornobyl Nuclear Power Plant Cooling Pond before and after the Water Level Drawdown. Water 2023, 15, 1504. https://doi.org/10.3390/w15081504
Bezhenar R, Zheleznyak M, Kanivets V, Protsak V, Gudkov D, Kaglyan A, Kirieiev S, Gusyev M, Wada T, Udovenko O, et al. Modelling of the Fate of 137Cs and 90Sr in the Chornobyl Nuclear Power Plant Cooling Pond before and after the Water Level Drawdown. Water. 2023; 15(8):1504. https://doi.org/10.3390/w15081504
Chicago/Turabian StyleBezhenar, Roman, Mark Zheleznyak, Volodymyr Kanivets, Valentyn Protsak, Dmitri Gudkov, Alexander Kaglyan, Serhii Kirieiev, Maksym Gusyev, Toshihiro Wada, Oleg Udovenko, and et al. 2023. "Modelling of the Fate of 137Cs and 90Sr in the Chornobyl Nuclear Power Plant Cooling Pond before and after the Water Level Drawdown" Water 15, no. 8: 1504. https://doi.org/10.3390/w15081504