Article

System Dynamics Approach for Water Resources Management: A Case Study from the Souss-Massa Basin

by
Ayoub Guemouria
1,*,
Abdelghani Chehbouni
1,2,
Salwa Belaqziz
3,4,
Terence Epule Epule
1,
Yassine Ait Brahim
1,
El Mahdi El Khalki
1,
Driss Dhiba
1 and
Lhoussaine Bouchaou
1,5
1
International Water Research Institute, Mohammed VI Polytechnic University, Benguerir 43150, Morocco
2
Institut de Recherche pour le Développement, Unité Mixte de Recherche, Centre d’études Spatiales de la Biosphère, 31400 Toulouse, France
3
Center for Remote Sensing Applications, Mohammed VI Polytechnic University, Benguerir 43150, Morocco
4
LabSIV Laboratory, Department of Computer Science, Faculty of Science, Ibn Zohr University, Agadir 80000, Morocco
5
Laboratory of Applied Geology and Geo-Environment, Faculty of Science, Ibn Zohr University, Agadir 80000, Morocco
*
Author to whom correspondence should be addressed.
Water 2023, 15(8), 1506; https://doi.org/10.3390/w15081506
Submission received: 16 December 2022 / Revised: 3 March 2023 / Accepted: 4 April 2023 / Published: 12 April 2023
(This article belongs to the Section Water Resources Management, Policy and Governance)

Abstract

:
In several areas, many social, economic, and physical subsystems interact around water resources. Integrated water management is applied to maximize economic and social welfare in an equitable manner without compromising the sustainability of vital ecosystems, mainly in hydrologic-stressed areas. The Souss-Massa basin, with its semi-arid climate, has a significant demand for agricultural, industrial, tourism, and domestic water. It constitutes a complex system where the lack of knowledge of all the interacting subsystems has led to a shortage of water in quantity and quality. The objective of this study is to investigate the interactions between supply and demand at different stages using a System Dynamics (SD) approach. The model developed promotes a holistic understanding of the interactions between the different problem indicators that operate in water resources management in order to support decision-making action and successfully manage water resources at the Souss-Massa basin scale. The chosen performance indicator is based on the achievement of a baseline sustainability index (SI) defined as the ratio of available water to supply water that should be higher than 20% to avoid a water stress situation. The multisource data were gathered from different government agencies for the period spanning between 2007 and 2020. The results showed that the current policies do not lead to sustainable water management. Groundwater withdrawals have increased considerably, from 747 Mm3 in 2007 to 4884 Mm3 in 2020. The balance between water supply and demand is only reached for three years, 2010, 2015, and 2018, without ever reaching an SI of 20%. The sensitivity analysis showed that the sustainability of water resources in the Souss-Massa basin is mainly impacted by the availability of surface water, irrigated areas, and irrigation efficiency. This study will be of great interest to policymakers to provide optimal and sustainable water management strategies based on improved water use efficiency, and to contribute to the sustainable development agenda in arid and semi-arid regions.

1. Introduction

Water scarcity is an urgent issue that can impose significant constraints on development. According to the World Water Assessment Program established by UNESCO [1], nearly half of the world’s population will live in areas of high water stress by 2030, and only 60% of our planet’s water needs will be met. In addition, drought in arid and semi-arid regions will push between 24 and 700 million people to move, leading to growing inequalities and tensions [2]. Africa is a continent of water paradoxes. Although it has abundant renewable water resources estimated at more than 5400 billion m3 per year, only 4% of this potential is mobilized for current uses, and more than 300 million people do not have access to drinking water [3]. Increasing water demand due to population growth and water uses threatens to increase pressure on water resources [4]. Climate change makes the situation even more critical [5]. This vulnerability is related to the importance of the agricultural sector and food security, their place in the economy, and the lack of effective mitigation and adaptation measures [6].
Numerous integrated water resources management (IWRM) models have been developed to determine water supply, to estimate the evolution of water demand, and to apply evolution scenarios in order to evaluate the satisfaction of needs in the future.
On a global scale, the most widely used model is the WaterGAP (Water Global Analysis and Prognosis) model. This model compares the availability and demand of water resources on a global scale, taking into account climate change and anthropogenic effects [7]. The spatial resolution of this model does not allow it to be used at the watershed scale, which is the local unit of water resource management.
On a local scale, there are many models that work in a similar way. These models aim to compare the water supply and demand of different users, to take into account ecological needs, to provide methods for managing dams for storage in anticipation of needs, and to support low water flows. Some of these models apply optimization methods, while others are based solely on simulation. An example of a model for understanding water demand satisfaction is the Mike Basin model [8]. This model evaluates the distribution of water resources to meet demand and stream quality but does not provide prioritization rules between users. The Water Evaluation And Planning (WEAP) model [9] is one of the most widely used models [10] and has been shown to be one of the most successful models for reporting on the capacity to meet water demands. The model simulates a baseline water demand and supply management scenario and then evaluates the change in the demand satisfaction rate. It also includes a water quality module, an ecosystem preservation module, and an economic module to evaluate the costs of water supply systems. The RIBASIM model [11] is a set of generic models to simulate the behavior of watersheds under various hydrological conditions. The model compares current and future water supply and demand at different time horizons [12]. It also assesses agricultural production and crop damage in the event of water shortage. The SWAT model [13] analyzes numerous hydrologic and agronomic data to predict the effects of land management on water resources. WAPOR, which stands for Water Productivity through Open access of Remotely sensed data, uses satellite data to measure water productivity in different sectors. As part of water accounting, WAPOR provides water managers with an overview of water use, identifies areas of high pressure on water resources, and assesses potential impacts on the environment and local communities. This will enable more effective and sustainable water management measures to be planned and implemented.
While all of these models are powerful tools for water management, they have limitations that must be considered when using them and interpreting the results. They are complex and require technical expertise to be used effectively. In addition, they require accurate and timely data and sometimes depend on the quality of satellite data that can be affected by adverse weather conditions and instrumentation errors. Furthermore, they are costly and have limitations in modeling some aspects of water management, such as groundwater management, water quality, agricultural practices, soil quality, and interactions between different water users.
Morocco, like many developing countries, is strongly affected by water scarcity. Its water resources are characterized by temporal irregularity and spatial variability. They are highly concentrated in the north of the country, and the remaining 49% is shared by 92.4% of the country [14]. In recent years, sustainable development has become a global ambition. The United Nations’ sustainable development goal (SDG) 6 aims to ensure the availability and sustainable management of water and sanitation for all people [15]. In Morocco, a sustainable water supply will need to be ensured to avoid excessive groundwater depletion [16] and, ideally, with effective wastewater treatment [17]. Morocco is one of the major arid climate countries whose water resources are highly vulnerable to global changes [18,19,20,21]. Most of Morocco’s watersheds suffer from water stress, and planners are generally challenged in achieving a sustainable water supply [22]. For example, the basins of Oum Er-Rbia, Souss-Massa, and Tensift suffer from an annual deficit of 560 Mm3, 271 Mm3, and 168 Mm3, respectively [23]. This challenge is particularly prevalent in the arid and semi-arid areas of Morocco [24,25]. Watersheds are faced with the dilemma of meeting the growing demand for water for domestic, agricultural, industrial, and touristic uses while preserving the sustainability of water resources as well as the environment [26].
The socioeconomic changes that Morocco has experienced in recent years in most sectors are expected to continue in the future [27,28]. There is, therefore, a real concern about balancing the growing demand for water while protecting the resources and the associated ecosystems [29,30]. For several years, Morocco has been implementing a policy of water mobilization and control [31]. Various measures have been adopted, including decentralized watershed management and the search for nonconventional water sources, such as seawater desalination and wastewater reuse [32]. Morocco has developed the national drinking water supply and irrigation program (2020–2027) within the national water plan (2020–2050). Resource planning is currently based on a master plan for sustainable development of the different basins (PDAIRE), which is evaluated and updated in accordance with the national water plan and the national water strategy. In the agricultural sector, Morocco adopted a new agricultural development strategy in 2008, The Green Morocco Plan (GMP), which was consolidated by the Green Generation Strategy (2020–2030) [33].
At the scale of the Souss-Massa basin, many studies have been conducted to assess the variability of water supply and demand. Seif-Ennasr et al. [34] analyzed the water balance of the Souss and Chtouka aquifers and found a deficit that varies from 100 Mm3/year to 370 Mm3/year and 60 Mm3/year, respectively. Hssaisoune et al. [35] have shown that the future of the basin’s water resources depends on good planning and coordinated management focused on conservation and preservation. The legislative framework should be strengthened, and nonconventional water use should be supported for regional sustainability and climate change mitigation [36]. Diaz and Perez [37] studied climate change projections in the Souss-Massa basin for the periods 2045–2055 and 2090–2100. The results confirmed that for the RCP 4.5 and RCP 8.5 scenarios, maximum and minimum temperatures will increase by 1.5 and 2.5 °C over the period 2045–2055. In 2090–2100, temperatures will likely increase by 3 and 6 °C. The main changes in precipitation were observed in the period 2090–2100, with a reduction of 40 mm/year and 120 mm/year, respectively. Seif-Ennasr et al. [38] showed that the most pessimistic 2030–2050 simulations predict a reduction in Youssef Ibn Tachefine dam storage of 77% and 80% under RCP 4.5 and RCP 8.5 scenarios, respectively. In addition, the natural aquifer recharge will decrease by 54% and 80% under RCP 4.5 and RCP 8.5 scenarios, respectively.
Agriculture in the Souss-Massa occupies an important place in the regional and national economic sectors. Several studies have been conducted to evaluate water use by agriculture. Elame et al. [39] showed that water pricing on surface water forces farmers to use water more efficiently, but those who combine surface and groundwater have no restrictions on water pumping, and, therefore, value this resource less. Seif-Ennasr et al. [40] showed that suitable land would decrease by 23% under RCP 8.5 and 9% under RCP 4.5. On the other hand, Choukr-Allah et al. [41] showed that global changes are determining factors for holistic water management in the Souss-Massa basin. In the face of water scarcity in the basin, the authors established a management master plan discussion based on three scenarios: no action, catastrophic social and economic disaster, and moderate intervention that stabilizes groundwater volume. Mansir et al. [42] used physical and socioeconomic variables to develop a vulnerability map that shows that the Souss-Massa basin is highly vulnerable and has reached high levels of overexploitation of water resources.
The traditional methods of water resource management used in the Souss-Massa basin, and in Morocco in general, remain technical and have limitations. This is because decision-makers use a linear mental model of problems, which assumes simple cause-and-effect relationships between system components and focuses on progressively narrower model boundaries to isolate components [43]. Such isolation exposes any analysis to the risk of not adequately recognizing the root causes of problems or incorporating all relevant factors at play, which could lead to biased recommendations regarding strategy or policy implementation [44,45]. Selecting an appropriate water resource management policy is complicated by climate characteristics (variability in precipitation amount and distribution patterns), connectivity between surface and groundwater, storage in natural and artificial reservoirs, population growth, and demand, among other factors [46,47].
Moreover, conventional methods do not provide a clear understanding of how the different systems that influence water resources management are interconnected and do not consider the feedback process and the nonlinear dynamic behavior of the system [48]. Furthermore, they are largely based on a reductionist and mechanistic approach and are considered ill-equipped to deal with the inherent complexity of the many systems involved in water resources management [49,50]. Challenges stem primarily from the integration of socioeconomic perspectives with technical elements, making systems difficult to simplify [51,52,53].
Our study, the first of its kind in Morocco, used the SD approach to evaluate sectoral policies applied to the period spanning between 2007 and 2020, and will serve as a basis for developing future sustainable scenarios. A sustainability index (SI) was used to diagnose the sustainability of water resources in the Souss-Massa basin. Then, a conceptual model regrouping the different interconnected parameters acting on water supply and demand was developed to help decision-makers identify appropriate solutions to meet a variety of development needs while maintaining sustainability objectives. Finally, a sensitivity analysis was performed to identify the parameters that most influence the system in order to move from a global model to a robust and reliable model.

2. Materials and Methods
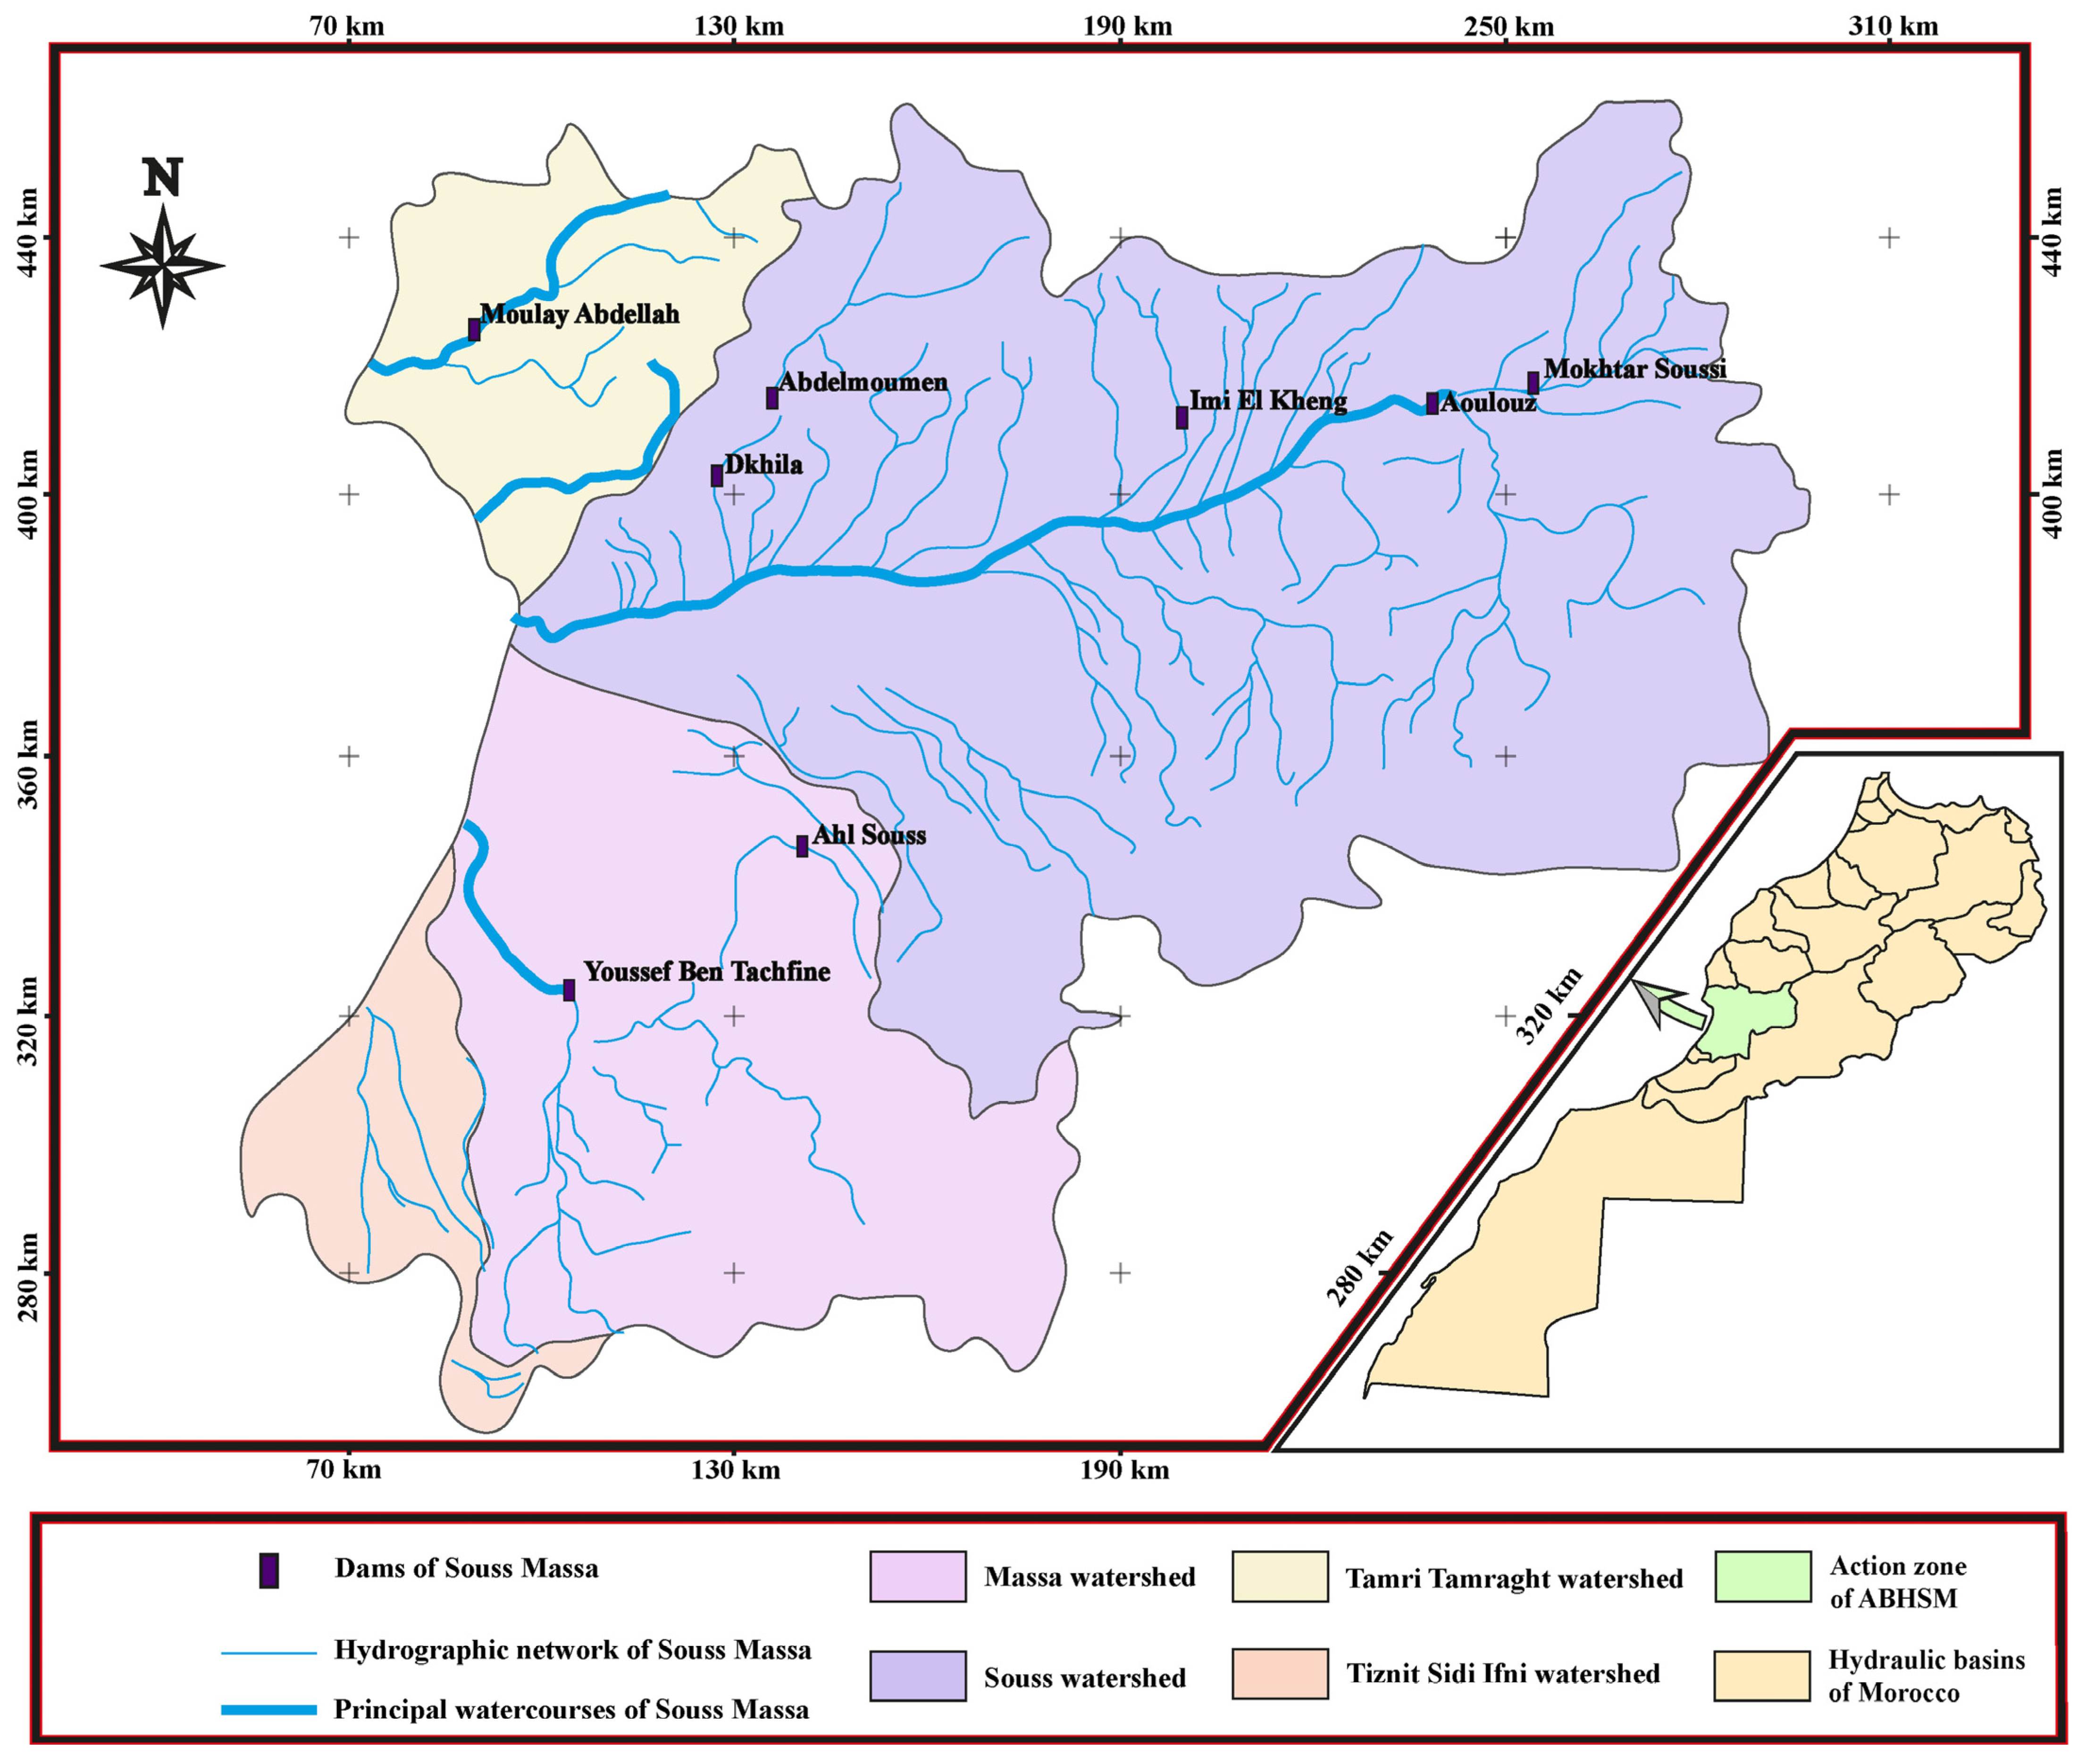
2.1. Study Area

The area of Souss-Massa basin is approximately 27,800 km2. It is bounded to the north by the Tensift basin, to the east and south by the Draa basin, and to the west by its 200 km long Atlantic coastline. The climate of the region is mainly arid, mitigated by the proximity of the ocean and the influence of the cold current. Average annual rainfall varies from 600 mm in the north, on the peaks of the High Atlas, to 150 mm in the south, in the eastern part of the Anti-Atlas. The plain receives about 200 mm of rainfall [54,55,56]. According to the latest census of 2014, the study area has a population of 2,800,035 inhabitants, which is nearly 8% of the total population of Morocco, with an average growth rate of 1.41% per year [57]. In order to secure water demand over the basin, Souss-Massa has 8 major dams (Figure 1) with an estimated overall storage capacity of nearly 718 Mm3. These dams regulate 364 Mm3/year of total surface water inflow. The main basins in the region are Souss, Massa, Tamri and Tamraght, and Tiznit-Sidi Ifni (Figure 1).
The Souss-Massa basin has a natural supply of 1023 Mm3/year (668 Mm3/year of surface water resources and 425 Mm3/year of groundwater resources). Water withdrawals in the basin amount to 425 Mm3/year for surface water and 696 Mm3/year for groundwater, resulting in water stress of 271 Mm3/year. In addition, 93% of the basin’s water resources are exploited for agriculture, of which 65% is extracted from groundwater, while only 7% is available for drinking water and industrial use. Available water per capita is about 300 m3 per capita per year, which is significantly below the scarcity threshold set by the United Nations at 1000 m3 per capita per year [58].

2.2. Modeling Approach

SD modeling is an approach for studying the evolution and behavior of system components and their interactions [59,60,61,62] first proposed by J. W. Forrester at the Massachusetts Institute of Technology (MIT) in 1950 and subsequently developed by [63,64,65,66]. The first SD model incorporating water resource management relationships was developed in the World 3 model [67] and updated by [68,69]. Currently, SD has evolved from continuous applications and stability of differential equations to continuous nonlinear group actions [70,71]. The main idea is feedback on the operation of processes [72,73,74,75].
The choice of the SD approach is justified by the fact that it has several advantages. SD is a flexible method for studying complex behavior over time by transforming the entire system into an interconnected series of stocks and flows [76,77]. Stocks represent accumulations [78,79]. Inputs and outputs change the stock level during the given time step and are influenced by the current stock levels of the system [80,81].
Auxiliary functions can take many mathematical functions and lags, each connected by an information link. The clouds represent the limits of the model, while the shadows represent the variables used. The symbol “R” represents reinforcing (or positive) feedback, while the symbol “B” represents balancing (or negative) feedback processes [82,83,84,85]. When the model is difficult to simulate with adequate software, it is necessary to proceed with dynamic modeling by analogy, which consists in substituting the initial model with a model of the same structure but less cumbersome [86,87].
Integrated models can be developed to be truly complete with the application of scenarios leading to technical optimization [88,89,90]. Three basic steps need to be followed to achieve satisfactory results: (1) problem identification and definition, (2) system conceptualization, and (3) model formulation [91,92,93,94,95]. Once the model is defined, simulation and calibration tests should be performed before the model is validated, then scenarios should be developed and evaluated, and finally, the system should be approved, and the most appropriate strategy should be designed [96,97,98]. The model established is intended for modeling the water resources of the Souss-Massa basin and can be extended to other watersheds. It is a hydro-socioeconomic model that can provide complete integrated modeling of quantitative and qualitative indicators. It uses many feedback relationships between different subsystems. It will explicitly highlight the dynamic feedback between the physical characteristics of the water balance, population growth, and agricultural and industrial development with the use of other nonconventional resources.

2.3. Literature Review on SD for Water Resources Management

SD is a promising option that offers several qualitative and quantitative tools to identify and explain the behavior of systems over time [99,100]. It provides an opportunity to explore new tools for representing the complex relationships associated with water resource systems [101,102,103,104,105]. Scientists have been using SD for water resources management since the 1980s with applications on small-scale hydroelectric analyses [106]. The various applications of SD to water resource management problems can generally be classified into two categories: (1) watershed-scale water resource planning problems (to better understand the current situation and/or inform stakeholders of the current state of the system) [107,108,109,110,111,112,113] and (2) scenario analyses of economic or policy impacts on water resources (to explore the behavior of the current system given changed conditions or alternative strategies) [114,115,116,117,118,119,120].
In real-world situations, planning and analysis are often performed in tandem, as they are each a step in the resource management process. Compared to integrated water resources management, the SD approach is more advantageous for indicating how different baseline changes affect the system in the future [121,122,123]. It is, therefore, particularly useful for representing complex systems with strong influences from social or economic elements [124,125]. Most applications of SD in the water resources domain [126,127,128,129,130,131,132] have focused on the use of the qualitative modeling tools of this method. Authors [133,134] consider the conceptualization or reflection phase of integrated water resources studies to be of paramount importance, as it provides a fundamental understanding of the options that can be used to achieve sustainable solutions. Authors [135] and [136] show that reliable qualitative models can be developed to help identify trends and provide insight into the drivers of multifaceted water resource problems, thus facilitating the formulation of preventive and sustainable strategies.

2.4. Data Collection

The design of the conceptual framework and feedback loops requires a clear definition and collection of the key factors that affect sustainable development, as well as ways to visualize the relationships between them. However, there are multiple interacting subsystems that tend to influence the sustainable development of water resources, namely: population growth, technological advances, industrial development in agriculture and tourism, trade, and economic growth (Table 1).
The hydro-climatic data were collected from the Souss-Massa Hydraulic Basin Agency (ABHSM). The data received are the historical daily rainfall of 16 rain gauges. From these, we obtained the monthly rainfall, and then the annual rainfall of each rain gauge. The surface waters (m3) are those of the 8 main dams in the Souss-Massa region. The population census data between 2004 and 2014 (conducted every 10 years) were collected from the High Commission for Planning (HCP), while considering the urban and rural populations following the new administrative division of the region. The water consumption per capita (m3/capita) was obtained from the National Office of Drinking Water and Electricity (ONEP). The connection rates in rural and urban areas were provided by the Agadir autonomous multiservice company (RAMSA). The data on the number of tourists were recorded by the Ministry of Tourism and the Regional Tourism Centre (CRT). The water consumption per tourist (m3/tourist) in the main tourist establishments was provided by RAMSA. For recycled water (m3), the quantity treated and reused were considered, not the quantity treated alone. The data collection allowed us to identify the different subsystems that influence water resources management in the Souss-Massa basin and to highlight the parameters on which each of them depends. This will allow the development of a global conceptual framework based on the key equations of the water balance.

2.5. Data Analysis

2.5.1. Quantitative Data Analysis

Once the data were collected, they were analyzed. Justified estimates were made to fill in data gaps to address the research problem.
There is a lack of evenly spaced rain gauges throughout the basin. In order to solve this issue, the Thiessen method was used to calculate for each subbasin the monthly precipitation data. This method is defined as follows:
Pmoy = PiSi S
where:
  • Pi: rainfall at station i (mm).
  • Si: area of influence of rain gauge i (Km2).
  • S: watershed area (Km2).
Data on groundwater recharge from precipitation are limited. In order to solve this issue, the following formula was used:
GWR = β × P
where:
  • GWR: groundwater recharge (m3).
  • β: the average of the ratio of precipitation infiltration to total groundwater input during the years of record for each aquifer.
  • P: annual precipitation (mm).
Ref. [137] estimates groundwater recharge from riverine inflow at 20% of dam inflow and the average participation of infiltration in the recharge of the Souss, Massa, and Tiznit aquifers at 20.12%, 32.4%, and 37.25%, respectively. These three aquifers represent about 55% of the total recharge of the basin. For the percolation of surface water to groundwater, an infiltration coefficient of 20% was retained on average for all dams.
Data on the annual water consumption of each industrial unit are limited. To fill this data gap, an industrial development rate of 5% estimated by the HCP between 2007 and 2020 was used. This rate will have to be revised according to future major projects in the Souss-Massa region. The irrigated areas took between 148,640 ha in 2007 and 154,540 ha in 2010. Water consumption per hectare varied from 6687 m3/ha in 2007 to 6151 m3/ha in 2020 according to the project plan for the conversion of irrigated land. Evaporation has been estimated at 10% of the water stored in the dams. The groundwater contract provides for a halt to the expansion of irrigated areas. Although this measure has not been respected by the GMP and, due to the lack of precise data on surfaces each year, the model was simulated using data from the PDAIRE (2007) of the Souss-Massa basin, which provides for a freeze on irrigated areas and a switch to localized or gravity irrigation. This led to an overall decrease in irrigation water demand in the area (from 994 Mm3 in 2007 to 870 Mm3 in 2020).

2.5.2. Model Equations

It is necessary to formalize the problem to simulate it. This involves defining the equations that represent the system in motion. The water supply and demand balances are developed in the model. The stock–flow relationship can be represented mathematically as follows:
Stock ( t ) = t 0 tn [ Inflow ( t ) Outflow ( t ) ] dt + Stock ( t 0 )
where the inflows and outputs are the values of the inputs and outputs of the model between the initial time t0 and the current time t.
The total water demand equation is represented as follows:
WD(t) = Dom, D(t) + Touris, D(t) + Agri, D(t) + Ind, D(t)
where:
  • WD: total water demand.
  • Dom, D: domestic water demand.
  • Touris, D: tourism water demand.
  • Agri, D: agricultural water demand.
  • Ind, D: industrial water demand.
The total water supply equation is represented as follows:
WS(t) = ASW(t) + AGW(t)
The available surface water supply is represented as follows:
ASW(t) = NSW(t) + RW(t) + DW(t) + TRW(t) − E(t) − P(t)
The available groundwater supply is represented as follows:
AGW(t) = NGW(t) + IRW(t) + P(t)
where:
  • WS: total water supply.
  • NSW: natural surface water.
  • RW, DW, and TRW are the recycled, desalinated, and transferred water supplies.
  • E: evaporation.
  • ASW: available surface water supply.
  • NGW: natural groundwater supply.
  • IRW: irrigation return water.
  • P: percolation.
  • AGW: available groundwater supply.
We conclude that:
WS(t) = NSW(t) + RW(t) + DW(t) + TRW(t) + NGW(t) + IRW(t) − E(t)
The availability index assesses the availability of water. It is defined as follows:
AI = WS(t) − WD(t)
The sustainability index assesses the sustainability of water. It is defined as follows:
SI = WS ( t ) WD ( t ) WS ( t )
Ref. [138] suggested that a sustainability index greater than 20% belongs to water basins with little or no water stress. Detailed coding equations have been added to Appendix A.

3. Results

3.1. Modeling

The modeling process involves two main steps. The first step is the development of a conceptual model or Causal Loop Diagram (CLD) of the problem in which the model elements and the causal relationships between them have been identified. The second step is the development of a simulation model or Stock and Flow Diagram (SFD) of the problem based on the conceptual model and the actual data recorded in the area. At this level, the behavioral patterns of the various parameters can be observed in graphical and figure form to validate the CLD of the problem and build confidence in the model.

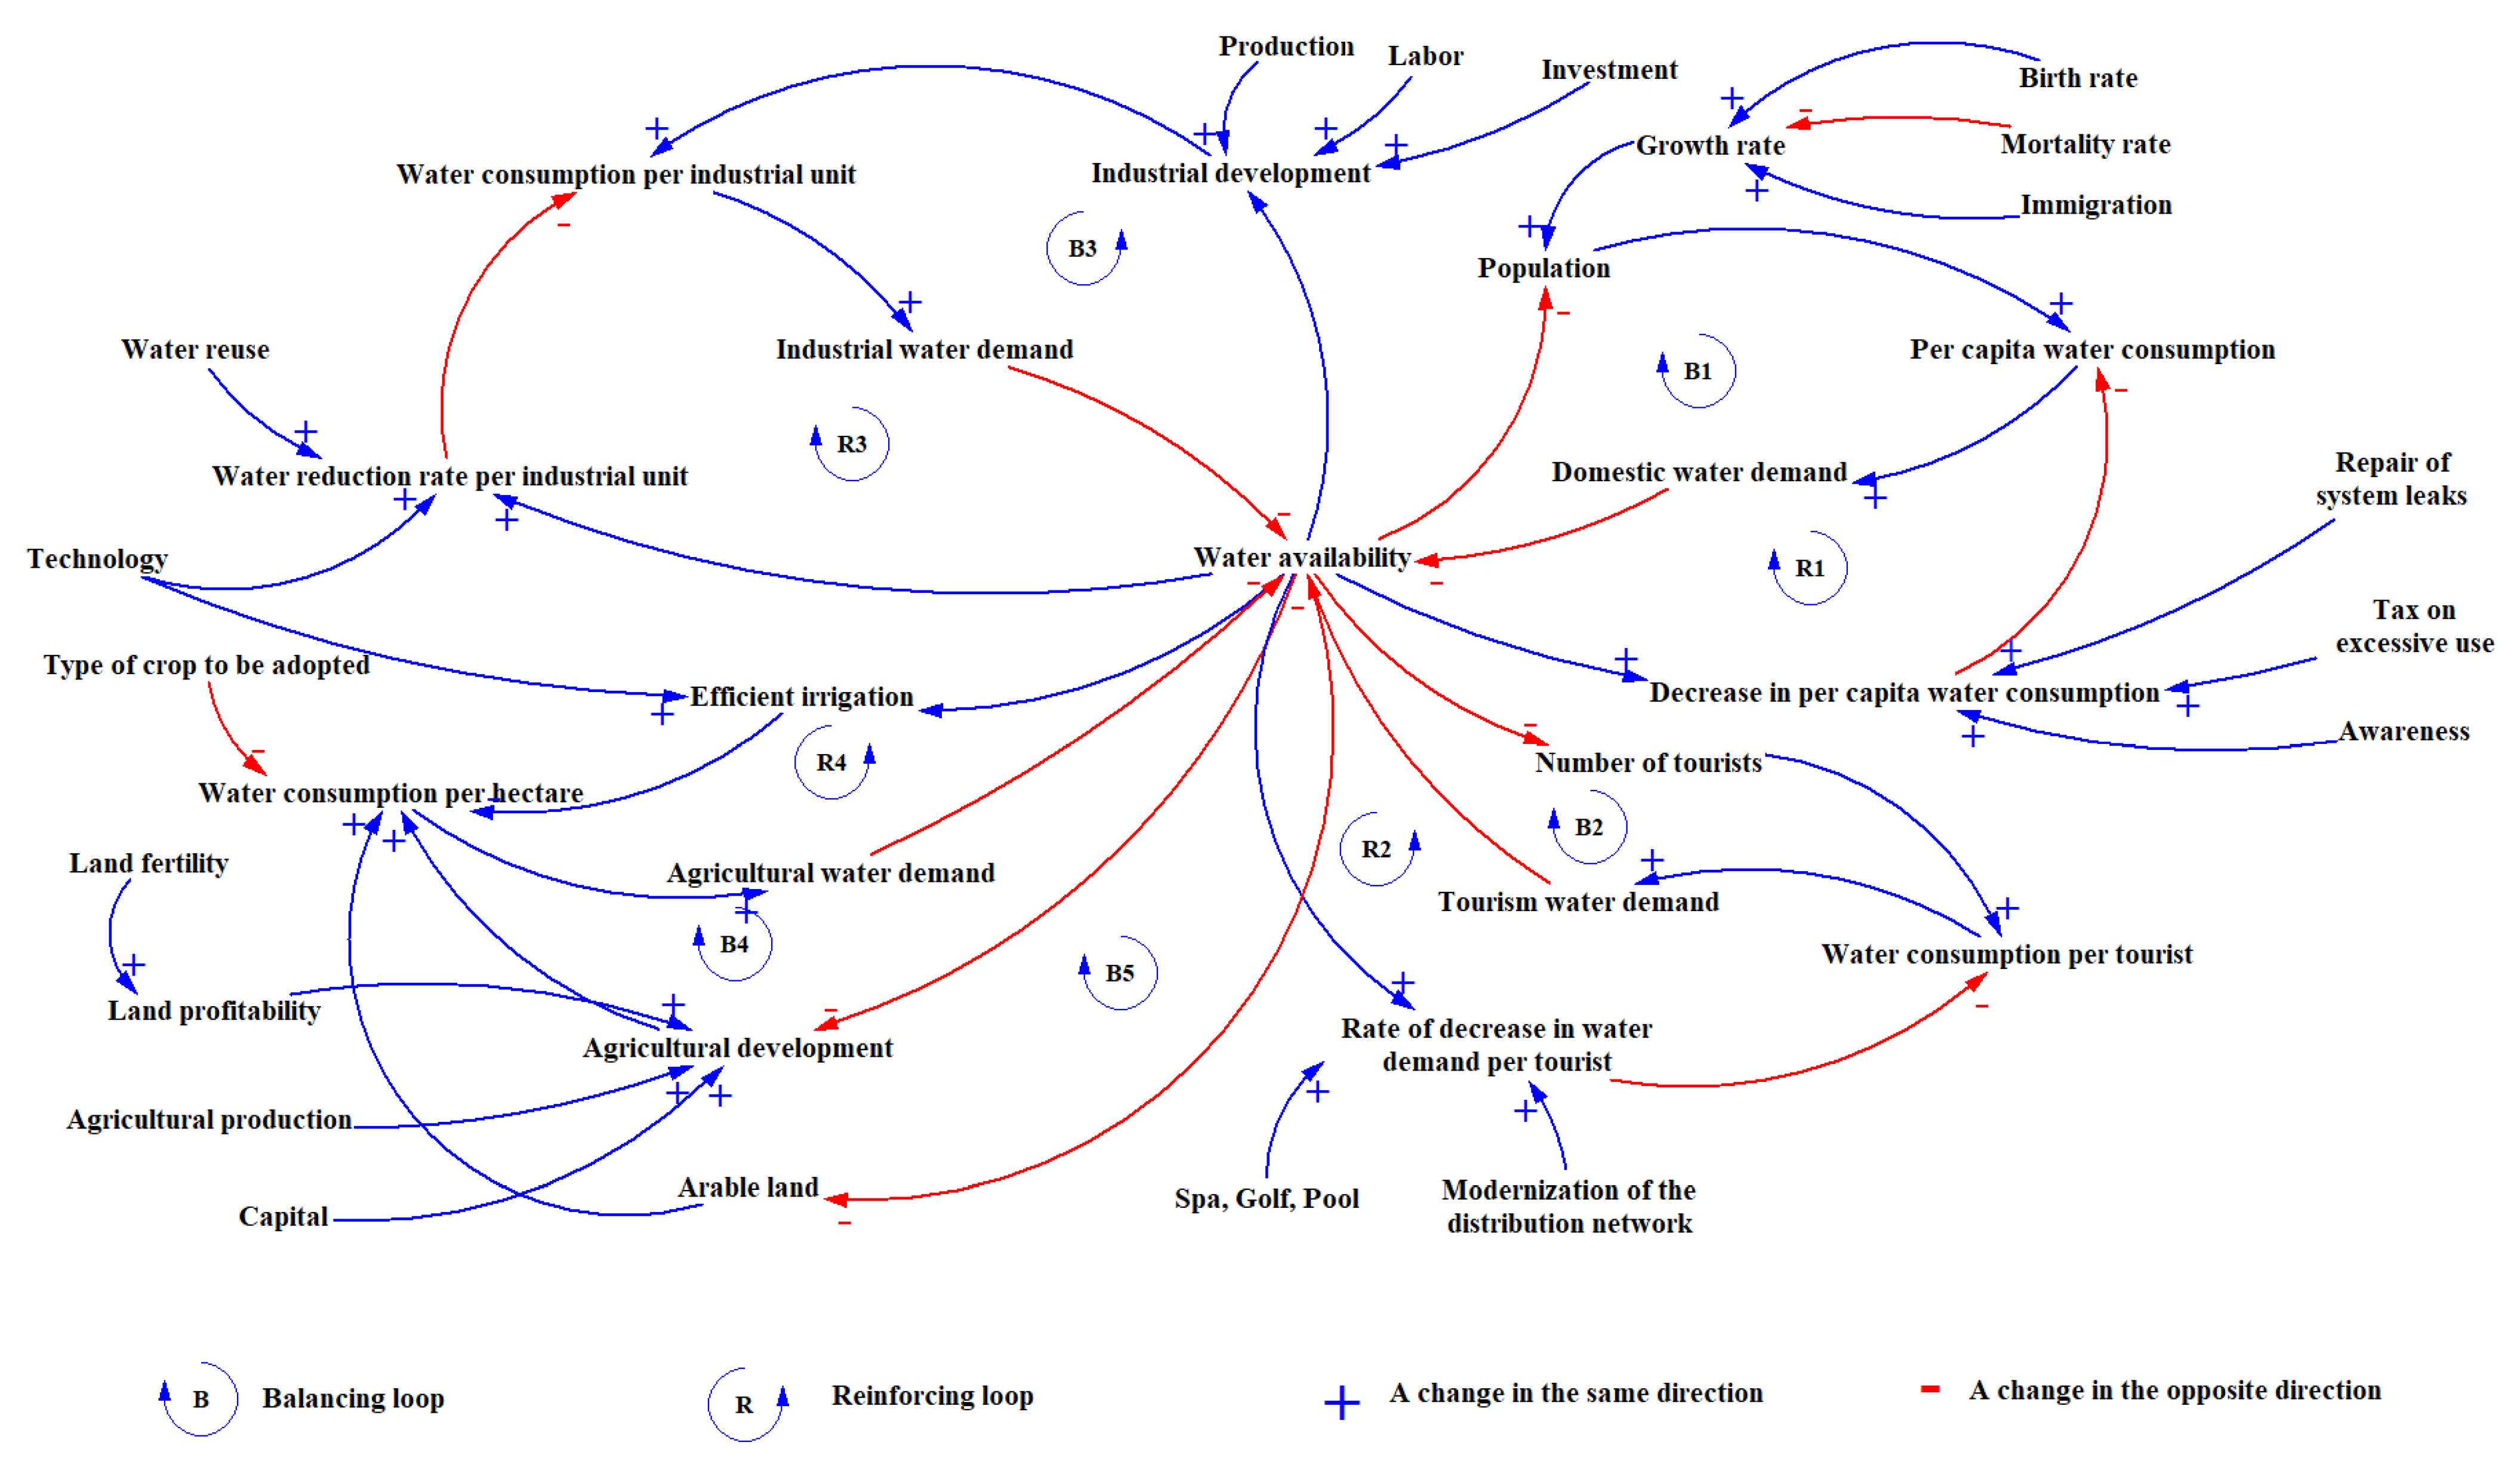
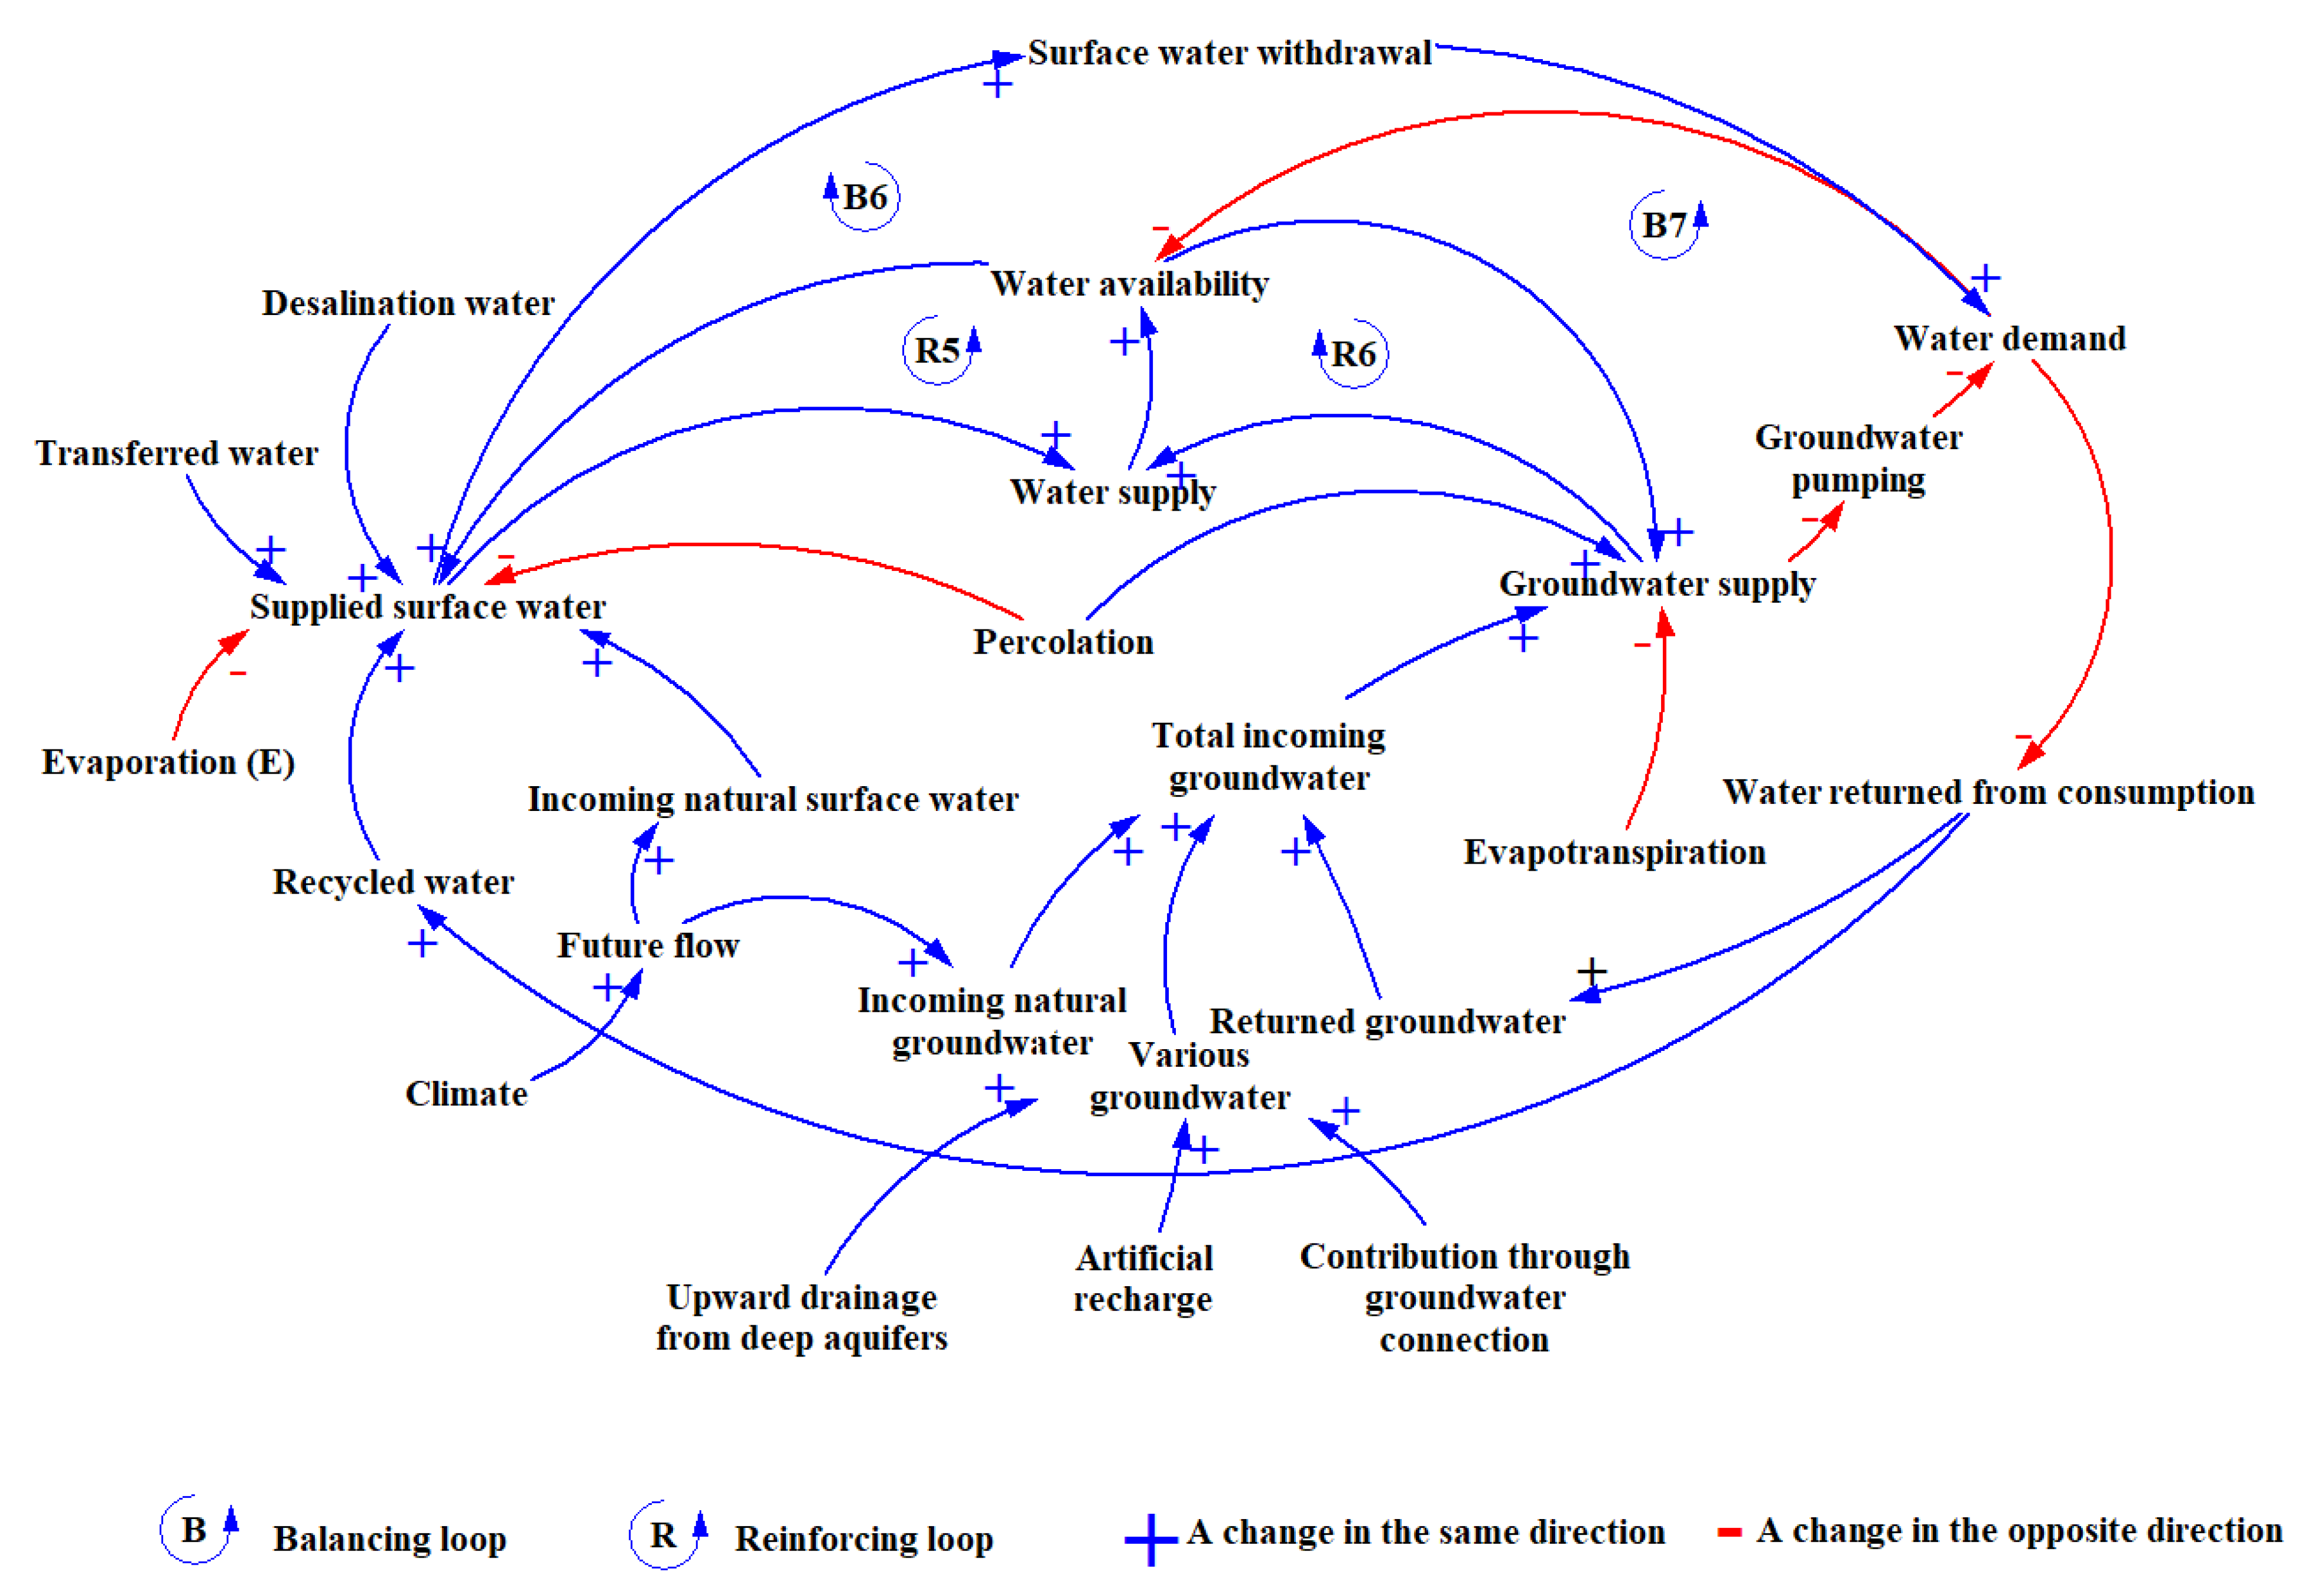
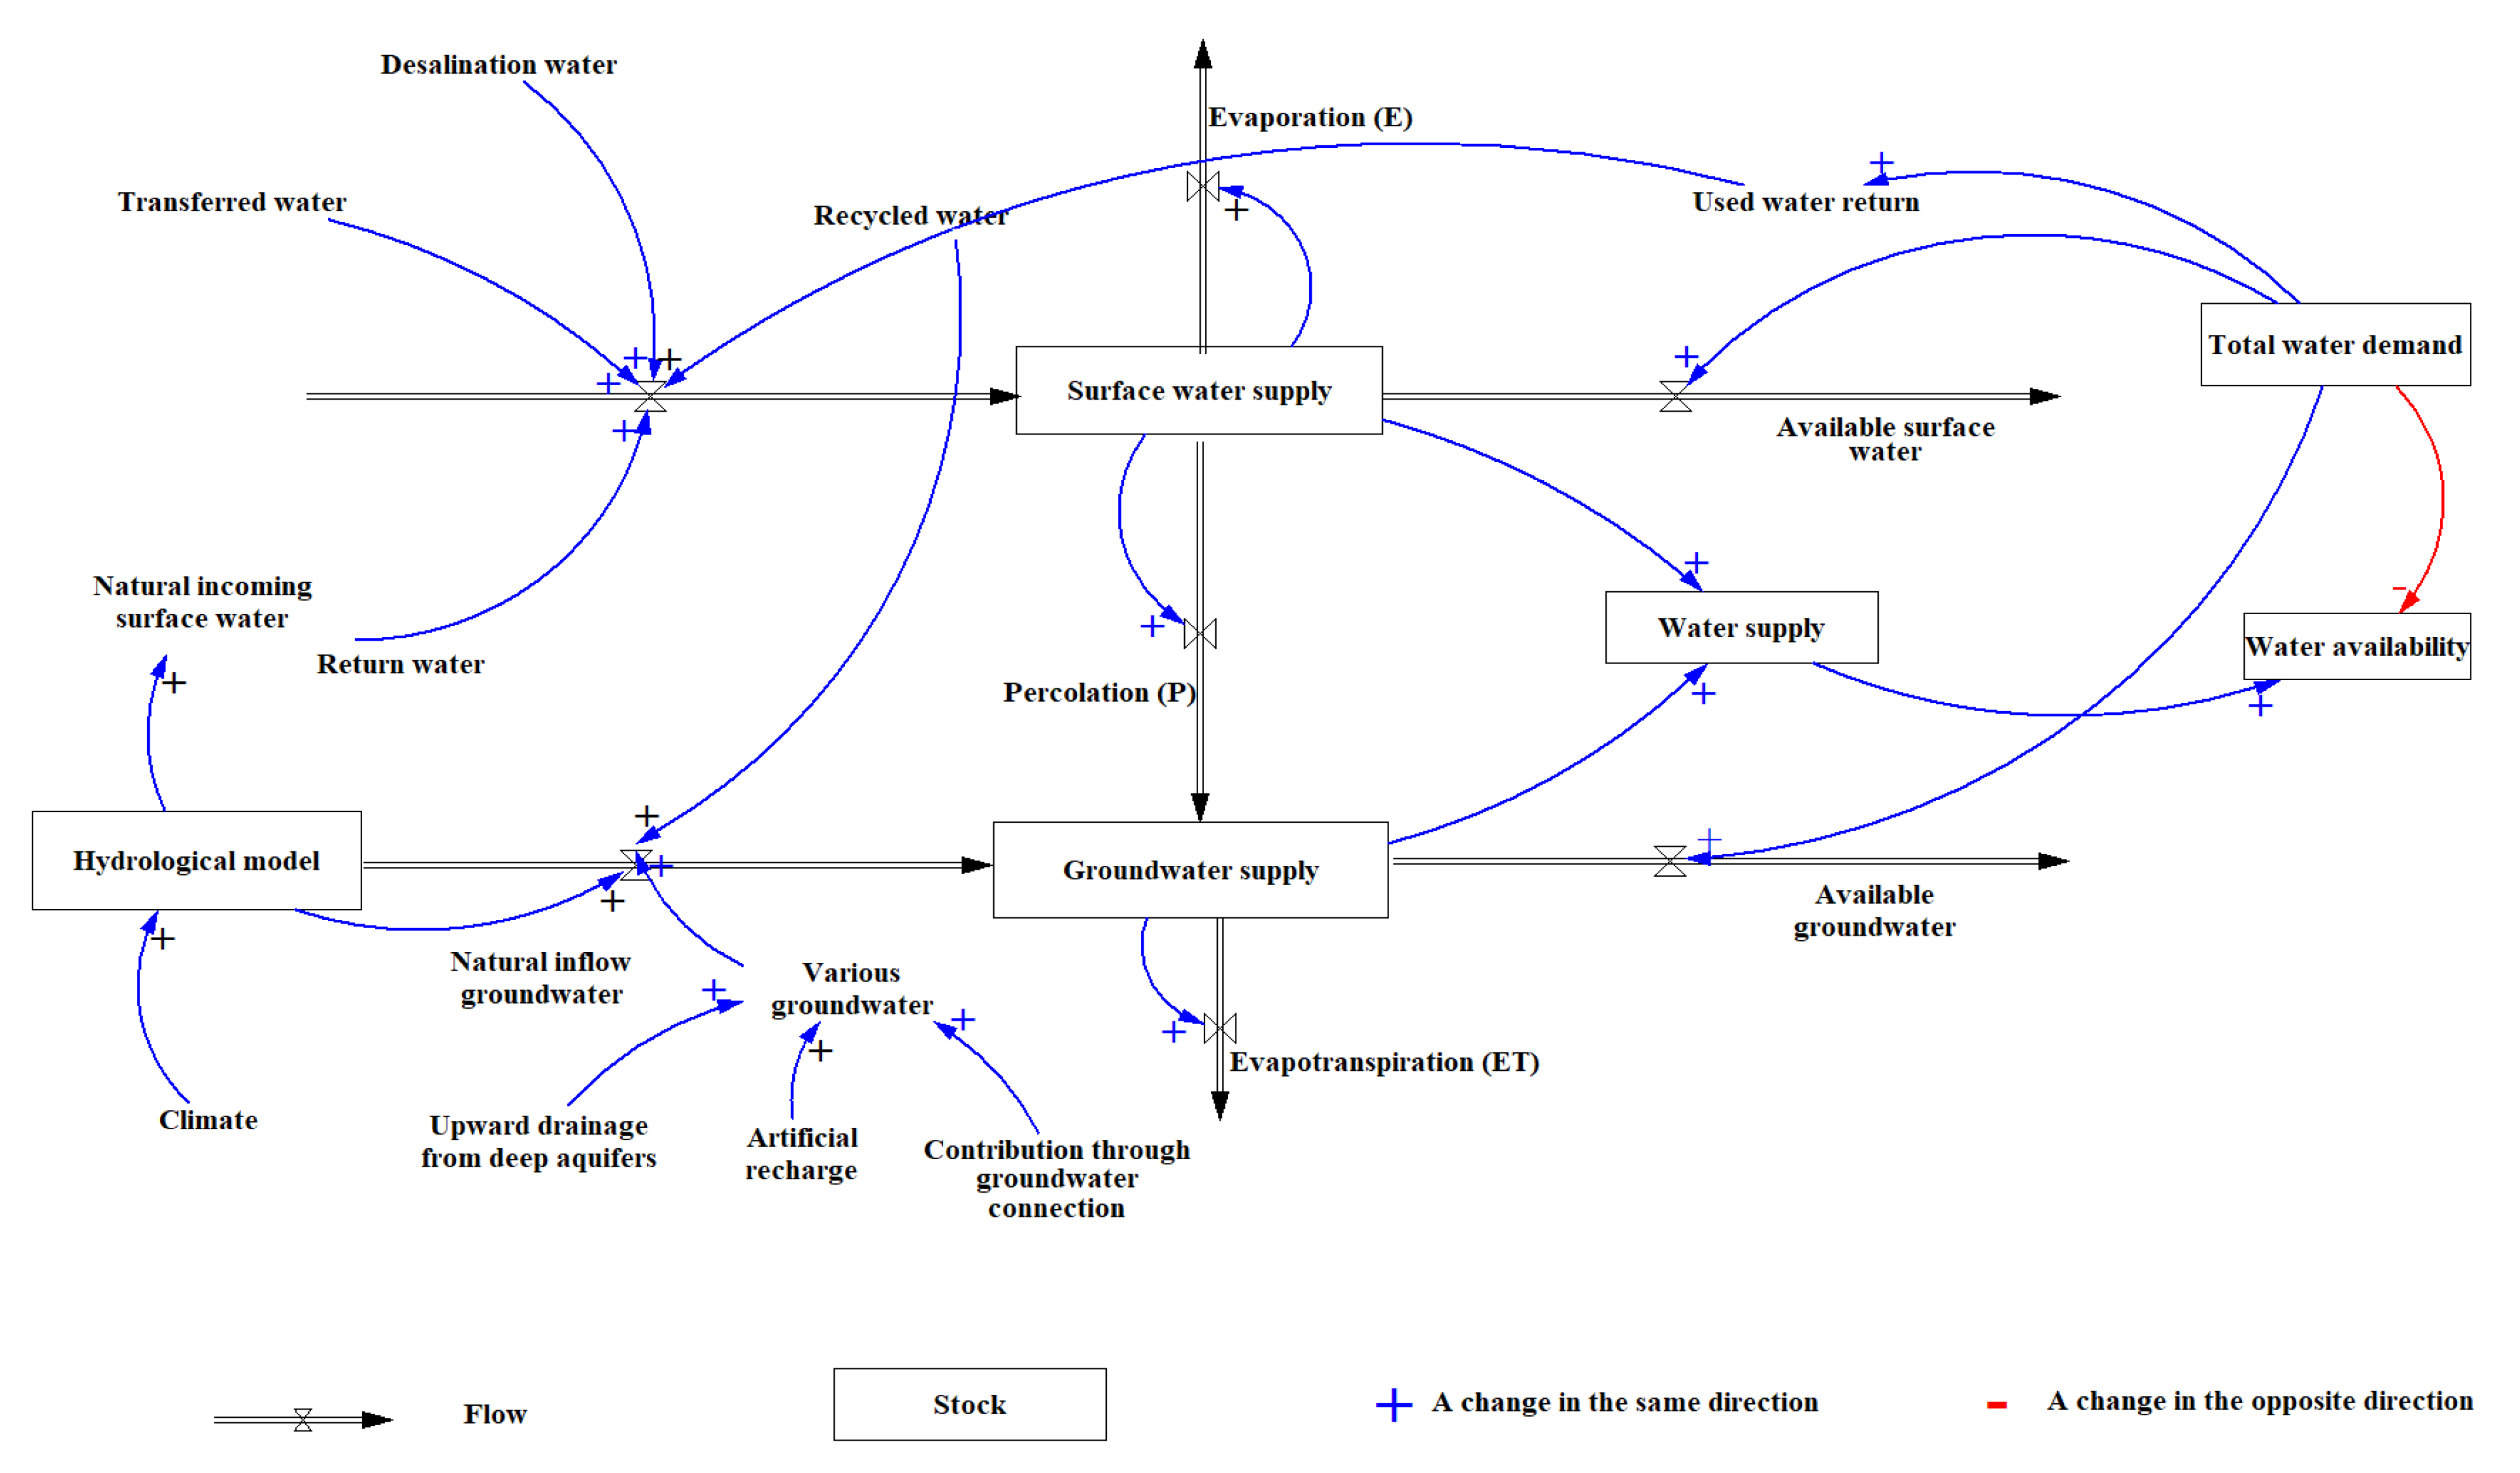
3.1.1. Qualitative Model

Through field observations and a review of scientific articles, two major subsystems are considered for water resources management in the Souss-Massa basin. The hydrological subsystem and the socioeconomic subsystem. In the hydrological subsystem, the variables are surface water supply, available groundwater, and water availability. In the socioeconomic subsystem, the variables are agricultural water demand, industrial water demand, tourism water demand, domestic water demand, water availability, water supply, and population. Two CLDs were developed (Figure 2 and Figure 3). The combination of these two CLDs were the qualitative model.
The key parameters that affect domestic, tourism, industrial, and agricultural water demand are shown in Figure 2, as well as the actions that decision-makers should take to minimize water demand. To balance the demand for domestic water (loop B1), due to population growth, it is necessary to minimize the rate of population growth by acting on the birth rate, mortality, and immigration as well as the reduction of water consumption per capita (loop R1); for this, it is necessary to act on the repair of leaks in the network, impose taxes on high water consumption, and act, above all, on user awareness. To balance the demand for tourist water due to the increase in the number of tourists (loop B2), it is necessary to act on the balancing loop R2, which attempts to minimize the amount of water used excessively by tourists, especially in SPAs, golf courses, and swimming pools, as well as to modernize the distribution network. To balance the industrial water demand (loop B3), due to industrial development, it is necessary to act on the balancing loop (loop R3), which minimizes water consumption per industrial unit by using technology and opting for water reuse. Finally, to balance the demand for agricultural water (loop B4), due to agricultural development and (loop B5) due to the increase in irrigated areas, it is necessary to act on loop R4, which minimizes water consumption per hectare by using technology, but, above all, by choosing a crop that consumes less water and is adapted to the nature of the soil to improve irrigation efficiency.
Figure 3 shows the main parameters that affect water supply. This is subdivided into the available surface water supply and available groundwater supply. This comprehensive integrated model clarifies the interaction of the different parameters and factors of the problem and could be useful in different management and decision-making processes regarding water problems in the basin.

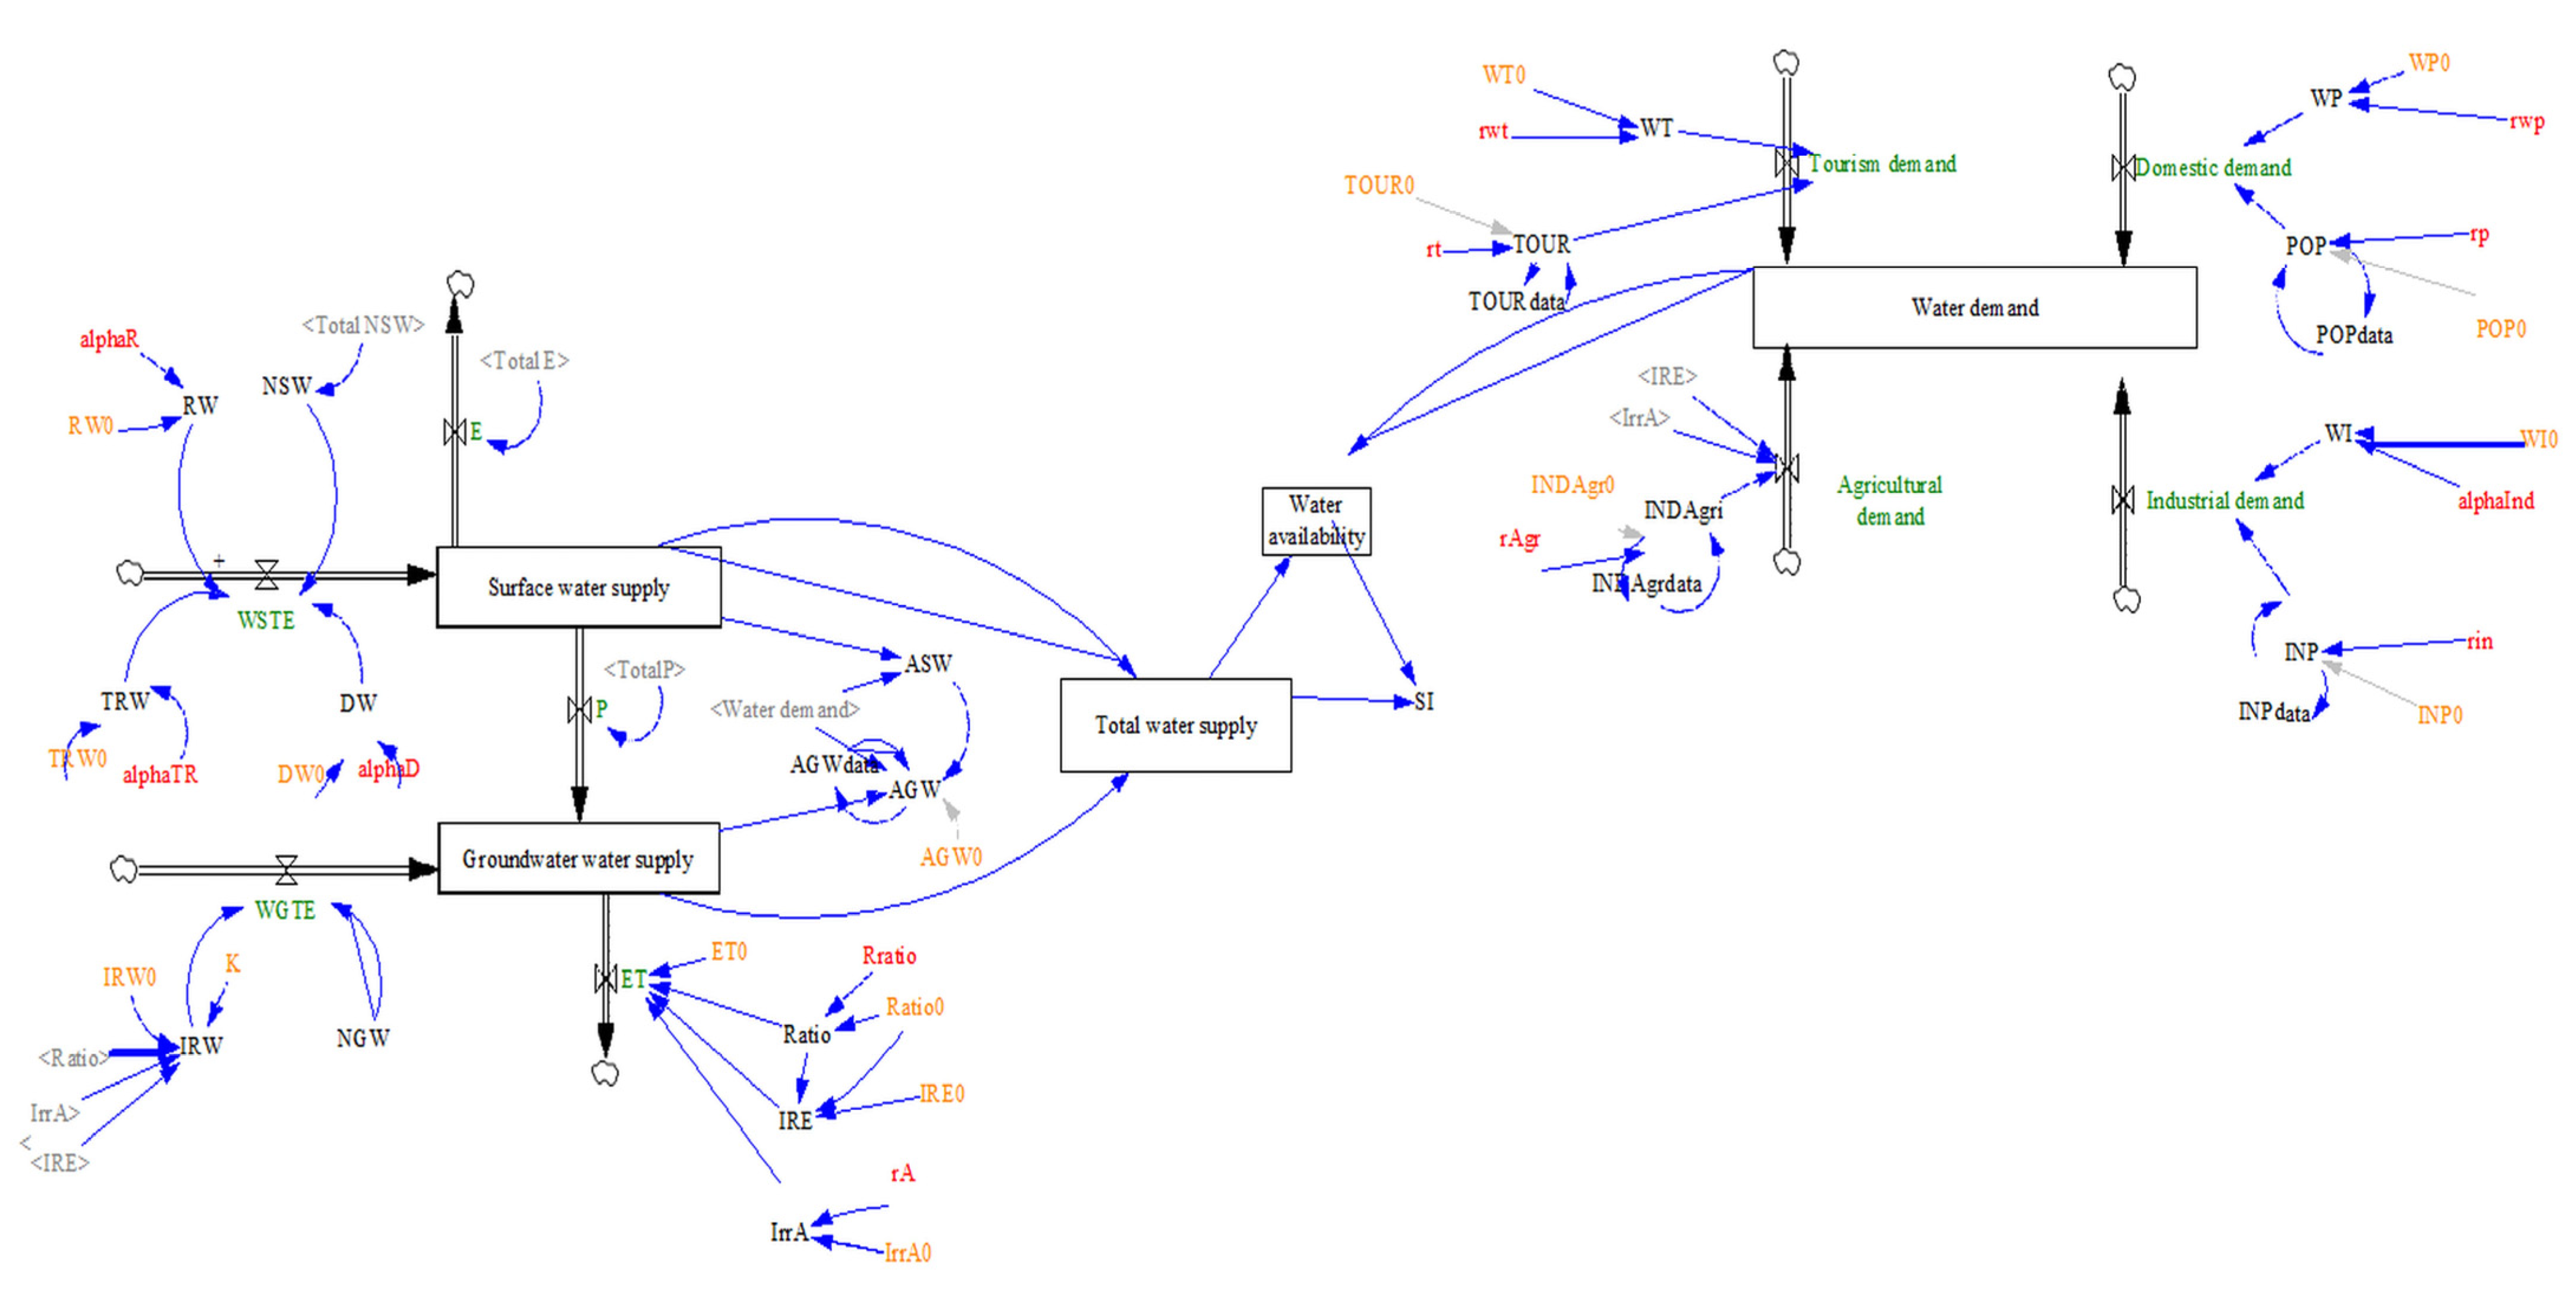
3.1.2. Quantitative Model
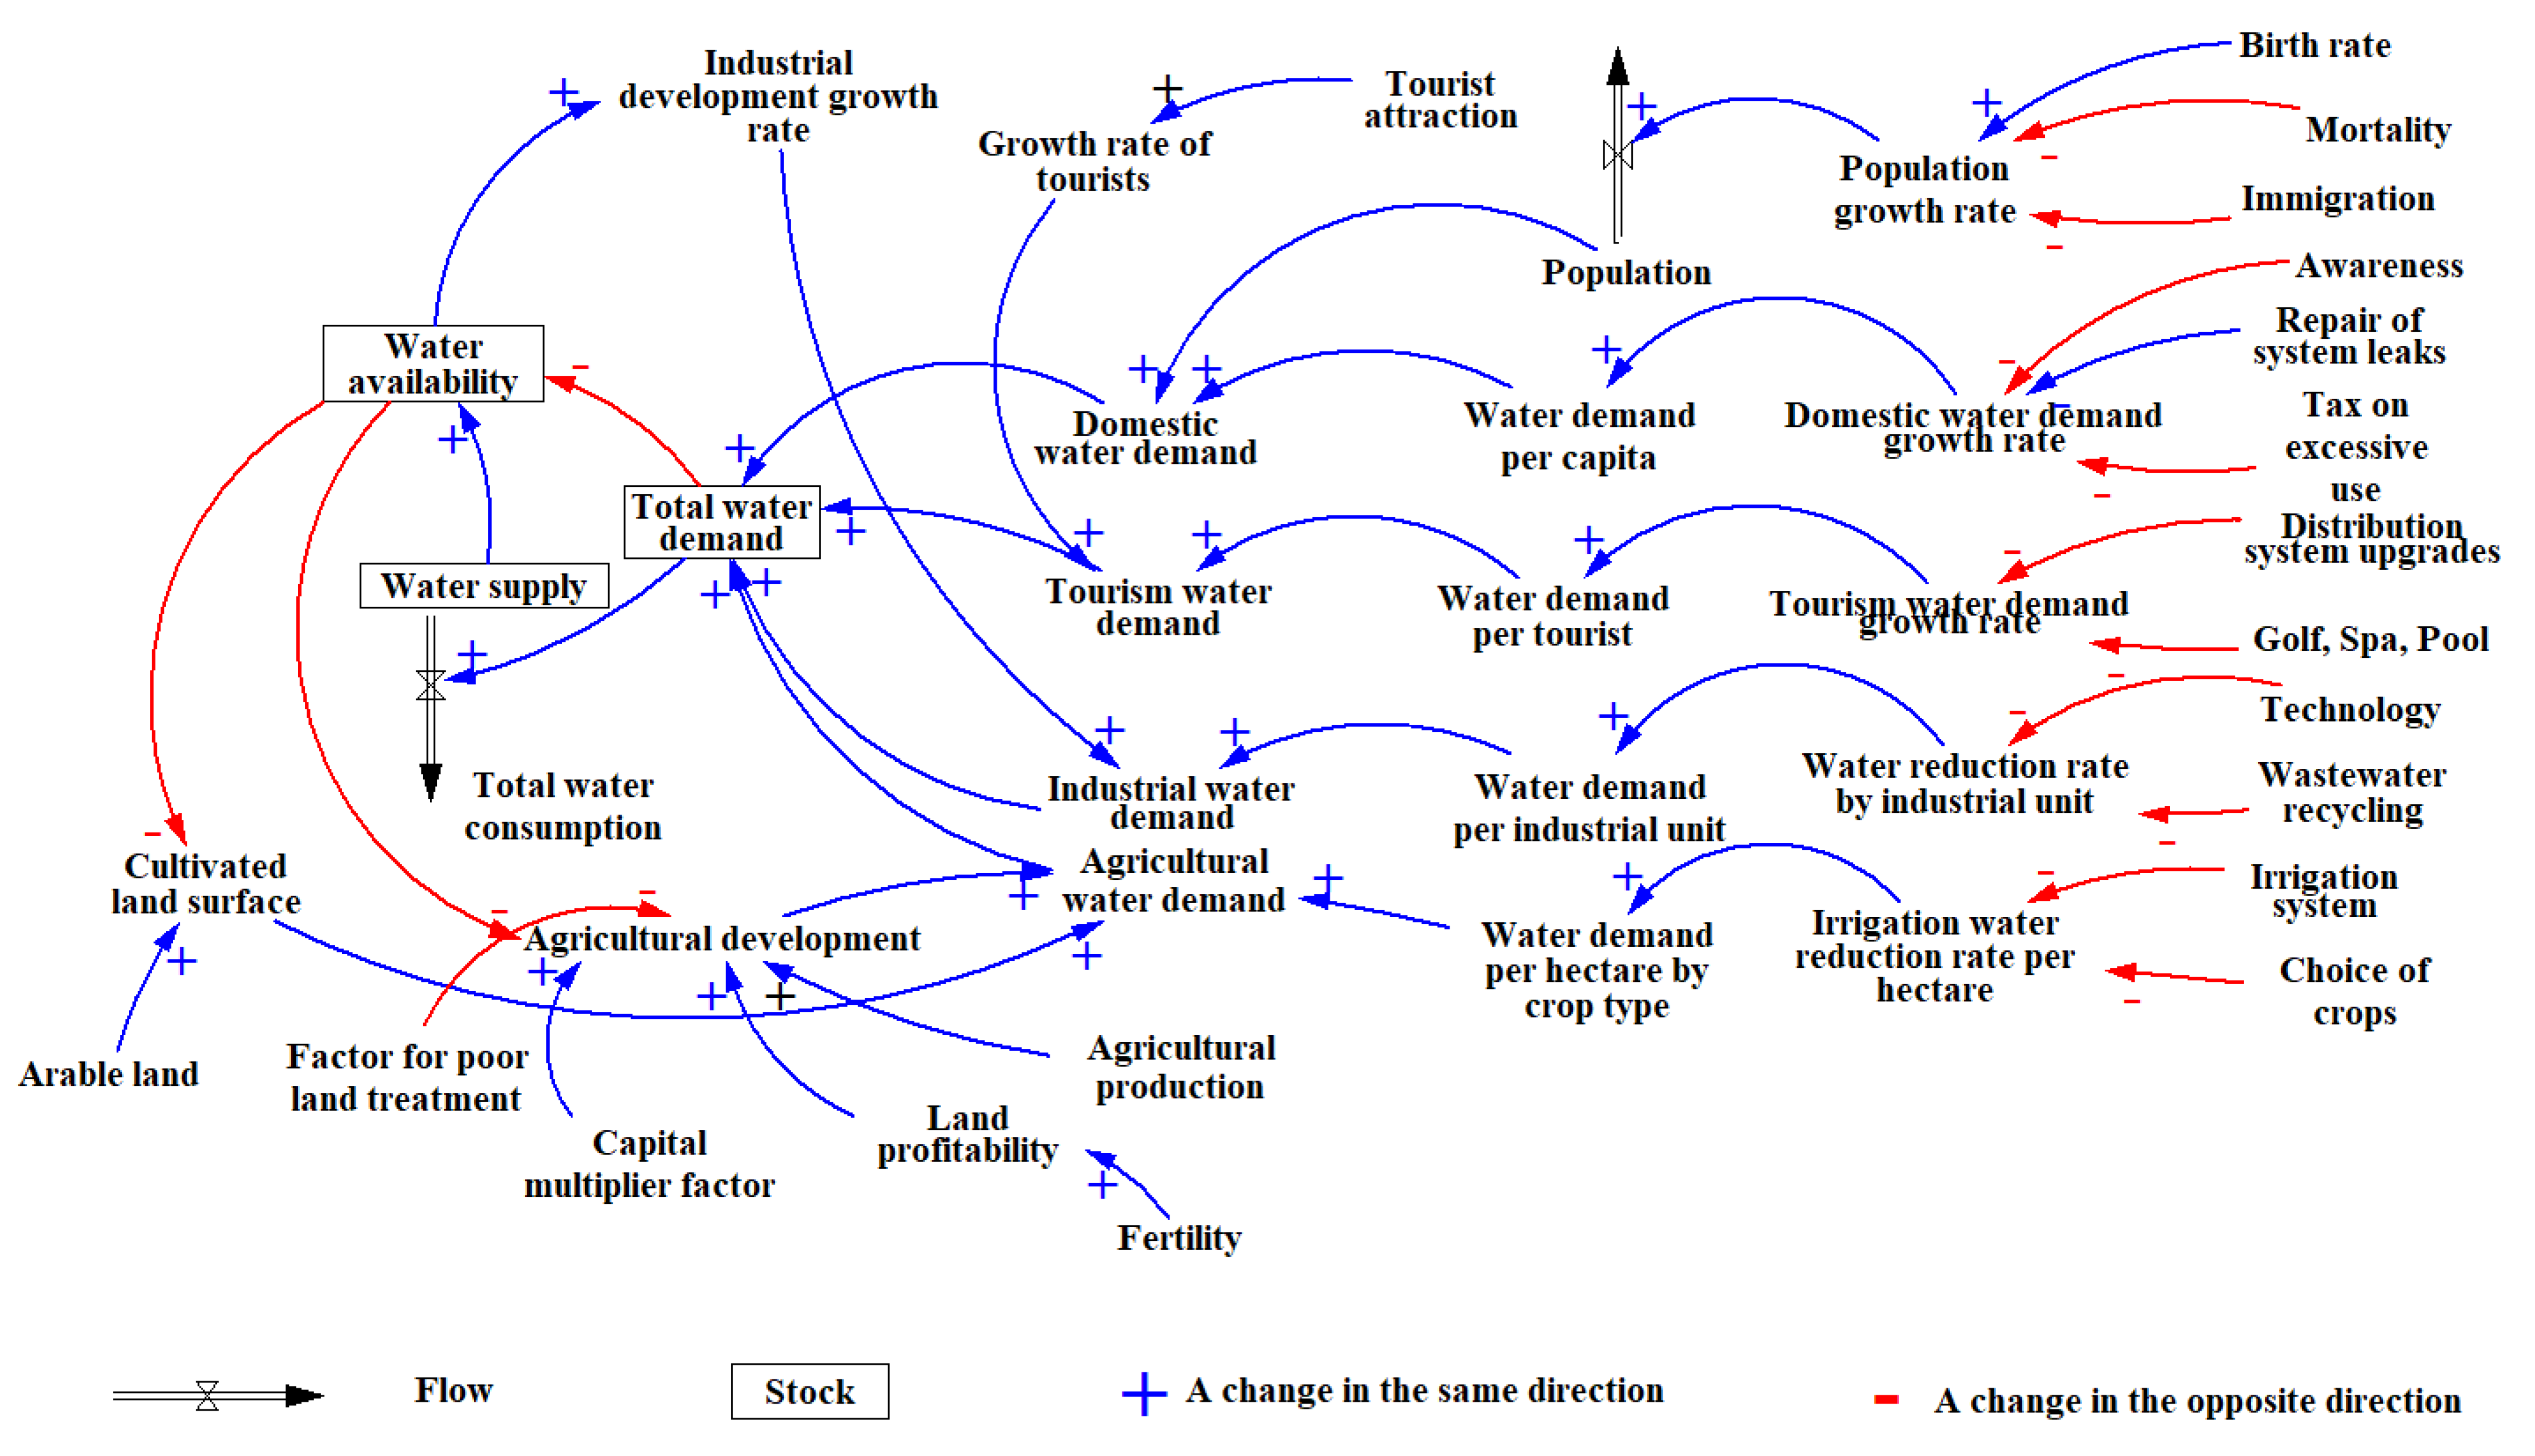
Model Structure

The qualitative phase of constructing the CLDs is followed by the quantitative phase. Quantitative modeling consists of developing a stock–flow diagram (SFD) to better characterize system processes graphically, as the CLD fails to capture the stock–flow structure of systems. The variables are either stocks or flows. Stocks are accumulations that characterize the state of the system and generate the information on which decisions are based. Flows represent the rates that can change the stock variables. Two SFDs were developed (Figure 4 and Figure 5). The combination of these two SFDs would be the quantitative model.
The stock variables (available surface water and groundwater) constitute the total water supply, water availability, and total water demand. The stock variables are increased by inflows and decreased by outflows. Available surface water is increased by total natural surface water entering dams, recycled water, desalination water, and possible interbasin transfers and decreased by percolation to groundwater (recharge), evaporation, and surface water withdrawals. Available groundwater is increased by natural groundwater inflow (input), consumer return to groundwater (input), and surface water percolation variables (input) and decreased by evapotranspiration and groundwater withdrawal variables (output: pumping and natural discharge).

Model Simulation

A quantitative model with an annual time step was developed to assess the water resources of the Souss-Massa basin based on the CLD and SFD of the problem. The geographical boundaries of the model correspond to the watershed boundaries. The simulation period of the model was 14 years (2007–2020). The choice of this period is related to the availability of the required hydrological and socioeconomic data to run the model. However, the model remains flexible and focuses on understanding trends and behaviors rather than numbers. The model was constructed using Vensim research software (Ventana Systems, Inc., Harvard, MA, USA) (Figure 6).
The originality of Vensim is that it has a graphical modeling interface that allows interactively plotting the behavior of the model through causal links and uses a declarative programming language to automate quality control experiments on the models [139,140]. The model ran simulations throughout the defined period. At the end of each year, some of the variables in the model were updated to represent the consequences of changes that occurred during the previous simulation step [141,142].

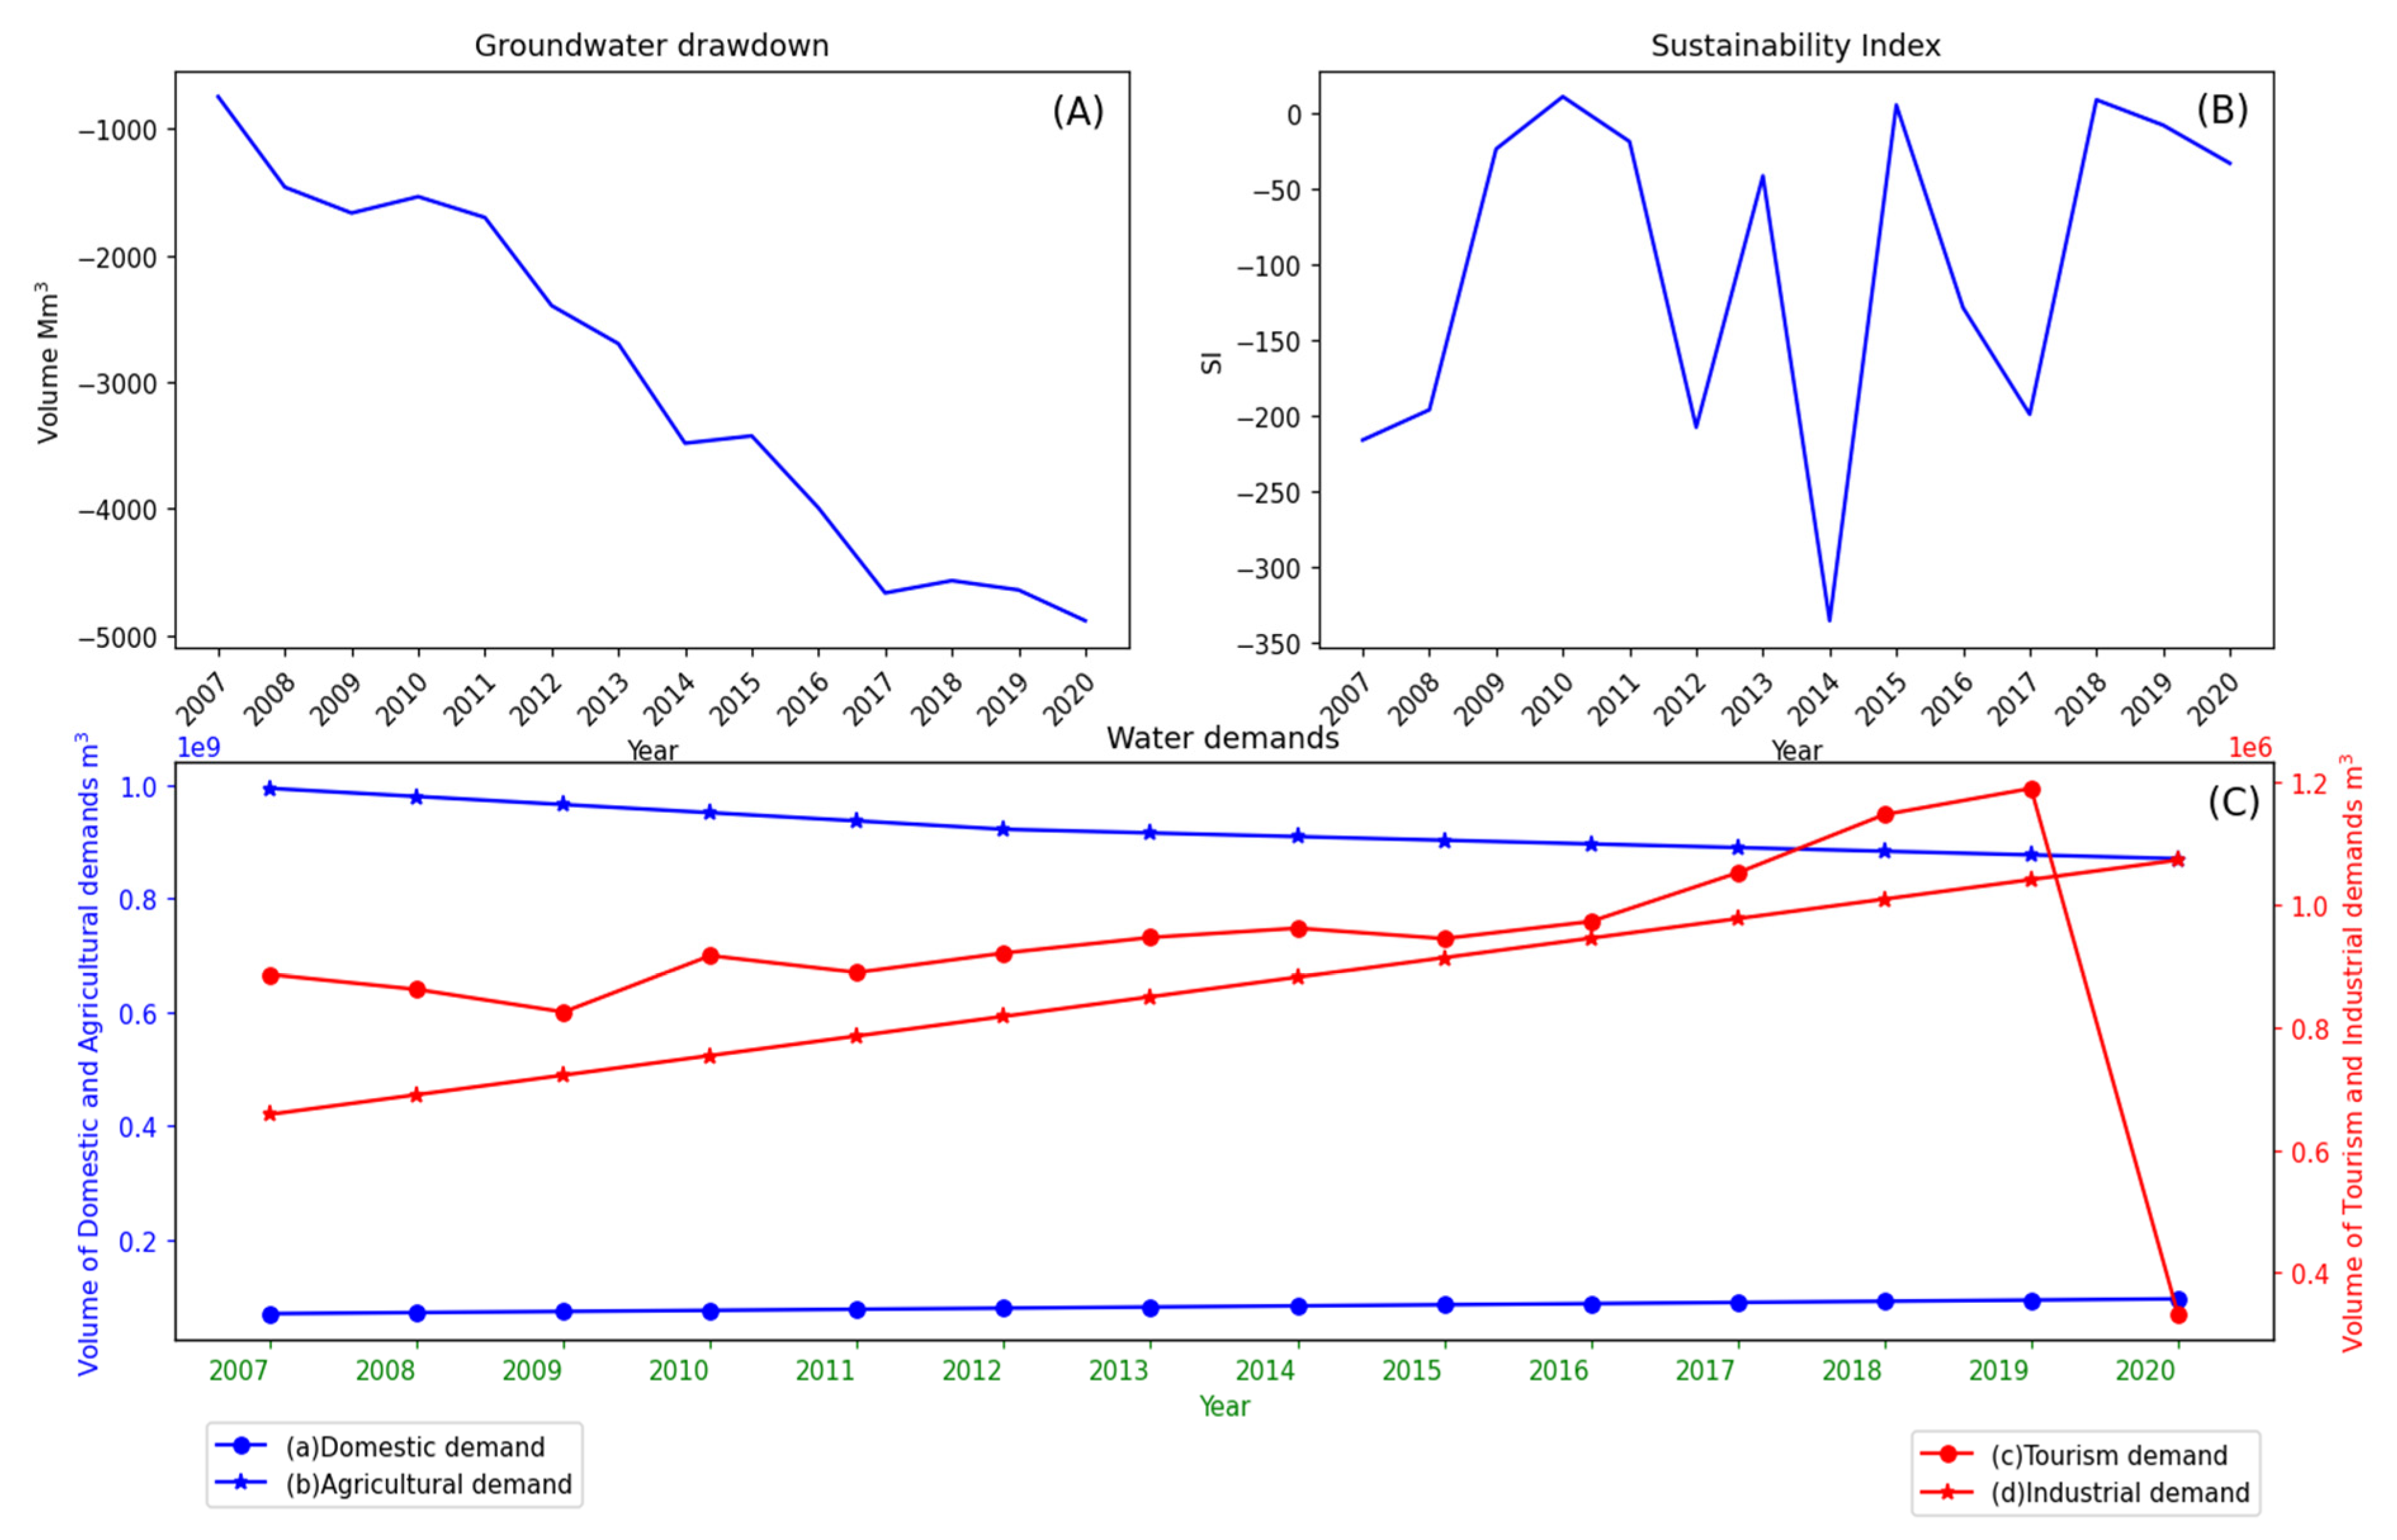
3.2. Simulation Results

The SD model developed at the scale of the Souss-Massa basin will serve as a basis for the simulation of scenarios proposed by decision-makers and can be adjusted for application to other basins. The quantification of the hydrological, sociopolitical, and economic elements of the model was very theoretical. However, it allowed us to understand the interactions of the different factors of the problem at different scales. This SD model allowed us to test current management strategies and to evaluate the strengths and weaknesses of each.
The simulation results show how changing one parameter can affect the model. The data collected were used to run the model and see the various very interesting interpretations that could be made. The focus should be on the recognition of the model, not the numbers and results generated. Scenarios were simulated and aligned with government policies for each sector. Figure 7 shows the change in the two important parameters, groundwater drawdown (GWD) (A) and sustainability index (SI) (B), in the Souss-Massa basin between 2007 and 2020, respectively. Other interesting curves can be visualized, such as domestic, industrial, tourism, and agricultural water demands (C), as well as different water supplies, population, and water availability.
The analysis of the main results of the simulation shows that water stress was a constant feature in all simulation years, except for three rainy years, 2010 (SI = 11), 2015 (SI = 5), and 2018 (SI = 9), when the supply was slightly higher than the demand, without reaching an SI higher than 20%, which means low or no water stress. The SI remained low during most of the simulation years, showing that the policies adopted do not guarantee the sustainability of water resources.
The groundwater drawdown for the simulated scenarios clearly shows that the groundwater volume decreased from 747 Mm3 in 2007 to 4884 Mm3 in 2020, or an annual average of 295.5 Mm3 (Table 2). The situation is alarming; hence, there is a need to reconsider the adopted strategies.
The decrease in tourism water demand was due to the decrease in the number of tourists associated with the COVID-19 pandemic. Regarding surface water components, only four wet years were able to achieve surface water contribution above 35%. These four years are 2010 (48.42%), 2015 (44.28%), 2018 (42.14%), and 2019 (36.26%), with an average of 24.6%. For the remaining years, surface water contribution remained low and reached a critical threshold of 5.68% in 2014. This directly resulted in an excessive withdrawal of groundwater to cope with the deficit.
The SD model allowed us to see the instantaneous results of the influence of the change of a parameter on the system. The combination of SD with the study of uncertainties will allow us to move from a macro model to a micro model that considers the key parameters that largely influence the management and sustainability of water resources in the Souss-Massa basin. It will allow us to have a global understanding of the complex problem of water resources management in the Souss-Massa basin in order to consider alternative solutions to redress the current state. Table 3 shows the ranges of variation of each parameter between 2007 and 2020 according to the actual data identified and according to the policies planned by the different sectors.

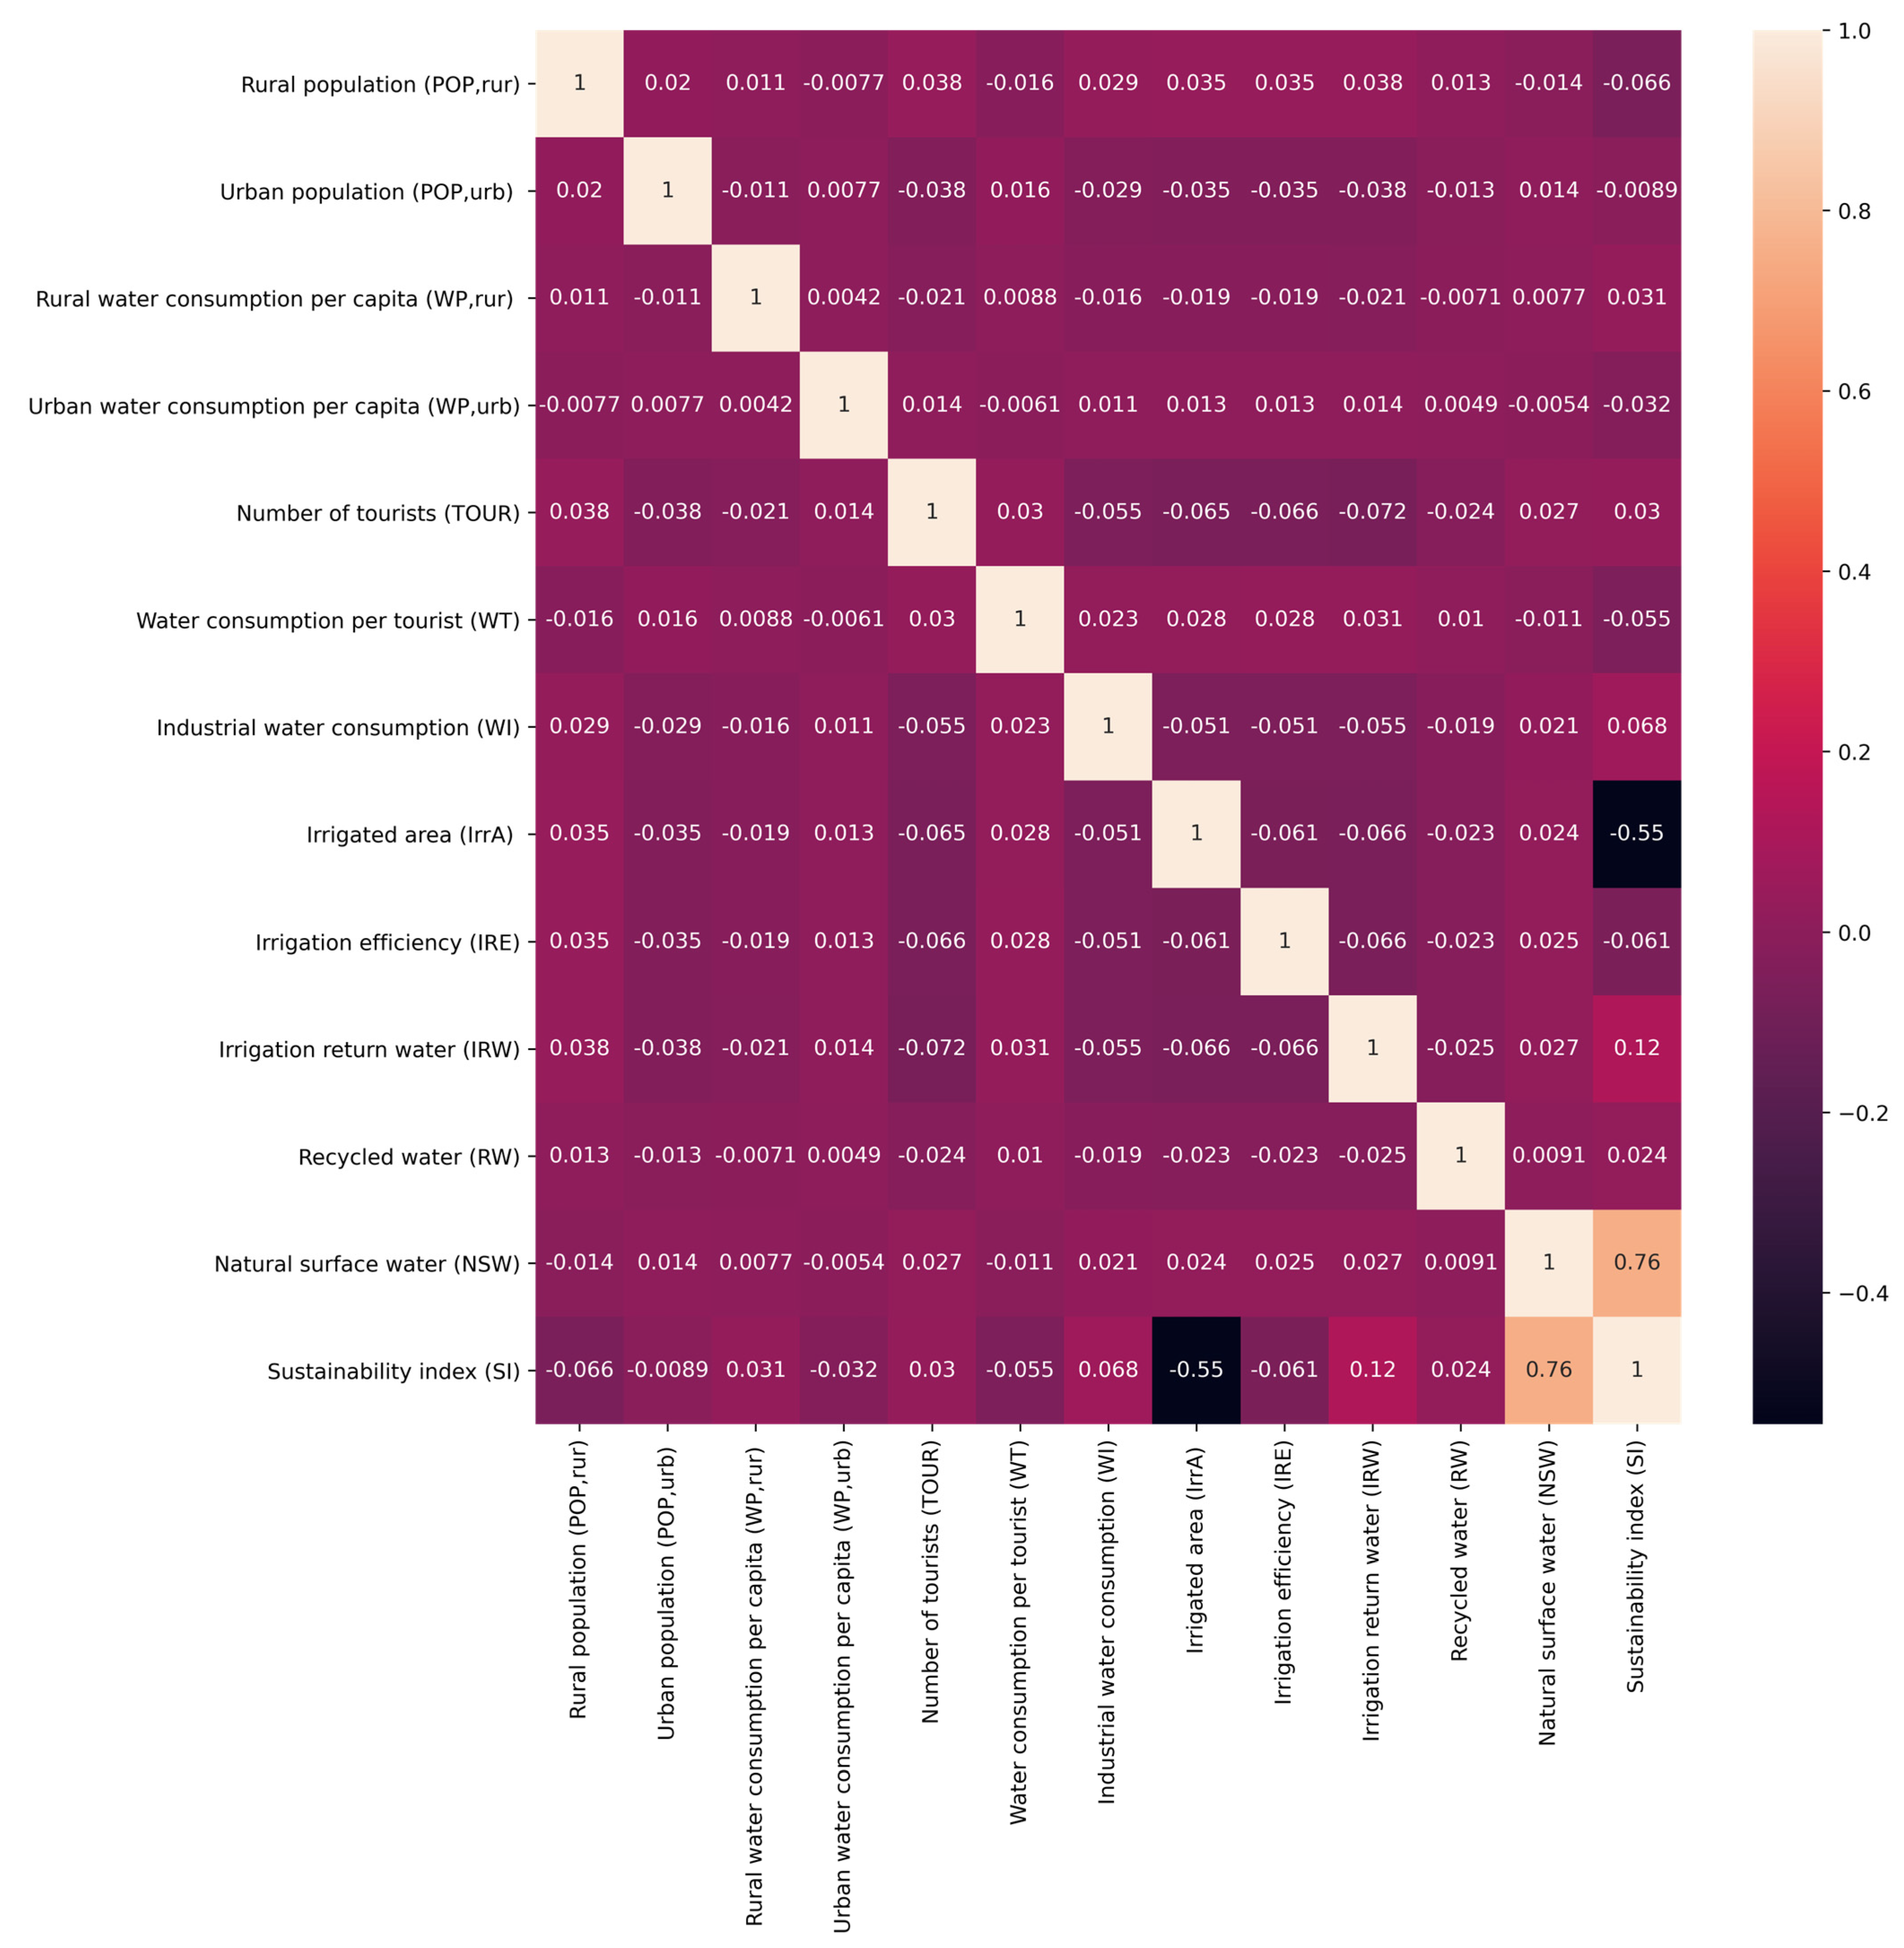
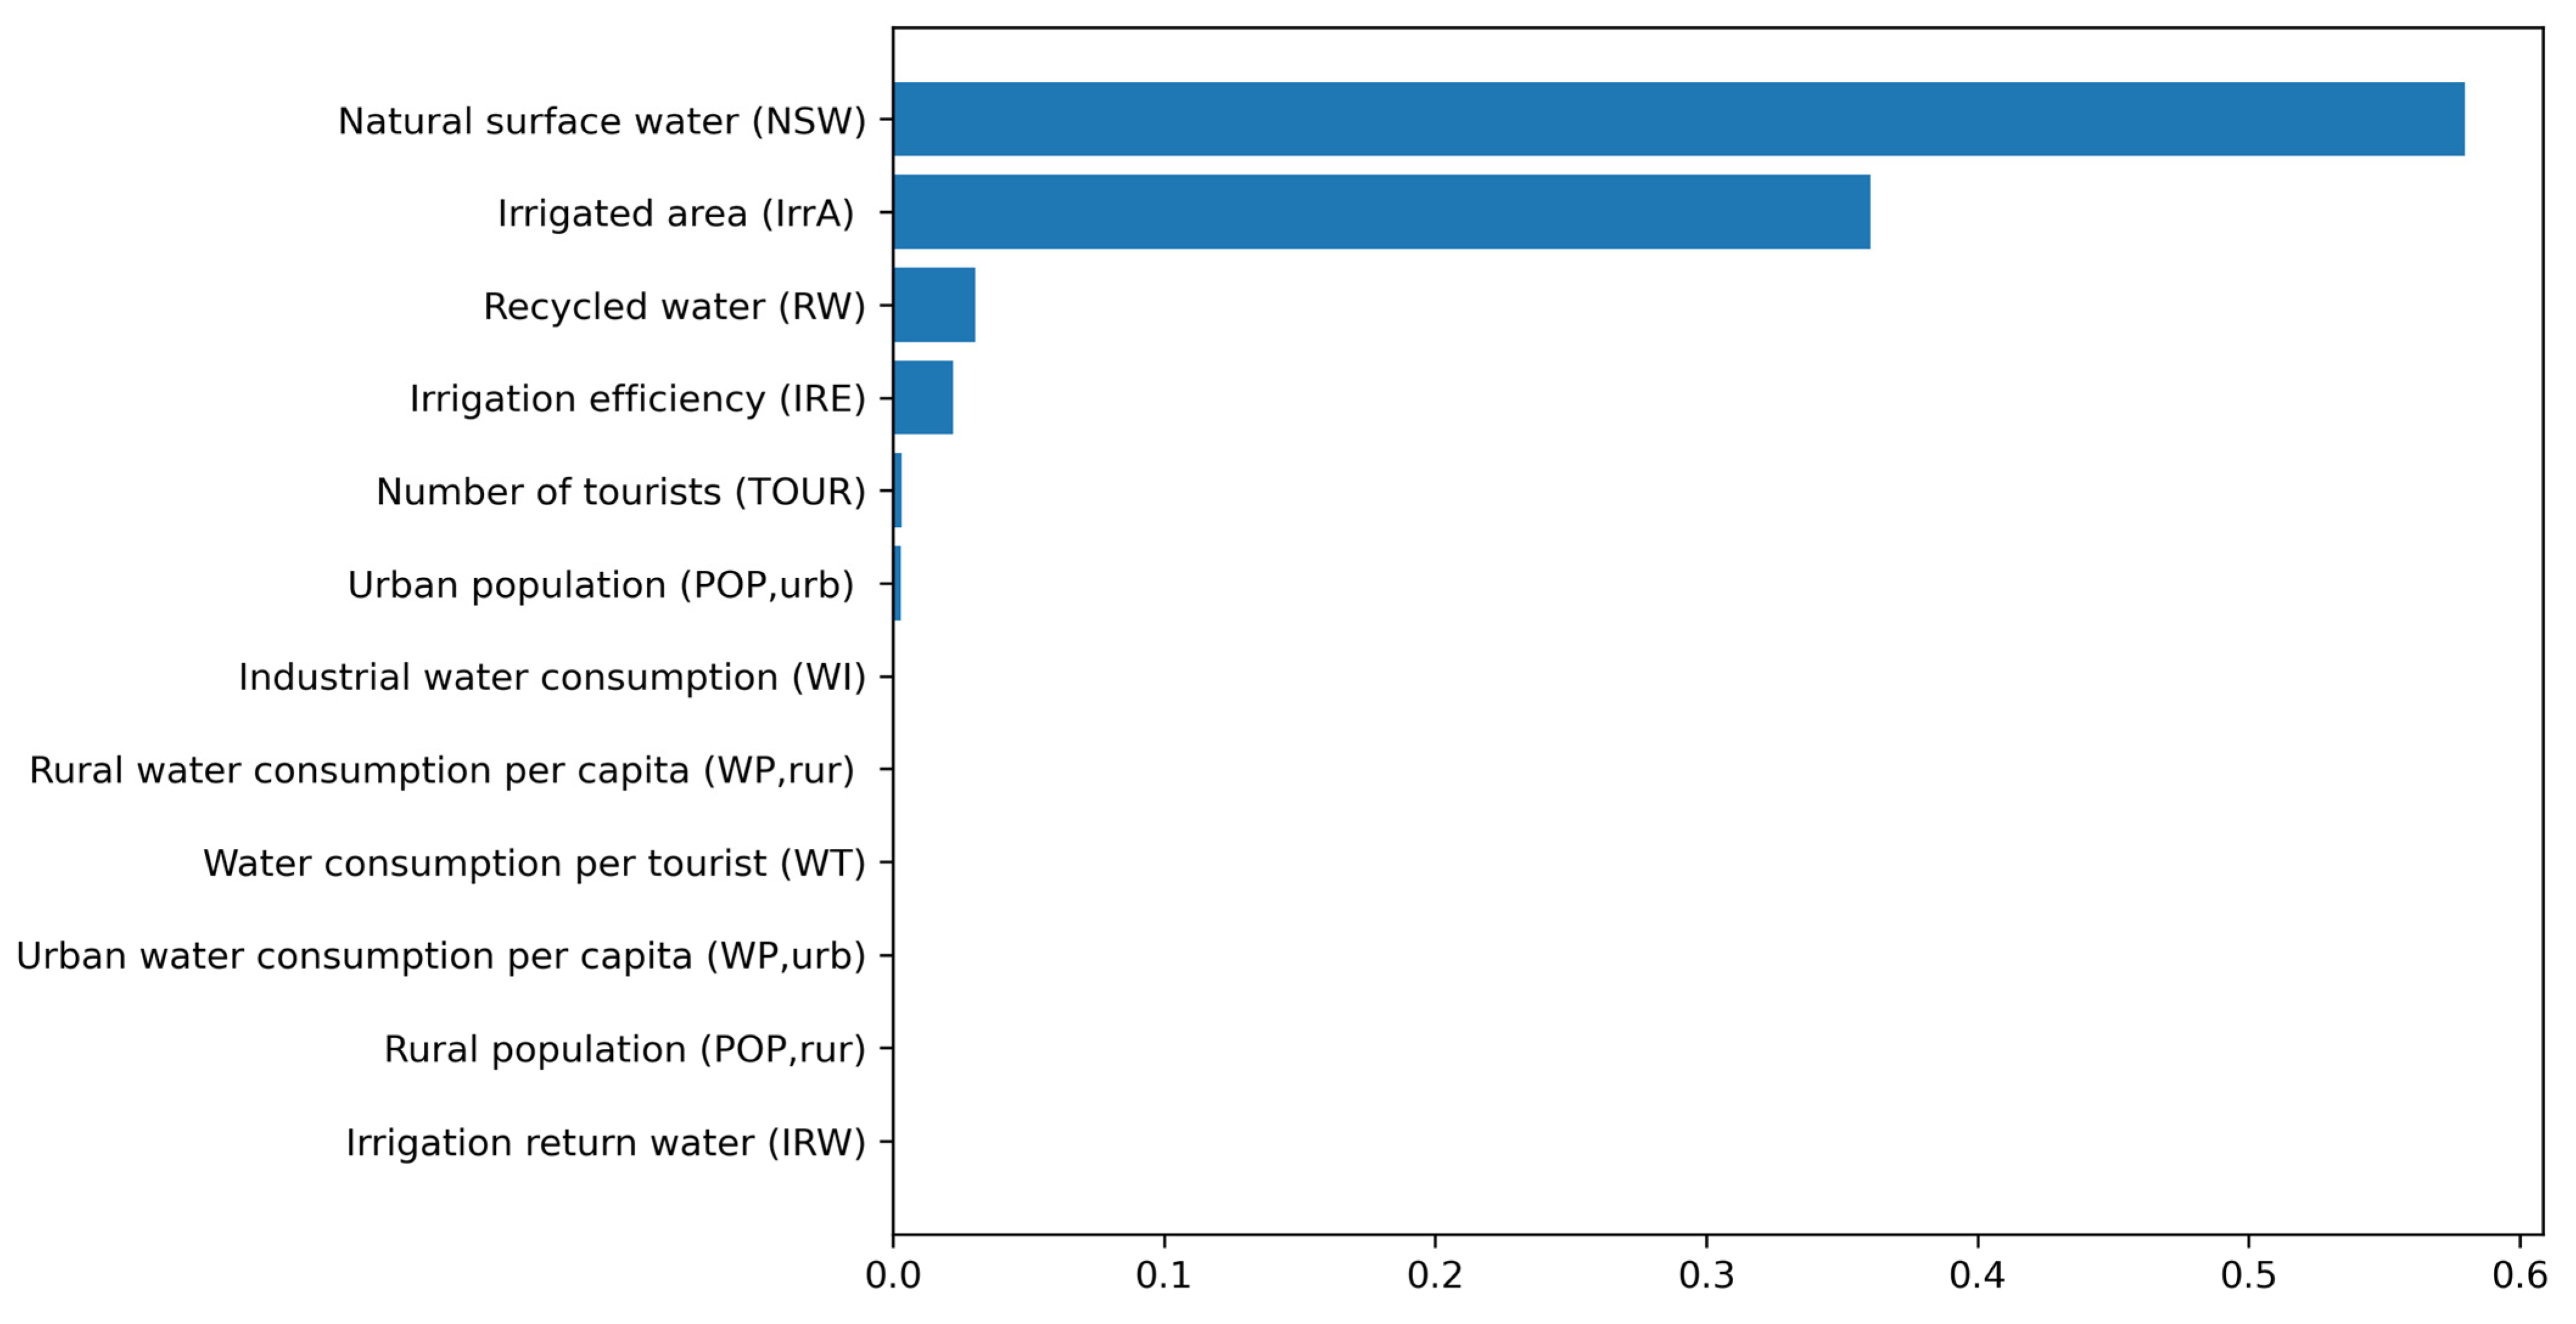
3.3. Sensitivity Analysis

Most SD software has a limited set of tools for dealing with uncertainty and risk [143,144,145,146]. In order to identify the model inputs that most influence the outcome, we first randomized the input parameters and ran repeated simulations to calculate the output parameters and then performed multivariate regression on the constructed dataset. This technique involved creating new features using combinations of features from the original data set [147]. Then, the parameters that were the subject of the simulations were alternately changed within an appropriate range. This was determined for each parameter based on its definition range and uncertainty. Each simulation took into account the modification of a single input with respect to the globality of the model parameters. The effect of each variation was analyzed at the level of the outputs selected as the object of analysis. The results of the sensitivity analysis are presented in Figure 8.
The sensitivity analysis allowed us to evaluate the response of the model to variations in the input parameters and to classify the factors, namely those that have the greatest influence on the model results and those that require more precision. It also allowed us to simplify the model by neglecting the least influential parameters to move from a global model to a robust model. The results of the sensitivity analysis show that among the 13 parameters analyzed, four parameters significantly influenced the objective function of the model in the following order of influence: (1) natural surface water, (2) irrigated area, (3) recycled water, and (4) irrigation efficiency. These four parameters give sensitivity indices ranging from 0.0049 to 1 (Figure 9). This results in high uncertainties in these parameters that can greatly influence the model outputs; hence, there is a need to pay special attention to their estimates.

4. Discussion

The Souss-Massa basin suffers from a decrease in water availability due to increased demand, decreased inflow, and anthropogenic activities, which have led to an increase in water stress. According to Bouchaou et al. [16], the response of water resources to climate change, as well as agricultural and irrigation practices, may have significant consequences for groundwater recharge in agricultural regions. In addition, climate change will affect the amount of groundwater pumping in the basin. On the other hand, farmers are adopting water-demanding crops (bananas and forage crops) that increase water withdrawals, which will have a negative impact on agricultural land. In this regard, several farmers have left their crops dry on the Ouled Teima and El Guerdane perimeters [148]. Berger et al. [149] have shown that the livelihoods of rural populations in the Souss-Massa are strongly linked to climatic conditions, water availability, and security. To address this situation, Hirich et al. [150] proposed new approaches for sustainable water planning and management. Indeed, these new strategies, including the Chtouka desalination plant project, will allow a 20% increase in water supply from 901 Mm3/year to 1171 Mm3/year by 2030. Belabhir et al. [151] demonstrated that the reuse of treated wastewater in agriculture in the Agadir region could save conventional water. On the other hand, Azemzi and Erraoui [152] showed that a good participatory management system incorporates the knowledge and skills of farmers, as well as their active involvement in the transition from community-based management to participatory management. On the other hand, the Souss-Massa will also benefit from new development plans, namely the new Green Generation strategy (2020–2030) and the 2020–2027 plan for water-saving programs in the agricultural sector.
Despite all these efforts for water management, the water situation in the Souss-Massa basin needs more investigation to support the sustainable decision system [153,154]. Indeed, there are still several gaps in the understanding of the complex interaction between productivity, sustainability of water resources, and different environmental and socioeconomic factors. Davies and Simonovic [155] demonstrated that the failure to design solutions for water resources management systems is based on a lack of knowledge of the many interconnections and dynamics of the different components of the system. Faced with this situation, it is necessary to first assess the sectoral policies that have led to this potential imbalance between water supply and demand and develop management strategies to adapt to the risks associated with the expected changes.
The use of modeling has emerged as a fundamental approach to evaluate water resources management policies to ensure a balance between supply and demand [156,157]. Several models have been developed at different spatial scales: WaterGAP [7], Mike Basin [8], WEAP [9], RIBASIM [11], and SWAT [13]. None of these conventional models have been able to encompass all the parameters that impact water resource management at the watershed scale and visualize how they are interconnected to achieve a holistic view of water resource sustainability. Thus, the SD model established will not only allow decision-makers to have a realistic vision of the water supply–demand balance during the simulation years but will also contribute to the sustainable development of water resources in the Souss-Massa basin and even to the search for other nonconventional sources to fill the deficit in future years. In addition, it is necessary to take stock of the achievements and weaknesses of the actions carried out within the framework of the policies to focus on the actions with positive results and to correct those that work less well. In this way, coherence with a sustainability objective will be guaranteed.
In our SD model, domestic, tourism, industrial, and agricultural water demands constitute the main subsystems of the global water demand at the Souss-Massa basin scale. These demands should be minimized as much as possible by acting on the parameters introduced in the developed model. Although agriculture in the Souss-Massa contributes to 6.6% of the national GDP, it consumes more than 80% of the total water demand. The main parameters to be taken into account are those related to the modernization of the irrigation process, the adoption of more profitable and less water-consuming crops, and the reduction of irrigated areas that have been extended by the GMP, which have contributed to the increased exploitation of groundwater resources.
On the other hand, the demand for domestic water, even if it represents less than 10%, should be minimized by repairing leaks in the distribution network and introducing a tax on excessive consumption, while giving priority to the notions of solidarity and equity for a better rationalization of water use. The natural supply of surface water depends only on the climate of the region and the percentage of greenhouse gas emissions. This requires a joint effort by the government and stakeholders to minimize future temperature increases by imposing carbon taxes. In addition, natural surface water should not be lost to the sea and should be stored. The average siltation of existing dams is 5.4 Mm3/year, which will reduce dam capacity to 556 Mm3 in 2050 and the regulated volume will be less than 204.8 Mm3/year [38]. In this sense, dams and weirs need to be built. As for groundwater, withdrawals should be more controlled and declared, and excessive pumping should be limited to avoid drastic depletion of aquifers. In addition, nonconventional waters will have to be strengthened to cope with the water deficit and the growing demand. Wastewater should be further treated and used for urban and tourist irrigation, as well as for groundwater recharge. Since the Souss-Massa region is a coastal area, it will be necessary to opt for a water supply by desalination. The planned desalination plants will improve the total water supply [150].
The objective of this SD model is to test policies and strategies that address the issue of water resources management in the Souss-Massa basin. The current version is limited to the available data. The quantification of the socioeconomic parameters of the model is speculative and difficult. However, it will be of great help to understand the first investigations of the system responses at different levels. This SD model has shown a great failure of the policies applied in the management of water resources at the scale of the Souss-Massa basin. Thus, the issue of water management should be at the center of future development policies. It will be necessary to decompartmentalize policies and adopt a participatory approach involving decision-makers, citizens, industrialists, farmers, and operators.
The sensitivity analysis has shown the key parameters that need to be addressed to readjust the model and move from a macro model to a micro and robust model. A hydrological study will have to be carried out to predict future flows at the scale of the Souss-Massa basin. This study will be integrated into the model simulation between 2020 and 2050 for future strategies. Over the last decade, water scarcity in the Souss-Massa basin has resulted in significant economic losses for agriculture. Good water governance, wastewater reuse, seawater desalination, the use of cost-effective and water-efficient crops, and the modernization of irrigation processes are all interesting scenarios that should now be considered by the relevant ministries for good water management in the coming years. Finally, SD models have some limitations. They cannot decide the optimal scenario for the future. Moreover, spatially distributed data cannot be modeled easily. Therefore, it is important that SD models are updated to improve their consistency.

5. Conclusions

SD modeling has allowed us to evaluate regional solutions and can provide answers to various policy questions. Qualitative and quantitative models have allowed us to better understand the problem of water resources management at the scale of the Souss-Massa basin and to predict the behavior of the system variables over time as a function of the different decision variables of the system. Based on the reaction of the likely behavior of key parameters to the adopted strategy, managers can make the best decisions considering hydrological, environmental, sociological, and economic aspects. This model will be very useful for studying the system’s responses to different futures and strategies. There is no single solution to water problems. A combination of approaches is needed, and several actions should be considered to address potential weaknesses in the current water resources management system. Because of the inherent strengths of the SD method, this model provides a valuable framework for studying water resource management problems, both independently and in tandem with other types of conventional and technical models and disciplines.
The overall conceptual framework and integrated dynamic modeling presented here will serve as the basis for defining the potential subsystems influencing the model to redress the current critical situation. The strength of SD models is that they provide an experimental simulation platform for the analysis of an interconnected strategic problem, which is not the case with traditional water resource management approaches. It is a rapid approach to explore the dynamics of the basin and the different scenarios that can be developed to understand the behavior of the system. This macro model remains very flexible, involves the key parameters that act on the water resources management system in the Souss-Massa basin, and can be easily improved into a robust and reliable micro-model. This SD model can simulate scenarios proposed by decision-makers and see the instantaneous results of how the change of a parameter affects the system as a whole. The SD approach is, therefore, a promising tool for conducting transdisciplinary research that addresses the most pressing problems.
SD modeling draws a comprehensive picture of water resource management at the watershed scale. This holistic approach requires accurate data collection. However, the data of the Souss-Massa basin reveal gaps and discontinuities. Concerning hydro-climatic data, many stations do not have reliable data. The breaks noted at several periods are due to malfunctions of measuring devices, changes in the environment of the station, or a lack of management of hydrometric data. In addition, most of the flow measurements in the basin are made at a daily time step. However, the daily time step is speculative for understanding flood events in the watersheds. As for socioeconomic data, they are limited and difficult to process due to their nonlinearity, nonstationary nature, and fluctuations due to unpredictable changes (inflation, COVID-19, etc.). In order to improve the databases and provide water resource managers with a reliable model, we recommend filling hydro-climatic gaps with remote sensing products and permanent maintenance of measuring devices. In addition, modeling studies for hydrological forecasting and analysis of hydro-climatological processes should be conducted to understand the response of hydrological elements to climate stress. For socioeconomic data, we recommend that decision-makers in the relevant departments be made aware of the issue of data quality and availability.
Because of the inherent limitations of the SD approach, this SD model provides a valuable framework for studying water resource management problems, both independently and in tandem with other types of conventional and engineering models and disciplines. Nevertheless, all three dimensions of sustainability (environmental, economic, and social) should be considered to ensure sustainable development for future generations.
Future prospects would be to expand the scope of the study beyond 2020 and include “what if” scenarios, the environmental subsystem such as water quality and the energy subsystem as part of a NEXUS. However, due to the sensitive nature of most of these models, the inclusion of these parameters can have a significant impact on the behavior and results of the model. Finally, to create more sophisticated and powerful methods, future studies should combine the SD method with other simulation or optimization methods, which will significantly improve the decision-making processes as well as the performance of these models.
Finally, agriculture’s contribution to value added and its economic participation should not deter authorities from regulating the use of groundwater resources. The benefits of overexploitation remain relatively small, while the loss of these resources poses unbearable social and economic risks to the Souss-Massa region and to Morocco, particularly in the event of severe and prolonged drought. The sectoral strategies initiated by the ministerial departments in Morocco are multiple. It remains for the government to consider the coherence and convergence between these different strategies through an evaluation that brings them together to determine the level of effectiveness and the degree of achievement of the objectives set. Indeed, the evaluation of public policies can be considered as a lever for efficient management of projects and programs. This SD model will allow for efficient and integrated management and will lead to the implementation of new public management that involves all stakeholders concerned, including public, semi-public, and private actors, because any successful evaluation process should adopt a pluralist and participatory dimension based on a compromise between all the actors concerned to better appropriate the results of the evaluation undertaken. Finally, the issue of dissemination and valorization of the results of the evaluation is crucial, which will subsequently allow for the readjustment of actions or the evolution of organizational practices with a view to achieving the desired objectives of sustainability and resilience in water resources management.

Author Contributions

Conceptualization, A.G., A.C., S.B., T.E.E. and L.B.; methodology, A.G., A.C., T.E.E. and L.B.; software, A.G. and S.B.; formal analysis, A.G., A.C., Y.A.B., E.M.E.K. and L.B.; investigation, A.G. and L.B.; data curation, A.G., A.C., T.E.E. and L.B.; writing—original draft preparation, A.G.; writing—review and editing, A.C., S.B., T.E.E., Y.A.B., E.M.E.K. and L.B.; supervision, A.C., S.B., T.E.E., Y.A.B., E.M.E.K., D.D. and L.B.; project administration, A.C., D.D. and L.B. All authors have read and agreed to the published version of the manuscript.

Funding

This research received no external funding.

Data Availability Statement

The necessary data were collected from different public organizations. The hydro-climatic data were collected from the Souss-Massa Hydrographic Basin Agency (ABHSM). Data from the population census between 2004 and 2014 (conducted every 10 years) were collected from the High Commission for Planning (HCP). Per capita water consumption (m3/capita) was obtained from the National Office of Drinking Water and Electricity (ONEP). The connection rates in rural and urban areas were provided by the Agadir autonomous multiservice company (RAMSA). The data on the number of tourists were recorded by the Ministry of Tourism and the Regional Tourism Centre (CRT). The water consumption per tourist (m3/tourist) in the main tourist establishments was provided by RAMSA.

Acknowledgments

The authors express their gratitude to all of the assistance provided by individuals who assisted them in conducting the research. This research was supported by the grant of Mohammed VI Polytechnic University. Our thanks to the Hydraulic Agency of the Souss-Massa basin for its help in making the database available. L. Bouchaou also thanks the support of the CHARISMA project with the help of the Hassan 2 Academy of Science and Technology as well as the AGREEMed and GEANTech projects.

Conflicts of Interest

The authors declare no conflict of interest.

Appendix A. Detailed Coding Equations

(1) 
Domestic water demand equations
𝐷 𝐷𝑜𝑚(𝑡) = 𝑊𝑝(𝑡) × 𝑃𝑂𝑃(𝑡)
where:
  • Wp(t): the per capita water demand at time t.
  • POP(t): the population at time t.
To balance this loop, we must act either on the population growth rate or on the per capita water consumption rate.
𝑊(𝑡) = 𝑟𝑤𝑝(𝑡) × 𝑊𝑝(𝑡0) + 𝑊𝑝(𝑡0)
𝑃𝑂(𝑡) = 𝑟𝑝(𝑡) × 𝑃𝑂𝑃 (𝑡0) + 𝑃𝑂𝑃(𝑡0)
where:
rp(t): the rate of population growth at time t.
rw(t): the rate of change of the water demand per capita at time t.
S t o c k ( t ) = t 0 t ( I n f l o w ( t ) O u t f l o w ( t ) ) d t + S t o c k ( t 0 )
So:
W p ( t ) = t 0 t ( r w p ( t ) × W p ( t 1 ) ) d t + W p ( t 0 )
P O P ( t ) = t 0 t ( r p ( t ) × P O P ( t 1 ) ) d t + P O P ( t 0 )
If we want to work with updated rates every year, we will have:
𝐷 𝐷𝑜𝑚, 𝑖 = 𝑊𝑝𝑖 × 𝑃𝑂𝑃𝑖
𝑊𝑝𝑖 = 𝑊𝑝0 × (1 + 𝑟𝑤𝑝1)(1 + 𝑟𝑤𝑝2) … (1 + 𝑟𝑤𝑝𝑖)
𝑃𝑂𝑃𝑖 = 𝑃𝑂𝑃0 × (1 + 𝑟𝑝1)(1 + 𝑟𝑝2) … (1 + 𝑟𝑝𝑖)
where:
  • Wpi: the per capita water demand of the i-th year.
  • Wp0: the initial per capita water demand.
  • P0Pi: the population of the i-th year.
  • P0P0: the initial population.
  • rwpi: the growth rate of the per capita demand of the i-th year.
  • rpi: the growth rate of the population in the i-th year.
(2) 
Tourism water demand equations
𝐷 𝑇𝑜𝑢𝑟𝑖𝑠 (𝑡) = 𝑊𝑇(𝑡) × 𝑇𝑂𝑈𝑅(𝑡)
where:
  • WT(t): the water demand per tourist at time t.
  • TOUR(t): the number of tourists at time t.
It must be taken into account that the number of tourists increases during certain seasons like summer.
To balance this loop, technology must be used to modernize the distribution systems, which will reduce the total consumption per tourist/year.
𝑊(𝑡) = 𝑟𝑤𝑡(𝑡) × 𝑊𝑇(𝑡0) + 𝑊𝑇(𝑡0)
𝑇𝑂𝑈(𝑡) = 𝑟𝑡(𝑡) × 𝑇𝑂𝑈𝑅(𝑡0) + 𝑇𝑂𝑈𝑅(𝑡0)
where:
  • rw(t): the growth rate of water demand per tourist at time t.
  • rt(t): the growth rate of tourists at time t.
Also:
W T ( t ) = t 0 t ( r w ( t ) × W T ( t 1 ) ) d t + W T ( t 0 )
T O U R ( t ) = t 0 t ( r t ( t ) × T O U R ( t 1 ) ) d t + T O U R ( t 0 )
(3) 
Industrial water demand equations
Industrial development increases the number of industrial units. Consequently, the demand for industrial water increases and the availability of water decreases. To balance this loop, we will use in the coding equations the quantity of water used per industrial unit and introduce a parameter that is the technology index to reduce the quantity of water per industrial unit.
𝐷 𝐼𝑛𝑑, 𝑖 = 𝐼𝑁𝑃𝑖 × 𝑊𝐼0(1 − 𝛼𝑖𝑖)
𝐼𝑁𝑃𝑖 = 𝐼𝑁𝑃0 × (1 + 𝑟𝑖𝑛1)(1 + 𝑟𝑖𝑛2) … (1 + 𝑟𝑖𝑛𝑖)
where:
  • WI0: the initial water demand per unit of industrial production.
  • αii: the rate of reduction in water demand per unit of output in the i-th year.
  • INPi: the industrial output in the i-th year.
  • rin: the growth rate of industrial production.
(4) 
Agricultural water demand equations
𝐷𝐴𝑔𝑟, 𝑖 = 𝐼𝑅𝐷, 𝑖 × 𝐴𝑖𝑟𝑟, 𝑖 × 𝐾𝑖
𝐴𝑖𝑟𝑟, 𝑖 = 𝐴𝑖𝑟(0) × (1 + 𝑟𝐴1) … (1 + 𝑟𝐴𝑖)
𝑟𝐴𝑖 = 𝐾𝑀𝑖 − 𝐾𝑜𝑏𝑠𝑖
𝐼𝑅𝐷, 𝑖 = 𝐼𝑅(0) × (1 + 𝛼𝐴1)(1 + 𝛼𝐴2) … (1 + 𝛼𝐴𝑖)
where:
  • IRD,i: the water demand per hectare in year i.
  • AIrr,i: the area of irrigated land in hectare in the i-th year.
  • Ki: the agricultural development index.
  • rAi: the growth rate of the irrigated area in year i.
  • KMi: the multiplier factor of land in year i.
  • Kobsi: the conservative factor of land in year i.
  • αAi: the rate of decrease in irrigation demand per hectare at the i-th year.
If we want to partition the water consumption per hectare by crop type, we keep the same equation and introduce an index j. The equation becomes:
𝐷𝐴𝑔𝑟𝑖, 𝑖𝑗 = 𝐼𝑅𝐷, 𝑖𝑗 × 𝐴𝑖𝑟𝑟, 𝑖𝑗 × 𝐾𝑖𝑗
Then the water consumption for all crops is summed.
(5) 
Surface water supply equations
𝑇𝐼𝑆𝐹 = 𝑁𝐹 + 𝐼𝑇𝐹 + 𝑅𝑆𝐹 + 𝐷𝐹
𝐴𝑆𝑊 = 𝑇𝐼𝑆𝐹 + 𝑆 − (𝐸 + 𝑃)
where:
  • TISF: the total incoming surface water.
  • NF: natural inflow.
  • ITF: transferred inflow.
  • RSF: recycled water flow.
  • DF: Desalination water flow.
  • ASW: available surface water.
  • S: seepage.
  • E: evapotranspiration.
  • P: percolation to groundwater.
Also:
T I S F ( t ) = t 0 t ( N F ( t ) + I T F ( t ) + R S F ( t ) + D F ( t ) ) d t + T I S F ( t 0 )
A S W ( t ) = t 0 t ( T I S F ( t ) + S ( t ) ( E ( t ) + P ( t ) ) ) d t + A S W ( t 0 )
(6) 
Groundwater supply equations
𝑇𝐼𝐺𝑊 = 𝑁𝐼𝐺𝑊 + 𝑅𝐺𝑊𝑃
𝐴𝐺𝑊 = 𝑇𝐼𝐺𝑊 + 𝑃 − (𝑆 + 𝐸𝐺𝑊)
where:
  • TIGW: total incoming groundwater.
  • NIGW: natural groundwater inflow.
  • RGWP: recycled groundwater flow.
  • AGW: available groundwater.
  • EGW: evaporation from groundwater.
Also:
T I G W ( t ) = t 0 t ( N I G W ( t ) + R G W P ( t ) ) d t ) + T I G W ( t 0 )
A G W ( t ) = t 0 t ( T I G W ( t ) + P ( t ) ( S ( t ) + E G W ( t ) ) ) d t + A G W ( t 0 )
(7) 
Balance sheet
Total water demand:
𝐷 = 𝐷𝐷𝑜𝑚 + 𝐷𝐼𝑛𝑑 + 𝐷𝐴𝑔𝑟 + 𝐷𝑇𝑜𝑢𝑟𝑖𝑠
Total water supply:
𝐴 = 𝐴𝑆𝑊 + 𝐾 × 𝐴𝐺𝑊
where K: the drainage coefficient of the water table.
The durability index SI is calculated:
S I = A D A
In order not to have water stress, we must have a sustainability index SI > 20%.

References

  1. Connor, R. The United Nations World Water Development Report 2015: Water for a Sustainable World; UNESCO Publishing: Paris, France, 2015; Volume 1. [Google Scholar]
  2. Lasserre, F. Conflits hydrauliques et guerres de l’eau: Un essai de modélisation. Rev. Int. Et Strat. 2007, 66, 105–118. [Google Scholar] [CrossRef]
  3. Bazié, J.-B. Accès à l’eau: L’Afrique entre abondance et pénurie. Apres-Demain 2014, 3–4, 28–29. [Google Scholar] [CrossRef]
  4. Filho, W.L.; Balogun, A.-L.; Ayal, D.Y.; Bethurem, E.M.; Murambadoro, M.; Mambo, J.; Taddese, H.; Tefera, G.W.; Nagy, G.J.; Fudjumdjum, H.; et al. Strengthening climate change adaptation capacity in Africa- case studies from six major African cities and policy implications. Environ. Sci. Policy 2018, 86, 29–37. [Google Scholar] [CrossRef]
  5. Tramblay, Y.; Villarini, G.; Khalki, E.M.; Gründemann, G.; Hughes, D. Evaluation of the Drivers Responsible for Flooding in Africa. Water Resour. Res. 2021, 57, e2021WR029595. [Google Scholar] [CrossRef]
  6. Epule, T.E.; Ford, J.D.; Lwasa, S.; Lepage, L. Climate change adaptation in the Sahel. Environ. Sci. Policy 2017, 75, 121–137. [Google Scholar] [CrossRef]
  7. Döll, P.; Kaspar, F.; Lehner, B. A global hydrological model for deriving water availability indicators: Model tuning and validation. J. Hydrol. 2003, 270, 105–134. [Google Scholar] [CrossRef]
  8. Doulgeris, C.; Georgiou, P.; Papadimos, D.; Papamichail, D. Ecosystem approach to water resources management using the MIKE 11 modeling system in the Strymonas River and Lake Kerkini. J. Environ. Manag. 2012, 94, 132–143. [Google Scholar] [CrossRef]
  9. Yates, D.; Sieber, J.; Purkey, D.; Huber-Lee, A. WEAP21—A Demand-, Priority-, and Preference-Driven Water Planning Model: Part 1: Model characteristics. Water Int. 2005, 30, 487–500. [Google Scholar] [CrossRef]
  10. Maliehe, M.; Mulungu, D.M. Assessment of water availability for competing uses using SWAT and WEAP in South Phuthiatsana catchment, Lesotho. Phys. Chem. Earth Parts A/B/C 2017, 100, 305–316. [Google Scholar] [CrossRef]
  11. Van der Krogt, W. Technical Report: RIBASIM Version 7.01 User Manual Addendum; Deltares Institute: Utrecht, The Netherlands, 2010. [Google Scholar]
  12. Pedro-Monzonís, M.; del Longo, M.; Solera, A.; Pecora, S.; Andreu, J. Water Accounting in the Po River Basin Applied to Climate Change Scenarios. Procedia Eng. 2016, 162, 246–253. [Google Scholar] [CrossRef] [Green Version]
  13. Arnold, J.G.; Srinivasan, R.; Muttiah, R.S.; Williams, J.R. LARGE AREA HYDROLOGIC MODELING AND ASSESSMENT PART I: MODEL DEVELOPMENT. JAWRA J. Am. Water Resour. Assoc. 1998, 34, 73–89. [Google Scholar] [CrossRef]
  14. Sinan, M.; Belhouji, A. Impact of the climate change on the climate and the water resources of Morocco on horizons 2020, 2050 and 2080 and measures of adaptation. Houille Blanche 2016, 32–39. [Google Scholar] [CrossRef]
  15. Wang, J.; Wang, K.; Wei, Y.-M. How to balance China’s sustainable development goals through industrial restructuring: A multi-regional input–output optimization of the employment–energy–water–emissions nexus. Environ. Res. Lett. 2020, 15, 034018. [Google Scholar] [CrossRef]
  16. Bouchaou, L.; Tagma, T.; Boutaleb, S.; Hssaisoune, M.; El Morjani, Z.E.A. Climate change and its impacts on groundwater resources in Morocco: The case of the Souss-Massa basin. In Climate Change Effects on Groundwater Resources: A Global Synthesis of Findings and Recommendations; CRC Press: Boca Raton, FL, USA, 2011; Volume 129. [Google Scholar]
  17. Necibi, M.; Dhiba, D.; El Hajjaji, S. Contaminants of Emerging Concern in African Wastewater Effluents: Occurrence, Impact and Removal Technologies. Sustainability 2021, 13, 1125. [Google Scholar] [CrossRef]
  18. Woillez, M.-N. Revue de littérature sur le changement climatique au Maroc: Observations, projections et impacts. Pap. De Rech. 2019, 1–33. [Google Scholar] [CrossRef]
  19. Driouech, F.; Stafi, H.; Khouakhi, A.; Moutia, S.; Badi, W.; ElRhaz, K.; Chehbouni, A. Recent observed country-wide climate trends in Morocco. Int. J. Clim. 2021, 41, E855–E874. [Google Scholar] [CrossRef]
  20. Epule, T.E.; Chehbouni, A.; Dhiba, D.; Moto, M.W. The Readiness Index for Climate Change Adaptation in Africa: The Role of Climate and Adaptive Capacity Proxies. Appl. Sci. 2021, 11, 9413. [Google Scholar] [CrossRef]
  21. Epule, T.E.; Chehbouni, A.; Dhiba, D.; Etongo, D.; Achli, S.; Salih, W.; Er-Raki, S. Identifying gaps in actual and simulated/potential yield and growing season precipitation in Morocco. Environ. Sci. Pollut. Res. 2022, 29, 84844–84860. [Google Scholar] [CrossRef]
  22. Choukr-Allah, R.; Ragab, R.; Bouchaou, L.; Damià, B. The Handbook of Environmental Chemistry: The Souss-Massa River Basin, Morocco; Springer International Publishing: Berlin/Heidelberg, Germany, 2017; ISBN 978-3-319-51131-3. [Google Scholar]
  23. Direction de la Recherche et de la Planification de l’Eau (DRPE), Secrétariat d’Etat Chargé de l’Eau. Available online: http://www.water.gov.ma (accessed on 14 October 2022).
  24. Bouchaou, L.; Tagma, T.; Hsissou, Y.; Ikenne, M.; Boutaleb, S.; Bouragba, L.; Mudry, J.-N.; Michelot, J.-L. An isotopic study of surface water and groundwater in a semi-arid environment: Souss-Massa basin in SW Morocco. In Groundwater and climate in Africa. Proceedings of the Kampala Conference, Uganda, 24–28 June 2008; IAHS Press: Wallingford, UK, 2009; pp. 76–81. [Google Scholar]
  25. Bouchaou, L.; Choukr-Allah, R.; Hirich, A.; Seif-Ennasr, M.; Malki, M.; Abahous, H.; Nghira, A. Climate change and water valuation in Souss-Massa region: Management and adaptive measures. Eur. Water 2017, 60, 203–209. [Google Scholar]
  26. Bouchaou, L. Les problèmes majeurs de la gestion de l’eau au Maroc. Sci. Et Changements Planétaires/Sécheresse 2004, 15, 187–194. [Google Scholar]
  27. Conseil Economique, Social et Environnemental (CESE), Rapport Annuel 2020; CESE: Rabat, Morocco, 2020.
  28. Policy Center for the New South (PCNS), Rapport d’activité 2020; PCNS: Rabat, Morocco, 2020.
  29. Shukla, P.R.; Skea, J.; Buendia, E.C.; Masson-Delmotte, V.; Pörtner, H.-O.; Roberts, D.C.; Zhai, P.; Slade, R.; Connors, S.; Diemen, R. (Eds.) Summary for policymakers. In Climate Change and Land: An IPCC Special Report on Climate Change, Desertification, Land Degradation, Sustainable Land Management, Food Security, and Greenhouse Gas Fluxes in Terrestrial Ecosystems; Forthcoming: Geneva, Switzerland, 2019. [Google Scholar]
  30. Watson, R.; Baste, I.; Larigauderie, A.; Leadley, P.; Pascual, U.; Baptiste, B.; Mooney, H. Summary for Policymakers of the Global Assessment Report on Biodiversity and Ecosystem Services of the Intergovernmental Science-Policy Platform on Biodiversity and Ecosystem Services; IPBES Secretariat: Bonn, Germany, 2019. [Google Scholar]
  31. Agoumi, A.; Debbarh, A. Ressources en eau et bassins versants du Maroc: 50 ans de développement. In Report Prepared Within the Framework of the “Water: Management of Scarcity” Organized by the Association of Moroccan Engineers of Bridges and Roads; Ministère de l’Agriculture, de l’équipement et de l’environnement: Rabat, Morocco, 2005. [Google Scholar]
  32. Sadeq, H.T. Du droit de l’eau au droit à l’eau au Maroc et ailleurs; Eddif: Casablanca, Morocco, 2007; pp. 58–100. [Google Scholar]
  33. Mathez, A.; Loftus, A. Endless modernisation: Power and knowledge in the Green Morocco Plan. Environ. Plan. E Nat. Space 2022, 6, 25148486221101541. [Google Scholar] [CrossRef]
  34. Seif-Ennasr, M.; Abdelaziz, H.; Morjani, Z.E.A.E.; Redouane, C.-A.; Rashyd, Z.; Abdessadek, N.; Mouna, M.; Lhoussaine, B.; Elhassane, B. Assessment of Global Change Impacts on Groundwater Resources in Souss-Massa Basin; Springer Science and Business Media LLC: Berlin/Heidelberg, Germany, 2017; pp. 115–140. [Google Scholar] [CrossRef]
  35. Hssaisoune, M.; Bouchaou, L.; Sifeddine, A.; Bouimetarhan, I.; Chehbouni, A. Moroccan Groundwater Resources and Evolution with Global Climate Changes. Geosciences 2020, 10, 81. [Google Scholar] [CrossRef] [Green Version]
  36. Díaz, J.; Pérez, J. Projections Climatiques Pour la Région de Souss Massa Drâa: Décades 2045–2055 et 2090–2100. In Proceedings of the Séminaire de Diffusion des Résultats du Projet Climacte, Marrakech, Morocco, 20–23 October 2014. [Google Scholar]
  37. Seif-Ennasr, M.; Zaaboul, R.; Hirich, A.; Caroletti, G.N.; Bouchaou, L.; Morjani, Z.E.A.E.; Beraaouz, E.H.; McDonnell, R.A.; Choukr-Allah, R. Climate change and adaptive water management measures in Chtouka Aït Baha region (Morocco). Sci. Total Environ. 2016, 573, 862–875. [Google Scholar] [CrossRef] [PubMed]
  38. Elame, F.; Lionboui, H.; Redouane, C.-A. Water Use Efficiency and Valuation in Agriculture in the Souss-Massa. Handb. Environ. Chem. 2016, 53, 275–283. [Google Scholar] [CrossRef]
  39. Seif-Ennasr, M.; Bouchaou, L.; Morjani, Z.; Hirich, A.; Beraaouz, E.; Choukr-Allah, R. GIS-Based Land Suitability and Crop Vulnerability Assessment under Climate Change in Chtouka Ait Baha, Morocco. Atmosphere 2020, 11, 1167. [Google Scholar] [CrossRef]
  40. Choukr-Allah, R.; Nghira, A.; Hirich, A.; Bouchaou, L. Water Resources Master Plan for Sustainable Development of the Souss-Massa River Basin. Handb. Environ. Chem. 2016, 53, 1–26. [Google Scholar] [CrossRef]
  41. Mansir, I.; Bouchaou, L.; Chebli, B.; Brahim, Y.A.; Choukr-Allah, R. A specific indicator approach for the assessment of water resource vulnerability in arid areas: The case of the Souss-Massa Region (Morocco). Hydrol. Sci. J. 2021, 66, 1151–1168. [Google Scholar] [CrossRef]
  42. Capellán-Pérez, I.; de Blas, I.; Nieto, J.; de Castro, C.; Miguel, L.J.; Carpintero, L.; Mediavilla, M.; Lobejón, L.F.; Ferreras-Alonso, N.; Rodrigo, P.; et al. MEDEAS: A new modeling framework integrating global biophysical and socioeconomic constraints. Energy Environ. Sci. 2020, 13, 986–1017. [Google Scholar] [CrossRef]
  43. Turner, B.L.; Menendez, H.M.; Gates, R.; Tedeschi, L.O.; Atzori, A.S. System Dynamics Modeling for Agricultural and Natural Resource Management Issues: Review of Some Past Cases and Forecasting Future Roles. Resources 2016, 5, 40. [Google Scholar] [CrossRef] [Green Version]
  44. Zhao, J.; Gómez-Expósito, A.; Netto, M.; Mili, L.; Abur, A.; Terzija, V.; Kamwa, I.; Pal, B.; Singh, A.K.; Qi, J.; et al. Power System Dynamic State Estimation: Motivations, Definitions, Methodologies, and Future Work. IEEE Trans. Power Syst. 2019, 34, 3188–3198. [Google Scholar] [CrossRef]
  45. Al-Jawad, J.Y.; Alsaffar, H.M.; Bertram, D.; Kalin, R.M. A comprehensive optimum integrated water resources management approach for multidisciplinary water resources management problems. J. Environ. Manag. 2019, 239, 211–224. [Google Scholar] [CrossRef]
  46. Bai, Y.; Langarudi, S.; Fernald, A. System Dynamics Modeling for Evaluating Regional Hydrologic and Economic Effects of Irrigation Efficiency Policy. Hydrology 2021, 8, 61. [Google Scholar] [CrossRef]
  47. Sangchini, E.K.; Ownegh, M.; Sadoddin, A.; Zarghami, M. An Integrated System Dynamics Model to Predict the Effects of Management Scenarios on Economic Assessment of Water and Soil Resources in Hableh-Rud River Basin, Iran. In Water Resources in Arid Lands: Management and Sustainability; Springer: Cham, Switzerland, 2021; pp. 25–36. [Google Scholar] [CrossRef]
  48. Ghasemi, A.; Saghafian, B.; Golian, S. System dynamics approach for simulating water resources of an urban water system with emphasis on sustainability of groundwater. Environ. Earth Sci. 2017, 76, 637. [Google Scholar] [CrossRef]
  49. Bates, G.; Beruvides, M.; Fedler, C.B. System Dynamics Approach to Groundwater Storage Modeling for Basin-Scale Planning. Water 2019, 11, 1907. [Google Scholar] [CrossRef] [Green Version]
  50. Xi, X.; Poh, K.L. Using System Dynamics for Sustainable Water Resources Management in Singapore. Procedia Comput. Sci. 2013, 16, 157–166. [Google Scholar] [CrossRef] [Green Version]
  51. Dace, E.; Muizniece, I.; Blumberga, A.; Kaczala, F. Searching for solutions to mitigate greenhouse gas emissions by agricultural policy decisions—Application of system dynamics modeling for the case of Latvia. Sci. Total. Environ. 2015, 527–528, 80–90. [Google Scholar] [CrossRef]
  52. Pluchinotta, I.; Pagano, A.; Giordano, R.; Tsoukiàs, A. A system dynamics model for supporting decision-makers in irrigation water management. J. Environ. Manag. 2018, 223, 815–824. [Google Scholar] [CrossRef]
  53. Brahim, Y.A.; Seif-Ennasr, M.; Malki, M.; N’Da, B.; Choukrallah, R.; El Morjani, Z.E.A.; Sifeddine, A.; Abahous, H.; Bouchaou, L. Assessment of Climate and Land Use Changes: Impacts on Groundwater Resources in the Souss-Massa River Basin. In The Souss-Massa River Basin, Morocco; Springer International Publishing: Cham, Switzerland, 2016; pp. 121–142. [Google Scholar] [CrossRef]
  54. Ait Brahim, Y.; Saidi, M.E.M.; Kouraiss, K.; Sifeddine, A.; Bouchaou, L. Analysis of observed climate trends and high resolution scenarios for the 21st century in Morocco. J. Mater. Environ. Sci. 2017, 8, 1375–1384. [Google Scholar]
  55. Attar, O.; Brouziyne, Y.; Bouchaou, L.; Chehbouni, A. A Critical Review of Studies on Water Resources in the Souss-Massa Basin, Morocco: Envisioning a Water Research Agenda for Local Sustainable Development. Water 2022, 14, 1355. [Google Scholar] [CrossRef]
  56. HCP. Available online: https://www.hcp.ma (accessed on 6 October 2022).
  57. ABHSM. Situation des Ressources en Eau dans le Bassin de Souss-Massa-Gestion de la Pénurie; ABHSM: Agadir, Morocco, 2020. [Google Scholar]
  58. Sterman, J.D. System Dynamics Modeling for Project Management; Unpublished Manuscript; System Dynamics Group, Sloan School of Management, Massachusetts Institute of Technology: Cambridge, MA, USA, 1992; Volume 246. [Google Scholar]
  59. Sterman, J.D. Learning in and about complex systems. Syst. Dyn. Rev. 1994, 10, 291–330. [Google Scholar] [CrossRef] [Green Version]
  60. Sterman, J.D. System Dynamics: Systems Thinking and Modeling for a Complex World; Massachusetts Institute of Technology. Engineering Systems Division: Cambridge, MA, USA, 2002. [Google Scholar]
  61. Sterman, J.D. All models are wrong: Reflections on becoming a systems scientist. Syst. Dyn. Rev. J. Syst. Dyn. Soc. 2002, 18, 501–531. [Google Scholar] [CrossRef]
  62. Forrester, J.W. Industrial Dynamics. J. Oper. Res. Soc. 1997, 48, 1037–1041. [Google Scholar] [CrossRef]
  63. Forrester, J.W. System dynamics, systems thinking, and soft OR. Syst. Dyn. Rev. 1994, 10, 245–256. [Google Scholar] [CrossRef]
  64. Forrester, J.W. The Beginning of System Dynamics; The McKinsey Quarterly: Chicago, IL, USA, 1995. [Google Scholar]
  65. Forrester, J.W. System dynamics—The next fifty years. Syst. Dyn. Rev. J. Syst. Dyn. Soc. 2007, 23, 359–370. [Google Scholar] [CrossRef]
  66. Meadows, D.; Meadows, D.L.; Randers, J.; Behrens, W.W. Perspectives, Problems, and Models: From The Limits to Growth (1972. In The Sustainable Urban Development Reader; Routledge: London, UK, 2014; pp. 50–54. ISBN 9781315770369. [Google Scholar]
  67. Meadows, D.H.; Meadows, D.L.; Randers, J. Beyond the limits. [Human populations and resource depletion]. World Watch (United States) 1992, 6, 15–28. [Google Scholar]
  68. Meadows, D.H.; Randers, J.; Meadows, D.L. The Limits to Growth: The 30-Year Update; Saarinen, J., Ed.; Destinations in change: The transformation process of tourist destinations. Tourist Studies; Chelsea Green: White River Junction, VT, USA, 2004; Volume 4, pp. 161–179. [Google Scholar]
  69. Simonovic, S.P.; Fahmy, H.; El-Shorbagy, A. The Use of Object-Oriented Modeling for Water Resources Planning in Egypt. Water Resour. Manag. 1997, 11, 243–261. [Google Scholar] [CrossRef]
  70. Garcia, J.M. Theory and Practical Exercises of System Dynamics: Modeling and Simulation with Vensim PLE; Preface John Sterman; Juan Martín García: Barcelona, Spain, 2020; pp. 25–96. [Google Scholar]
  71. Barlas, Y.; Carpenter, S. Philosophical roots of model validation: Two paradigms. Syst. Dyn. Rev. 1990, 6, 148–166. [Google Scholar] [CrossRef]
  72. Barlas, Y. Formal aspects of model validity and validation in system dynamics. Syst. Dyn. Rev. J. Syst. Dyn. Soc. 1996, 12, 183–210. [Google Scholar] [CrossRef]
  73. Sterman, J.; Oliva, R.; Linderman, K.; Bendoly, E. System dynamics perspectives and modeling opportunities for research in operations management. J. Oper. Manag. 2015, 39, 40. [Google Scholar] [CrossRef]
  74. Ford, D.N.; Lyneis, J.M. System Dynamics Applied to Project Management: A Survey, Assessment, and Directions for Future Research. Syst. Dyn. Theory Appl. 2020, 2, 285–314. [Google Scholar] [CrossRef]
  75. Sterman, J.D. Does formal system dynamics training improve people’s understanding of accumulation? Syst. Dyn. Rev. 2010, 26, 316–334. [Google Scholar] [CrossRef] [Green Version]
  76. Azar, A.T. System dynamics as a useful technique for complex systems. Int. J. Ind. Syst. Eng. 2012, 10, 377–410. [Google Scholar] [CrossRef]
  77. Sweeney, L.B.; Sterman, J.D. Bathtub dynamics: Initial results of a systems thinking inventory. Syst. Dyn. Rev. J. Syst. Dyn. Soc. 2000, 16, 249–286. [Google Scholar] [CrossRef] [Green Version]
  78. Pallant, A.; Lee, H.-S. Teaching Sustainability Through System Dynamics: Exploring Stocks and Flows Embedded in Dynamic Computer Models of an Agricultural Land Management System. J. Geosci. Educ. 2017, 65, 146–157. [Google Scholar] [CrossRef]
  79. Clifford Holmes, J.K.; Slinger, J.H.; Musango, J.K.; Brent, A.C.; Palmer, C.G. Using system dynamics to explore the water supply and demand dilemmas of a small South African municipality. In Proceedings of the 32nd International Conference of the System Dynamics Society, Delft, The Netherlands, 20–24 July 2014; Authors Version. System Dynamics Society: LIttleton, MA, USA, 2014. [Google Scholar]
  80. Bala, B.K.; Arshad, F.M.; Noh, K.M. System dynamics. In Modelling and Simulation; Springer: London, UK, 2017; p. 274. ISBN 978-981-10-2045-2. [Google Scholar]
  81. Karnopp, D.; Margolis, D.L.; Rosenberg, R.C. System Dynamics: Modeling, Simulation, and Control of Mechatronic Systems; John Wiley & Sons: Hoboken, NJ, USA, 2012; pp. 16–84. [Google Scholar]
  82. Clark, R.N. Control System Dynamics; Cambridge University Press: Cambridge, UK, 1996; pp. 52–78. [Google Scholar]
  83. Machowski, J.; Bialek, J.; Bumby, J.R.; Bumby, J. Power System Dynamics: Stability and Control; John Wiley & Sons: Hoboken, NJ, USA, 2020; pp. 24–65. [Google Scholar]
  84. Oliva, R. Model calibration as a testing strategy for system dynamics models. Eur. J. Oper. Res. 2003, 151, 552–568. [Google Scholar] [CrossRef]
  85. Chen, Z.; Wei, S. Application of System Dynamics to Water Security Research. Water Resour. Manag. 2014, 28, 287–300. [Google Scholar] [CrossRef]
  86. Soltani, M.; Alizadeh, H.A. Integrated Water Resources Management at Basin Scale (IWMsim) Using a System Dynamics Approach. J. Water Soil Resour. Conserv. 2018, 7, 69–90. [Google Scholar]
  87. Chan, W.K.; Schruben, L. Optimization Models of Discrete-Event System Dynamics. Oper. Res. 2008, 56, 1218–1237. [Google Scholar] [CrossRef]
  88. Duggan, J. Using system dynamics and multiple objective optimization to support policy analysis for complex systems. In Complex Decision Making; Springer: Berlin/Heidelberg, Germany, 2008; pp. 59–81. [Google Scholar]
  89. Dangerfield, B.; Roberts, C. An Overview of Strategy and Tactics in System Dynamics Optimization. Syst. Dyn. 2018, 165–196. [Google Scholar] [CrossRef]
  90. Forrester, J.W. Lessons from system dynamics modeling. Syst. Dyn. Rev. 1987, 3, 136–149. [Google Scholar] [CrossRef]
  91. Coyle, R.G. The use of optimization methods for policy design in a system dynamics model. Syst. Dyn. Rev. 1985, 1, 81–91. [Google Scholar] [CrossRef]
  92. Coyle, R.G. System Dynamics Modelling: A Practical Approach. J. Oper. Res. Soc. 1997, 48, 544. [Google Scholar] [CrossRef]
  93. Coyle, G. Qualitative and quantitative modelling in system dynamics: Some research questions. Syst. Dyn. Rev. J. Syst. Dyn. Soc. 2000, 16, 225–244. [Google Scholar] [CrossRef]
  94. Ford, A.; Ford, F.A. Modeling the Environment: An Introduction to System Dynamics Models of Environmental Systems; Island Press: Washington, DC, USA, 1999; pp. 18–116. [Google Scholar]
  95. Martinez-Moyano, I.J.; Richardson, G.P. Best practices in system dynamics modeling. Syst. Dyn. Rev. 2013, 29, 102–123. [Google Scholar] [CrossRef]
  96. Rebs, T.; Brandenburg, M.; Seuring, S. System dynamics modeling for sustainable supply chain management: A literature review and systems thinking approach. J. Clean. Prod. 2019, 208, 1265–1280. [Google Scholar] [CrossRef]
  97. Komariah, I.; Matsumoto, T. System dynamics for water resource sustainability issues: Assessing the impact of river restoration plans in the Upper-Middle Ciliwung river basin, Indonesia. Int. J. River Basin Manag. 2021, 19, 565–574. [Google Scholar] [CrossRef]
  98. Ahmad, S.; Simonovic, S.P. Spatial System Dynamics: New Approach for Simulation of Water Resources Systems. J. Comput. Civ. Eng. 2004, 18, 331–340. [Google Scholar] [CrossRef]
  99. Gohari, A.; Mirchi, A.; Madani, K. System Dynamics Evaluation of Climate Change Adaptation Strategies for Water Resources Management in Central Iran. Water Resour. Manag. 2017, 31, 1413–1434. [Google Scholar] [CrossRef] [Green Version]
  100. Simonović, S.P. Managing Water Resources: Methods and Tools for a Systems Approach; Routledge: London, UK, 2009. [Google Scholar] [CrossRef] [Green Version]
  101. Barlas, Y. System dynamics: Systemic feedback modeling for policy analysis. System 2007, 1, 1–68. [Google Scholar]
  102. Simonovic, S.P. Systems Approach to Management of Water Resources—Toward Performance Based Water Resources Engineering. Water 2020, 12, 1208. [Google Scholar] [CrossRef]
  103. Madani, K.; Mariño, M.A. System Dynamics Analysis for Managing Iran’s Zayandeh-Rud River Basin. Water Resour. Manag. 2009, 23, 2163–2187. [Google Scholar] [CrossRef]
  104. Sterman, J.D.; Siegel, L.; Rooney-Varga, J.N. Does replacing coal with wood lower CO2 emissions? Dynamic lifecycle analysis of wood bioenergy. Environ. Res. Lett. 2018, 13, 015007. [Google Scholar] [CrossRef]
  105. Pasqualino, R.; Jones, A.W.; Monasterolo, I.; Phillips, A. Understanding Global Systems Today—A Calibration of the World3-03 Model between 1995 and 2012. Sustainability 2015, 7, 9864–9889. [Google Scholar] [CrossRef] [Green Version]
  106. Mirchi, A.; Watkins, D.; Madani, K. Modeling for watershed planning, management, and decision making. In Watersheds: Management, Restoration and Environmental Impact; Nova Science Publishers: New York, NY, USA, 2010; pp. 1–25. [Google Scholar]
  107. Mirchi, A.; Madani, K.; Watkins, D.; Ahmad, S. Synthesis of System Dynamics Tools for Holistic Conceptualization of Water Resources Problems. Water Resour. Manag. 2012, 26, 2421–2442. [Google Scholar] [CrossRef]
  108. Kotir, J.H.; Smith, C.; Brown, G.; Marshall, N.; Johnstone, R. A system dynamics simulation model for sustainable water resources management and agricultural development in the Volta River Basin, Ghana. Sci. Total. Environ. 2016, 573, 444–457. [Google Scholar] [CrossRef]
  109. Abdolabadi, H.; Sarang, A.; Ardestani, M.; Little, J. Estimating the Available Water in the Watershed using System Dynamics Hydrological Model (Case Study: Ilam Watershed). Environ. Energy Econ. Res. 2018, 2, 265–280. [Google Scholar] [CrossRef]
  110. Zare, F.; Elsawah, S.; Bagheri, A.; Nabavi, E.; Jakeman, A.J. Improved integrated water resource modelling by combining DPSIR and system dynamics conceptual modelling techniques. J. Environ. Manag. 2019, 246, 27–41. [Google Scholar] [CrossRef]
  111. Abdi-Dehkordi, M.; Bozorg-Haddad, O.; Salavitabar, A.; Goharian, E. Developing a sustainability assessment framework for integrated management of water resources systems using distributed zoning and system dynamics approaches. Environ. Dev. Sustain. 2021, 23, 16246–16282. [Google Scholar] [CrossRef]
  112. Naderi, M.M.; Mirchi, A.; Bavani, A.R.M.; Goharian, E.; Madani, K. System dynamics simulation of regional water supply and demand using a food-energy-water nexus approach: Application to Qazvin Plain, Iran. J. Environ. Manag. 2021, 280, 111843. [Google Scholar] [CrossRef]
  113. Xu, Z.X.; Takeuchi, K.; Ishidaira, H.; Zhang, X.W. Sustainability Analysis for Yellow River Water Resources Using the System Dynamics Approach. Water Resour. Manag. 2002, 16, 239–261. [Google Scholar] [CrossRef]
  114. Tidwell, V.C.; Passell, H.D.; Conrad, S.H.; Thomas, R.P. System dynamics modeling for community-based water planning: Application to the Middle Rio Grande. Aquat. Sci. 2004, 66, 357–372. [Google Scholar] [CrossRef]
  115. Dai, S.; Li, L.; Xu, H.; Pan, X.; Li, X. A system dynamics approach for water resources policy analysis in arid land: A model for Manas River Basin. J. Arid. Land 2013, 5, 118–131. [Google Scholar] [CrossRef]
  116. Abadi, L.S.K.; Shamsai, A.; Goharnejad, H. An analysis of the sustainability of basin water resources using Vensim model. KSCE J. Civ. Eng. 2015, 19, 1941–1949. [Google Scholar] [CrossRef]
  117. Li, T.; Yang, S.; Tan, M. Simulation and optimization of water supply and demand balance in Shenzhen: A system dynamics approach. J. Clean. Prod. 2019, 207, 882–893. [Google Scholar] [CrossRef]
  118. Shahvi, S.; Mellander, P.-E.; Jordan, P.; Fenton, O. A Fuzzy Cognitive Map method for integrated and participatory water governance and indicators affecting drinking water supplies. Sci. Total. Environ. 2021, 750, 142193. [Google Scholar] [CrossRef]
  119. Baghanam, A.H.; Seifi, A.J.; Sheikhbabaei, A.; Hassanzadeh, Y.; Besharat, M.; Asadi, E. Policy-Making toward Integrated Water Resources Management of Zarrine River Basin via System Dynamics Approach under Climate Change Impact. Sustainability 2022, 14, 3376. [Google Scholar] [CrossRef]
  120. Feng, M.; Liu, P.; Li, Z.; Zhang, J.; Liu, D.; Xiong, L. Modeling the nexus across water supply, power generation and environment systems using the system dynamics approach: Hehuang Region, China. J. Hydrol. 2016, 543, 344–359. [Google Scholar] [CrossRef]
  121. Tian, Y.; Li, C.; Yi, Y.; Wang, X.; Shu, A. Dynamic Model of a Sustainable Water Resources Utilization System with Coupled Water Quality and Quantity in Tianjin City. Sustainability 2020, 12, 4254. [Google Scholar] [CrossRef]
  122. Benabderrazik, K.; Kopainsky, B.; Tazi, L.; Joerin, J.; Six, J. Agricultural intensification can no longer ignore water conservation—A systemic modelling approach to the case of tomato producers in Morocco. Agric. Water Manag. 2021, 256, 107082. [Google Scholar] [CrossRef]
  123. Sterman, J.D.; Sweeney, L.B. Managing Complex Dynamic Systems: Challenge and Opportunity for. In How Professionals Make Decisions; Lawrence Erlbaum Associates Publishers: Mahwah, NJ, USA, 2004; p. 57. [Google Scholar]
  124. Sterman, J.D. Learning from Evidence in a Complex World. Am. J. Public Health 2006, 96, 505–514. [Google Scholar] [CrossRef]
  125. Stave, K.A. A system dynamics model to facilitate public understanding of water management options in Las Vegas, Nevada. J. Environ. Manag. 2003, 67, 303–313. [Google Scholar] [CrossRef]
  126. Balali, H.; Viaggi, D. Applying a System Dynamics Approach for Modeling Groundwater Dynamics to Depletion under Different Economical and Climate Change Scenarios. Water 2015, 7, 5258–5271. [Google Scholar] [CrossRef] [Green Version]
  127. Ahmadi, M.H.; Zarghami, M. Should water supply for megacities depend on outside resources? A Monte-Carlo system dynamics simulation for Shiraz, Iran. Sustain. Cities Soc. 2019, 44, 163–170. [Google Scholar] [CrossRef]
  128. Barati, A.A.; Azadi, H.; Scheffran, J. A system dynamics model of smart groundwater governance. Agric. Water Manag. 2019, 221, 502–518. [Google Scholar] [CrossRef]
  129. de Araujo, W.C.; Esquerre, K.P.O.; Sahin, O. Building a System Dynamics Model to Support Water Management: A Case Study of the Semiarid Region in the Brazilian Northeast. Water 2019, 11, 2513. [Google Scholar] [CrossRef] [Green Version]
  130. Keyhanpour, M.J.; Jahromi, S.H.M.; Ebrahimi, H. System dynamics model of sustainable water resources management using the Nexus Water-Food-Energy approach. Ain Shams Eng. J. 2021, 12, 1267–1281. [Google Scholar] [CrossRef]
  131. Mashaly, A.F.; Fernald, A.G. Analyzing and Assessing Dynamic Behavior of a Physical Supply and Demand System for Sustainable Water Management under a Semi-Arid Environment. Water 2022, 14, 1939. [Google Scholar] [CrossRef]
  132. Zomorodian, M.; Lai, S.H.; Homayounfar, M.; Ibrahim, S.; Fatemi, E.; El-Shafie, A. The state-of-the-art system dynamics application in integrated water resources modeling. J. Environ. Manag. 2018, 227, 294–304. [Google Scholar] [CrossRef]
  133. Phan, T.D.; Bertone, E.; Stewart, R.A. Critical review of system dynamics modelling applications for water resources planning and management. Clean. Environ. Syst. 2021, 2, 100031. [Google Scholar] [CrossRef]
  134. Winz, I.; Brierley, G.; Trowsdale, S. The Use of System Dynamics Simulation in Water Resources Management. Water Resour. Manag. 2009, 23, 1301–1323. [Google Scholar] [CrossRef]
  135. Gastelum, J.R.; Krishnamurthy, G.; Ochoa, N.; Sibbett, S.; Armstrong, M.; Kalaria, P. The Use of System Dynamics Model to Enhance Integrated Resources Planning Implementation. Water Resour. Manag. 2018, 32, 2247–2260. [Google Scholar] [CrossRef]
  136. ABHSM. Etude de Modélisation de L’impact du Changement Climatique Sur Les Ressources en Eau du Bassin Hydraulique de Sous Massa (Mission I, II, III); ABHSM: Agadir, Morocco, 2019. [Google Scholar]
  137. Vojdani, H.R.; Farhadi, A.A. Introduction of system dynamics model in analysis of sustainability of water resources. Water Env. J. Iran Water Swage Eng. 2005, 61, 15–22. [Google Scholar]
  138. Sapiri, H.; Zulkepli, J.; Ahmad, N.; Abidin, N.Z.; Hawari, N.N. Introduction to System Dynamic Modelling and Vensim Software: UUM Press; UUM Press: Kedah, Malaysia, 2017; pp. 1–108. [Google Scholar]
  139. Mundra, I.W.; Hirijanto, H. SYSTEM DYNAMICS FOR SIMULATION MODEL OF MATERIAL COST IN WATER RECOURCES PROJECT. J. Sustain. Technol. Appl. Sci. (JSTAS) 2020, 1, 25–32. [Google Scholar] [CrossRef]
  140. Koushali, H.P.; Moshtagh, R.; Mastoori, R. Water Resources Modelling Using System Dynamic in Vensim. J. Water Resour. Hydraul. Eng. 2015, 4, 251–256. [Google Scholar] [CrossRef]
  141. Good, P.; Perkins, P. Simulation Software: Anylogic and Vensim; Morehead State University: Morehead, KY, USA, 2019. [Google Scholar]
  142. Pruyt, E. Dealing with uncertainties? Combining system dynamics with multiple criteria decision analysis or with exploratory modelling. In Proceedings of the 25th International Conference of the System Dynamics Society, Boston, MA, USA, 29 July–2 August 2007; The System Dynamics Society: Littleton, MA, USA, 2007. pp. 1–22.
  143. Pruyt, E.; Kwakkel, J. System dynamics and uncertainty. In Proceedings of the International System Dynamics Conference, Delft, The Netherlands, 20–24 July 2014. [Google Scholar]
  144. Pruyt, E. Integrating Systems Modelling and Data Science: The Joint Future of Simulation and ‘Big Data’ Science. Int. J. Syst. Dyn. Appl. 2016, 5, 1–16. [Google Scholar] [CrossRef] [Green Version]
  145. Hekimoğlu, M.; Barlas, Y. Sensitivity analysis for models with multiple behavior modes: A method based on behavior pattern measures. Syst. Dyn. Rev. 2016, 32, 332–362. [Google Scholar] [CrossRef]
  146. Elsawah, S.; Danesh, D.; Ryan, M. A strategic asset planning decision analysis: An integrated System Dynamics and multi-criteria decision-making method. In INCOSE International Symposium; International Council on Systems Engineering: Orlando, FL, USA, 2016; Volume 29, pp. 788–802. [Google Scholar] [CrossRef]
  147. Belaqziz, S.; Khabba, S.; Er-Raki, S.; Jarlan, L.; Le Page, M.; Kharrou, M.H.; El Adnani, M.; Chehbouni, A. A new irrigation priority index based on remote sensing data for assessing the networks irrigation scheduling. Agric. Water Manag. 2013, 119, 1–9. [Google Scholar] [CrossRef]
  148. El Mahdad, E.; Ouhajou, L.; El Fasskaoui, M.; Aslikh, A.; Nghira, A.; Fdil, F.; Baroud, A.; Barceló, D. Experiences, Success Stories, and Lessons Learnt from the Implementation of the Water Law Framework Directive in the Souss-Massa River Basin. Handb. Environ. Chem. 2016, 53, 303–333. [Google Scholar] [CrossRef]
  149. Berger, E.; Bossenbroek, L.; Beermann, A.J.; Schäfer, R.B.; Znari, M.; Riethmüller, S.; Sidhu, N.; Kaczmarek, N.; Benaissa, H.; Ghamizi, M.; et al. Social-ecological interactions in the Draa River Basin, southern Morocco: Towards nature conservation and human well-being using the IPBES framework. Sci. Total. Environ. 2021, 769, 144492. [Google Scholar] [CrossRef]
  150. Hirich, A.; Choukr-Allah, R.; Nrhira, A.; Malki, M.; Bouchaou, L. Contribution of Seawater Desalination to Cope with Water Scarcity in Souss-Massa Region in Southern Morocco. Handb. Environ. Chem. 2016, 53, 213–226. [Google Scholar] [CrossRef]
  151. Belabhir, A.; Mansir, I.; Bouchaou, L.; El Otmani, M.; Yaacoubi, B.; Choukr-Allah, R. Effect of Treated Wastewater on the Growth and Yield of Two Sweet Corn Varieties: Impact of Doses and Systems of Irrigation. In Water Resources in Arid Lands: Management and Sustainability; Springer: Cham, Switzerland, 2021; pp. 263–275. [Google Scholar]
  152. Azemzi, H.; Erraoui, E.H. Irrigation water management and collective action: Understanding the shift from community management to participatory management in Souss-Massa (Morocco). Euro-Mediterr. J. Environ. Integr. 2021, 6, 1. [Google Scholar] [CrossRef]
  153. Haddouch, M.; Elame, F.; Abahous, H.; Choukr-Allah, R. Socio-economics and governance of water resources in the Souss-Massa river basin. In The Souss-Massa River Basin, Morocco; Springer: Cham, Switzerland, 2017; Volume 53, pp. 335–349. [Google Scholar] [CrossRef]
  154. Ez-Zaouy, Y.; Bouchaou, L.; Saad, A.; Hssaisoune, M.; Brouziyne, Y.; Dhiba, D.; Chehbouni, A. Morocco’s coastal aquifers: Recent observations, evolution and perspectives towards sustainability. Environ. Pollut. 2022, 293, 118498. [Google Scholar] [CrossRef]
  155. Davies, E.G.; Simonovic, S.P. Global water resources modeling with an integrated model of the social–economic–environmental system. Adv. Water Resour. 2011, 34, 684–700. [Google Scholar] [CrossRef]
  156. D’Alessandro, S.; Cieplinski, A.; Distefano, T.; Dittmer, K. Feasible alternatives to green growth. Nat. Sustain. 2020, 3, 329–335. [Google Scholar] [CrossRef]
  157. Distefano, T.; Isaza, A.S.; Muñoz, E.; Builes, T. Sub-national water–food–labour nexus in Colombia. J. Clean. Prod. 2022, 335, 130138. [Google Scholar] [CrossRef]
Figure 1. Hydrographic network and dams of Souss-Massa.
Water 15 01506 g001
Figure 2. Causal loop diagram mapping the key parameters that impact water demand in the Souss-Massa basin.
Water 15 01506 g002
Figure 3. Causal loop diagram mapping the key parameters that impact water supply in the Souss-Massa basin.
Water 15 01506 g003
Figure 4. Stock–flow diagram showing the interactions between key water demand parameters in the Souss-Massa basin.
Water 15 01506 g004
Figure 5. Stock–flow diagram showing the interactions between key water supply parameters in the Souss-Massa basin.
Water 15 01506 g005
Figure 6. System Dynamics model simulation in the Souss-Massa basin.
Water 15 01506 g006
Figure 7. Results of the simulation of the System Dynamics model for the period spanning between 2007 and 2020: (A) Groundwater drawdown (Mm3); (B) Sustainability index (SI); (C) Water demands (m3).
Water 15 01506 g007
Figure 8. Correlation matrix of the System Dynamics model parameters.
Water 15 01506 g008
Figure 9. Ranking of the key parameters of the System Dynamics model in the Souss-Massa basin.
Water 15 01506 g009
Table 1. Variable and constant parameters integrated in the System Dynamics model.
FactorsKey VariablesStocks
Surface water supplyDesalination water: DW
Interbasin transfer water: TRW
Recycled water: RW
Rate of increase of recycled water: αR
Interbasin transfer water rate: αTR
Rate of increase of desalination water: αD
Rate of industrial development: rin,i
Total natural inflow surface water: Total NSW
Precipitation: P
Flow: Q
Evaporation: E
Available
surface water supply ASW
Groundwater supplyNatural incoming groundwater: NGW
Returned groundwater after use: RGW
Available groundwater supply AGW
Water demandWater demand per capita: WP
Population: POP
Rate of decrease in per capita water consumption: rwp
Population growth rate: rp
Domestic
water
demand Dom,D
Water demand per tourist: WT
Tourists: TOUR
Rate of water demand per tourist: rwt
Growth rate of tourists: rt
Tourism
water
demand Touris,D
Water consumption by industry: WI
Rate of growth of industrial development: rin
Industrial
water
demand Ind,D
Irrigation water consumption/ha: IRE
Area of irrigated farmland: IrrA
Rate of change of irrigated area: rAi
Rate of change of water consumption per hectare: rAgri
Agricultural water
demand Agri,D
Table 2. Summary of System Dynamics model results.
YearsWater Demand (m3)Water Supply (m3)SIGWD (Mm3)
DomesticIndustrialTourismAgriculturalWDAGWASWASW/WD (%)RWWS
200769,849,318658,000885,619994,000,0001,092,410,853227,740,000114,600,0007.340342,340,000−215.92746.62
200871,743,214689,913861,446979,792,9171,079,338,925234,060,000128,820,0008.350362,880,000−195.961461.26
200973,653,457721,826824,744965,500,6681,066,792,066452,720,000439,340,00028.830892,060,000−23.671665.44
2010755,880,048753,739916,598951,123,2531,056,874,390513,960,000731,010,00048.4201,244,970,00010.91536.19
201177,522,986785,652889,166936,660,6731,040,770,052412,290,000500,010,00033.630912,300,000−18.761700.61
201279,482,272817,565920,881921,906,9601,031,267,621195,320,000140,240,0009.520335,560,000−207.52396.5
201381,457,906849,478946,388915,453,6111,024,717,546353,810,000396,580,00027.090750,390,000−41.452696.76
201483,449,886881,391961,529909,000,2631,020,408,259146,280,00082,790,0005.680229,070,000−335.293482.75
201585,458,215913,304944,498902,546,9141,015,209,965481,590,000642,210,00044.280112,380,0005.43424.84
201687,482,891945,217972,451896,093,5651,011,276,682263,380,000184,250,00012.750447,620,000−128.473993.48
201789,523,914977,1301,051,989889,640,2161,008,744,2241,906,640,000122,720,00010.823 × 106313,350,000−198.954664.8
201891,581,2851,009,0431,147,207883,186,8681,006,597,901551,700,000573,160,00042.1423 × 1061,124,860,0008.814567.61
201993,692,5181,040,9561,190,071876,733,5191,003,054,229455,120,000486,780,00036.2623 × 106941,900,000−7.934641.29
202095,821,5851,072,869333,220870,121,200975,752,266359,260,000369,790,00029.423 × 106729,040,000−33.14883.92
Table 3. Range of variation of the System Dynamics model parameters.
ParametersValueRate of Change between 2007
and 2020
Urban population1,181,537
1,580,897
2.60%
Rural population1,239,034
1,118,228
−0.75%
Water consumption per urban inhabitant (m3/year)48.4
52.35
0.62%
Water consumption per rural inhabitant (m3/year)10.22
11.68
1.10%
Number of tourists885,619
1,190,071
3.20%
Water consumption per tourist (Mm3)189
99
−1.10%
Industrial water consumption (m3)658,000
1,186,902
5%
Irrigated area (ha)148,640
150,540
From 148,640 ha in 2007 to 154,540 ha in 2010
Water consumption per
hectare (m3/ha)
6687
6151
A reduction of 536 m3/ha and an improvement in irrigation efficiency of 8.7%.
Water recycling (m3)2007–2017: 0
2017–2019: 23,000,000
2020: 28,000,000
2.18%
Desalination water (m3)0Desalination plant in progress
Disclaimer/Publisher’s Note: The statements, opinions and data contained in all publications are solely those of the individual author(s) and contributor(s) and not of MDPI and/or the editor(s). MDPI and/or the editor(s) disclaim responsibility for any injury to people or property resulting from any ideas, methods, instructions or products referred to in the content.

