

Assessment of the Breaching Event, Breach Parameters and Failure Mechanisms of the Spillway Collapse in the Swa Dam, Myanmar

1
Graduate School of Science and Technology, University of Tsukuba, Tsukuba 305-8572, Japan
2
Institute of Life and Environmental Sciences, University of Tsukuba, Tsukuba 305-8572, Japan
*
Author to whom correspondence should be addressed.
Water 2023, 15(8), 1513; https://doi.org/10.3390/w15081513
Submission received: 31 January 2023
/
Revised: 6 April 2023
/
Accepted: 10 April 2023
/
Published: 12 April 2023
(This article belongs to the Topic Hydro-Meteorological Hazards: Forecasting, Assessment and Risk Management)
Abstract
:The spillway of the Swa earthen dam, constructed in Yedashe Township, Bago Region, Myanmar, collapsed suddenly on 29 August 2018 and resulted in a huge flood to downstream areas causing fatalities and the displacement of thousands of localities. This study aimed to assess the spillway breaching process in terms of the breaching parameters such as the average breach width, failure time and peak outflow, and failure mechanisms. We analyzed the event from the changes in the study site before and after the event and used water discharge conditions from satellite data and water level records during the event. We compared the breaching parameters using empirical equations from past failed events with tested scenarios for failure mechanisms, such as overtopping and piping. According to satellite data, 97% of the storage from the reservoir was discharged, and the peak breach outflow rate was 7643 m3/s calculated from the water level records. The selected empirical formulas were applied, and the estimated average breach widths, failure times and peak discharge from the formulas were larger in overtopping and nearer in piping than that of the observed data for the Swa Dam. Thus, a concrete spillway might impact the erodibility rate of breaching compared with concrete-faced and earthen dam types.
1. Introduction
Although dams provide various benefits for livelihood, their failures also cause adverse effects on localities downstream. A dam break can be highly fatal due to the huge and rapid-moving waves made by the release of the reservoir water and can wash away every obstacle downstream. By analyzing data from historical dam failures, it is established that the majority of dam failure incidents belong to earth-fill dams [1,2]. For earth-fill dams, the failure is characterized by a gradual erosion of the dam material, due either to overflow or seepage, with a peak discharge more delayed with respect to the beginning of the erosion [3,4,5,6]. For a concrete dam, the failure is quite instantaneous, and the potential energy linked to the reservoir level is turned into kinetic energy. Therefore, the peak discharge occurs in a very short time [7,8,9]. For instance, the Malpasset Dam, a concrete dam in France with a height of 66.5 m and a reservoir volume of 55 million m3, broke in 1959 and caused flooding which killed 421 people [10]. Examples of the failure of earth dams are the Banqiao and Shimantan dams in Henan Province, China, which collapsed in 1975 due to Typhoon Nina causing reservoirs to swell with rainwater and resulted in a death toll of 85,000 and the loss of millions of homes and businesses [11]. Different case studies have shown that dam hazards occur because of several failure mechanisms, such as overtopping due to flooding, piping through the embankment or foundation, sliding downstream or upstream, technical problems in different dam elements such as spillways, foundation and slopes, poor management and natural disasters such as landslides and earthquakes [12,13,14].
Myanmar is a country in Southeast Asia with an area of 615,678 km2 and a population of 52 million. In the past years, 236 reservoirs including 177 large dams have been constructed in Myanmar to alleviate the water shortage problem in the central region where annual precipitation is less than 500 mm. Earthen, embankment-type dams are mostly constructed throughout the country mainly for rainwater storage for agriculture and other various purposes, such as flood control, hydropower generation, navigation, fisheries, recreation and tourism. Myanmar has already experienced several dam failure cases; from 1966 to 2019, 11 significant dam breaches happened throughout the country including the Swa Dam breach. The spillway of the Swa Dam located in Yadeshe Township, Bago Region, collapsed unexpectedly on 29 August 2018. Flood water burst out of the dam, inundating acres of rice fields, 7 people died and 63,421 people were forced to evacuate their homes. Among various factors contributing to dam failures, the failure of spillways has been an important reason, which can occur due to several reasons including insufficient spillway capacity, blockage of spillways by flood debris and technical failures of the spillway structure such as water injection below the spillway slabs and consequent erosion and scouring [12,15,16]. Several studies have investigated dam breaching and breaching parameters (e.g., [17,18,19,20,21,22,23,24,25,26]). However, these studies were mostly about breaches that happened in dam bodies because of various causes of failure, and there were very few studies regarding spillway-failure-induced dam breach cases.
There are three notable studies on spillway failure: the partial collapse of the spillway in Montedoglio Dam, Italy (2010), the spillway damaged of the Oroville Dam, CA, USA (2017) and the spillway failure in Toddbrook Dam, UK (2019). In the Montedoglio spillway case, the investigation found that the breach outflow was reduced because of the presence of the spillway channel walls [27]. In the Oroville dam spillway case, late decision-making led to spillway damage [28]. The Toddbrook Dam spillway suffered from poor maintenance, which most likely damaged the foundation. Moreover, the spillway was poorly designed as the concrete slabs were relatively thin and unreinforced, and it lacked a stilling basin. The spillway was under fast-flowing water which caused the failure (e.g., [29,30,31,32,33,34,35]). The Toddbrook spillway incident highlighted the urgency for reassessment of the structural integrity of aged infrastructures in England and served as an important notice for the safety of the dams [36]. Although spillway failure cases also cause severe impacts related to communities similar to dam failure cases, there is insufficient documentation about them, especially for Southeast Asian countries, including Myanmar. Moreover, the need to collect data referring to these extreme events is of considerable interest to better address the prevention of dam failures through more suitable methodologies. In addition, when a dam break event occurs, it represents a great opportunity to collect data about the breach and corresponding outflow, flood rout and impacts on the downstream area. Additionally, understanding the process of dam breaching, and knowing the parameters that describe the dam breaching process are important.
Considering these circumstances, this study aims to assess the Swa Dam spillway failure case, to determine the process of spillway breaching and failure mechanisms and the effectiveness of spillways to the breach. This study also aims to clarify the similarities and differences between the spillway breaching event at the Swa Dam and ordinal dam breach events, compare previous empirical relationships and obtain lessons to be learned from this failure case for future risk mitigation of dam failure cases in Myanmar.
2. Materials and Methods
2.1. Study Area
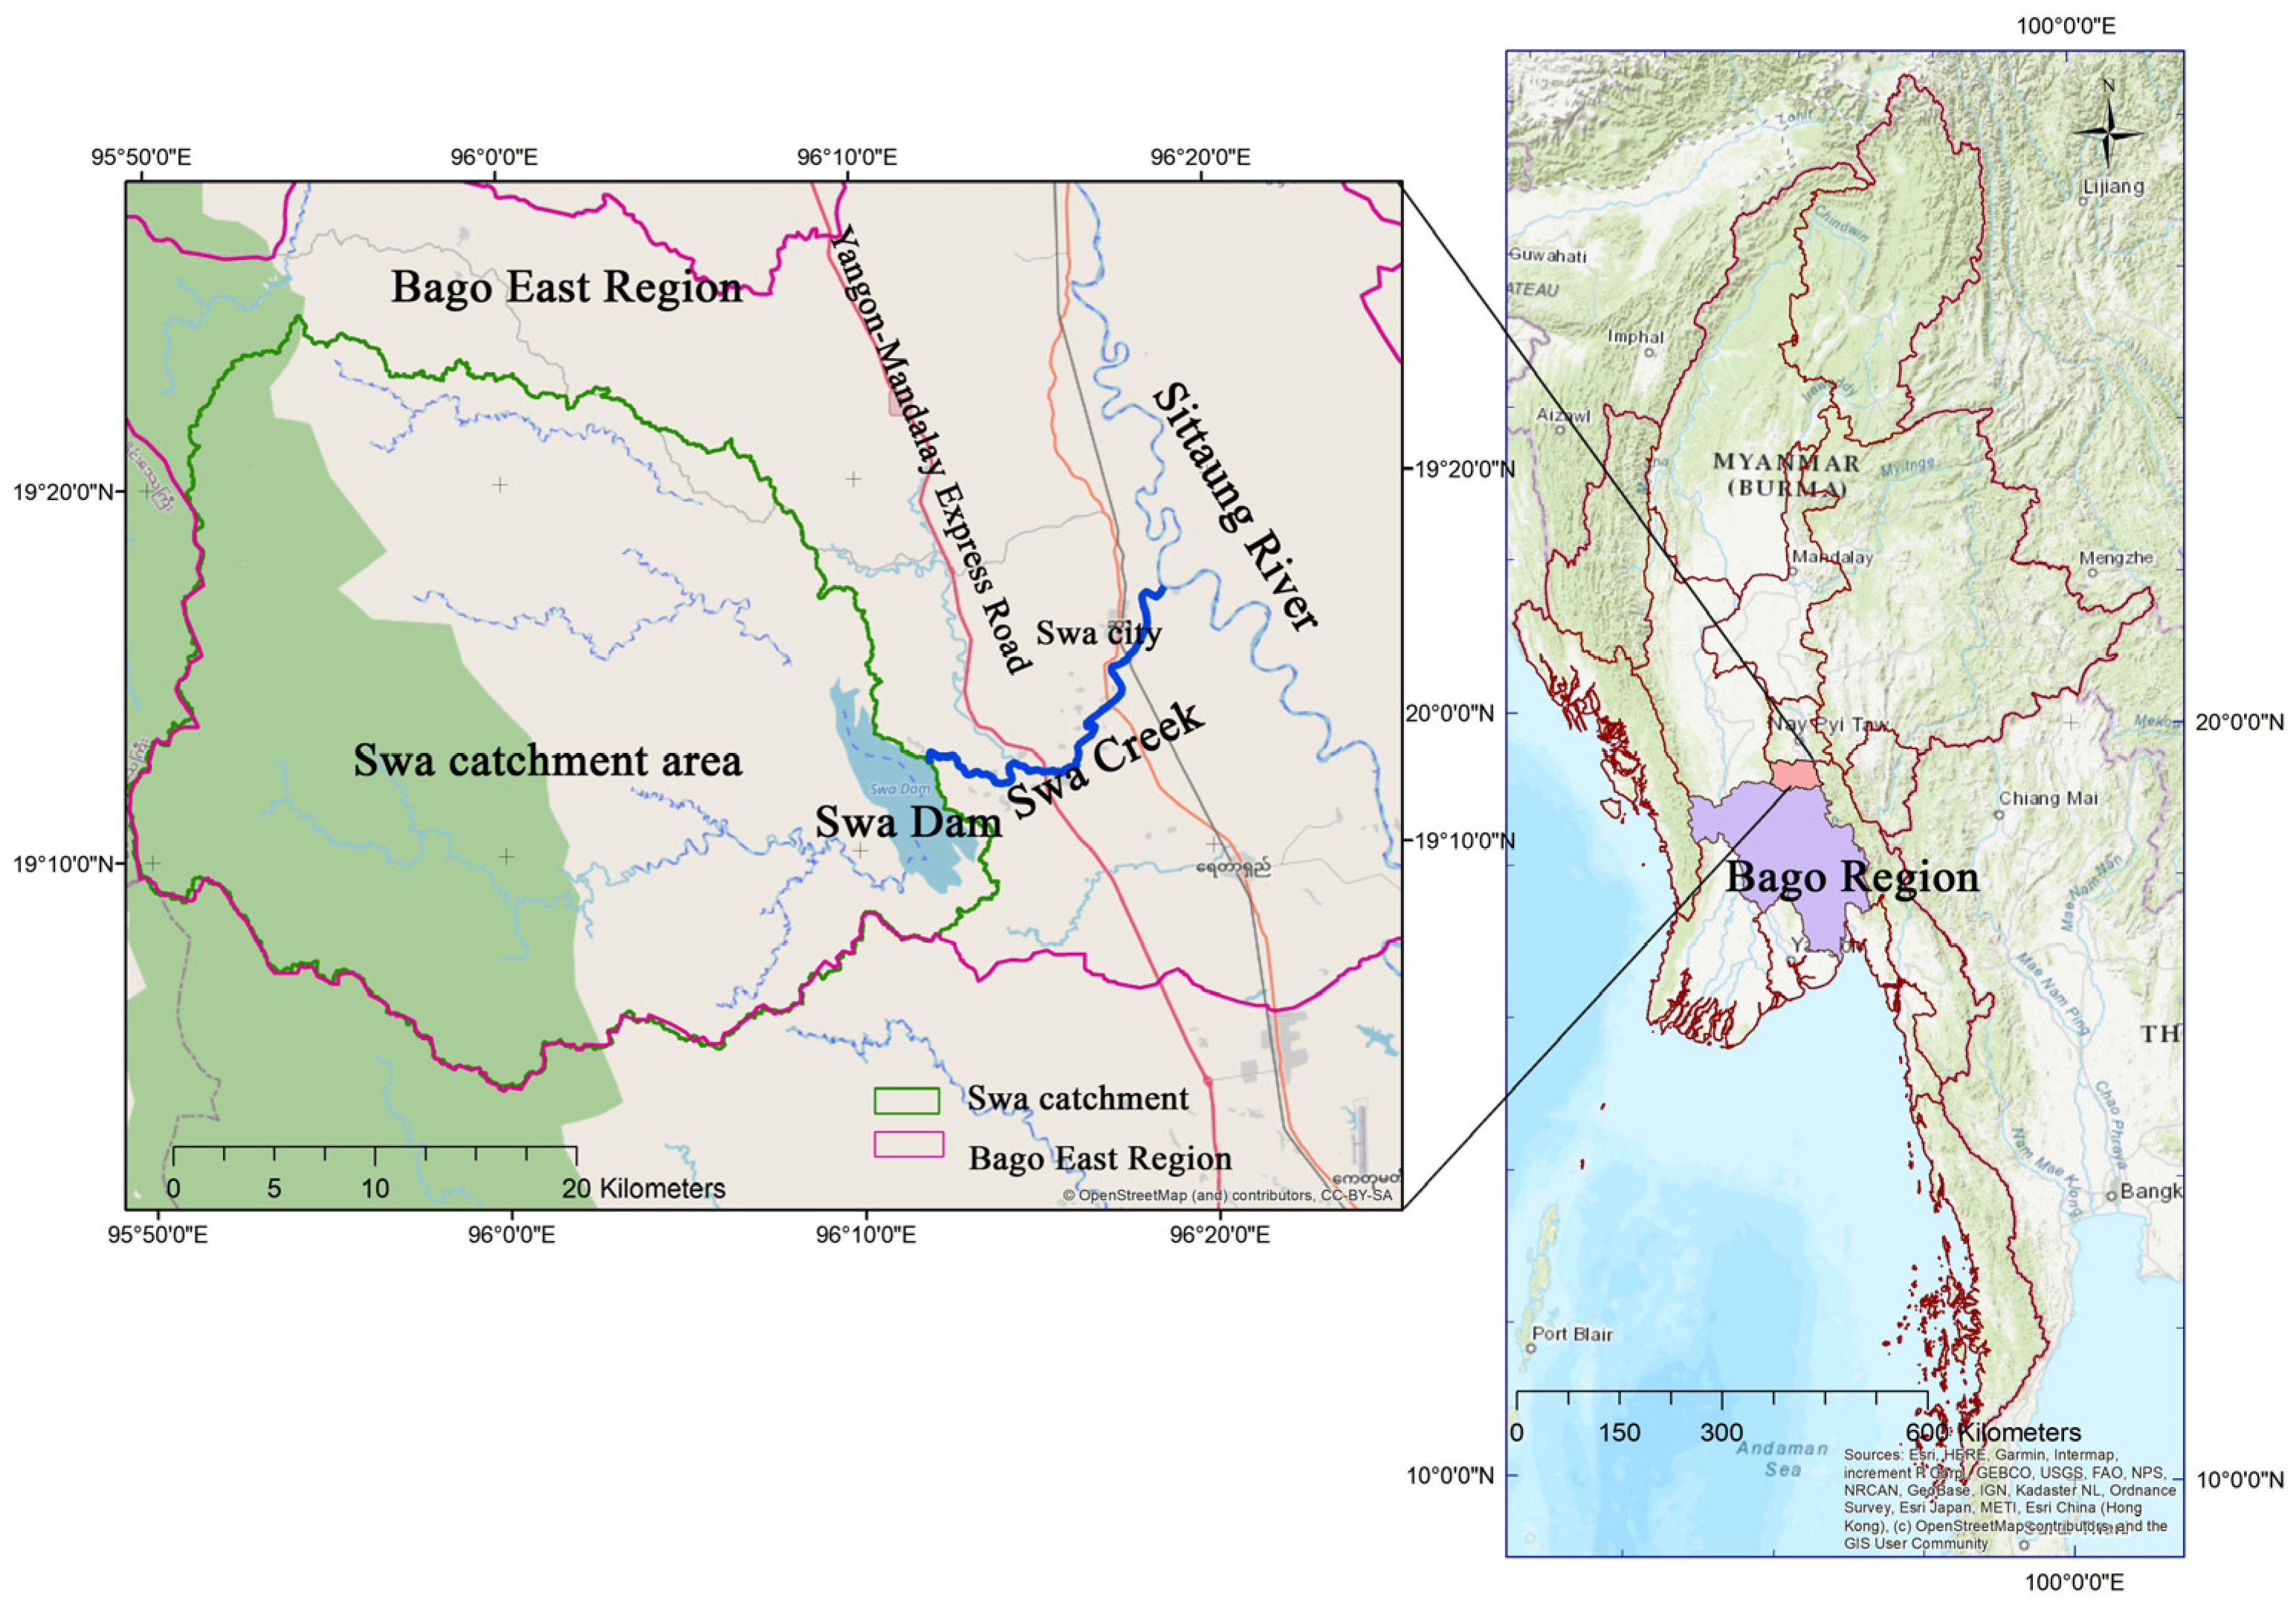
The study site is in Yedashe Township in Bago Region, southern Myanmar. The Swa creek which flows into the Sittaung River, Swa Dam, and its catchment and downstream area are included in this study site. Swa Dam was constructed between 1999 and 2005 to supply irrigation water to a 14,164 ha area within the Yedashe Township. Swa Dam’s catchment area is about 1000 km2 and is located in the eastern area of the Bago Mountain range. The highest elevation of the catchment is about 2000 m a.s.l. The Swa creek flows in the study area from Swa Dam to the Sittaung River which is 21.8 km in length. The downstream area of the dam is about 247 km2, which comprises the Yangon–Mandalay Express Road, the Yangon–Mandalay railway, the Yedashe Township and Swa City as shown in Figure 1.
2.2. Meteorological and Hydrological Conditions of the Study Site
The site is affected by tropical monsoons, and there are no rainfall stations within the catchment area of Swa Dam. Thus, rainfall data for the study site were collected from the rainfall station of Yedashe Township, located 16 km east of Swa Dam, which included the yearly rainfall records of the Hydrology branch of the Irrigation and Water Utilization Management Department (IWUMD) of Myanmar. According to the records, the average annual precipitation in the Swa Dam catchment is about 1700 mm, ranging from 939 to 2817 mm. The average annual inflow from the catchment of the study site is about 696 million m3, ranging from 426 to 1119 million m3. The condition of the average annual rainfall and inflow data are shown in Figure A1 (Appendix B).
2.3. Swa Dam
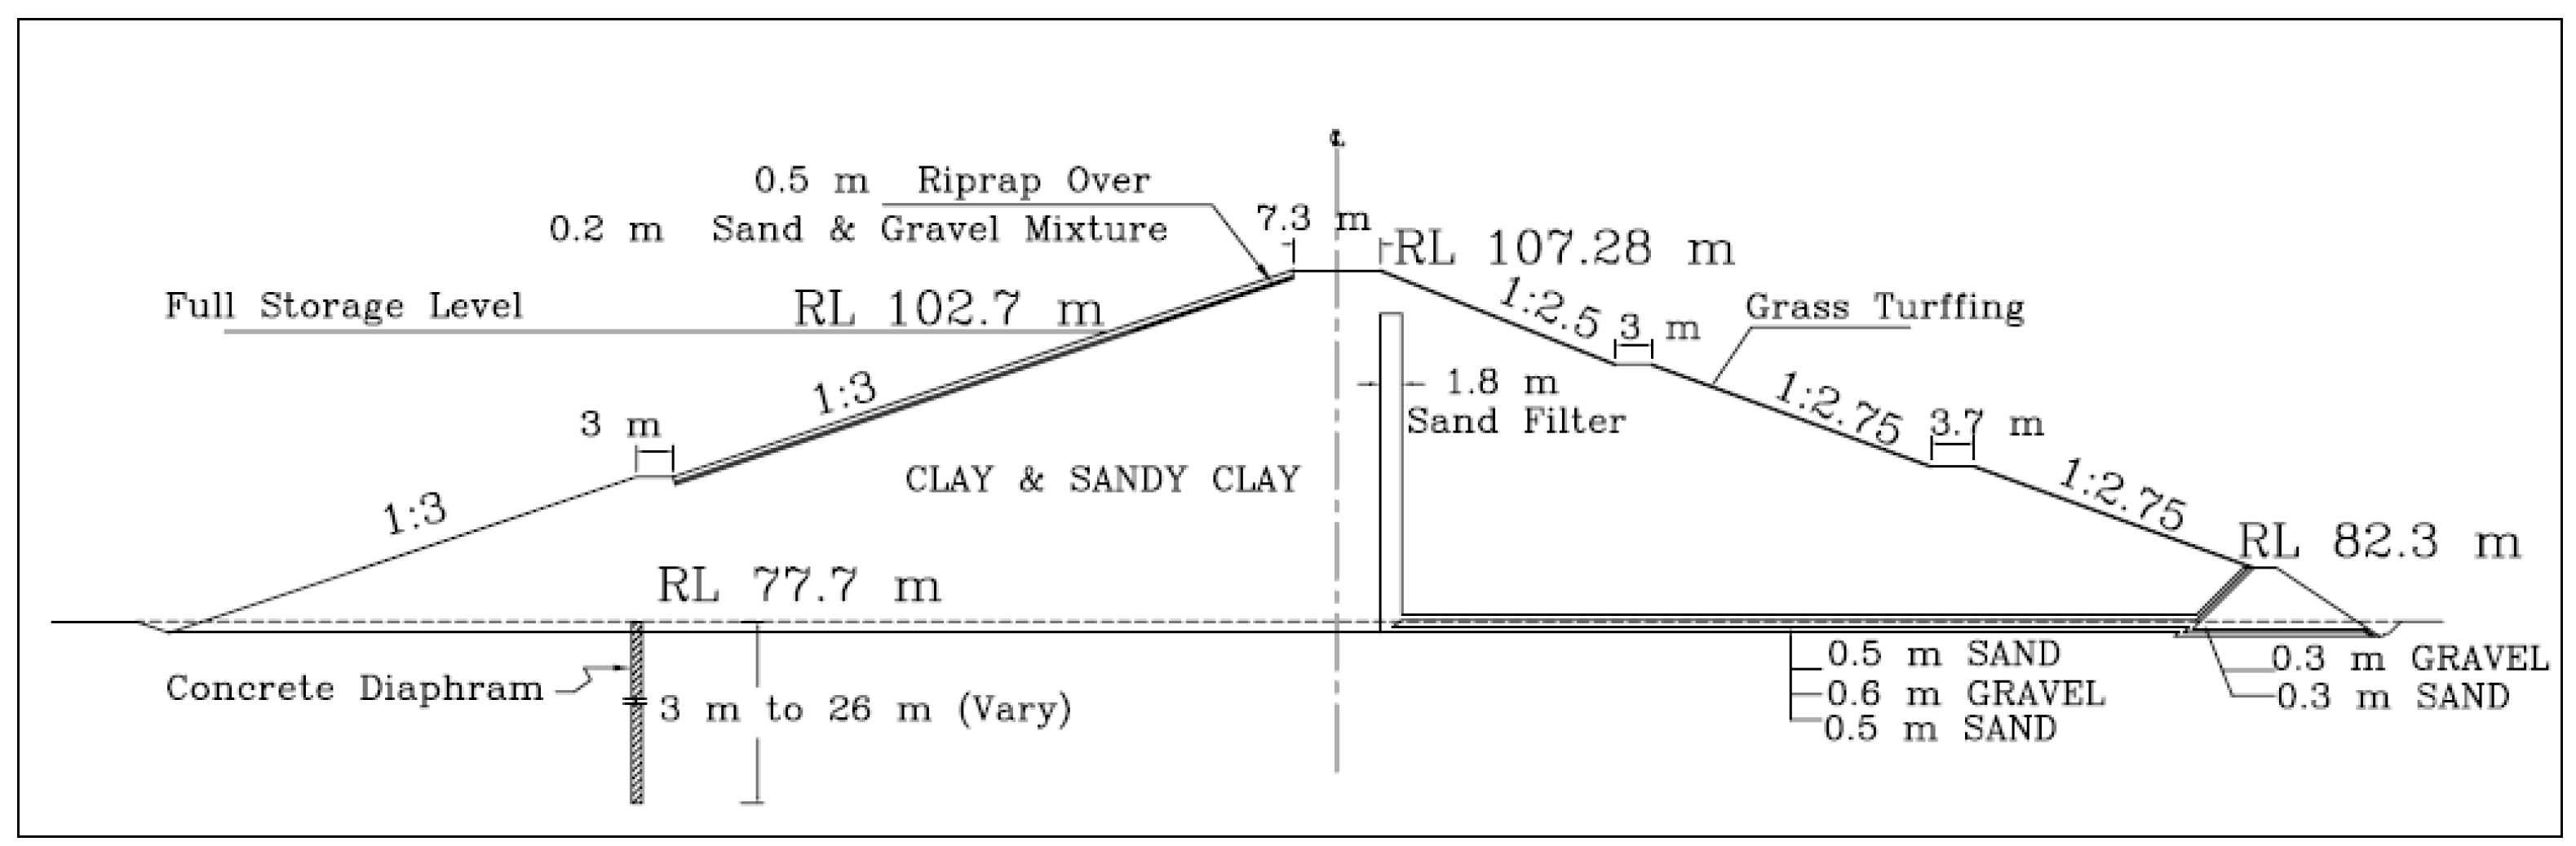
The Swa Dam is an earthen embankment dam, and the reservoir function is to store water for irrigation. For the dam dimensions, the dam crest is 7.3 m wide, the dam height is 29.56 m and the dam length is 2012 m. The upstream slope is 1:3, whereas the downstream slope is 1:2.5 until the first berm and 1:2.75 for the rest. The storage capacity of the reservoir is 267 million cubic meters at the full storage water level (R.L-102.7 m), and the water surface area is 2792 ha at that level. The dam is filled with clay material at the center and clay or sandy clay at the upstream and downstream sides. The average maximum dry density (MDD) of CL is 105 pounds per cubic foot (pcf) and the optimum moisture content (OMC) is 17.8%. The average MDD of SC is 112.6 pcf and OMC is 15.8%. The average plasticity index of CL is 18.2% and that of SC is 13.8%. The grain size distribution of CL is clay 25.4%, silt 41.3% and sand 33.3%, and those of SC are clay 15.3%, silt 26.8%, sand 57.2% and gravel 0.7%. The soil parameters of the filling material of the main dam and saddle dam are as follows: dry density (rd) (108.88 pcf), saturated density (rsat) (130.5 pcf), water content (17.75%), soil specific gravity (2.68), cohesion (C) (0.67 kg/cm2), internal friction angle (21°). The average permeability rate of the filling material is 4.3 × 10⁻⁷ cm/sec and was found to be within the approved range for dam safety. To prevent seepage injection from the upstream side, a 0.6 m-thick diaphragm cut off wall was constructed using plastic concrete with a total length of 750 m and an average depth of 11.5 m. At the downstream end of the main dam, the seepage in the dam toe is 12 gal/min; therefore, an inverted sand filter and rock toe was constructed to protect from seepage landslide. The dam has a 1.6 m-thick sand and gravel layered horizontal filter. The dam was designed and constructed by the IWUMD under the Ministry of Agriculture, Livestock and Irrigation of Myanmar. The typical cross-section of the Swa Dam is shown in Figure A2 (Appendix B).
2.4. Spillway Description
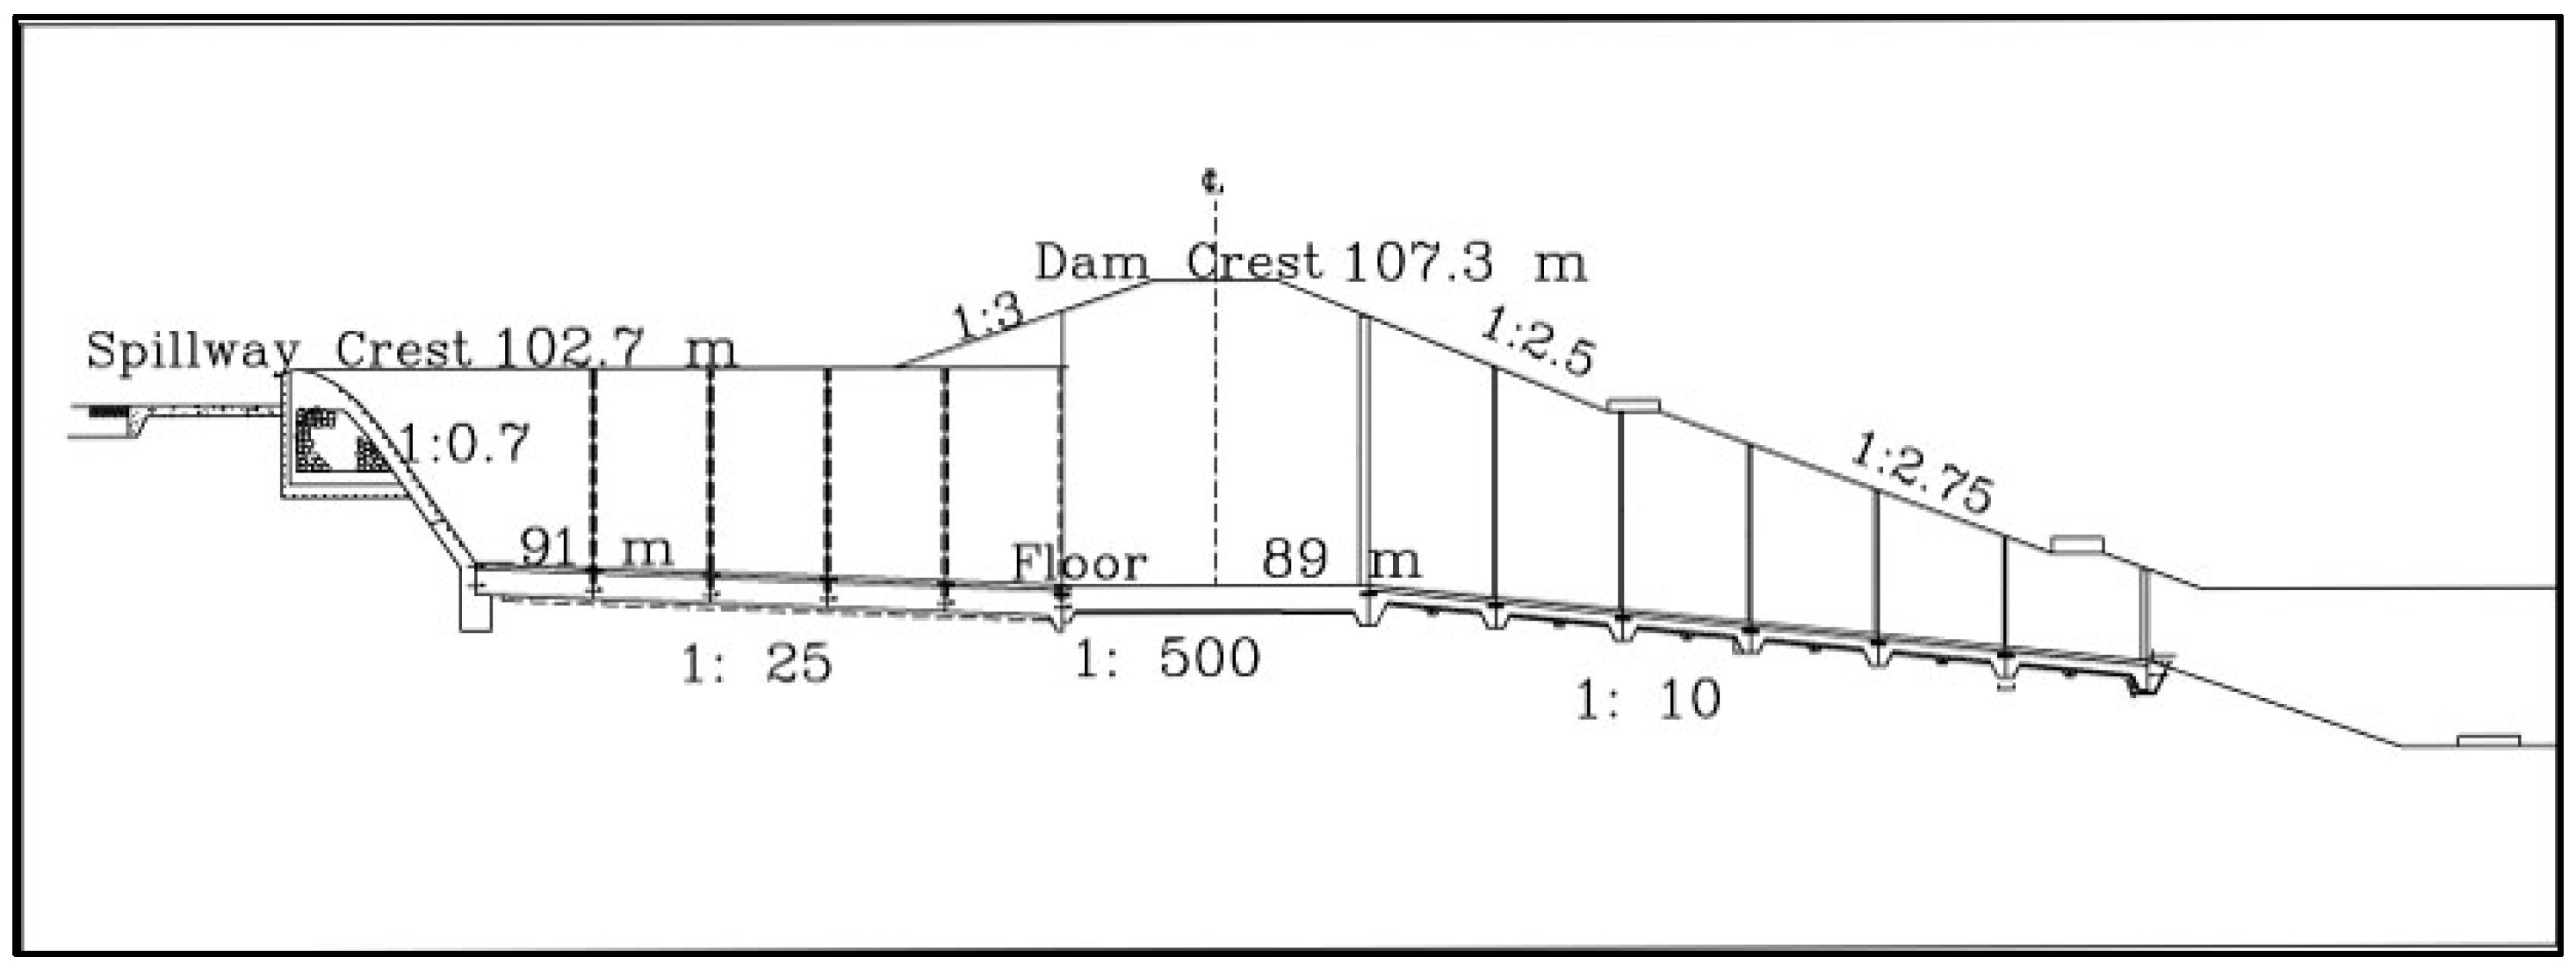
The spillway is a reinforced concrete bath tube (duckbill) type ogee spillway, which has a 122 m total overflow length, and is 171 m long; the width of spillway is 36.6 m at the bottom and about 64 m maximum at the crest of the main dam. The height of the spillway at the dam crest is 13.7 m. The longitudinal gradient of the spillway is 1:0.7 in the mouth of the duckbill, 1:25 in the floor of the duckbill, 1:500 in the transition and 1:10 in the chute portion, as shown in Figure 2. The floor of the spillway is covered by 15 cm-thick lean concrete over 0.3 m-thick reinforced cement concrete at the duckbill part and 1.2 m-thick mass concrete at the transition and chute portions. The foundation test for the spillway was performed by 7 test holes at the transition portion (left and right), Duckbill and chute portion and the bulk density is from 1.52 to 1.67 t/m3, the moisture content is from 18.49 to 24.53% and the bearing capacity is from 3.26 to 4.2 kg/cm2 (2.98 T.S.F to 3.84 T.S.F), and the largest values are found to be under the left side of the transition portion. Based on the rainfall data from the Yedashe Township station, projected floods in the Swa catchment for different return periods (20 years to 1000 years) were prepared by the IWUMD, as shown in Table A1 (Appendix A). The peak flood (Qp) ranged from 1758 to 3491 m3/s with respect to the return periods. The spillway was designed to tolerate a flood that happened once in a 200-year period (2693 m3/s), and the overflow length of 120 m was designed for that flood.
2.5. Breach Event Description
2.5.1. Hydrological Conditions before the Breach Event
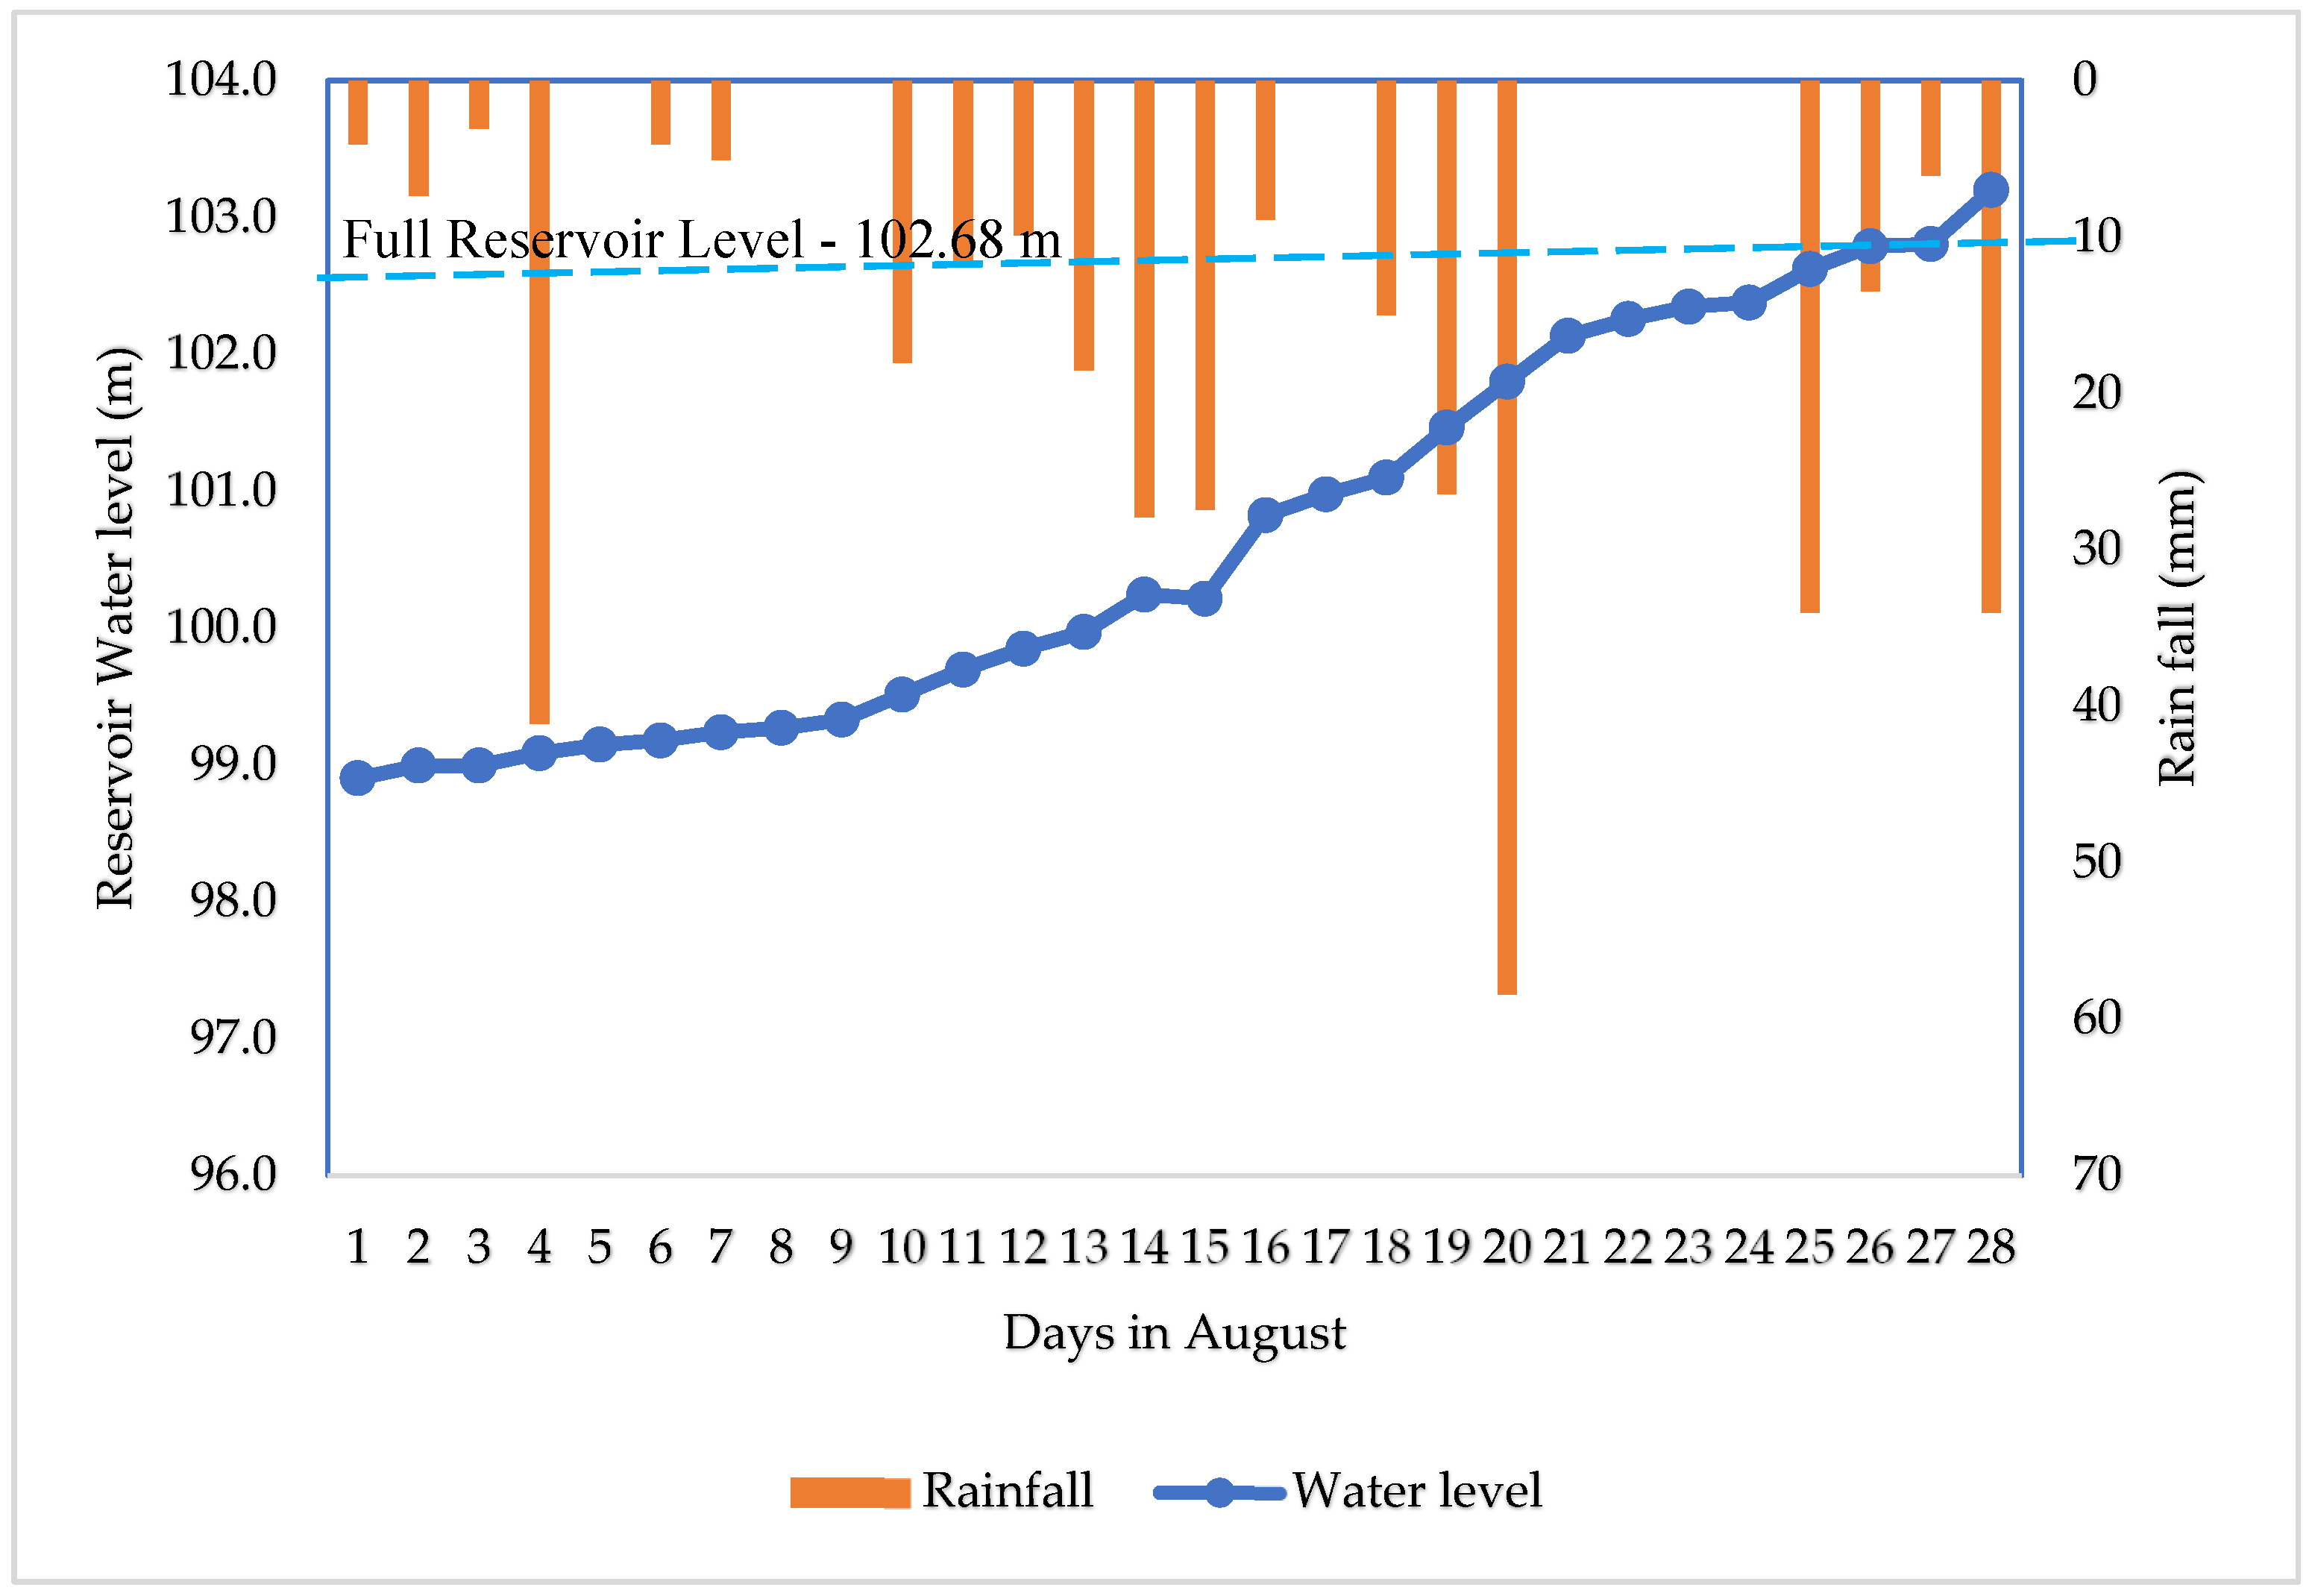
Before the breach event, 20 rainy days were observed in August; on 20 August, a maximum rainfall of about 60 mm was observed, according to the records of the Hydrology branch of the IWUMD. According to the records, starting from 25 August 2018, rainfall had continued for four days, and the spillway began to overflow on 26 August, as shown in Figure 3. The estimated outflow from the spillway was about 213 m3/s on 26 August. From 25 to 28 August 2018, the total rainfall was about 88 mm, and the water level in the reservoir was raised to R.L 103.2 m, 0.5 m above the full reservoir level (R.L 102.68 m). When the water level in the reservoir rose to R.L 103.1 m, the estimated outflow from the spillway changed to about 1911 m3/s on 28 August. In addition, the water level of the reservoir rose from 99 m (1 August) to 103.2 m (28 August), according to the records of the Hydrology branch of the IWUMD.
2.5.2. Failure Event and Consequences Downstream
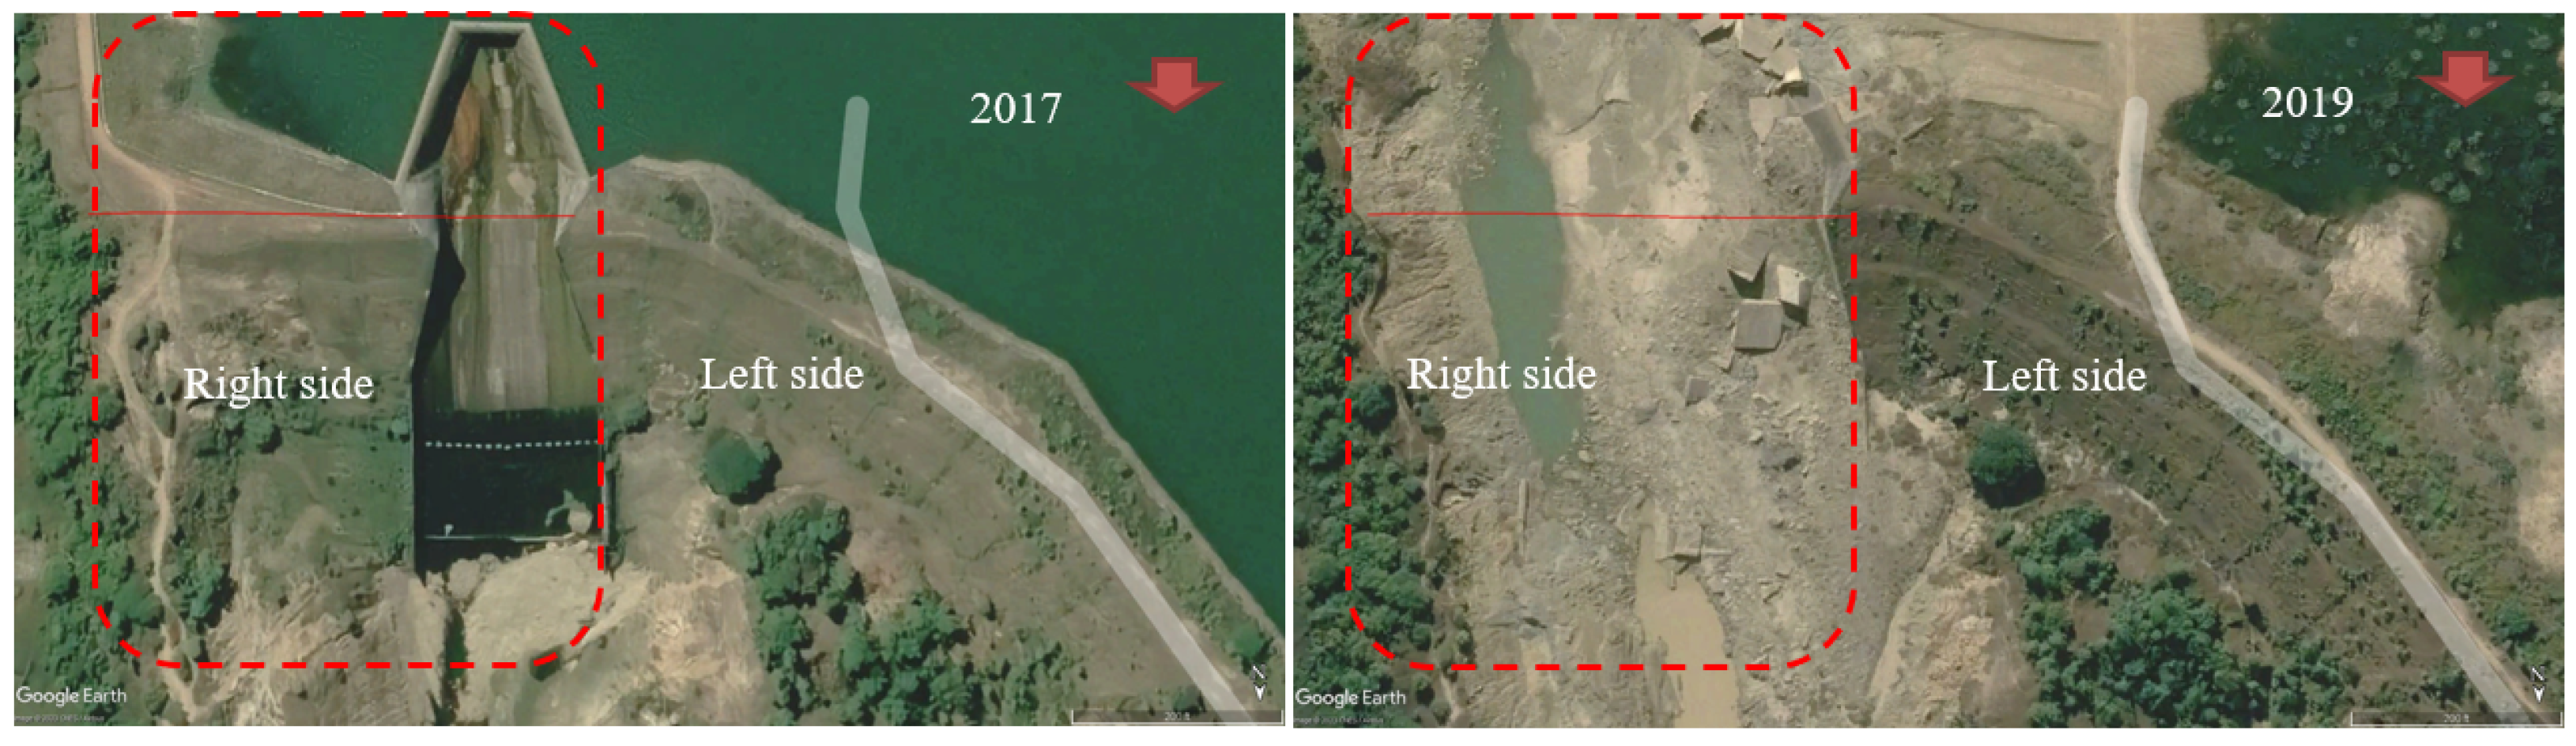
Before the event, the spillway overflowed at about 0.5 m water depth above the spillway weir crest, and the water level was about 103.2 m which was about 4.1 m from the crest of the dam embankment. The water level in the reservoir remained at that level until the early morning of 29 August. According to the witnesses of the breach event, Swa’s spillway seemed to have collapsed before 5 a.m. LT on the morning of 29 August 2018; however, the water levels could be recorded at 5:00 a.m. The gauge watcher of the Swa Dam noticed that the water level at the gauge of the Swa Dam suddenly went down at about 4:00 a.m. LT and the villagers in the nearest village to the dam also reported that they found water under their residences. When the watcher reached the event site at 6:00 A.M, the spillway had already broken and the breach opening at the spillway had already extended to the right-side embankment of the Swa Dam. The left side of the duckbill part remained undestroyed during the event. The water from the reservoir flowed out from the opening continuously from 29 August to the next day, 30 August. The conditions of the study site before and after the spillway broke can be visualized using Google Earth images from December 2017 and 2019 as shown in Figure 4. The breach opening expanded to the right embankment was clearly identified by comparing the images in Figure 4.
As the water spilled out from the reservoir into surrounding farmland, the spillway failure instigated immense flooding in 85 villages of 17 village tracts in Yedashe Township and affecting over 63,000 people [37]. Then, the flood water from the spillway breach flowed across the downstream and toured down into the Sittaung River. The collapse of the spillway submerged the road section between mileposts 161 and 166 on the Yangon–Mandalay Highway (5.2 km from the dam), and the road sections between mileposts 169 and 204 on the Yangon–Mandalay old express road (10 km from the dam) were submerged 0.3 m (1 ft) to 1 m (4 ft) under water for some time, according to the media records during the event [37]. According to the Ministry of Social Welfare, Relief and Resettlement, Myanmar, four people died and three were missing because of the downstream flood. The cause of the breach had not yet been identified, and the spillway collapsed because of progressive failure, according to the records [37].
2.5.3. Field Observation and Causes of Failure
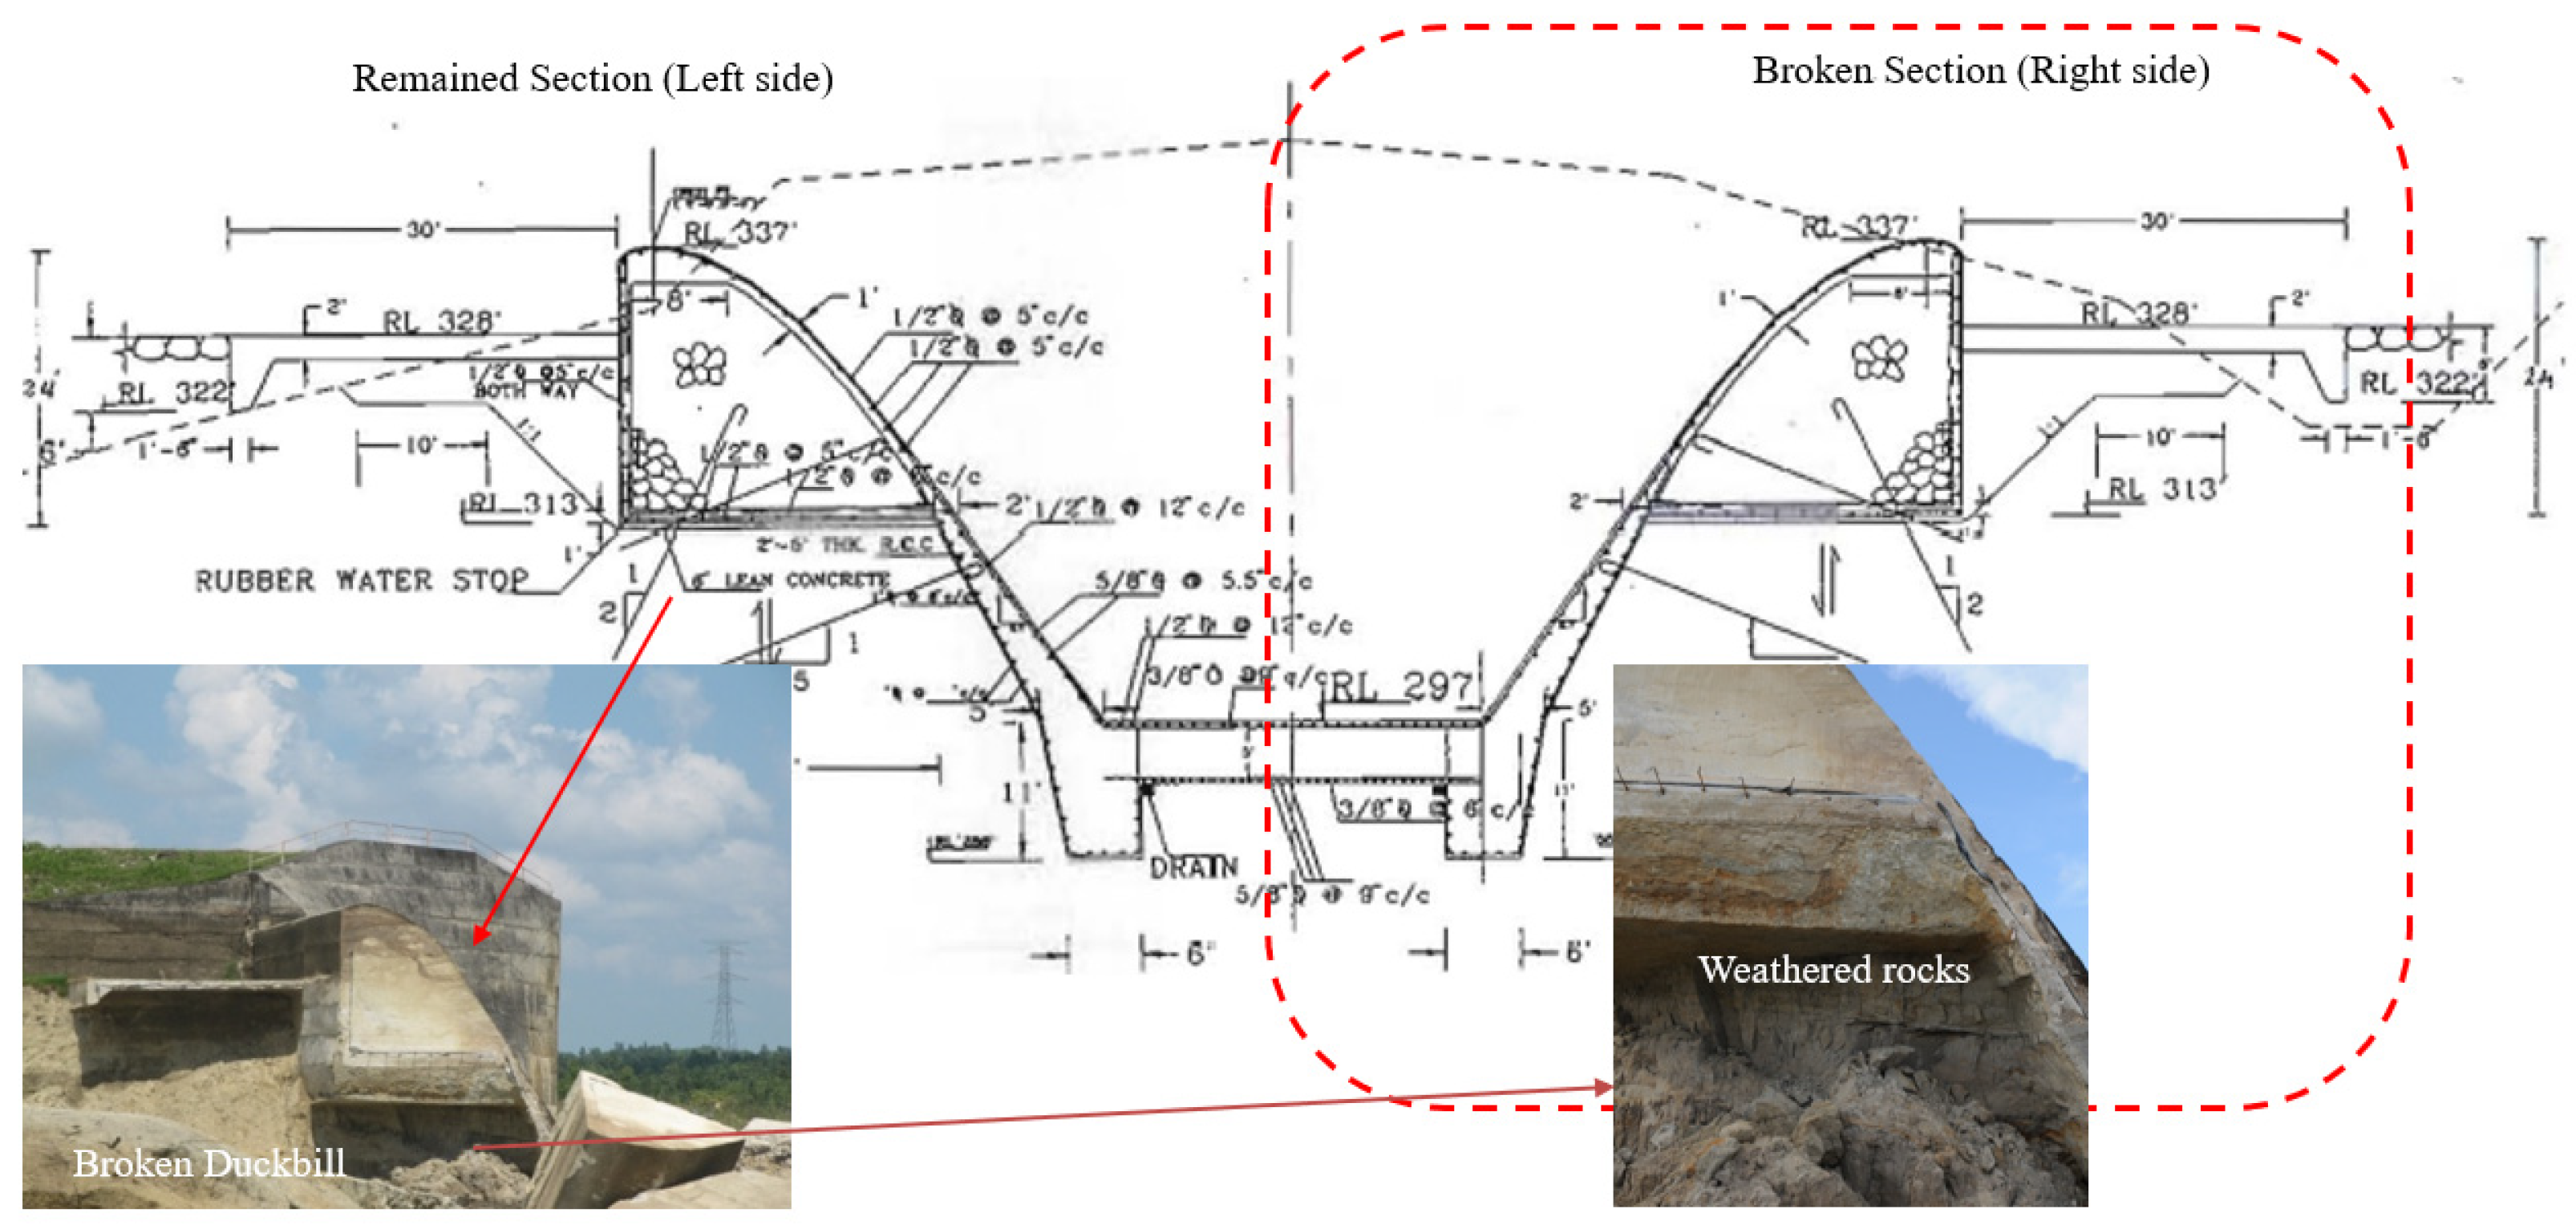
The investigation team from the IWUMD visited the spillway collapse site in November 2018 to find the causes of the spillway collapse. With limited information because of the condition of the study site, the team figured that the failure causes might be related to the foundation and climate-change-related issues. The spillway foundation was found to be composed of sand, rocks and mudstones, and weathering was observed in the foundation as shown in Figure 5. Duckbill-type ogee structures might suffer uplift of the water head during high water periods; although reinforcement bars were provided in the concrete structure of the ogee spillway to resist the uplift of the water head and other tension stresses. On the other hand, foundation rocks become weak against tension stress caused by uplift of the water head and the slaking would have probably occurred to those stones according to the technical report of the investigation team. The weathering including slaking of the foundation and uplift of the water head may have acted against ogee spillway, and many specialists in Myanmar fault the main reason of failure on the foundation of the spillway.
Actually, after the impoundment of the Swa Dam in 2005, water has overflowed from the spillway every year according to the records of the IWUMD. On the other hand, the water level of the reservoir comes down lower than the bottom of ogee elevation starting in the dry season of 2009 according to the records of the IWUMD. Thus, the repetition of wet and dry conditions would lead the foundation toward slaking which would be one of the causes of weathering in the foundation. Therefore, the changing of the climate pattern of the study site might also be one of the factors of the failure. The team also recognized that seepage happened at the construction joint of the spillway, and each block of the spillway weir had a smooth surface, as shown in Figure 5. The team described that the seepage that happened at the construction joint might be one of the factors that affected the stability of the structure.
2.6. Changes in the Study Site before and after the Dam Breach
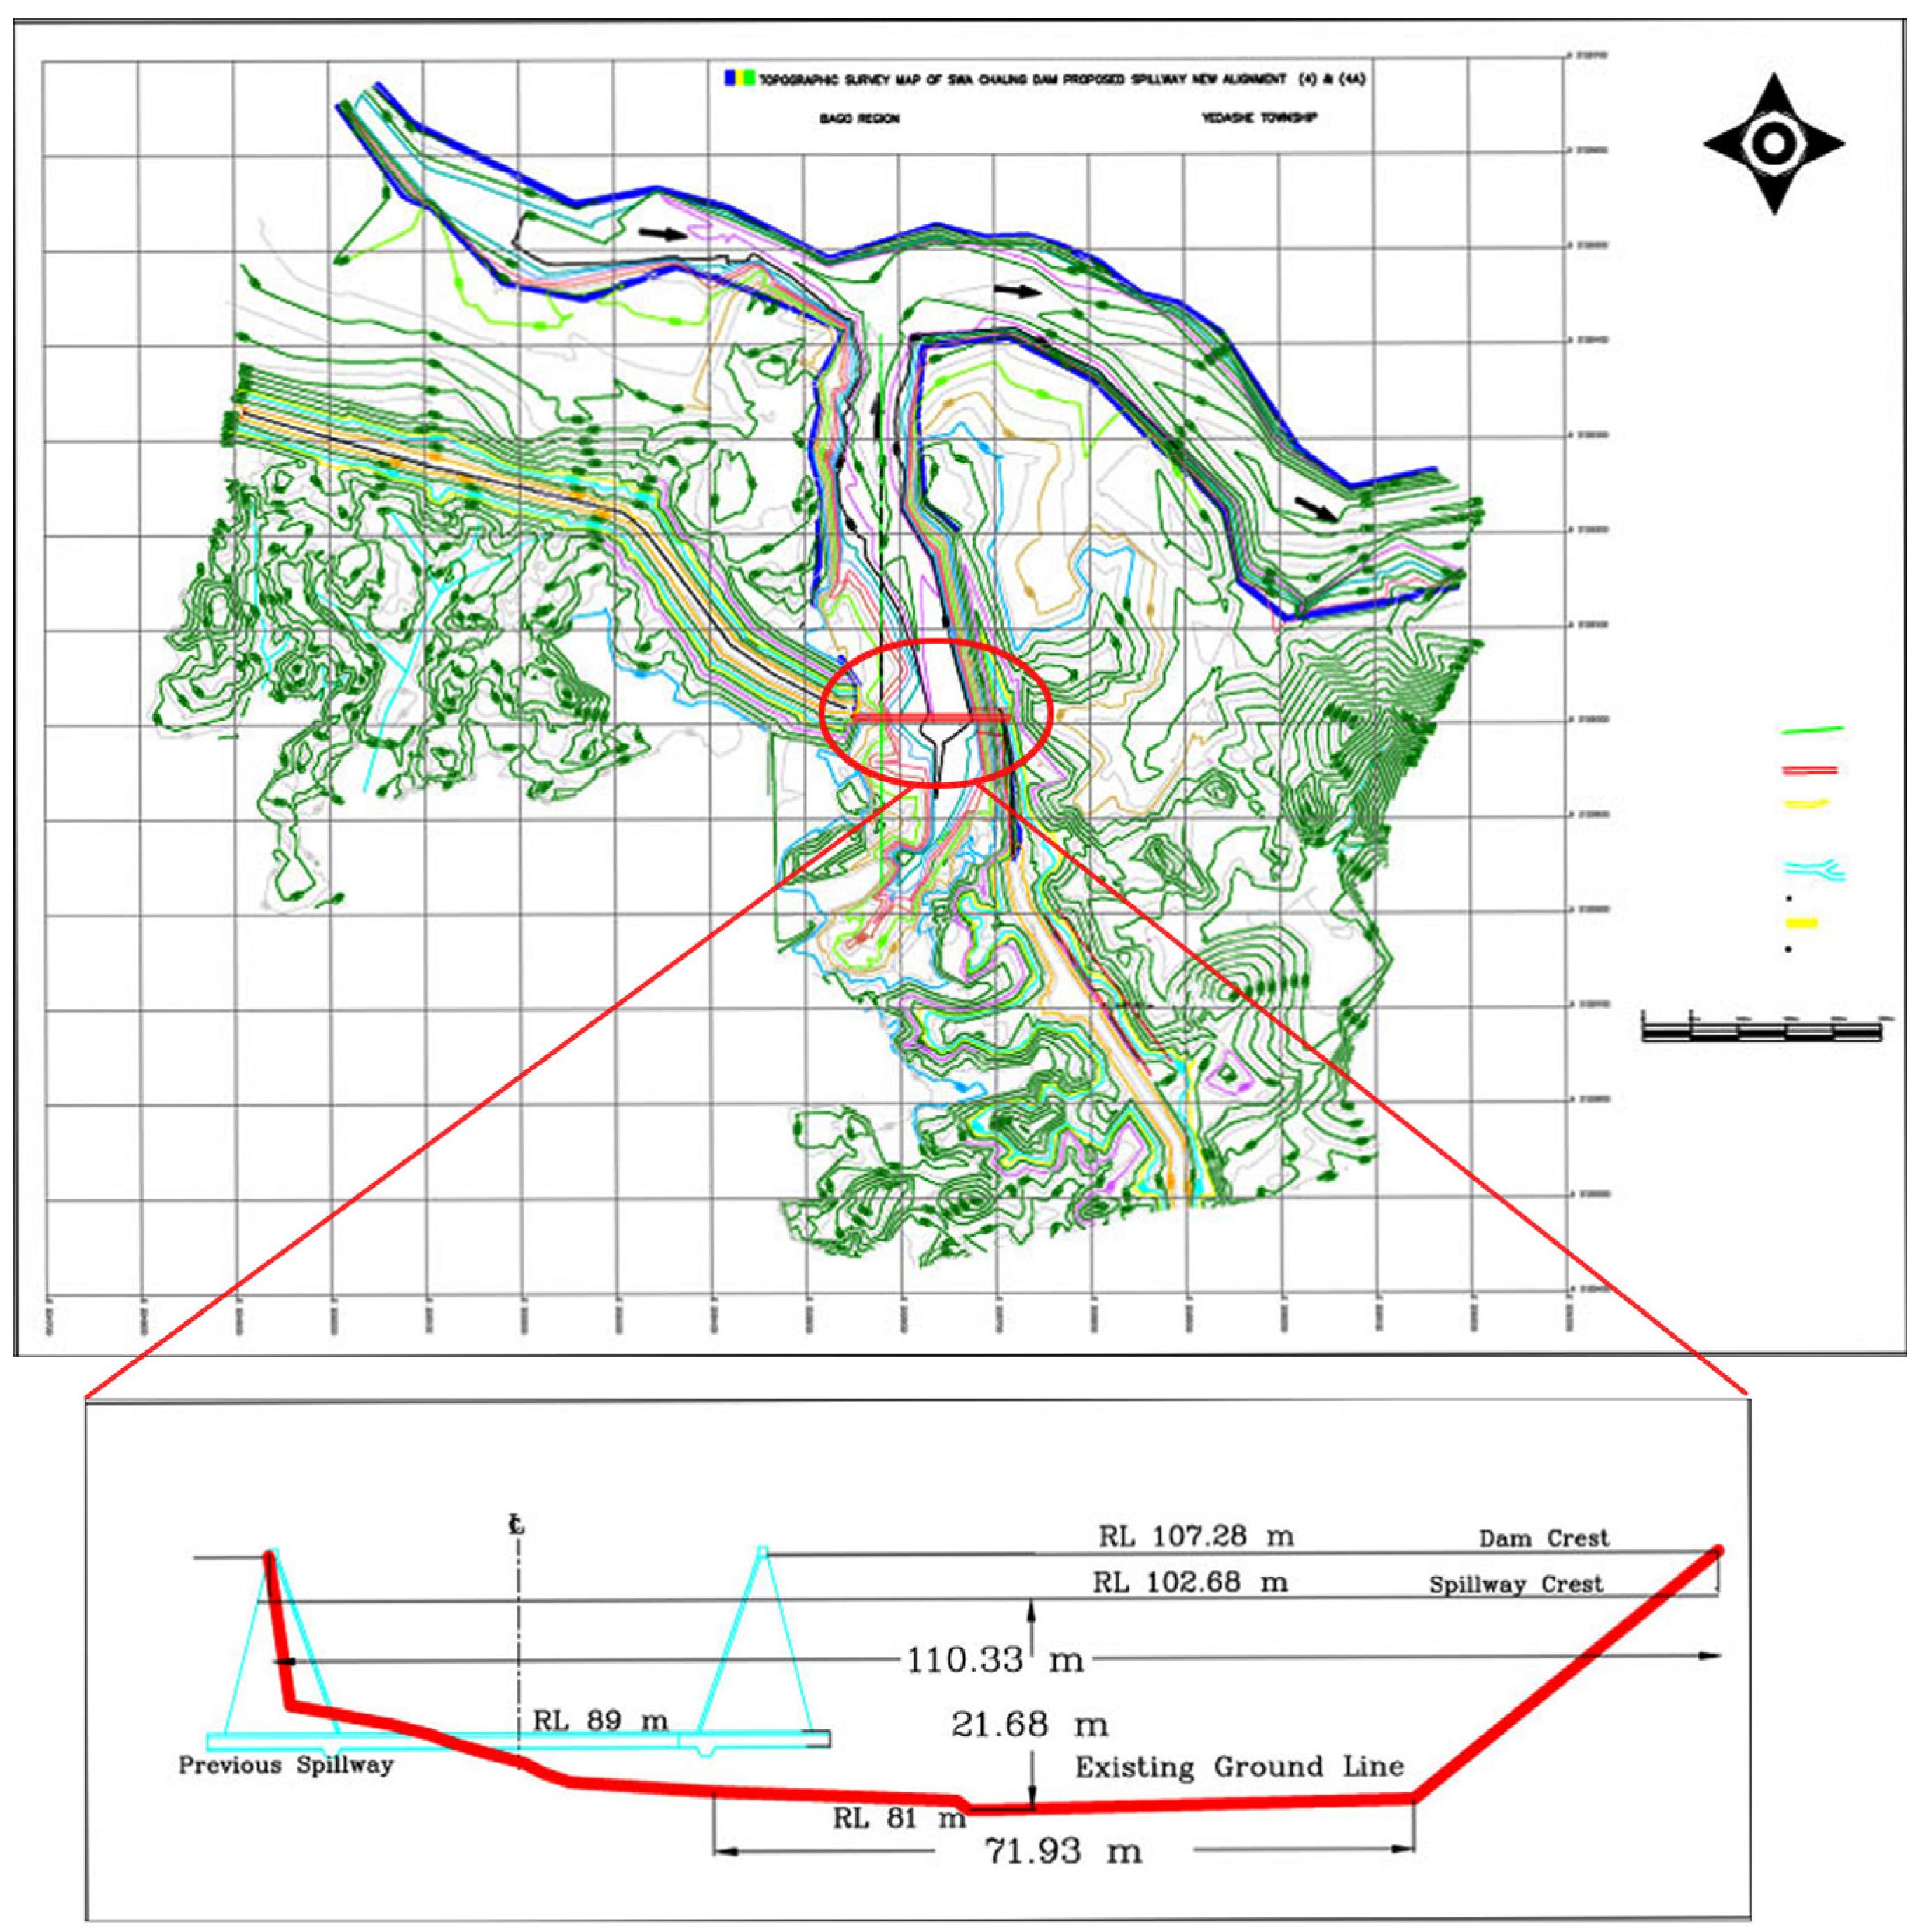
As topographic data before the breach were not available for the study site, ALOS World 3D 30 m DEM by the Japan Aerospace Exploration Agency (JAXA) [38] was used to assess the topographic condition of the study site before the event. Meanwhile, topographic data after the breach were gathered from elevation contours prepared by the IWUMD from a field survey of the collapse site, which was conducted after the breach event. AW30D DEM (survey date between 2006 and 2011) [38] was compared with the topographic data of the field survey. The final breach opening was confirmed to have laterally expanded to the right bank, whereas the left bank of the spillway was almost not damaged at all, as shown in Figure 5. Compared with the cross-section of the spillway, the width expanded by 98 m and increased three times. Moreover, the elevation of the bottom dropped by 8 m at the center of the opening. However, about half of the original spillway on the left bank side had almost no change in elevation at the bottom. The lowest point of the breach opening was lower than the floor of the original spillway (R.L 89 m) and existed in the dam body, which was about 21 m away from the right bank of the original spillway.
2.7. Water Discharge Condition
2.7.1. Total Outflow Volume by Satellite Data
Two satellite images taken on the 19 and 31 August 2018 were gathered from the synthetic aperture radar (SAR) data of the Sentinel 1A satellite to assess the water surface area changes before and after the breach of the Swa Dam. The SAR data were downloaded from the Alaska Satellite Facility website (https://asf.alaska.edu/data-sets/sar-data-sets/sentinel-1/ (accessed on 24 May 2022)) [39]. The assessment of flooded areas using the Sentinel-1 SAR imagery followed the workflow of https://opengislab.com (accessed on 25 May 2022) [40] using the SNAP software version 8 [41]. Ground range detected data of the Sentinel 1 satellite (Acquisition date: 24 May 2022) was downloaded and treated according to the workflow, including preprocessing, determining flooded areas, and viewing results in ArcGIS version 10.3. Detailed procedures are described at Flood Mapping with Sentinel-1 Data using SNAP and QGIS—open.gis.lab (opengislab.com (accessed on 25 May 2022)). By applying a threshold value, the water pixels can be separated from the non-water pixels by the SNAP software version 8. In the SNAP software version 8, the color manipulation tab showed backscatter values, with low values corresponding to water and high values to non-water. For the Swa Dam case, a threshold value (e.g., 0.0515) was used to get the best representation of water, and this threshold value was applied to calculate the water area for both images. After analyzing the images, the results were visualized using the ArcGIS software version 10.3, and the water spread area calculation was analyzed using the reclassify tool of ArcGIS version 10.3.
2.7.2. Calculated Outflow Using Water Level Records during the Event
The water level of Swa Dam was measured daily (5:00 a.m. LT) for the non-flood season and hourly for the flood season (from July to October) at the gauge post located in the conduit tower of the Swa Dam. For the breach event, the water level was measured at 1 h intervals, starting from 5:00 a.m. on 29 August 2018 to 9:00 a.m. on 30 August 2018, using the water volume change with respect to time and water balancing in the Swa reservoir, as shown in Equation (1).
where V is the reservoir water volume with respect to the recorded water height (m3), t is time (s), Qb is the breach discharge rate (m3/s), Qin is the inflow rate of the reservoir (m3/s), and Qf is the outflow through the conduit (m3/s). Qin for the Swa Dam was recorded daily by the IWUMD, whereas Qf was zero for the breach event as the conduit was closed at that time, according to the information from the IWUMD.
2.8. Comparisons with Previous Dam Breach Events
2.8.1. Dam Breaching Parameters
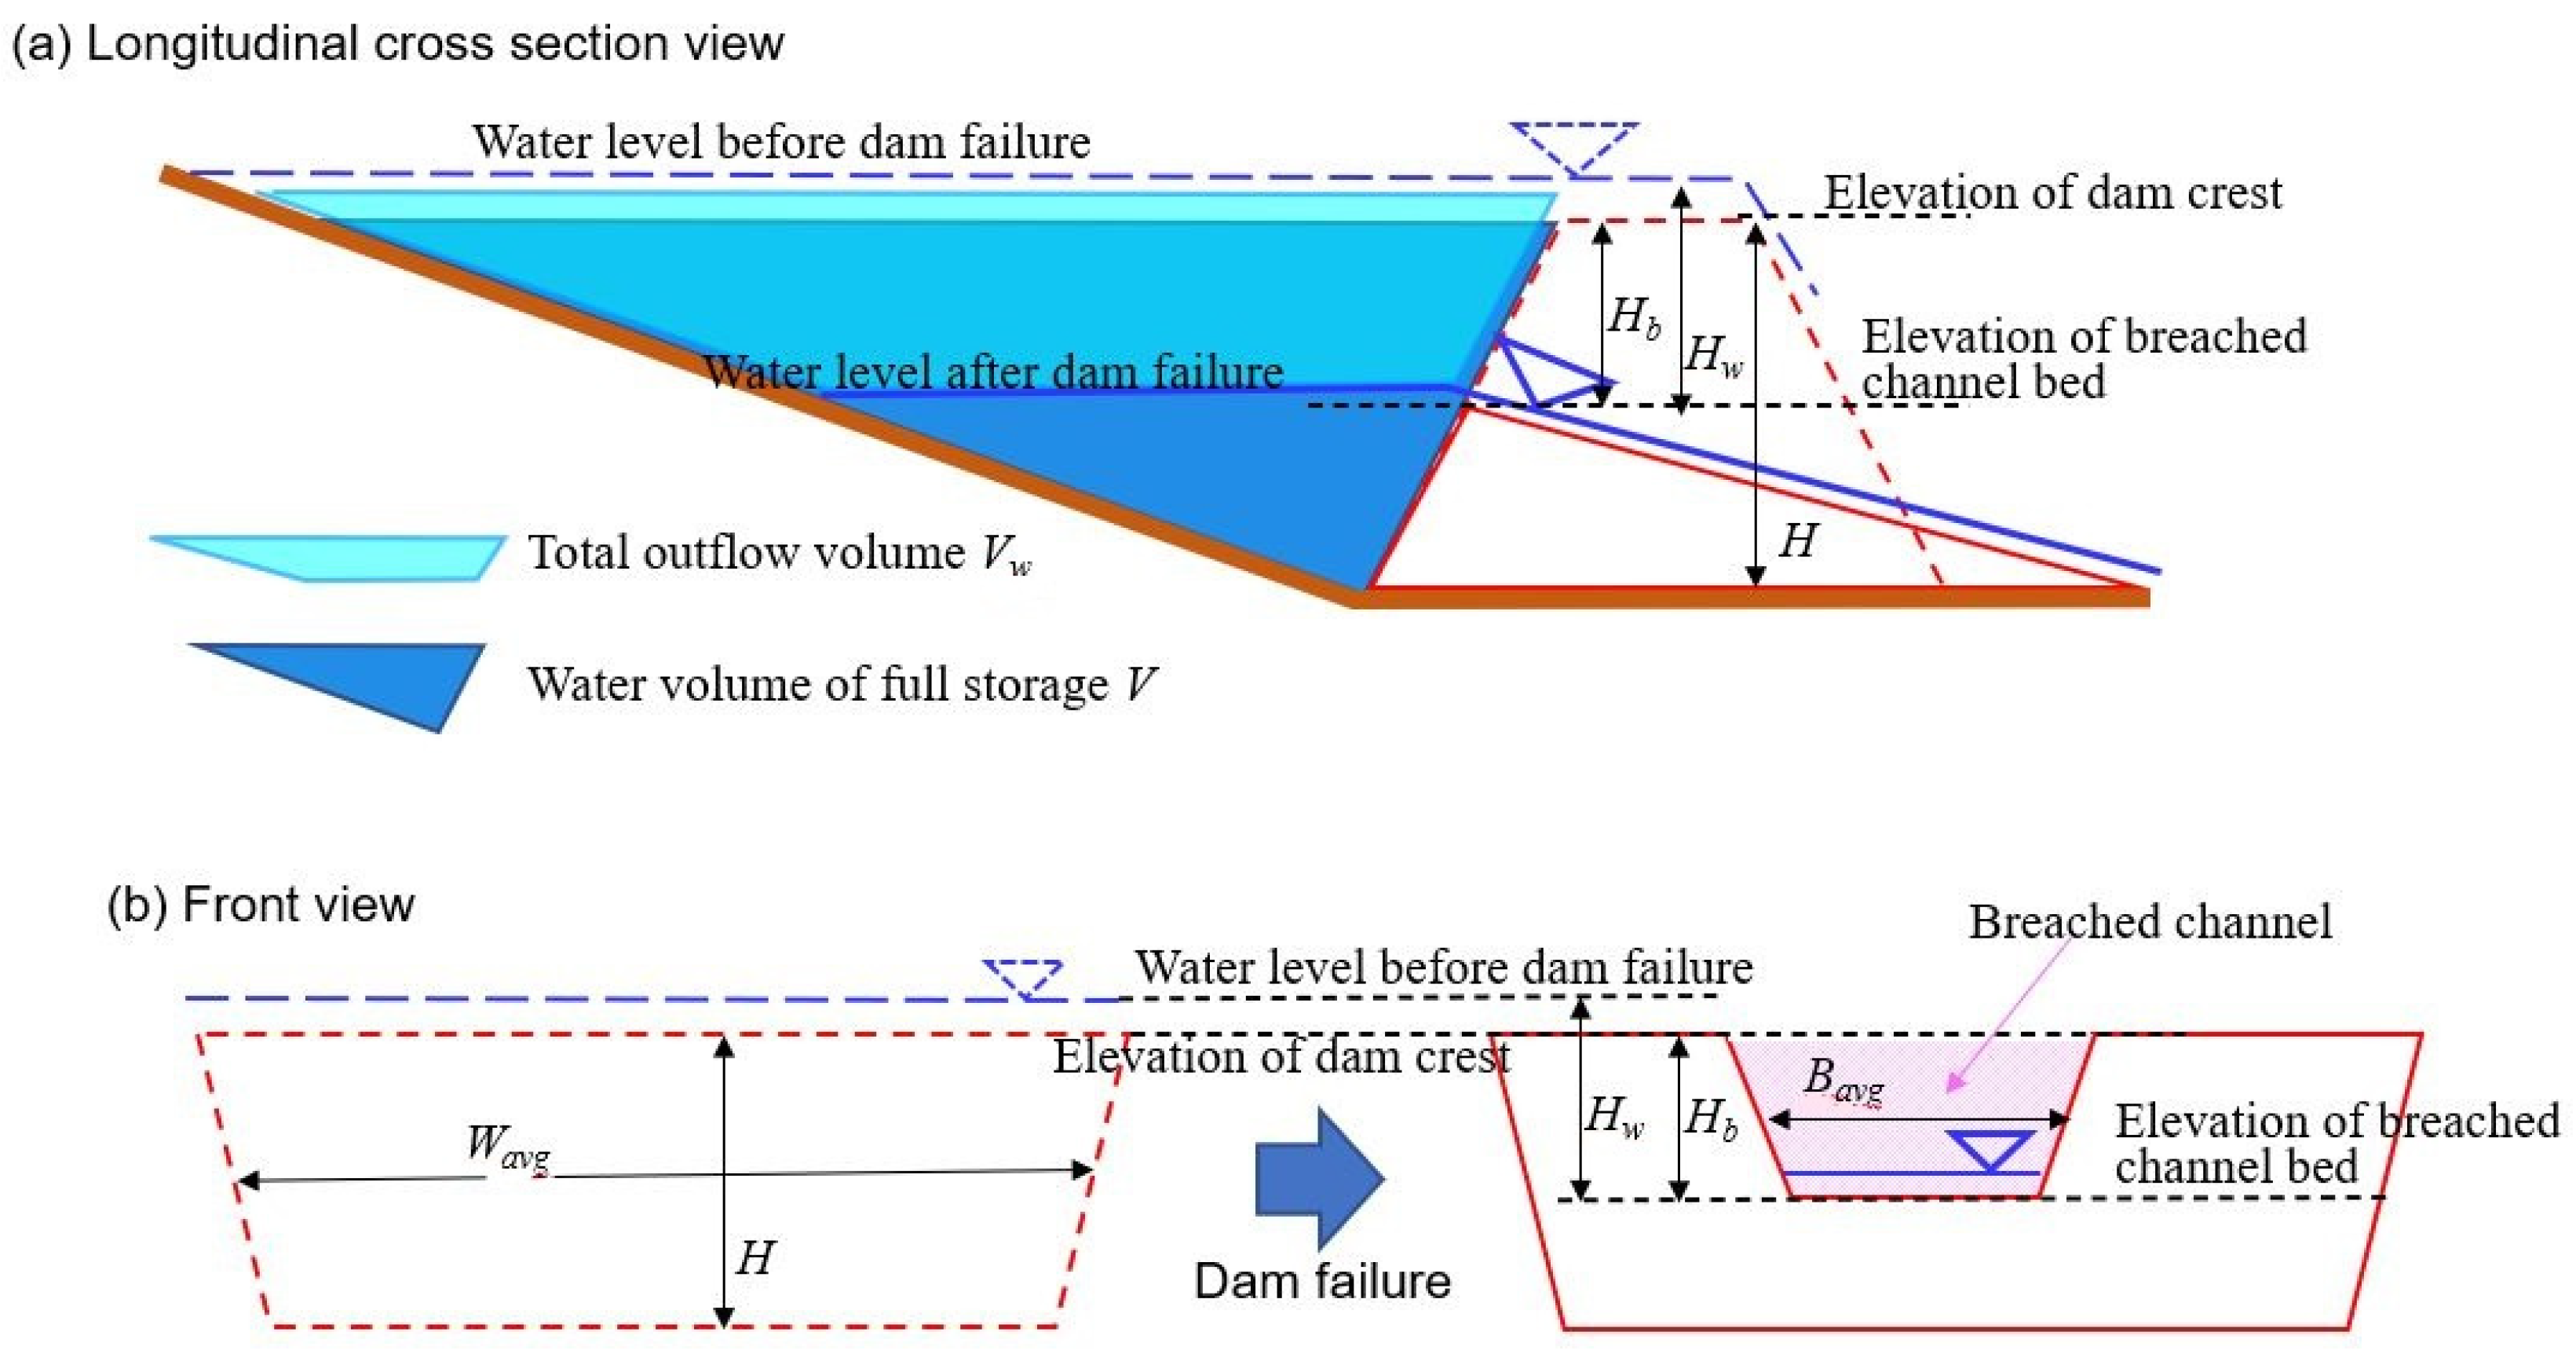
In this study, breach parameters were applied to assess the characteristics of breach events, such as the dimension of the breach channel, breach outflow and failure time. According to previous studies, several breach parameters describe the characteristics of the breach channel, such as the depth of the breached channel (Hb), and average width (Bavg) and characteristics of the breach event, such as the height of the water surface from the bottom of the breached channel (Hw), the total breach outflow volume (Vw), the failure time of the breach (Tf) and the peak outflow of the breach (Qp) [42]. Moreover, the relationships between parameters were examined by collecting actual dam breach cases [43,44]. As a result, several empirical relationships were found (see Table 1 and Table 2). In addition, previous studies reported that some breaching parameters are related to reservoir properties [45], such as the dam height (Hd), the dam width (Wavg), and the reservoir storage (V), as shown in Figure 6. Thus, we compared the relationships found in this study with previous empirical relationships to clarify the similarities and differences of the spillway breaching event in the Swa Dam and other dam breach events.
- Breach parameters for the breach channel:
The depth of the breached channel (Hb) is mentioned as a breach height in many works in the literature. It is the vertical extent of the breach measured from the crest of the dam down to the bottom of the breach [17,18,19,20,21,22,23,24,25,26]. Previous studies advise that if there is no information for the breach height (Hb), the height of the dam (H) could be taken as the breach height. For the Swa Dam breach case, Hb was taken as the height from the top of the spillway crest to the bottom of the final breach which was R.L 102.68 to 81 m (details are explained in Section 2.8.3) From the spillway crest (R.L 102.68 m) to the final bottom elevation of the breach (R.L 81 m), the height of the breach was 21.68 m, and this height was applied as Hb in the empirical calculation.
Meanwhile, the average breach width (Bavg) is the average of the breaching width of the top and bottom width of the breached channel. For the Swa Dam case, the top width of the breach was about 148.73 m, the bottom width of the breach was about 71.93 m, and the average breach width was 110.33 m taken from the topographic survey data of the IWUMD (Figure 7). This average width measured from the survey data was applied as the observed average breach width in the comparison of the resulting average breach widths (Bavg) by empirical equations.
- 2.
- Breach parameters for water discharge:
The height of the water surface from the breach inverted (Hw) is the vertical extent of the water measured from the top of the water surface before dam failure to the bottom of the breach, whereas Vw is the volume of water with respect to Hw [17,18,19,20,21,22,23,24,25,26]. In previous studies, if there was no information for the breach water height (Hw) and its corresponding water volume (Vw), the dam height (H) could be assumed as Hw in some cases such as overtopping cases, and the full storage water level and full storage reservoir, V, could be taken as parameters in other cases such as piping cases. For the Swa Dam case, Hw was measured from the overflow water surface (R.L 103.2 m) before the breach day to the final breach bottom elevation (R.L 81 m), which was 22.2 m. This height was applied as Hw in the empirical calculation.
The dam breach procedure should be divided into two stages (i.e., breach initiation and beach formation), so that the failure time could be separated into two parts (i.e., initiation time and formation time) corresponding to that in [43]. The initiation time initiates with the first flow of water over or through the dam and ends when erosion reaches the upstream face of the dam and produces a rapid acceleration of breach outflow and an unstoppable failure of the dam. Meanwhile, the formation time begins when the initiation time ends and continues until the breach has reached its maximum size [43]. However, previous studies stated that the formation time is not until the absolute draining end of the reservoir [43]. Several previous studies also stated that the failure time of a breach (Tf) is generally described as the time between the initiation of the breach and the development of its peak discharge (Qp). For example, Froehlich (2008) [24] stated that the failure time is from the initiation of a breach until it reaches its maximum size.
Two-time parameters were examined in the Swa Dam case for the failure time of a breach (Tf) according to previous studies. In the Swa Dam, the water discharge rate increased from zero at 5:00 a.m. LT to the maximum breach discharge rate, which was about 7643 m3/s at 7:00 a.m. LT on 29 August 2018 Therefore, the time taken to peak discharge was 2 h, which was from 5:00 a.m. to 7:00 a.m. LT. After that, the water discharge rate dramatically decreased to 3000 m3/s at 9:00 a.m. After the drastic decrease, the water discharge decreased gradually with the decrease in the water level. Therefore, the breach development time or failure time for the Swa Dam breach was taken as 4 h. The detailed water discharge conditions are described in Table A3.
2.8.2. Empirical Equations from Previous Studies
Empirical equations from previous studies were used to clarify the characteristics of the breach event that happened in the Swa Dam. The empirical equations were simplified equations derived from regression analyses of past dam failure cases [42]. Several world dam failure datasets were compiled in previous studies and various empirical equations have been proposed on the basis of these datasets to qualify relationships between breach parameters such as peak outflow (Qp), average width (Bavg) and failure time of a breach (Tf). From the empirical equations established between the 1980s and 2022, eight of them were selected to assess the Swa Dam breach. These empirical equations could be divided into two categories according to their distinguishing variables. Six equations were categorized as equations for any failure modes, levels of erodibility and dam types. They include those of the Bureau of Reclamation (USBR) (1982) [17], MacDonald and Langridge-Monopolis (1984) [18], Pierce et al. (2010) [19], Soliman (2015) [20], Sharharm (2013) [21] and Tegos et al. (2022) [22], as shown in Table 1. Other equations include three equations by Froehlich established in 1995, 2008 and 2016 and that of Xu and Zhang (2009) [26] (Table 2).
In the first set of equations, the USBR’s (1982) [17] equation was based on 21 failed dams, whereas of the MacDonald and Langridge-Monopolis (1984) [18] equation was from 42 dam failure cases, Pierce et al.’s (2010) [19] equation was from 87 case studies, Soliman (2015) [20] used 166 case studies and Sharharm (2013) [21] collected data from 142 damaged dams. Each equation comprised three equations for three breach parameters: the average breach width (Bavg), failure time (Tf) and peak outflow (Qp). Pierce (2010) [19] only had an equation for peak outflow, whereas Soliman (2015) [20] did not have a peak outflow equation and Sharharm (2013) [21] had no equation for failure time, as described in Table 1. Most of the equations depended on the water height from the breach bottom (Hw) and the water volume at failure time (Vw) (Table 1). Some equations were governed by the height of a breach (Hb) and the average dam width (Wavg) (Table 1). Soliman’s (2015) [20] equation was based on dam characteristics such as the storage volume (V), dam height (H) and average dam width (Wavg), as shown in Table 1. Here, Tegos’s (2022) equation for peak breach outflow was also presented as it is the most updated empirical formula which was constructed on dam characteristics such as the storage volume (V) and dam height (H) using the database of 161 historical dam failures [22].
The second category included Froehlich’s equations and Xu and Zhang’s (2009) [26] equations, as shown in Table 2. Froehlich proposed equations for breach parameters (Bavg, Tf and Qp) using data from 111 past dam failure cases in 3 different papers (1995, 2008 and 2016) [23,24,25]. Froehlich’s equations were mostly based on the height of a breach (Hb), the water height from the breach bottom (Hw) and the water volume at failure time (Vw). Failure modes were distinguished by the coefficient K0 in Froehlich’s average breach width equations proposed in 1995 and 2008 and by Km in Froehlich’s 2016 average breach width equations. The values for the coefficient K0 were 1.4 or 1.3 for the overtopping failure mode and 1 for piping or other failure modes. Similarly, Km = 1.5 or 1.85 for the overtopping failure mode and 1 for piping or other failure modes. Froehlich’s 2016 equations for the average breach width and peak outflow had a factor for the breach height, Kh, which was 1 for Hb < Hs and ()1/8 for Hb > Hs. A reference height Hs = 6.1 m was used in Froehlich’s 2016 equations to separate large dams from small dams.
Xu and Zhang (2009) [26] compiled 75 dam failure cases and proposed three equations for Bavg, Tf and Qp as in Table 2 [45]. Meanwhile, Xu and Zhang (2009) [26] distinguished the effects of the types of dams, failure modes and erodibility by inserting the coefficients b3, b4 and b5, respectively, for each breach parameter, as described in Table A2 (Appendix A). The reference height Hr = 15 m was used in Xu and Zhang’s equations to separate large dams from small dams according to the International Commission of Large Dams (1998) [12], and the reference time Tr = 1 h was applied in Xu and Zhang’s (2009) equation of failure time [26]. Thus, the comparison between the calculated characteristics using previous empirical equations and the observed characteristics in the Swa Dam data is considered effective for clarifying the characteristics of the breach phenomenon in the Swa Dam compared with previous events. Further, as cases of spillway failure are very rare, this comparison may provide insight into the role of spillways on earthen embankment dams in reducing flood damage due to dam breaches.
2.8.3. Tested Scenarios for Failure Mechanisms
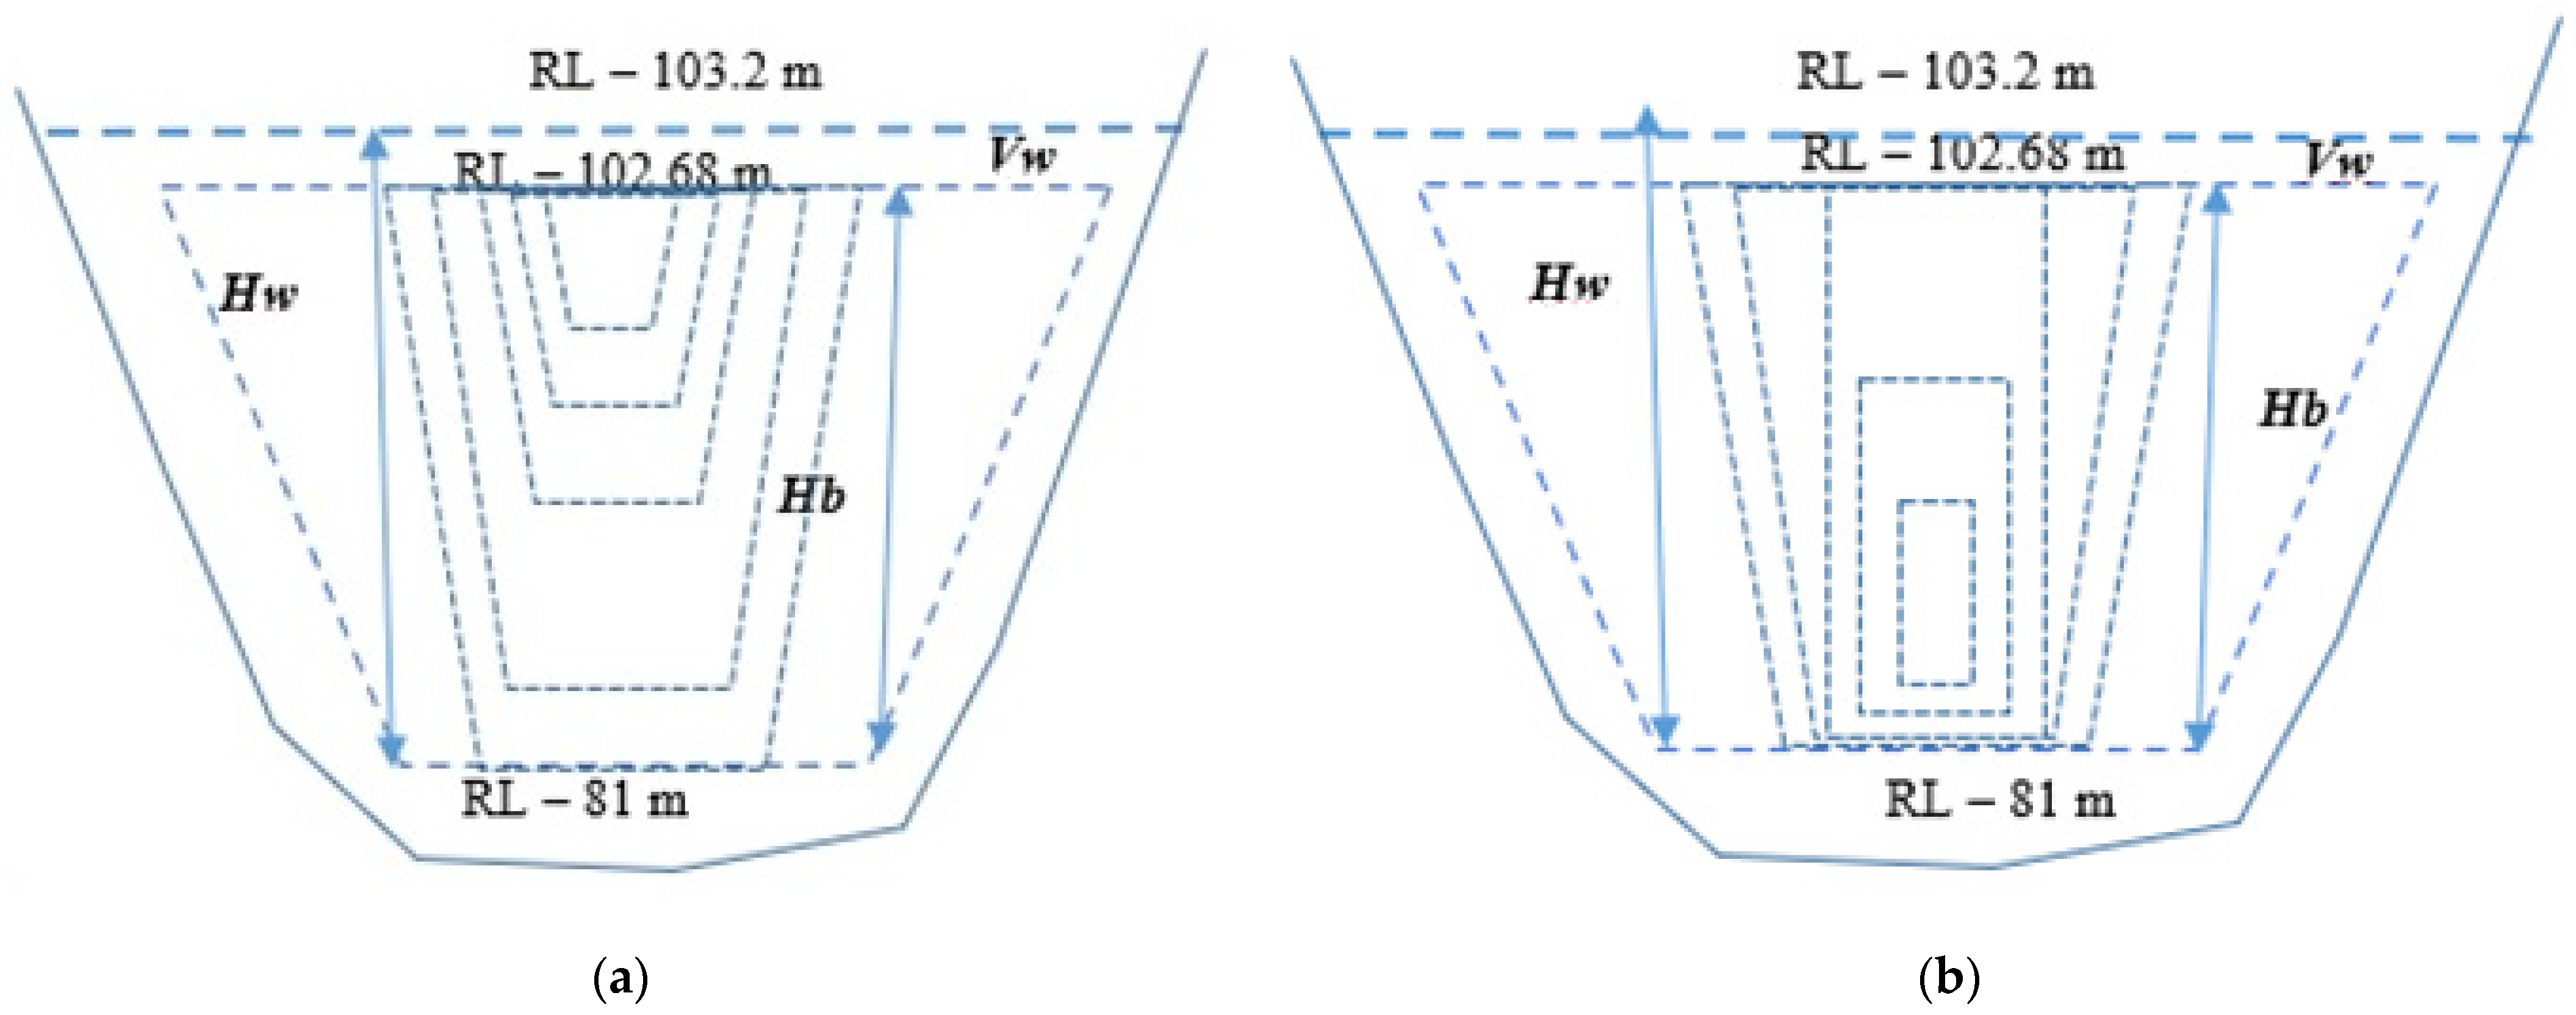
Most previous studies on dam failure have focused on two main mechanisms: overtopping erosion and piping failure of the dam body. Meanwhile, an ogee-type spillway failure happened in the Swa Dam case, indicating that the dam failure mechanism was not the same as those of previous events. However, two probable processes, overtopping erosion and piping erosion, were also considered in the spillway failure in the Swa Dam. Because the water level data indicated that the overflow occurred at the start of the breach, we cannot eliminate the possibility of overtopping erosion. Thus, we set two scenarios, Scenario 1 (overtopping erosion) and Scenario 2 (piping erosion) as described in Figure 8, to apply the selected empirical equations from previous studies.
We set the same water height from the breach bottom (Hw) and height of the breach (Hb) for both scenarios based on the collected survey data for the Swa Dam’s collapse site (mentioned in Section 2.8.1). The water surface level was about R.L 103.2 m at the beginning of the breach and the bottom level of the breach was R.L 81 m which was the final level of the breach opening (detailed description in Section 2.8.1). The detailed setting for the two scenarios is described in Table A4. In addition, the dam height (29.6 m), dam width (170.7 m) and storage volume (266,863,398 m3) of the Swa Dam were applied as parameters related to reservoir properties such as the dam height (H), dam width (Wavg) and reservoir storage (V). The specific values for the coefficients of the empirical equations of Xu and Zhang (2009) [26] were set up for the Swa Dam breach according to Table A2. The values for b4 (failure mode) in Xu and Zhang (2009) [26] were different for each scenario. Xu and Zhang (2009) [26] showed three values for b5 (erodibility), and we performed trial calculations using such three values as there was no direct evidence of such in the Swa Dam. Three values were also described for b3 in Xu and Zhang’s equations, which were related to the types of dams, and two values were selected for the two dam types (concrete-faced dam and homogeneous earth-filled dam) for the Swa Dam according to the material of the dam and the failure that happened in the concrete spillway.
3. Results
3.1. Water Discharge Characteristics
Using SAR data from Sentinel 1, water area changes in the study site before and after the dam breach were analyzed, as shown in Figure 9. Before the breach happened, the reservoir water area of the Swa Dam and along the Swa creek was about 27 km2, according to a satellite image on 19 August 2018 (Figure 9a). The water area at the Swa Dam was reduced to 3.74 km2 after the breach with respect to a 31 August satellite image (Figure 9b). The water area indicated that the water level after the breach was around 84.5 m. According to the height–volume relationship of the Swa Dam, the total volume of discharged water was estimated at around 259 million cubic meters, indicating that 97% of the full storage was discharged. The calculated water volume above the elevation of the spillway floor (R.L 89 m) was 39 million cubic meters.
On the day of the collapse (29 August 2018), no rainfall was recorded, the overflow depth of the spillway was about 0.5 m (water level 103.2 m) and the water discharge rate drastically increased from 0 to 7217.9 m3/s within 1 h (Figure 10). The maximum breach discharge was about 7642.8 m3/s at a 101.1 m water level and happened at 7:00 a.m. LT on 29 August 2018, as shown in Figure 10. This peak discharge is around five times larger than the discharge rate for the spillway design discharge (1486 m3/s). Moreover, the estimated peak discharge was around two times larger than the designed peak flow (3491 m3/s) because of rainfall that occurs once in 1000 years. The peak discharge continued for 1 h until 7:00 a.m. LT, although the water level in the reservoir dropped from 102.2 to 101.1 m. After that, the water discharge rate dramatically decreased to 3000 m3/s in 1 h with a decrease in the water level from 100.1 to 99.5 m. After the drastic decrease, the water discharge decreased gradually with the decrease in the water level, but the discharge rate was still larger than 1500 m3/s until 14:00 LT, suggesting that the water discharge exceeded the spillway design discharge rate for around 9 h. The discharge rate became 500 m3/s 24 h after the peak discharge. The recorded hourly water level and corresponding water volume in the reservoir are described in Table A3 (Appendix B). The total discharged volume until 24 h from the beginning of the breach (29 August 2018, 5:00 a.m. to 30 August 2018, 5:00 a.m.) was around 215.5 million cubic meters, as shown in Table A3.
3.2. Calculated Results Using Empirical Equations
The observed breach parameters, such as the peak outflow (Qp), average breach width (Bavg) and the failure time of the breach (Tf) of the Swa Dam, were compared with the calculated parameters from empirical formulas of previous research. Table 3 explains the assessment between the calculated results from empirical equations and the observed data for the Swa Dam for overtopping and piping scenarios.
3.2.1. Average Breach Width (Bavg)
The average breach width (Bavg) was calculated for 22 cases (Table 3). Nine cases were calculated based on Scenario 1 using equations or coefficients for overflow events and nine cases were calculated for Scenario 2 using coefficients for piping events. For the other four cases, we used empirical formulas based on both overtopping erosion and piping failure. The mean width for the 22 cases was 148 m and by comparing the observed values for the Swa Dam (110.33 m) the average calculated breach width for all cases was 1.3 times larger than the observed breach width of the Swa Dam. The mean widths for Scenarios 1 were 183 m and the average breach width calculated based on Scenario 1 was 1.65 times that of the Swa Dam. The width calculated using Xu and Zhang’s (2009) equation was the minimum (106 m) in Scenario 1 cases, and the calculated width was 0.96 times the observed width in the Swa Dam. The mean widths for Scenarios 2 were 116 m, and the average calculated width was almost similar (1.05 times) to the observed width of the Swa Dam and ranged from 62 to 163 m.
Here, we calculated the absolute relative errors for all empirical equations applied to the 22 cases to evaluate the performance of these equations as shown in Figure 11. The least error value (0.03) was found in Shahram’s equation, and Xu and Zhang’s equation for concrete-faced dams with medium erodibility (piping scenario) has a minimum error value (0.08) for the calculated average breach width. The error values ranged from 0.03 to 1.43 as shown in Figure 11.
3.2.2. Failure Time (Tf)
The breach failure time (Tf) was calculated for 18 cases. Six cases were calculated for Scenario 1 using equations or coefficients for overflow events and six cases were calculated for Scenario 2 using coefficients for piping events. For the other six cases, we used empirical formulas based on both overtopping erosion and piping failure. The average calculated duration was 7.8 h for all cases and ranged from 0.73 h (by USBR, 1982) to 25.6 h (low-erodibility overtopping erosion case of an earthen dam by Xu and Zhang, 2009) [26]. The durations of low-erodibility cases of both earthen and concrete-faced dams by Xu and Zhang (2009) [26] were dramatically longer than other estimations. Except for the low-erodibility cases of Xu and Zhang (2009) [26], the longest calculated Tf was 8.2 h (median erodibility overtopping erosion case of an earthen dam by Xu and Zhang, 2009) [26] and the average Tf became 4.3 h. By comparing these with the observed values in the Swa Dam (4 h), the average calculated durations for all cases were two times larger than the duration for the Swa Dam. When we did not consider the low-erodibility cases, the average of the calculated durations was about 1.2 times larger than that of the Swa Dam for both scenarios. The average duration for Scenario 1 was 5 h, if we did not include low-erodibility cases. Similarly, the average duration for Scenario 2 was 4.9 h, if we did not consider low-erodibility cases. Furthermore, the calculated formation time for a medium-erodibility concrete dam using Xu and Zhang’s (2009) [26] equation was 4.86 h in Scenario 2 (piping) and was 1.2 times the observed time for the Swa Dam.
We calculated the absolute relative errors for all empirical equations applied to 18 cases to evaluate the performance of these equations as shown in Figure 12. Froehlich’s 2008 equation has a minimum error value (0.08) and Xu and Zhang’s equation for a concrete-faced dam with medium erodibility (piping scenario) has a minimum error value (0.22) for the calculated failure time. Xu and Zhang’s equations for concrete-faced and earth dams with low erodibility for both scenarios are found to have very high relative errors. The error values ranged from 0.04 to 5.4 as shown in Figure 12.
3.2.3. Peak Discharge (Qp)
The peak discharge (Qp) was calculated for 20 cases. Seven cases were calculated for Scenario 1 using equations or coefficients for overflow events and, seven cases were calculated for Scenario 2 using coefficients for piping events. For the other six cases, we used empirical formulas based on both overtopping erosion and piping failure. The calculated discharge ranged from 3057 m3/s calculated by Froehlich (2016) [25] with a piping coefficient to 24,912 m3/s calculated by Xu and Zhang (2009) [26], assuming a concrete-faced high-erodibility dam with an overtopping erosion coefficient. By comparing these with the observed values in the Swa Dam (7643 m3/s), the average calculated peak discharge for all cases was 10,203 m3/s and 1.3 times larger than that of the Swa Dam. The average peak discharge for Scenario 1 was 14,630 m3/s and 1.9 times larger than that of the Swa Dam. For Scenario 2, the average peak discharge was 7416 m3/s, almost the same (0.97 times) as the observed peak flow. The observed peak discharge of the Swa Dam was within the range of both Scenarios 1 and 2.
We considered the absolute relative errors for all empirical equations applied to 20 cases to evaluate the performance of these equations as shown in Figure 13. The least error value (0.05) was found in Froehlich’s 2016 [25] equation for a piping scenario, and Xu and Zhang’s equation for a concrete-faced dam with medium erodibility (piping scenario) also had a minimum error value (0.14) for the calculated peak outflow. Xu and Zhang’s equations for concrete-faced and earth dams with medium and high erodibility for the overtopping scenario are found to have high relative errors. The error values ranged from 0.05 to 2.26 as shown in Figure 13.
4. Discussion
4.1. Occurrence of Spillway Breach
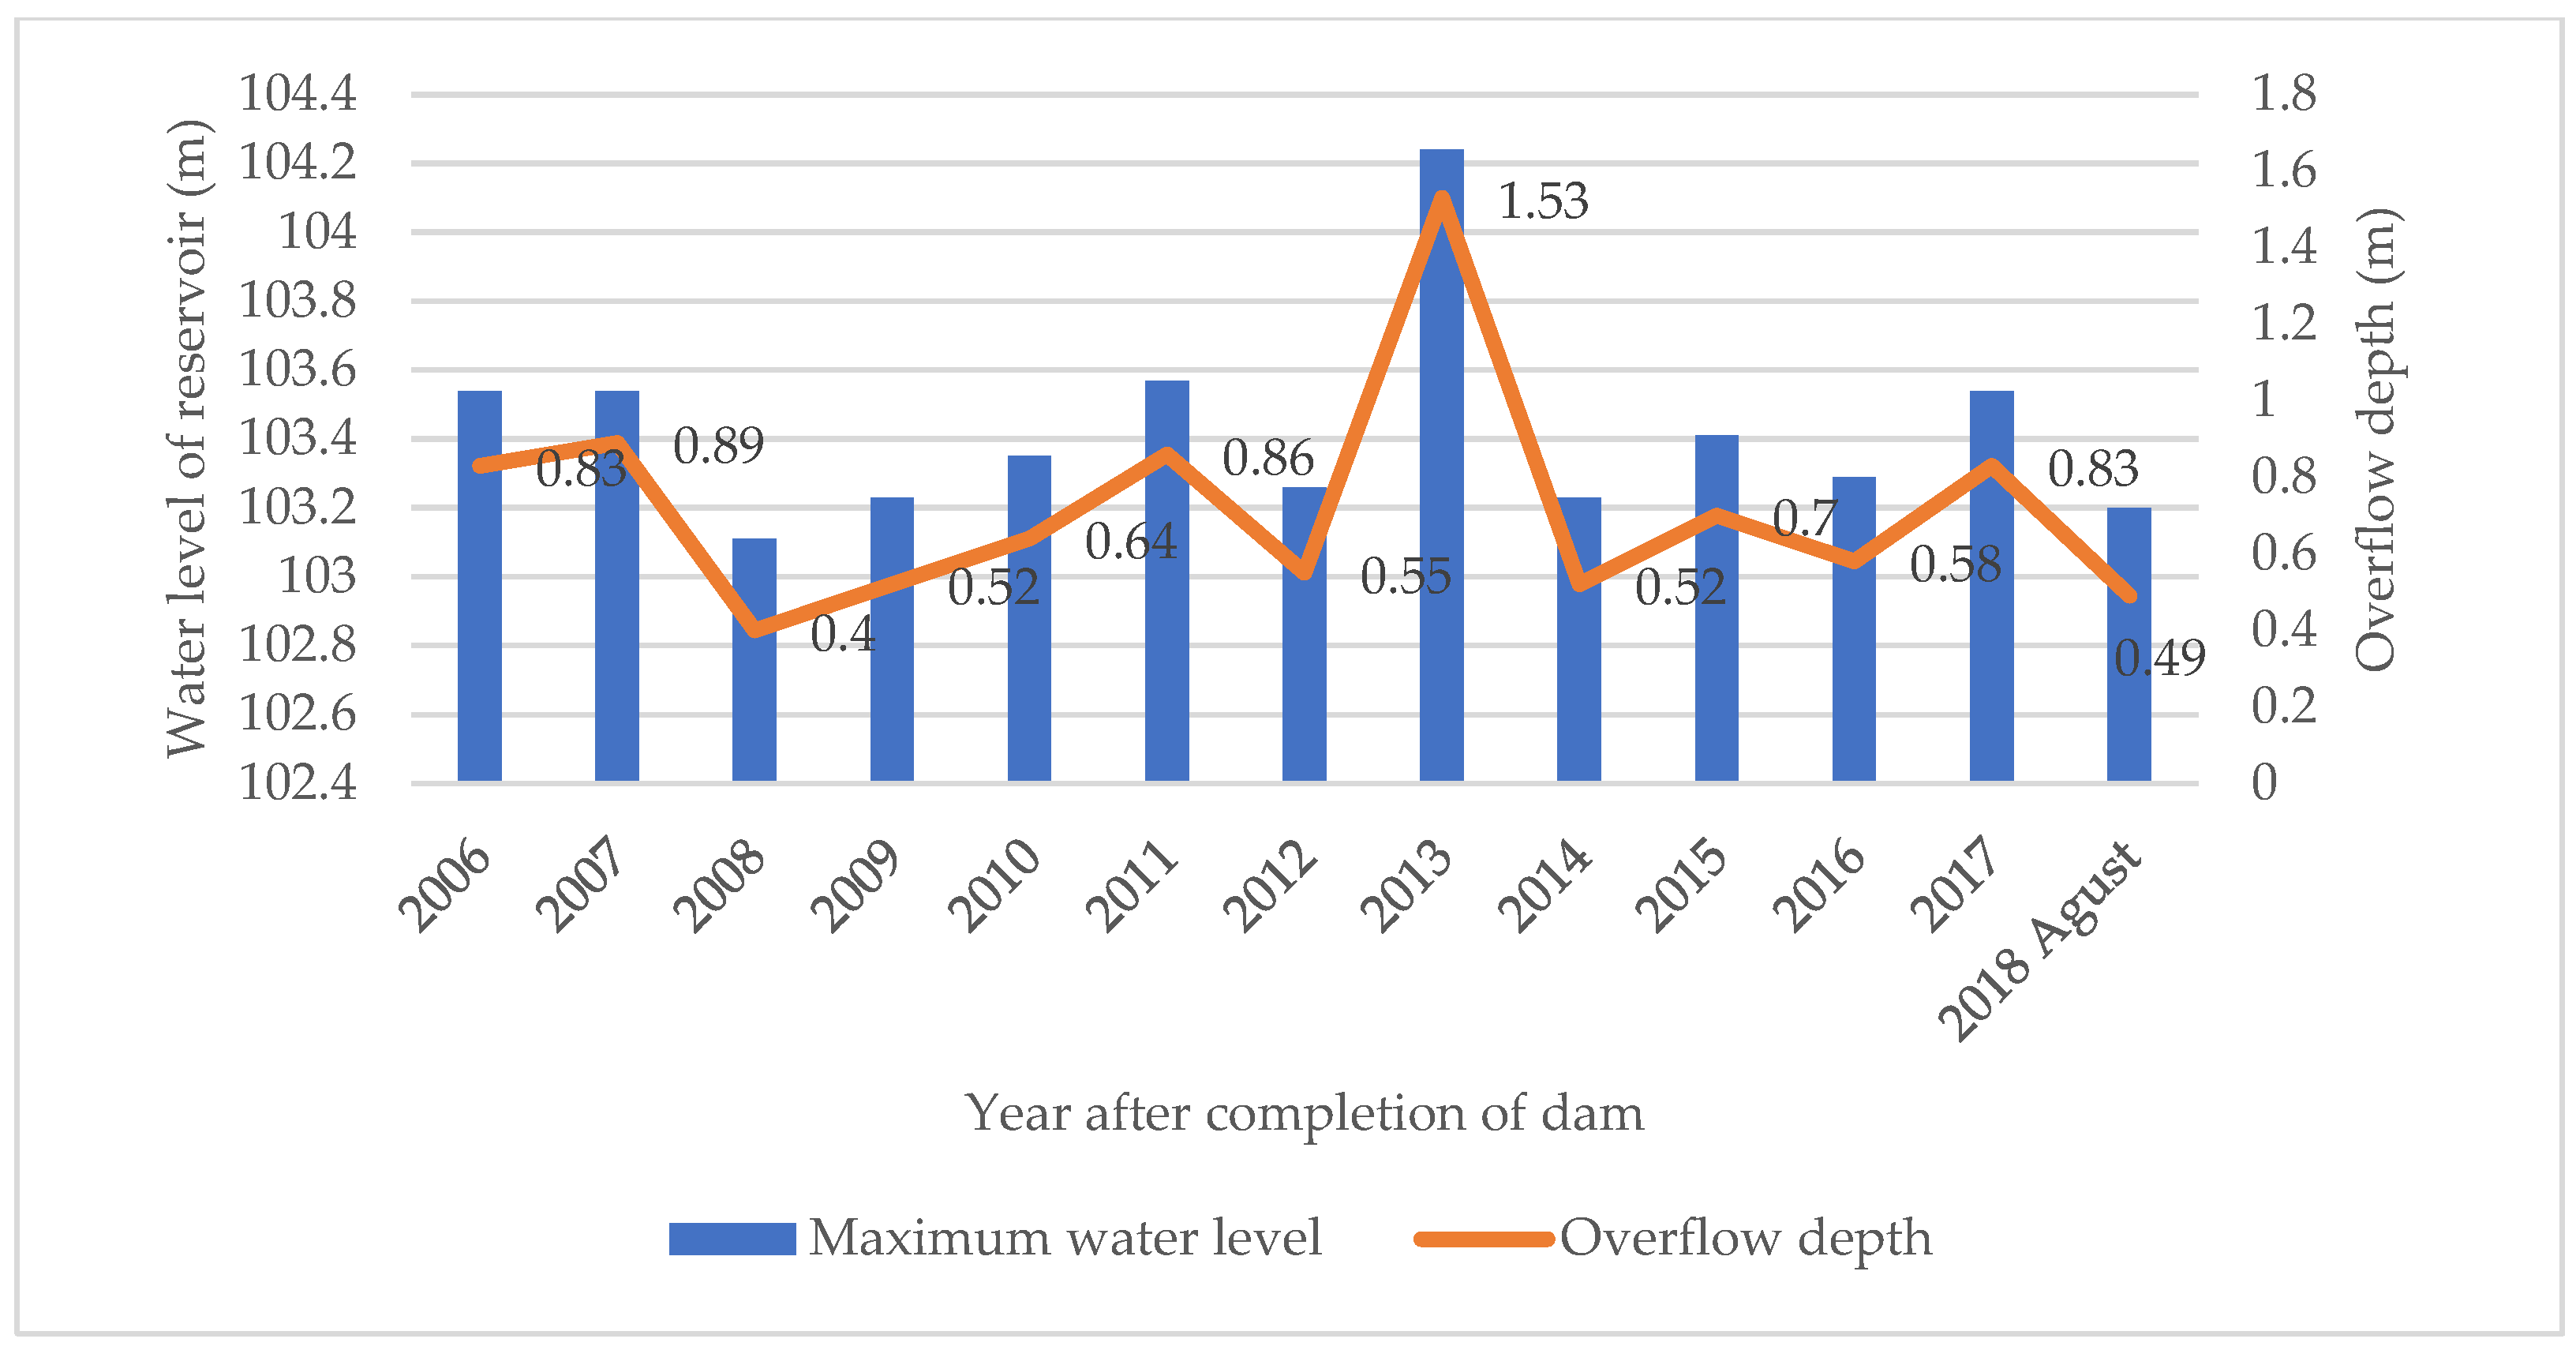
By compiling 13 years of water level records from the IWUMD, the spillway overflowed 38 times; 8 times in 2017 and 6 times in 2011. Generally, the maximum overflow occurred in August and October of each year, according to the records. We compared the overflow depth of the spillway in August 2018 with the highest overflow depth in each year, and the overflow depth of the breach day was about 0.5 m, which was not high enough compared with those in previous events, as shown in Figure 14. The largest overflow depth happened in 2013, which was 1.53 m and around three times larger than the highest overflow depth on the breach day. This suggests that the overflow depth cannot fully explain the occurrence of the spillway breach. The surface or interior of the spillway might have weakened over time because of other reasons.
On the other hand, the overflow rate at the last 6 h before the breach (212 m3/s) was smaller than the designed flow rate of the spillway (1486 m3/s). The drastic increase in the outflow rate immediately after the start of the breach suggests that the cross-section of the water flow suddenly increased after the start of the breach. One probable explanation for this is that the intake of the spillway was suddenly broken and the outflow rate dramatically increased. A similar sudden collapse also happened in the spillway of the Montedoglio earth-fill dam in Italy during its stability test. The reservoir water level was raised to the crest level of the spillway during the stability test, and three concrete blocks 10 m high fractured out. In addition, no rainfall was recorded on the breach day, similar to the Swa Dam case [21].
4.2. Erosion of the Spillway
According to the observed water level and corresponding calculated outflow rate, the water level decreased with time; however, the discharge rate remained nearly constant in the peak 2 h (from 5 a.m. to 7 a.m.), as in Figure 10. This suggests that the cross-sectional area of outflow gradually enlarged with time for the first 2 h. Two possibilities for this process are (1) the gradual erosion of the spillway intake, and (2) the gradual erosion of the right bank and bed of the spillway. At peak flow periods, the flow rate was very large, suggesting that the shear stress of flow to the bed and side bank of the spillway was much larger than designed, and the drastic erosion and collapse might have occurred because of the large shear stress. Moreover, the water flow might have been subjected to the right bank side because only the right side of the spillway was eroded in the event. This agreed well with the foundation test of the spillway, which found that the bearing capacity of the left side was larger than that of the right side of the spillway (Section 2.4).
The Effectiveness of the Presence of the Spillway
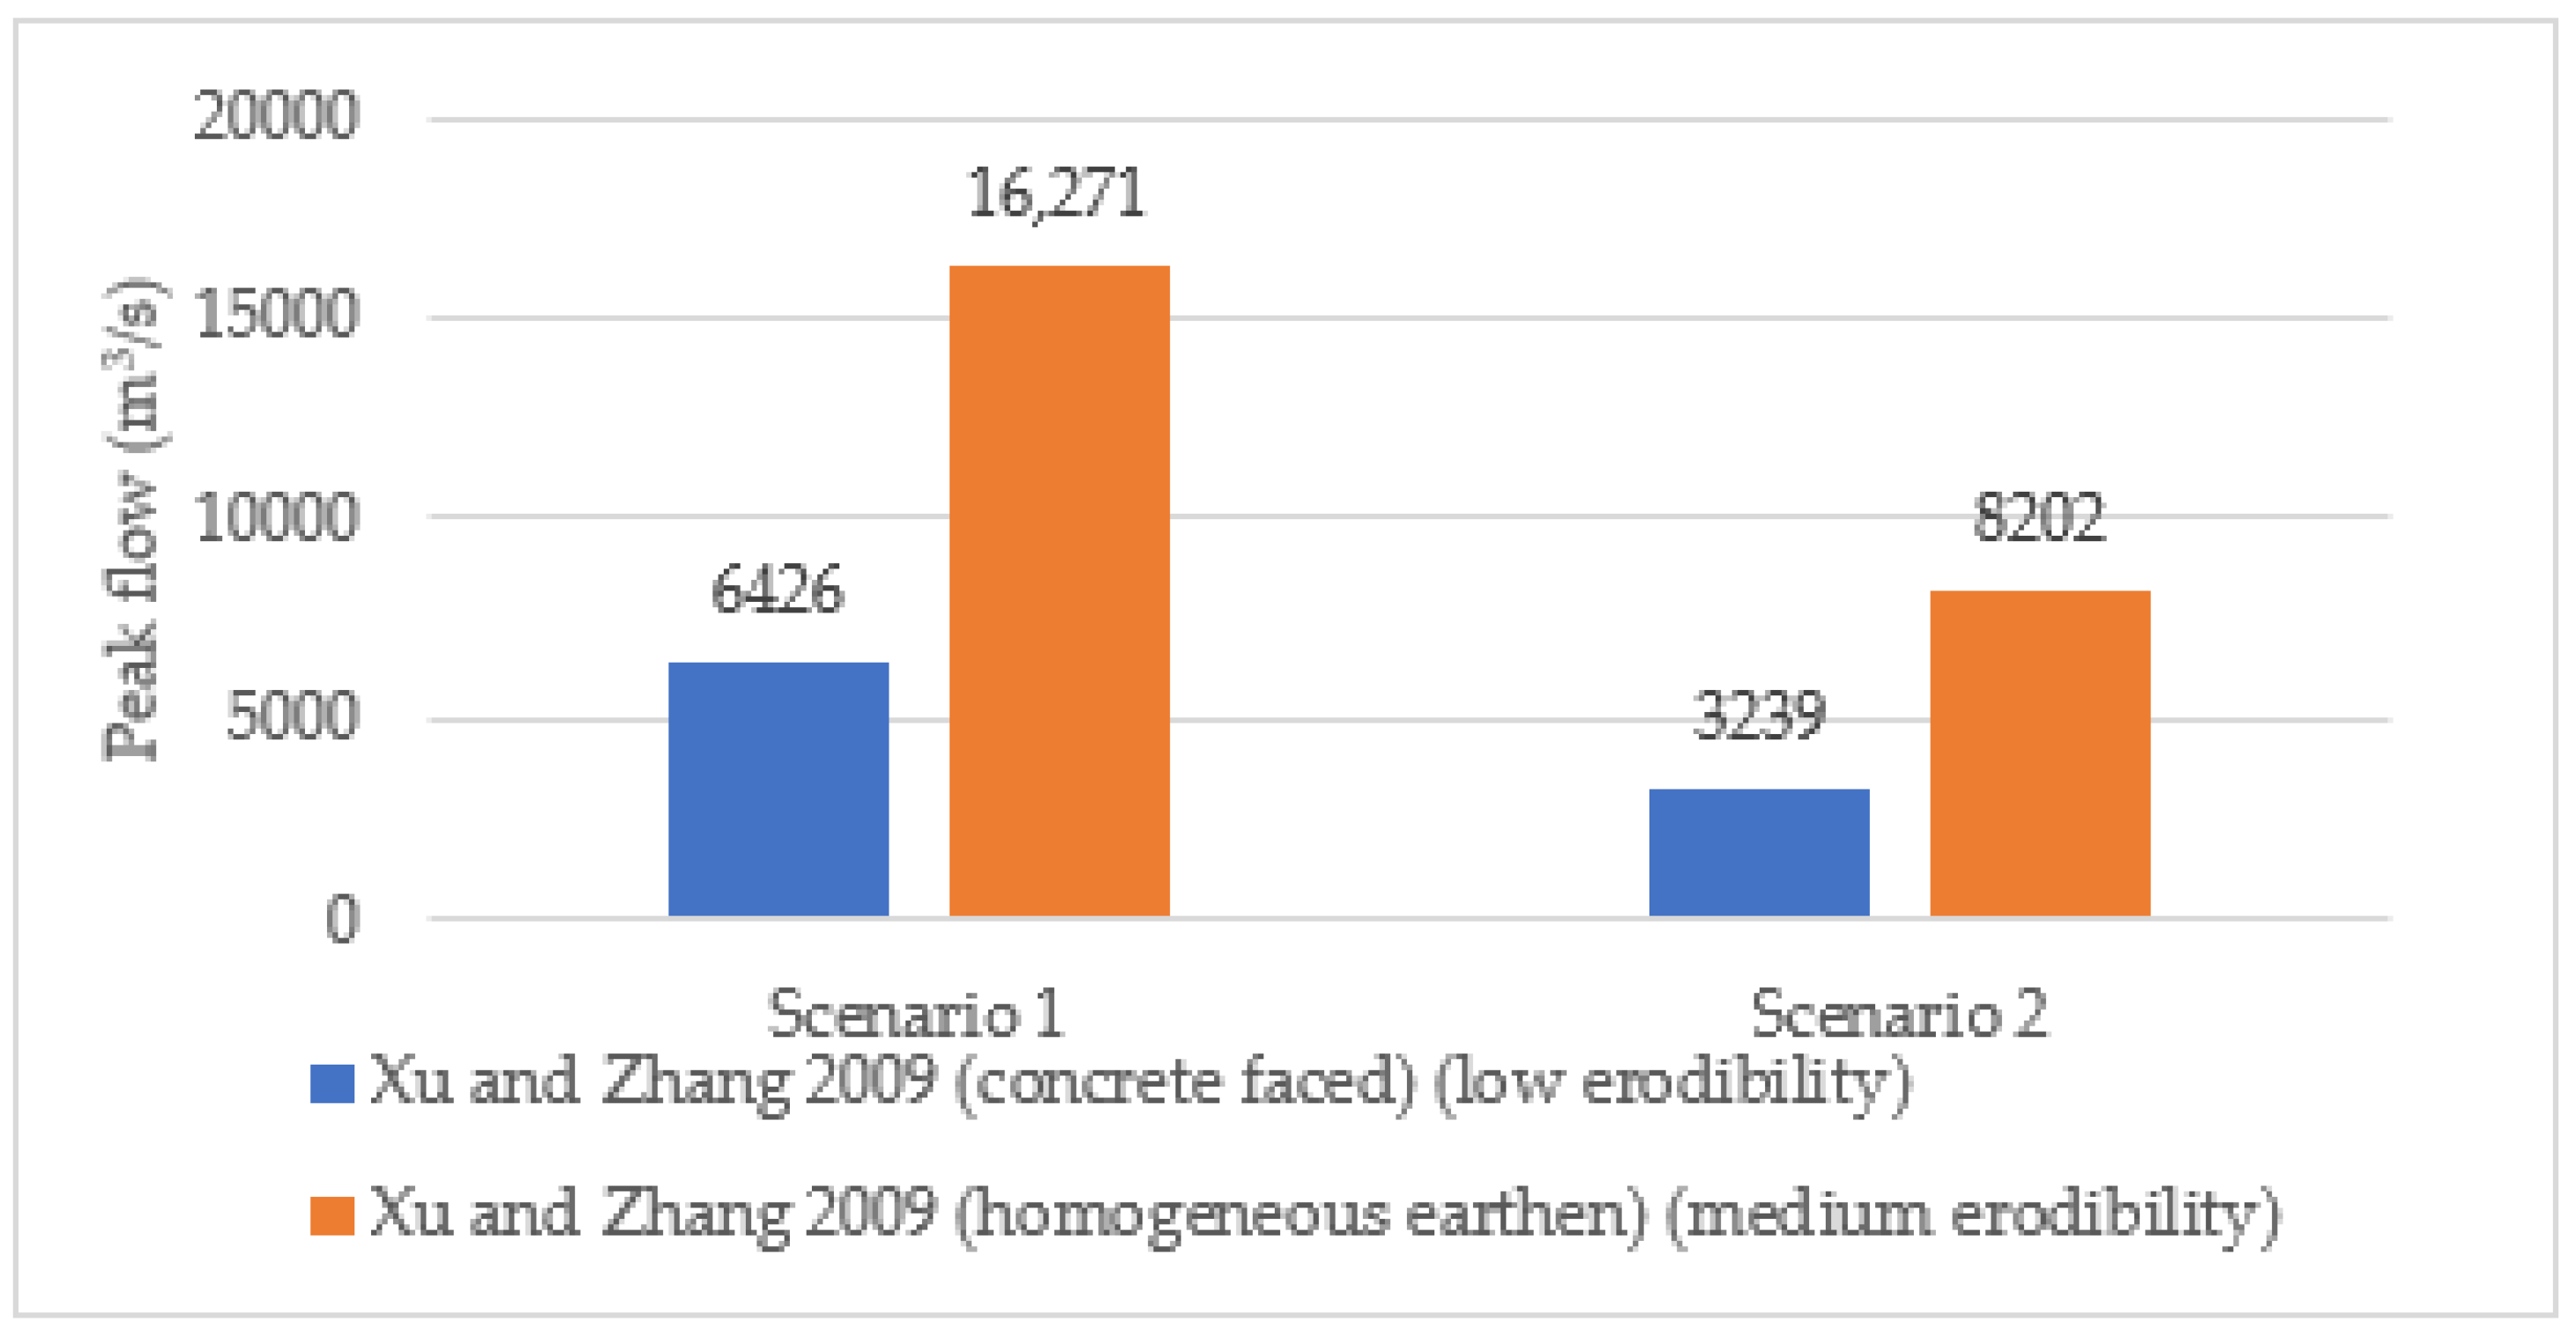
The effects of the concrete spillway in the event were analyzed on the basics of the erodibility and dam type, referring to the calculated results from Xu and Zhang’s (2009) equations. Once we assumed the erodibility level to be the medium erodibility and homogeneous earthen dam, the calculated peak flow, Qp, was about 1.1 to 2.1 times larger than the observed peak discharge. Meanwhile, in the case of the low-erodibility and concrete-faced dam, the calculated peak flow was 0.4 to 0.8 times lower than the observed peak discharge, as shown in Figure 15. This indicates that the case of the Swa Dam was intermediate between low and medium erodibility and was relatively close to low erodibility, rather than medium erodibility. This suggests that the spillway in the Swa Dam might have had a reduced erodibility compared with that of a homogeneous earthen dam. This agrees well with the condition of the Swa Dam, where the floor of the spillway was covered by 15 cm-thick lean concrete over 0.3 m-thick reinforced cement concrete at the duckbill part. Moreover, the side bank of the spillway might be considered as contributing to reducing the breach width because the left bank of the spillway was not eroded. The collapse event that happened in the spillway of the Montedoglio earth-fill dam in Italy also concluded that the presence of the spillway channel walls reduced the breach outflow [27].
4.3. Lessons from the Disaster
Further analyses are necessary to accurately determine the reason for the Swa Dam’s sudden collapse. However, the spillway may have simply depreciated over time because of the several reasons including the changing climate pattern. However, the Swa Dam case suggested that even in the ordinal magnitude of rainfall, dam collapse may occur. In the Swa Dam 1 year before the breach the overflow rate in the spillway was immediately larger than other years after 2013 (described in Section 4.1). Therefore, regular onsite inspection is important to check the changes in the body of the dam and its appurtenance structures and must be done at least once a year.
Once the collapse begins, the breach flow rate increases sharply and the evacuation time in the downstream area becomes extremely limited, according to the previous failures. For example, in the case of the Niedow Dam failure in Poland, the earthen dam was completely swept away within 80 min, which means that the abandon time was less than 80 min [46]. Thus, to mitigate damage, we must prepare hazard maps and alter systems in advance. If we find signature characteristics of the collapse during regular inspections, we must develop hazard maps and alter systems as was done in the previous studies which prepared the hazard systems for emergency preparedness for the breach [47,48].
Another suggestion is that the previous empirical equations established from the past dam failure cases seemed to be applicable when they were applied to the spillway failure case. However, to apply these equations for hazard mapping before the breach, we must set the breach height (Hb) or the water height during the breach (Hw) as all the equations were dominated by the heights and storage volume of the reservoir relating to those heights. In this regard, we must determine Hb or Hw and related parameters before using these empirical equations.
5. Conclusions
The spillway breach that suddenly happened in the Swa Dam for unknown reasons was assessed in terms of changes in topography and water discharge circumstances and breach parameters of the event. We applied selected empirical formulas from previous studies to calculate the breach parameters and tried to find the causes of the failure. From the field investigation, we found that the observed average breach width was about 110 m, and the breach opening was expanded to the right side of the dam embankment and became wider from the original spillway width. The water discharge hydrograph for the breach event was implemented from the water level records and elevation-storage data of the Swa reservoir and the peak outflow was about 7643 m3/s, calculated from the water level records of the event. The observed failure time is difficult to determine because of the lack of evidence; however, we assumed it to be 4 h in this study according to the water level records.
As the spillway breach was assessed in terms of breach parameters, the empirical equations were applied to evaluate three breaching parameters: the average breach width, failure time and peak discharge, and the calculated results were compared to the observed values. Additionally, we evaluated the performance of the empirical equations by the absolute relative errors of them. From the empirical equations applied in this study, Froehlich’s equations and Xu and Zhang’s 2009 equations exhibit the highest among the empirical formulas; however, considering the high uncertainty of the breach phenomenon and the lack of real-world sample to calibrate the models, all models with low absolute errors (i.e., lower than 0.5) set out above are recommended for further application. In this study, the effect of the spillway in the dam breaching process could be clarified in Xu and Zhang’s empirical equations with dam types and erodibility factors.
The failure modes are uncertain because of the inconsistency of the results. From the calculated peak outflow results, the failure reason is overtopping as the relative error is very low in Froehlich’s 2016 equation for overtopping scenario. However, the results from Xu and Zhang’s concrete-faced dam with medium erodibility equation suggested that the failure mode is piping in the average breach width and failure time calculation. In this regard, no definitive suggestions may be raised because of the lack of evidence. Therefore, the lessons we learned from this event are that the dam breach parameters and peak outflow could be predicted only if the appropriate empirical formulas are selected with enough information. The uncertainty of these empirical equations was also high as described in the study by Tony Whal (2004) [49].
Furthermore, dam breach analysis also could be performed using other methods such as machine learning algorithms or numerical models such as two or three dimensional CFD models. For example, the seepage rate prediction was taken at a rockfill dam in Japan to compare the predicted and observed dam leakages using three machine learning algorithms such as random forest (RF), extremely randomized trees (ERT) and support vector regression (SVR) and found that they were in good agreement with each other [50]. Furthermore, the performance of the Flow-3D model was satisfied in the Mahabad Dam (Iran) and Tignes Dam (France) cases compared to a laboratory experiment and other models [51]. Therefore, further studies based on the hypothesis of this study should be performed, while taking into consideration these overestimations and uncertainties, and studies on selecting suitable empirical formulas or the use of the numerical modelling for other dams in Myanmar should be conducted.
Author Contributions
Conceptualization, P.P.S.S.K. and T.U.; methodology, P.P.S.S.K.; software, P.P.S.S.K.; validation, P.P.S.S.K. and T.U.; formal analysis, P.P.S.S.K.; investigation, P.P.S.S.K.; resources, P.P.S.S.K.; data curation, P.P.S.S.K.; writing—original draft preparation, P.P.S.S.K.; writing—review and editing, P.P.S.S.K. and T.U.; visualization, P.P.S.S.K.; supervision, T.U.; project administration, T.U.; funding acquisition, P.P.S.S.K. All authors have read and agreed to the published version of the manuscript.
Funding
This research was funded in part by the Project for Human Resources Development Scholarship by the Japanese Grant Aid (JDS), Japan International Cooperation Agency (JICA).
Data Availability Statement
The data presented in this study are available upon request from the corresponding author.
Acknowledgments
We would like to express our deepest appreciation to the IWUMD, JDS and all supporters for their immense support.
Conflicts of Interest
The authors declare no conflict of interest.
Abbreviations
| Qp | peak outflow due to breach, m3/s. |
| Bavg | average breach width, m. |
| Tf | breach formation time, h. |
| Vw | volume of water at failure time, m3. |
| Hw | height of the water from the breach bottom, m. |
| Wavg | average width of the dam, m. |
| Hb | height of breach, m. |
| Ver | volume of material eroded from the dam, m3. |
| g | acceleration due to gravity (9.8 m/s2 in the SI units). |
| H | dam height, m. |
| V | volume of water stored in the dam, m3. |
| K0/Km | coefficient for failure mode (Froehlich’s equations). |
| Kh | coefficient of the size of the dam (Froehlich’s equations). |
| Hr | reference height (15 m) (Xu and Zhang’s equation). |
| Hs | reference height (6.1 m) (Froehlich’s equation). |
| Tr | reference time (1 h). |
| b3 | coefficient of dam type (Xu and Zhang’s equation). |
| b4 | coefficient of failure mode (Xu and Zhang’s equation). |
| b5 | coefficient of erodibility (Xu and Zhang’s equation). |
Appendix A

Table A1.
Design flood for different return periods at the Swa Dam site, Yedashe Township (IWUMD).
| Return Period (Year) | 1-Day Maximum Rainfall (mm) | Peak Flood (m3/s) |
|---|---|---|
| 20 | 176.5 | 1758 |
| 50 | 204.5 | 2105 |
| 100 | 225.6 | 2296 |
| 200 | 246.4 | 2693 |
| 500 | 274.3 | 3241 |
| 1000 | 294.9 | 3491 |
Table A2.
Coefficient values of Xu and Zhang’s (2009) [45] empirical equations.
Table A2.
Coefficient values of Xu and Zhang’s (2009) [45] empirical equations.
| Coefficients | Average Breach Width, Bavg | Failure Time, Tf | Peak Outflow, Qp |
|---|---|---|---|
| b3, Dam with core walls | −0.041 | −0.327 | −0.503 |
| b3, Concrete-faced dam | 0.026 | −0.674 | −0.591 |
| b3, Homogeneous/zoned earth fill dam | −0.226 | −0.189 | −0.649 |
| b4, Overtopping | 0.149 | −0.579 | −0.705 |
| b4, Piping | 0.389 | 0.611 | −1.039 |
| b5, Low erodibility | −0.391 | 0.579 | −1.362 |
| b5, Medium erodibility | −0.14 | −0.564 | −0.375 |
| b5, High erodibility | 0.291 | −1.205 | −0.007 |
Appendix B
Table A3.
Hourly water level, equivalent reservoir water volume and calculated breach outflow during the Swa Dam breach event.
Table A3.
Hourly water level, equivalent reservoir water volume and calculated breach outflow during the Swa Dam breach event.
| Time (Hour) | Water Level (m) | Outflow Rate (m3/s) | Volume in the Reservoir (Mm3) |
|---|---|---|---|
| 29 August, 5:00 a.m. | 103.2 | 0.0 | 279.1 |
| 6:00 a.m. | 102.2 | 7217.9 | 253.1 |
| 7:00 a.m. | 101.1 | 7642.8 | 226.4 |
| 8:00 a.m. | 100.1 | 5756.2 | 203.0 |
| 9:00 a.m. | 99.5 | 3047.4 | 179.8 |
| 10:00 a.m. | 98.3 | 6771.8 | 167.7 |
| 11:00 a.m. | 97.6 | 3893.7 | 153.6 |
| 12:00 p.m. | 97.0 | 2945.3 | 143.0 |
| 1:00 p.m. | 96.1 | 4938.7 | 129.2 |
| 2:00 p.m. | 95.7 | 1783.4 | 122.8 |
| 3:00 p.m. | 95.3 | 1920.8 | 115.9 |
| 4:00 p.m. | 94.9 | 1646.0 | 109.9 |
| 5:00 p.m. | 94.5 | 2030.1 | 102.6 |
| 6:00 p.m. | 94.1 | 1203.7 | 98.3 |
| 7:00 p.m. | 93.8 | 984.4 | 94.8 |
| 8:00 p.m. | 93.6 | 984.7 | 91.2 |
| 9:00 p.m. | 93.2 | 1203.3 | 86.9 |
| 10:00 p.m. | 92.7 | 1750.5 | 82.6 |
| 11:00 p.m. | 92.6 | 437.5 | 79.0 |
| 12:00 a.m. | 92.3 | 984.7 | 75.5 |
| 30 August, 1:00 a.m. | 92.2 | 656.5 | 73.1 |
| 2:00 a.m. | 91.9 | 875.1 | 69.9 |
| 3:00 a.m. | 91.7 | 656.5 | 67.6 |
| 4:00 a.m. | 91.6 | 547.2 | 65.6 |
| 5:00 a.m. | 91.4 | 546.8 | 63.6 |
| 6:00 a.m. | 91.3 | 240.9 | 62.8 |
| 7:00 a.m. | 91.1 | 561.9 | 60.8 |
| 8:00 a.m. | 90.9 | 481.7 | 59.0 |
| 9:00 a.m. | 90.7 | 481.7 | 57.0 |
Table A4.
Input data set for the parameters of the Swa Dam breach for different scenarios.
| Scenario 1 (Spillway Breach by Overtopping) | Scenario 2 (Spillway Breach by Piping) | |
|---|---|---|
| Spillway crest level (m) | 102.68 | 102.68 |
| Breach bottom level (m) | 81 | 81 |
| Water surface level (m) | 103.2 | 103.2 |
| Breach height, Hb (m) | 21.68 | 21.68 |
| Height of water at failure time, Hw (m) | 22.2 | 22.2 |
| Dam height, H (m) | 29.6 | 29.6 |
| Average dam width, Wavg (m) | 170.7 | 170.7 |
| Water volume at failure time, Vw (m3) | 276,207,009 | 276,207,009 |
| Storage of the Swa Dam, V (m3) | 266,863,398 | 266,863,398 |
Figure A1.
Average annual rainfall and annual inflow of the study site (recorded by the IWUMD).

Figure A2.
Typical cross-section of Swa Dam (IWUMD).

References
- Zhang, L.; Xu, Y.; Jia, J. Analysis of earth dam failures: A database approach. Georisk Assess. Manag. Risk Eng. Syst. Geohazards 2009, 3, 184–189. [Google Scholar] [CrossRef] [Green Version]
- Aureli, F.; Maranzoni, A.; Petaccia, G. Review of Historical Dam-Break Events and Laboratory Tests on Real Topography for the Validation of Numerical Models. Water 2021, 13, 1968. [Google Scholar] [CrossRef]
- Singh, K.P.; Snorrason, A. Sensitivity of outflow peaks and flood stages to the selection of dam breach parameters and simulation models. J. Hydrol. 1984, 68, 295–310. [Google Scholar] [CrossRef]
- Castorani, A.; Moramarco, T. Selecting the optimal design flood. Int. J. Hydropower Dams 1995, 2, 74–80. [Google Scholar]
- Morris, M.; Hassan, M.; Vaskinn, K. Breach formation: Field test and laboratory experiments. J. Hydraul. Res. 2007, 45 (Suppl. S1), 9–17. [Google Scholar] [CrossRef]
- Greenbaum, N. Assessment of dam failure flood and a natural, high-magnitude flood in a hyperarid region using paleoflood hydrology, Nahal Ashalim catchment, Dead Sea, Israel. Water Resour. Res. 2007, 43, W02401. [Google Scholar] [CrossRef] [Green Version]
- Stevens, M.; Linard, J. The safest dam. J. Hydraul. Eng. 2002, 128, 139–142. [Google Scholar] [CrossRef]
- Schmocker, L. Book review: The failure of embankment dams due to overtopping. J. Hydraul. Res. 2009, 47, 288. [Google Scholar] [CrossRef]
- Jandora, J.; Ríha, J. The Failure of Embankment Dams due to Overtopping; Vutium Press: Brno, Czech Republic, 2008. [Google Scholar]
- Valiani, A.; Caleffi, V.; Zanni, A. Case Study: Malpasset Dam-Break Simulation using a Two-Dimensional Finite Volume Method. J. Hydraul. Eng. 2002, 128, 460–472. [Google Scholar] [CrossRef]
- Si, Y.; Qing, D. The world’s most catastrophic dam failures: The August 1975 collapse of the Banqiao and Shimantan Dams. In The River Dragon Has Come; Routledge: Abingdon, UK, 1998; pp. 25–38. [Google Scholar]
- ICOLD (International Commission on Large Dams). Lessons from Dam Incidents; ICOLD: Paris, France, 1973; p. 1069. [Google Scholar]
- Evans, J.E.; Mackey, S.D.; Gottgens, J.F.; Gill, W.M. Lessons from a dam failure. Ohio J. Sci. 2000, 100, 121–131. [Google Scholar]
- Deangeli, C.; Giani, G.P.; Chiaia, B.; Fantilli, A.P. Dam Failures. In WIT Transactions on State-of-the-Art in Science and Engineering; WIT Press: Southampton, UK, 2009. [Google Scholar]
- Demissie, M.; Tsihrintzis, V.A.; Bogner, W.C.; Bhowmik, N.G. Scour Channel Development After Spillway Failure. J. Hydraul. Eng. 1988, 114, 844–860. [Google Scholar] [CrossRef]
- Koskinas, A.; Tegos, A.; Tsira, P.; Dimitriadis, P.; Iliopoulou, T.; Papanicolaou, P.; Koutsoyiannis, D.; Williamson, T. Insights into the Oroville Dam 2017 Spillway Incident. Geosciences 2019, 9, 37. [Google Scholar] [CrossRef] [Green Version]
- United States Bureau of Reclamation (Reclamation) (USBR). Guidelines for Defining Inundated Areas Downstream from Bureau of Reclamation Dams; Reclamation Planning Instruction No. 82-11; USBR: Washington, DC, USA, 1982.
- MacDonald, T.C.; Langridge-Monopolis, J. Breaching characteristics of dam failures. J. Hydraul. Eng. 1984, 110, 567–586. [Google Scholar] [CrossRef]
- Pierce, M.W.; Thornton, C.I.; Abt, S.R. Predicting peak outflow from breached embankment dams. J. Hydrol. Eng. 2010, 15, 338–349. [Google Scholar] [CrossRef] [Green Version]
- Soliman, A.; Bekhit, H.; Hamed, K.; El Zawahry, A. Prediction of dam breach parameters and their uncertainties. J. Eng. Appl. Sci. 2014, 61, 269–290. [Google Scholar]
- Nourani, V.; Mousavi, S. Evaluation of Earthen Dam-Breach Parameters and Resulting Flood Routing Case Study: Aidoghmosh Dam. Int. J. Agric. Innov. Res. 2013, 1, 109–115. [Google Scholar]
- Tegos, A.; Dooley, B.; Dimitriadis, P.; Raybould, M. Predictive empirical dam breach peak outflows—A global analysis and proposed updates. In Proceedings of the 21st BDS Conference on Dams and Reservoirs in a Climate Change, Nottingham, UK, 14–17 September 2022. [Google Scholar]
- Froehlich, D.C. Embankment dam breach parameters revisited. In Proceedings of the Conference on Water Resources Engineering, San Antonio, TX, USA, 14–18 August 1995; pp. 887–891. [Google Scholar]
- Froehlich, D.C. Embankment Dam Breach Parameters and Their Uncertainties. J. Hydraul. Eng. 2008, 134, 1708–1721. [Google Scholar] [CrossRef]
- Froehlich, D. Empirical model of embankment dam breaching. In Proceedings of the International Conference on Fluvial Hydraulics (River Flow 2016), St. Louis, MO, USA, 11–14 July 2016; pp. 1821–1829. [Google Scholar] [CrossRef]
- Xu, Y.; Zhang, L.M. Breaching Parameters for Earth and Rockfill Dams. J. Geotech. Geoenviron. Eng. 2009, 135, 1957–1970. [Google Scholar] [CrossRef]
- Moramarco, T.; Barbetta, S.; Pandolfo, C.; Tarpanelli, A.; Berni, N.; Morbidelli, R. Spillway Collapse of the Montedoglio Dam on the Tiber River, Central Italy: Data Collection and Event Analysis. J. Hydrol. Eng. 2014, 19, 1264–1270. [Google Scholar] [CrossRef]
- France, J.W.; Alvi, I.A.; Dickson, P.A.; Falvey, H.T.; Rigbey, S.J.; Trojanowski, J. Independent Forensic Team Report: Oroville Dam Spillway Incident; ASDSO and USSD: Lexington, KY, USA, 2018; pp. 1–584. [Google Scholar]
- Heidarzadeh, M. Whaley Bridge Dam Collapse Is a Wake-Up Call: Concrete Infrastructure Will Not Last Forever without Care, 2019. The Conversation. Available online: https://theconversation.com/whaley-bridge-dam-collapse-is-a-wake-up-call-concrete-infrastructure-will-not-last-forever-without-care-121423 (accessed on 28 December 2022).
- Balmforth, D. Toddbrook Reservoir Independent Review Report, 2020, 89 Pages. Available online: https://www.gov.uk/government/publications/toddbrookreservoir-incident-2019-independent-review (accessed on 28 December 2020).
- Hughes, A. Report on the Nature and Root Cause of the Toddbrook Reservoir Auxiliary Spillway Failure on 1st August 2019, 2020, p. 77. Available online: https://canalrivertrust.org.uk/refresh/media/thumbnail/41505-report-on-toddbrook-reservoir-by-dy-andrew-hughes.pdf (accessed on 30 December 2022).
- Mason, P.J. Toddbrook: The independent government review a forensic approach to causality. Dams Reserv. 2020, 30, 153–164. [Google Scholar] [CrossRef]
- Mehta, A.M.; Weeks, C.S.; Tyquin, E. Towards preparedness for dam failure: An evidence base for risk communication for downstream communities. Int. J. Disaster Risk Reduct. 2020, 50, 101820. [Google Scholar] [CrossRef]
- Allman, C.; Mould, D.J.; Bennett, N.; Rebollo, D.; Robson, R. Toddbrook Reservoir: A case study quantifying the importance of maintaining bywashes. Dams Reserv. 2020, 30, 173–180. [Google Scholar] [CrossRef]
- Lewis, R.; Scott, D.; Lockett, S. Toddbrook Reservoir event 6 July 2020. Dams Reserv. 2020, 30, 132–136. [Google Scholar] [CrossRef]
- Heidarzadeh, M.; Feizi, S. A cascading risk model for the failure of the concrete spillway of the Toddbrook dam, England during the August 2019 flooding. Int. J. Disaster Risk Reduct. 2022, 80, 103214. [Google Scholar] [CrossRef]
- Media Report on Swa Chaung Spillway Breech (August to October 2018). October 2018. pp. 1–20. Available online: https://www.google.com/url?sa=t&rct=j&q=&esrc=s&source=web&cd=&ved=2ahUKEwiNqYLgn6T-AhWagVYBHdDVCe0QFnoECAgQAQ&url=https%3A%2F%2Fwww.researchgate.net%2Fprofile%2FSandar-Tin-Shwe%2Fproject%2FMyanmar-Agriculture-Development-Support-Project%2Fattachment%2F5cc011283843b01b9b9c2c40%2FAS%3A751114987257857%401556091176286%2Fdownload%2FMedia%2Beport%2Bon%2BSwa%2BSpillway%2BBreech.pdf%3Fcontext%3DProjectUpdatesLog&usg=AOvVaw1GRmvU8TRRuU7zz9RH0q-W (accessed on 18 August 2022).
- Japan Aerospace Exploration Agency. ALOS World 3D 30 meter DEM. V3.2, January 2021. Distributed by Open Topogra-Phy. 2021. Available online: https://doi.org/10.5069/G94M92HB (accessed on 22 May 2022).
- Available online: https://asf.alaska.edu/data-sets/sar-data-sets/sentinel-1/ (accessed on 24 May 2022).
- Available online: https://opengislab.com/blog/2018/5/14/flood-mapping-with-sentinel-1-data-using-snap-and-qgis (accessed on 25 May 2022).
- Available online: https://step.esa.int/main/snap-8-0-released/ (accessed on 25 May 2022).
- Wahl, T.L. Evaluation of Erodibility-Based Embankment Dam Breach Equations. June 2014. pp. 1–99. Available online: https://www.usbr.gov/tsc/techreferences/hydraulics_lab/pubs/HL/HL-2014-02.pdf (accessed on 18 August 2022).
- Wahl, T.L. Prediction of Embankment Dam Breach Parameters—A Literature Review and Needs Assesment. Water Resources Research, DSO-98-004 (July). 1998. p. 67. Available online: http://www.usbr.gov/pmts/hydraulics_lab/pubs/DSO/DSO-98-004.pdf (accessed on 18 August 2022).
- Wahl, T.; Bureau, U.S. Breach Parameter Prediction Methods and the Need for and Potential Benefits of Improved Breach Models. In Proceedings of the International Dam Breach Processes Workshop, Agricultural Research Service, Stillwater, OK, USA, 10–11 March 1998. [Google Scholar]
- USBR. Prediction of Embankment Dam Breach Parameters a Literature Review and Needs Assessment; Dam Safety Research Report; Bureau of Reclamation Dam Safety Office: Denver, CO, USA, 1998.
- Kostecki, S.; Banasiak, R. The Catastrophe of the Niedów Dam—The Causes of the Dam’s Breach, Its Development, and Consequences. Water 2021, 13, 3254. [Google Scholar] [CrossRef]
- Mao, J.; Wang, S.; Ni, J.; Xi, C.; Wang, J. Management System for Dam-Break Hazard Mapping in a Complex Basin Environment. ISPRS Int. J. Geo-Inf. 2017, 6, 162. [Google Scholar] [CrossRef] [Green Version]
- Yudianto, D.; Ginting, B.; Sanjaya, S.; Rusli, S.; Wicaksono, A. A Framework of Dam-Break Hazard Risk Mapping for a Data-Sparse Region in Indonesia. ISPRS Int. J. Geo-Inf. 2021, 10, 110. [Google Scholar] [CrossRef]
- Wahl, T.L. Uncertainty of Predictions of Embankment Dam Breach Parameters. J. Hydraul. Eng. 2004, 130, 389–397. [Google Scholar] [CrossRef]
- Prediction of Dam Leakage Using Machine Learning. Available online: https://repository.dl.itc.u-tokyo.ac.jp/record/54668/files/0057_202007081617.pdf (accessed on 30 December 2022).
- Ferdowsi, A.; Nemati, M.; Farzin, S. Development of Dam-Break Model Considering Real Case Studies with Asym-metric Reservoirs. Comput. Eng. Phys. Model. 2021, 4, 39–63. [Google Scholar] [CrossRef]
Figure 1.
Location of the study site, Bago Region, Myanmar.

Figure 2.
Longitudinal section of Swa Dam’s spillway (before collapse) (IWUMD).

Figure 3.
Reservoir water level and rainfall condition of Swa Dam before the breach event (1–28 August 2018) (record by the IWUMD).
Figure 3.
Reservoir water level and rainfall condition of Swa Dam before the breach event (1–28 August 2018) (record by the IWUMD).

Figure 4.
Collapsed spillway before and after the breach event (Google Earth images).

Figure 5.
The typical cross-section of the collapsed spillway (design by the IWUMD).

Figure 6.
Schematic illustration of the dam breaching parameters (a) Hb, Hw, H, Vw and V in longitudinal view (b) Wavg and Bavg in Front view.
Figure 6.
Schematic illustration of the dam breaching parameters (a) Hb, Hw, H, Vw and V in longitudinal view (b) Wavg and Bavg in Front view.

Figure 7.
Breach dimensions from the topographic survey data (after the event) (IWUMD).

Figure 8.
Spillway breach by (a) Scenario 1: overtopping and (b) Scenario 2: piping.

Figure 9.
Water spread area (a) before (blue) and (b) after (red) the breach of the Swa Dam.

Figure 10.
Observed dam water level and calculated outflow rate from 26 to 30 August 2018.

Figure 11.
The absolute relative errors for the empirical formulas calculated for the average breach width.
Figure 11.
The absolute relative errors for the empirical formulas calculated for the average breach width.

Figure 12.
The absolute relative errors for the empirical formulas calculated for the failure time.

Figure 13.
The absolute relative errors for the empirical formulas calculated for the peak discharge.
Figure 13.
The absolute relative errors for the empirical formulas calculated for the peak discharge.

Figure 14.
Highest overflow depths of the Swa Dam after completion (IWUMD).

Figure 15.
Comparison of peak discharges from Xu and Zhang’s 2009 [26] empirical equation for different dam types and erodibilities.
Figure 15.
Comparison of peak discharges from Xu and Zhang’s 2009 [26] empirical equation for different dam types and erodibilities.

Table 1.
Selected empirical equations for dam types, failure modes and erodibilities.
| Equation Developer | Average Breach Width (m) | Failure Time (h) | Peak Outflow(m3/s) |
|---|---|---|---|
| Bureau of reclamation (1982) [17] | Bavg = 3 Hw | Tf = 0.011 Bavg | Qp = 19.1 (Hw)1.85 |
| MacDonald et al. (1984) [18] | Bavg = Ver/(Wavg Hb) | Tf = 0.0179 Ver0.364 | Qp = 1.154 (VwHw)0.412 |
| Ver = 0.0261(Vw Hw)0.769 | |||
| Pierce et al. (2010) [19] | Qp = 0.863 Vw0.335 Hb1.833 Wavg−0.663 | ||
| Soliman (2015) [20] | Bavg = 48.644 V0.275 Wavg−0.086 | Tf = 0.15 + 1.865 H−0.675 V0.408 | |
| Shahram et al. (2013) [21] | Bavg = 2.2839 Vw0.0635 Hb0.8481 | Qp = 0.06577 g0.5 Vw0.2649 Hw1.7053 | |
| Tegos et al. (2022) [22] | Qp = (H/0.011) 0.706 (Bavg/3.321)0.332 (V/0.048) 0.229 |
Table 2.
Empirical equations of Froehlich and Xu and Zhang.
| Equation Developer | Average Breach Width | Failure Time | Peak Outflow |
|---|---|---|---|
| Froehlich (1995) [23] | Bavg = 0.1803 K0 Vw 0.32 Hb0.19 | Tf = 0.00254 Vw 0.53 Hb−0.9 | Qp = 0.607 × Vw 0.295 Hw1.24 |
| Froehlich (2008) [24] | Bavg = 0.27 K0 Vw 0.32 Hb0.04 | Tf = 63.2 √ Vw/gHb2 | |
| Froehlich (2016) [25] | Bavg = 0.28 Km Kh Vw1/3 Wavg−1/6 Hb1/6 | Tf = 50√Vw/gHb2 Wavg/Hb1/4 | Qp = 0.0175 Km Kh (gVw Hb2 Hw/Wavg)0.5 |
| Xu and Zhang (2009) [26] | Bavg/Hb = 0.787(H/Hr)0.133(Vw 1/3/Hw)0.652 eb3+b4+b5 | Tf/Tr = 0.304(H/Hr)0.707(Vw 1/3/Hw)1.228 eb3+b4+b5 | Qp/√Vw5/3g = 0.175(H/Hr)0.199(Vw1/3/Hw)−1.274 eb3+b4+b5 |
Note(s): The symbols are the same as those in Table 1.
Table 3.
Comparison of calculated results and observed data for Scenarios 1 and 2.
| Investigator | Average Breach Width, Bavg (m) | Failure Time, Tf (h) | Peak Outflow, Qp (m3/s) | |||
|---|---|---|---|---|---|---|
| Scenario 1 | Scenario 2 | Scenario 1 | Scenario 2 | Scenario 1 | Scenario 2 | |
| Bureau of Reclamation (1982) [17] | 66.6 | 0.73 | 5913 | |||
| MacDonald et al. (1984) [18] | 236.7 | 2.61 | 12,436 | |||
| Pierce et al. (2010) [19] | 5406 | |||||
| Soliman (2015) [20] | 145.3 | 2.0 | ||||
| Shahram et al. (2013) [21] | 106.6 | 7009 | ||||
| Tegos et al. (2022) [22] | 6094 | |||||
| Froehlich (1995) [23] | 211.34 | 162.57 | 4.74 | 8767 | ||
| Froehlich (2008) [24] | 214.85 | 153.46 | 4.3 | |||
| Froehlich (2016) [25] | 193.92 | 129.24 | 5.7 | 7988 | 4318 | |
| Xu and Zhang (2009) [26] (concrete-faced, low erodibility) | 135.6 | 79.28 | 15.75 | 15.26 | 6426 | 3239 |
| Xu and Zhang (2009) [26] (concrete-faced, medium erodibility) | 174.3 | 101.89 | 5.02 | 4.86 | 17,242 | 8692 |
| Xu and Zhang (2009) [26] (concrete-faced, high erodibility) | 268.3 | 156.79 | 2.65 | 2.56 | 24,912 | 12,558 |
| Xu and Zhang (2009) [26] (homogeneous earthen, low erodibility) | 105.4 | 61.62 | 25.59 | 24.78 | 6064 | 3057 |
| Xu and Zhang (2009) [26] (homogeneous earthen, medium erodibility) | 135.5 | 79.1 | 8.16 | 7.9 | 16,271 | 8202 |
| Xu and Zhang (2009) [26] (homogeneous earthen, high erodibility) | 208.5 | 121.87 | 4.3 | 4.16 | 23,509 | 11,850 |
| Swa dam | 110.33 | 4.0 | 7642.8 | |||
Disclaimer/Publisher’s Note: The statements, opinions and data contained in all publications are solely those of the individual author(s) and contributor(s) and not of MDPI and/or the editor(s). MDPI and/or the editor(s) disclaim responsibility for any injury to people or property resulting from any ideas, methods, instructions or products referred to in the content. |
© 2023 by the authors. Licensee MDPI, Basel, Switzerland. This article is an open access article distributed under the terms and conditions of the Creative Commons Attribution (CC BY) license (https://creativecommons.org/licenses/by/4.0/).
Share and Cite
MDPI and ACS Style
Kyaw, P.P.S.S.; Uchida, T. Assessment of the Breaching Event, Breach Parameters and Failure Mechanisms of the Spillway Collapse in the Swa Dam, Myanmar. Water 2023, 15, 1513. https://doi.org/10.3390/w15081513
AMA Style
Kyaw PPSS, Uchida T. Assessment of the Breaching Event, Breach Parameters and Failure Mechanisms of the Spillway Collapse in the Swa Dam, Myanmar. Water. 2023; 15(8):1513. https://doi.org/10.3390/w15081513
Chicago/Turabian StyleKyaw, Pa Pa Shwe Sin, and Taro Uchida. 2023. "Assessment of the Breaching Event, Breach Parameters and Failure Mechanisms of the Spillway Collapse in the Swa Dam, Myanmar" Water 15, no. 8: 1513. https://doi.org/10.3390/w15081513
Note that from the first issue of 2016, this journal uses article numbers instead of page numbers. See further details here.