Article

Hydrochemical Assessment of the Kisköre Reservoir (Lake Tisza) and the Impacts of Water Quality on Tourism Development

1
Department of Landscape Protection and Environmental Geography, Institute of Earth Sciences, Faculty of Science and Technology, University of Debrecen, 4032 Debrecen, Hungary
2
Department of Data Science and Visualization, Faculty of Informatics, University of Debrecen, 4023 Debrecen, Hungary
3
Regional Laboratory of the Middle-Tisza District Water Directorate, Tiszaliget 9688/3, 5000 Szolnok, Hungary
*
Author to whom correspondence should be addressed.
Water 2023, 15(8), 1514; https://doi.org/10.3390/w15081514
Submission received: 5 March 2023 / Revised: 5 April 2023 / Accepted: 10 April 2023 / Published: 12 April 2023
(This article belongs to the Special Issue Water Quality Assessment—Methods and Surveys)

Abstract

:
Outdoor recreation has grown rapidly in recent years, with an increasing preference for areas in good ecological condition. Since lakes represent some of the most important wetlands, providing a wide variety of ecosystem services, they have become a very popular destination. The present study aimed to assess the water quality of the largest artificial lake in Hungary (Kisköre Reservoir—Lake Tisza), and the role of ecological status in tourism development. Monthly water sampling from the basins of the lake (Tiszavalk, Poroszló, Sarud and Abádszalók basins) took place from April–November 2021 and in 2022. The majority of samples from the river section and from the lake are classified as Ca2+-HCO3 type or mixed Ca2+-Na+-HCO3 type. According to the results, the water quality of each basin is considered excellent or good. Rapid warming of the shallow water of the basins was detected during the summer months, resulting in different hydrochemical characteristics (pH, NH4-N, NO2-N, NO3-N, PO4-P, CODcr BOI5) compared to the river section. Differences in the plant nutrient and oxygen balance component groups have been revealed with hierarchical and two-step cluster analysis as well. The results demonstrated that the hydrochemical properties of the lake’s water are substantially influenced by the filling of the lake in spring from the River Tisza and the significant lowering (1.2 m) of the water level in the autumn each year, allowing the drainage of stagnant water, the removal of accumulated sediments and the oxidation of organic matter. The number of tourists on Lake Tisza has increased rapidly over the last decade, confirming that a wide range of ecosystem services have a significant attractive impact on waterfront activities and ecotourism.

1. Introduction

Adequate water resources management is crucial for environmental sustainability, social welfare and long-term economic development [1,2,3]. Contamination of the aquatic environment through the loads produced by municipal, industrial, or agricultural activities is a topical concern globally and surface waters are particularly vulnerable to these impacts [4,5,6,7]. The majority of freshwater lakes and wetland areas are affected by the phenomenon of water quality degradation and ecological imbalance due to increasing anthropogenic activities, especially in developing countries [8].
Cultural eutrophication accelerated by human activities is considered one of the most pressing environmental challenges [9,10]. Excess nutrient inputs, especially nitrogen (N) and phosphorus (P) are generally accepted as key factors that accelerate the eutrophication process in freshwater ecosystems [11,12,13,14]. In addition to pollutant sources, climate change-induced droughts in the catchment areas are significantly altering the natural conditions of surface waters [15,16,17]. Intense land use along river catchments has been evidenced to affect nutrient enrichment (N, P) [18,19].
Lakes represent some of the most important ecosystems, providing a wide variety of services, as one of the most important sources of water for human and economic use [20,21]. While certain ecosystem services have direct economic benefits (water supply, water storage, flood protection), others have a predominantly positive impact on the environment [22]. Recent studies have shown that the high biodiversity of aquatic ecosystems is generally positively valued by people and can therefore enhance the recreational value of these areas [23,24]. The recognition of the ecological and economic benefits that natural wetland ecosystems provide to humans has heightened interest in creating new aquatic ecosystems (artificial lakes, reservoirs and wetlands) to support human life [25].
Artificial lakes (reservoirs) are designed to store surface water and are characterized by natural and especially strong artificial (due to lake regulation) driving forces, leading to large and rapidly changing lake water levels, which have a major impact on the whole immediate ecosystem [26,27]. The extreme variations in water levels have a major impact on the biodiversity of the area and the degree of pollution. Adjacent areas may be also influenced by artificial lake regulations [28,29]. The construction of hydropower dams is among the most intensive anthropogenic impacts on river systems [30,31]. Globally, more than 50,000 large dams have been built for water supply, power generation, flood control, infrastructure and other economic benefits.
Outdoor recreation has grown rapidly in recent years. Alongside the rapid development of the tourism sector, environmental problems such as increasing noise, deteriorating air quality, increasing water pollution and loss of biodiversity are becoming increasingly widespread [32,33]. Qu (2007) [34] concluded that changes in the water quality of the Sand Lake in Ningxia province were mainly caused by tourist-related activities such as the use of motor boats, fishing, swimming and direct discharges of liquid and solid wastes. Mosisch and Arthington (1998) [35] found that the recreational use of lakes in Australia has led to hydrocarbon pollution originating from power boating and water skiing activities. Kumar and colleagues (2022) found severely degraded water quality in Dal Lake, due to among others, direct sewage discharges of houseboats and hotels [36].
Among particularly popular recreational activities are waterfront activities such as swimming, bathing, shoreline camping and fishing. Shallow lakes are particularly endangered by these activities [37]. According to Shulz (1981), each individual swimmer or bather contributes an average of 0.094 g P per day to the water body [38]. Nutrient enrichment due to mass tourism was also observed in the case of Lake Balaton in Hungary, when, in the 1980s, the annual number of overnight stays reached 14 million [39]. These cases also highlight that ecological considerations should be taken into account in tourism development.
Environmental hazards from campsites include potential threats to vegetation, soils, water quality and biodiversity [40]. Camping activities often contribute to increased soil erosion in lakeshore areas, resulting in significant nutrient inputs [41]. Pit latrines of frequented campsites have been found to be potential risks of pollution [42]. However, Derlet and Carson (2006) investigated the environmental impacts of backpackers in the Sierra Nevada Wilderness and found coliform bacteria in only 1 of 15 areas rarely visited by backpackers [43].
The aim of the current study is to evaluate the water quality of the largest artificial lake in Hungary, which is under increasing pressure due to tourism development. Despite its artificial nature, the lake has a high natural value, attracting many visitors interested in outdoor recreation. The continuous presence of tent fishing, campsites and wild camping has an increasingly strong impact on the lake. Since only limited recent studies on water quality evaluation and its impacts on ecotourism development of the Kisköre Reservoir (Lake Tisza) are present in the literature [44,45,46], our study could contribute to the existing literature on artificial lake ecosystems.

2. Materials and Methods

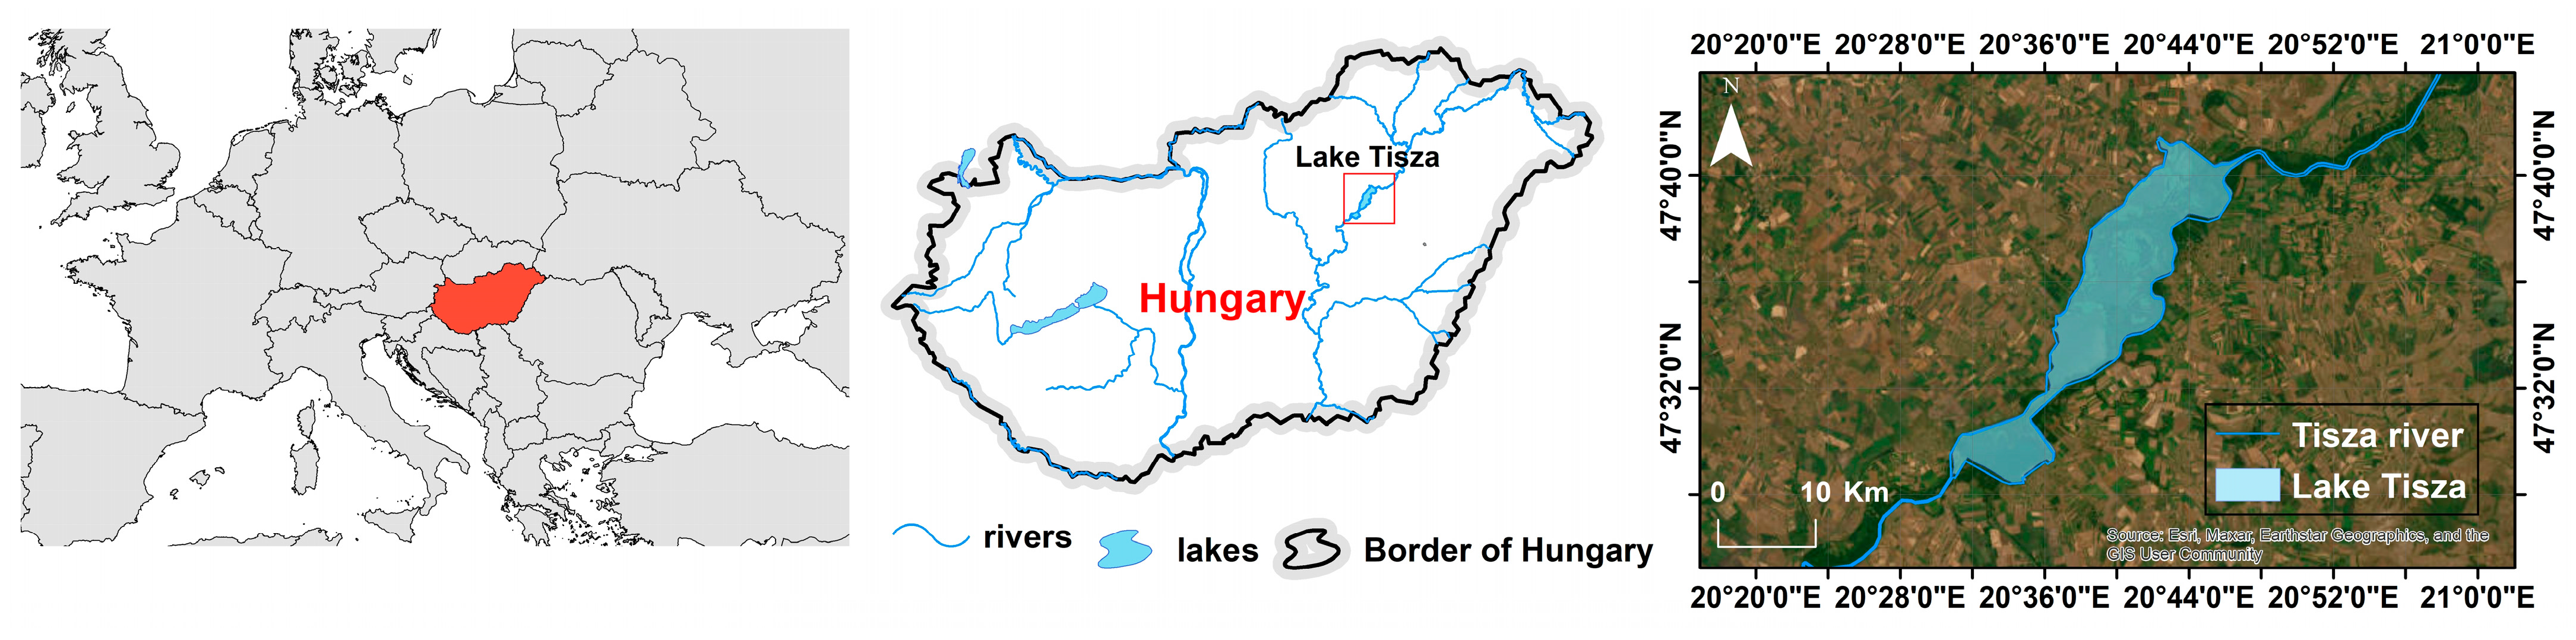
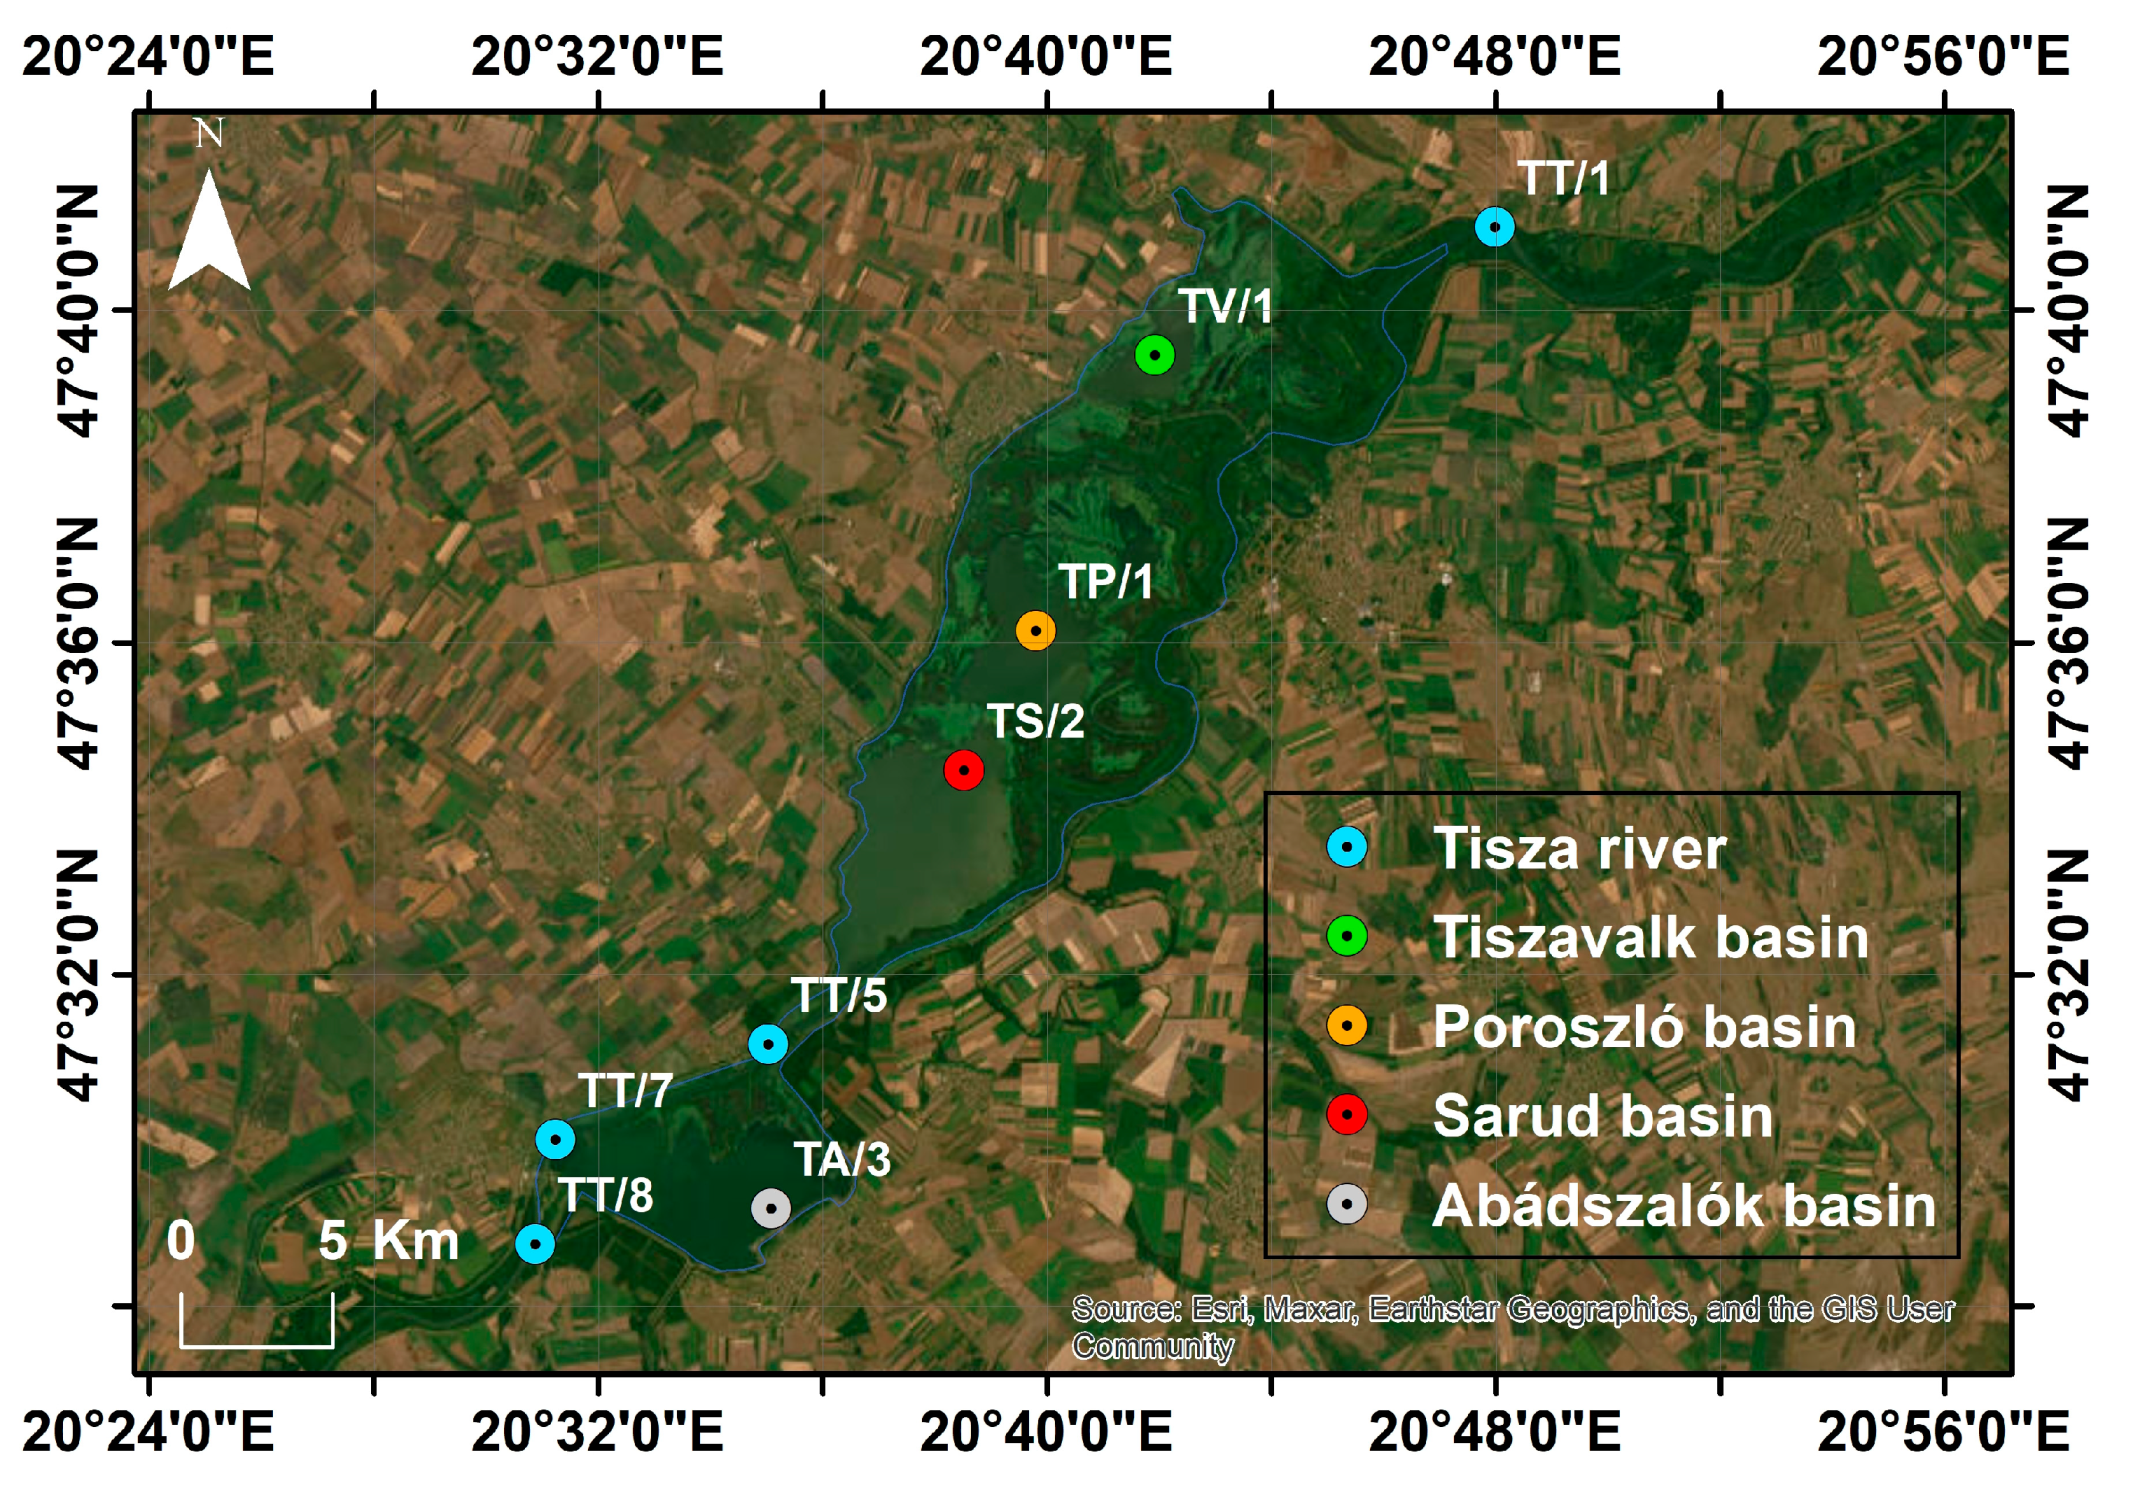
2.1. Description of the Study Area

The investigated artificial lake, the Kisköre Reservoir (geographical name: Lake Tisza) was constructed by the damming of the Tisza River in 1974 [47]. The Reservoir is located in the Middle Tisza region of the Great Hungarian Plain (Figure 1). With its total surface area of 127 km2, it is the second largest, and at 45 years old, the youngest lake in Hungary. The length of the reservoir is 27 km2, while its total volume is 253 million m3 [48].
The artificially created lowland reservoir, which also includes the bed of the Tisza River is bounded by flood protection embankments gradually reinforced since the mid-1800s. In the reservoir area, a varied and rich fauna has gradually developed, with environmental features similar to those of the ancient floodplain landscape of the Tisza. This artificial shallow wetland complex is characterized by mosaic patterns of habitats (large areas of open water, wetlands, oxbows, islands and extended macrophyte coverage), representing a high nature conservation value. The high natural value is also reflected in the fact, that the reservoir belongs to the Ramsar Convention Sites and is listed as a Unesco World Heritage Site.
Its special characteristic is that the water level of the lake is artificially regulated. The reservoir is flooded by the River Tisza every spring, and as a result of this, from March to November 70% of the area is covered by water [49]. The water level is reduced by 1.2 m in November, draining a major part of the area. The summer water level of Lake Tisza is reduced to the winter operating water level for flood protection reasons. Primarily, they protect the dikes and the Kisköre barrage from ice floods. The process allows the drainage of stagnant water, the removal of accumulated sediments, and the oxidation of organic matter. The free water surface with a water depth of more than 30 cm is about 64 km2 from spring to autumn and about 40 km2 in winter. Water circulation, water exchange and human traffic between the river and the basins are provided by flushing channels and natural streams and stages.
The reservoir is divided into 4 basins, which are managed differently: (1) Tiszavalk basin (TV, average water depth: 0.7 m), (2) Poroszló basin (TP, average water depth: 1.3 m), (3) Sarud basin (TS, average water depth: 1.5 m), and (4) Abádszalók basin (TA, average water depth: 2.5 m) [50]. The Tiszavalk basin is a highly protected area with limited permits for boating or fishing, while the Abádszalók basin has low protection and extensive waterfront recreational activity [51]. The Poroszló and Sarud basins are considered moderately protected, with opportunities for fishing, boating and swimming.
Lake Tisza has crucial importance for water management as well as tourism in the region. Its complex use requires very careful ecosystem management, maintaining a balance between nature conservation and recreational activities.
The reservoir and its surroundings are located in the Pannonian biogeographical region 2 [52]. The temperate climate is continental, the area belongs to the warm, dry, moderately hot summer climate zone. It has the most extreme annual temperatures in Hungary (mean temperatures in January: −2–−3 °C, in July: 21.5–22 °C), and this is the driest region of the country (annual precipitation < 550 mm, the wettest month is July: 55–70 mm, driest is January: 24–28 mm). However, according to the data of the Middle Tisza District Water Directorate, climate change will cause a decrease in precipitation in July (27.2 mm in 2022) and an increase in temperatures (more heatwave days). The two years under investigation, but especially 2022, were extremely drought-prone. Extremely low water levels were recorded, with unprecedented summer water levels in the reservoir (Figure 2).

2.2. Water Sampling and Laboratory Measurements

Water sampling from the Kisköre reservoir in accordance with the European Union Water Framework Directive (WFD) was carried out between 2021–2022 by the Middle Tisza District Water Directorate. In this context, comprehensive chemical investigations were carried out in all basins and in the Tisza River basin. In order to determine the water chemical parameters, the currently valid national standard methods and guidelines were used. Measurements were performed in the Laboratory of the Middle Tisza District Water Directorate.
Surface water sampling and chemical analyses were carried out in five areas of the Kisköre reservoir (Tisza basin TT/5, Abádszalók basin TA/3, Sarud basin TS/2, Poroszló basin TP/1, Tiszavalk basin TV/1) at monthly intervals from April to October each year (Figure 3).
Sampling was designed in accordance with MSZ ISO 5667-4:2017, and in all cases, samples were taken from a water boat directly from the top 20 cm of the water body. Temperature, pH, electrical conductivity (EC), dissolved oxygen (DO) content and saturation of the 20 cm surface water layer were measured on-site with HACH® HQ40d Portable pH, Conductivity, Dissolved Oxygen, ORP Multi-Parameter Meter.
Determination of the hydrochemical parameters was performed according to the relevant standards as follows: CODcr according to MSZ 12750-21:1971, BOI5 according to MSZ EN 1899-1:2000 and MSZ EN 1899-2:2000, TOC according to MSZ EN 1484:1998; NH4-N according to ISO 7150-1:1984; NO2-N, NO3-N and total N according to MSZ 448-27:1985; PO4-P according to MSZ 12750-17:1974; total P according to MSZ 260-20:1980; and Cl according to MSZ 1484-15:2009.

2.3. Water Quality Evaluation

The assessment was carried out on the basis of the new, revised water body classification in the River Basin Management Plan III (RBMP III). The relevant section of the Tisza River (across the reservoir) is classified as RW8N (flatland—low gradient—calcareous—moderately fine riverbed material—extremely large catchment area). Lake Tisza has been designated as a heavily modified water body (type LW5: flatland—calcareous or organic—with small, medium or large surface, shallow or very shallow—constantly flooded still water), and the water body parts are hydraulically integrated. The water bodies were categorized by component groups according to the Water Framework Directive (WFD) criteria (Table 1). Water type specific classification by physico-chemical characteristics for lakes and watercourses was performed according to a 5-class system as follows: the specific classification of the water type according to the physico-chemical characteristics supporting the biology for still waters and watercourses is graded in 5 classes (1–2–3–4–5). The classification is based on the annual average of the components, which are then assigned a classification code rank (1–2–3–4–5), taking into account the quality limit for each component (Table 2). The component group code rank is obtained by calculating the average of the code ranks of each physico-chemical characteristic within the group. As an integrated physico-chemical rating, the water body is classified as the worst component group. For the physico-chemical characteristics, there is no difference in whether the water body is classified as natural, heavily modified or artificial.
To compare the chemical faces of the water from different basins, Piper, Durov and Stiff diagrams (created in Grapher 19 software, version 19, Golden, CO, USA) were used [53,54,55]. Piper diagrams are the most widely used charts to represent the concentrations of the major components of water samples [56,57,58]. Statistical analysis (Spearman correlation, hierarchical cluster analysis HCA) of the data set was performed and boxplot diagrams were created using the SPSS 28 software [59]. The Sodium Absorption Ratios (SAR) of the water samples were calculated based on the following equation:
S A R = N a C a + M g 2 .

3. Results

3.1. Ecological Potential Assessment of the Reservoir Based on Physico-Chemical Parameters

The water quality evaluation of the different basins for the years 2021–2022 is presented in Table 3. The acidification status of each basin according to pH was classified as good (rank 2), representing the lowest component category. The salinity, oxygen balance and plant nutrients component groups fall into the excellent category; however, the overall ecological potential rank—due to the pH values—of the basins was determined as good.
High pH values were found in all basins, with upper quartile values above 8.5, indicating the moderate to low category. In the Tiszavalk basin, the highest pH value reached 9.0, which falls into the category of low to worse. The highest COD values were measured in this basin with a maximum of 28 mg/L. Elevated NO3-N and total N values were measured in the Tiszavalk and Sarud basins with a classification result of category 2.
The excellent and good values of the considered parameters can be explained by the fact, that the quality of the water entering the reservoir from the River Tisza is already known due to the sampling point in the upper section (sampling point TT1), so only water of acceptable quality is released into the reservoir. If an event occurs in the upper sections of the river that causes unfavorable water quality conditions, the flushing channels of the Kisköre Reservoir will be closed. In addition, annual draining and refilling with fresh water prevent negative eutrophication processes.
In order to evaluate the differences between the sampling years (2021, 2022) and between the sampling points in the basins and in the relevant section of the River Tisza, boxplot diagrams were created (Figure 4). For all parameters plotted (pH, PO4-P, NH4-N, NO3-N, CODcr and BOI5) significant differences can be found between the sampling points located in the river and located in the different basins of the lake. This is because of the significant amount of organic substance in the reservoir and the fast warming of the shallow water, especially in the Tiszavalk basin where the average water depth is only 0.7 m. This is supported by higher BOI5 and CODcr values in the basins compared to the river. Median CODcr values in the basins exceeded 10 mg/L, while COD values in the river were below 10 mg/L in both years, except for the sampling point TT/5.
However, considerably higher concentrations of NH4-N and NO3-N were measured in the river section compared to the basins. NH4-N concentrations in the basins were around 0.05 mg/L, except in the Abádszalók basin; however, in the river, they exceeded 0.1 mg/L on numerous sampling occasions. In the case of NO3-N, while the median values were typically below 0.2 mg/L, they were measured in the river at around 0.6 mg/L.
The different N content of the basins and the river is due to the filtering effect of the reed beds, and the abundance of aquatic plants, which can take up significant amounts of nitrogen from the water. The Abádszalók basin is the deepest basin and has the largest water surface, therefore the filtration effect of the vegetation is less pronounced there, resulting in higher N concentrations. In addition, this basin is visited by the largest number of tourists, so the high number of bathers may also contribute to the higher concentrations. The higher organic matter content can also be explained by the much higher amount of biomass in the water of the basins, which decomposes more rapidly, especially in shallow water with higher temperatures.
Investigating the fluctuations of inorganic nitrogen forms over time, it can be seen that during the filling period in April, the lake and river values are close to each other, but thereafter a continuous separation is observed, reaching the maximum in autumn (Figure 5). The warming of shallow water of the basins is very significant during the summer months (>26 °C), while in the Poroszló basin, it can approach or exceed 30 °C. The highest total anion value was found in the Tiszavalk basin exceeding 300 mg/L during the summer months in 2021 and 2022. SAR values showed a significant increase due to the extremely dry and hot weather in 2022. While in 2021 the SAR values ranged between 1–1.5, they increased significantly to between 2–2.5 in 2022 (Figure 5).

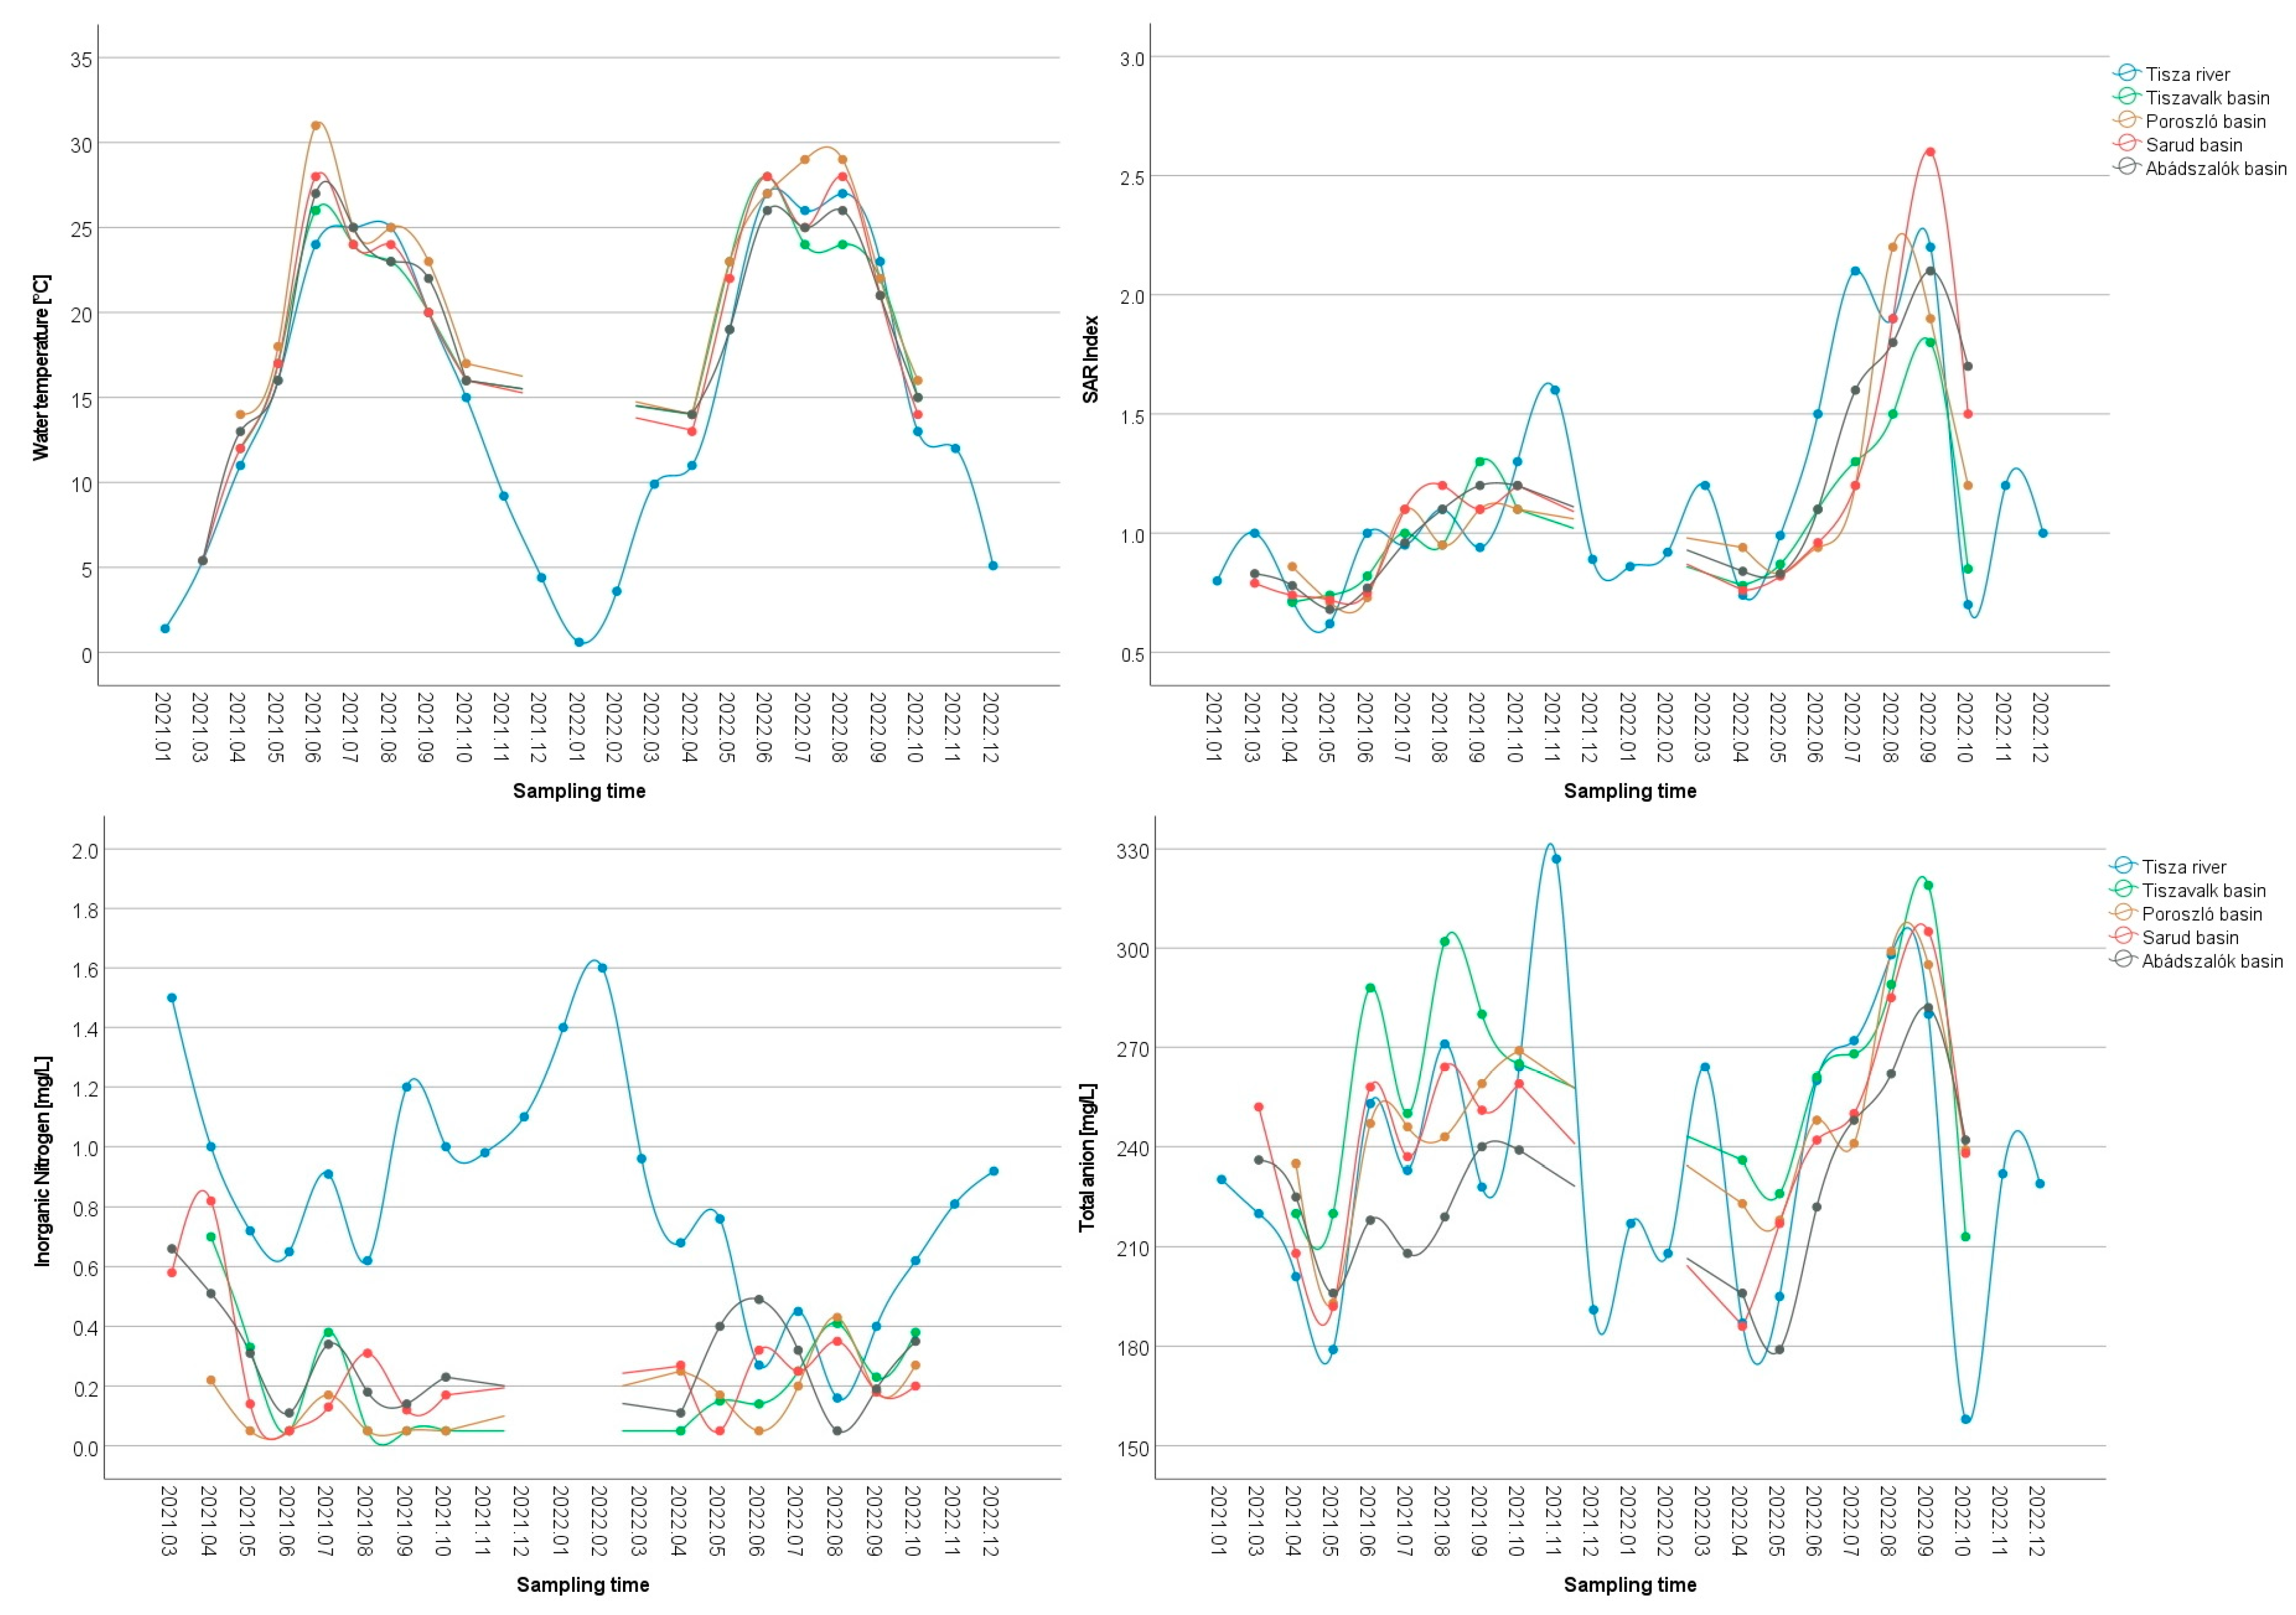
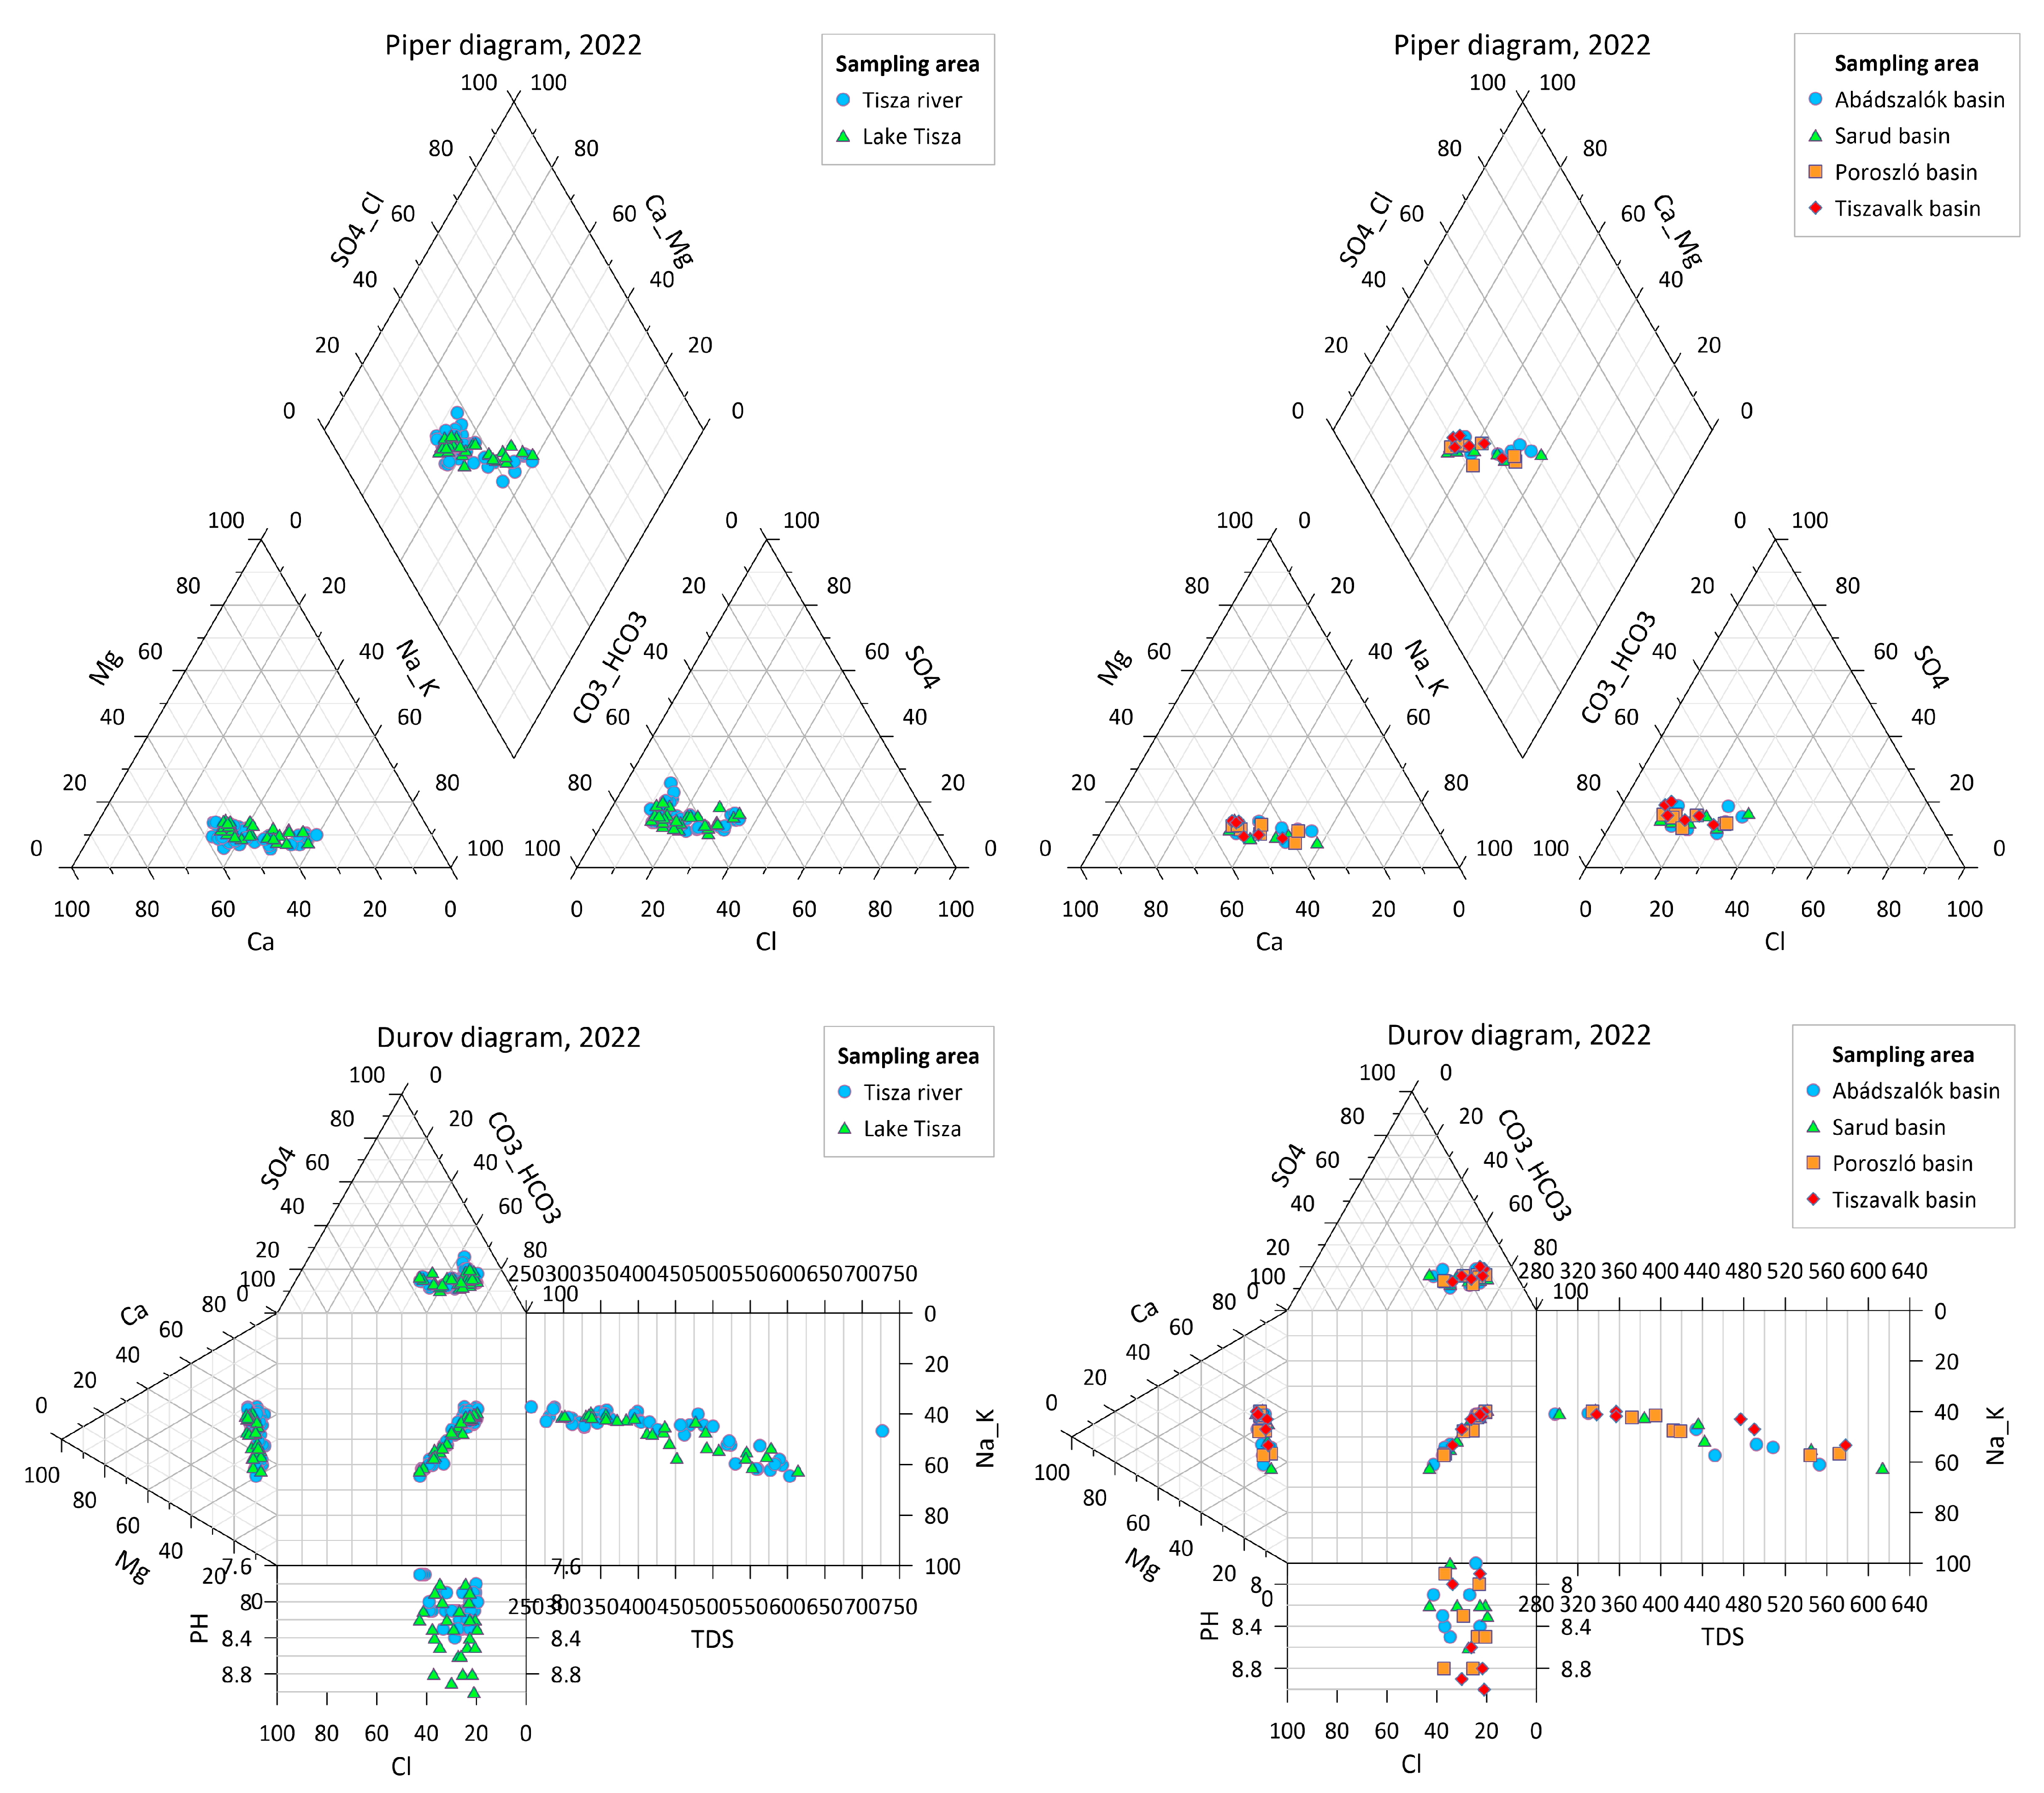
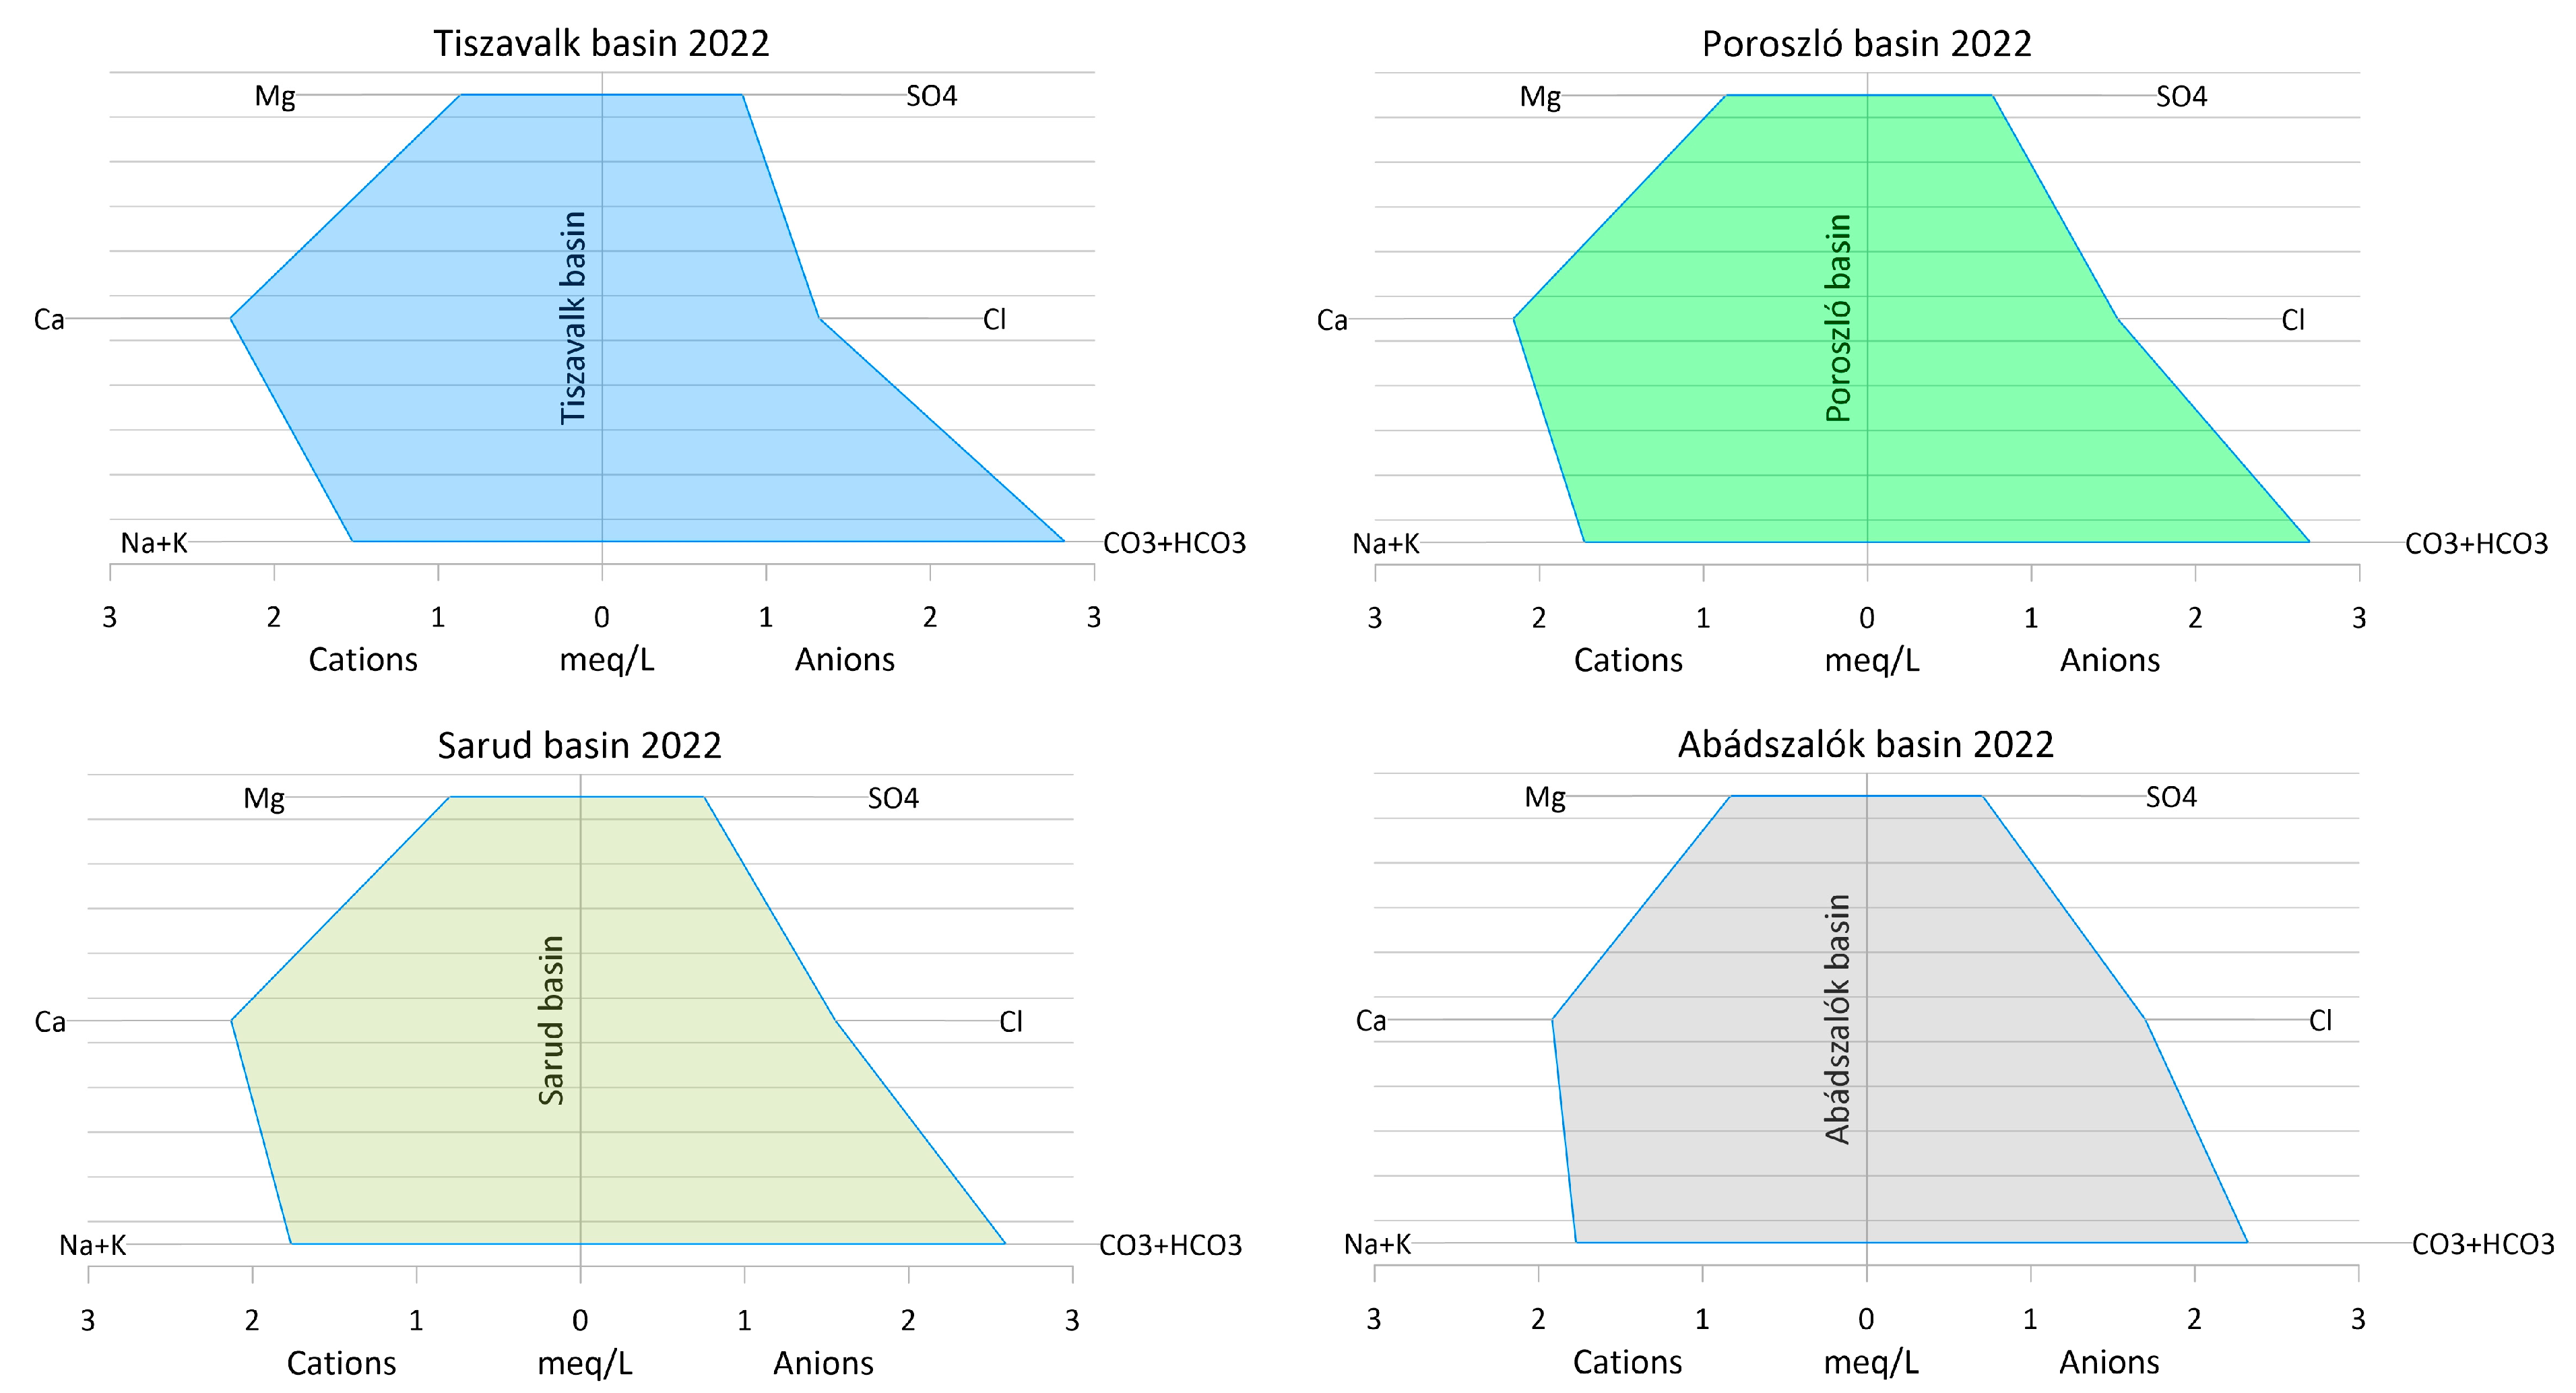
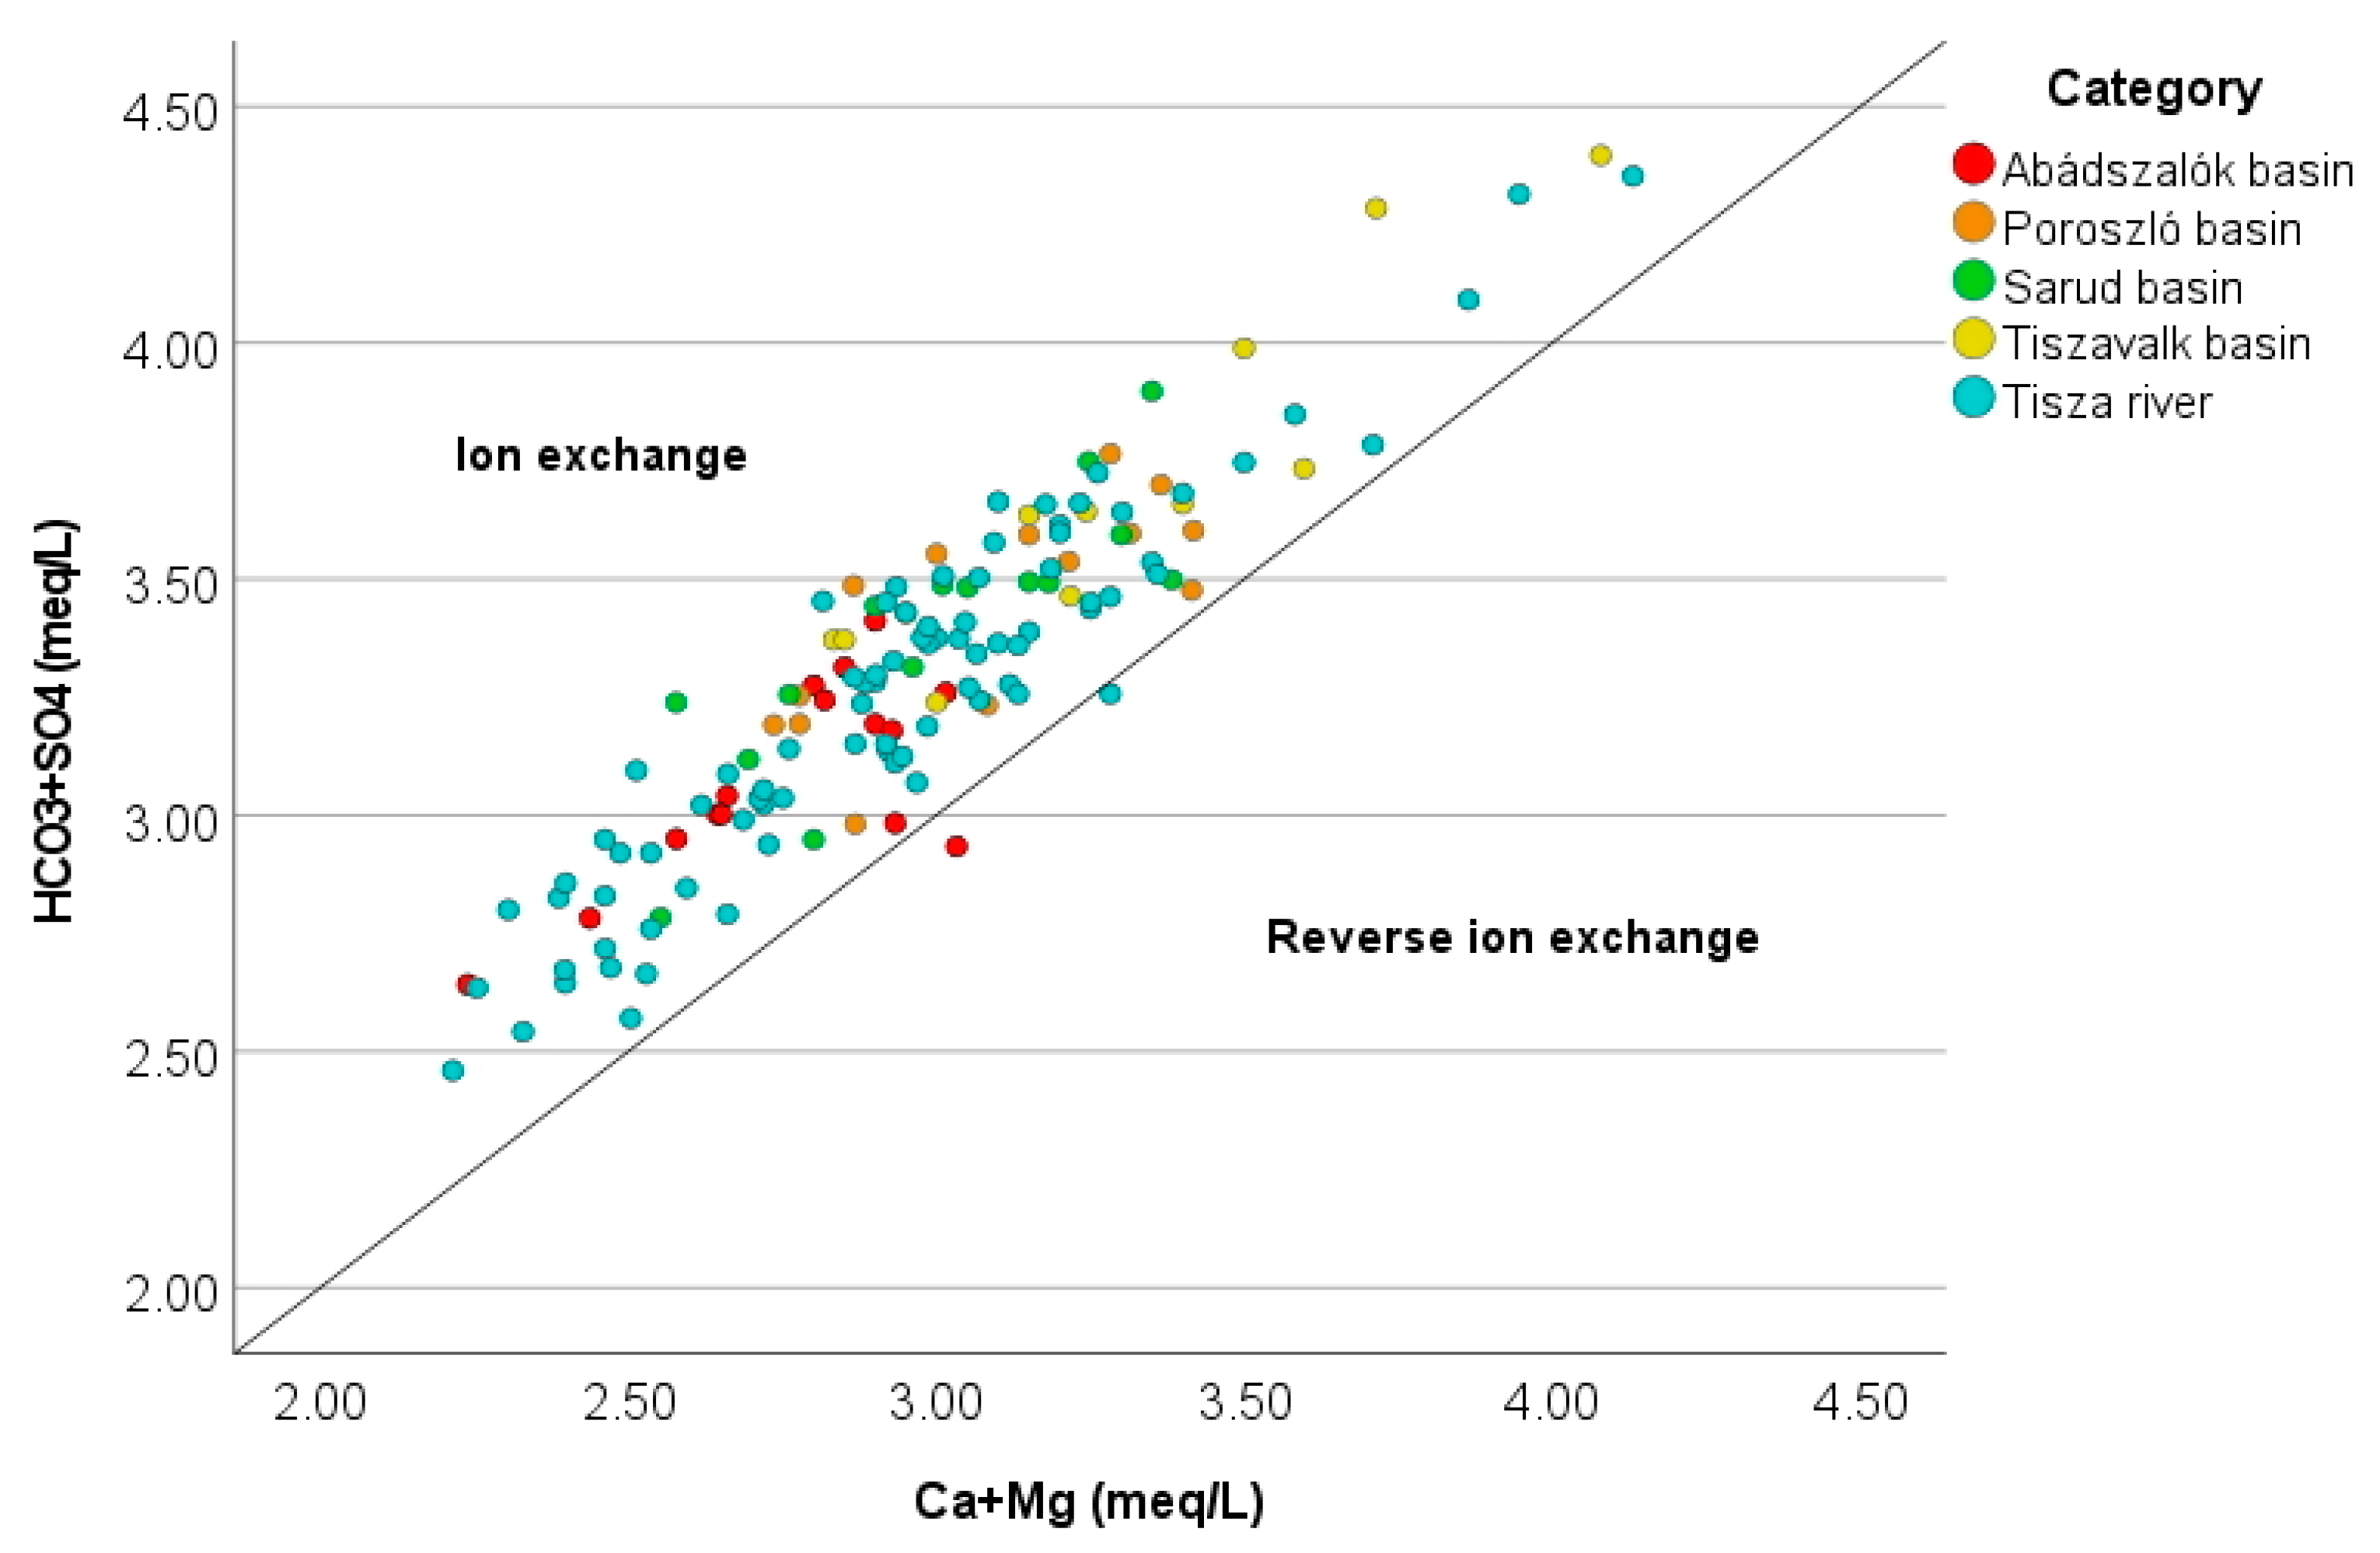
3.2. Evaluation of the Hydrochemical Composition of Lake Tisza

In order to identify the geochemical evolution of the water type of the sampling sites, major cations and anions (Ca2+, Mg2+, Na+, K+, Cl, SO42−, CO32−, HCO3) were plotted on Piper, Durov and Stiff diagrams for the year 2022 (Figure 6 and Figure 7). The samples were first divided into two groups, samples from the river section and samples from the lake. Samples from the lake were then divided by basin (Tiszavalk, Poroszló, Sarud and Abádszalók basins).
According to the Piper diagram, for cations, the majority of the samples are classified as a Ca2+ and Na+ type, while in the case of anions the HCO3 type was determined (Figure 6). Most of the samples from the river section and from the lake are classified as the Ca2+-HCO3 type, while 20% of them are considered the mixed Ca2+-Na+-HCO3 type. Since the water in the lake is derived from the river, no significant separation was detected. No significant differences were found between the four basins, although it can be seen that the Tiszavalk basin has a higher Ca2+ value, while Na+ is more dominant in the Sarud and Abádszalók basins.
According to the Stiff diagrams created for each basin, the abundance of major cations follows the order Ca2+ > Na+ + K+ > Mg2+, while the order of major anions is CO32− + HCO3 > Cl > SO42− (Figure 7).
The scatter diagram of Ca2+ + Mg2+ vs. HCO3 + SO42− is used to determine dominant silicate or carbonate weathering processes. Primary rock-forming minerals may be silicates and carbonates. The dots above the 1:1 equiline indicate that the dominant process is the ion exchange, dots below the 1:1 equiline suggest reverse ion exchange, whereas samples that plot along the equiline suggest weathering of both carbonates and silicates [60]. Figure 8 shows that almost all of the samples fall above the 1:1 equiline, meaning that the concentrations of Ca2+ + Mg2+ are slightly deficient in relation to the anions (HCO3 + SO42−). As the dominant cation, Ca2+ is more preferable to Mg2+, it can be assumed, that the deficiency of Ca2+ is due to ion exchange processes resulting from silicate weathering [57].

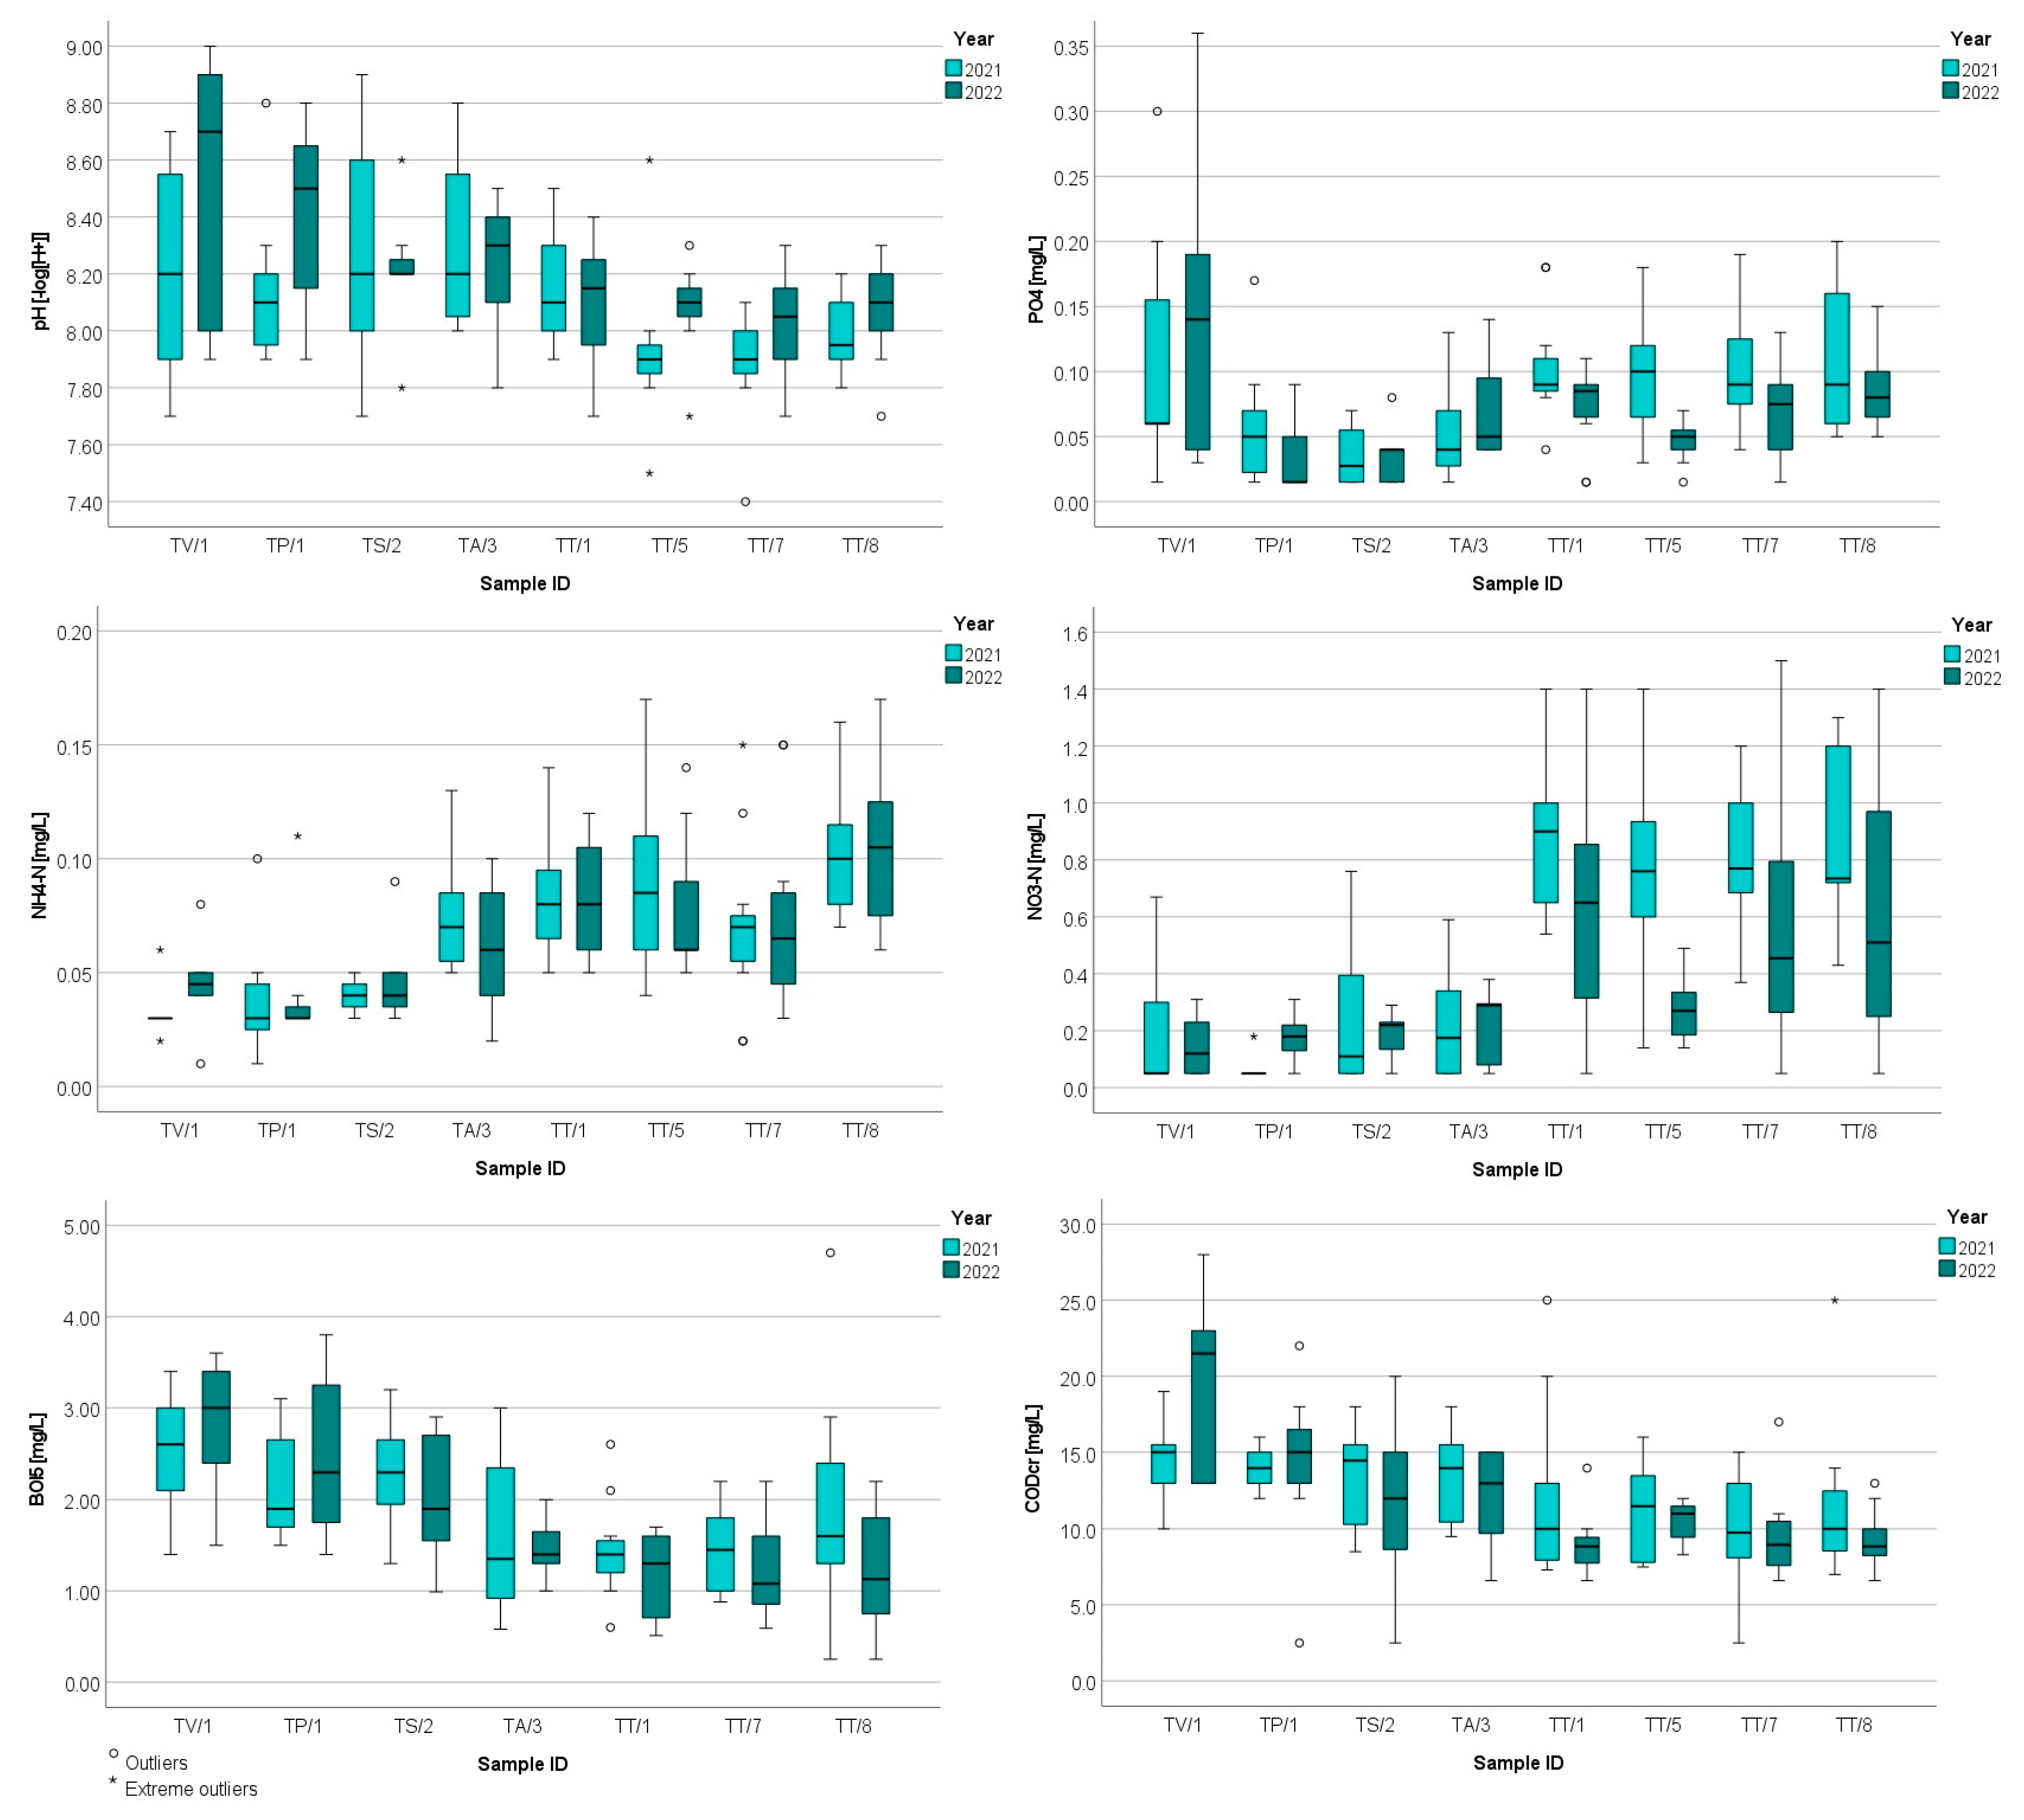
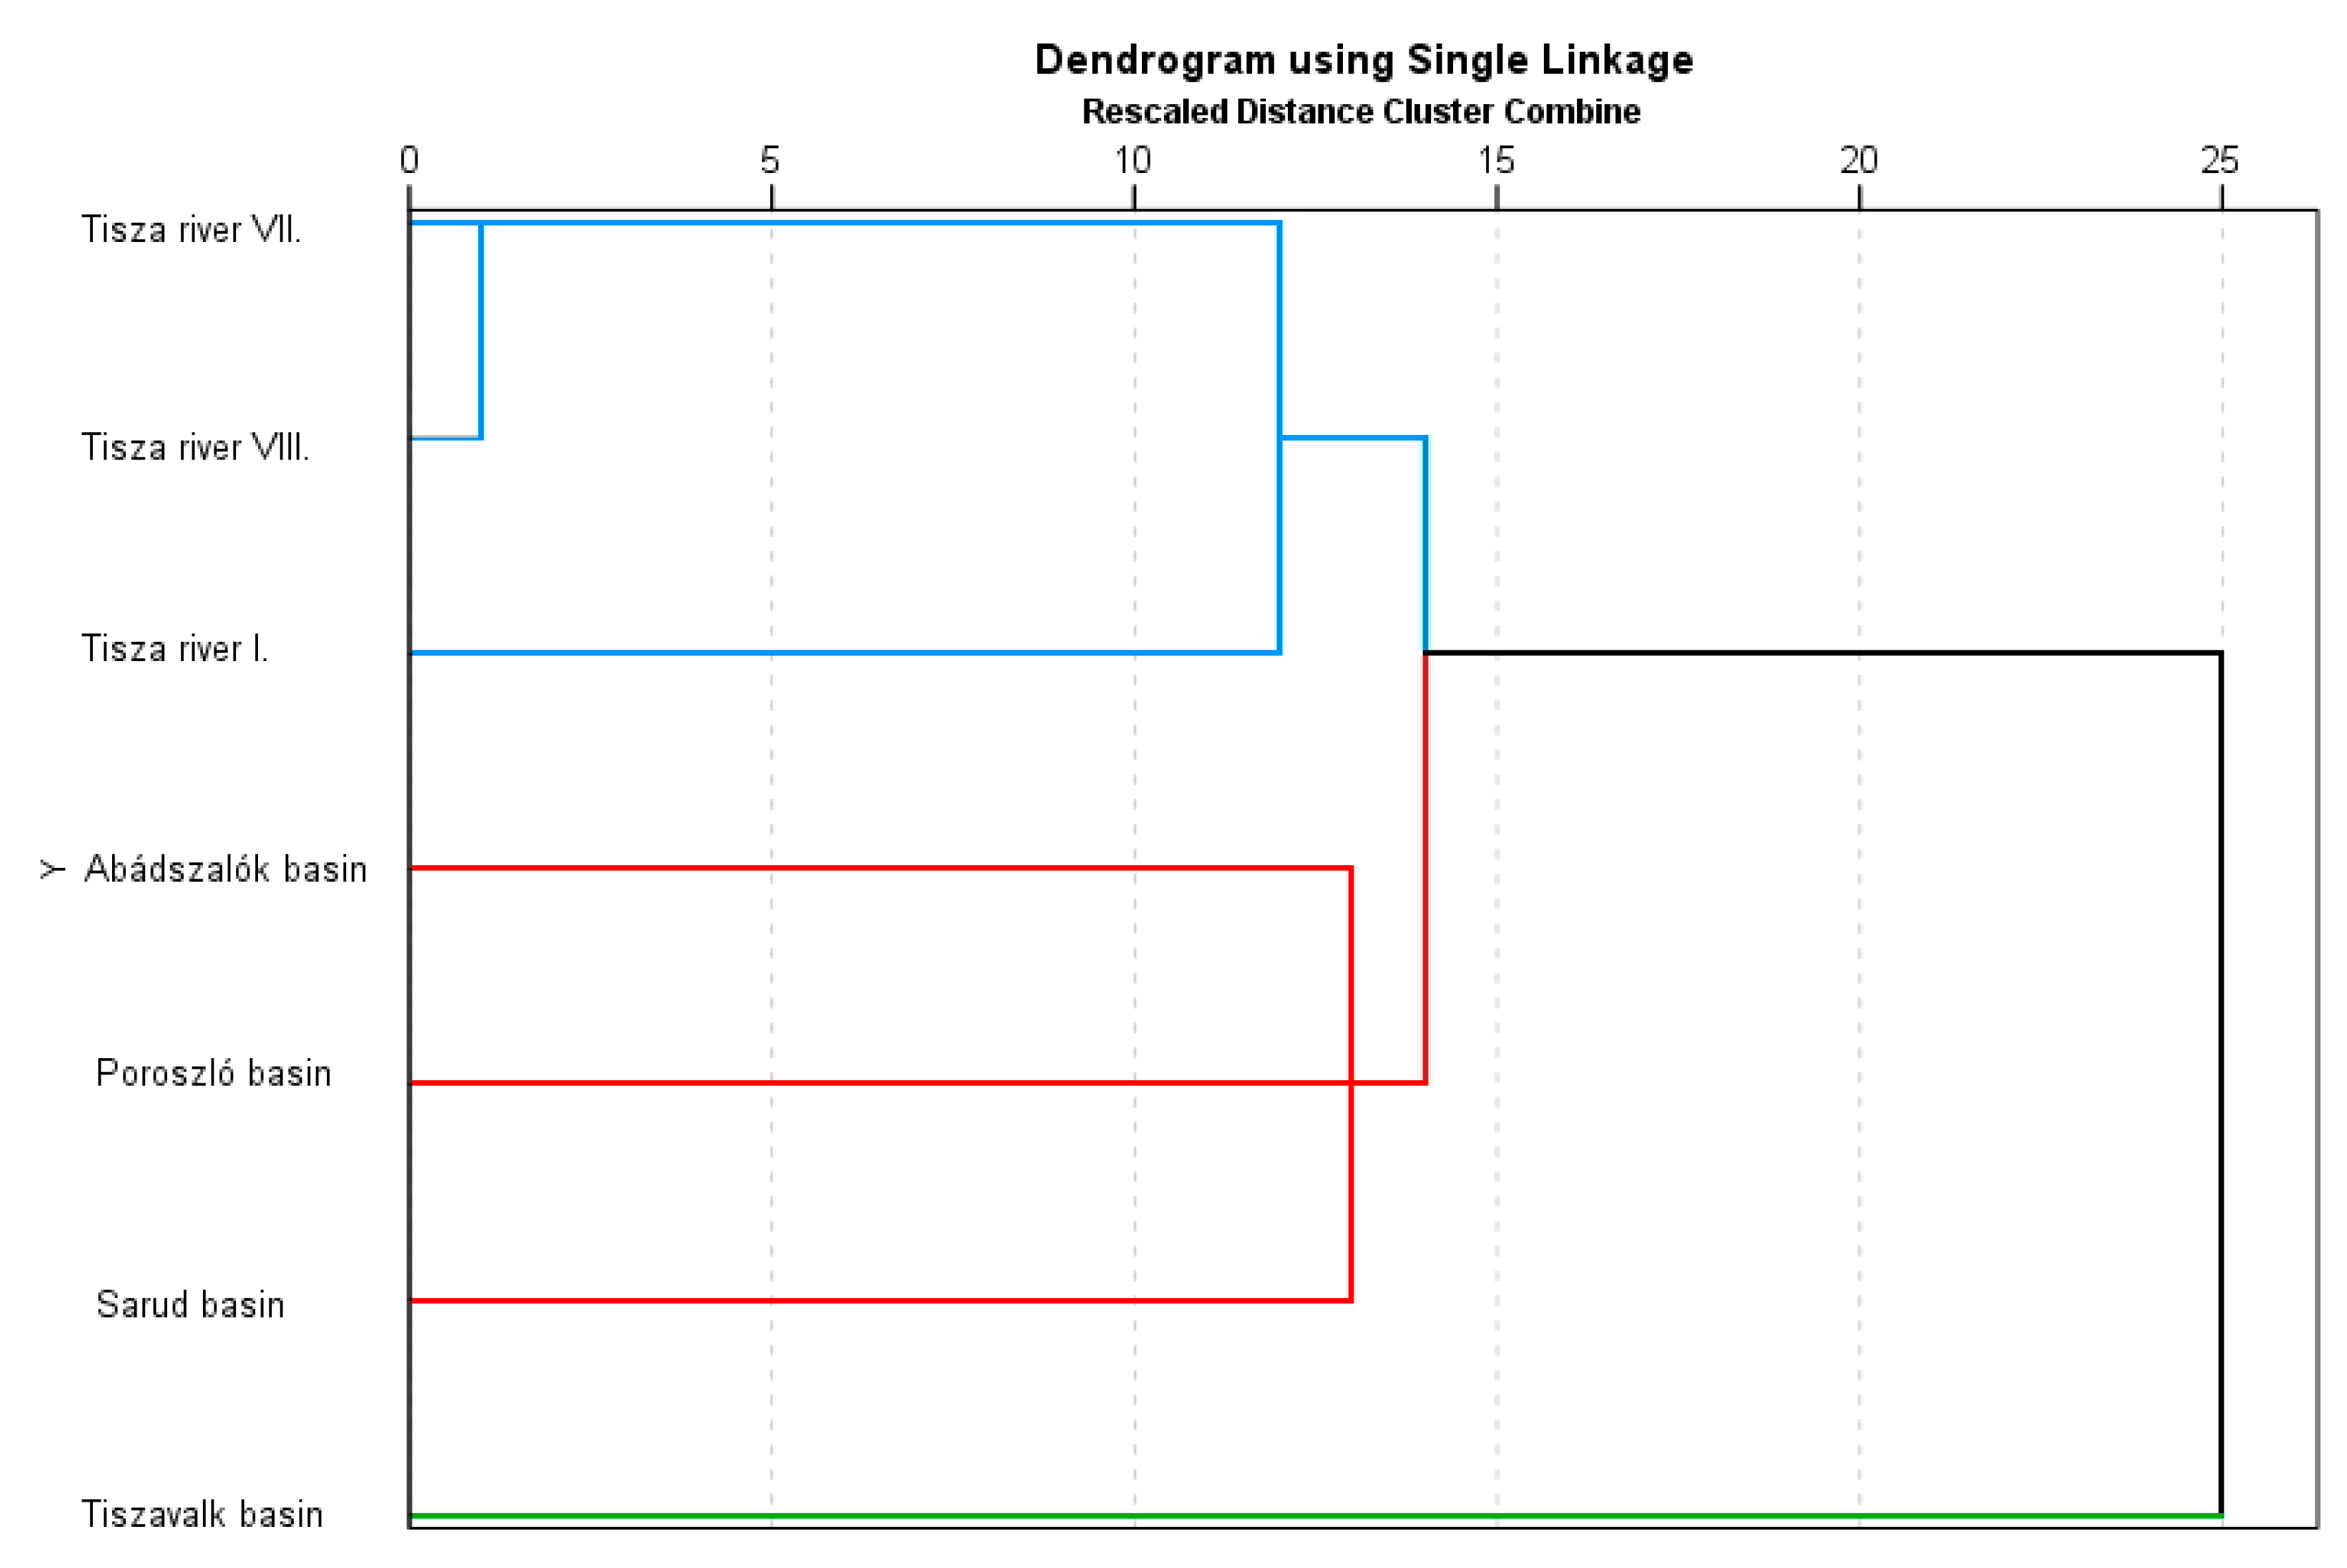
3.3. Statistical Analysis of the Water Samples Collected between 2021 and 2022

Correlation calculations for the investigated hydrochemical parameters were conducted using SPSS 28 software. Table 4 summarizes the Spearman correlation coefficients for the components. The strongest significant (p < 0.001) positive correlation was determined between Na+/Cl (r = 0.982), Na+/EC (r = 0.884), HCO3/Ca2+ (r = 0.828), and K+/Cl (r = 0.707), while a moderate negative correlation was detected between NH4+/pH (r = −0.407), NH4+/CO32− (r = −0.361), and NO3/HCO3 (r = −0.348).
To evaluate the spatial separability of the water samples originating from different locations (river section, basins of the lake), hierarchical cluster analysis was performed. To calculate the similarity between the variables, the nearest neighbor cluster method was used. The results are presented in a form of a dendrogram (Figure 9). Because of the continuous refilling and drainage of the basin, it is not possible to separate the basins from the river based on the data from the spring. However, the different circulation, evaporation and biological processes in the river and in the basins make a considerable difference for the summer period. On this basis, HCA was able to separate three distinct clusters. Samples from the Tisza River section were clearly separated from the basins. The Tiszavalk basin, with the lowest water level and the highest environmental protection measures, was markedly separated from the other three basins.
A two-step cluster analysis was conducted to classify groups based on the given parameters and to identify the weight of each variable in the clustering process. Two groups were identified, comprising 41.5% and 58.5% of the samples (Figure 10). The larger group (2) consists of 92% of samples from the river section, while in the first group, 79% of the samples are of lake water origin. These results also confirm that, although the lake receives its water from the River Tisza, different biological processes during the year result in the lake and the river having distinct features. The most important contributors to the group composition consisted of the inorganic nitrogen forms, NO3, NH4+, NO2. The first group had an average NO3 value of 0.73 mg/L, while the value of the second group was 2.94 mg/L. The mean values of NH4+ were 0.05 mg/L in the first and 0.11 mg/L in the second group, respectively. The mean value of the least important factor (EC) was almost equal to the values of 420 μS/cm (Group 1) and 422 μS/cm (Group 2).

3.4. The Impact of Favorable Ecological Status on Tourism Development

Since the favorable status of the water quality and habitats are essential for the different types of outdoor and waterfront activities such as fishing, swimming, bathing, and water sports, as well as for bicycle tourism and ecotourism, sustainable management of the lake is a priority of national interest. The Kisköre reservoir is an excellent example of the way in which a human-created lake can become a complex system of habitats with significant environmental value. It was demonstrated in the previous parts of the study how the annual exchange of water contributes to the maintenance of the good condition of the lake ecosystem and good water quality, which has contributed greatly to the increase in tourism over the last decade. The number of tourists on Lake Tisza increased from 29,000 in 2000 to 135,000 in 2019. The number of bicycle tourists passing through the Kisköre Dam has risen from 12,167 in 2009 to 68,003 in 2022.
The importance of the lake is also highlighted by the fact that during the COVID-19 pandemic, the number of outdoor activities increased rapidly, the number of bicycle tourists reached 70,435 in 2020 and reached its peak of 87,920 in the counting period in 2021, when strict epidemiological measures were still in place. The public’s demand for waterfront recreation is also shown by the fact that the number of fishing tickets sold in 2020 was 30% higher than in the previous year (130,000). These trends confirm that Lake Tisza is an increasingly popular destination for outdoor activities and ecotourism.

4. Conclusions

The present study aimed to assess the water quality of the largest artificial lake in Hungary (Kisköre Reservoir—Lake Tisza), with special regard to the hydrochemical properties. The special characteristic of the lake is that the water level is artificially regulated. The reservoir is filled by the water of the River Tisza every spring, while the water level is reduced by 1.2 m, draining a major part of the area in the autumn. This process substantially affects the water quality characteristics of the lake. The majority of samples from the river section and from the lake are classified as Ca2+-HCO3 type or mixed Ca2+-Na+-HCO3 type. Since the water in the lake is derived from the river, no significant separation was detected. According to the ecological potential assessment results, all component groups of each basin (Tiszavalk, Poroszló, Sarud and Abádszalók basins) were classified as excellent or good. Due to high pH values, the overall evaluation of the basins water quality was good. This favorable situation is due to the fact that the annual filling allows for a constant supply of good quality river water and prevents eutrophication processes typical of shallow waters. The good ecological condition of the lake has enabled it to become one of the most popular recreational areas in Hungary, with a steadily increasing number of visitors, causing increasing anthropogenic loads, although the yearly water change moderates their impact significantly. The temperature measurements demonstrated the rapid warming of the shallow water of the basins during the summer months, resulting in different hydrochemical characteristics compared to the river section. Differences in the plant nutrient and oxygen balance component groups have been revealed with hierarchical and two-step cluster analysis indicating distinct features of the basins. In addition to the good water quality status of the lake, a long-term assessment and a more detailed study of the water quality of the basins are needed in the future.
It was revealed that the annual exchange of water supports the maintenance of the lake ecosystem and good water quality, which contributes highly to the significant increase in ecotourism and sustainable tourism activities over the past two decades. The trends in the number of fishers and bicycle tourists during the pandemic confirm that Lake Tisza is an increasingly popular destination for outdoor activities and ecotourism. Therefore, in order to ensure good water quality, a strong emphasis should be placed on visitor management in water-related tourism activities.

Author Contributions

Conceptualization. T.M., G.S.; methodology. T.M., E.C. and M.V.; software. T.M., D.B.; validation. A.B., E.K. and I.F.; formal analysis. T.M., A.B.; investigation. B.B., E.C. and G.S.; resources. T.M., P.C. and G.S.; data curation. E.C., B.B., M.V. and G.S.; writing—original draft preparation. T.M., G.S. and M.V.; writing—review and editing. T.M., G.S., E.K. and P.C.; visualization. T.M. and D.B.; supervision. T.M., G.S. All authors have read and agreed to the published version of the manuscript.

Funding

Project no. TKP2021-NKTA-32 has been implemented with the support provided by the National Research, Development and Innovation Fund of Hungary, financed under the TKP2021-NKTA funding scheme.

Data Availability Statement

Not applicable.

Acknowledgments

We acknowledge the assistance provided by the Middle Tisza District Water Directorate in providing the results of laboratory measurements.

Conflicts of Interest

The authors declare no conflict of interest.

References

  1. Carstens, D.; Amer, R. Spatio-Temporal Analysis of Urban Changes and Surface Water Quality. J. Hydrol. 2019, 569, 720–734. [Google Scholar] [CrossRef]
  2. Östlund, C.; Flink, P.; Strömbeck, N.; Pierson, D.; Lindell, T. Mapping of the Water Quality of Lake Erken, Sweden, from Imaging Spectrometry and Landsat Thematic Mapper. Sci. Total Environ. 2001, 268, 139–154. [Google Scholar] [CrossRef] [PubMed]
  3. Pande, C.B.; Moharir, K.N.; Singh, S.K.; Elbeltagi, A.; Pham, Q.B.; Panneerselvam, B.; Varade, A.M.; Kouadri, S. Groundwater Flow Modeling in the Basaltic Hard Rock Area of Maharashtra, India. Appl. Water Sci. 2021, 12, 12. [Google Scholar] [CrossRef]
  4. Kumar, V.; Parihar, R.D.; Sharma, A.; Bakshi, P.; Singh Sidhu, G.P.; Bali, A.S.; Karaouzas, I.; Bhardwaj, R.; Thukral, A.K.; Gyasi-Agyei, Y.; et al. Global Evaluation of Heavy Metal Content in Surface Water Bodies: A Meta-Analysis Using Heavy Metal Pollution Indices and Multivariate Statistical Analyses. Chemosphere 2019, 236, 124364. [Google Scholar] [CrossRef]
  5. Kim, H.-S.; Ko, J.-M.; Hwang, S.-J. Evaluation of Water Quality Variation and Sediment of a Shallow Artificial Lake (Lake llgam) in Located the Metropolitan Area. Korean J. Ecol. Environ. 2003, 36, 161–171. [Google Scholar]
  6. Hong, T.T.K.; Giao, N.T. Analysis of Surface Water Quality in Upstream Province of Vietnamese Mekong Delta Using Multivariate Statistics. Water 2022, 14, 1975. [Google Scholar] [CrossRef]
  7. Panneerselvam, B.; Ravichandran, N.; Kaliyappan, S.P.; Karuppannan, S.; Bidorn, B. Quality and Health Risk Assessment of Groundwater for Drinking and Irrigation Purpose in Semi-Arid Region of India Using Entropy Water Quality and Statistical Techniques. Water 2023, 15, 601. [Google Scholar] [CrossRef]
  8. Bhagowati, B.; Ahamad, K.U. A Review on Lake Eutrophication Dynamics and Recent Developments in Lake Modeling. Ecohydrol. Hydrobiol. 2019, 19, 155–166. [Google Scholar] [CrossRef]
  9. Li-kun, Y.; Sen, P.; Xin-hua, Z.; Xia, L. Development of a Two-Dimensional Eutrophication Model in an Urban Lake (China) and the Application of Uncertainty Analysis. Ecol. Model. 2017, 345, 63–74. [Google Scholar] [CrossRef]
  10. Adhurya, S.; Das, S.; Ray, S. Nitrogen and Phosphorous Loading by Aquatic Avifauna in a Shallow Eutrophic Freshwater Lake. Energ. Ecol. Environ. 2022, 7, 111–129. [Google Scholar] [CrossRef]
  11. Gurkan, Z.; Zhang, J.; Jørgensen, S.E. Development of a Structurally Dynamic Model for Forecasting the Effects of Restoration of Lake Fure, Denmark. Ecol. Model. 2006, 197, 89–102. [Google Scholar] [CrossRef]
  12. Wang, J.; Fu, Z.; Qiao, H.; Liu, F. Assessment of Eutrophication and Water Quality in the Estuarine Area of Lake Wuli, Lake Taihu, China. Sci. Total Environ. 2019, 650, 1392–1402. [Google Scholar] [CrossRef]
  13. Heredia, C.; Guédron, S.; Point, D.; Perrot, V.; Campillo, S.; Verin, C.; Espinoza, M.E.; Fernandez, P.; Duwig, C.; Achá, D. Anthropogenic Eutrophication of Lake Titicaca (Bolivia) Revealed by Carbon and Nitrogen Stable Isotopes Fingerprinting. Sci. Total Environ. 2022, 845, 157286. [Google Scholar] [CrossRef]
  14. Kincaid, D.W.; Adair, E.C.; Joung, D.; Stockwell, J.D.; Schroth, A.W. Ice Cover and Thaw Events Influence Nitrogen Partitioning and Concentration in Two Shallow Eutrophic Lakes. Biogeochemistry 2022, 157, 15–29. [Google Scholar] [CrossRef]
  15. Woolway, R.I.; Kraemer, B.M.; Lenters, J.D.; Merchant, C.J.; O’Reilly, C.M.; Sharma, S. Global Lake Responses to Climate Change. Nat. Rev. Earth Environ. 2020, 1, 388–403. [Google Scholar] [CrossRef]
  16. Komatsu, E.; Fukushima, T.; Harasawa, H. A Modeling Approach to Forecast the Effect of Long-Term Climate Change on Lake Water Quality. Ecol. Model. 2007, 209, 351–366. [Google Scholar] [CrossRef]
  17. Golub, M.; Thiery, W.; Marcé, R.; Pierson, D.; Vanderkelen, I.; Mercado-Bettin, D.; Woolway, R.I.; Grant, L.; Jennings, E.; Kraemer, B.M.; et al. A Framework for Ensemble Modelling of Climate Change Impacts on Lakes Worldwide: The ISIMIP Lake Sector. Geosci. Model Dev. 2022, 15, 4597–4623. [Google Scholar] [CrossRef]
  18. Savic, R.; Stajic, M.; Blagojević, B.; Bezdan, A.; Vranesevic, M.; Nikolić Jokanović, V.; Baumgertel, A.; Bubalo Kovačić, M.; Horvatinec, J.; Ondrasek, G. Nitrogen and Phosphorus Concentrations and Their Ratios as Indicators of Water Quality and Eutrophication of the Hydro-System Danube–Tisza–Danube. Agriculture 2022, 12, 935. [Google Scholar] [CrossRef]
  19. Lawniczak-Malińska, A.; Nowak, B.; Pajewski, K. Agricultural Pressures on the Quality of Ground and Surface Waters in Catchments of Artificial Reservoirs. Water 2023, 15, 661. [Google Scholar] [CrossRef]
  20. Halkos, G.; Matsiori, S. Assessing the Economic Value of Protecting Artificial Lakes. Available online: https://mpra.ub.uni-muenchen.de/39557/1/MPRA_paper_39557.pdf (accessed on 2 March 2023).
  21. Reynaud, A.; Lanzanova, D. A Global Meta-Analysis of the Value of Ecosystem Services Provided by Lakes. Ecol. Econ. 2017, 137, 184–194. [Google Scholar] [CrossRef]
  22. Turner, R.K.; van den Bergh, J.C.J.M.; Söderqvist, T.; Barendregt, A.; van der Straaten, J.; Maltby, E.; van Ierland, E.C. Ecological-Economic Analysis of Wetlands: Scientific Integration for Management and Policy. Ecol. Econ. 2000, 35, 7–23. [Google Scholar] [CrossRef]
  23. Meyerhoff, J.; Klefoth, T.; Arlinghaus, R. The Value Artificial Lake Ecosystems Provide to Recreational Anglers: Implications for Management of Biodiversity and Outdoor Recreation. J. Environ. Manag. 2019, 252, 109580. [Google Scholar] [CrossRef] [PubMed]
  24. Nijkamp, P.; Vindigni, G.; Nunes, P.A.L.D. Economic Valuation of Biodiversity: A Comparative Study. Ecol. Econ. 2008, 67, 217–231. [Google Scholar] [CrossRef]
  25. Hammer, D.A.; Bastian, R.K. Wetlands Ecosystems: Natural Water Purifiers? In Constructed Wetlands for Wastewater Treatment; CRC Press: Boca Raton, FL, USA, 1989; ISBN 978-1-00-306985-0. [Google Scholar]
  26. El-Zehairy, A.A.; Lubczynski, M.W.; Gurwin, J. Interactions of Artificial Lakes with Groundwater Applying an Integrated MODFLOW Solution. Hydrogeol. J. 2018, 26, 109–132. [Google Scholar] [CrossRef] [Green Version]
  27. El Gammal, E.A.; Salem, S.M.; El Gammal, A.E.A. Change Detection Studies on the World’s Biggest Artificial Lake (Lake Nasser, Egypt). Egypt. J. Remote Sens. Space Sci. 2010, 13, 89–99. [Google Scholar] [CrossRef] [Green Version]
  28. Wildi, W. Environmental Hazards of Dams and Reservoirs. NEAR Curric. Nat. Environ. Sci. 2010, 2, 187–197. Available online: https://www.semanticscholar.org/paper/Environmental-hazards-of-dams-and-reservoirs-Wildi/4731514a2648e74c44001d66c664526717940d87 (accessed on 2 March 2023).
  29. Gao, L.; Gao, B.; Xu, D.; Peng, W.; Lu, J. Multiple Assessments of Trace Metals in Sediments and Their Response to the Water Level Fluctuation in the Three Gorges Reservoir, China. Sci. Total Environ. 2019, 648, 197–205. [Google Scholar] [CrossRef]
  30. Li, Q.; Yu, M.; Lu, G.; Cai, T.; Bai, X.; Xia, Z. Impacts of the Gezhouba and Three Gorges Reservoirs on the Sediment Regime in the Yangtze River, China. J. Hydrol. 2011, 403, 224–233. [Google Scholar] [CrossRef]
  31. Wang, C.; Fang, F.; Yuan, Z.; Zhang, R.; Zhang, W.; Guo, J. Spatial Variations of Soil Phosphorus Forms and the Risks of Phosphorus Release in the Water-Level Fluctuation Zone in a Tributary of the Three Gorges Reservoir. Sci. Total Environ. 2020, 699, 134124. [Google Scholar] [CrossRef]
  32. Lee, L.-H.; Lee, Y.-D. The Impact of Water Quality on the Visual and Olfactory Satisfaction of Tourists. Ocean Coast. Manag. 2015, 105, 92–99. [Google Scholar] [CrossRef]
  33. Zhong, L.; Deng, J.; Song, Z.; Ding, P. Research on Environmental Impacts of Tourism in China: Progress and Prospect. J. Environ. Manag. 2011, 92, 2972–2983. [Google Scholar] [CrossRef]
  34. Qu, X. Effect of Tourism Development on Water Environment of Sand Lake in Ningxia. J. Arid. Land Resour. Environ. 2007, 21, 105–108. [Google Scholar]
  35. Mosisch, T.D.; Arthington, A.H. The Impacts of Power Boating and Water Skiing on Lakes and Reservoirs. Lakes Reserv. Sci. Policy Manag. Sustain. Use 1998, 3, 1–17. [Google Scholar] [CrossRef]
  36. Kumar, R.; Parvaze, S.; Huda, M.B.; Allaie, S.P. The Changing Water Quality of Lakes—A Case Study of Dal Lake, Kashmir Valley. Environ. Monit. Assess. 2022, 194, 228. [Google Scholar] [CrossRef]
  37. Dokulil, M.T. Environmental Impacts of Tourism on Lakes. In Eutrophication: Causes, Consequences and Control: Volume 2; Ansari, A.A., Gill, S.S., Eds.; Springer: Dordrecht, The Netherlands, 2014; pp. 81–88. ISBN 978-94-007-7814-6. [Google Scholar]
  38. Schulz, L. Naehrstoffeintrag in seen durch badegaeste. Zbl. Bakt. Hyg. I Abt. Orig. B 1981, 173, 528–548. [Google Scholar]
  39. Puczkó, L.; Rátz, T. Tourist and Resident Perceptions of the Physical Impacts of Tourism at Lake Balaton, Hungary: Issues for Sustainable Tourism Management. J. Sustain. Tour. 2000, 8, 458–478. [Google Scholar] [CrossRef]
  40. King, J.G.; Mace, A.C. Effects of Recreation on Water Quality. J. (Water Pollut. Control Fed.) 1974, 46, 2453–2459. [Google Scholar]
  41. Marion, J.L. A Review and Synthesis of Recreation Ecology Research Supporting Carrying Capacity and Visitor Use Management Decisionmaking. J. For. 2016, 114, 339–351. [Google Scholar] [CrossRef]
  42. Nichols, D.S.; Prettyman, D.; Gross, M. Movement of Bacteria and Nutrients from Pit Latrines in the Boundary Waters Canoe Area Wilderness. Water Air Soil Pollut. 1983, 20, 171–180. [Google Scholar] [CrossRef]
  43. Derlet, R.W.; Carlson, J.R. Coliform Bacteria in Sierra Nevada Wilderness Lakes and Streams: What Is the Impact of Backpackers, Pack Animals, and Cattle? Wilderness Environ. Med. 2006, 17, 15–20. [Google Scholar] [CrossRef] [Green Version]
  44. Katona, G. A Tisza-tó öblítő csatornáinak környezetbiztonságra gyakorolt hatása. The impact of flushing canals of Lake Tisza on environmental safety. Hung. J. Hydrol. 2020, 100, 95–104. [Google Scholar]
  45. Pomucz, A.B.; Csete, M. Sustainability Assessment of Hungarian Lakeside Tourism Development. Period. Polytech. Soc. Man. Sci. 2015, 23, 121–132. [Google Scholar] [CrossRef] [Green Version]
  46. Teszárné Nagy, M.; Márialigeti, K.; Végvári, P.; Csépes, E.; Bancsi, I. Stratification Analysis of the Óhalász Ox-Bow of the River Tisza (Kisköre Reservoir, Hungary). Hydrobiologia 2003, 506, 37–44. [Google Scholar] [CrossRef]
  47. Borics, G.; Ács, É.; Boda, P.; Boros, E.; Erős, T.; Grigorszky, I.; Kiss, K.T.; Lengyel, S.; Re, N.M. Water Bodies in Hungary—An Overview of Their Management and Present State. Hidrológiai Közlöny 2016, 96, 57–67. [Google Scholar]
  48. Teplán, I. A Tisza és Vízrendszere 1-2; Teplán, I., Ed.; MTA Társadalomkutató Központ: Budapest, Hungary, 2003. [Google Scholar]
  49. Harka, Á.; Csipkés, R.; Kovács, P.; Juhász, L. Impact of the Development and Three Decades Operation of the “Lake Tisza” Reservoir on the Fish Community of This Area; “Vasile Goldis” University Press: Arad, Romania, 2014; Volume 24. [Google Scholar]
  50. Middle-Tisza District Water Directorate. Water System of Lake Tisza, in Hungarian. A Tisza-Tó Vízrendszere. Available online: http://www.kotivizig.hu/index.php?option=com_content&view=article&id=20%3Atisza-to-vizrendszere&catid=47%3Atisza-to-vizrendszere&Itemid=77&fbclid=IwAR0dj-tbL2H6nICJjZ_oZU6wfBBub5J37LtWS1_JktVpUaJzF3D-_JVFQw4 (accessed on 28 January 2023).
  51. Kókai, Z.; Borics, G.; Bácsi, I.; Lukács, Á.; Tóthmérész, B.; Csépes, E.; Török, P.; Béres, V.B. Water Usage and Seasonality as Primary Drivers of Benthic Diatom Assemblages in a Lowland Reservoir. Ecol. Indic. 2019, 106, 105443. [Google Scholar] [CrossRef] [Green Version]
  52. Metzger, M.J.; Shkaruba, A.D.; Jongman, R.H.G.; Bunce, R.G.H. Descriptions of the European Environmental Zones and Strata; Alterra: Wageningen, The Netherlands, 2012. [Google Scholar]
  53. Piper, A.M. A Graphic Procedure in the Geochemical Interpretation of Water-Analyses—Piper—1944—Eos, Transactions American Geophysical Union—Wiley Online Library. Available online: https://agupubs.onlinelibrary.wiley.com/doi/abs/10.1029/TR025i006p00914 (accessed on 23 January 2023).
  54. Durov, S.A. Natural Waters and Graphic Representation of Their Composition. Dokl. Akad. Nauk SSSR 1948, 59, 87–90. [Google Scholar]
  55. Stiff, H.A. The Interpretation of Chemical Water Analysis by Means of Patterns. J. Pet. Technol. 1951, 3, 15–17. [Google Scholar] [CrossRef]
  56. Moreno Merino, L.; Aguilera, H.; González-Jiménez, M.; Díaz-Losada, E. D-Piper, a Modified Piper Diagram to Represent Big Sets of Hydrochemical Analyses. Environ. Model. Softw. 2021, 138, 104979. [Google Scholar] [CrossRef]
  57. Zhang, Y.; Xu, M.; Li, X.; Qi, J.; Zhang, Q.; Guo, J.; Yu, L.; Zhao, R. Hydrochemical Characteristics and Multivariate Statistical Analysis of Natural Water System: A Case Study in Kangding County, Southwestern China. Water 2018, 10, 80. [Google Scholar] [CrossRef] [Green Version]
  58. Panneerselvam, B.; Paramasivam, S.K.; Karuppannan, S.; Ravichandran, N.; Selvaraj, P. A GIS-Based Evaluation of Hydrochemical Characterisation of Groundwater in Hard Rock Region, South Tamil Nadu, India. Arab. J. Geosci. 2020, 13, 837. [Google Scholar] [CrossRef]
  59. Balamurugan, P.; Kumar, P.S.; Shankar, K.; Nagavinothini, R.; Vijayasurya, K.; Balamurugan, P.; Kumar, P.S.; Shankar, K.; Nagavinothini, R.; Vijayasurya, K. Non-carcinogenic risk assessment of groundwater in southern part of salem district in tamilnadu, india. J. Chil. Chem. Soc. 2020, 65, 4697–4707. [Google Scholar] [CrossRef]
  60. Batabyal, A.K.; Gupta, S. Fluoride-Contaminated Groundwater of Birbhum District, West Bengal, India: Interpretation of Drinking and Irrigation Suitability and Major Geochemical Processes Using Principal Component Analysis. Environ. Monit. Assess. 2017, 189, 369. [Google Scholar] [CrossRef]
Figure 1. Location of the Kisköre Reservoir (Lake Tisza).
Water 15 01514 g001
Figure 2. Deviation of water level data and monthly rainfall in the Kisköre Reservoir from the long-term average in 2021 and 2022.
Water 15 01514 g002
Figure 3. Location of the sampling points in the Tisza River section and in the different basins of the lake.
Water 15 01514 g003
Figure 4. Box plots of pH, PO4-P, NH4-N, NO3-N, CODcr and BOI5, for the sampling years (2021, 2022).
Water 15 01514 g004
Figure 5. Temporal fluctuations of temperature, SAR, inorganic N and total anion content of the sampling points during 2021–2022.
Water 15 01514 g005
Figure 6. Hydrochemical faces of the sampling sites based on Piper and Durov diagrams.
Water 15 01514 g006
Figure 7. Stiff diagrams for the different basins of Lake Tisza in 2022.
Water 15 01514 g007
Figure 8. The scatter diagram of Ca2+ + Mg2+ vs. HCO3 + SO42− for the different basins of Lake Tisza in 2021–2022.
Water 15 01514 g008
Figure 9. Dendrogram, representing the HCA results.
Water 15 01514 g009
Figure 10. Results of the two-step cluster analysis.
Water 15 01514 g010
Table 1. Component groups for lakes and water courses.
Component GroupLakeWatercourse
Oxygen balance, organic pollutionCODcr
BOI5
TOC
Dissolved oxygen
CODcr
BOI5
TOC
NH4-N
Plant nutrientsNH4-N
NO2-N
NO3-N
Total N
PO4-P
Total P
inorganic-N
Total N
PO4-P
Total P
State of acidificationpHpH
SalinityEC
Cl
EC
Table 2. Physico-chemical classification of heavily modified water bodies.
ComponentDimensionClassification Limit
Excellent–GoodGood–ModerateModerate–LowLow–Worse
1234
pH 7.9–8.27.6–7.87.3–7.57.0–7.2
8.3–8.58.6–8.88.9–9.1
ECμS/cm≤6007009001100
CODcrmg/L≤15.030.050.075.0
BOI5mg/L≤3.505.008.0012.0
TOCmg/L≤8.0015.020.025.0
NH4-Nmg/L≤0.050.100.300.50
NO2-Nmg/L≤0.010.020.030.05
NO3-Nmg/L≤0.20.400.801.50
Total Nmg/L≤1.002.004.007.50
PO4-Pmg/L≤0.050.100.150.25
Total Pmg/L≤0.200.400.600.80
Table 3. Physico-chemical classification of the different basins of Lake Tisza for the years 2021–2022.
ComponentTiszavalk BasinPoroszló Basin
Min.Max.LQ *UQ *MeanRankMin.Max.LQ *UQ *MeanRank
pH7.79.07.98.88.427.98.88.08.68.32
EC30257834748443013345723674754221
CODcr10.3028.0013.021.517.0022.5022.012.7516.014.041
BOI51.403.602.053.402.6511.403.81.573.032.341
TOC3.708.403.856.154.9713.108.004.506.205.441
NH4-N0.010.080.030.050.0410.010.100.030.040.411
NO2-N0.0020.020.0020.010.0110.000.010.0020.010.0041
NO3-N0.050.670.050.290.1810.050.310.050.190.121
Total N0.541.600.291.201.0520.681.300.821.030.921
PO4-P0.010.120.020.070.0410.010.050.0050.230.021
Total P0.050.210.050.120.0910.050.110.050.050.051
Overall rank2Overall rank2
ComponentSarud BasinAbádszalók Basin
Min.Max.LQ *UQ *MeanRankMin.Max.LQ *UQ *MeanRank
pH7.78.98.18.68.327.88.88.18.58.32
EC30261432848741412985533744794051
CODcr2.5020.08.0012.012.5916.6018.009.9015.012.761
BOI50.993.200.891.702.1710.583.001.002.001.541
TOC3.006.603.45.24.4212.94.23.33.83.601
NH4-N0.030.090.060.110.0410.020.130.050.100.071
NO2-N0.0010.010.010.010.0110.000.010.0010.010.0071
NO3-N0.050.760.380.930.2120.050.590.050.30.221
Total N0.631.901.001.601.0620.251.500.530.830.711
PO4-P0.010.030.020.020.0110.010.0020.010.030.021
Total P0.050.110.050.050.0610.050.0170.050.110.071
Overall rank2Overall rank2
Note(s): * LQ = Lower Quartile, * UQ = Upper Quartile.
Table 4. Spearman correlation coefficients for the investigated hydrochemical parameters.
pHECNa+K+Ca2+Mg2+CO3HCO3ClSO42−NH4+NO2NO3PO43−CODcrBOI5
pH1
EC−0.0441
Na+−0.0930.8841
K+−0.0780.7050.7451
Ca2+0.0680.6720.6310.6541
Mg2+−0.0050.3920.2660.4260.1911
CO32−0.559−0.072−0.160−0.049−0.0610.1761
HCO30.1320.6390.5590.5960.8280.4680.0451
Cl−0.0800.8840.9820.7070.5980.267−0.1380.5281
SO42−0.1010.1990.1590.4570.2270.4670.1980.2090.1301
NH4+−0.4070.0010.043−0.029−0.083−0.185−0.361−0.2780.030−0.0361
NO2−0.334−0.117−0.094−0.081−0.073−0.136−0.149−0.194−0.1480.1270.5491
NO3−0.261−0.288−0.259−0.243−0.204−0.228−0.144−0.348−0.2990.0810.5370.6661
PO43−−0.3880.0300.0030.1190.116−0.044−0.259−0.052−0.0380.1430.4210.4140.4711
CODcr0.196−0.071−0.0540.160−0.0180.1440.2280.072−0.045−0.068−0.240−0.415−0.304−0.0431
BOI50.2610.2460.2050.3300.2920.3850.3390.4430.2260.237−0.361−0.338−0.407−0.238−0.4101
Note(s): Bold: Correlation is significant at the 0.01 level.
Disclaimer/Publisher’s Note: The statements, opinions and data contained in all publications are solely those of the individual author(s) and contributor(s) and not of MDPI and/or the editor(s). MDPI and/or the editor(s) disclaim responsibility for any injury to people or property resulting from any ideas, methods, instructions or products referred to in the content.

