
Estimation of Global Water Quality in Four Municipal Wastewater Treatment Plants over Time Based on Statistical Methods

1
Applied Technology Group to Environmental Health, Universidad Católica de Murcia (UCAM), 30107 Guadalupe, Spain
2
Research Group in Advanced Telecommunications (GRITA), Universidad Católica de Murcia (UCAM), 30107 Guadalupe, Spain
*
Author to whom correspondence should be addressed.
Water 2023, 15(8), 1520; https://doi.org/10.3390/w15081520
Submission received: 14 March 2023
/
Revised: 5 April 2023
/
Accepted: 11 April 2023
/
Published: 13 April 2023
(This article belongs to the Special Issue Coastal Aquifers Management: Hydrological, Environmental, Economic and Social Challenges in the Context of Global Change)
Abstract
:Wastewater from urban and industrial sources can be treated and reused for crop irrigation, which can certainly help to protect aquifers from overexploitation and potential environmental risks of groundwater pollution. In fact, water reuse can also have negative effects on the environment, such as increased salinity, pollution phenomena or soil degradation, among others. Consequently, reuse of wastewater requires rigorous treatment and a very detailed analysis of different parameters, in compliance with established quality limitation standards. Therefore, this study was carried out to develop a prediction of temporal changes in water quality by introducing a wastewater quality index (WWQI) for four regional wastewater treatment plants (WWTPs) in Murcia, Southeast Spain, where a significant number of physicochemical and biological parameters are obtained in time series over the period 2019–2021. For this purpose, multivariate statistical analyses have been adopted to predict the performance of WWQI. By robust PCA of the sixteen physicochemical variables of the raw and treated wastewater, five main principal components (PCs) were extracted, which explain between 21.39% and 36.79% of the data variability. From the loadings of the PCs, the relationships between the original parameters are analyzed. The accuracy of the developed models in terms of fit to the training dataset ranged from 74.3% to 97.9%, with p-values < 0.05. The techniques incorporated in this study provided a comprehensive evaluation framework for monitoring wastewater treatment.
1. Introduction
Water is an essential resource for agricultural land, especially for irrigated crops, which require the extraction of water from natural resources. However, not as much water is available due to increased demand, which is affected by climate change that is causing greater variability in water availability due to sometimes more intense rainfall but also longer and more unpredictable dry periods.
This situation is exacerbated during periods of drought, forcing governments to implement restriction plans or large-scale hydraulic projects. This has led to the emergence of wastewater usage for agriculture, aquaculture, groundwater recharge and other applications. One of the actions aimed at increasing water production may be, among others, the creation of desalination and/or water treatment plants that can be reused for agricultural, urban, industrial, recreational or environmental purposes. So, the reuse of treated wastewater is one of the most alternative water resources for crop irrigation and urban-tourism uses [1], but this reuse can have negative consequences, which is due to the fact that conventional wastewater treatment plants (WWTPs) do not effectively remove some organic and inorganic pollutants, which could lead to water pollution causing environmental and human health problems. In many arid and semi-arid areas of the world, reuse of reclaimed water has been implemented to secure and improve agricultural production.
Despite the benefits of this resource, the scientific community has identified a number of concerns and challenges for human health and the environment, as crops in irrigated areas are exposed to contaminants that are likely to remain in the water after the conventional treatment process that may cause risks to human health or end up in the surrounding soil endangering freshwater. Throughout history, WWTPs have been designed to remove certain types of pollutants. Therefore, the presence of these compounds in wastewater and their impact on the environment puts pressure on WWTPs for their operational removal [2]. In fact, awareness of the problem is beginning to be raised, and studies and tests are starting to be carried out along the treatment processes at source before it reaches the receiving bodies. Much research has been done on the subject of wastewater, especially on point sources of pollution, and it has been shown that conventional WWTPs are not as effective in removing pollutants.
The application of technologies such as the use of membrane bioreactors, adsorption with activated carbon or advanced oxidation processes (AOPs) such as ozonation, photo-Fenton, heterogeneous photocatalysis, etc., to treat water represents an invaluable improvement in effluent quality but entails higher costs that are necessary to address this environmental problem prior to its incorporation into a receiving waterway [3,4,5,6]. In wastewater treatment, physico-chemical properties of flows depend on many factors, such as origin, type of sewerage network, economic growth and meteorology. Thus, wastewater stream has a multicomposition from organic, inorganic and nutrient loads that vary in time and space [7,8].
Identifying the dynamics of the wastewater content and its scale is essential to establish the preferred treatment system [9]. To achieve and ensure water quality, a combination of technical testing and analysis of water quality parameters is required as complementary preventive measures before transferring them to stakeholders. In each WWTP, different processes take place simultaneously, so it is necessary to take into account a large number of chemical, physical and microbiological parameters to characterize and evaluate wastewater flows. Therefore, understanding effluent variability and its impact within the treatment process is essential to prevent adverse health and environmental impacts from reused wastewater. Although all necessary wastewater analytical data are collected, appropriate techniques are needed to extract useful information by developing suitable index variables to better describe wastewater quality and assess the effectiveness of the treatment system [10,11].
In view of the above, multivariate statistical techniques are used to establish relationships between interrelated data to better quantify wastewater quality and treatment processes, as well as to analyze large databases of quantitative variables/observations and compress them to extract relevant information [12]. An emphasis has been placed by some scientists on the application of principal component analysis (PCA) and multiple linear regressions (MLR) to obtain information on the seasonal flow of wastewater generated by domestic and industrial waste [13,14,15].
In the course of this research, several of the techniques incorporated in this work have been carried out using a multivariate statistical analysis approach to extract and organize information from the water quality monitoring program. This approach used (1) PCA to reduce the dimensionality of the datasets obtained from the WWTP and analyze the interconnectedness of variables, as well as quantify the importance of different variables in the dataset, (2) MLR to predict the performance of wastewater quality index (WWQI) and develop models that can predict important quality parameters and (3) correlation analysis to determine the degree to which specific parameters were statistically correlated.
PCA is a widely used statistical technique for decomposing a data matrix into vectors called factors or principal components without losing most of the original information in the form of linear combinations of the initial uncorrelated variables [16], with the first factor representing the largest possible variance of the dataset. The second factor is calculated following a similar strategy, only with the condition that it is uncorrelated with the first and represents the next highest variance. This is repeated until a total of factors equal to original number of variables are calculated. Therefore, Varimax rotation is used to increase the participation of the variables with the highest contribution and simultaneously reduce the weight of the variables with the lowest contribution [17,18].
Apart from PCA, MLR models are a form of linear regression used when there are two or more predictors that can be applied in WWTP to predict the effect of two or more independent variables, such as BOD5, COD, TSS, temperature, pH and ammonia in the case of WWQI. Consequently, the MLR method is used in many environmental studies [19].
To verify their relationship with WWQI, some specific parameters are initially examined by PCA. Any weakly correlated parameters will be excluded for predicting WWQI. However, only correlated parameters will be used in the MLR process. By far the most common measure of correlation is Pearson’s correlation [20].
Considering data analysis in general terms, PCA has a number of advantages:
- (1)
- Reduction of dimensionality of the data. This can be useful when the initial data contain a large number of variables and are therefore difficult to visualize or analyze.
- (2)
- Derivation/extraction of new features or elements from the original data that are more insightful or understandable than the original ones.
- (3)
- Visualization of high-dimensional data in two or three dimensions that may not have been visible in the initial high-dimensional space.
- (4)
- Reduction of the impact of noise or measurement errors on data.
- (5)
- Reduction of the impact of multicollinearity in the analysis by identifying the most important characteristics or components.
However, there are also some disadvantages to this statistical method, such as:
- (1)
- Difficulty in interpreting the resulting principal components, which are not always easy to understand or describe in terms of the original characteristics.
- (2)
- Loss of information when choosing a subset of the most crucial features or components to reduce the dimensionality of the data.
- (3)
- Difficulty in identifying the most crucial features due to distortion of the covariance matrix by outliers.
- (4)
- Difficulty in scaling: although PCA assumes that the data are scaled and centralized, some resulting principal components may not correctly represent the underlying patterns in the data if the data are not correctly scaled.
- (5)
The results of a correlation analysis are limited to simultaneously assessing correlations between several variables, despite the usefulness of the correlation analysis method established between two variables [24]. However, PCA can be applied to identify the performance of the treatment process and determine interdependencies between variables [25].
These approaches present a diagnosis of the process in terms of the relationships established between the analytical measured data. The relationships were used to build empirical models to estimate one or more properties of the system [26]. During recent years, many studies on the field of sewage management have widely applied statistical methods of data analysis for different purposes [27,28,29,30,31,32,33]. In this field, some researchers have made progress in the use of multivariate statistical techniques applied to modeling to assess water quality. In fact, this approach has been widely adopted to estimate the concentration of the main effluent quality parameters [31,34].
The current paper presents a novel analysis of physicochemical and biological parameters of wastewater based on the latest work in the field of multivariate statistics to develop a simple model based on PCA, correlation, multivariate regression and ANOVA. The study also involves the development of techniques that provide a framework for the global evaluation of WWTP quality using the wastewater quality index (WWQI) [35,36].
2. Materials and Methods
2.1. Study Area Sites
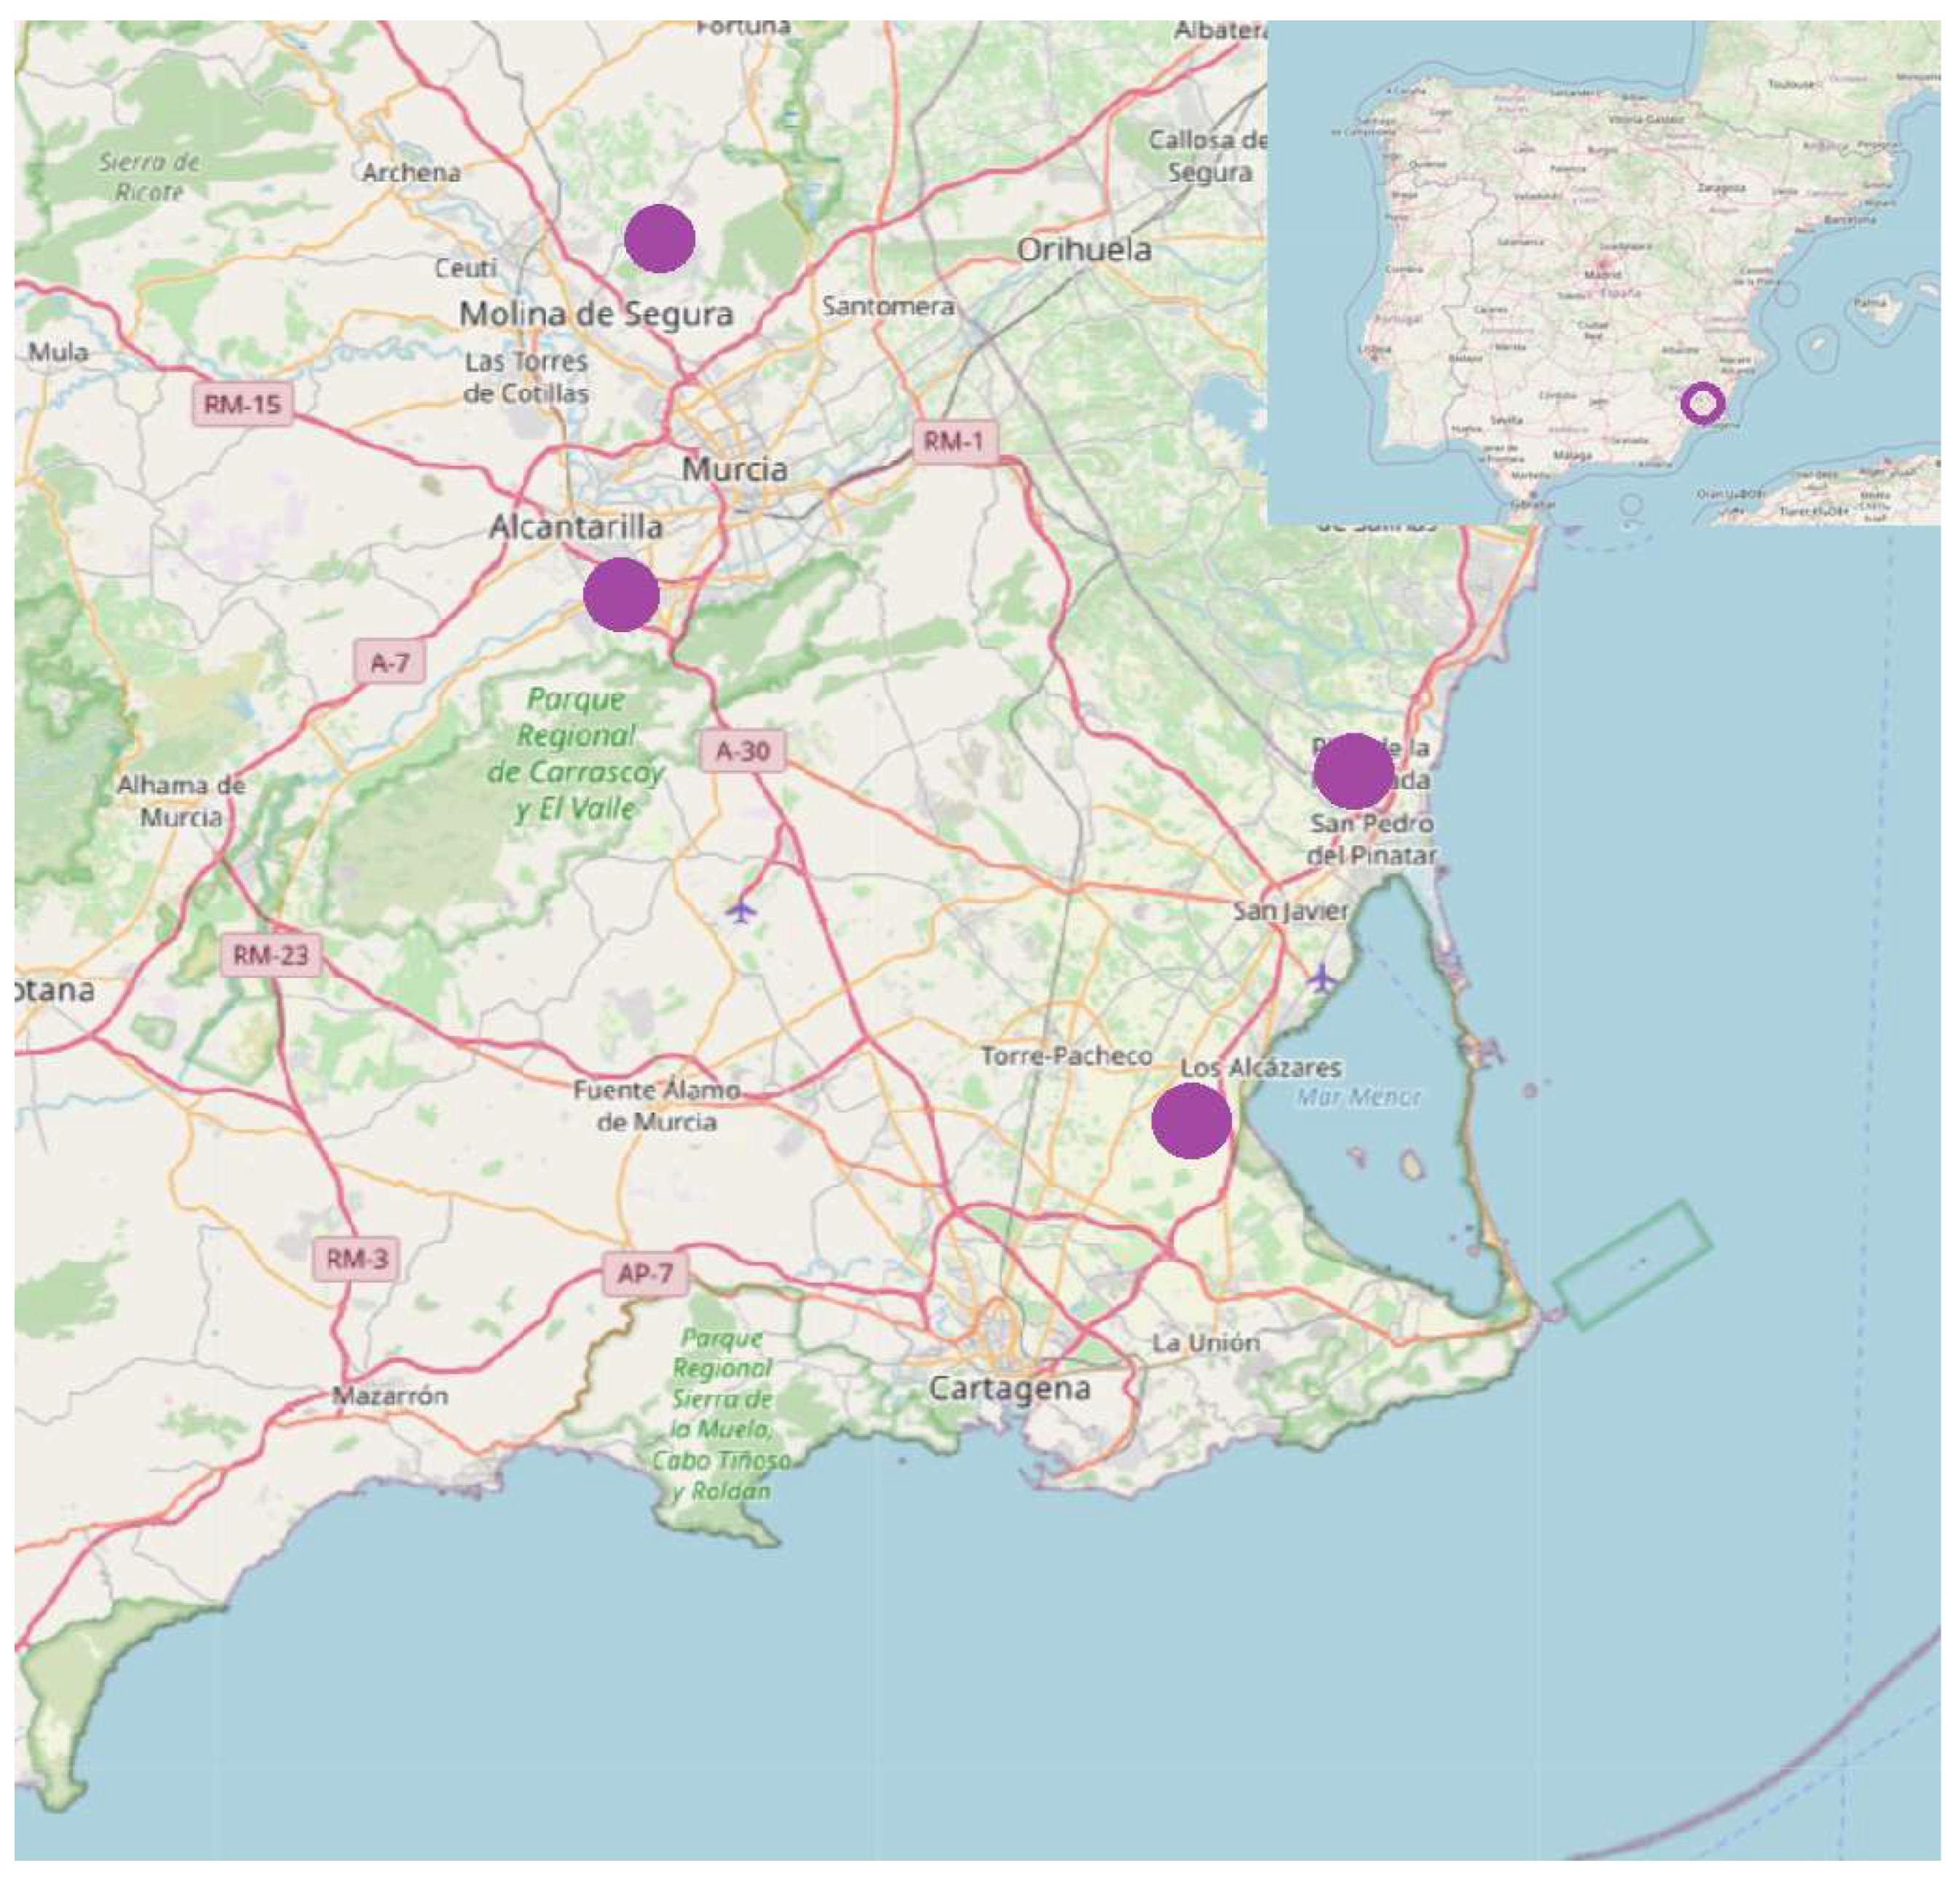
As shown in Figure 1, four representative WWTPs have been chosen for water sampling in the Region of Murcia (Southeast Spain): Alcantarilla (AL), Molina (MO), Los Alcázares (LZ) and San Pedro (SP). LZ and SP are located in the coastal area adjacent to the agricultural lands of Cartagena, close to Mar Menor coastal lagoon, while AL and MO inland also used for agricultural land and public domain. Parameter sampling was performed at the inlet (influent) and outlet (effluent) of the selected WWTPs from March 2019 to January 2021 according to the standards of the American Public Health Association (APHA). In addition, the incoming and outgoing water was collected manually 3 times a day.
Most of selected plants mentioned above are the largest of their type in the region, covering in total most of the principal cities and municipal public WWTPs and operating with an average daily flow of millions of gallons per day (mgd) and a peak hour flow capacity of 3 to 6 mgd, serve a population between 16,891 and 69,785 inhabitants and are designed to treat wastewater from various residential and industrial connections to meet the needs of their population (see Table 1). For most of WWTPS, the plant is designed as a sequential batch reactor (SBR) system consisting of preliminary, secondary and tertiary treatment systems. Due to the high pollutant load of industrial and agricultural origin entering these plants and to the need to comply with regulations on the quality of the treated effluent, their treatment systems have pretreatment with screening, degreasing and desanding units, clarification basins, secondary biological treatment and finally tertiary treatment by UV disinfection. In addition, the effluent treated by each WWTP is used for irrigation and/or public use.
2.2. Parameters Monitored
During deployment, there are up to 1000 samples for water quality assessment of these WWTPs. All analytical tests used in the sampling and metrology plan followed standard methods for water and wastewater testing [37]. Water samples were collected in acid-washed glass bottles, rinsed with deionized water, sterilized and then stored in a portable refrigerator at 4 °C for proper preservation until arrival at the laboratory. The eight laboratory analysis parameters were measured by a procedure following the method recommended by Association of Official Analytical Chemists (AOAC), an International official method [38]. Measurements of monitored parameters include pH, electrical conductivity (EC), total suspended solids (TSS), chemical oxygen demand (COD), total nitrogen (TN), total phosphorus (TP), biological oxygen demand (BOD5) and dissolved organic carbon (DOC) content in both influent and effluent. Furthermore, a wastewater quality index (WWQI) has been developed to estimate the overall quality status of the raw and treated waters.
2.3. Descriptive Statistics
The treatments were carried out using the statistical software Sigma Plot 14.0 (Statistical Package for the Social Sciences-Sigma Plot for Windows 14.0 ed. Systat Software, 2022. Chicago). Descriptive statistics were performed for each parameter measured in the influent and effluent of each WWTP to establish the characteristics of central tendency, dispersion and distribution [39]. The descriptive statistics calculated were mean, median, standard deviation, standard error, variance, skewness, kurtosis, range, minimum and maximum. Tables S1–S4 in Supplementary Materials show these statistics for the four wastewater treatment plants under study.
2.4. Correlation Analysis
All figures were obtained using the statistical software referred to Sigma Plot 14.0. Regarding data processing, SPSS (Statistical Package for Social Science, version 13.0) and Sigma Plot were used. In this process, different methods of statistical analysis were applied, such as correlation, multivariate regression, ANOVA and PCA analysis, where significant differences were processed by appropriate tests scored as significant at p < 0.05. Principal component analysis (PCA) is a statistical method that was proposed by Pearson (1901) [40] and independently also by Hotelling (1933) [41], which consists of describing the variation produced by the observation of p random variables in terms of a set of new variables that are uncorrelated with each other (called principal components), each of which is a linear combination of the original variables. These new variables are obtained in order of importance, so that the first principal component (PC1) incorporates the greatest possible amount of variation due to the original variables; the second principal component (PC2) is chosen so that it explains the greatest possible amount of variation that remains unexplained by the PC1, subject to the condition of being uncorrelated with the PC1, etc.
2.5. Wastewater Quality Index Calculations
Wastewater quality index (WWQI) is a defined number digit that cumulatively describes the quality of an aggregate set of measured physicochemical and biological parameters. The WWQI is a mathematical expression of the Canadian Council of Ministers of the Environment (CCME) developed for the influent and effluent for the case study [42,43]. This index is one of the most widely used Water Quality Index method in summarizing the water analytical data into data or information that are beneficial for decision makers based on three factors of water quality that relate to water quality limitations which consider the scope (F1), frequency (F2) and amplitude (F3) being calculated based on the quality limitations [44,45]. WWQI of the influent and effluent flows is calculated from the wastewater monitoring results using Equations (1) to (6):
where:
F1 is the percentage of measured variables that do not meet limit at least once during the time period; F2 is the percentage of individual tests that do not meet limit; F3 is the amount by which failed test values do not meet limit; Excursion is the number of times by which an individual test is greater than limit; nse is the collective amount by which individual tests are out of compliance.
The CCME classification, created in 2001 and used since then in Canada and around the world, reports water quality using an index that provides information on the overall condition of water at various monitoring points. Water quality is classified into different categories with a scoring scale from zero to one hundred. If the weighted arithmetic index is in the range 95 to 100, it is excellent; if it is in the range 80 to 94, it is good; if it is in the range 65 to 79, it is fair; if it is in the range 45 to 64, it is marginal; and if it is in the range 0 to 44, it is poor [46]. These five classifications were developed based on measured parameters and established water quality standards. Table 2 presents the WWQI categories for the four WWTPs under study.
Upon WWQI analysis, it is expected to find that streams influent to WWTPs have index quality values between 45 and 60, indicating that water quality was commonly endangered or impaired and would be harmful to surrounding water bodies if discharged without treatment, but after treatment the effluent water quality index was reported to be uniformly between 95 and 100, revealing that the water quality is excellent and not harmful to the receiving waters of the discharge.
3. Results
3.1. Temporal Evolution of Influent and Effluent Qualities
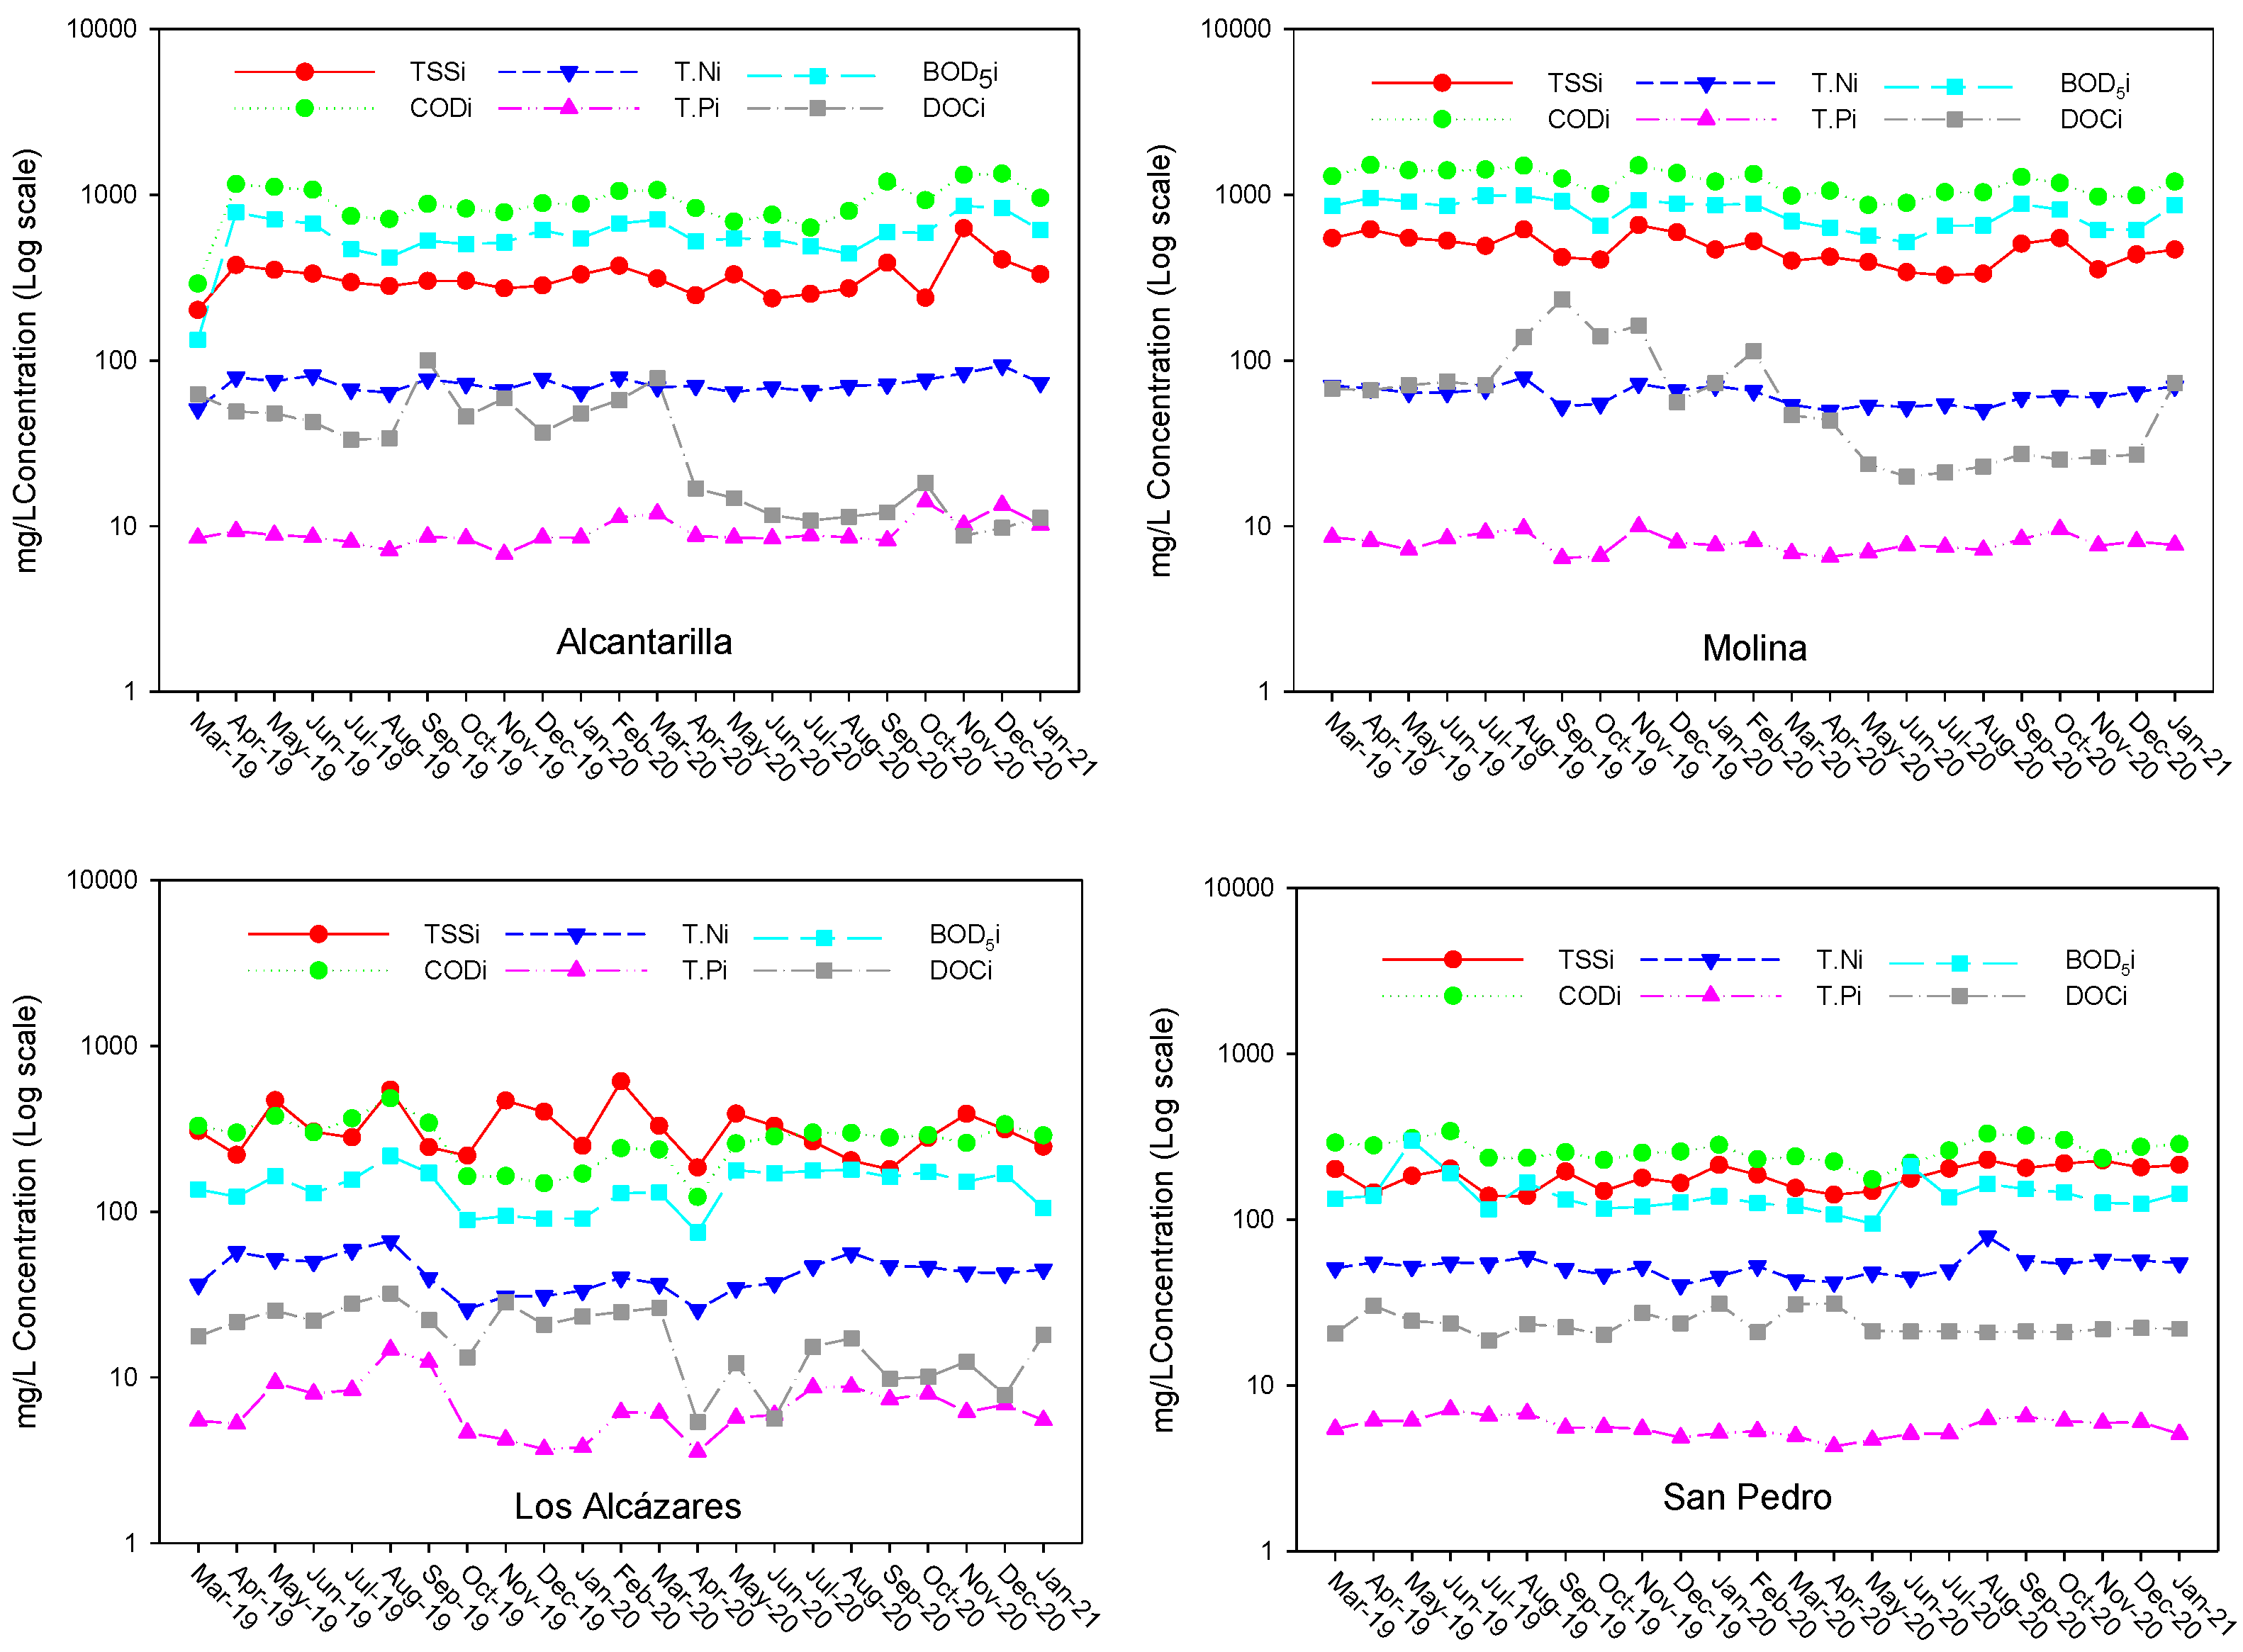
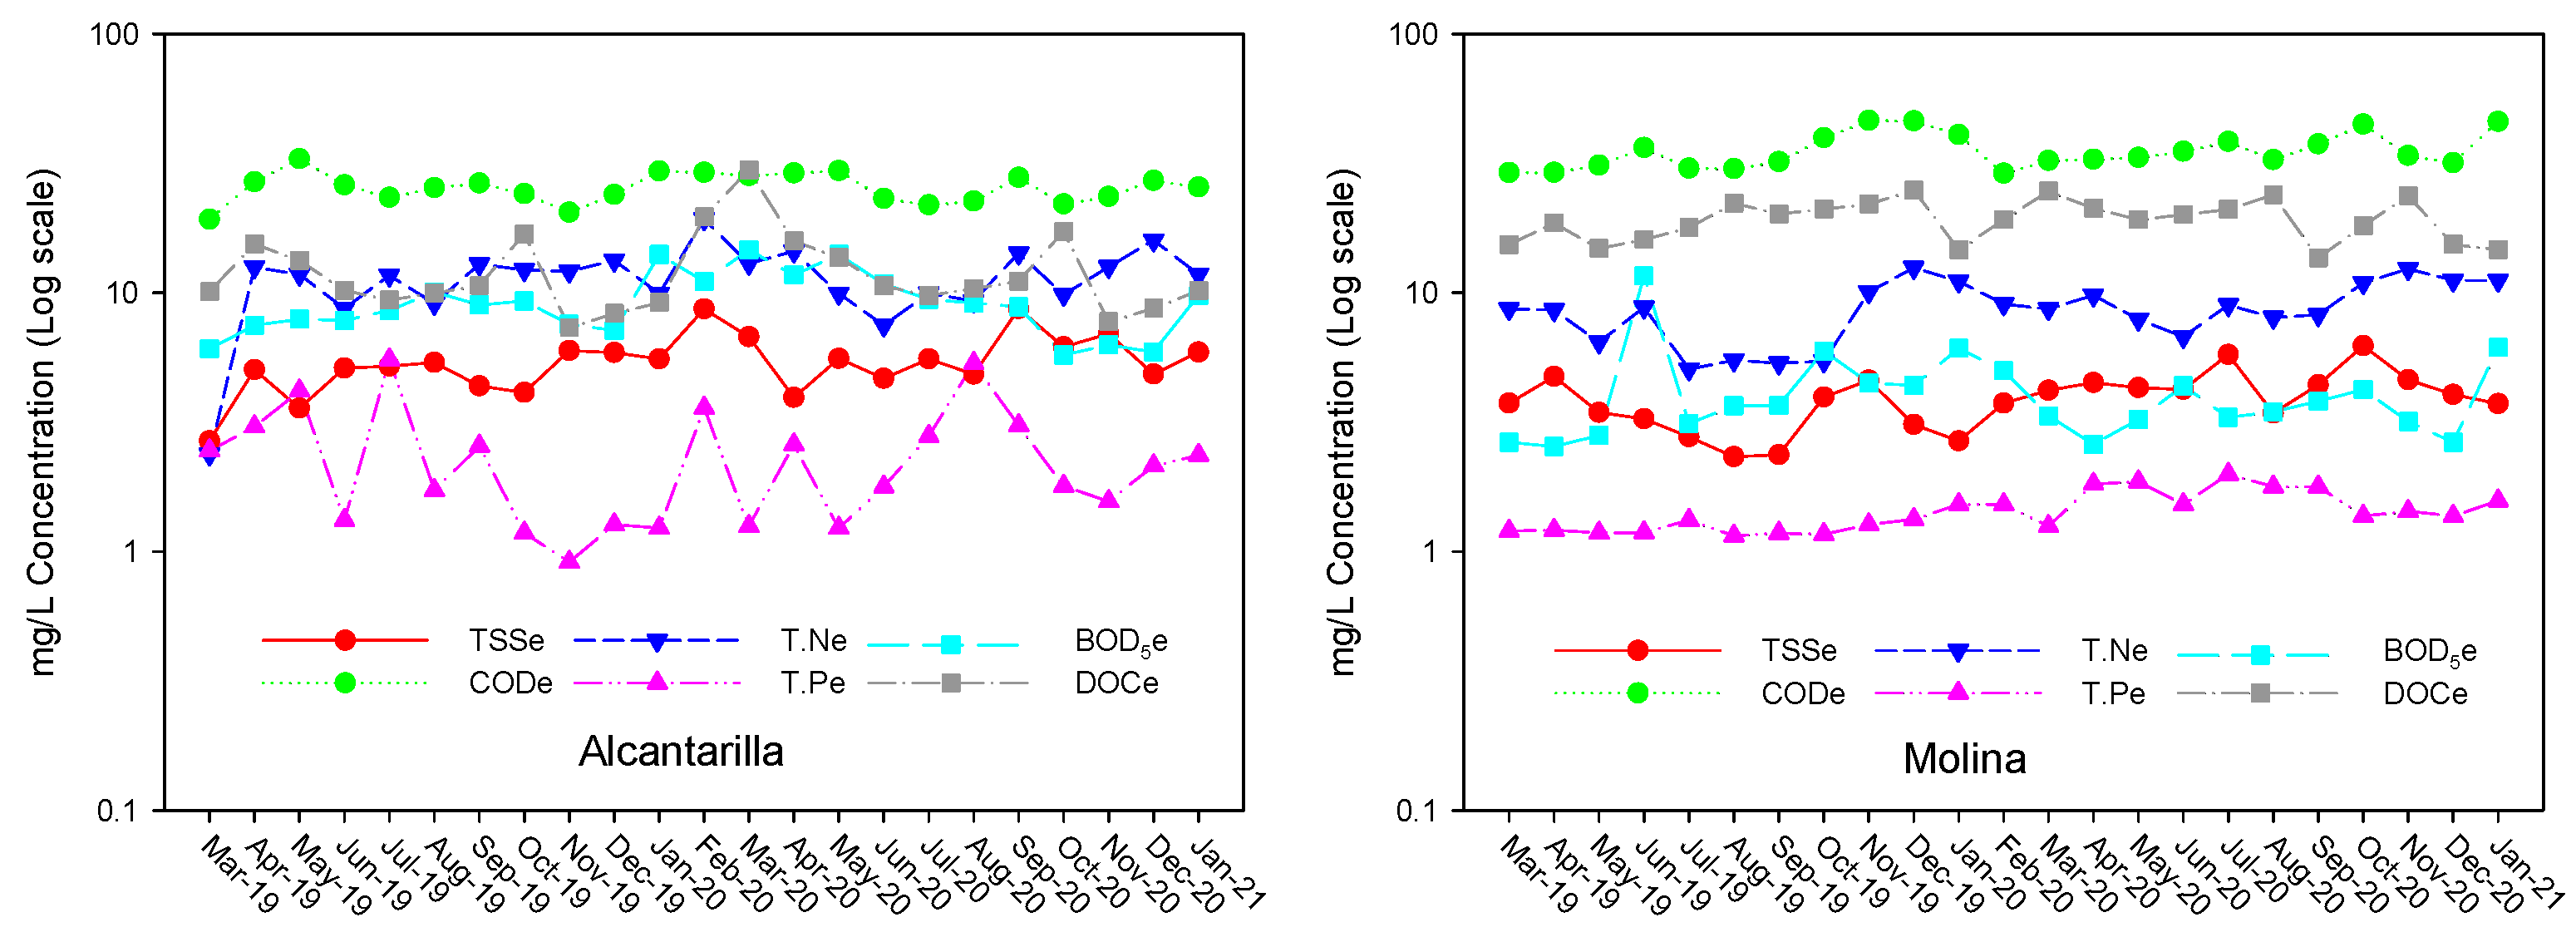
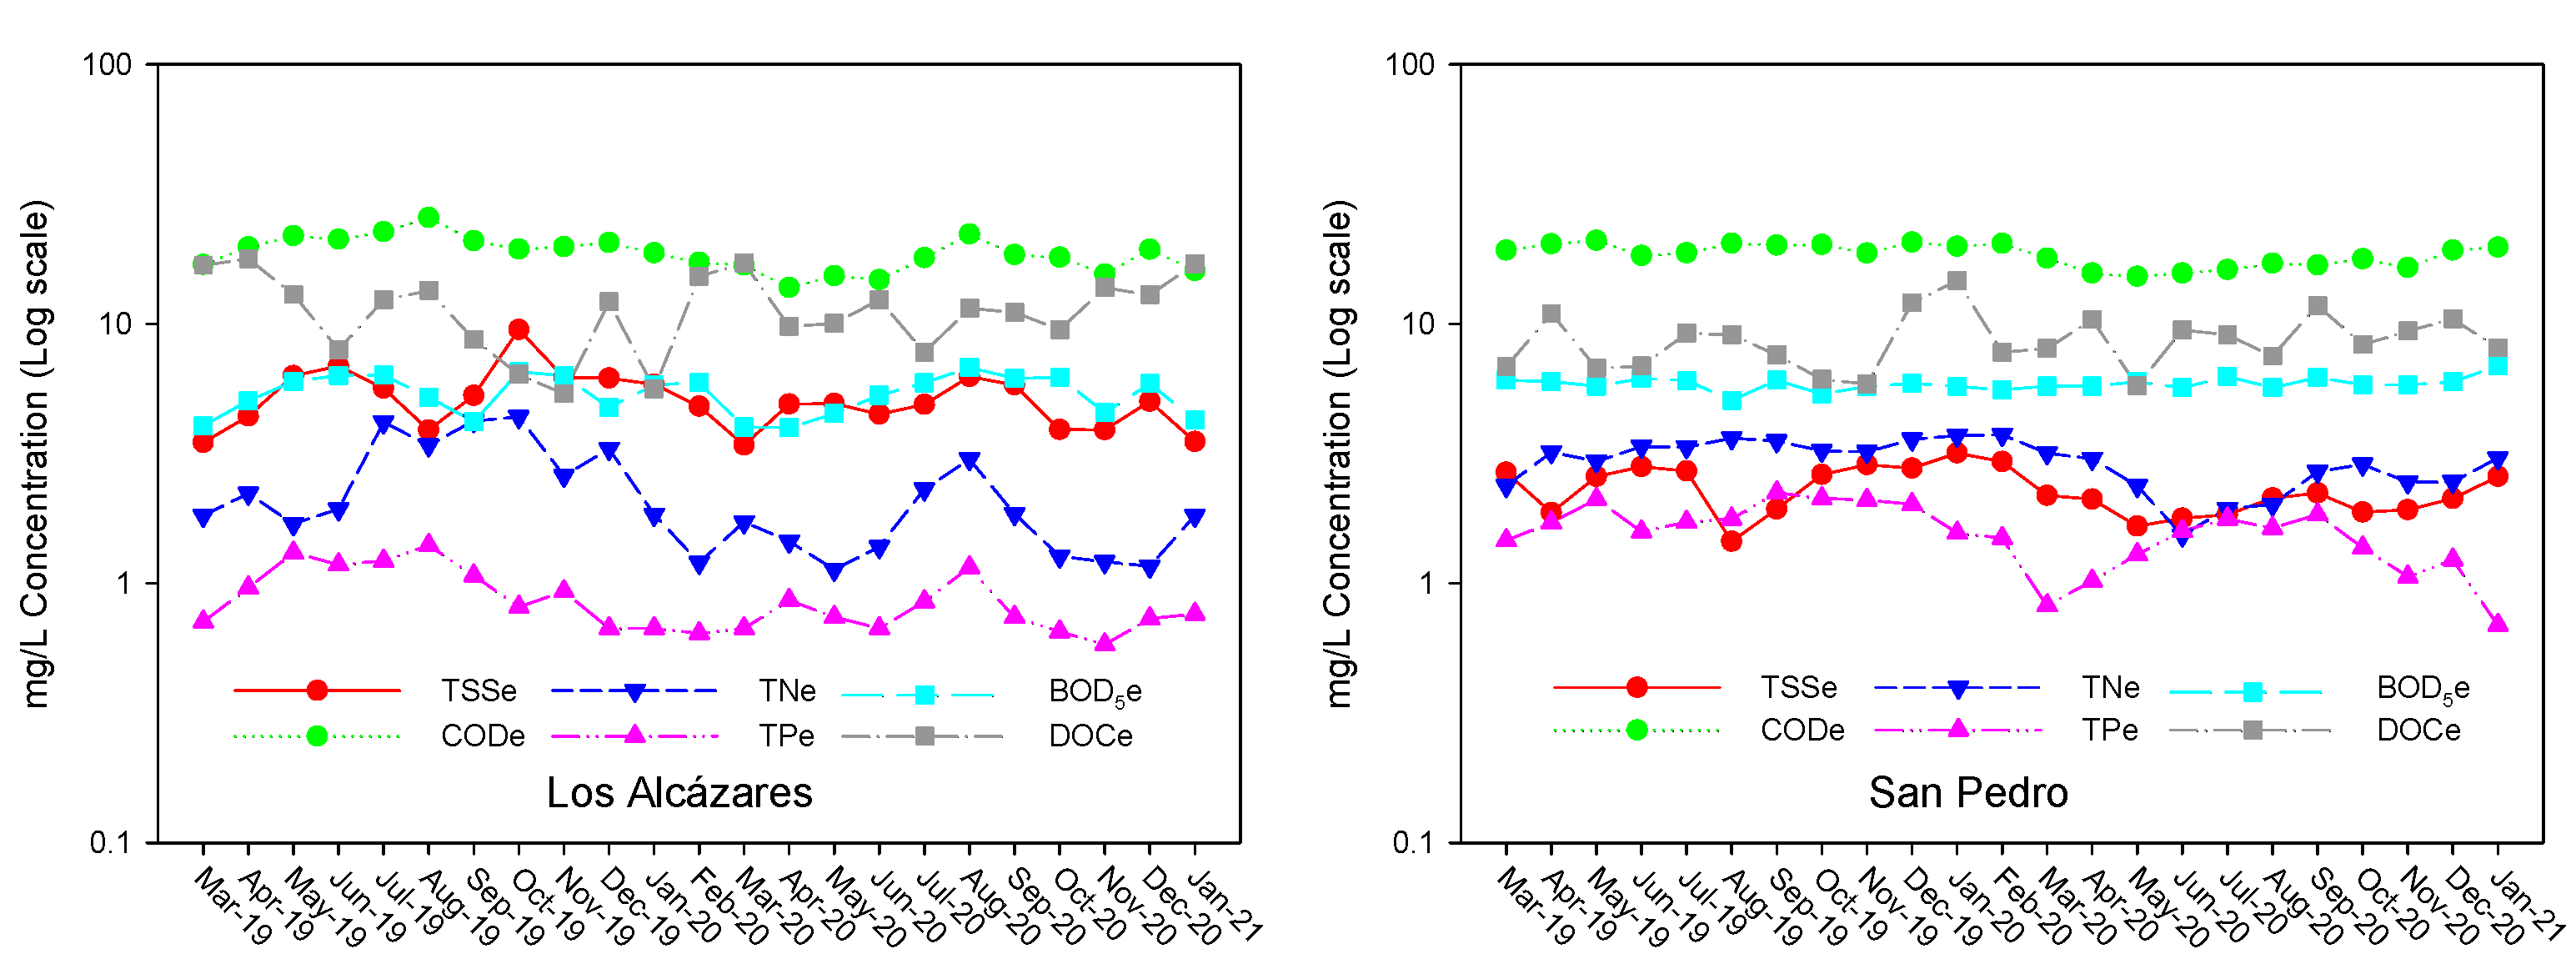
Figure 2 and Figure 3 show the time evolution of TSS, COD, TN, TP, BOD5 and DOC measurements of influent and effluent with the same trend in all WWTPs during March 2019 to January 2021. The most remarkable aspect is that the parameters BOD5, TSS, nitrogen and phosphorus in the influent can be described by a linear expression, while dissolved organic carbon can be described by a 2nd degree polynomial expression. This opposite trend indicates that as the amount of available dissolved organic carbon increases, the level of pollutants in the influent wastewater decreases. Regarding the effluent quality parameters, it was observed that the variation of organic matter throughout the treatment process had a considerable impact on the concentration of other quality parameters, especially TSS, TP and TN. An increase in the amount of DOC, COD and BOD5 led to a decrease in the concentration of TSS in the effluent and an increase in the level of BOD5. After treatment, it is possible to reduce suspended particulate matter and achieve a significant reduction in BOD5 and COD, which allows compliance with discharge regulations for most wastewaters. In fact, obtaining all wastewater data makes decision making by operators still challenging due to the complex interrelationships of parameters.
3.2. Multivariate Statistical Analysis Approach
This statistical analysis incorporates techniques such as correlation analysis, principal component analysis (PCA) and exploratory factor analysis (EFA) using SPSS and the choice of the number of components to be extracted. PCA was performed for all parameters. The analysis extracted five principal factors based on Kaiser’s rule of eigenvalues greater than one [47], as shown in Tables S5–S8 in Supplementary Materials.
Table 3 presents the results of the rotated factor matrix obtained through an exploratory factor analysis using the maximum likelihood method with Varimax rotation to analyze the factor structure and correlation between the components or factors included in the scale. After rotation, the loadings are readjusted to the proper size to ensure equal weight to all items when performing the rotation.
According to these procedures, the dimension of the dataset was reduced from sixteen variables to five factors with information around 71.31% and 81.15%, as shown in Table 3. However, it was observed that two components (PC1 and PC2) had higher loadings that can better explain characteristics of the dataset. The remaining components do not satisfy the general trend of actions between variables.
Developing the correlated values of the significant factor loadings (component’s score) in four WWTPs, the highest loading of the total variance of each dataset was attributed to PC1 (34.32%) in AL-WWTP and 28.82% in MO-WWTP, respectively, being labeled as the loading of the influent quality parameters. This fact reveals that it is the dominant data pattern to better understand the influent wastewater characteristics. The second component PC2 contributed 13.17% in AL-WWTP and 15.93% in MO-WWTP of the initial variance of the data, mainly considered for the oxygen demand characteristics of the treated wastewater, including phosphorus and nitrogen.
The analysis carried out for LZ-WWTP, where the first component represents 36.79% of initial data variance, contained significant loadings for the ion activity component because it highly represented the influent and effluent EC values. In this plant, PC2 (17.58%) was correlated with the nutrient removal performance of the WWTP as well as with the nutrient load of the effluent wastewater, which changed significantly. Regarding SP-WWTP, PC1 component (21.39%) was initially related to the organic loading of the influent wastewater, while PC2 (17.62%) was correlated to the effluent oxygen demand that can be concluded due to positive observed scores for this component.
As a rule, to understand the structure of the data, PCA usually involves the interpretation of the components (PCs) that are extracted from the original dataset. Table 3 shows the rotated component matrix, which is a matrix of the component loadings of each variable on each PC that can explain the relationships between the original variables (parameters). Regarding the raw AL-WWTP, PC1 was saturated mainly by BOD5 and COD, followed by TN, TSS and TP. Rather, the effluent was dominated by TN, TSS and COD. These parameters characterize the organic and inorganic compounds present in municipal wastewater; PC2 was affected by COD. PC3 was affected mainly by BOD5 and COD; PC4 was affected by pH; and PC5 was affected by TP and COD. In the case of the MO-WWTP, the first component of influent values presents high pH and moderate effluent load. The second component presents high TSS, TN, BOD5 and TP values, which is attributed to the massive input of organic waste due to increased biological activities. PC3 presents high EC loadings in both influent and effluent and high COD loadings, a common parameter used to characterize the total content of organic and inorganic compounds in the effluent. The fourth component has high pH and TP loadings, and PC5 was affected mainly by BOD5. In the case of LZ-WWTP, PC1 presents high negative loads with EC in both influent and effluent and positive loads with DOC in influent and also TP, TN and COD in effluent. PC2 exhibits high nitrate, phosphate and also BOD5 and COD loads, mainly due to nutrients that have passed through the aerobic part of an activation tank. PC3 was affected mainly by pH. PC4 was affected by BOD5 and TSS. PC5 of the influent values was heavily loaded with TSS and DOC. Concerning the SP-WWTP, the first component has a high pH load for both influent and effluent. PC2 was saturated mainly in the influent by BOD5, COD, TN, TSS and TP. The third component has high EC loadings in the influent and also TSS. PC4 has high negative loadings with BOD5 in the effluent and positive loadings with TP and COD. Finally, PC5 has positive loadings with DOC in both influent and effluent and also with TSS in effluent, which were of low concentrations and therefore contributed to the less important PCs.
In computational terms, data obtained have been analyzed using PCA to identify the dominant parameters of the processes occurring simultaneously in WWTPs (mainly BOD5, TSS and nutrient pollution) with the aim of extracting further information for process optimization [48].
3.3. Approach to Statistical Modeling
Multivariate statistical techniques were applied in this section to develop predictive models of water quality parameters from the database of historical measured processes. Considering as training data, the quality and quantity parameters measured during March 2019 to January 2021, the development of descriptive numerical models was carried out to predict the influent and effluent WWQIs. The prediction models of the quality parameters are based on different combinations of available variables for TSS, TN, TP and BOD5 concentrations of influent and effluent. A total of 10 numerical expressions derived from the influent and effluent quality parameters considered above were used to identify the WWQIs described in Table 4.
3.4. Assessment and Verification of Model Quality
A complex matrix of physicochemical and biological parameters is obtained from the wastewater monitoring data, which alone cannot provide a reliable temporal assessment of wastewater quality or evaluate WWTP performance. To address this problem, two methods were applied: (1) PCA to identify the dominant process parameters occurring simultaneously at WWPTs and (2) WWQI index to summarize a large number of monitored parameters into a single unitless value.
The PCA has identified the dominant process parameters occurring simultaneously at the WWTPs, mainly BOD5, TSS and nutrient pollution in this study. Therefore, they have been considered in the regression to predict the WWQI index.
During the validation of the accuracy of the models, the dataset was divided into training data and test data. Through analysis of the predicted and originally calculated WWQI results, a validation dataset was used to examine the prediction performance of the models. As performance indicators, the accuracy of these models was assessed by the coefficient of determination (R2) and the root mean square error of prediction of the concentrations (RMSE), which was calculated based on the Equation (7). These standard metrics were used to assess the quality of each model by indicating the concentration of the data around the line of best fit between the measured concentrations of the training data and the precision with which the test data were estimated.
This index was calculated numerically as follows:
where
- Predictedi = values of predicted parameter
- Calculatedi = values of measured parameter
- N = Total number of samples
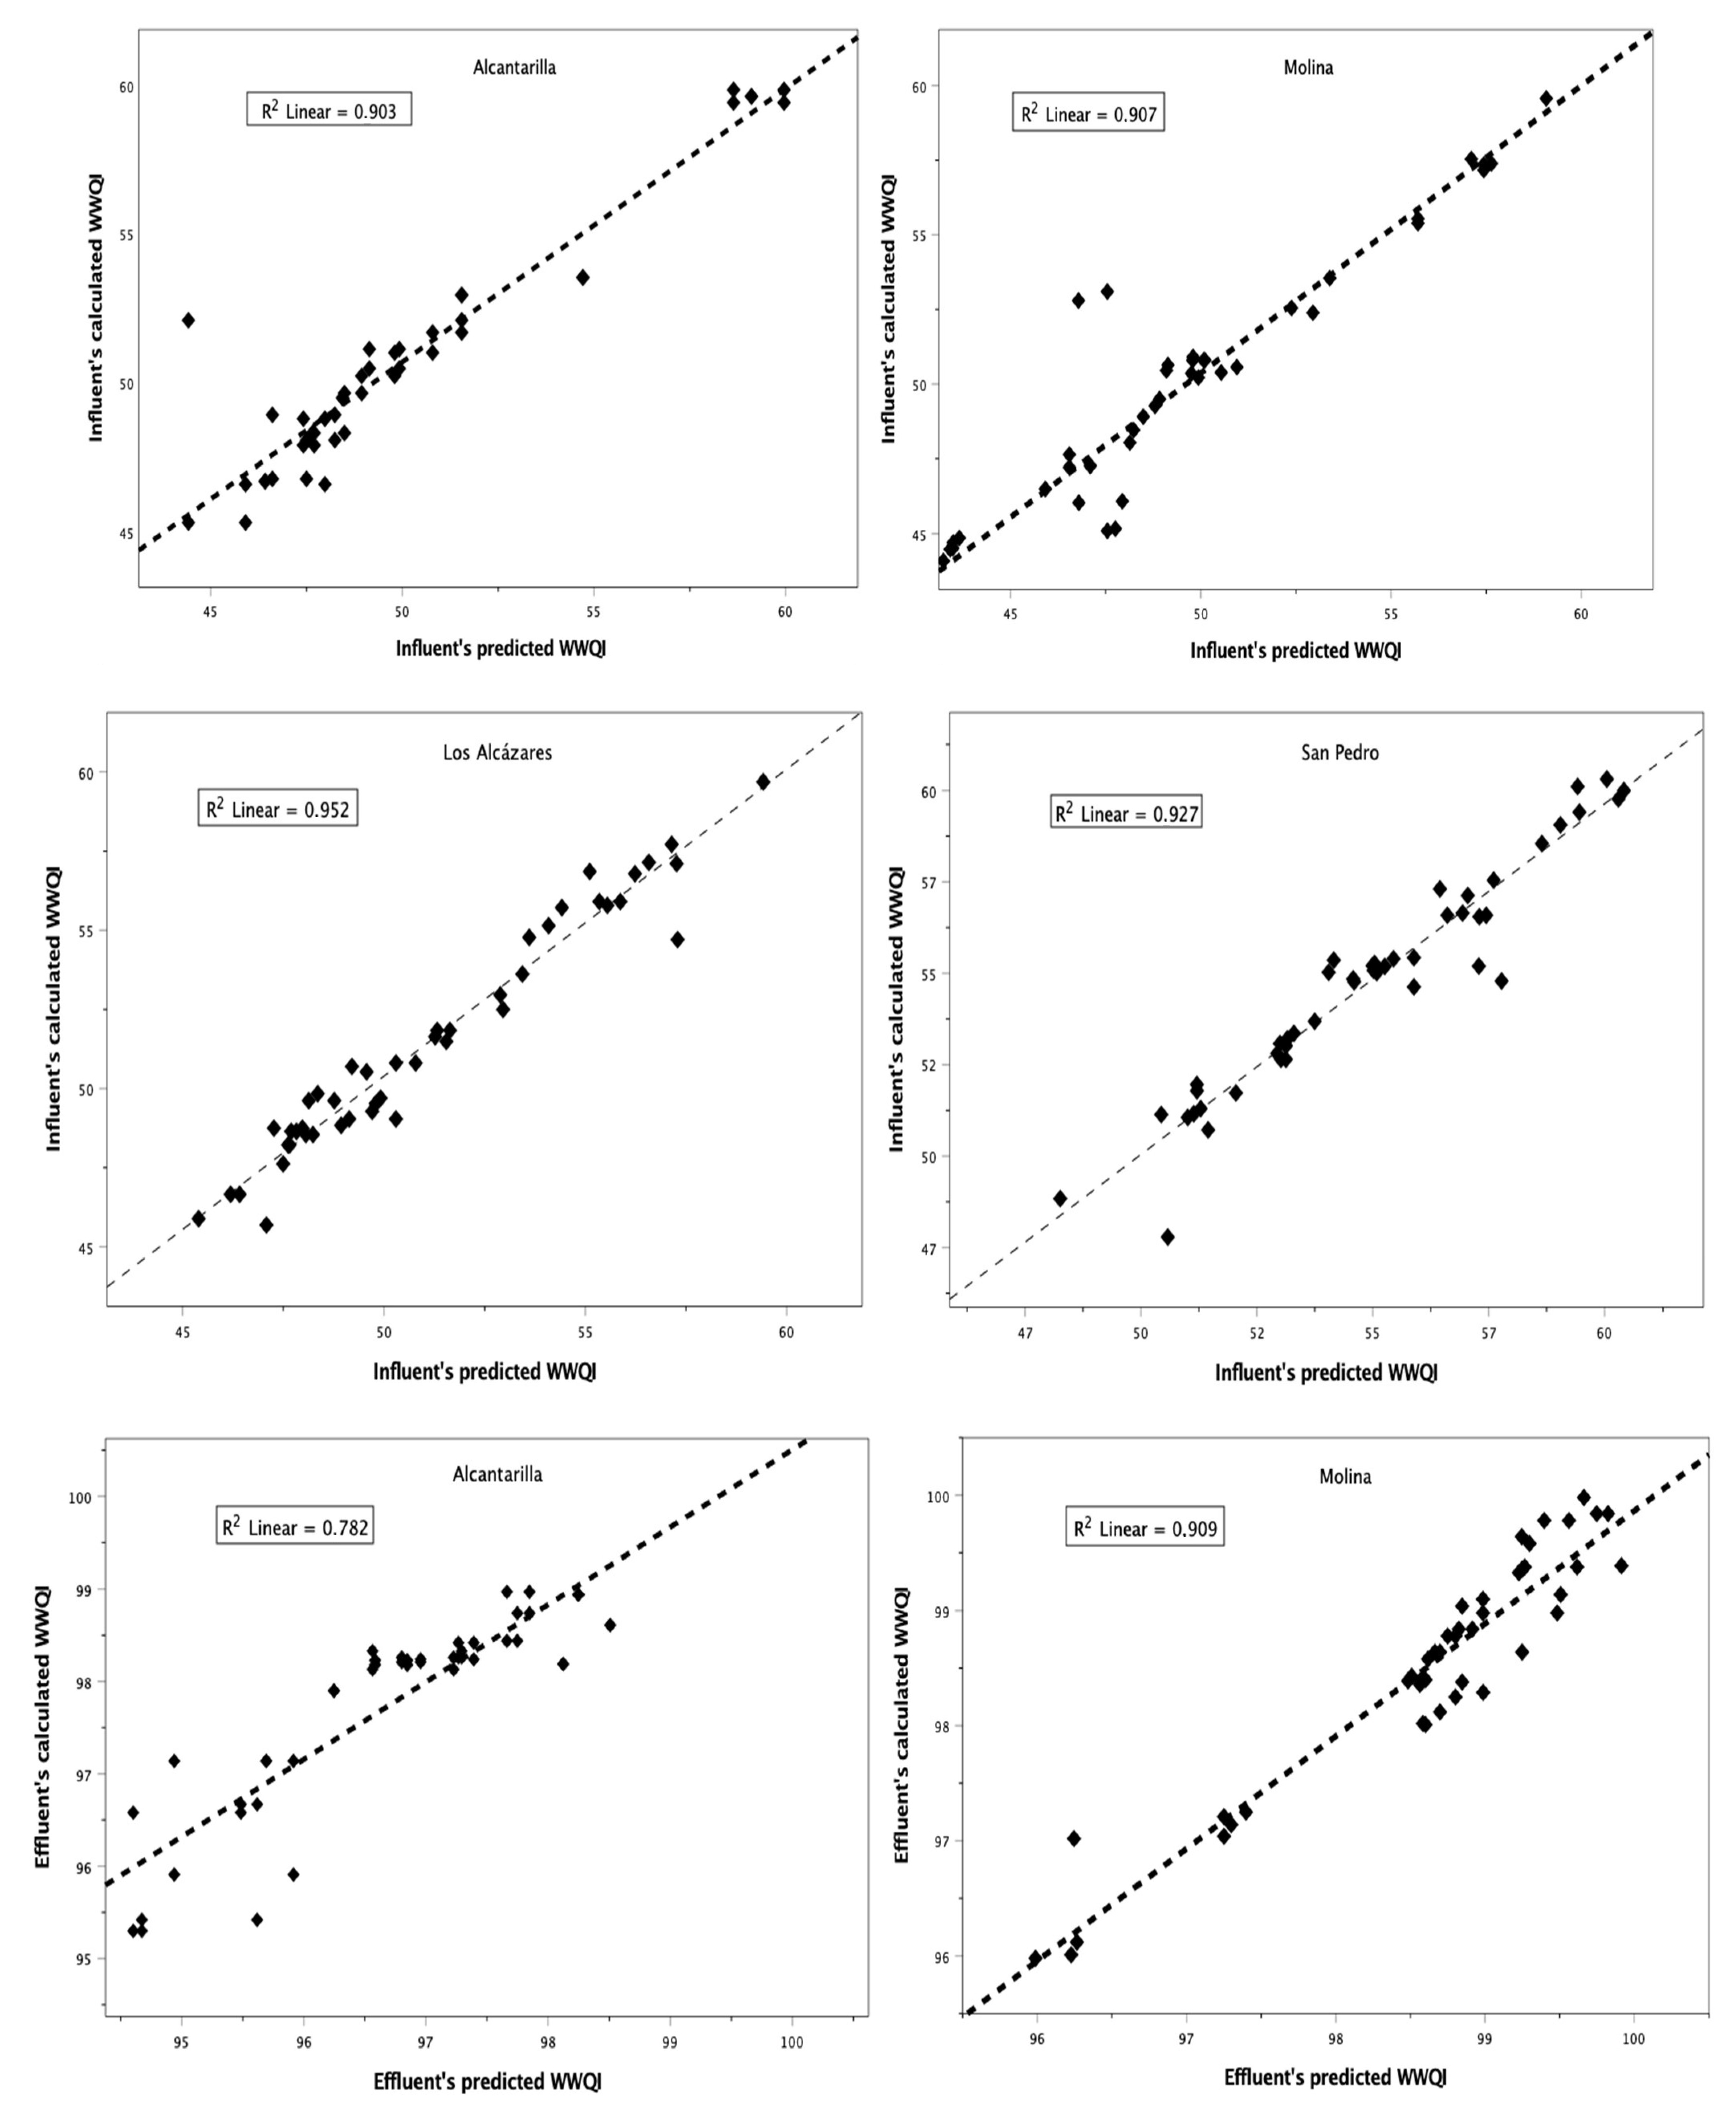
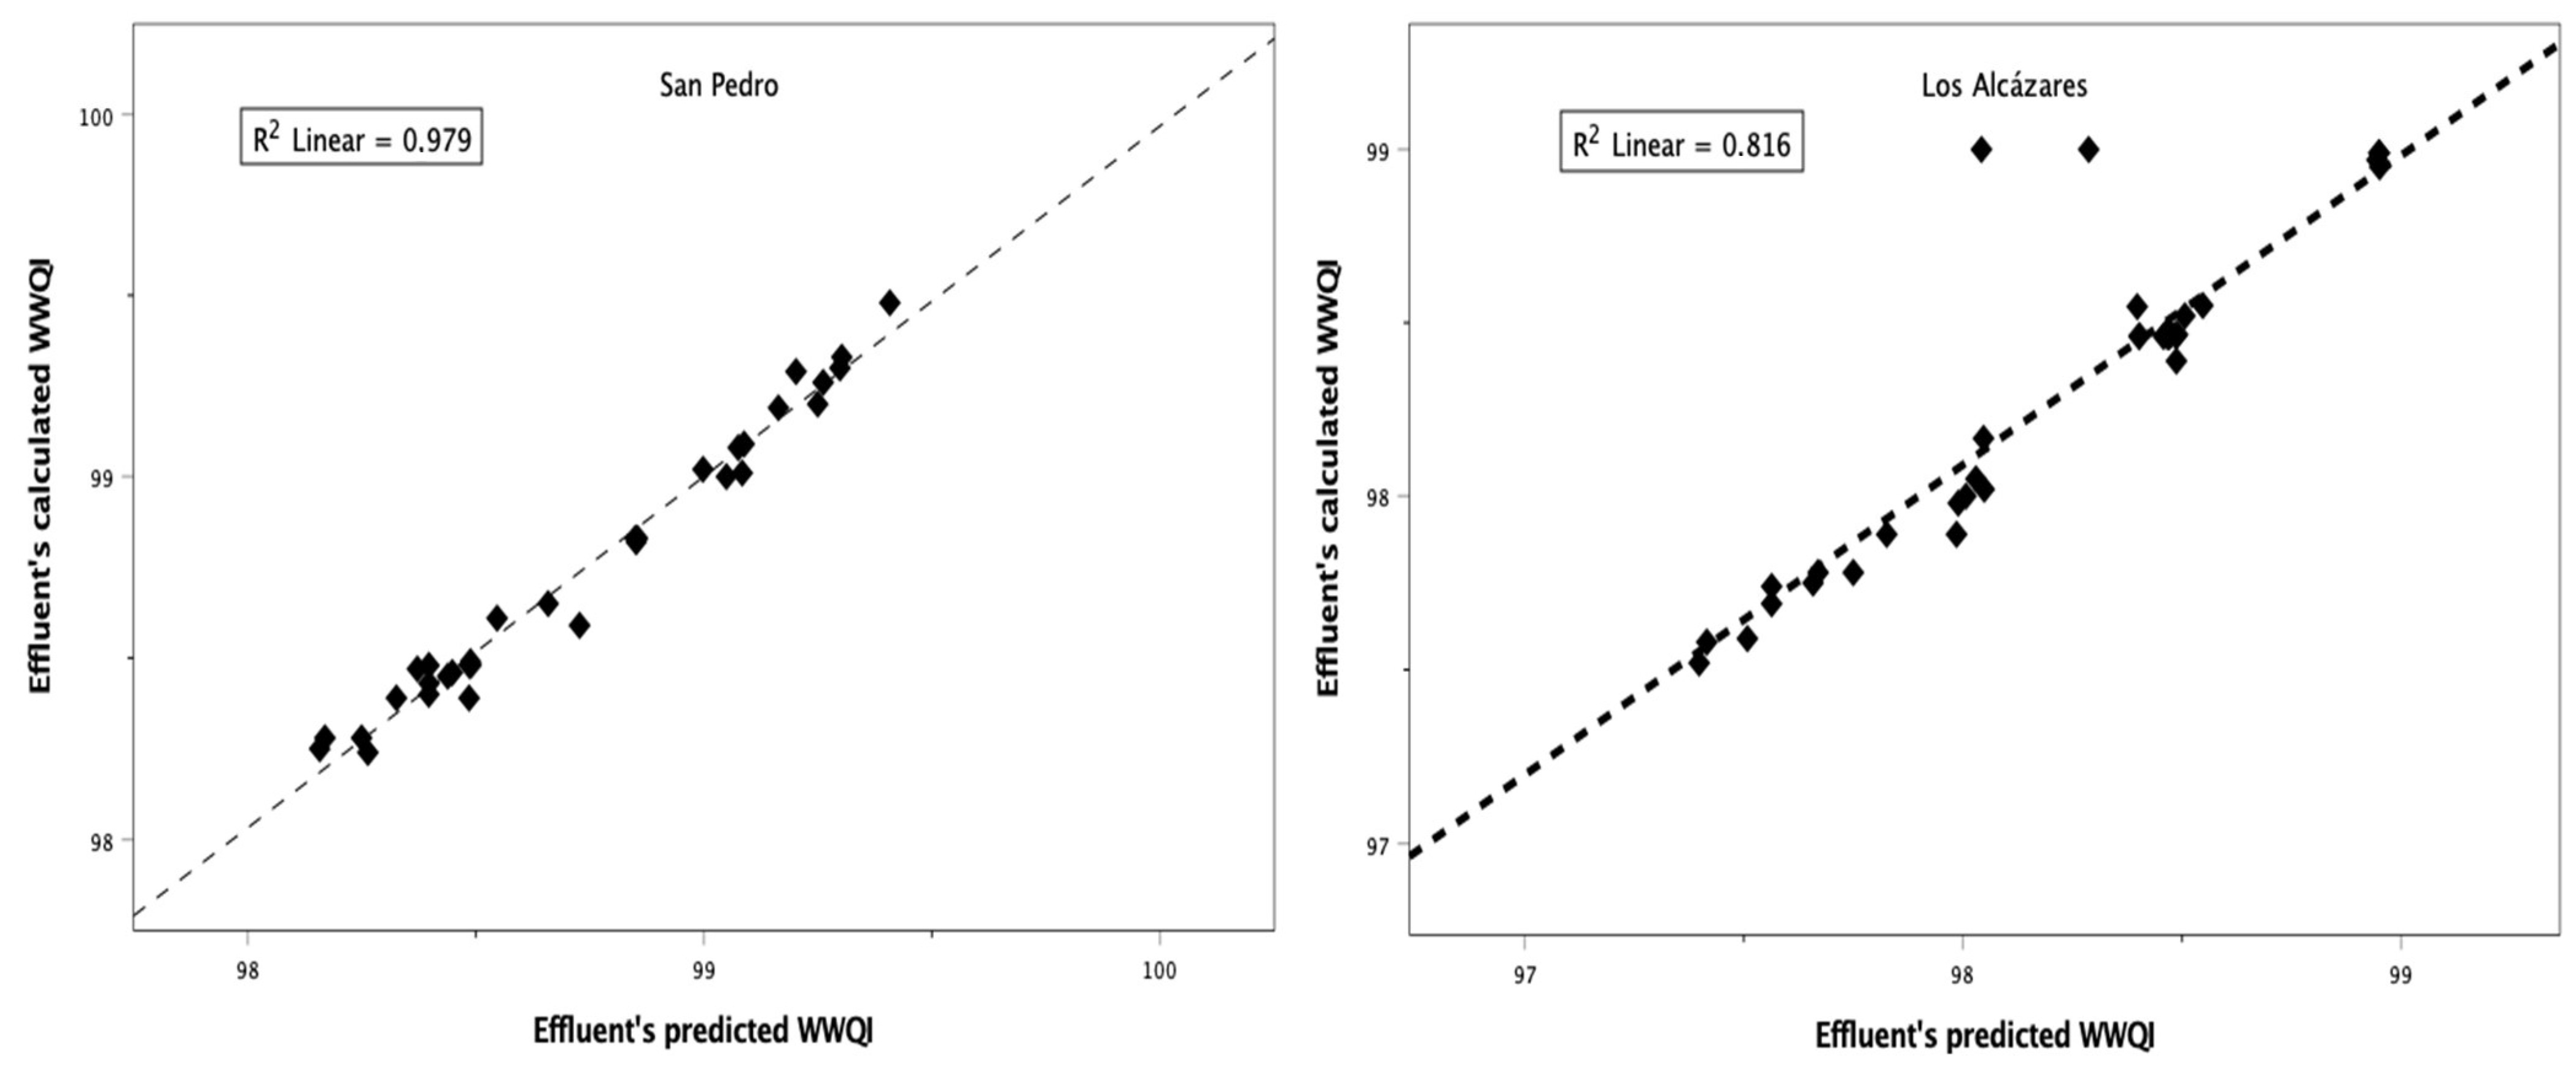
After analysis of the model dataset, the results confirmed a high accuracy, ranging from 74.3% to 97.9%, whereas the RMSE (root mean square error of predicted scores) = 7.06 represented a higher value for the influent WWQI model fitted with the test dataset. At the same time, in a scatter model with the training dataset, it was observed that the plot of the coefficient of determination also showed that the scatter points were more aggregated around the fit line, suggesting that the prediction point of the influent WWQI model was closer to the calculated value (Figure 4). Overall, however, we can confirm that there is high accuracy, suggesting that all the data were suitable for these models.
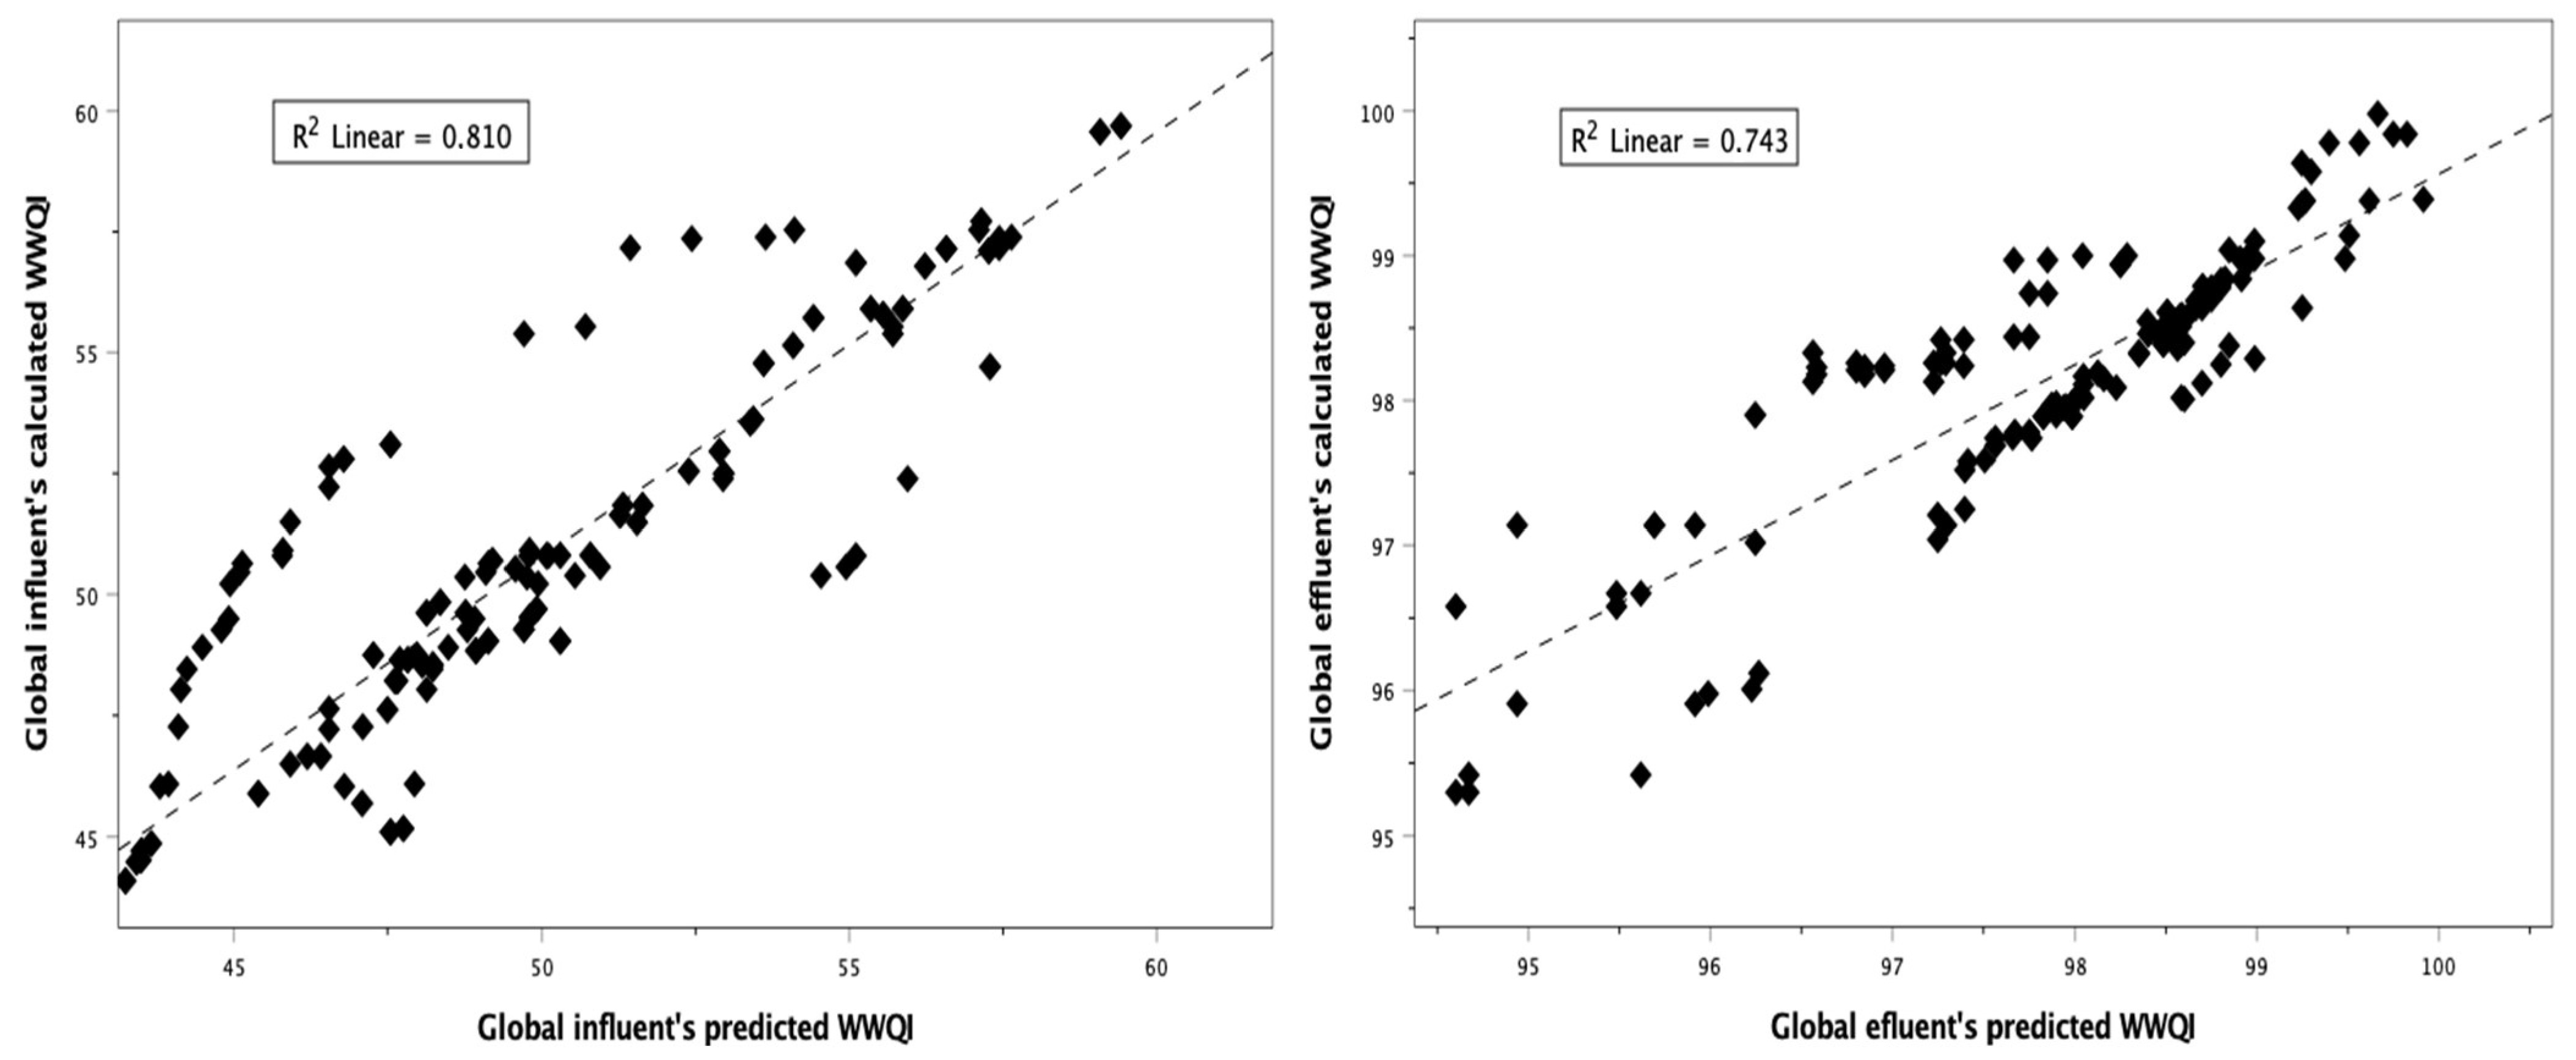
As can be seen from the scatter plots (Figure 5) of the calculated and predicted global values, there are many scatter points that are well fitted and clustered, indicating that all data were suitable for this model, which can serve as a reference for global data processing, especially for large amounts of data and provide better results.
4. Conclusions
This study has focused on the assessment of wastewater quality using statistical techniques. In order to develop a simple and reliable WWQI prediction method that would provide a better estimation of the overall quality of raw and treated wastewater in 4 WWTPs, a significant number of parameter data were integrated into a single score. High accuracy of the overall model developed indicates that the model performed well and could be used to predict the WWQI of WWTPs as a whole and provide better results. As expected, in the development of the WWQI, the influent of the plant has a low rate. However, after treatment, all effluent flows were in satisfactory compliance with the established discharge standards. These calculated rates were therefore in the range of 95 and 100, indicating that they could be discharged into the surrounding water bodies. Furthermore, in addition to the prediction of wastewater quality, the numerical description of the quality of water flows such as TSS, TN, TP and BOD5 using empirical expressions could be used as a first approximation for the modeling of a wastewater treatment process at any WWTP, which will certainly help to minimize the negative impact generated by the reuse of these water resources in agricultural areas with water scarcity. Similarly, these methodological tools can contribute to restore, as far as possible, the quantity and quality of groundwater in overexploited and degraded coastal aquifers.
Supplementary Materials
The following supporting information can be downloaded at: https://www.mdpi.com/article/10.3390/w15081520/s1, Table S1. Descriptive statistics for AL-influent (i) and -effluent (e) parameters. Table S2. Descriptive statistics for MO-influent (i) and -effluent (e) parameters. Table S3. Descriptive statistics for LZ-influent (i) and -effluent (e) parameters. Table S4. Descriptive statistics for SP-influent (i) and -effluent (e) parameters. Table S5. Pearson correlation matrix of different variables of AL-WWTP. Table S6. Pearson correlation matrix of different variables of MO-WWTP. Table S7. Pearson correlation matrix of different variables of LZ-WWTP. Table S8. Pearson correlation matrix of different variables of SP-WWTP.
Author Contributions
Conceptualization, A.E.A. and N.V.; Formal analysis, A.E.A., J.M.N., N.V. and R.M.; Investigation, A.E.A., N.V., R.M. and J.M.N.; Methodology, A.E.A., J.M.N., N.V. and R.M.; Resources, A.E.A., J.M.N., N.V. and R.M.; Software, A.E.A., J.M.N., N.V. and R.M.; Visualization, A.E.A.; Supervision, N.V.; Validation, A.E.A., N.V., R.M. and J.M.N.; Writing—original draft preparation, A.E.A., J.M.N., N.V. and R.M.; Writing—review and editing, A.E.A., N.V., R.M. and J.M.N. All authors have read and agreed to the published version of the manuscript.
Funding
This paper is the result of the research carried out under the project Enhanced Portable Sensor for Water Quality Monitoring moving to genuinely integrated Water Resource Management-ECOSENS AQUAMONITRIX-LIFE is co-funded by the LIFE Program of the European Union under contract number LIFE17 ENV/IE/000237.
Data Availability Statement
For privacy reasons, backup data cannot be made publicly available.
Acknowledgments
The authors are grateful to the Entity of Sanitation and Wastewater Treatment of the Region of Murcia (ESAMUR) for their partial support of this work.
Conflicts of Interest
The authors declare that they have no known competing financial interests or personal relationships that could have appeared to influence the work reported in this paper.
References
- Margenat, A.; Matamoros, V.; Diez, S.; Canameras, N.; Comas, J.; Bayona, J.M. Occurrence of chemical contaminants in peri-urban agricultural irrigation waters and assessment of their phytotoxicity and crop productivity. J. Sci. Total Environ. 2017, 599–600, 1140–1148. [Google Scholar] [CrossRef] [PubMed]
- Archer, E.; Petrie, B.; Kasprzyk-Hordern, B.; Wolfaardt, G. The fate of pharmaceuticals and personal care products (PPCPs), Endocrine Disrupting Contaminants (EDCs), Metabolites and illicit drugs in a WWTW and environmental waters. Chemosphere 2017, 174, 437–446. [Google Scholar] [CrossRef]
- Rivera-Utrilla, J.; Sánchez-Polo, M.; Ferro-García, M.A.; Prados-Joya, G.; Ocampo-Pérez, R. Pharmaceuticals as emerging contaminants and their removal from water. A review. Chemosphere 2013, 93, 1268–1287. [Google Scholar] [CrossRef] [PubMed]
- Saleh, I.A.; Zouari, N.; Al-Ghouti, M.A. Removal of pesticides from water and wastewater: Chemical. physical and biological treatment approaches. Environ. Technol. Innov. 2020, 19, 101026. [Google Scholar] [CrossRef]
- Rout, P.R.; Zhang, T.C.; Bhunia, P.; Surampalli, R.Y. Treatment technologies for emerging contaminants in wastewater treatment plants: A review. Sci. Total Environ. 2021, 753, 141990. [Google Scholar] [CrossRef] [PubMed]
- Soto-Verjel, J.; Maturana, A.Y.; Villamizar, S.E. Advanced catalytic oxidation coupled to biological systems to treat pesticide contaminated water: A review on technological trends and future challenges. Water Sci. Technol. 2022, 85, 1263–1294. [Google Scholar] [CrossRef]
- Avella, A.C.; Görner, T.; Yvon, J.; Chappe, P.; Guinot-Thomas, P.; De Donato, P. A combined approach for a better understanding of wastewater treatment plants operation: Statistical analysis of monitoring database and sludge and sludge physico-chemical characterization. Water Res. 2011, 45, 981–992. [Google Scholar] [CrossRef]
- Lefkir, A.; Maachou, R.; Bermad, A.; Khouider, A. Factorization of physico chemical parameters of activated sludge process using the principal component analysis. Desalination Water Treat. 2016, 57, 20292–20297. [Google Scholar] [CrossRef]
- Tchobanoglous, G.; Burton, F.L. Wastewater engineering. Management 1991, 7, 4. [Google Scholar]
- Boyacioglu, H. Development of a water quality index based on a European classification scheme. Water SA 2007, 33, 101–106. [Google Scholar] [CrossRef] [Green Version]
- Rosen, C.; Lennox, J. Multivariate and multiscale monitoring of wastewater treatment operation. Water Res. 2001, 35, 3402–3410. [Google Scholar] [CrossRef]
- Aguado, D.; Rosen, C. Multivariate statistical monitoring of continuous wastewater treatment plants. Eng. Appl. Artif. Intell. 2008, 21, 1080–1091. [Google Scholar] [CrossRef]
- Singh, K.P.; Malik, A.; Mohan, D.; Sinha, S.; Singh, V.K. Chemometric data analysis of pollutants in wastewaterda case study. Anal. Chim. Acta 2005, 532, 15–25. [Google Scholar] [CrossRef]
- Zhang, Z.; Tao, F.; Du, J.; Shi, P.; Yu, D.; Meng, Y.; Sun, Y. Surface water quality and its control in a river with intensive human impacts- a case study of the Xiangjiang River, China. J. Environ. Manag. 2010, 91, 2483–2490. [Google Scholar] [CrossRef] [PubMed]
- Ouali, A.; Azri, C.; Medhioub, K.; Ghrabi, A. Descriptive and multivariable analysis of the physico-chemical and biological parameters of Sfax wastewater treatment plant. Desalination 2009, 246, 496–505. [Google Scholar] [CrossRef]
- Wuderlin, D.A.; Diaz, M.D.P.; Amé, M.V.; Pesce, S.F.; Hued, A.C.; Bistoni, M.L.A. Pattern recognition techniques for the evaluation of spatial and temporal variations in water quality, A case study: SuquÍa river basin (Cordoba-Argentina). Water Res. 2001, 35, 2881–2894. [Google Scholar]
- Kaiser, H.F. The varimax criteria for analytical rotation in factor analysis. Psychometrika 1958, 23, 187–200. [Google Scholar] [CrossRef]
- Cloutier, V.; Lefebvre, R.; Therrien, R.; Savard, M.M. Multivariate statistical analysis of geochemical data as indicative of the hydrogeochemical evolution of groundwater in a sedimentary rock aquifer system. J. Hydrol. 2008, 353, 294–313. [Google Scholar] [CrossRef]
- Qasaimeh, A.; Al-Ghazawi, Z. Regression modeling for rapid prediction of wastewater BOD. Desalin. Water Treat. 2020, 201, 165–172. [Google Scholar] [CrossRef]
- Sharma, P.; Sood, S.; Mishra, S.K. Development of multiple linear regression model for biochemical oxygen demand (BOD) removal efficiency of different sewage treatment technologies in Delhi, India. Sustain. Water Resour. Manag. 2020, 6, 29. [Google Scholar] [CrossRef]
- James, G.; Witten, D.; Hastie, T.; Tibshirani, R. An Introduction to Statistical Learning, 1st ed.; Springer Texts in Statistics; Springer: New York, NY, USA, 2013. [Google Scholar]
- Jolliffe, I.T.; Cadima, J. Principal component analysis: A review and recent developments. Phil. Trans. R. Soc. A 2016, 374, 20150202. [Google Scholar] [CrossRef] [Green Version]
- Johnstone, I.M.; Titterington, D.M. Statistical challenges of high-dimensional data. Phil. Trans. R. Soc. A 2009, 367, 4237–4253. [Google Scholar] [CrossRef] [Green Version]
- Rastogi, G.K.; Sinha, D. A novel approach to water quality management through correlation study. J. Environ. Res. Dev. 2011, 5, 1029–1035. [Google Scholar]
- Lebart, L.; Morineau, A.; Fenelon, J.P. Traitement des données statistiques (methodes et programmes); Dunod Editeur: Malakoff, Paris, 1979; 510p. [Google Scholar]
- Gallagher, N.B.; Wise, B.M.; Butler, S.W.; White, D.D.; Barna, G.G. Development and Benchmarking of Multivariate Statistical Process Control Tools for a Semiconductor Etch Process: Improving Robustness through Model Updating. IFAC Symp. Ser. 1997, 30, 79–84. [Google Scholar] [CrossRef] [Green Version]
- Bayo, J.; Lopez-Castellanos, J. Principal factor and hierarchical cluster analyses for the performance assessment of an urban wastewater treatment plant in the Southeast of Spain. Chemosphere 2016, 155, 152–162. [Google Scholar] [CrossRef] [PubMed]
- Costa, J.; Alves, M.; Ferreira, E. Principal component analysis and quantitative image analysis to predict effects of toxics in anaerobic granular sludge. Bioresour. Technol. 2009, 100, 1180–1185. [Google Scholar] [CrossRef] [PubMed] [Green Version]
- Durmusoglu, E.; Yilmaz, C. Evaluation and temporal variation of raw and pretreated leachate quality from an active solid waste landfill. Water. Air. Soil Pollut. 2006, 171, 359–382. [Google Scholar] [CrossRef]
- Goode, C.; LeRoy, J.; Allen, D. Multivariate statistical analysis of a high rate biofilm process treating kraft mill bleach plant effluent. Water Sci. Technol. 2007, 55, 47–55. [Google Scholar] [CrossRef]
- Platikanov, S.; Rodriguez-Mozaz, S.; Huerta, B.; Barcelo, D.; Cros, J.; Batle, M.; Poch, G.; Tauler, R. Chemometrics quality assessment of wastewater treatment plant effluents using physicochemical parameters and UV absorption measurements. J. Environ. Manag. 2014, 140, 33–44. [Google Scholar] [CrossRef]
- Sun, Y.; Chen, Z.; Wu, G.; Wu, Q.; Zhang, F.; Niu, Z.; Hu, H.-Y. Characteristics of water quality of municipal wastewater treatment plants in China: Implications for resources utilization and management. J. Clean. Prod. 2016, 131, 1–9. [Google Scholar] [CrossRef] [Green Version]
- Tomita, R.K.; Park, S.W.; Sotomayor, O.A. Analysis of activated sludge process using statistical tools—A PCA approach. Chem. Eng. J. 2002, 90, 283–290. [Google Scholar] [CrossRef]
- Wallace, J.; Champagne, P.; Hall, G. Multivariate statistical analysis of water chemistry conditions in three wastewater stabilization ponds with algae blooms and pH fluctuations. Water Res. 2016, 96, 155–165. [Google Scholar] [CrossRef] [PubMed]
- Bordalo, A.A.; Teixeira, R.; Wiebe, W.J. A water quality index applied to an international shared river basin: The case of the Douro River. Environ. Manag. 2006, 38, 910–920. [Google Scholar] [CrossRef] [PubMed]
- Uddin, M.G.; Nash, S.; Olbert, A.I. A review of water quality index models and their use for assessing surface water quality. Ecol. Indic. 2021, 122, 107218. [Google Scholar] [CrossRef]
- APHA (American Public Health Association). Standard methods for examination of water and wastewater. In Anales de Hidrología Médica, 23rd ed.; Universidad Complutense de Madrid: Washington, DC, USA, 2012. [Google Scholar]
- Association of Official Analytical Chemists. Official Methods of Analysis of AOAC International, 16th ed.; AOAC International: Gaithersburg, MD, USA, 2019. [Google Scholar]
- Bharti, N.; Katyal, D. Water quality indices used for surface water vulnerability assessment. Int. J. Environ. Sci. 2011, 2, 154. [Google Scholar]
- Pearson, K. On lines and planes of closet fit to systems of points in space. Philos. Mag. 1901, 2, 559–572. [Google Scholar] [CrossRef] [Green Version]
- Hotelling, H. Analysis of a complex of statistical variables into principal components. J. Educ. Psychol. 1933, 24, 417–441. [Google Scholar] [CrossRef]
- Chong, I.-G.; Jun, C.-H. Performance of some variable selection methods when multicollinearity is present. Chemom. Intell. Lab. Syst. 2005, 78, 103–112. [Google Scholar] [CrossRef]
- Mamun, M.; Kim, J.Y.; An, K.G. Multivariate Statistical Analysis of Water Quality and Trophic State in an Artificial Dam Reservoir. Water 2021, 13, 186. [Google Scholar] [CrossRef]
- CCME. Canadian Water Quality Guidelines for the Protection of Aquatic Life: CCME Water Quality Index. Canadian Environmental Quality Guideline; Canadian Council of Ministers of the Environment: Winnipeg, MB, USA, 2001. [Google Scholar]
- Lumb, A.; Halliwell, D.; Sharma, T. Application of CCME Water Quality Index to monitor water quality: A case study of the Mackenzie River basin. Canada. Environ. Monit. Assess. 2006, 113, 411–429. [Google Scholar] [CrossRef]
- De Rosemond, S.; Duro, D.C.; Dube, M. Comparative analysis of regional water quality in Canada using the Water Quality Index. Environ. Monit. Assess. 2009, 156, 223–240. [Google Scholar] [CrossRef] [PubMed]
- Hurley, T.; Sadiq, R.; Mazumder, A. Adaptation and evaluation of the Canadian Council of Ministers of the Environment Water Quality Index (CCME WQI) for use as an effective tool to characterize drinking source water quality. Water Res. 2012, 46, 3544–3552. [Google Scholar] [CrossRef] [PubMed]
- Khan, A.A.; Paterson, R.; Khan, H. Modification and application of the Canadian Council of Ministers of the environment water quality index for the communication of drinking water quality data in Newfoundland and Labrador. Water Qual. Res. J. Can. 2004, 39, 285–293. [Google Scholar] [CrossRef] [Green Version]
Figure 1.
Location of four WWTPs in Murcia, SE Spain.

Figure 2.
Temporal variation of average monthly influent (i) parameters.

Figure 3.
Temporal variation of average monthly effluent (e) parameters.


Figure 4.
Scatter plots of calculated and predicted values of WWQI.


Figure 5.
Scatter plots of calculated and predicted global WWQI values.


Table 1.
Characteristics of WWTPs.
| Flow Rate in Million Gallons Day (mgd) | |||||
|---|---|---|---|---|---|
| WWTP (*) | Population Served | Design Flow | Flow Treated | Effluent Uses | Technology Used (**) |
| AL | 41,966 | 3 | 1.5 | Irrigation | CAS + DS + C + F + SF + UV |
| MO | 69,785 | 6 | 4 | Irrigation & Public domain | CAS + EA + C + F + SF + UV |
| LZ | 16,891 | 5 | 1.5 | Irrigation | CAS + EA + C + F + SF + UV |
| SP | 26,152 | 4.4 | 2 | Public domain | CAS + MBR + UV |
Note(s): (*) Source: Elaboration based on ESAMUR (2021), (**) CAS: Conventional Activated Sludge; EA: Extended Aeration. C: Coagulation; F: Floculation; DS: Double Stage; SF: Sand Filtres; MBR: Bioreactor Membranes; UV: Ultraviolet.
Table 2.
WWQI classification and wastewater quality assessment.
| WWQI | ||||
|---|---|---|---|---|
| Excellent | Good | Fair | Marginal | Poor |
| 95–100 | 80–94 | 65–79 | 45–64 | 0–44 |
| Very close to natural or pristine levels | Rarely depart from natural or desirable levels | Sometimes depart from natural or desirable levels | Often depart from natural or desirable levels | Quality is almost always threatened or impaired |
| WWTP | Influent | Effluent | ||
| Score | Category | Score | Category | |
| AL | 45–60 | Marginal | 95–100 | Excellent |
| MO | 44–60 | Marginal | 96–100 | Excellent |
| LZ | 45–60 | Marginal | 97–100 | Excellent |
| SP | 45–60 | Marginal | 98–100 | Excellent |
Table 3.
Rotated component matrix with factor loadings (>0.4).
| AL | Principal Component a | MO | Principal Component b | ||||||||
|---|---|---|---|---|---|---|---|---|---|---|---|
| PC1 | PC2 | PC3 | PC4 | PC5 | PC1 | PC2 | PC3 | PC4 | PC5 | ||
| pHi | −0.56 | 0.45 | 0.79 | ||||||||
| ECi | −0.78 | 0.84 | |||||||||
| TSSi | 0.69 | 0.90 | |||||||||
| CODi | 0.92 | 0.86 | |||||||||
| TNi | 0.88 | 0.89 | |||||||||
| TPi | 0.69 | 0.83 | |||||||||
| BODi | 0.91 | 0.85 | |||||||||
| DOCi | 0.88 | 0.68 | |||||||||
| pHe | -0.85 | 0.77 | 0.47 | ||||||||
| ECe | −0.44 | 0.49 | −0.45 | −0.44 | −0.44 | 0.81 | |||||
| TSSe | 0.50 | −0.76 | |||||||||
| CODe | 0.42 | 0.71 | 0.78 | ||||||||
| TNe | 0.73 | −0.76 | |||||||||
| TPe | 0.55 | 0.70 | |||||||||
| BODe | 0.90 | 0.53 | |||||||||
| DOCe | 0.68 | 0.42 | 0.48 | ||||||||
| Eigenv | 6.18 | 2.37 | 1.73 | 1.50 | 1.27 | 5.19 | 2.87 | 2.29 | 1.76 | 1.43 | |
| Var (%) | 34.32 | 13.17 | 9.61 | 8.32 | 7.03 | 28.82 | 15.93 | 12.73 | 9.79 | 7.93 | |
| Cum (%) | 34.32 | 47.49 | 57.10 | 65.41 | 72.44 | 28.82 | 44.75 | 57.48 | 67.27 | 75.20 | |
| LZ | Principal Component c | SP | Principal Component d | ||||||||
| PC1 | PC2 | PC3 | PC4 | PC5 | PC1 | PC2 | PC3 | PC4 | PC5 | ||
| pHi | 0.90 | 0.90 | |||||||||
| ECi | −0.66 | 0.94 | |||||||||
| TSSi | 0.86 | 0.56 | 0.56 | ||||||||
| CODi | 0.77 | 0.86 | |||||||||
| TNi | 0.63 | 0.68 | 0.76 | ||||||||
| TPi | 0.74 | −0.45 | 0.78 | ||||||||
| BODi | 0.91 | 0.61 | |||||||||
| DOCi | 0.65 | 0.64 | −0.57 | 0.54 | |||||||
| pHe | 0.95 | 0.86 | |||||||||
| ECe | −0.83 | 0.93 | |||||||||
| TSSe | 0.86 | 0.59 | |||||||||
| CODe | 0.68 | −0.69 | 0.48 | ||||||||
| TNe | 0.55 | −0.60 | −0.68 | ||||||||
| TPe | 0.70 | 0.60 | |||||||||
| BODe | 0.83 | −0.65 | |||||||||
| DOCe | −0.77 | 0.68 | |||||||||
| Eigenv | 6.62 | 3.17 | 1.82 | 1.69 | 1.31 | 3.85 | 3.17 | 2.31 | 2.09 | 1.42 | |
| Var (%) | 36.79 | 17.58 | 10.13 | 9.36 | 7.29 | 21.39 | 17.62 | 12.82 | 11.61 | 7.87 | |
| Cum (%) | 36.79 | 54.37 | 64.50 | 73.86 | 81.15 | 21.39 | 39.01 | 51.83 | 63.44 | 71.31 | |
Note(s): a Rotation converged in 9 iterations; b Rotation converged in 8 iterations. c Rotation converged in 7 iterations; d Rotation converged in 7 iterations.
Table 4.
Predictive statistical models of the raw and treated wastewater quality index.
| WWTP | Numerical Expression | R2 | RMSE | |
|---|---|---|---|---|
| Data | ||||
| Train | Train | Test | ||
| AL | 0.903 | 2.15 | 7.06 | |
| 0.907 | 1.20 | 1.36 | ||
| MO | 0.952 | 0.67 | 2.20 | |
| 0.927 | 0.04 | 0.17 | ||
| LZ | 0.782 | 0.24 | 3.29 | |
| 0.909 | 0.05 | 0.29 | ||
| SP | 0.816 | 0.20 | 0.68 | |
| 0.979 | 0.01 | 0.02 | ||
| GL * | 0.810 | 0.84 | 1.51 | |
| 0.743 | 0.08 | 0.10 | ||
Note(s): * GL: Global.
Disclaimer/Publisher’s Note: The statements, opinions and data contained in all publications are solely those of the individual author(s) and contributor(s) and not of MDPI and/or the editor(s). MDPI and/or the editor(s) disclaim responsibility for any injury to people or property resulting from any ideas, methods, instructions or products referred to in the content. |
© 2023 by the authors. Licensee MDPI, Basel, Switzerland. This article is an open access article distributed under the terms and conditions of the Creative Commons Attribution (CC BY) license (https://creativecommons.org/licenses/by/4.0/).
Share and Cite
MDPI and ACS Style
El Aatik, A.; Navarro, J.M.; Martínez, R.; Vela, N. Estimation of Global Water Quality in Four Municipal Wastewater Treatment Plants over Time Based on Statistical Methods. Water 2023, 15, 1520. https://doi.org/10.3390/w15081520
AMA Style
El Aatik A, Navarro JM, Martínez R, Vela N. Estimation of Global Water Quality in Four Municipal Wastewater Treatment Plants over Time Based on Statistical Methods. Water. 2023; 15(8):1520. https://doi.org/10.3390/w15081520
Chicago/Turabian StyleEl Aatik, Abderrazak, Juan Miguel Navarro, Ramón Martínez, and Nuria Vela. 2023. "Estimation of Global Water Quality in Four Municipal Wastewater Treatment Plants over Time Based on Statistical Methods" Water 15, no. 8: 1520. https://doi.org/10.3390/w15081520
Note that from the first issue of 2016, this journal uses article numbers instead of page numbers. See further details here.