1. Introduction
Freshwater aquaculture is an important and integral part of the European agriculture sector. The total volume of EU freshwater aquaculture was 319,000 tons in 2018. The freshwater sector employs approximately 10,000 people. The most important producers in terms of value are France (14%), Denmark (12%) and Italy (12%). The common carp (
Cyprinus carpio Linnaeus, 1758) is an important species produced primarily in Central and Eastern Europe, where Poland and Czech Republic alone have a share of more than 50% of total EU production [
1]. Between the years 2014 and 2020 the mean annual production of the common carp in the European Union was 57,434 tons, with Poland having the main share at 33%, followed by the Czech Republic (31%), Hungary (20%) and Germany (8%) [
2]. Aquaculture production in Central Europe, including the Czech Republic, is generally characterized by extensive and semi-intensive fish farming in ponds. Common carp are predominantly fed with natural food with supplementary feeding with cereals, representing 25–50% of total production; additionally, the prospects of organic carp pond farming have been explored in Europe. [
3]. Common carp pond farming is the oldest known form of European aquaculture [
4]. Fish pond farming dates back to the early medieval period (with the first documented fish pond being established in 1115 AD) and has supplied a significant proportion of dietary protein since its rise to prominence in the late 15th century. In many areas, the origins of the existing Czech pond systems date back to the 15th or 16th century, and for centuries, these ponds have played a fundamental role in landscape water management, such as water retention and flood prevention, and in the preservation and protection of biodiversity [
5]. Many of these ponds are rainfed or dependent on small streams or springs. In these ponds, low flow makes it impossible to maintain quality or temperature using cooler and oxygen-richer stream water. In many cases, streams that are used as water sources for ponds are loaded with treated water from sewage treatment plants upstream, which are still rich in nutrients. Inputting water with higher temperatures results in the water quality deteriorating easily. The Food and Agriculture Organization (FAO) has determined that there are 52,000 ha available for fish farming in the Czech Republic, 41,000 ha of which are used for fish production. Most ponds are farmed for carp accompanied by other species (herbivorous fish, predatory fish species, tench, etc.). Market carp weight is reached at the age of 3–5 years. Stocking density is determined by the amount of natural production in a pond and a desired increment rate. Increasing production is achieved through the artificial feeding of grains or feed mixtures based on cereals, i.e., carbohydrate feed with a 12–13% protein content (in the absence of natural food, maximum 18%). The share increase in feeding is typically 50% of total production. The daily feed rations are typically 0.1 to 4.5% of the total fish body weight and depend on the quality of the water. The fertilization of ponds is frequent and is aimed at supporting the development and optimization of natural food particles and regulating hydrochemical parameters. Both organic and inorganic fertilizers are used as sources of fertilization in the ponds. The average production is approximately 450 kg per ha, with individual farms ranging between 200 and 800 kg per ha. Current carp pond management practice (which includes fertilization and supplementary feeding), together with the influence of agriculture and human settlements, has led to the majority of ponds in Central Europe being considered as eutrophic to hypertrophic [
5,
6]. Annual common carp production in the Czech Republic fluctuated between 17,370 and 18,460 tons in the years 2014–2020. Common carp was the dominant fish produced (88%) [
2]. However, the production of carp is trending towards stagnation, and the entire sector is also vulnerable to the importation of cheaper fish from both neighboring European countries and Southeast Asia. Another limitation to fish pond farming is global climate change. There is increasing evidence for the effects of climate change on fish and fisheries [
7,
8,
9,
10], particularly on northern populations [
11,
12]. Fish are directly influenced by the temperature of their environment. Most physiological processes in fish are heavily influenced by temperature, including spawning, development and growth [
13]. General relationships between temperature, mortality and growth have been identified for most temperate fish species. Climatic factors, such as temperature, affect community structure and limit species distribution (e.g., northern range) [
14,
15,
16]. In terms of temperature, it is likely that the greatest impact comes from an increase in climate variability and the number of extreme hot days and heat waves. As for increases in average temperature trends, it seems likely that most problems involving heat will occur as a result of reduced water quality, oxygen levels, increased stress and associated disease, and reduced feeding and growth performance, rather than by directly exceeding the thermal tolerances of the animals involved [
10]. The thermal ranges of fishes are bounded by their critical thermal maxima and minima [
17]. However, acclimation to higher-than-ambient or near-lethal temperatures (under laboratory or natural conditions) allows fish to adjust these critical limits by a few degrees [
18,
19]. Freshwater species can be divided into warm-, cool- and cold-water species with regard to their preferred temperature conditions. Originally, these delineations were suggested for temperate fishes, which were divided into warm-water (average preferred temperature of 27–31 °C during summer), cool-water (21–25 °C) and cold-water (11–15 °C) species [
15]. Furthermore, there is an additional category that comprises very-cold-water species that live in low water temperatures (summer temperatures of less than 10 °C) at high latitudes [
20]. Temperature tolerance ranges are species-specific and include both stenothermal (narrow thermal range) species such as arctic char (
Salvelinus alpinus) and eurythermal (wide tolerance range) species such as the common carp [
21].
In the present study, the authors consider fish responses to rising temperatures, that are linked to climate change. The main objective of the study is to estimate how ongoing climate change might affect fish persistence in an environment experiencing increasing water temperature and how these alterations will impact the centuries-old traditional fish pond farming in the Czech Republic. To properly represent the diversity of fish pond environmental conditions across the region, a set of productive ponds comprising various climatic areas and various farming management methods (e.g., various farmed species) are represented in the study.
2. Materials and Methods
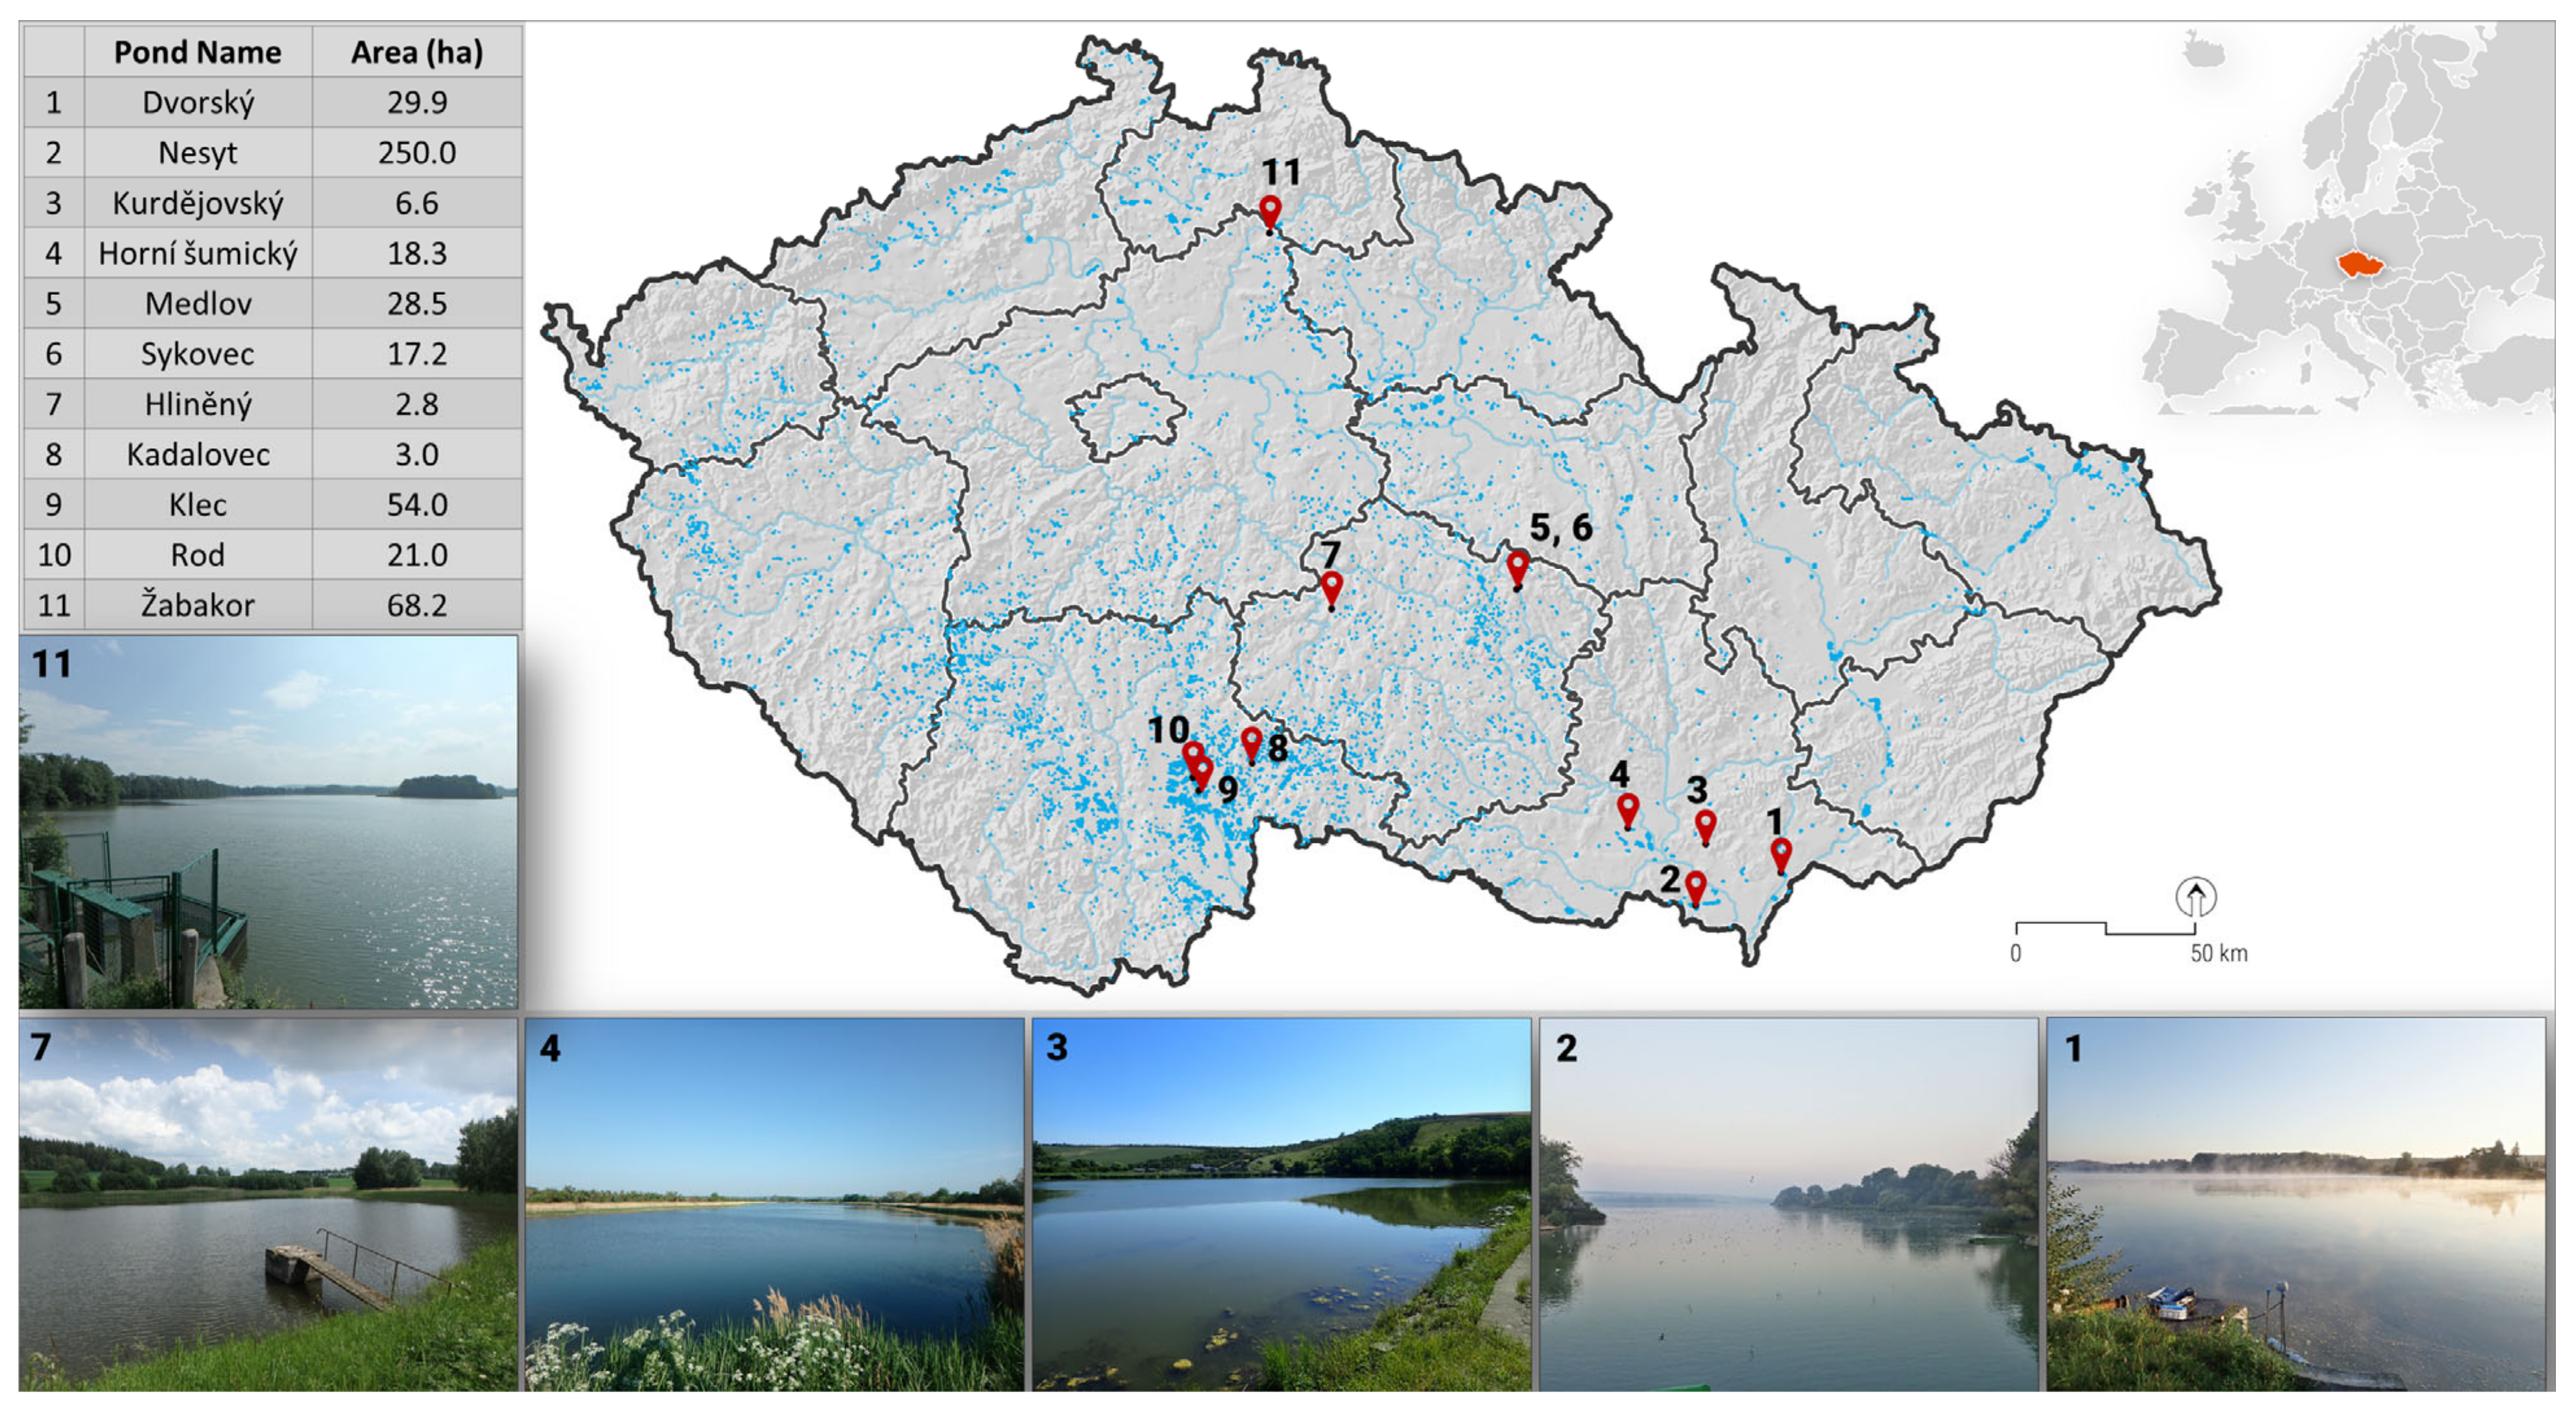
Eleven ponds from three different climatic areas and elevations ranging from 170 to 740 m a.s.l. were included in the study (
Table 1 and
Table 2,
Figure 1). The temperature in all ponds was measured on average 0.1 m below and 1 m above the surface by a Pt100 sensor connected to an automatic data logger Minikin mini data logger (EMS Minikin Ti,
www.emsbrno.cz: last access 20 February 2023) or by manual mercury-based thermometers (Medlov and Sykovec ponds), both methods having a maximum measurement error given by the manufacturer being ±0.1 °C. The measurements were taken in all ponds at least 5–10 m (depending on the size) from the bank on the free surface of the water. The daily mean of all measurements was used to calculate surface water temperature (t
sw). The automated measurements were collected hourly and the manual thermometer measurements were recorded at three daily intervals (700, 1400 and 2100).
- a.
Southern Moravia region: Nesyt, Dvorský, Kurdějovský and Šumický horní pond
Nesyt, as the largest Moravian pond (250 ha), is located app. 25 km to the southwest at an elevation of 175 m (48.776° N, 16.731° E). An intensive, one-growing-season fish farming system is present in this pond. The predominant farmed species is common carp. Complementary species are pikeperch (Sander lucioperca L.), tench, northern pike (Esox lucius L.), wels catfish (Silurus glanis L.) and grass carp (Ctenopharyngodon idella Val.). The shoreline flora is formed by common reed (Phragmites australis (Cav.) Steud.) and bulrush (Typha latifolia L.). Dvorský pond (30 ha) is located in the southeastern part of Moravia at an elevation of 170 m (48.854° N, 17.072° E). Šumický horní pond (18 ha) is nature-protected area and is located in the southern part of Moravia at an elevation of 195 m (48.980° N, 16.469° E), and Kurdějovský pond (7 ha) is located at 195 m (48.935° N, 16.777° E) being about 23 km eastern direction from Šumický horní.
- b.
Bohemian-Moravian highlands: Sykovec, Medlov and Hliněný pond
Sykovec and Medlov are located at elevations of 740 and 711 m (49.609° N, 16.038° E and 49.614° N, 16.051° E, respectively). Medlov pond (29 ha) is part of a cascade system, in which the upper Sykovec pond (17 ha) feeds into the Medlov pond. The main water source of the Sykovec pond is 250 m from the pond influx. The main Medlov source is the outflow from the Sykovec pond. In addition to their main sources, both ponds have a number of extrinsic capillary springs, are rather deep, are surrounded by coniferous trees and have extensive sandy littoral zones. In the Sykovec and Medlov ponds, a semi-intensive one-year farming system with common carp and rainbow trout (Oncorhynchus mykiss Walbaum) is present. Complementary farming species included in this system are tench, pikeperch, northern whitefish (Coregonus peled Gmelin) and maraene whitefish (Coregonus lavaretus maraena Bloch). Hliněný pond (2 ha) is located at elevations of 560 m (49.564° N, 15.298° E).
- c.
Bohemian-Moravian highlands and Southern Bohemia interface: Kadalovec pond
Kadalovec (3 ha) pond is located in South Bohemia (49.161° N, 14.980° E) at an elevation of 482 m. Due to the circuit canal, the water shift is minimal during the April–September season, and in winter the stream is retained. Two-thirds of the shoreline area is lined with a mixed stand of trees. In a one-year semi-intensive system, the common carp and pikeperch are farmed.
- d.
Southern Bohemia-Třeboň region: Klec and Rod ponds
The Třeboň region (South Bohemia 49.089° N, 14.767° E, 49.122° N, 14.744° E) contains numerous ponds with a total area of 10,165 ha and mean elevation of 410–450 m above sea level [
22]. Třeboň region represents the center of Czech pond culture (460 ponds in total). This large pond network, together with secondary formed littoral coenoses, has become a significant breeding site and migration stop for water birds. The area is also significant for its rich wetlands and water vegetation. The studied ponds belong to the Třeboňsko Protected Landscape Area, which is a UNESCO biospheric reservation. Klec (54 ha) and Rod (21 ha) fish ponds belong to the complex system of the Naděje fish ponds situated 20 km north of Třeboň (430 m a.s.l.), along the river Lužnice [
23]. The fish ponds rest on a sandy bottom derived from river alluvium. The fish ponds are shallow with an average depth of only 0.8 m. The main source of water is the Potěšilka canal, which splits from the outflow canal of Rožmberk fish pond [
24], the largest fish pond in Central Europe (489 ha). In terms of fish production, Klec fish pond is primarily used as the main fish pond for the production of marketable carp with a one-year production period. Fishery management has followed less intensive practices in Rod fish pond, which has Nature Reserve status. Rod pond is surrounded by reed growth, and floating
Glyceria provides a breeding place for birds, particularly for
Anseriformes spp. Peat bog lines the eastern side of Rod pond, providing a habitat for various endangered plants and amphibians.
- e.
Northern Bohemia: Žabakor pond
The Žabakor pond (50.546° N, 15.051° E) with total area 68 ha is located at elevation of 235 m above sea level. Established in mid-17th century and fed by Žehrovka creek, originally running through the pond but currently flowing through a separated stream bed along its northern margin. Since 1998, it has been a nature-protected area with an abundant birdlife.
- f.
Site-specific analysis
The observed daily surface water temperature data and daily meteorological data for the ambient air temperature were used for the process of developing and verifying a daily surface water temperature equation. The model equation was based on the assumption that the temperature of the surface layer of water (depth 0.1 m) is linearly proportional to the moving average daily air temperature with a certain time delay. For the development and verification of the model, the statistical software R was used [
25] with a package DEoptim [
26,
27], which iteratively (200x in one run proved to be a sufficient number) searched for the combination of four parameters that lead to the result with the lowest RMSE. The first parameter is the width of the window for calculating the moving average of air temperature (1–50 days), the second parameter is the time shift (delay), after which the change in air temperature is reflected in the change in water temperature (0–50 days), the third and fourth are parameters a, b of the linear equation y = a * x + b; (x = moving average of air temperature with time shift). First, the model was set to find the best fitting parameters for each individual lake separately to evaluate the range of parameters found and the RMSE achieved at different locations (RMSE of 0.73–1.70 °C). In the next step, the model was parametrized for the best fit across all eight ponds, aiming for the lowest RMSE (2.09 °C). In the last step, only the period May–October was used for model parameterization, as the model accuracy is targeted for the period with the highest water temperatures. The best fitting window width for the moving average was found to be five days, the time delay was one day and the resulting equation parameters y = 2.120 + 1.021 * td
5, resulted in an average RMSE of 1.95 (1.18–2.98 °C) across all ponds. The model was validated on an independent dataset comprised of three ponds: Kurdějovský (
n = 144), Šumický horní (
n = 260) and Sykovec (
n = 1300).
Whitefish is a species-rich genus of mostly cold-water benthivores that grow optimally at water temperatures between 13 and 18 °C [
28], while higher temperatures above 22 °C impair growth [
29] and temperatures above 26 °C are lethal [
30] for several coregonid species. Northern whitefish tolerates temperatures up to 27–28 °C; however, it is feasible only when oxygen saturation is well above 70%. The optimum temperature range for juvenile carp growth rate is between 20–25 °C [
31,
32], while for adult specimens, up to 27 °C is reported as the optimum temperature [
33]. Oyugi, Cucherousset, Baker and Britton [
32] placed the maximum feeding rate for carp between 24 and 28 °C. However, these studies also noted that the upper threshold of this maximum feed rate holds only with sufficient oxygen content.
Therefore, we set the critical temperature thresholds combining the literature review, field measurements, expert judgement and observation of several critical events by the study authors. Based on the present trophic levels observed in most of the Czech ponds (eutrophic to hypertrophic), load of organic compounds (
Table 2), oxygen content and pH, the critical threshold was placed 3–5 °C lower than the literature survey indicated, which is reflected in
Table 3.
The temperature threshold had to be reached for several consecutive days. We specifically focused on:
- i.
The mean length of the continuous periods with surface water temperatures above the threshold appropriate for the fish species in each modeled decade;
- ii.
The number of continuous periods 3 days in length (maraene whitefish and rainbow trout) and 5 days in length (common carp and northern whitefish) with surface water temperatures above the appropriate threshold in each modeled decade;
- iii.
The number of days within the continuous periods that are 3 and 5 days in length with surface water temperatures above the threshold per year.
After the model validation, the model was used to predict productivity in fisheries under climate change, which was performed at both the level of selected ponds and for the entire region.
- g.
Observed climate data
As inputs for the study, long-term measurements of daily meteorological data from 268 climatological and 787 precipitation measuring stations of the Czech Hydrometeorological Institute were used. This dataset consists of all relevant weather variables, such as daily average, 1400 maximum and minimum temperature (°C); daily average relative humidity (%); precipitation (mm·day
−1); global solar radiation (MJ-m
−2·day
−1) and wind speed (m·s
−1), from the national drought monitoring system (
www.intersucho.cz: last access 20 February 2023), available for the entire Czech Republic with daily weather data interpolated into 500 × 500 m grids [
34]. Daily data are interpolated by kriging regression, which uses geographic coordinates, elevation and other terrain characteristics as predictors. The average minimum distance between two neighboring stations is approximately 22 km for variables measured at climatological stations and less than 10 km for variables measured at precipitation stations [
35]. Rainfall was measured from 7:00 a.m. on a given date to 7:00 a.m. the following day. All other weather parameters were measured continuously each day. For each pond, the air temperature data were estimated based on the grids covered by that pond.
- h.
Climate change scenarios
For detailed insight towards the end of the 21st century and under various circumstances of socio-economic development captured by different SSP scenarios, “classic” CMIP GCM climate projections were used. The daily data of 18 simulations of 17 GCMs were acquired from the Earth System Grid Federation data nodes. Majority of simulations were available in 100 km nominal resolution. One GCM has a 50 km nominal resolution. The remaining GCMs were run in a coarse setting of ca. 250 km resolution. For CMIP6 GCMs, climate models were validated in order to find suitable outputs for the Czech Republic. The used validation metrics included (1) the distance from GCM ensemble mean for the air temperature, (2) the average correlation of the annual cycle and (3) spatial correlation. Metrics were processed for several meteorological parameters, such as daily minimum, maximum and mean temperatures, global radiation, relative humidity, wind speed and precipitation. For the 50 km resolution, not all SSP scenarios were available, that is why 100 km simulations were preferred. For all selected models of CMIP6-ScenarioMIP simulations, downscaling was processed for SSP scenarios 1–2.6, 2–4.5, 3–7.0 and 5–8.5, representing different socio-economic development pathways and including future development of anthropogenic emissions of greenhouse gasses and aerosols [
36]:
SSP1-2.6: Sustainable pathway
SSP2-4.5: “Middle of the Road” scenario: Degradation of environmental systems, but some improvements concerning resource and energy use
SSP3-7.0: “Regional Rivalry“ and conflicts allowing for only small economic development
SSP5-8.5: “Fossil-fueled Development”
For the Czech Republic, the final selection of models is as follows: CMCC-ESM2, EC-EARTH, GFDL-ESM4, MPI-ESM1-2-HR, MRI-ESM2-0 and TAIESM1. Climate model simulations cannot be directly used for local simulations and impact studies. For this reason, it is necessary to either correct climate change simulations to remove systematic error or transform the observed series so that the changes between the observed and transformed series correspond to the changes in the climate model simulation. The second mentioned approach is called “delta method” and is traditionally used in the Czech Republic for modeling the impacts of climate change as it is more robust compared to the use of corrected simulations. For use in the daily step, it is advisable to apply transformations that consider not only changes in averages but also variability. This is made possible, for example, by the Advanced Delta Change (ADC) method. The ADC method makes it possible to include changes in variability in the transformation. This simply means that the extremes can change differently to those of the average. When deriving precipitation changes from the ADC climate model, the method also considers systematic simulation errors. Since the temperature is transformed linearly, systematic error has no effect on the resulting temperature transformation.
Precipitation is transformed using the following relationship
where P* is transformed precipitation, P observed precipitation, P
90 is the 90% quantile of precipitation, subscripts C and F indicate simulated data for the control period and simulated data for the scenario period, respectively. a and b are transformation parameters that are derived for 7-day blocks, which guarantee seasonal variability in changes. A linear transformation for values above P
90 prevents the occurrence of unrealistically high values, which are, relatively, often the result of a nonlinear transformation for P > P
90 and b > 1. For precipitation higher than the 90% quantile of precipitation in a given month, the threshold value E = P − P
90 is calculated.
The temperature transformation is performed in the ADC method as follows
where T* is the transformed temperature, T is the observed mean temperature, TC and TF are the mean monthly temperature for the control climate model simulation and the scenario climate model simulation, respectively, and
σC and
σF are the daily temperature standard deviations for the control and scenario periods in the climate model simulation, respectively. Similar to precipitation, the transformation parameters are smoothed. Other meteorological variables (solar radiation, relative humidity and wind speed) are modified by multiplication with a ratio of standard deviations for the control and scenario periods in the climate model simulations. The transformation parameters are smoothed as well. Station data that are used as input are applied in the form of technical series, i.e., records without errors, homogenized and with filled gaps and then interpolated as described above.
3. Results
The dependence of daily surface water temperatures on the five-day air temperature mean with one-day delay was shown for each pond, with certain variations in the strength of this relationship (
Table 2). This high correlation justified the incorporation of the five-day air temperature mean into the equation to determine the surface water temperature. A five-day moving average with one-day delay was found to be the best fitting mode equation, resulting in a mean RMSE of 2.26 (1.75–2.56 °C) across the eight ponds used for calibration and 2.78 °C for the three independent ponds left for validation.
The present study used the following model to express surface water temperature:
where t
sw is the daily mean surface water temperature and t
5dm is the five-day mean of the air temperature.
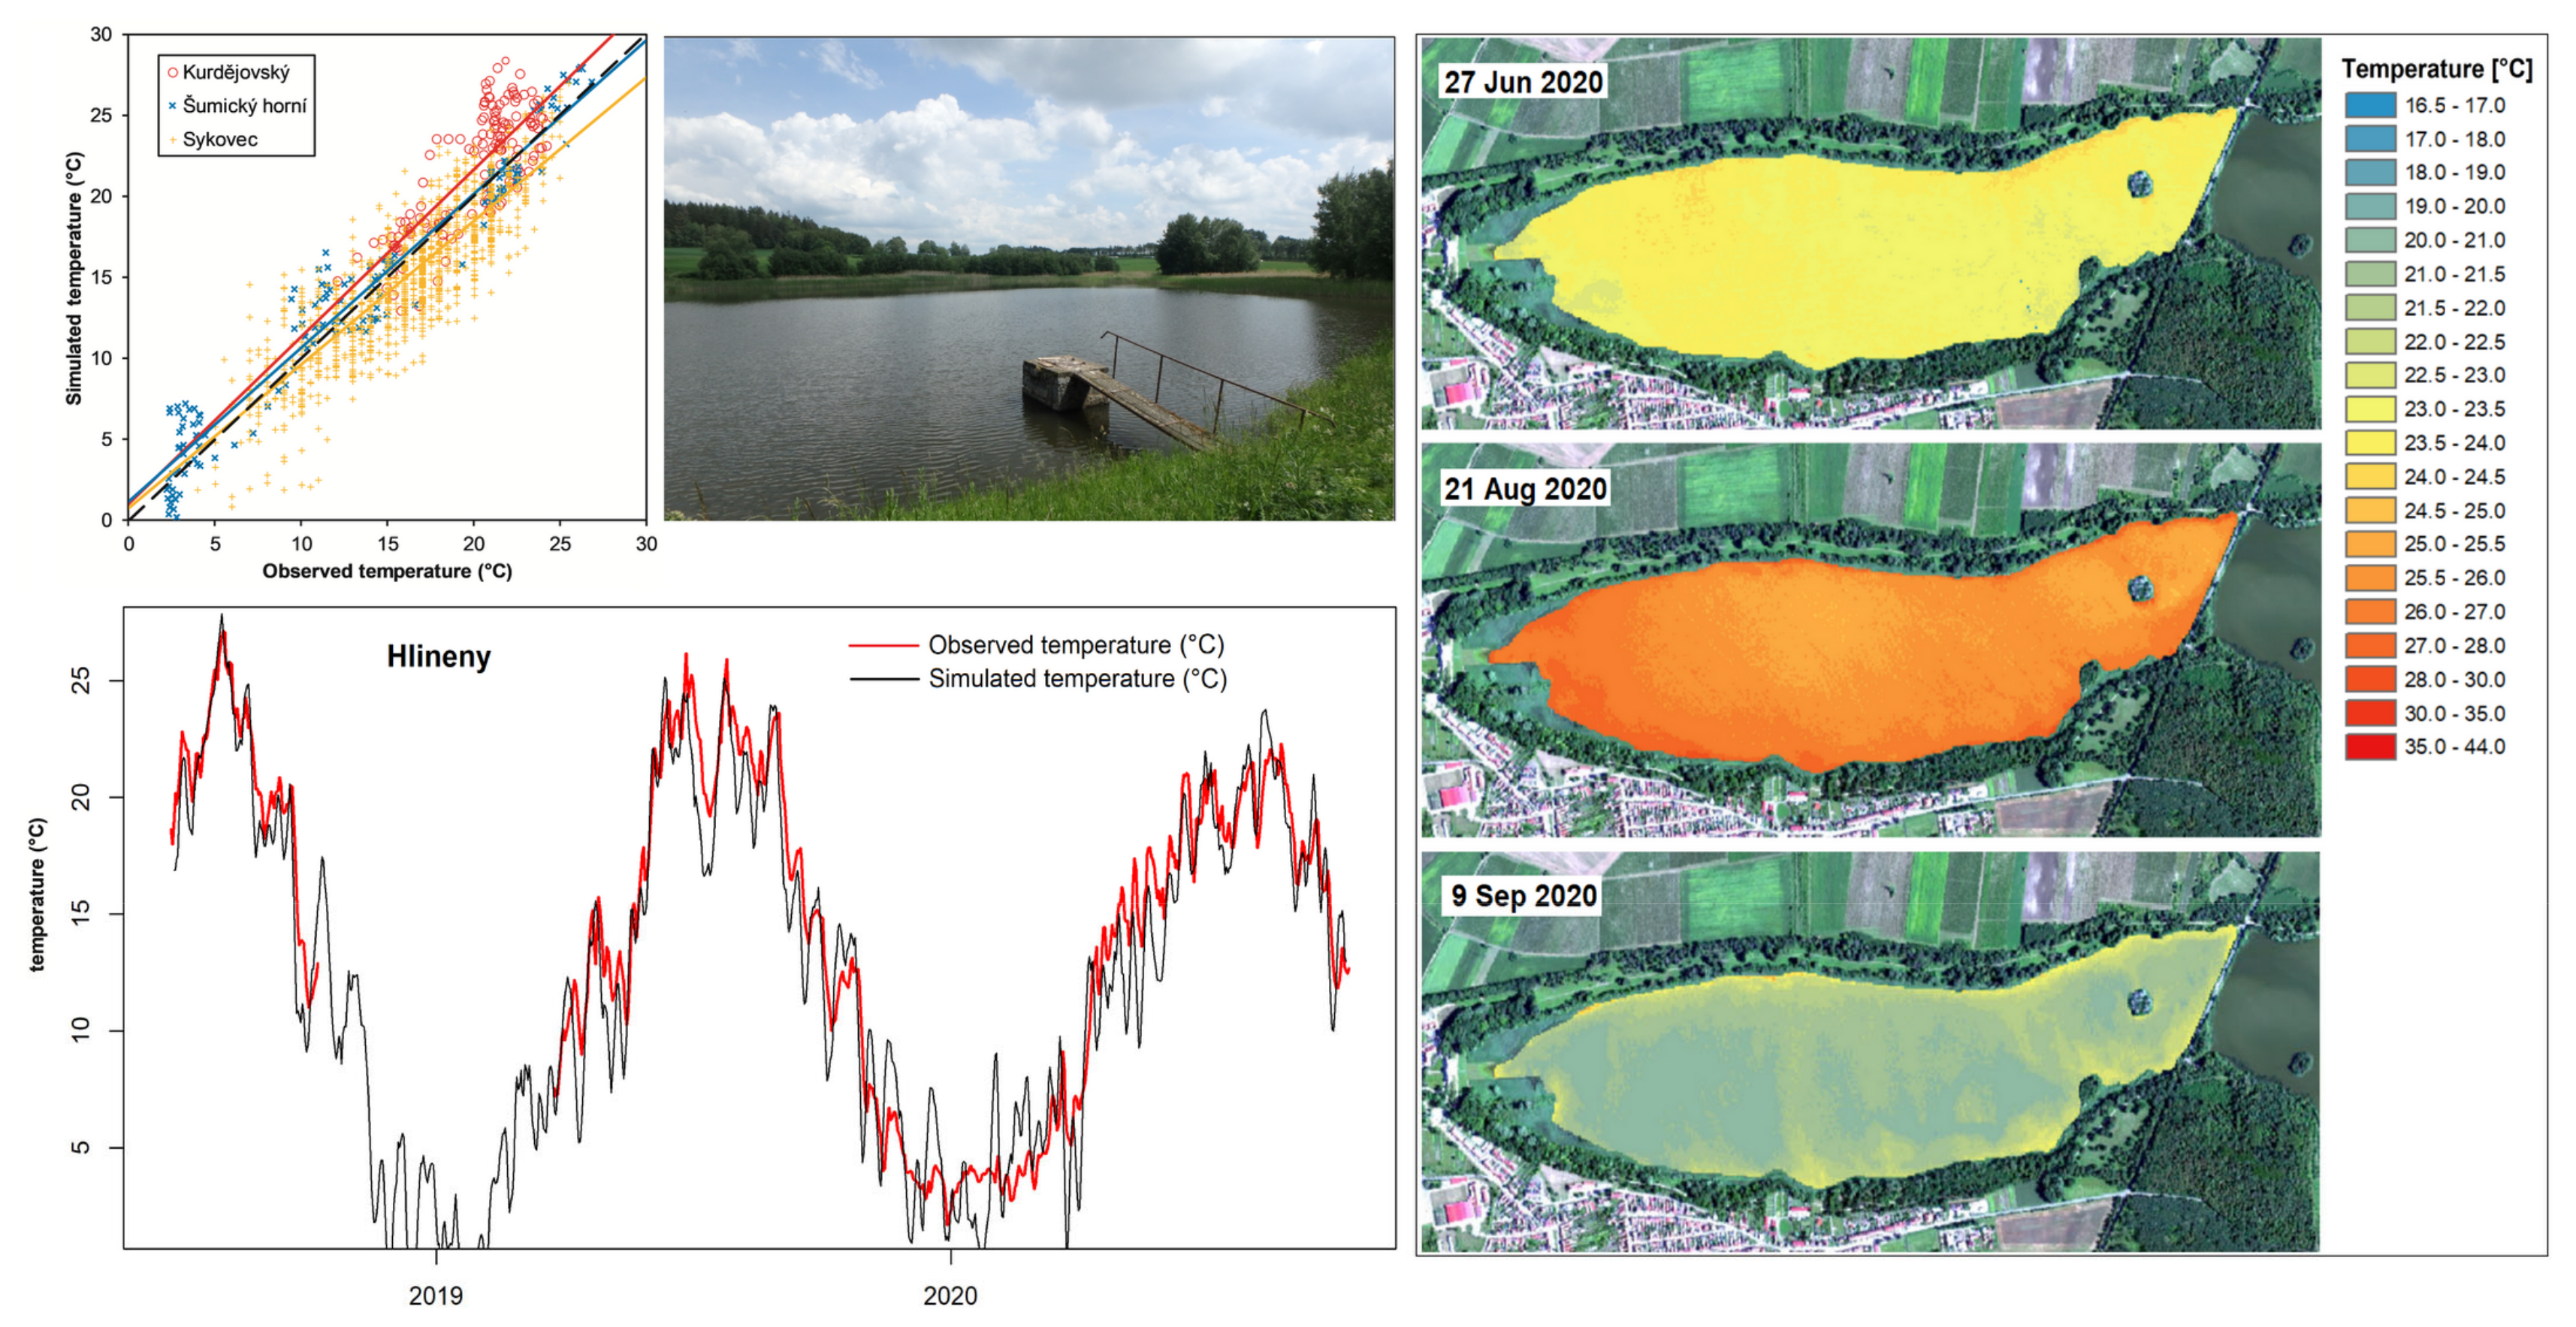
The RMSE ranged from 1.75 to 2.78 °C, and the correlation coefficient from 0.79 to 0.96 (
Table 4). Graphical presentations of the comparisons between the measured and modeled surface water temperatures are shown in
Figure 2 as a time series from Hliněný pond. The scatter plot on the top left depicts the results of an independent validation of the model, based on three ponds, Kurdějovský, Šumický horní and Sykovec (
Table 4). The right panel of
Figure 2 also demonstrates the high uniformity of the surface temperature across the pond area with the overall spatial difference between the warmest and coldest spot being less than 1.5 °C.
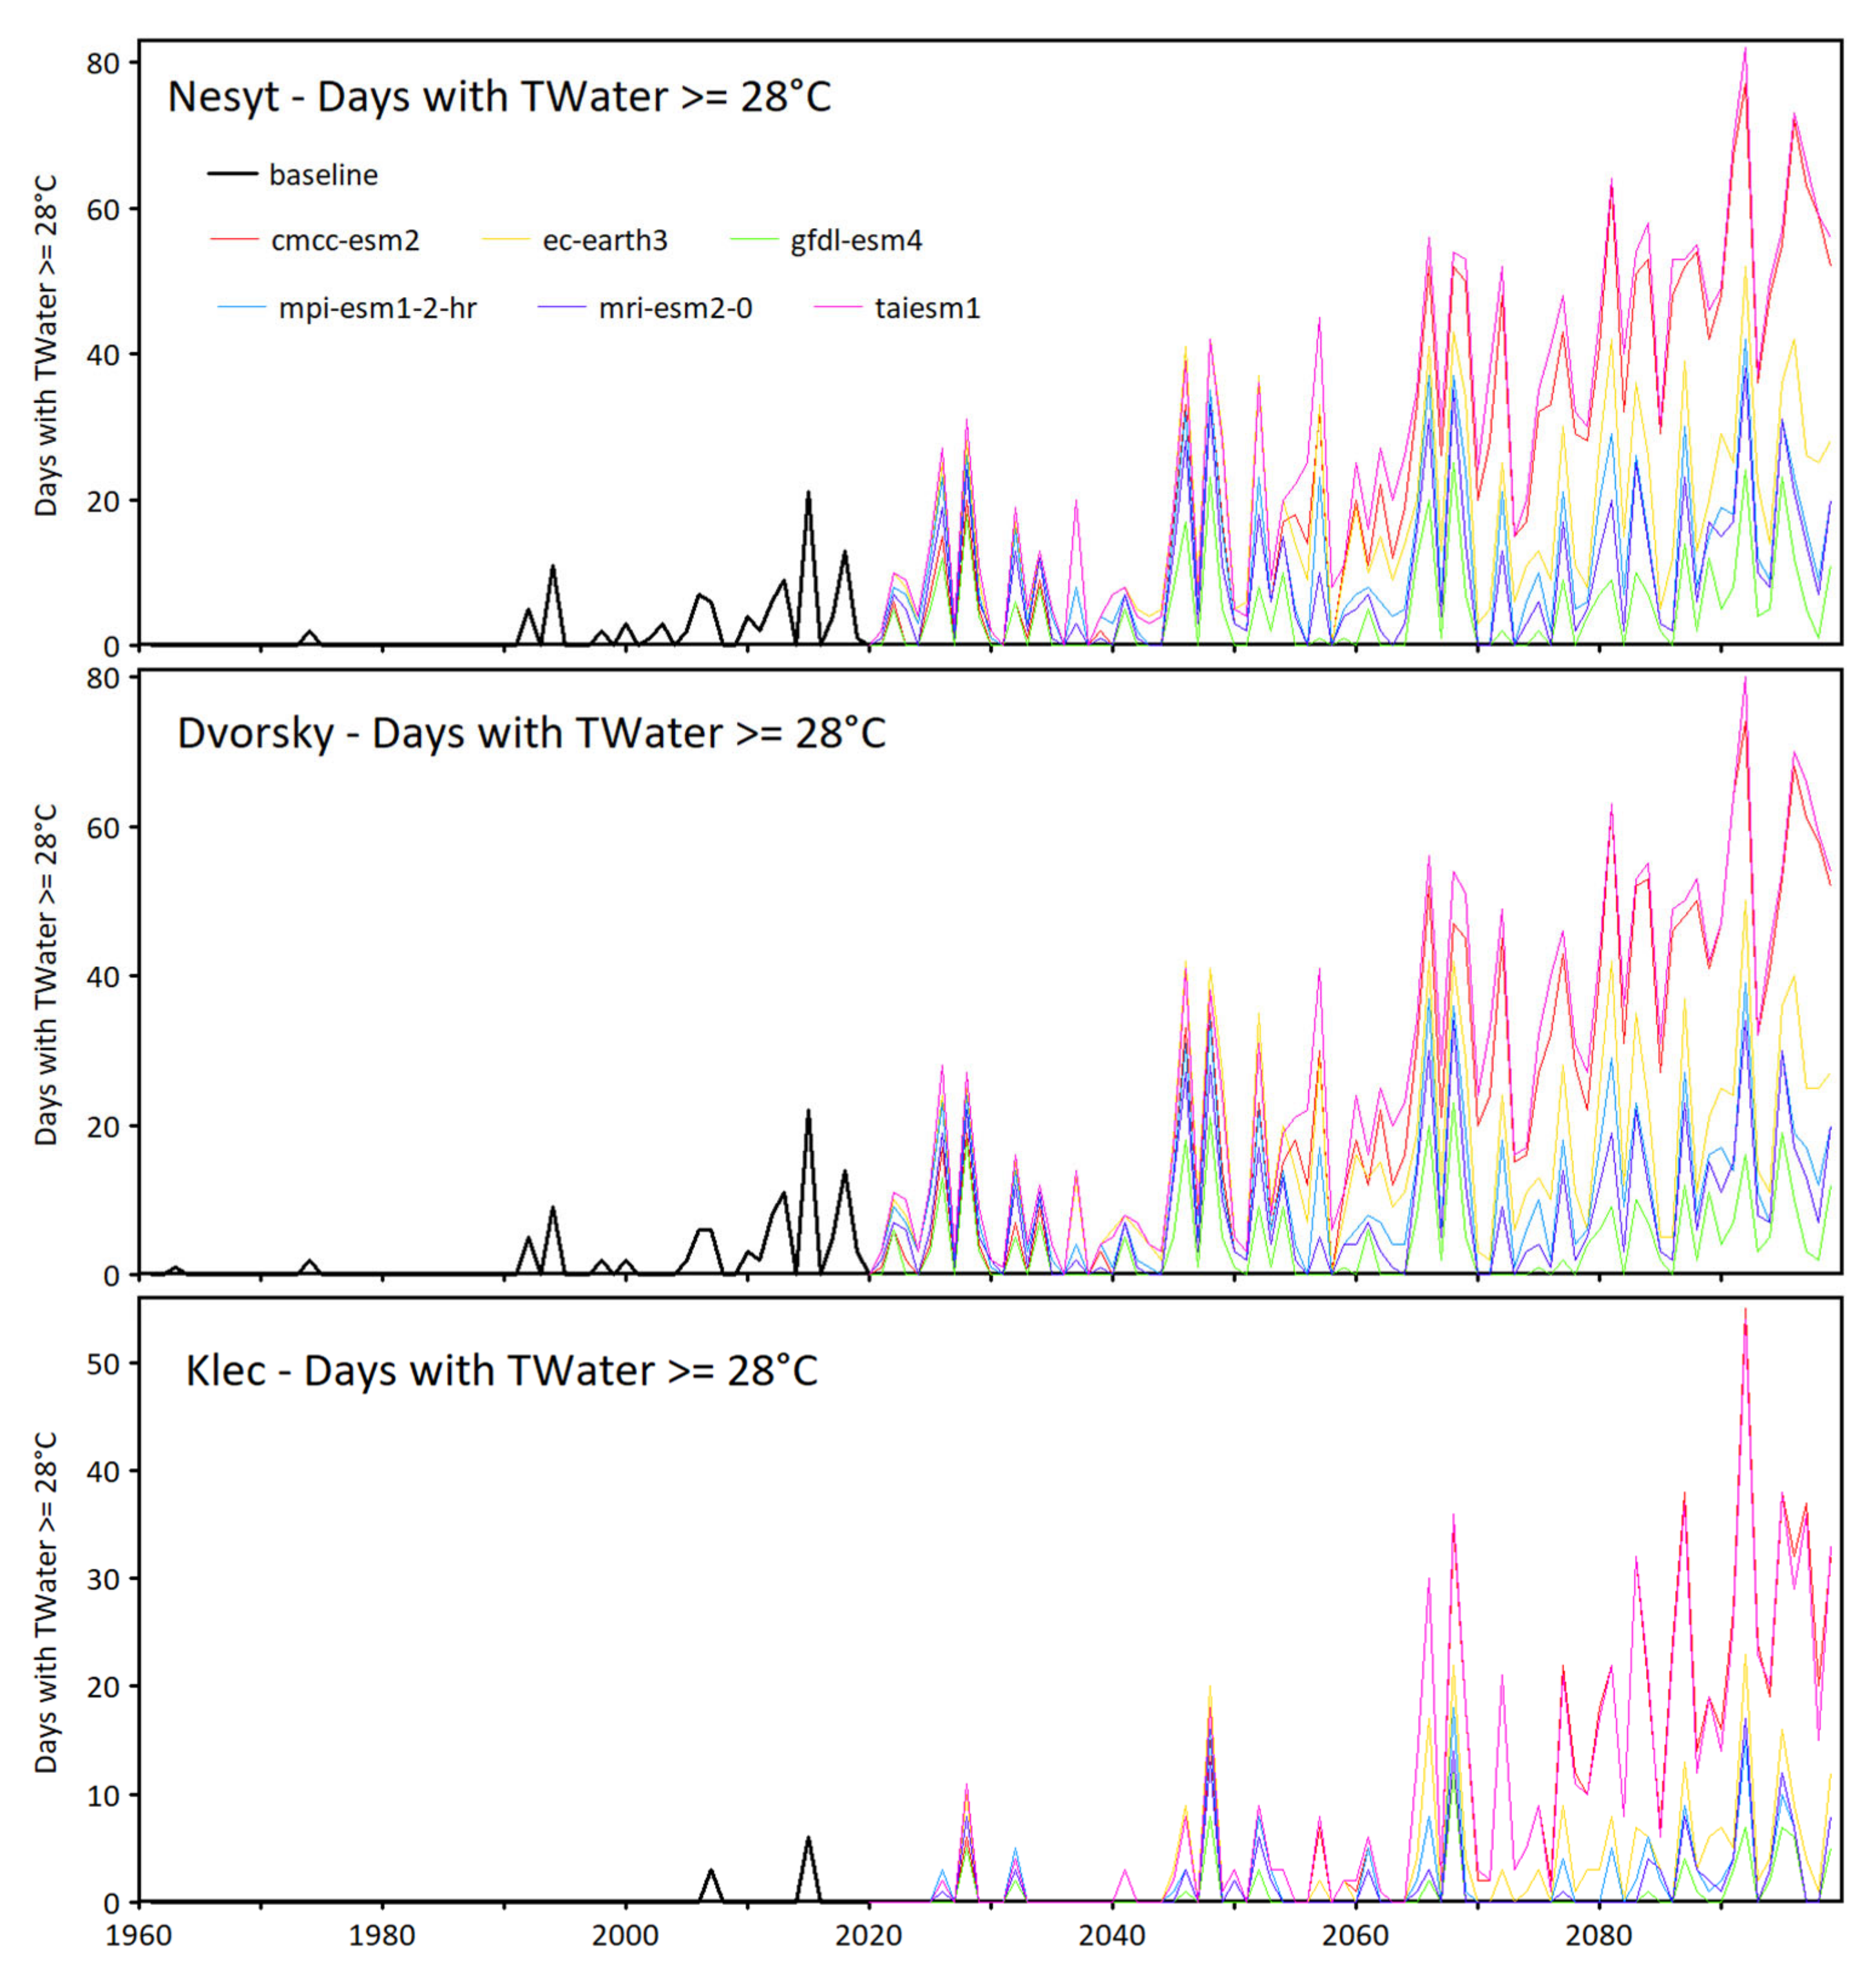
The results of the model using the climate change meteorological dataset estimated increasing surface water temperatures in all fish production areas as shown in
Figure 3 for three representative ponds: Nesyt and Dvorsky, which are typical representatives of South Moravian lowland ponds (elevation 175 and 170 m a.s.l., respectively), and Klec pond located at a higher elevation (430 m a.s.l.), which is typical for a South Bohemian production area. Before the year 2000, there was a very rare occurrence of days with water temperatures above 28 °C (challenging for carp), ranging from zero to about 20 days per year at maximum, which was more pronounced in the case of the Nesyt and Dvorský lowland ponds due to their low elevation, and was almost nonexistent in the case of Klec pond in higher elevations. However, there is a steep increase in the overall number of days with water temperatures above 28 °C after 2020 for lowland ponds, from about 20 days in 2020 to almost double in 2040. After the year 2040, the increase is evident even for the Klec pond, and rises steadily towards the end of the 21st century. After the year 2050, there is more variation in the projected values given by the different GCMs used.
Spatial analysis of days with water temperatures above 29.1 °C between 1981 and 2100 is depicted in
Figure 4. The period 1981–2020 is based on observed weather data, while the period 2020–2099 represents the median value from the ensemble of six GCM models and four emission scenarios. It can clearly be seen that there is a progressive increase in the occurrence of water temperatures exceeding 29.1 °C from 1981–1990 (
Figure 4a) towards the end of the 21st century (
Figure 4h). Although before the year 1980 (during the period 1961–1980) no such days occurred, for the period 2035–2064, more than 20 such days are projected for the South Moravia region (Dvorský, Nesyt, Kurdějovský and Šumický horní ponds). This progressive water temperature trend is most significant in the South Moravia region; however, it is also detected in the later periods after the mid-21st century in other regions. For the common carp in South Moravia, the median of the scenarios modeled is characterized by up to 25 days with surface water temperatures above the threshold temperature of 29.1 °C. In South Bohemia, the predicted number of days above this threshold is approximately half that of South Moravia. In the latter period, 2055–2084, Northern Bohemia also becomes affected, while Southern Moravia is expected to suffer more than 40 such days annually. The only exception to this pattern seems to be the South Bohemia region (Klec and Rod ponds) and Bohemian-Moravian highlands (Medlov, Sykovec and Hliněný ponds), where the threat during the 2035–2064 period is less serious due to the higher elevations at which these ponds are located.
A much bigger increase is predicted in the last decade recorded in the Bohemian-Moravian highlands (Medlov pond) for rainbow trout and northern whitefish farming (100 and 50 days). Moreover, the Bohemian-Moravian highlands is the region where there have been days with surface water temperatures above the threshold for farmed fish under current climate conditions. In such years, the increased water temperature has resulted in lower fish productivity due to the lower intensity of fish feeding.
The final part of the study consisted of detailed regional analysis. As the temperature threshold for carp was defined based on only a few literature sources, the alternative approach was used. The model was used to define the daily surface water temperatures in all 500
× 500 grids that represent ponds with an area greater than 1 ha, i.e., 9030 grids over the period 1961–2020. Two 30-year periods, i.e., 1961–1990 and 1981–2010, were used to determine the critical temperature threshold. The threshold was set as 99.99 percentile of daily April–September surface water temperatures in each of the two reference periods leading to 27.1 °C (1961–1990) and 29.1 °C (1981–2010) thresholds, fitting well with the literature-based threshold. It can be assumed that no fish pond would be situated in an area affected by extremely high temperatures by a responsible owner. Here only the estimates based on the 1981–2010 period are presented as these represent the worst case scenario.
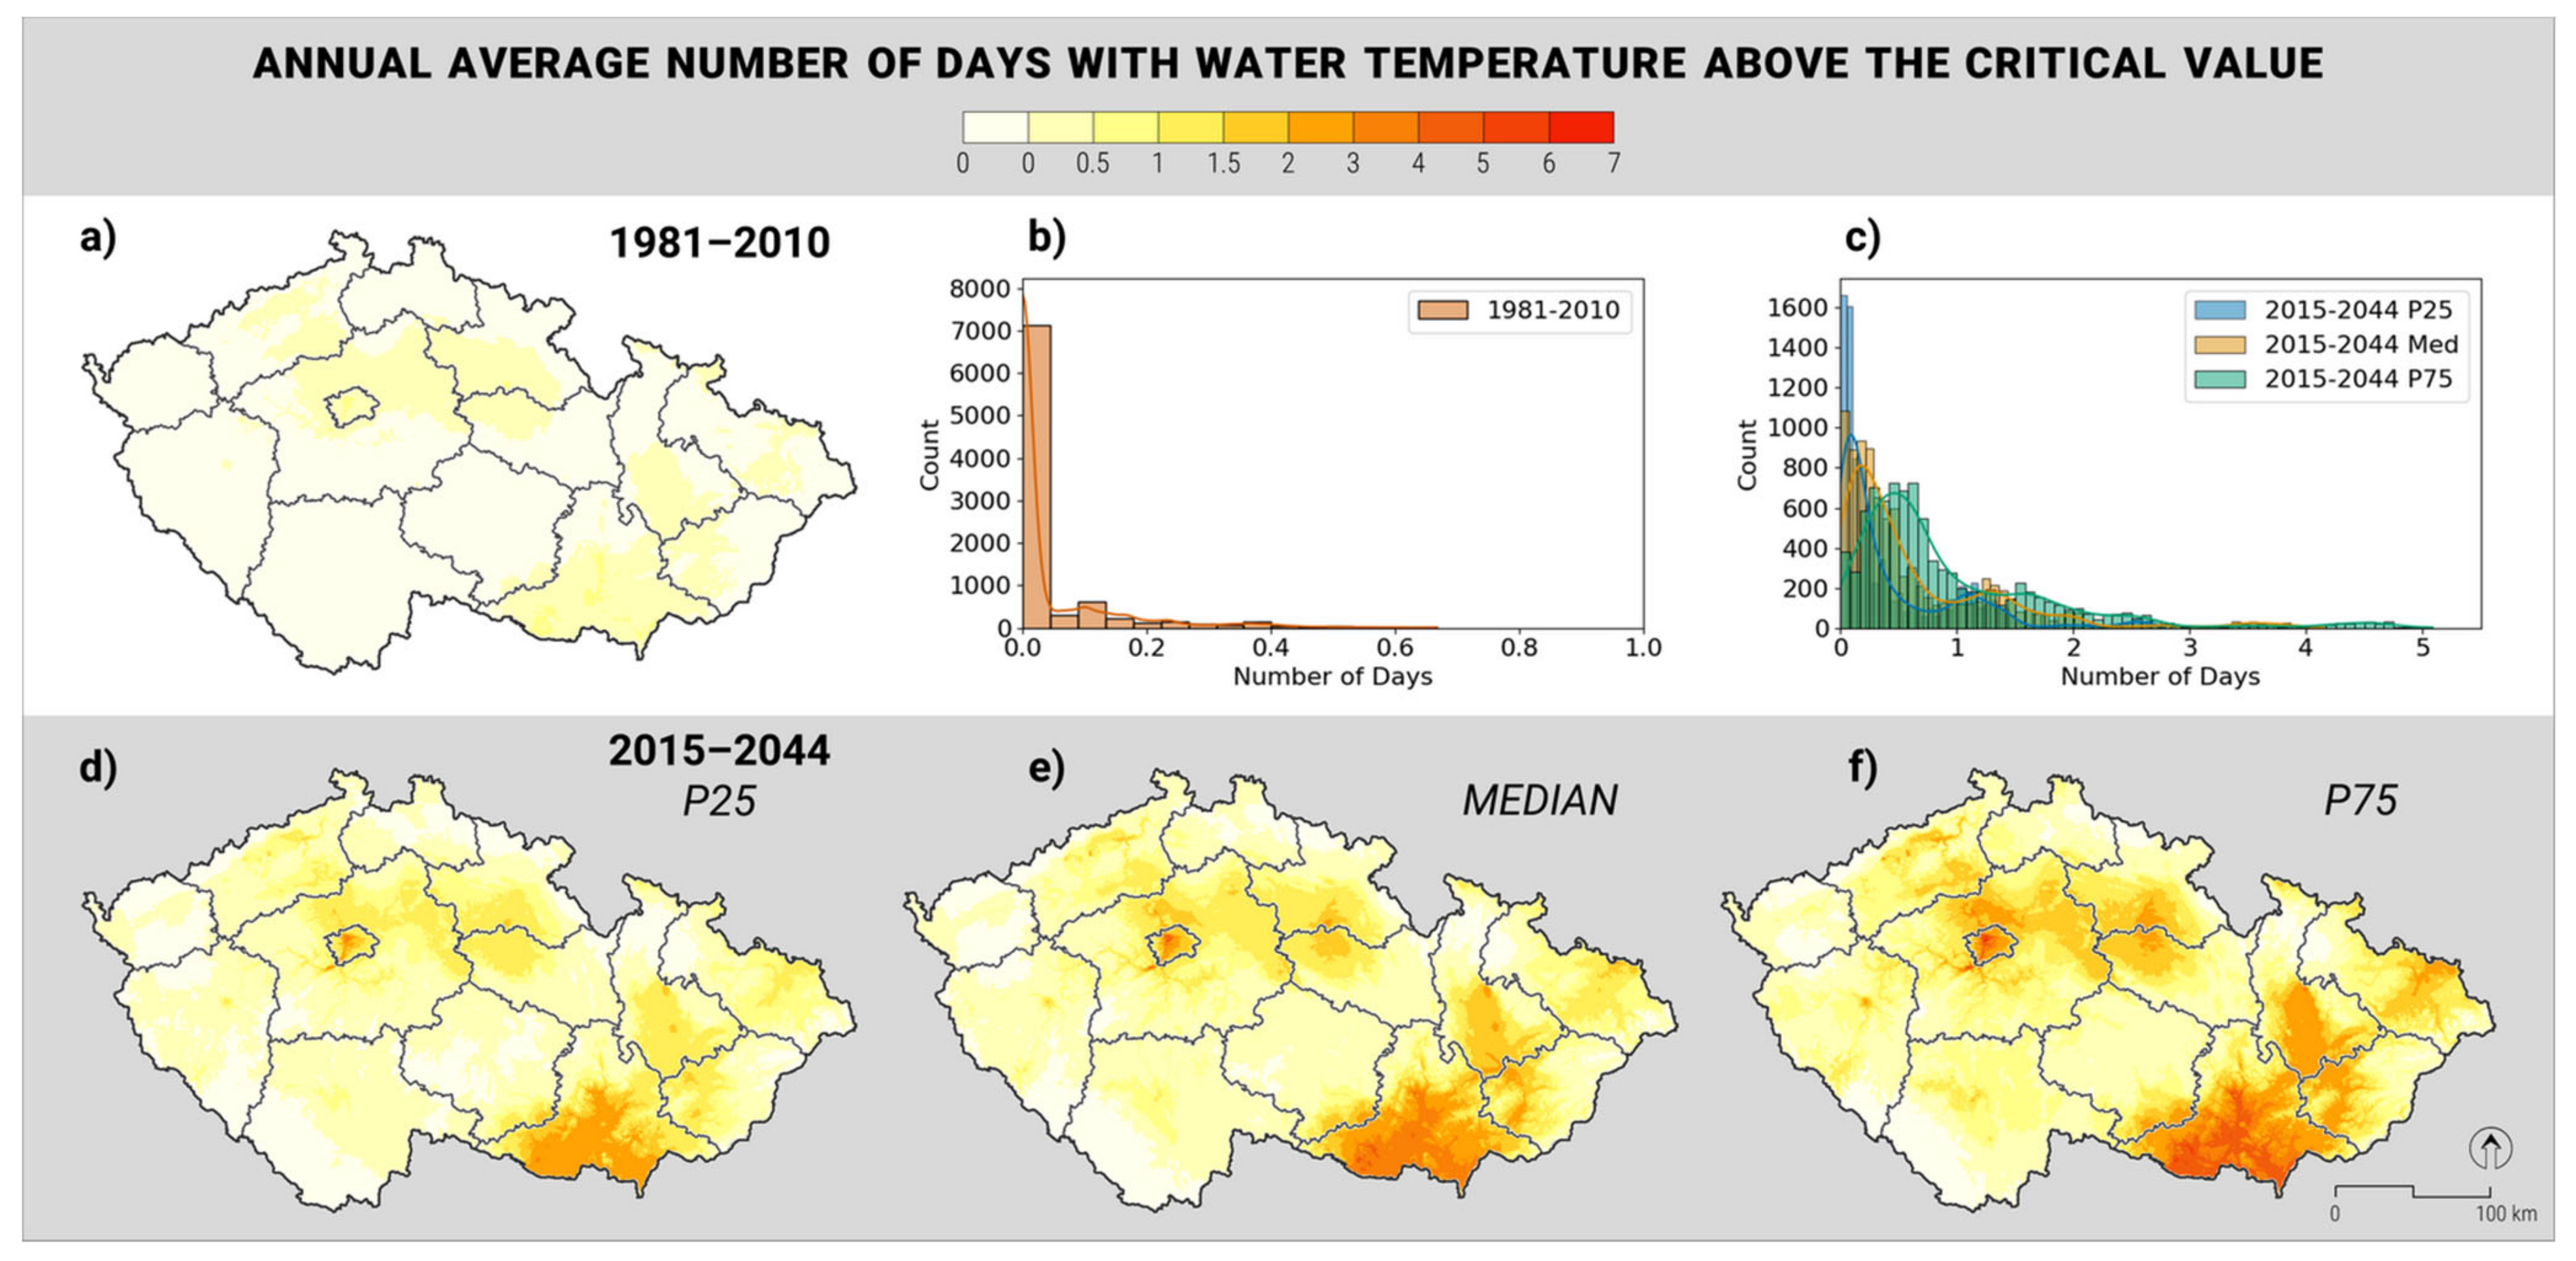
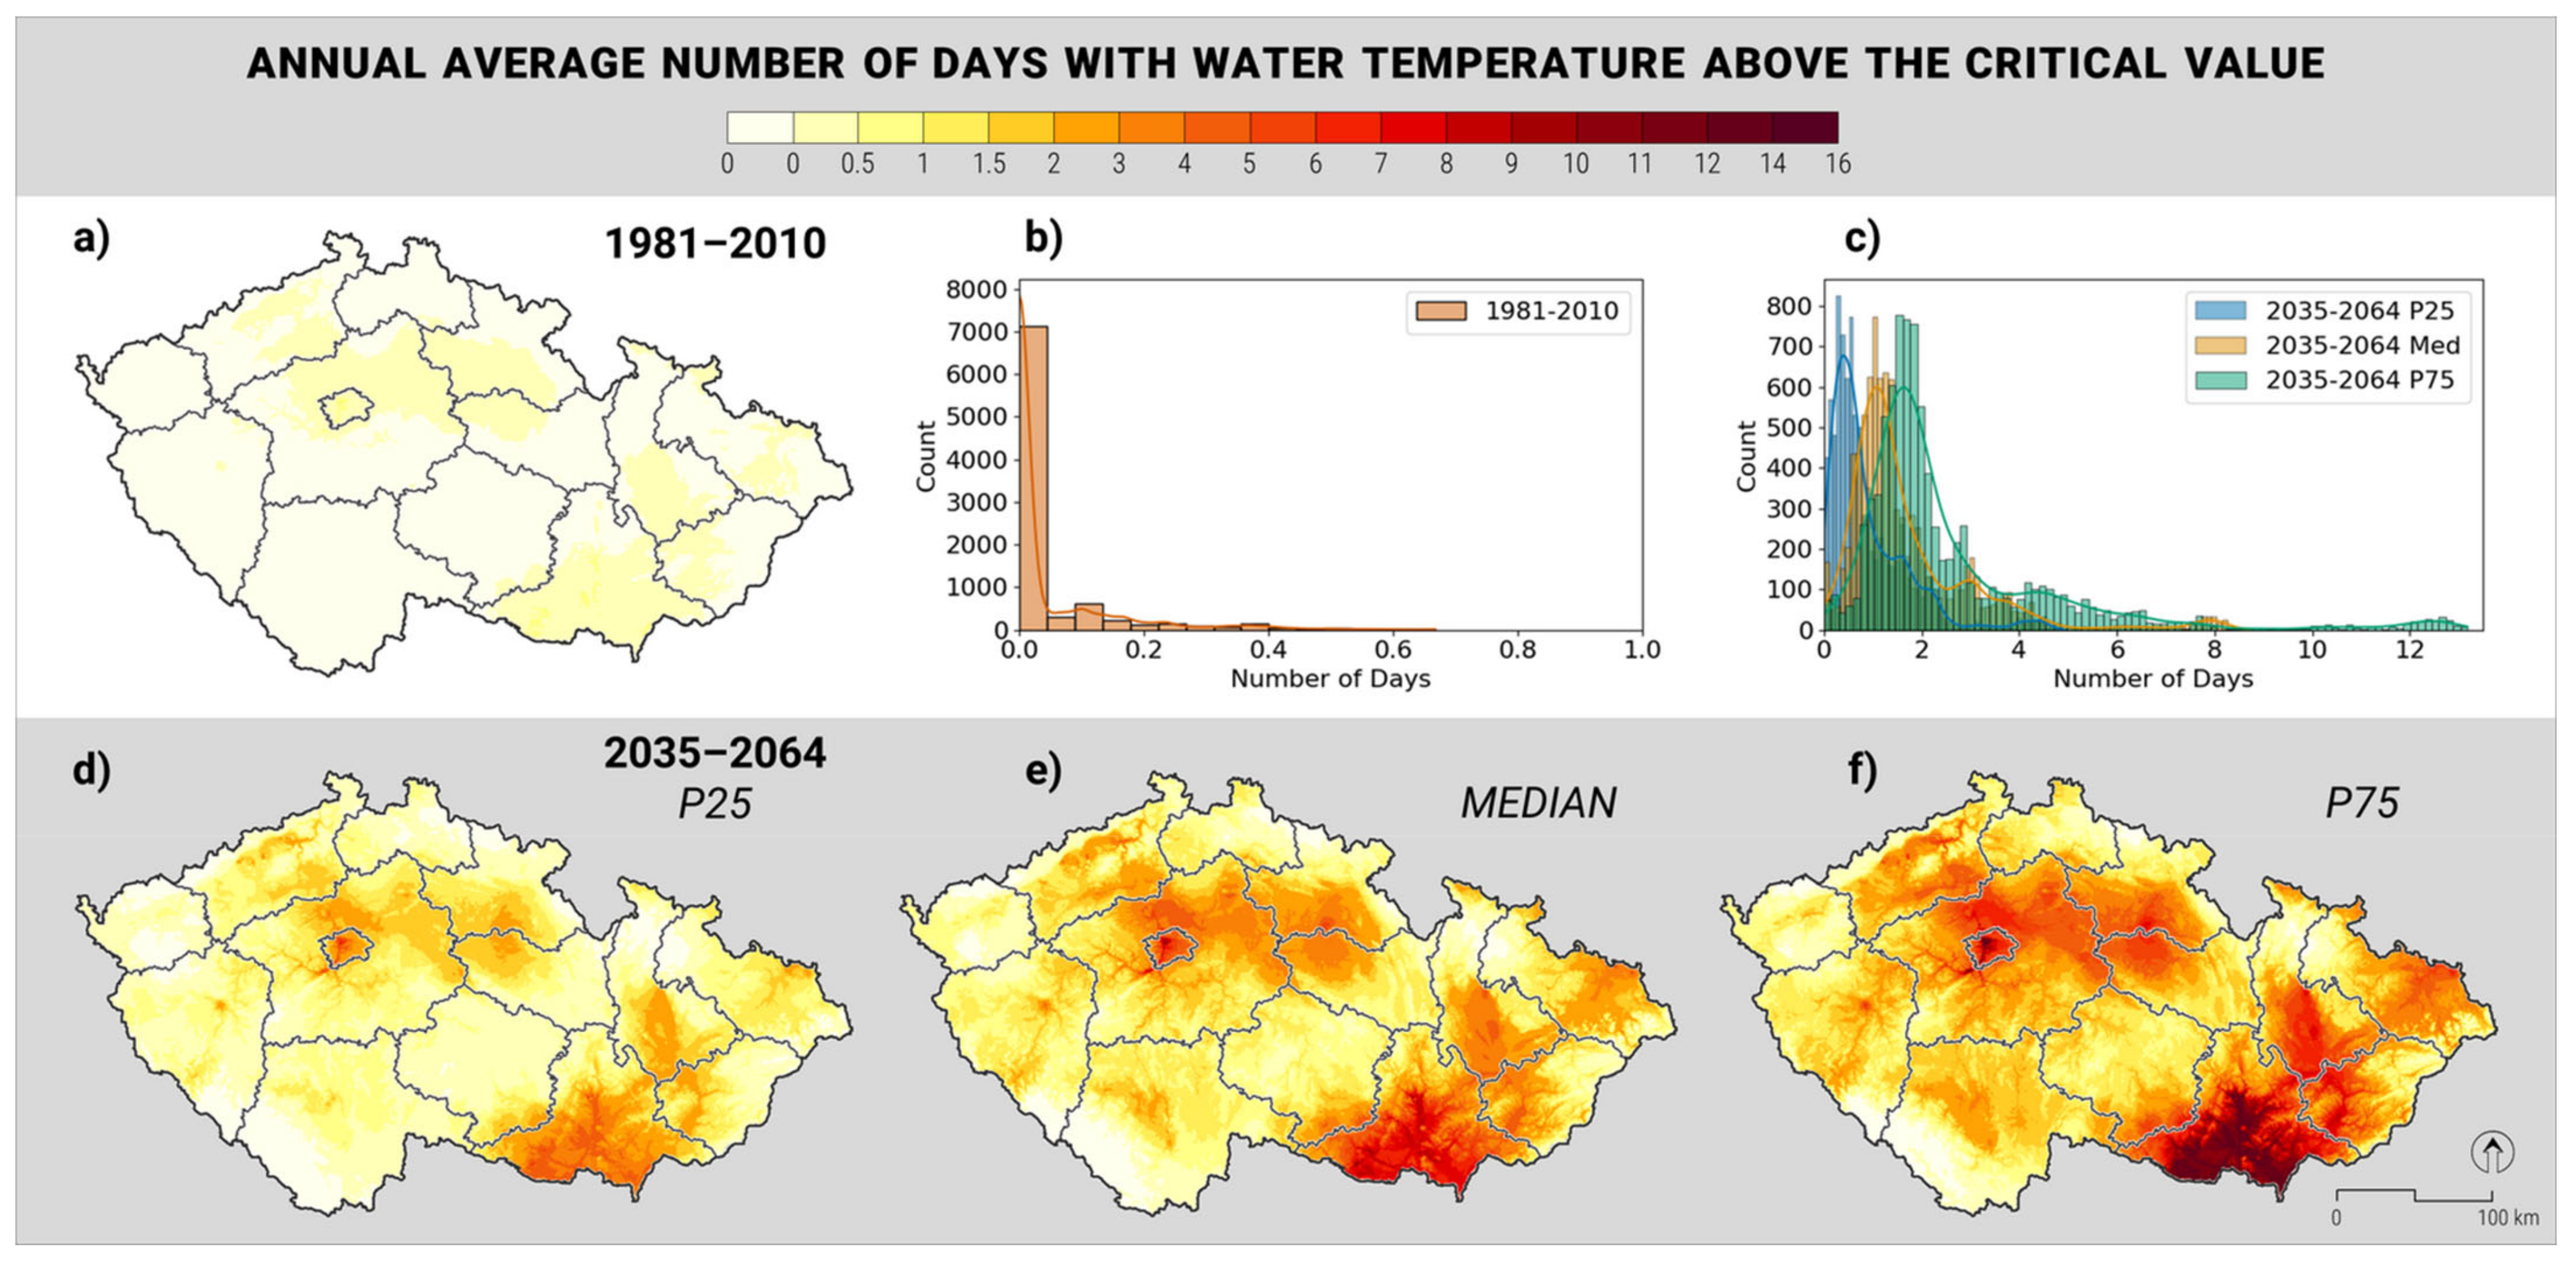
Figure 4 illustrates how marked the changes in the number of days with water temperatures above the critical threshold of 29.1 °C have been since 1981. From virtually no occurrence between 1981 and 1990, it reaches an average of 4–6 days in the warmest regions by 2011–2020 and surpasses 25 days by 2050. While by 2020 the excess number of days with very warm water are concentrated in areas outside the main pond concentrations and avoid the most important pond areas in the southwest of the country, it is not the case by 2030.
Figure 5 documents this sharp increase in the number of days that will inevitably affect the fish production. While
Figure 5e represents the median of the six GCMs × four differently shared socio-economic pathways,
Figure 5d represents the lower quartile and
Figure 5f the upper quartile of this 24-member ensemble. The robustness of the shift towards higher temperatures is clear.
Figure 5c shows that a considerable number of ponds will be affected by multiple days of high temperatures in an average season, signaling protracted periods of unusually warm water, especially in the southeastern and north-central parts of the Czech Republic. This trend is even more pronounced by 2050 as
Figure 6 shows.
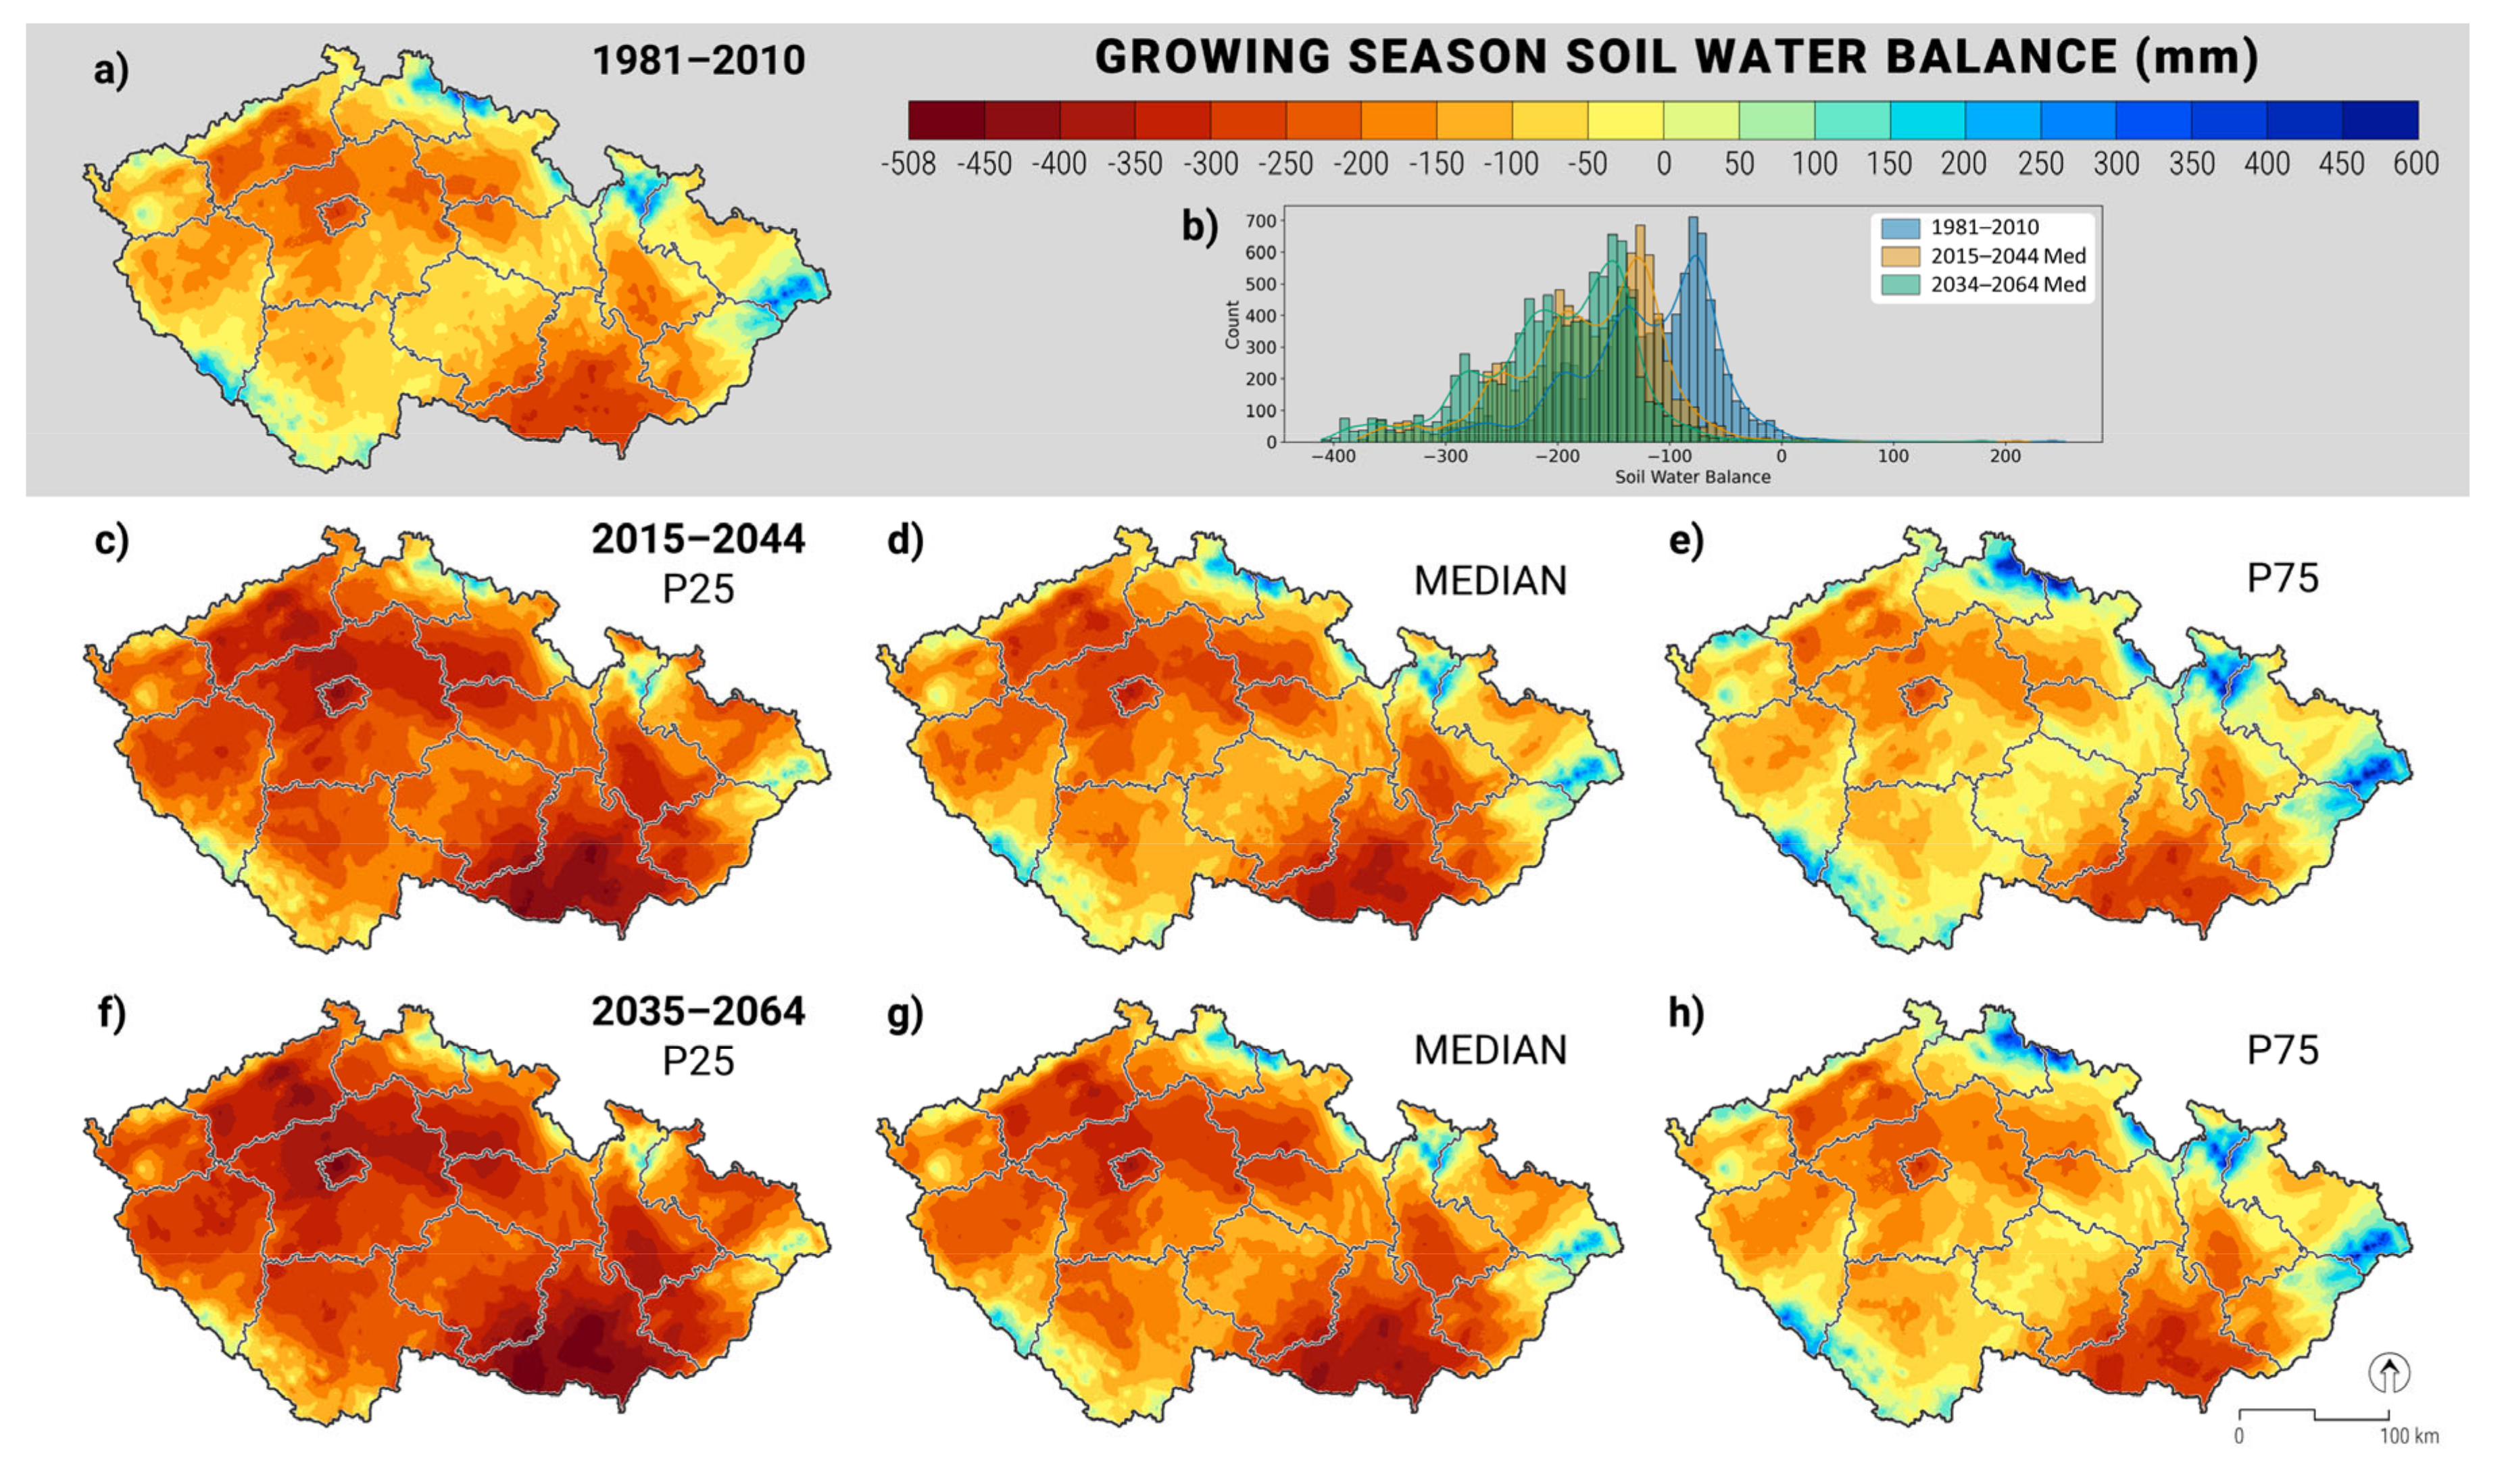
The temperature of water surpasses by several degrees any recorded event and affects all fish pond basins. In the face of increasing water temperatures, the increased supply of pond inflow, ideally of colder stream/river water, would be a welcomed adaptation measure. However, as
Figure A1 in
Appendix A illustrates, the April–September climatological water balance is likely to be tilted towards higher water deficits. Compared to the 1981–2010 baseline values, the difference between rainfall and potential evapotranspiration during April–September will grow from −123 ± 62 mm to −173 ± 66 mm by 2030 and to −201 ± 67 mm by 2050. The growing water deficit will affect all the pond basins and it will by itself pose a significant challenge in being able to sustain the fish pond production.
4. Discussion
Given the strong responses of individual freshwater organisms to temperature, anticipated climate warming is likely to have considerable effects on the geographical distributions of freshwater organisms. These effects are likely to be species- and ecosystem-specific [
20]. A rise in global temperature and changing precipitation patterns have altered the thermal and hydrological regimens of many inland waters. Some ecosystems have already deteriorated over recent decades, and more are likely to be negatively affected in the near future [
37]. In temperate and subarctic zones, changes in the global climate can profoundly affect primary production and the trophic state of inland waters through changes in water temperature and stratification patterns [
38]. Climate change will alter freshwater ecosystems, but specific effects will vary among regions and based on the type of water body. Most man-made lakes have preset water levels and poorly developed littoral zones [
39]. Due to their smaller volumes and the weaker stratification, shallow water bodies are less influenced by meteorological conditions in the preceding winter than deeper water bodies and respond more directly to prevailing weather conditions [
40,
41]. Sala et al. [
42] considered lentic (i.e., lakes and ponds) and lotic (i.e., streams and rivers) ecosystems to be the most sensitive to land use change, exotic species and climate change in a global-scale assessment. However, these drivers of change may vary among regions and latitudes, with aquatic ecosystems at high latitudes being more strongly threatened by climate change than by other drivers.
The authors of this study selected the summer season (the period from April–September) for their analyses because they consider this period to be significant in determining fish production. This suggestion is consistent with the claim of [
43] that fish in temperate ecosystems undergo approximately 90% of their annual growth in the summer months because food availability tends to be highest, and water temperatures approach growth optimums. In these cases, a slight increase in water temperature could be beneficial because the growing season is extended; moreover, overwintering stress can decrease with slight increases in temperature during the growing season [
44,
45]. The potential impacts of global climate change on freshwater fish production across Europe, especially using traditional fish pond methods, have been considered in a limited number of studies. Souza et al. [
46], in a study focused on the impacts of climate on common carp viability in Europe, deliberately avoided using traditional pond farming for analysis, focusing rather on deeper lakes and reservoirs, as those have less complicated characteristics than traditional ponds (small surface area, shallow depth, lack of aphotic zones and thermal stratification of the water column). Heavy exploitation, the introduction of exotic species and habitat change usually make it difficult to quantify climatic effects [
14]. Increases in temperatures can affect individual fish by altering physiological functions such as thermal tolerance, growth, metabolism, food consumption, reproductive success and the ability to maintain internal homeostasis in the face of a variable external environment [
47]. Moreover, during the summer low-flow period, ponds increase their water temperature by at least 2.3 °C at catchment scales, although Seyedhashemi et al. [
48] reported a 5.5 °C increase. An increase in downstream temperature is weakly compensated by natural processes, leading to minimal downstream recovery to baseline temperatures [
48]. This might have a negative implication for the cascade pond system, when the upper pond feeds into the lower pond, as in our case, the ponds Sykovec and Medlov. Under the conditions in the Czech Republic, the common carp is the most crucial farmed fish species found in productive fisheries. The initial modest increase in water temperature will lead to an increase in carp productivity due to the prolongation of the vegetation season and more rapid fish growth in warmer water [
49,
50], especially in deeper water bodies [
46]. The increased likelihood of long episodes with water temperatures greater than 28 °C means there could be considerable challenges for carp production in Czech ponds. Our study shows a considerable increase in the occurrence of “heat-stress” episodes that will likely affect the sustainability of carp production in a more dramatic way than an overall change in mean climate conditions. A long-term trend of increasing production in ponds has led to significant changes in the structure and dynamics of these aquatic ecosystems. The intensive use of organic fertilizer (manure), using grain or pellets for fish food, along with high stocking density, results in an increase in the phytoplankton biomass and, ultimately, fish production. The high biological activity of the phytoplankton biomass is often the cause of destabilization of the pond ecosystem, coupled with considerable variability in key abiotic water parameters (dissolved oxygen, pH and ammonia content). A common feature is the predominance of a few species of cyanobacteria, which form the majority of phytoplankton biomass, thereby reducing the ability of phytoplankton to compensate for sudden changes in the environment. This destabilization increases the likelihood of a parameter exceeding a critical threshold value, often with fatal consequences for a pond’s ecosystem. These fluctuations are a natural reaction to a highly unbalanced nutrient load, and the behavior of the whole ecosystem becomes hard to predict [
24,
51]. At the same time, available methods for water aeration were observed to be inadequate, thus limiting the ability of carp fish farms to cope based on the traditional farm system. Climate change has already had a significant impact on the farming of cold-water fish species (Coregoninae, rainbow trout). Due to increased water temperature, these species are expected to be farmed in a few deeper and colder ponds at higher elevations. This fact is supported by our results, which show, for example, a much higher median number of days per year with water temperatures above the critical value for rainbow trout, maraene whitefish and northern whitefish at the higher elevation of the Medlov pond than for common carp at lower elevations in the south Moravian and Bohemian Dvorský and Klec ponds. Temperature increases lead to increases in stratification, which in turn increase the temperature of the epilimnion and contribute to strong hypoxia in the hypolimnion [
52]. Many authors have described a strong thermal and physical–chemical stratification during the summer and in shallow ponds [
53,
54,
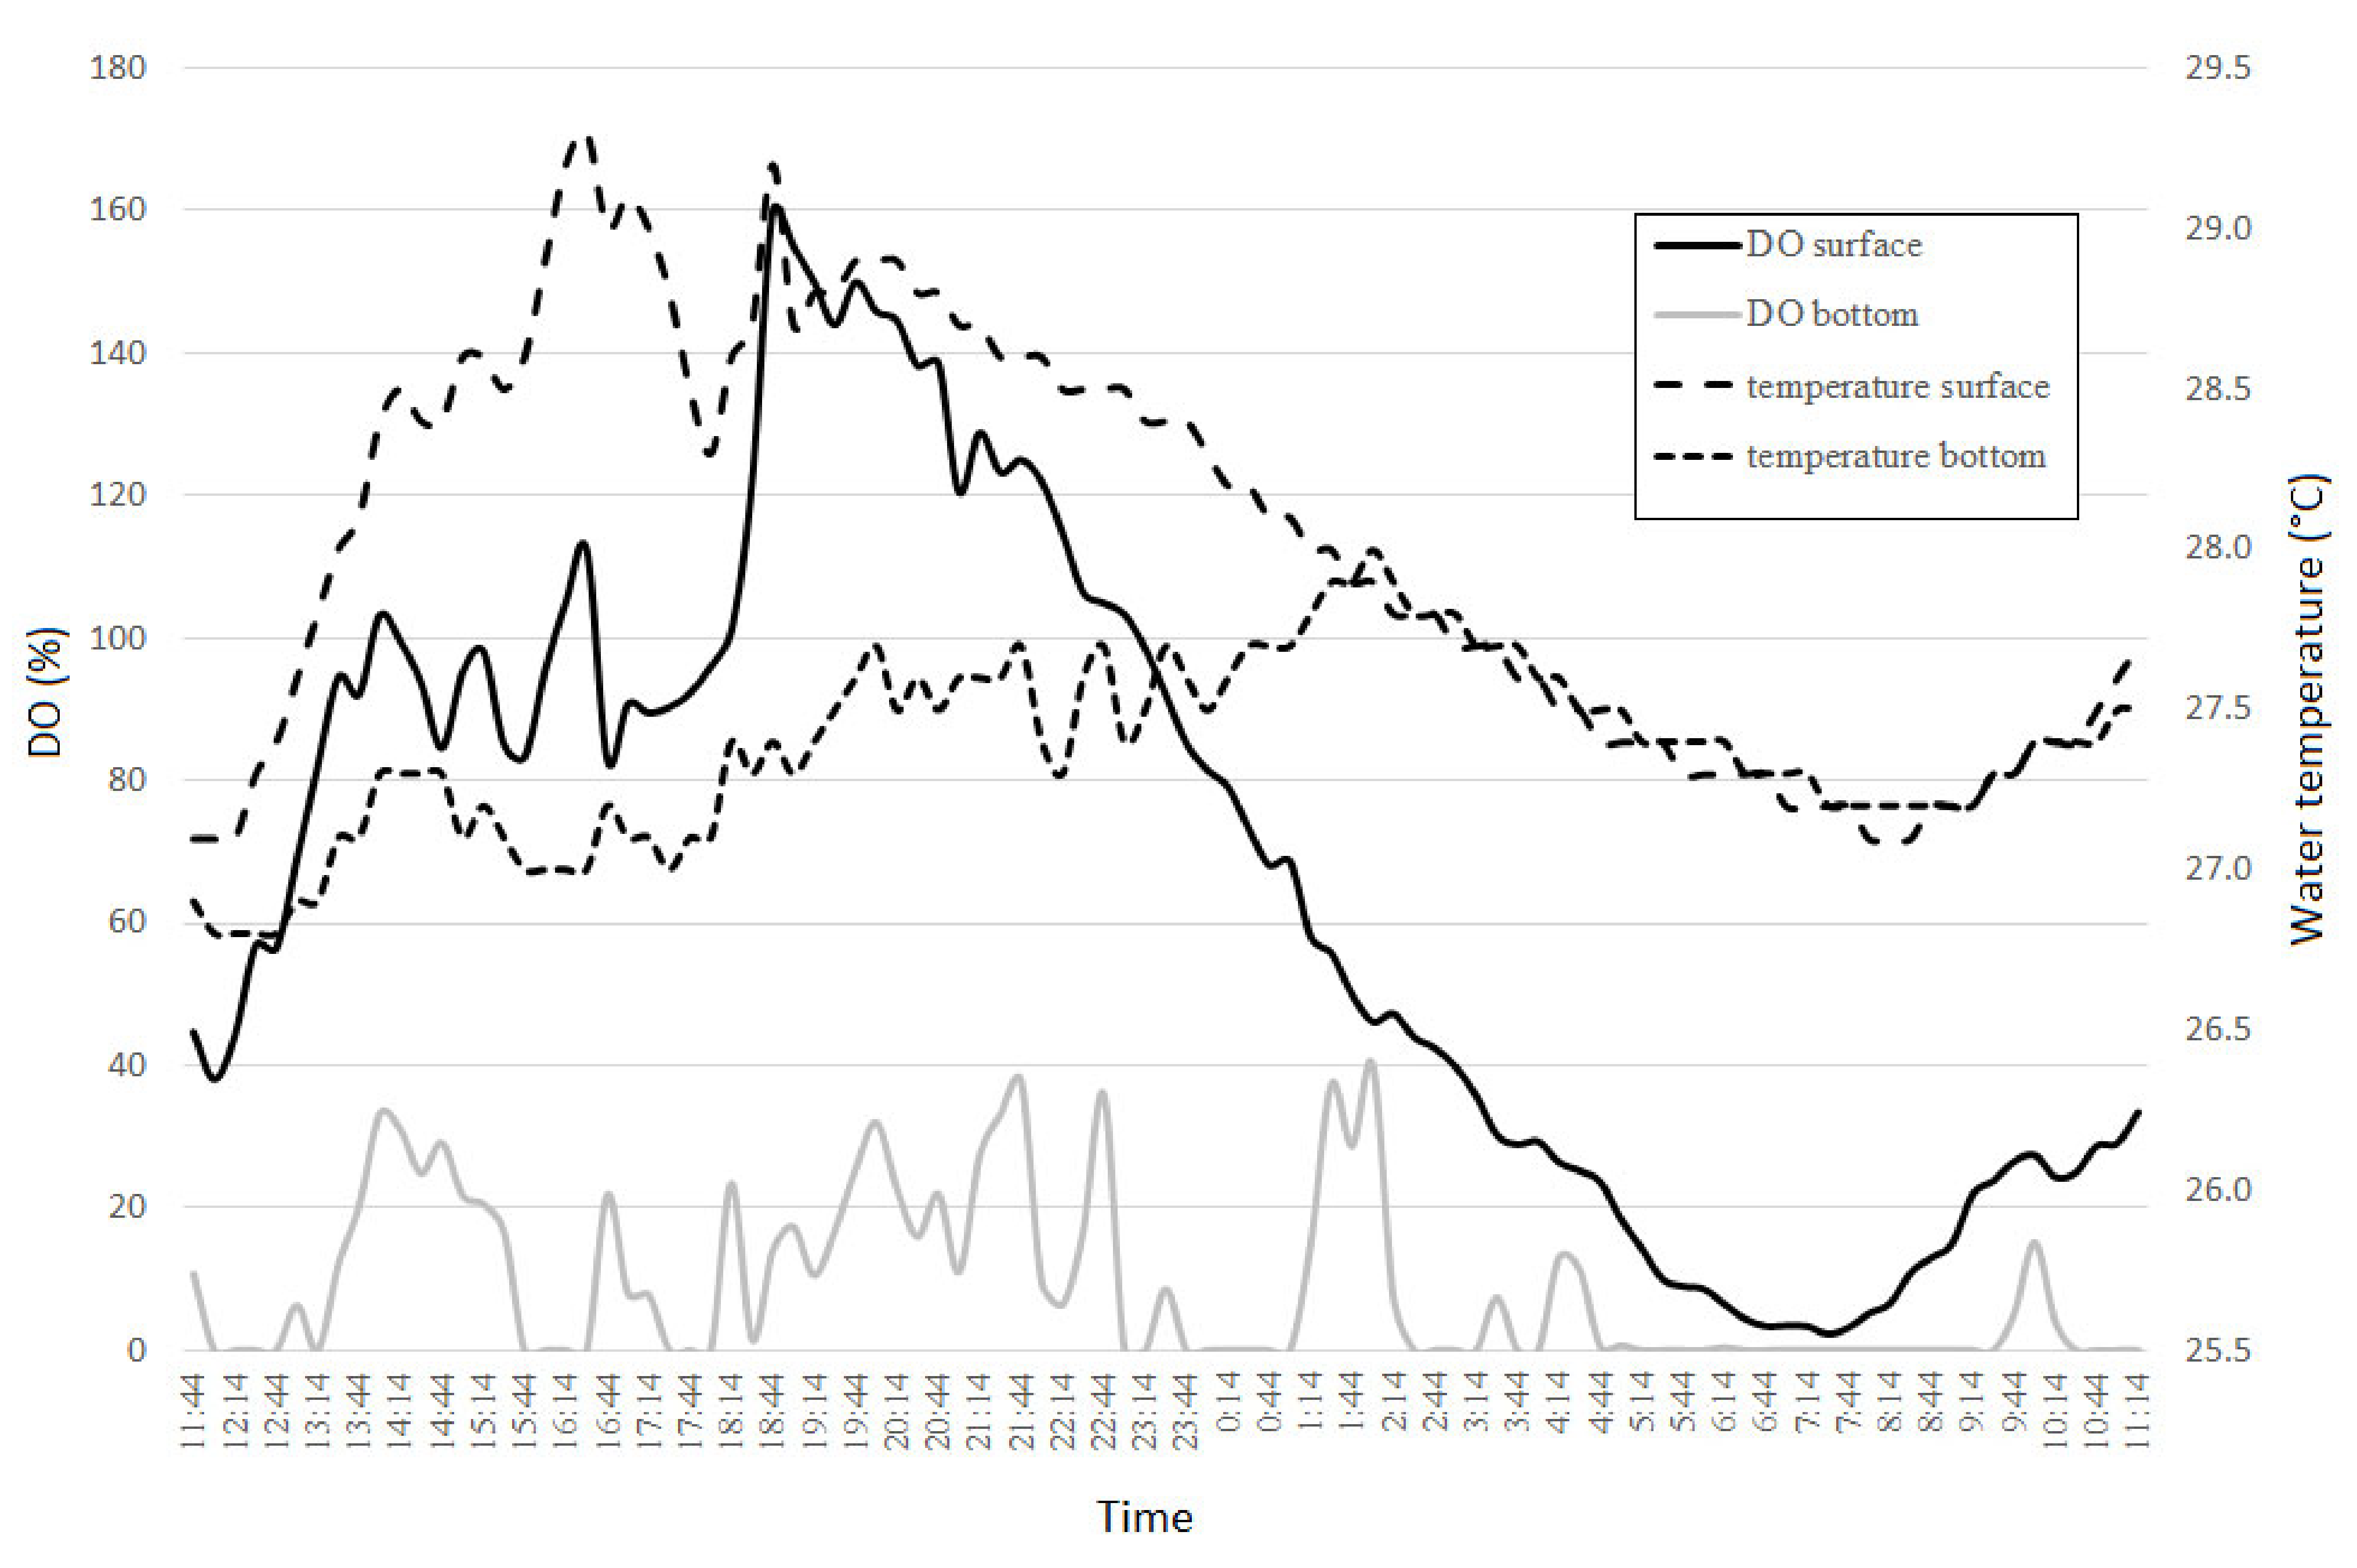
55]. Our results from the Dvorský pond (
Figure A2 in the
Appendix A) show that in the case of long sunny days and windless weather, the temperature difference between the surface and the bottom during the day can be up to 3 °C. The temperature gradient is diminished during the night. Similar temperature differences were also reported in shallow ponds in subtropical areas [
53]. Thermal stratification is closely related to stratification of the oxygen content in water, which is primarily dependent on the intensity of photosynthesis in the studied ponds. Thermal stratification also effects stratification of the oxygen content in water, where the epilimnion is supersaturated with oxygen, while the hypolimnion oxygen concentrations remain very low. An anoxic situation can develop during the nighttime and early morning period when respiration is higher and the dissolved oxygen content drops to or below the critical levels throughout the water column. An increase in global temperatures will strengthen stratification because increased heating of the epilimnion will intensify the temperature and density gradients between the two compartments, making mixing more difficult. However, recent advances in electronics and off-grid photovoltaic systems can be a solution to late summer hypoxia by providing aeration even for remote ponds. The study by Oberle et al. [
56] suggested that the optimal time for pond aeration is during the day, which allows the use of off-grid solar-powered technology in remote ponds. Water mixing is essential for the movement of oxygen to the hypolimnion and nutrients to the epilimnion, where they can be incorporated into the food web [
57]. Climate change will also prolong stratification events by heating the epilimnion sufficiently to form a density gradient earlier in the year. The water temperature will be too high for cold-water fish species in the epilimnion during the majority of the rearing season. Conversely, colder water in the hypolimnion will be insufficiently saturated by dissolved oxygen. As a result, the summer refuges for cold-water fish species will decrease significantly and fish will be forced to stay in limited spaces on the boundary of the epilimnion and hypolimnion. Such conditions can cause an increase in the stress of fish, a decrease in food availability, and an increase in susceptibility to infections and parasite invasions [
58] and predation by birds. It is worth mentioning that thermal stratification in ponds emerges mainly during windless sunny days with co-occurring high air temperatures and is of short duration. The temperature differences are usually up to 2 degrees Celsius. However, there is a significant gradient in the oxygen concentration. These conditions are disturbed by the windy period when the entire water column of the pond is mixed and homogenization of physio-chemical parameters in the entire water column occurs. However, these rapid changes of physio-chemical parameters are likely to increase the stress of the fish. Climate change will also lengthen the time of stratification through the increase in water temperature.
Food intake increases exponentially with temperature for fish [
59]. Regardless of the state of food resources, an increase in temperature causes certain increases in metabolic rates and a subsequent increase in the amount of energy required. In food-limited environments, food intake cannot keep pace with metabolic demand. For example, common carp cultured at 35 °C develop a vitamin C deficiency and grow more slowly than those cultured at 25 °C [
60]. Climate change may lower the carrying capacity of a trout-dominated system, as trout are often food-limited in the summer months because feeding activity is depressed at temperatures above its optimal temperature. With temperatures increasing regularly over the 27.1 °C and 29.1 °C thresholds, fish pond production will inevitably shift towards carp and then to other presently unconsidered species. However, such changes in the species composition and introduction of new aquaculture species could spell the dawn of traditional freshwater pond aquacultures that have been part of the Czech landscape for over 8 centuries.
Rising temperatures enhance the effect of high nutrient loads to the aquatic environment from anthropogenic sources and lead to increased stratification. This is conducive to cyanobacterial dominance in aquatic ecosystems. Phenology, abundance, distribution, size spectra and zooplankton communities are also likely to be altered under prolonged heat episodes. The amount of readily decomposable organic matter in the water will at the same time increase. When this happens, the high plankton biomass will disrupt the diurnal chemistry of aquatic ecosystems. Changes in dissolved oxygen levels will depend on many factors such as the environmental temperature, biological oxygen demand or local climate (e.g., wind mixing of water). As a result, oxygen deficiencies are expected to occur more frequently [
21,
23,
61,
62,
63] with inevitable and deadly consequences for the fish in the aquaculture.

 ,
, 


