
Evaluation of the Effect of WRF Physical Parameterizations on Typhoon and Wave Simulation in the Taiwan Strait
by
 and
and
Chenghan Luo
1, 
Shaoping Shang
1,2,3,*,
Yanshuang Xie
1,2,3,*,
Zhigang He
1,2,3,
Guomei Wei
1,2,3,
Feng Zhang
4 and
Lei Wang
1 1
College of Ocean and Earth Sciences, Xiamen University, Xiamen 361102, China
2
Research and Development Center for Ocean Observation Technologies, Xiamen University, Xiamen 361102, China
3
Key Laboratory of Underwater Acoustic Communication and Marine Information Technology Ministry of Education, Xiamen University, Xiamen 361102, China
4
College of Physics and Electonic Information Enginerring, Minjiang University, Fuzhou 350100, China
*
Authors to whom correspondence should be addressed.
Water 2023, 15(8), 1526; https://doi.org/10.3390/w15081526
Submission received: 9 March 2023
/
Revised: 24 March 2023
/
Accepted: 11 April 2023
/
Published: 13 April 2023
(This article belongs to the Section Oceans and Coastal Zones)
Abstract
:Typhoons and typhoon waves can cause disasters in coastal areas around the world. The Taiwan Strait often experiences typhoons, especially in summer. Numerical models have been adopted to predict typhoons and reduce losses. The Weather Research and Forecasting (WRF) model is widely used in typhoon simulations, and the Simulating WAves Nearshore (SWAN) model performs well in wave simulations. However, significant uncertainty remains in terms of choosing suitable WRF physical parameterizations in different situations. To evaluate the effect of WRF physical parameterizations on wind and wave simulations, 27 simulation experiments were designed. Three typhoon events (Goni, Dujuan, and Meranti) with different tracks that influenced the Taiwan Strait were simulated. Three parameters (wind speed, wind direction and significant wave height) were assessed using Taylor diagrams, and it was found that the best simulation experiment changed according to typhoon tracks and physical parameters. In wind speed simulation, the best simulation experiment is 12 for typhoon Dujuan and 19 for typhoon Goni and Meranti. From the perspective of wind direction simulation, experiments 26, 23, and 2 performed best for typhoons Goni, Dujuan, and Meranti. And experiments 19, 1, and 20 had the best performances in significant wave height simulation for typhoons Goni, Dujuan, and Meranti. The WRF-SWAN model using the best simulation experiment reduced the error and exhibited good performance in the wind and wave simulations. Skill scores of three parameters were all over 70 for typhoon Goni and 80 for typhoon Dujuan and Meranti. The applicability of the best simulation experiments was demonstrated in typhoon simulations with similar tracks. The accuracy of the wave simulation depended on wind speed, wind direction, and their interaction. In addition, a scheme’s sensitivity changed with different typhoon tracks. This study provides references for designing physical parameterizations for use with the WRF-SWAN model, which may help to simulate typhoons and typhoon waves in the Taiwan Strait more accurately in the future.
1. Introduction
Typhoons and typhoon waves are terrible natural disasters that lead to significant economic and human losses in coastal areas around the world [1,2,3,4]. The southeast coast of China, which includes the Taiwan Strait, frequently experiences typhoons, which form over the Northwest Pacific Ocean, especially in summer [5,6]. The waves induced by typhoons threaten fisheries and navigation [3,7]. In recent years, expanding reclamation programs have changed the land-sea distribution, which might result in more serious consequences associated with typhoon events [8,9]. However, accurate typhoon and wave forecasts can help prevent the losses caused by typhoons and typhoon waves, especially in regions in which typhoons frequently occur [10].
Numerical simulations with high temporal and spatial resolutions are playing an increasingly important role in typhoon and typhoon wave studies [11,12,13]. The Weather Research and Forecasting (WRF) model, developed by the National Center for Atmospheric Research and the National Centers for Environmental Prediction, is a mesoscale meteorological model designed for atmospheric research and operational forecasting [14,15,16]. The WRF model is widely applied in typhoon simulations and has been shown to perform well in wind, temperature, pressure, and humidity simulations [17,18,19,20]. The Simulating WAves Nearshore (SWAN) model, developed by the Delft University of Technology, is a third-generation wave model designed to obtain realistic estimates of waves in coastal areas from given wind conditions. It is widely adopted in studies concerning typhoon wave simulations [21,22,23]. Reanalysis data are often used to provide wind inputs in the SWAN model [24,25]. However, many studies show that wind inputs obtained from the WRF model with high temporal and spatial resolutions can significantly improve the SWAN wave simulation [26,27,28,29,30]. In the WRF-SWAN model, the design of WRF physical parameterizations has a significant influence on the accuracy of typhoon simulations [31,32,33,34].
The Taiwan Strait (21–26° N, 118–123° E) is located between Taiwan Island and Fujian Province. This is the main path of typhoons that form over the Northwest Pacific Ocean [35,36]. Typhoons are significantly influenced by islands that they pass near, for example, Taiwan Island. This has acted to increase errors in wind simulations in the Taiwan Strait during typhoon events [7,37]. Suitable physical parameterization combinations can reduce the WRF model’s wind simulation errors and are also helpful in reducing the SWAN model’s wave simulation errors [21,24,38,39]. The effects of the Taiwan Island change with typhoon tracks and suitable physical parameterization can also differ [7,36]. However, significant uncertainty remains in choosing suitable WRF physical parameterization combinations in the WRF-SWAN model according to the typhoon track to produce relatively reliable typhoon and wave simulations in the Taiwan Strait [39,40].
This study aimed to investigate the effect of WRF physical parameterizations on typhoon and wave simulations in the Taiwan Strait and provide references for the selection of WRF physical parameterizations for the WRF-SWAN model, which might help to predict typhoons and typhoon waves more accurately and reduce human and financial losses.
2. Methodology
Three typhoon events with different tracks were simulated using the WRF-SWAN model. Twenty-seven simulation experiments were designed to investigate the effect of WRF physical parameterizations on simulation accuracy. The simulated wind speed, wind direction, and significant wave height were compared with buoy observation data, and the performances of different WRF physical parameterizations were assessed using Taylor diagrams. Details about the model, experimental design, Taylor diagrams, and observation data are described below.
2.1. WRF Model
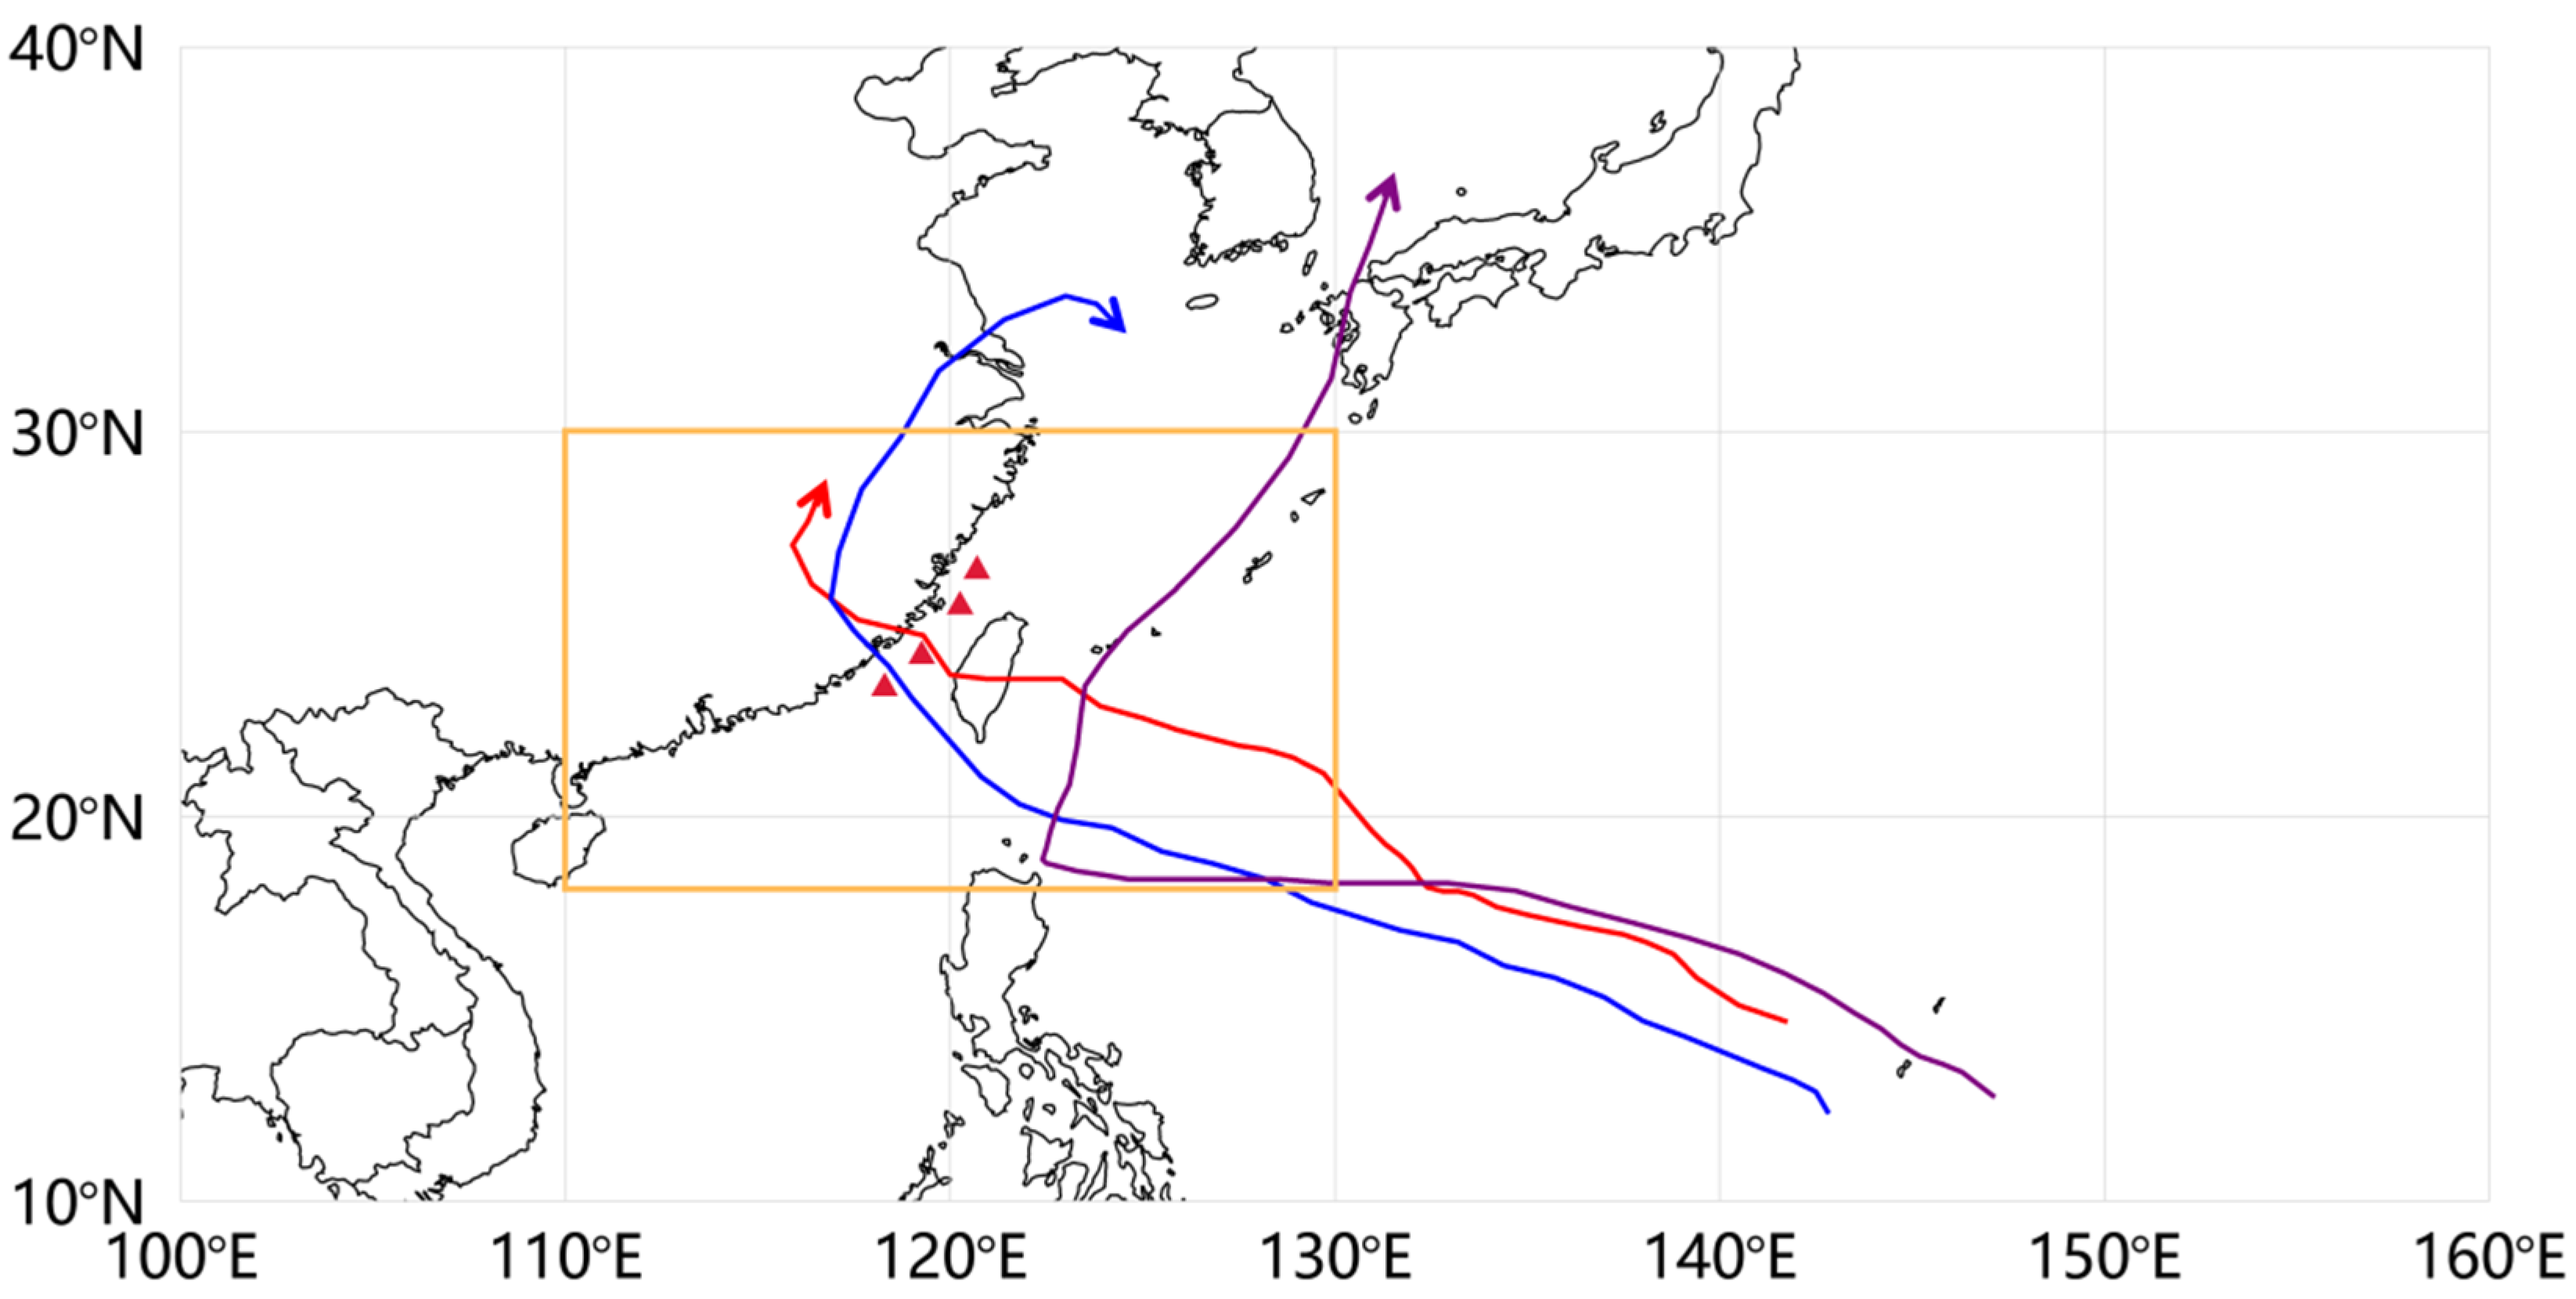
The WRF model version 3.9.1 was used to simulate the typhoon events in this study. The source code and a detailed description can be obtained from the official site [41]. The WRF model domain consists of 280 × 180 grids with a 25 km resolution that covers East Asia and the Pacific, including the Taiwan Strait (21–26° N, 118–123° E; Figure 1). The wide model domain can simulate the formation, development, and dissolution of typhoons and improve the accuracy of simulated wind [42]. The characteristics of the WRF grid are shown in Table 1. The FNL reanalysis data were used to provide meteorological initial and boundary conditions, the spatial resolution was 1 × 1 degrees, and the temporal resolution was 6 h. We applied a 4-dimensional nudging technique in the WRF simulation. The wind over the boundary layer would be nudged per 6 h to make modeled trajectory and intensity correct. The wind in the boundary layer is not influenced by nudging, which could develop and interact with terrain freely. The simulations started 3 days before the formation of typhoons and ended at the dissolution of typhoons. The first 3 days were regarded as the spin-up of the model. The simulation start and end times of 3 typhoons are shown in Table 2.
2.2. SWAN Model
The SWAN model version 40.85 was used to simulate the typhoon wave during typhoon events in this study. The SWAN model domain consists of a 200 × 120 grid with a 0.1° resolution that covers the Taiwan Strait (21–26° N, 118–123° E; Figure 1). Various related sets are shown in Table 3. The WRF model provided wind speed and wind direction at a 10 m height to simulate the wave in the SWAN model, the spatial resolution was 25 km, and the temporal resolution was 1 hour. The initial conditions in the SWAN model were calculated using the WRF wind input. The wave spectrum at the boundary of the SWAN grid is defined as JONSWAP in the SWAN model. JONSWAP could give boundary conditions according to WRF wind input. The simulation period was consistent with the WRF model, and the first 3 days were used to spin up the model.
2.3. Experimental Design
Previous studies suggest that the choice of microphysics, longwave/shortwave radiation, and cumulus parameterizations significantly influence typhoon simulations in the WRF model [39,43,44]. To investigate the effect of these 3 types of parameterizations on typhoon simulations, 3 popular choices from each type were adopted in this study. The Lin, WSM6, and Morrison microphysics parameterizations can all simulate the microphysics processes in typhoon events [45,46]. The longwave/shortwave radiation parameterization is very important in energy absorption, conversion, and transmission processes. RRTM/Dudhia, CAM/CAM, and RRTMG/RRTMG are widely used in typhoon simulation studies [47,48]. Three cumulus parameterizations (KF, Grell 3D, and TDK) can all describe the cumulus convection process during typhoon events [49,50,51]. The 27 experiments are shown in Table 4. In addition, the Yonsei University scheme was adopted as the planetary boundary layer parameterization and the Noah scheme was adopted as the land-surface parameterization, according to previous studies [12,52,53].
The same WRF physical parameterizations can exhibit different performances on different typhoon tracks because physical parameterizations perform better in different situations and regions. Three representative typhoon events (Goni, Dujuan, and Meranti) were chosen to analyze the effect of WRF physical parameterizations on the typhoon simulation with different tracks and the wave simulation in the Taiwan Strait.
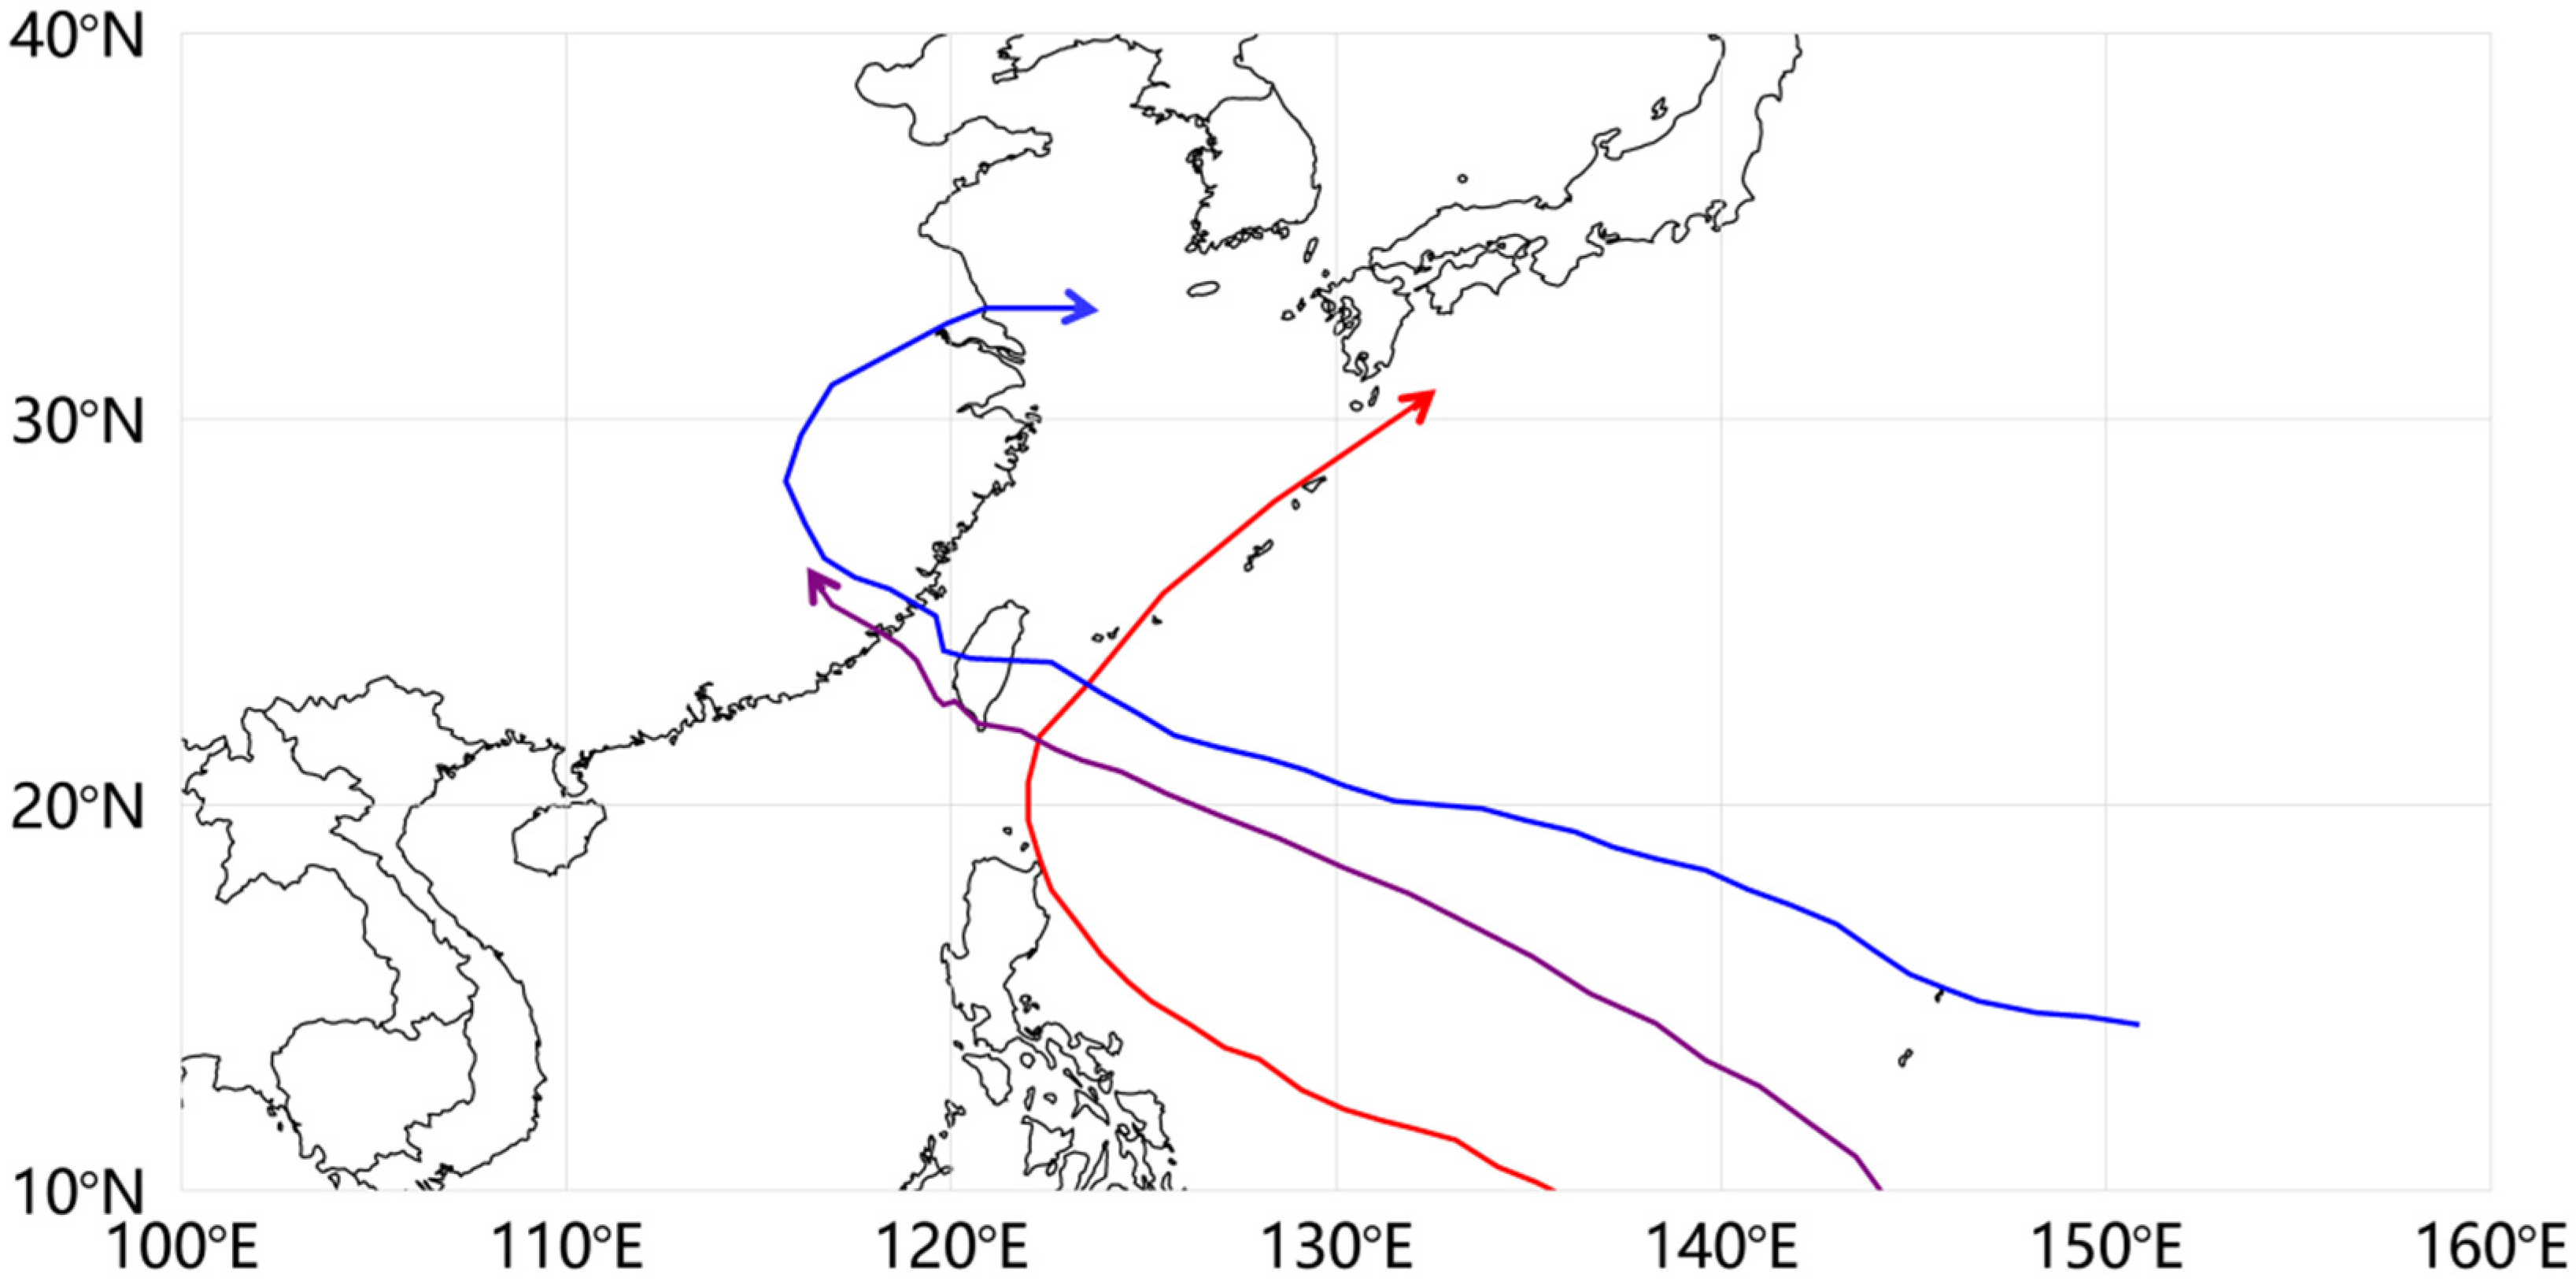
Typhoon Goni formed on 12 August 2015 and reached typhoon strength on August 15, first moving toward the west and turning north on the southeast side of Taiwan (Figure 1). The maximum wind speed detected near the typhoon center was over 50 m/s, and the Taiwan Strait was only impacted by the outer wind field of the typhoon.
Typhoon Dujuan started as a tropical depression on 20 September 2015 and became a strong tropical storm on 24 September. Dujuan reached its peak intensity on 26 September when it became a super typhoon with a sustained wind of 55 m/s. The typhoon moved westward, made landfall on 28 September in Taiwan and made landfall a second time on 29 September at Putian, Fujian (Figure 1). The typhoon’s structure broke down to a significant extent after landfall in Taiwan, and it weakened to a tropical storm after landfall at Fujian.
Typhoon Meranti started as a tropical storm on 10 September 2016 over the Northwestern Pacific Ocean and intensified into a super typhoon in just 2 days. Typhoon Meranti moved toward the northwest and made landfall at Xiamen, Fujian, without passing over Taiwan (Figure 1). It is regarded as the strongest typhoon to make landfall in Fujian from 1949 to 2016.
These 3 typhoons all impacted the Taiwan Strait in different ways. Typhoon Goni did not pass over Taiwan and the Taiwan Strait, and so this area was only impacted by the outer wind field. The typhoons Dujuan and Meranti passed over the Taiwan Strait, but Meranti did not pass over Taiwan Island. The tracks of these 3 typhoon events are shown in Figure 1.
In addition, ensemble prediction of many experiments sometimes could improve simulation accuracy and was adopted in this study.
2.4. Taylor Diagram
Taylor diagrams were used to assess the experimental performances in this study. They can be used to assess the agreement between a set of experiments and a reference data set by summarizing the metrics of the correlation (R), the centered root mean square difference (E), and the standard deviation (σ) in a single graph [54]. The value of σ is calculated by Equation (1)
where n is the total number of discrete points, and xmean is the mean value of the field. The value of σ denotes the amplitude of variation.
The R-value between f (experiment) and r (reference data), which are defined as N discrete points, is defined by Equation (2)
where fmean and rmean are the mean values and σf and σr are the standard deviations of f and r, respectively. R is often used to quantify the pattern similarity between the experiment and reference data.
The E value is defined by Equation (3)
The value of E refers to the difference between the experiment and reference data.
All 4 statistics (R, E, σf, and σr) are useful in assessing experiments and the relationship between them is shown in Equation (4).
The relationship is consistent with the law of cosines and allows 4 statistics to be displayed on a single diagram.
Because the units of variables are different, their statistics should be nondimensionalized before being compared with each other. For each variable, we choose to normalize the E and the 2 standard deviations by the standard deviation of the reference data (En = E/σr, σn = σf/σr, and σrn = 1) and plot the normalized diagram. The details of the diagram are described below.
A good experiment should accurately simulate the amplitude and pattern of variables. However, when an experiment has a lower R (a lower pattern similarity) and a lower En (closer agreement with the reference data), has the model performance improved or not? To comprehensively assess the model performance, the skill score (S) is defined as Equation (5)
As the model simulation approaches the reference data, S approaches 100.
Wind speed and wind direction from wind simulations are very important for wave simulations. In wave simulations, significant wave height is an essential parameter and is closely related to wave forecasting. As a result, we used a Taylor diagram to analyze the accuracy of the simulated wind speed, wind direction, and significant wave height [55,56].
2.5. Other Data
In our study, the best typhoon track data from the China Meteorological Administration Tropical Cyclone Data Center’s official website were used to provide the best typhoon tracks [57].
Hourly buoy observation data from typhoon episodes from the Fujian Marine Forecast Station were used to provide the wind speed and wind direction at a 10 m height and significant wave height in our research [58]. The precision of the observation data is to 2 significant figures, and the locations of buoys are shown in Figure 1, i.e., they almost cover the entire Taiwan Strait area.
3. Model Result
3.1. Evaluation of the Wind Speed Simulation
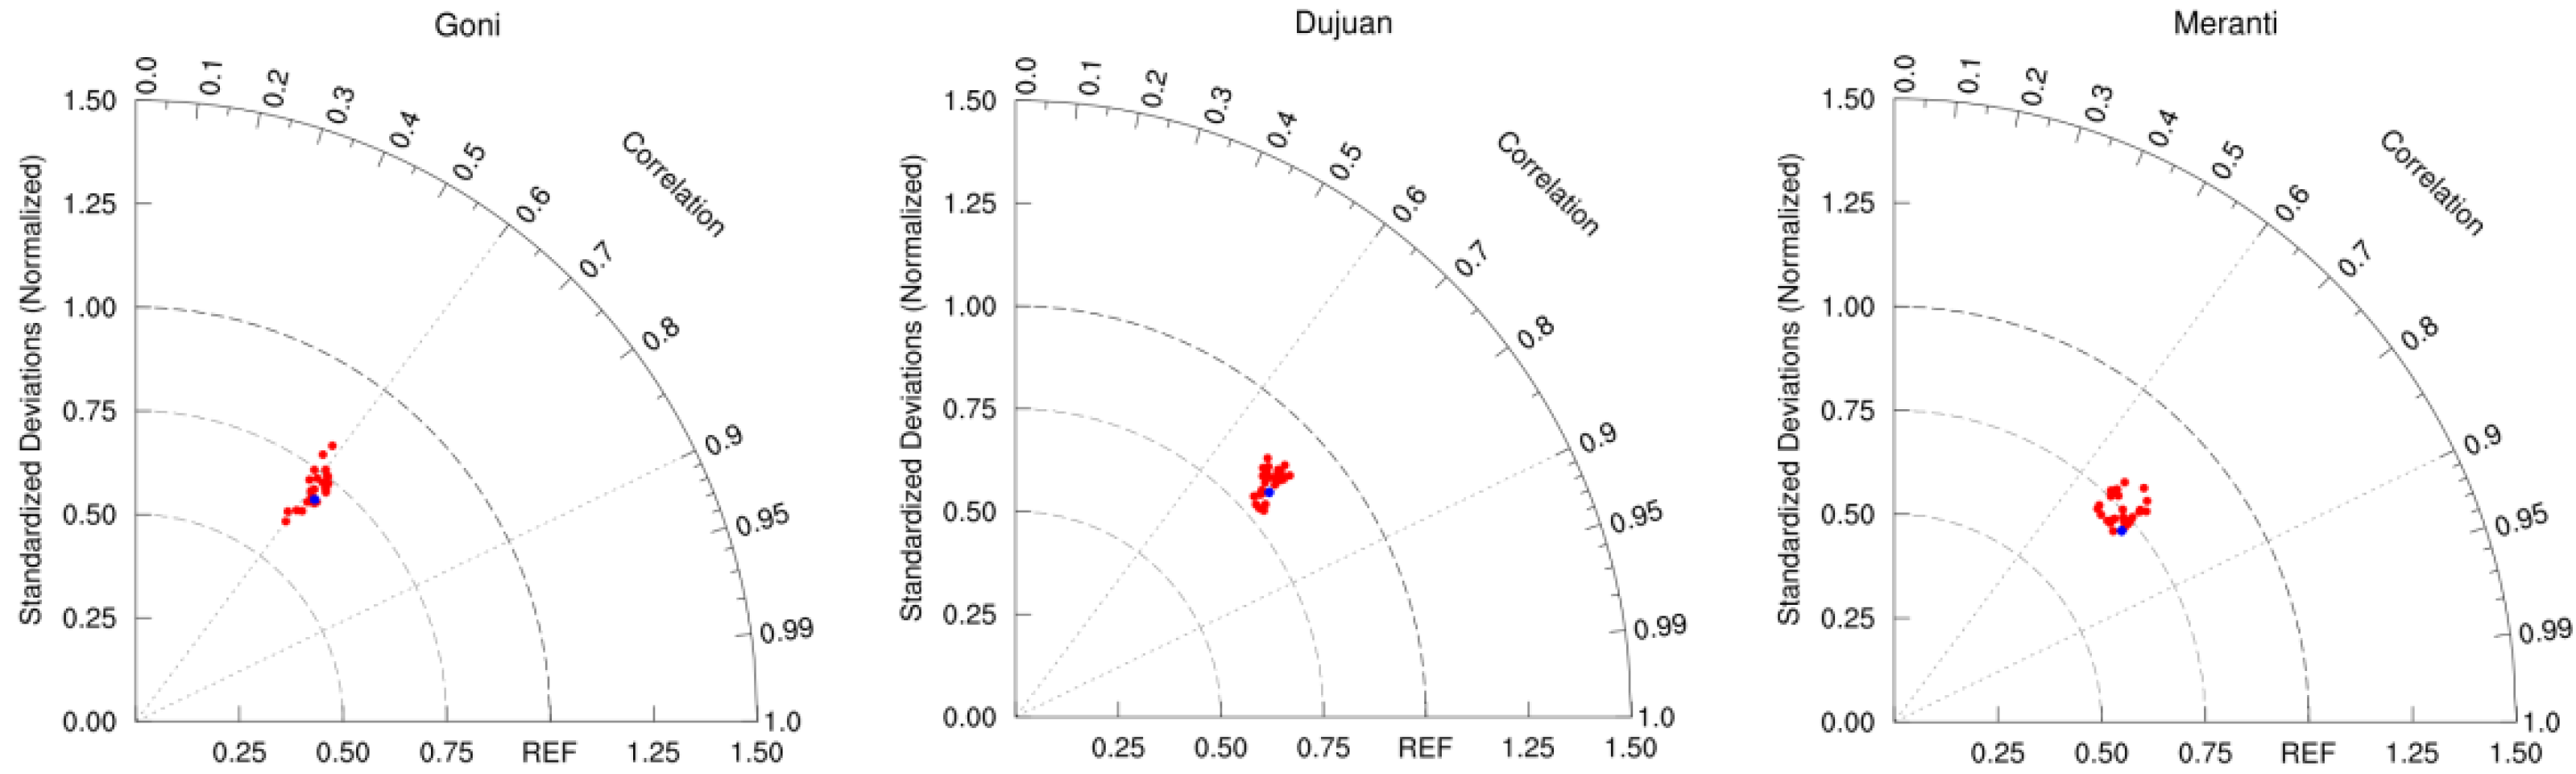
Twenty-seven simulation experiments for each typhoon event obtained from the WRF model were used to evaluate the performance of the physical parameterization combinations. Taylor diagrams of the wind speed for 3 typhoon events and 27 experiments are shown in Figure 2. Each red dot stands for an experiment, and the blue dots stand for the ensemble prediction of 27 experiments. The radial distance from the dot to the origin is proportional to the σn of an experiment. The R-value between the experiment and observation is given by the azimuthal position. The En between the experiment and observation is proportional to the distance from the dot to the reference point. The results suggest that the R-, σn-, and En-values of the wind speed all changed significantly between experiments. The same experiment exhibited different performances for typhoons with different tracks, which demonstrates that typhoon track and physical parameterization both affect the simulation accuracy. The performance of ensemble prediction is better than many experiments but not the best experiment.
In terms of R, details about R in the three typhoon events are shown in Table 5. The error range, the best value, and the best simulation experiment for the three typhoon simulations were all different, and the simulation of typhoon Goni exhibited the worst performance in terms of R. According to the best simulation experiments, the ranking of performance for the three typhoon events was Dujuan > Meranti > Goni.
From the perspective of σn, the error range, best value, and best experiment are shown in Table 6. All values were less than one, which indicated that the amplitude of the simulated variation was less than the amplitude of the observed variation. According to the best simulation experiments, the ranking of performance for the three typhoon events was also Dujuan > Meranti > Goni.
The En statistics are shown in Table 7. According to the best experiment, the ranking of performance for the three typhoon events was consistent with that for R and σn. However, the best simulation experiments in the three statistics (R, σn, and En) were different for the same typhoon simulation. In fact, a change in the physical parameterizations in the model produced improvements in one aspect of a simulation and deterioration in other aspects. No physical parameterization was the best for every aspect.
Considering the R, σn, and En as a whole, skill score (Equation (4)) was adopted to assess the performance of the different experiments. The results suggest that experiment 19 exhibited the best performance in the Goni simulation, with a skill score of 78.5. The best simulation experiments in the Dujuan and Meranti typhoons were 12 (86.3) and 19 (83.9). The best simulation experiments in terms of skill score were different from those identified using the single statistics, which demonstrates that an improvement in one aspect might be offset by a deterioration in another. Despite this, the ranking of the best skill scores for the three typhoon events was Dujuan > Meranti > Goni.
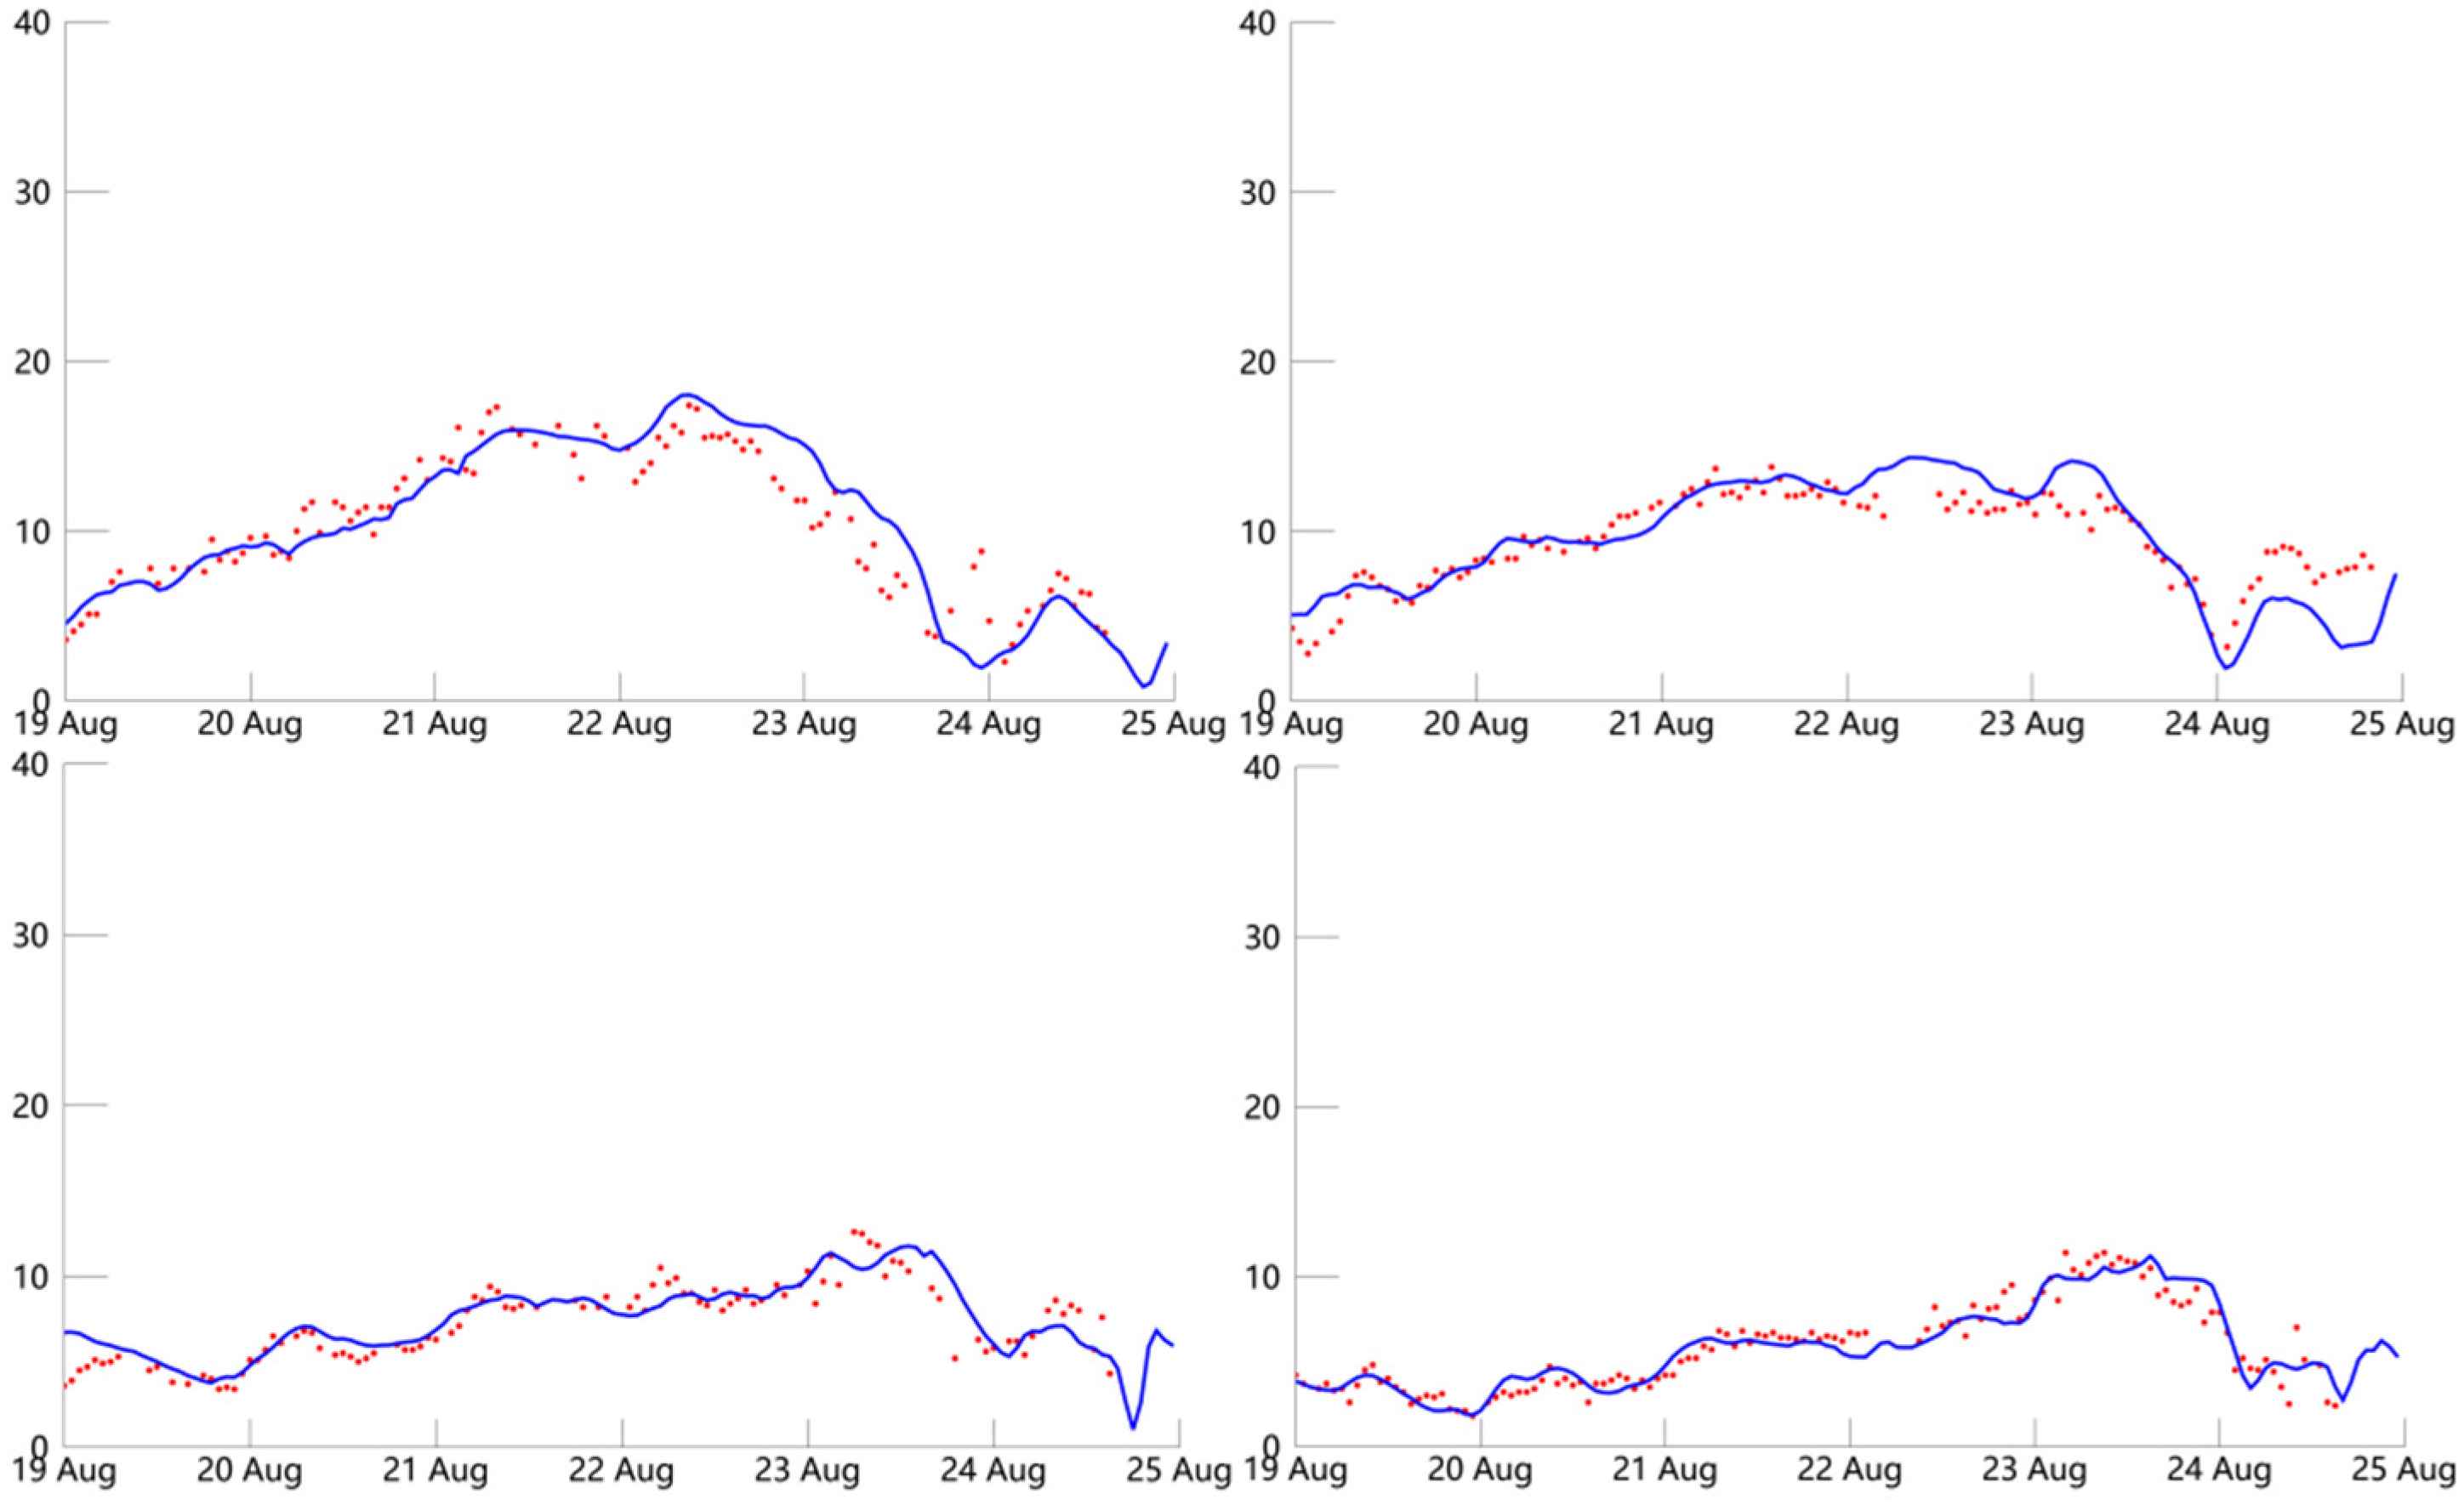
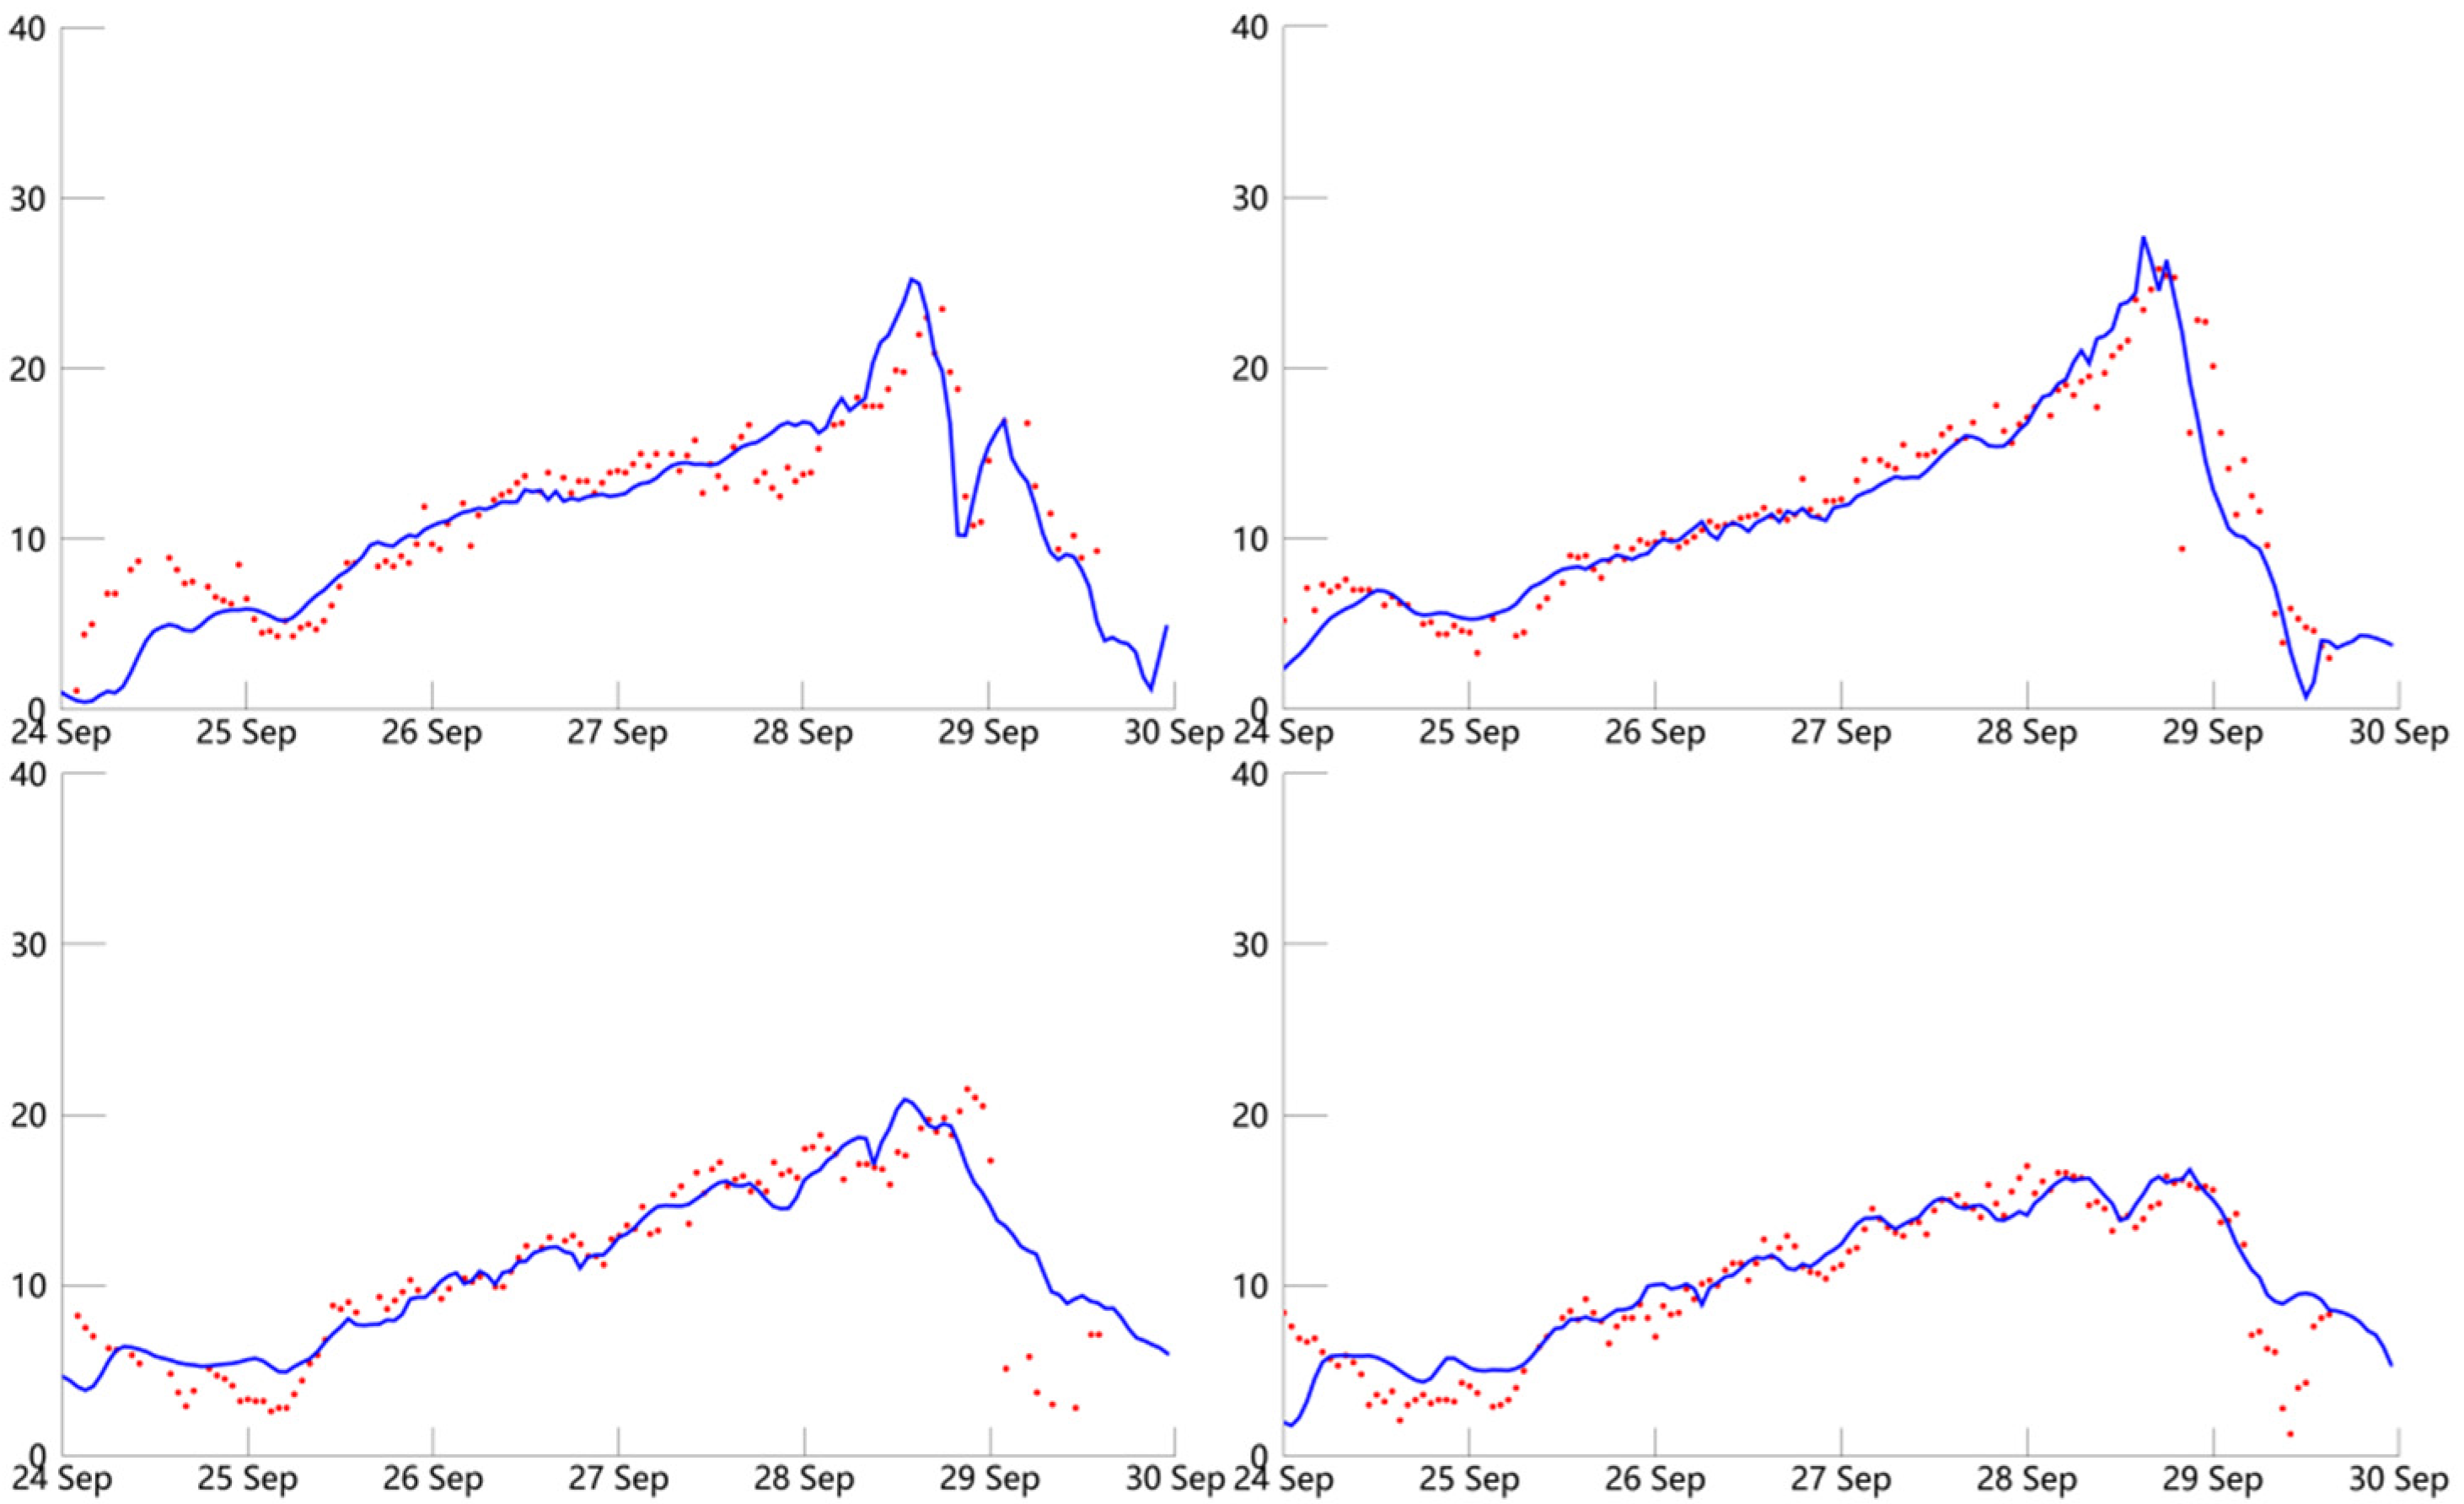
The temporal distributions of the simulated wind speed in the best simulation experiments for the three typhoons are shown in Figure 3, Figure 4 and Figure 5 and were compared with the observation data from the buoys. The results suggest that the simulated typhoons with different tracks performed well in the wind speed simulation. The maximum wind speeds were almost accurately simulated, especially in the Dujuan Typhoon.
The mean skill scores of the schemes for the three typhoon events are shown in Table 8, which were calculated using the skill scores of the experiments containing special physical parameterizations. For example, the mean skill score of the Lin scheme is the average value of the Lin-contained experiments, i.e., experiments 1–9. The results suggest that cumulus schemes had the greatest impact on the skill score in the three typhoon simulations. From the perspective of the mean skill score, Morrison was the best microphysical scheme in the three typhoon events. In the three pairs of longwave/shortwave radiation schemes, CAM/CAM performed best for typhoons Goni and Meranti, while RRTM/Dudhia exhibited the best performance for typhoon Dujuan. KF was the best cumulus scheme for typhoon Goni, and TDK performed best for typhoons Dujuan and Meranti. In summary, Morrison, CAM/CAM, and KF produced the best experiment (experiment 22) for typhoon Goni according to the highest mean skill score. However, this result is inconsistent with the above results, which indicates that the schemes might affect each other, and the total performance of parameterization combinations does not equal the sum of single parameterization. A similar situation was also observed for typhoon Dujuan.
3.2. Evaluation of the Wind Direction Simulation
Wind direction is another basic parameter in wind simulations other than wind speed. The accuracy of the simulated wind direction also significantly affects the wave simulation. The direction of the north wind is 0 degrees, the east wind is 90 degrees, the south wind is 180 (−180) degrees, and the west wind is −90 degrees. Taylor diagrams of the wind direction for the three typhoon events and 27 experiments are shown in Figure 6.
The result indicates that the wind direction errors in the three typhoon events were different from the wind speed errors, which demonstrates that the same physical parameterization had different effects on the wind speed and wind direction. The choice of physical parameterization had a significant impact on the wind direction accuracy, especially in the Dujuan simulation. In addition, there is a clear gap between the performances of ensemble prediction and the best experiment, especially in the Dujuan and Meranti simulations.
The R, σn, and En statistics for the wind direction simulation are shown in Table 9, Table 10 and Table 11. In the three statistics, the difference between the worst value and the best value was larger than that observed in the wind speed simulation. According to the best value, the ranking of performance in the three typhoon events was Dujuan > Goni > Meranti. The best simulation experiments in the three statistics were different from each other; thus, the skill score was helpful in assessing the overall performance of the experiments. The skill score results suggest that experiments 26 (90.43), 23 (92.39), and 2 (86.60) were the best experiments for typhoons Goni, Dujuan, and Meranti. The differing best simulation experiments in the three typhoon events show that the performance of physical parameterization changed with typhoon tracks.
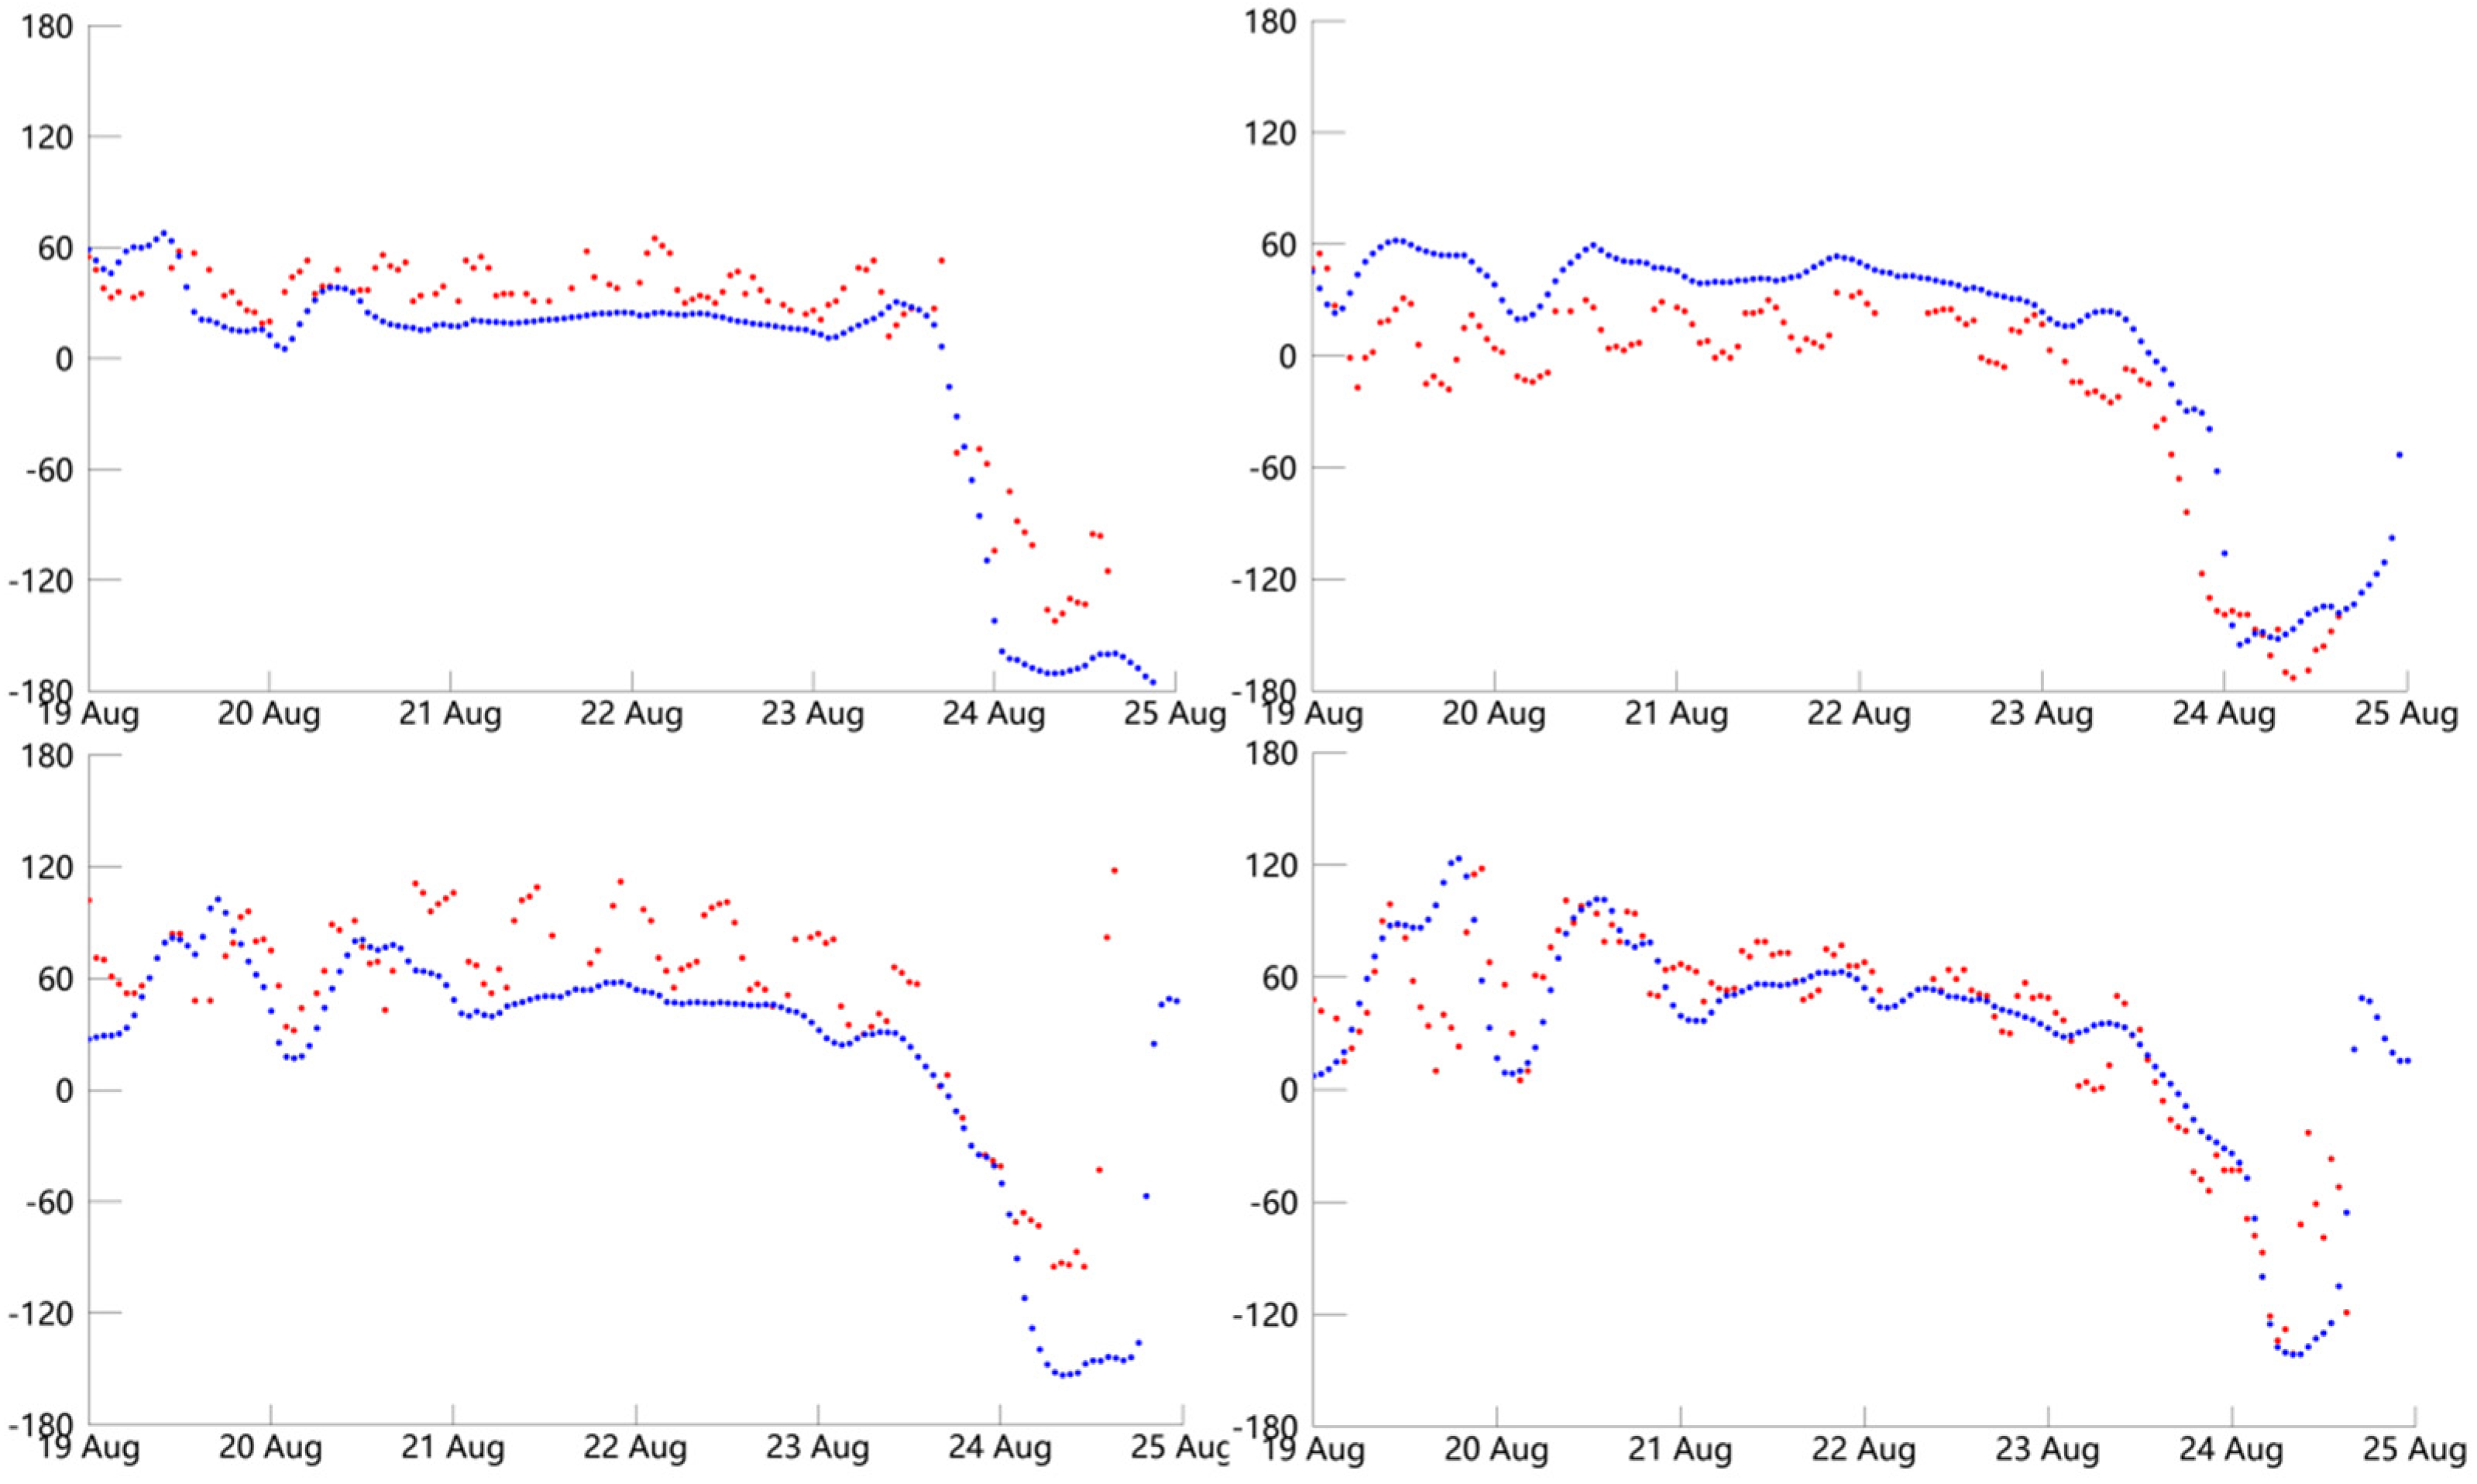
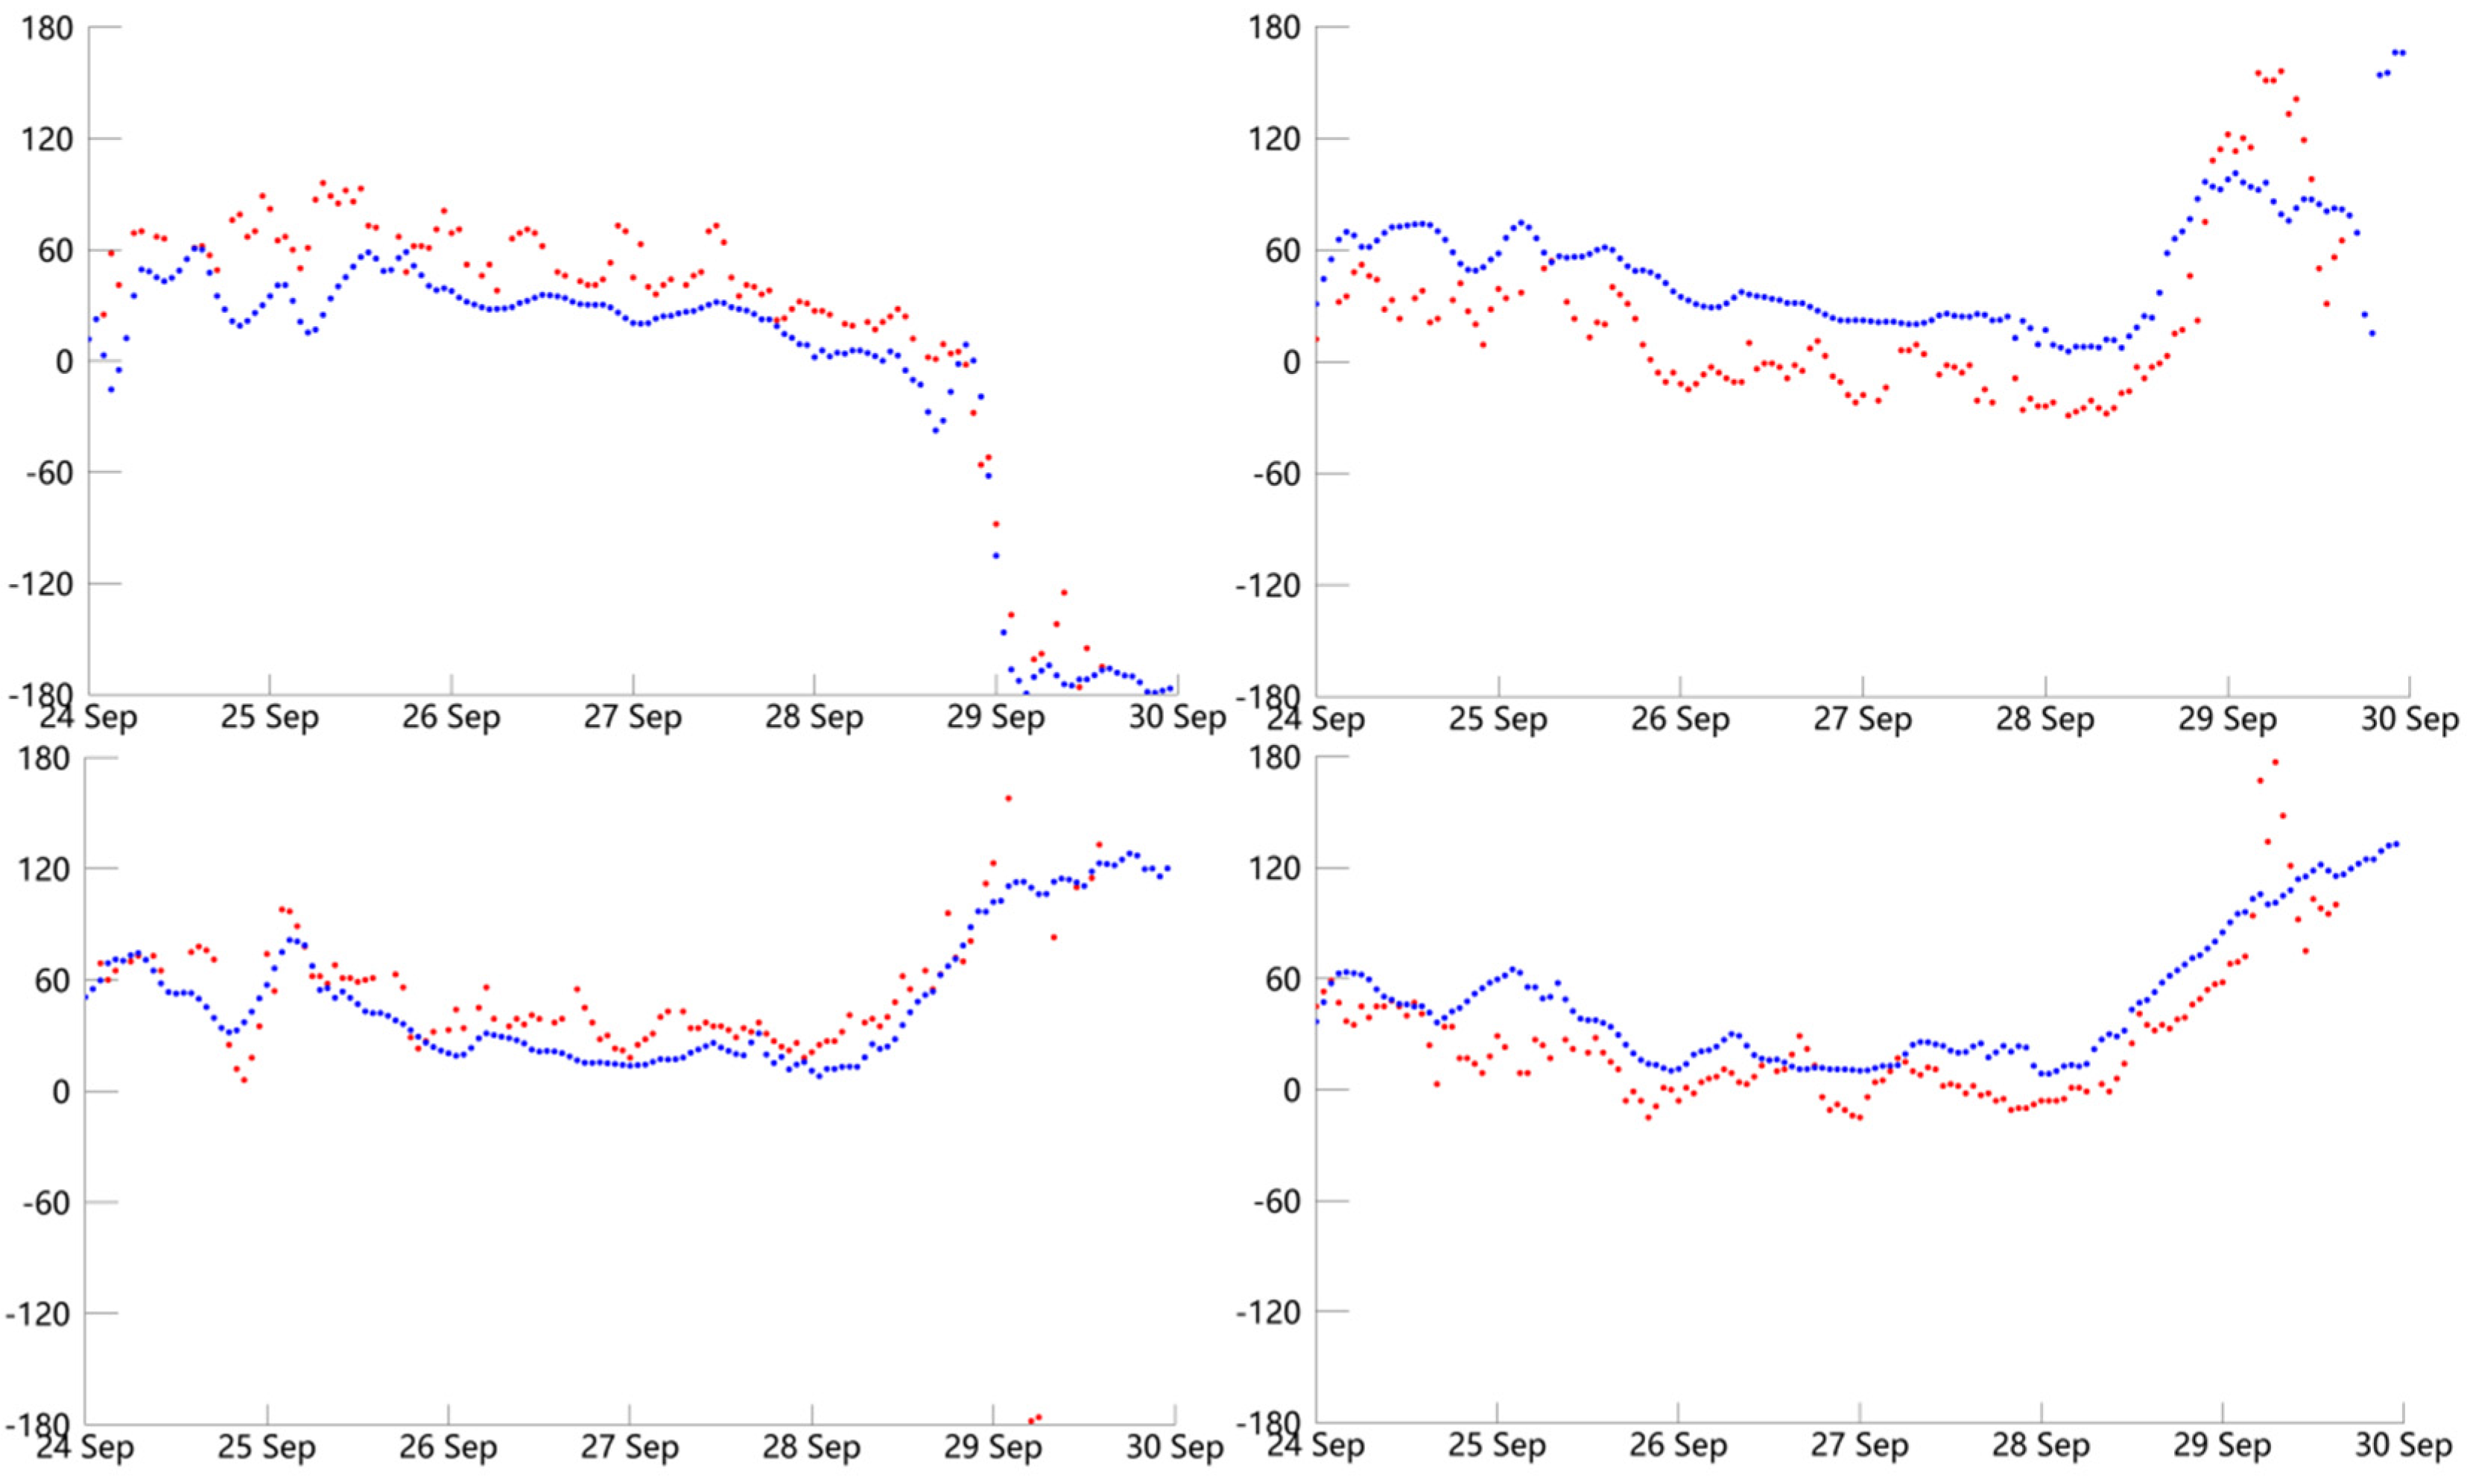
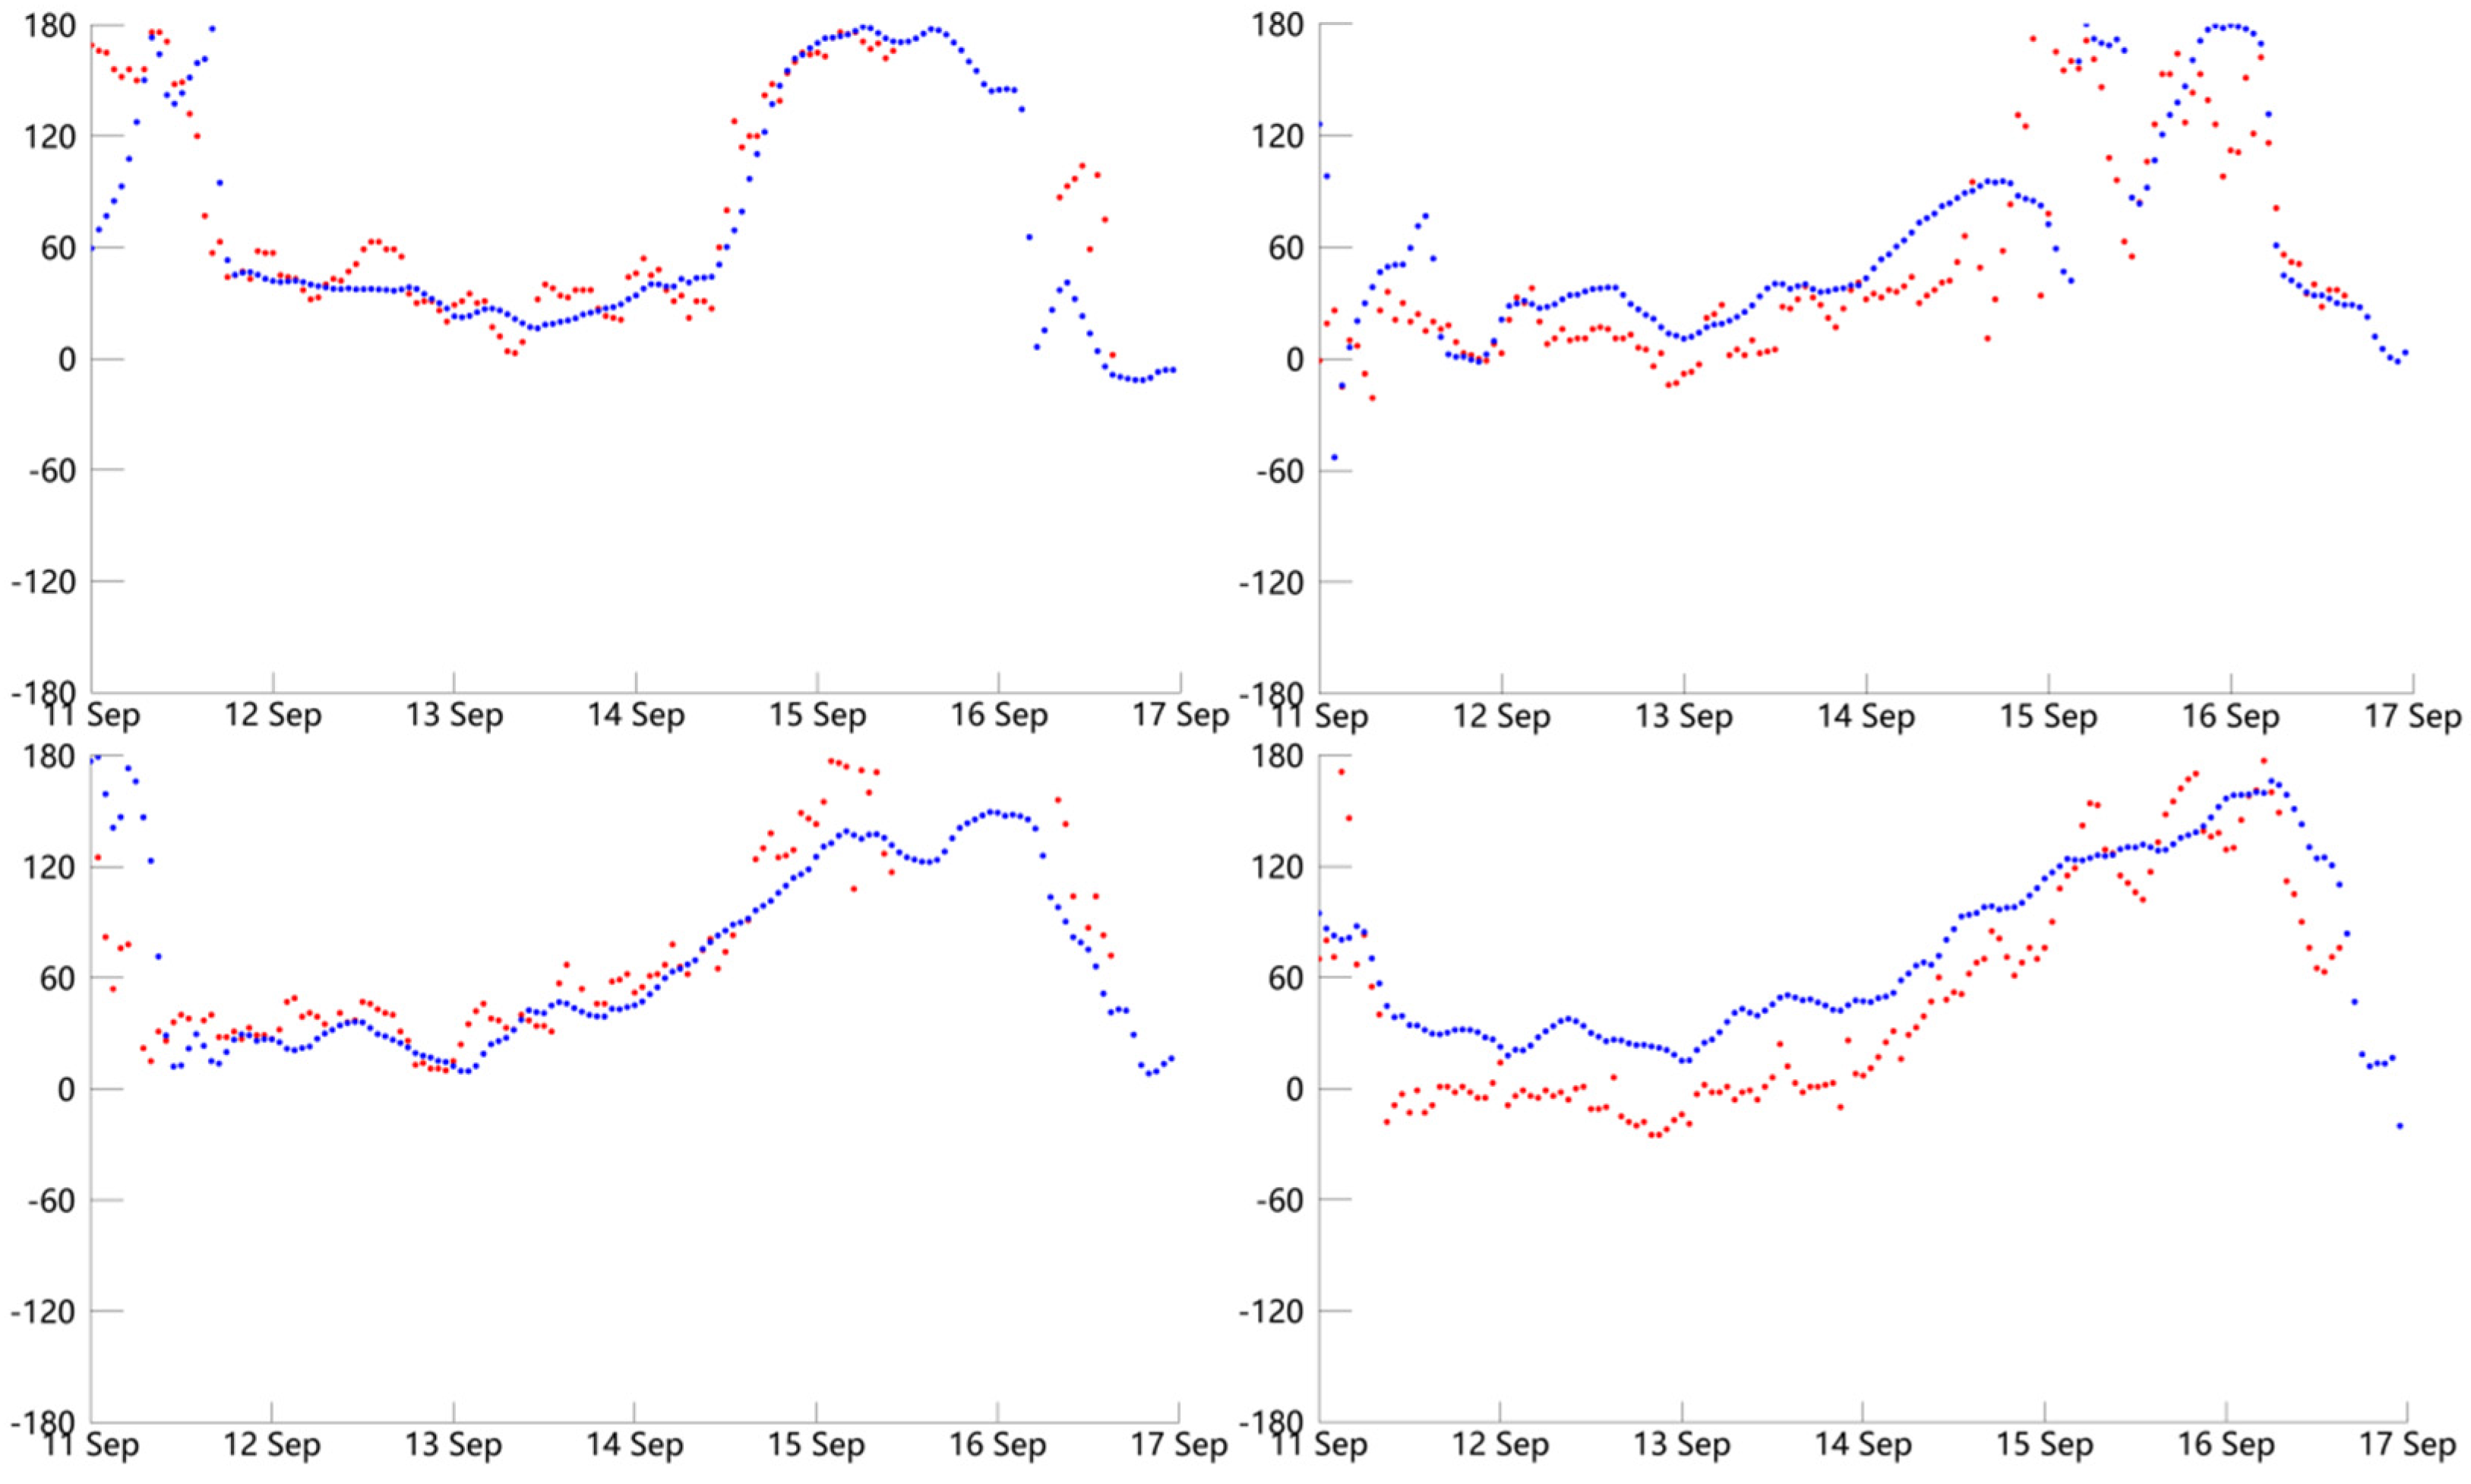
The temporal distributions of the simulated wind directions in the best simulation experiments for the three typhoons are shown in Figure 7, Figure 8 and Figure 9 and were compared with the observation data from the buoys. The results indicate that there were certain differences between the simulated wind directions and buoy observations, especially for the Meranti simulation. Because the temporal resolution of the meteorological reanalysis data was only 6 h, certain small-scale wind direction changes might not have been simulated well. However, the wind direction trends were approximately accurate for the three typhoon events.
The mean skill scores for each physical scheme for the three typhoon events are shown in Table 12. From the perspective of mean skill score, experiments 27 and 13 were the best simulation experiments for typhoons Goni and Meranti, which is different from the above results and demonstrates that 27 experiments were necessary. According to the mean skill score, longwave/shortwave radiation had the greatest effect on the skill score of the simulated wind directions.
The different errors, the best simulation experiments, and the scheme sensitivities in the wind speed and wind direction simulations suggest that the effects of physical parameterization on the wind speed and wind direction were different.
3.3. Evaluation of the Significant Wave Height Simulation
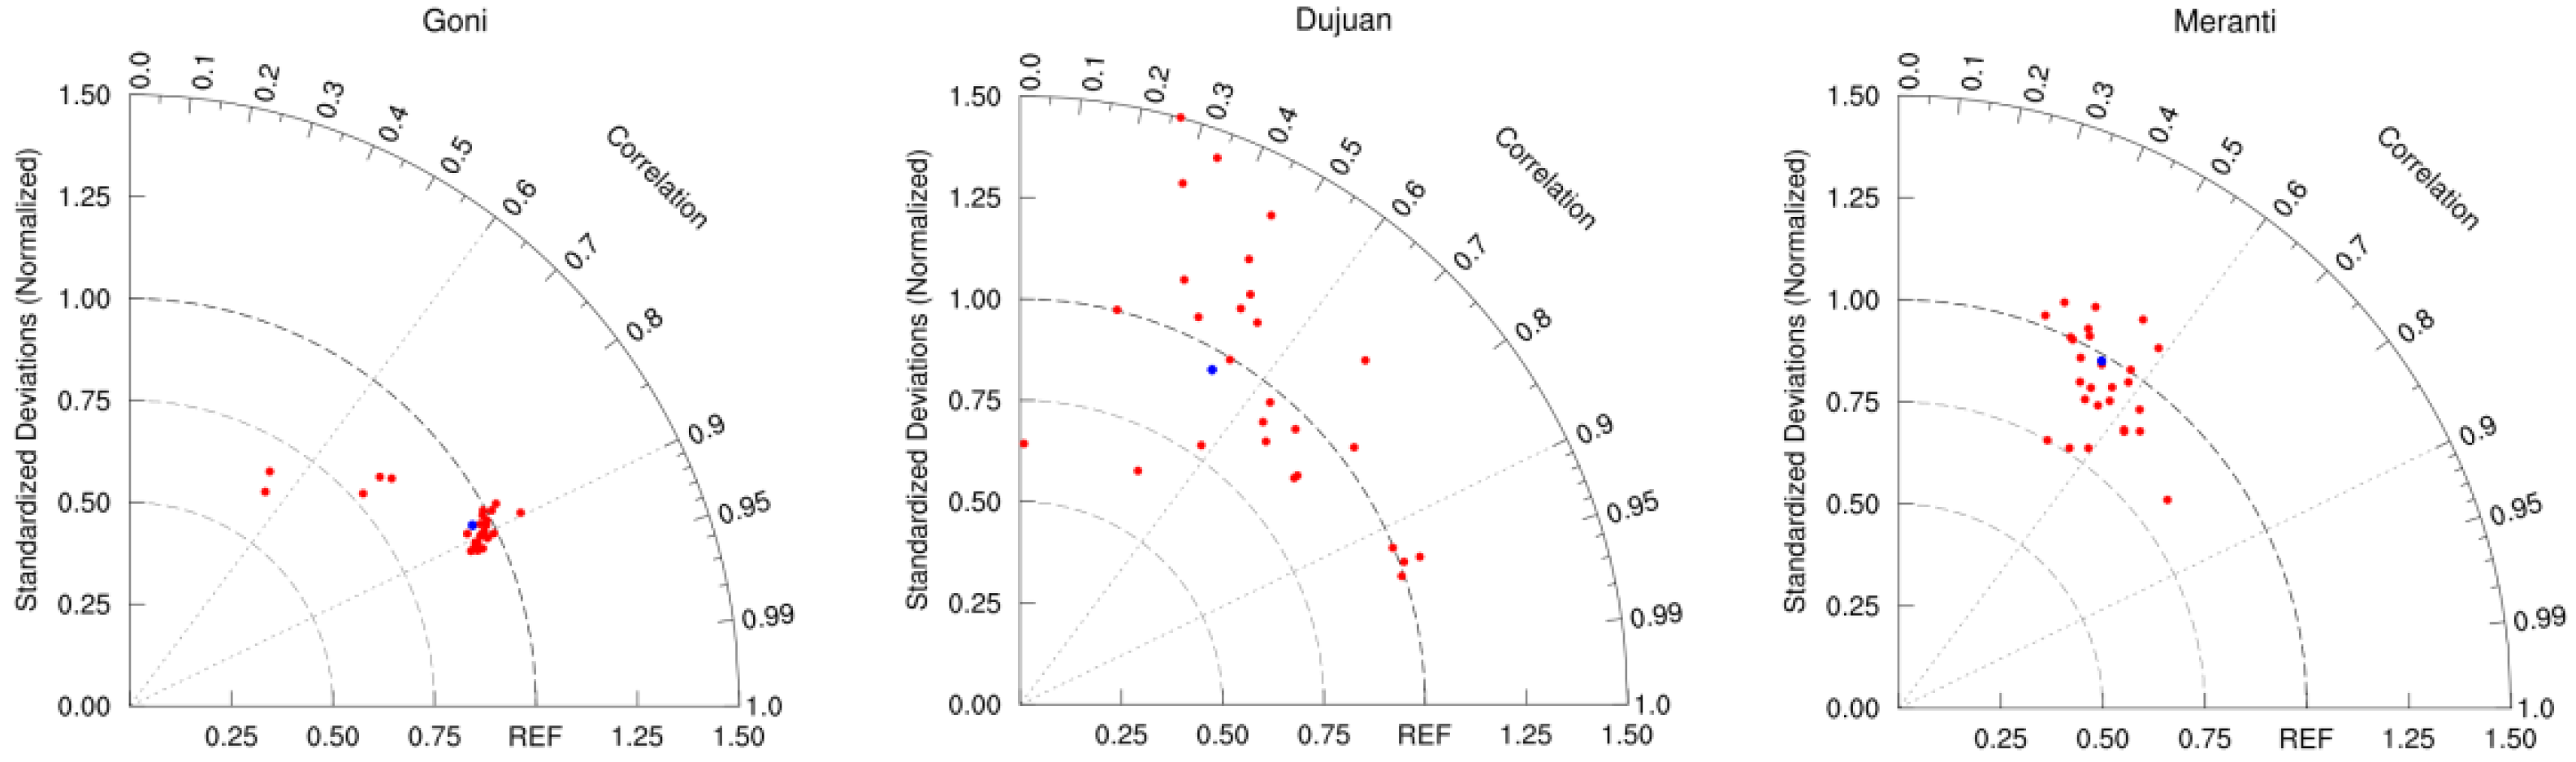
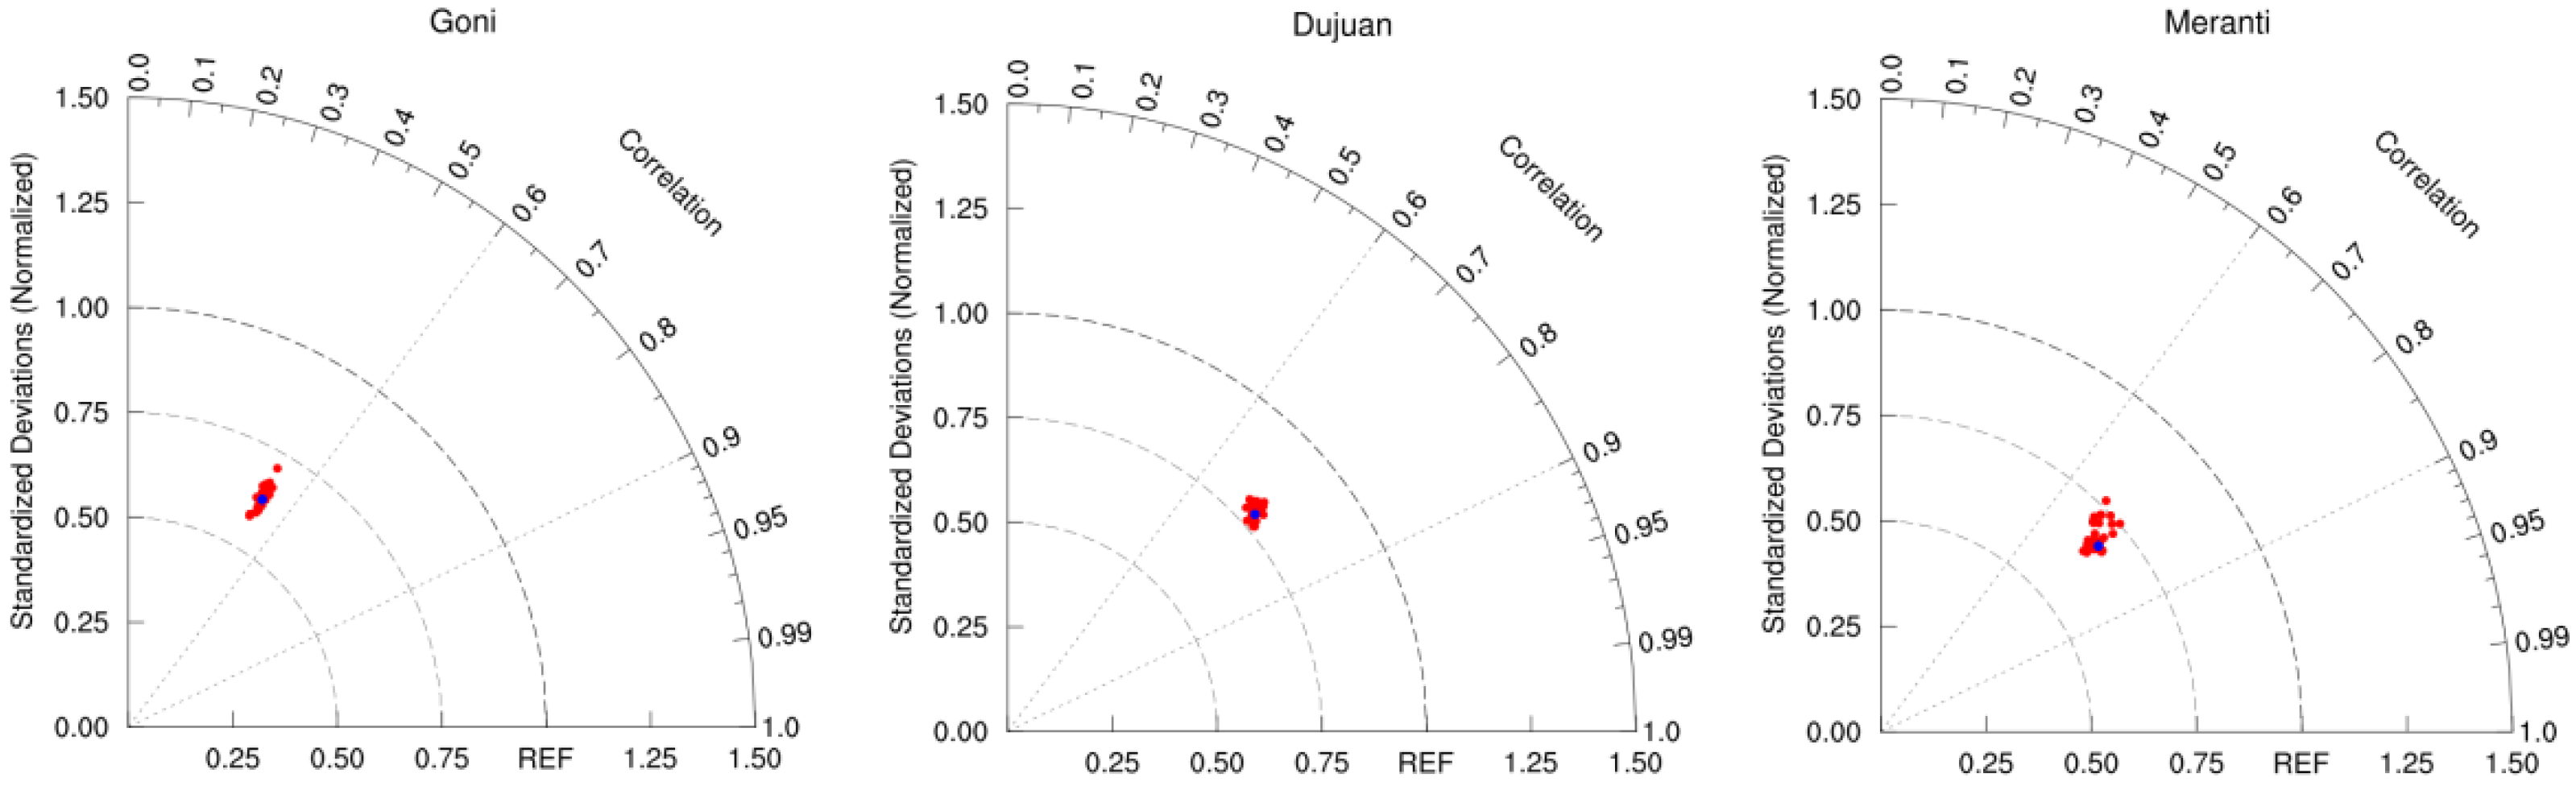
The accuracy of the simulated wind speed and wind direction both had a significant impact on the significant wave height simulation. However, the performance of physical parameterizations and the best simulation experiments were different for the wind speed and wind direction. It remains a question whether a suitable simulation experiment for significant wave height would refer to the wind speed simulation or the wind direction simulation. To address the question, wind data obtained from 27 experiments for each typhoon event were provided to simulate the significant wave height in the SWAN model. The results were used to analyze the effect of WRF physical parameterization combinations on the accuracy of the significant wave height simulation. Taylor diagrams of the significant wave height during the three typhoon events are shown in Figure 10.
The result indicates that the significant wave height simulation error was different from that observed in the wind speed and wind direction simulations and was influenced by both of them. However, the significant wave height error was similar to the wind speed error, and the differences caused by the experiments were relatively small. The rankings of ensemble prediction in three typhoon simulations were all almost between the 10th and 20th.
The R, σn, and En statistics of the significant wave height simulation are shown in Table 13, Table 14 and Table 15. In the three statistics, the error ranges were the smallest among the three parameters. According to the best value, the ranking of performance for the three typhoon events is Dujuan > Meranti > Goni, which is consistent with the wind speed result. The best simulation experiments in the three statistics were also different, so the skill score was necessary to evaluate the experiment performances of the three physical parameters and the three typhoon tracks. The skill score results suggest that experiments 19 (71.47), 1 (83.96), and 20 (80.99) were the best simulation experiments for typhoons Goni, Dujuan, and Meranti. The best simulation experiments for the significant wave height in the three typhoon events were different from that observed for the wind speed and wind direction because significant wave height is related to both of them. Therefore, the suitable physical parameterization combinations for the significant wave height should be considered alone, and the best choice should not be simply selected from the wind speed or direction simulations. In addition, interestingly, some experiments had better performances in terms of wind speed and wind direction compared to the best experiments for the significant wave height. This indicates that the total effect of wind on the accuracy of the significant wave height does not simply equal the sum of the performances of the wind speed and wind direction.
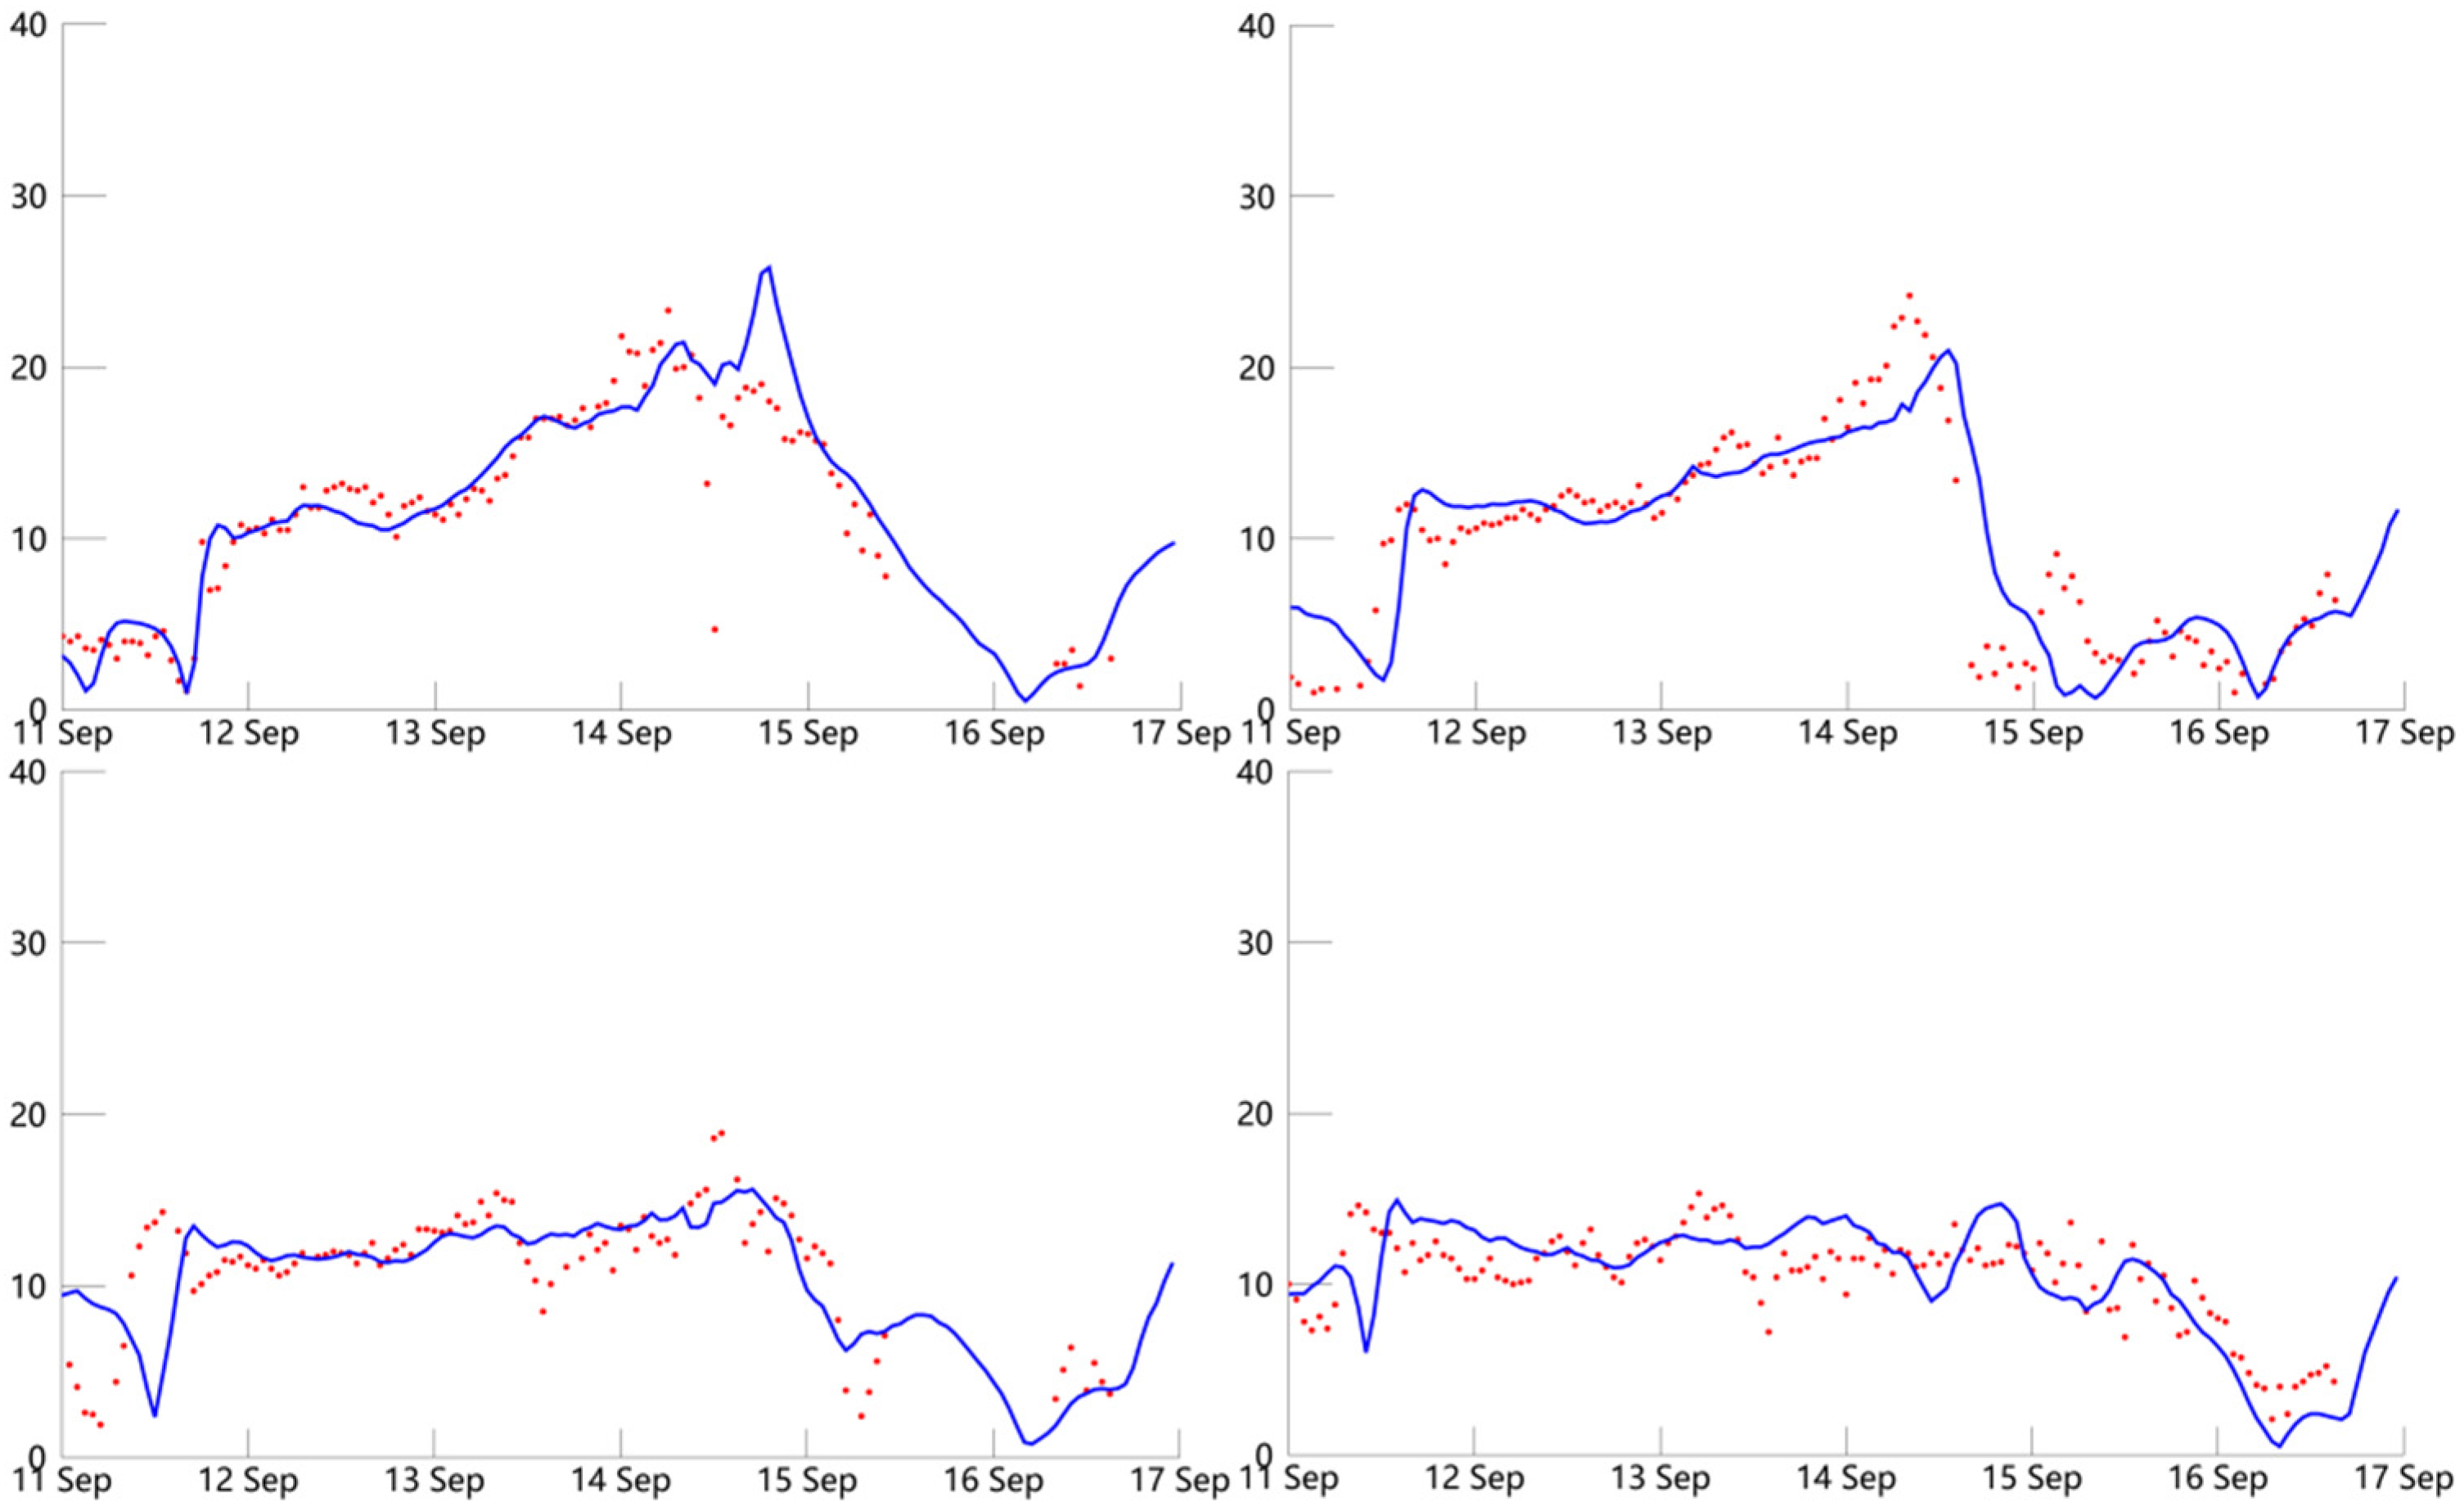
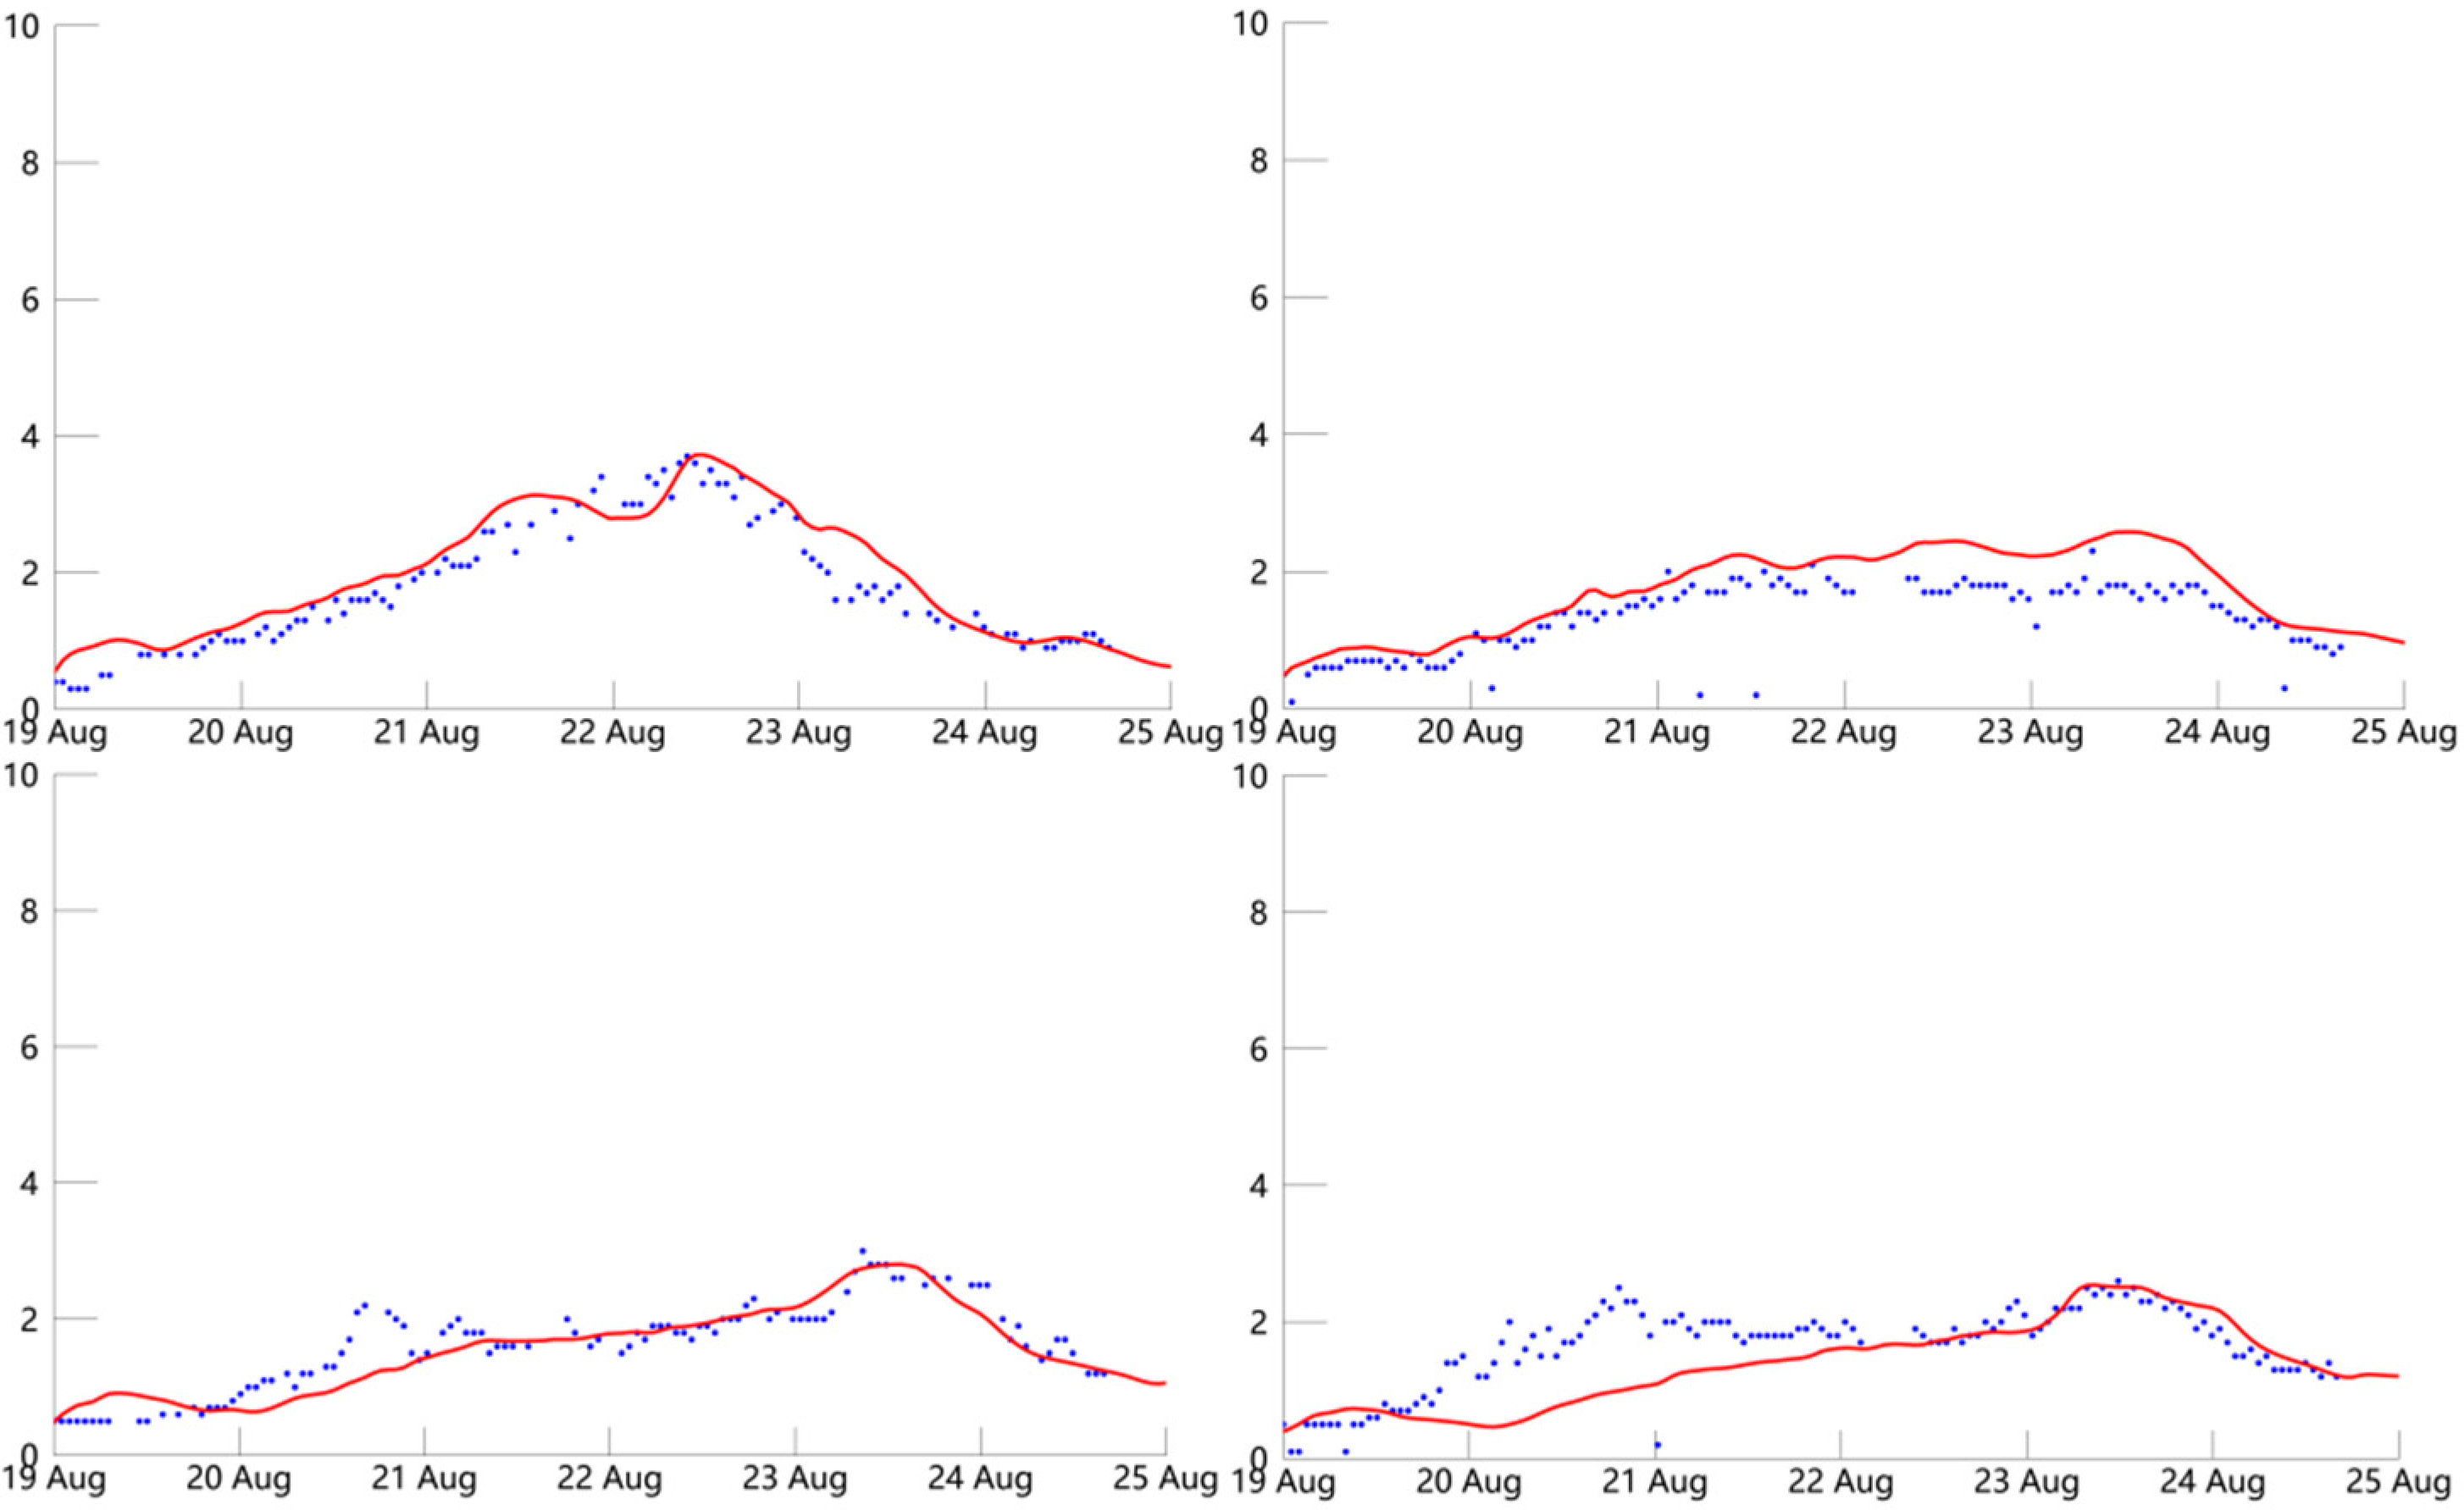
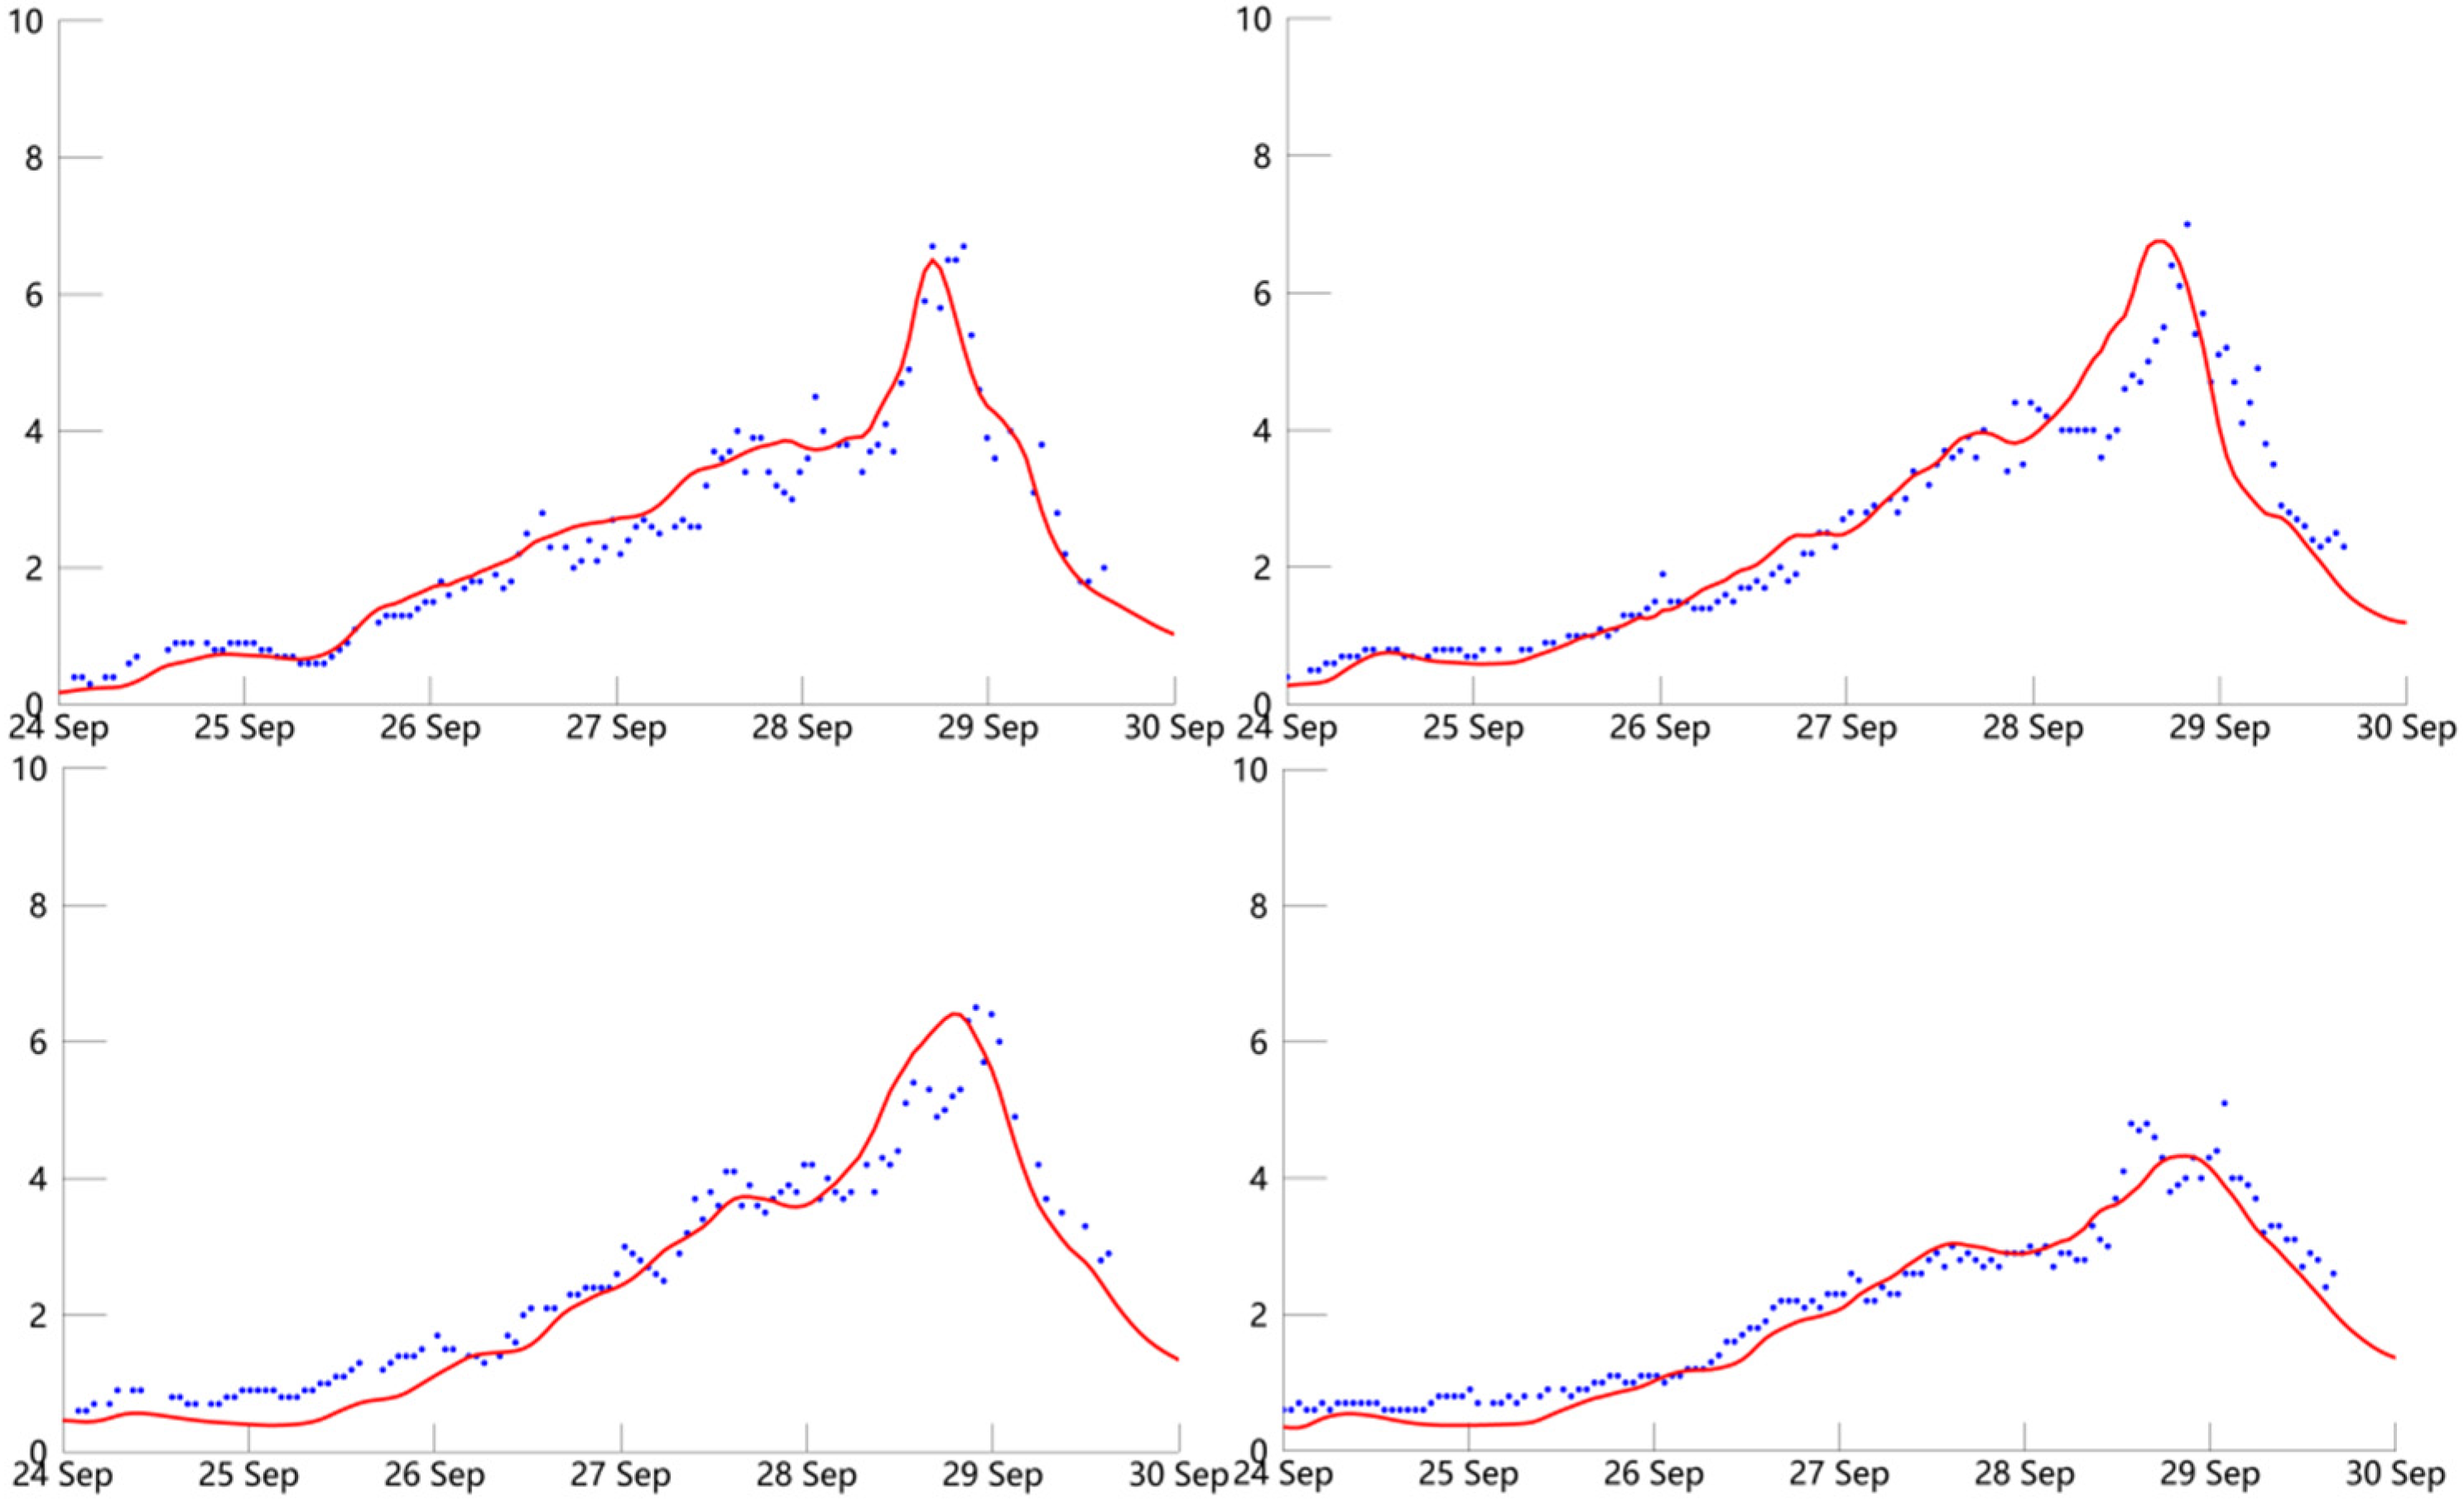
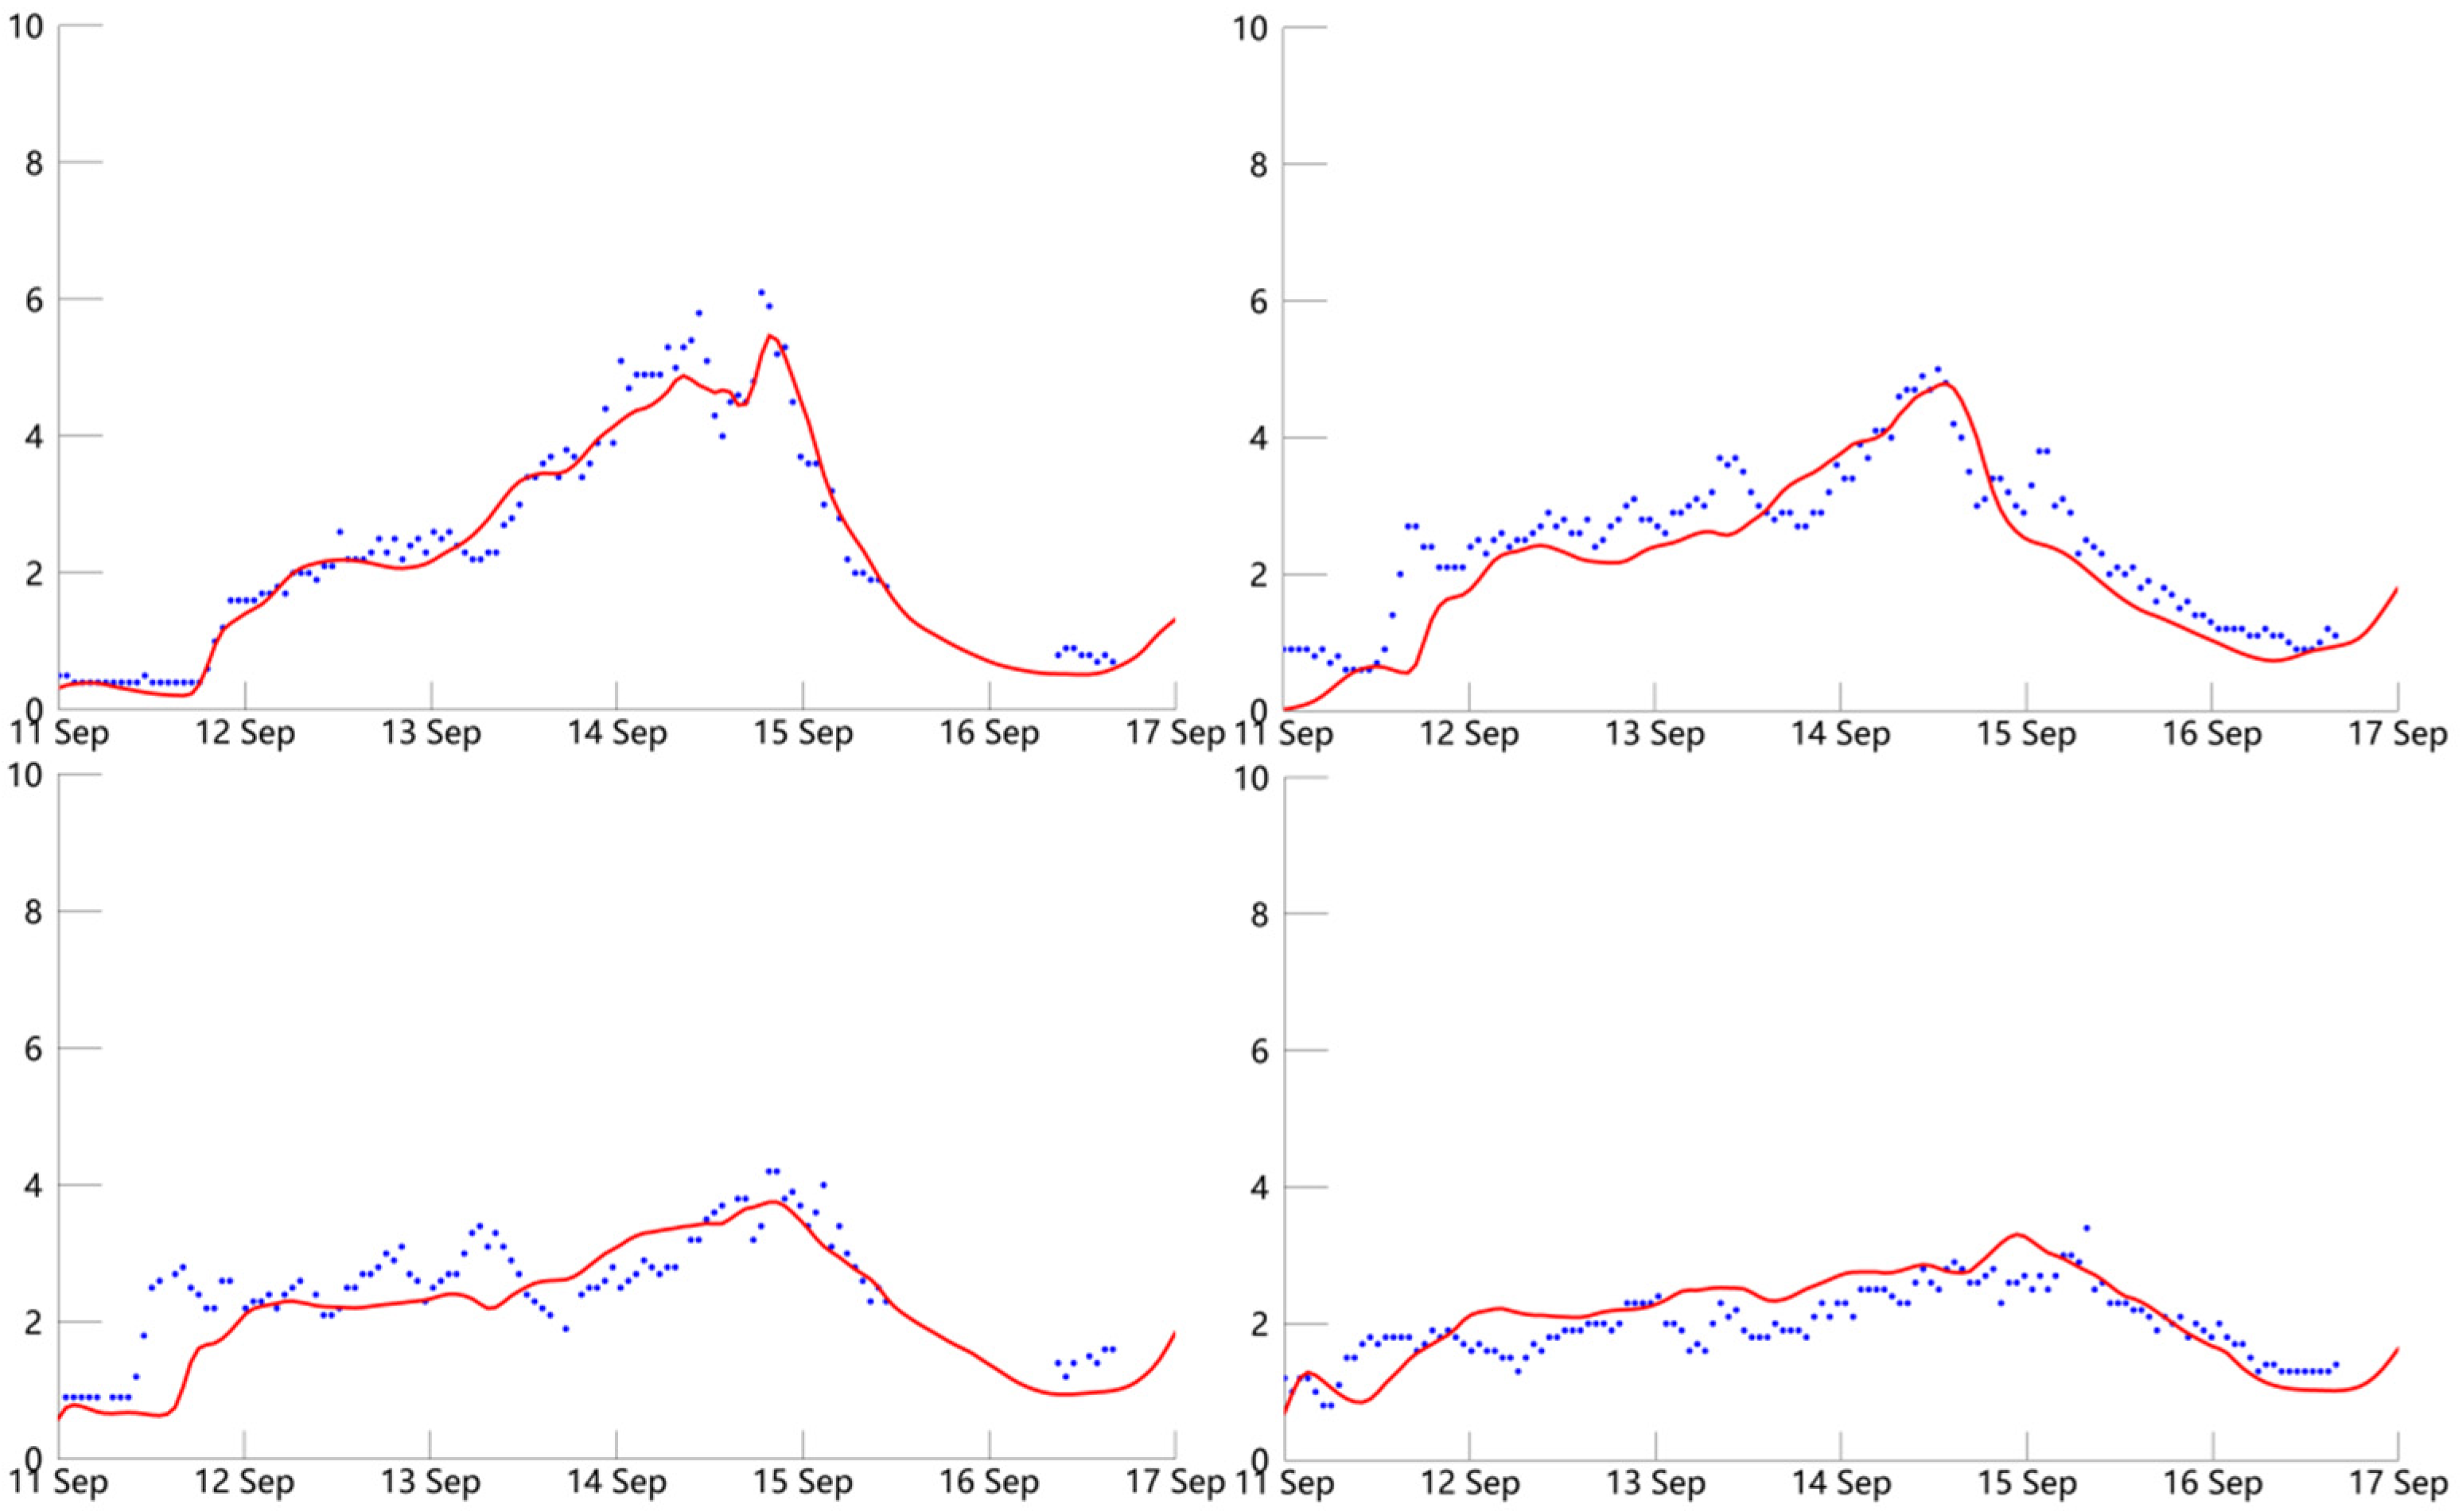
The temporal distributions of the simulated significant wave heights from the best simulation experiments for the three typhoons are shown in Figure 11, Figure 12 and Figure 13 and were compared with the observation data from the buoys. The trend of the simulated significant wave height was similar to that of the buoy observations, and high values were simulated with relative accuracy. The changes in significant wave height during typhoons Dujuan and Meranti were more intense compared to those during typhoon Goni, which might have been influenced by the different typhoon tracks.
The mean skill scores of each physical scheme for the three typhoon events are shown in Table 16. The differences caused by microphysics parameterizations were the smallest, and longwave/shortwave radiation parameterizations had the most obvious impact on the skill scores for the three typhoons. The results are consistent with the schemes’ sensitivities for wind direction.
3.4. Applicability of the Best Simulation Experiments
The above results show the best simulation experiments for different parameters and typhoon tracks. However, the applicability of the best simulation experiments derived from typhoons Goni, Dujuan, and Meranti remains to be analyzed. Three typhoons with similar tracks (Noul, Soudelor, and Nepartak; Figure 14) were simulated using 27 experiments.
The results suggest that the ensemble prediction of 27 experiments was not the best. The best simulation experiments for typhoons Goni, Dujuan, and Meranti are the best simulation experiments for typhoons with similar tracks. The skill scores of the wind speed, wind direction, and significant wave height obtained from the best simulation experiments for the three typhoons are shown in Table 17. The ranking of best performances in different parameters is wind direction > wind speed > significant wave height, which is consistent with the results observed for typhoons Goni, Dujuan, and Meranti.
4. Conclusions
Three typhoon events (Goni, Dujuan, and Meranti) were selected to investigate the effects of WRF physical parameterization combinations on the accuracy of wind and wave estimations in the Taiwan Strait. Twenty-seven experiments were designed using three microphysics, longwave/shortwave radiation, and cumulus schemes. Wind speed, wind direction, and significant wave height from the 27 experiments were assessed using Taylor diagrams. The skill score and mean skill score of single schemes were used to establish the best simulation experiments and scheme sensitivities in different situations.
The results suggest that the choice of simulation experiments has a significant influence on the accuracy of the wind and wave estimations in the WRF-SWAN model. The ranking of influence on parameters was wind direction > wind speed > significant wave height. Significant wave height errors depend on the wind speed error and wind direction error, but the total error of wind speed and wind direction does not simply equal the sum of their errors.
The performance of the physical parameterization combination does not equal the sum of single schemes’ performances. The best simulation experiments for typhoon estimation change with varying parameters and typhoon tracks. In wind speed simulation, experiment 12 was the best choice for typhoon Dujuan and experiment 19 was the best choice for typhoon Goni and Meranti. From the perspective of wind direction simulation, experiments 26, 23, and 2 had the best performances for typhoons Goni, Dujuan, and Meranti. Furthermore, experiments 19, 1, and 20 performed best in significant wave height simulation for typhoons Goni, Dujuan, and Meranti. When using the best simulation experiments, the accuracy of the three parameters improved significantly, and the results were relatively accurate. The skill scores of three parameters were all over 70 for typhoon Dujuan and 80 for typhoon Dujuan and Meranti. To investigate the applicability of the best simulation experiments, three typhoons with similar tracks (Noul, Soudelor, and Nepartak) were selected. The results indicate that the best simulation experiments also performed best in typhoons with similar tracks. In addition, scheme sensitivity is related to the parameters. The most sensitive scheme type was shown to be cumulus for the wind speed simulation and longwave/shortwave radiation for the wind direction and significant wave height.
This study will help scientists choose suitable physical parameterization combinations for the WRF-SWAN model and improve simulation accuracy.
In addition, the air-sea interaction process is an important topic in numerical simulations. In the WRF-SWAN model, the WRF model provides the wind input with a high spatial and temporal resolution to the SWAN model, which improves the accuracy of the simulated wave. In addition, the accuracy of the wind estimation can be improved when the SWAN model provides the sea surface roughness to the WRF model. This will form the basis of our future research direction.
Author Contributions
Conceptualization, S.S.; Funding acquisition, S.S.; Investigation, C.L.; Resources, Z.H., G.W., F.Z. and L.W.; Writing-original draft, C.L.; Writing-review & editing, Y.X. All authors have read and agreed to the published version of the manuscript.
Funding
This work was funded by two grants from the National Key Research and Development Project of China (Grants 2017YFC1404800 and 2016YFC1401104), the Marine Economic Development Subsidy Project of Fujian, China (Grant ZHHY-2019-2), and Fujian science and technology Major special project (2022NZ033023).
Data Availability Statement
The data presented in this study are available on request from the corresponding author.
Acknowledgments
We are grateful to Fujian Marine Forecasts for supplying the buoy data.
Conflicts of Interest
The authors declare no conflict of interest.
References
- Chen, F.; Jia, H.; Du, E.; Wang, L.; Wang, N.; Yang, A. Spatiotemporal Variations and Risk Analysis of Chinese Typhoon Disasters. Sustainability 2021, 13, 2278. [Google Scholar] [CrossRef]
- Dawson, R.J.; Hall, J.W.; Bates, P.D.; Nicholls, R.J. Quantified Analysis of the Probability of Flooding in the Thames Estuary under Imaginable Worst-case Sea Level Rise Scenarios. Int. J. Water Resour. Dev. 2005, 21, 577–591. [Google Scholar] [CrossRef]
- Li, J.; Nie, B. Storm surge prediction: Present status and future challenges. Procedia IUTAM 2017, 25, 3–9. [Google Scholar] [CrossRef]
- Emanuel, K. Increasing destructiveness of tropical cyclones over the past 30 years. Nature 2005, 436, 686–688. [Google Scholar] [CrossRef]
- Liu, Y.; Sun, Z.; Chen, M.; Huang, H.L.A.; Gao, W. Assimilation of atmospheric infrared sounder radiances with WRF-GSI for improving typhoon forecast. Front. Earth Sci. 2018, 12, 457–467. [Google Scholar] [CrossRef]
- Shen, F.; Xue, M.; Min, J. A comparison of limited-area 3DVAR and ETKFEn3DVAR data assimilation using radar observations at convective scale for the prediction of Typhoon Saomai (2006). Meteorol. Appl. 2017, 24, 628–641. [Google Scholar] [CrossRef] [Green Version]
- Du, M.; Hou, Y.; Hu, P.; Wang, K. Effects of Typhoon Paths on Storm Surge and Coastal Inundation in the Pearl River Estuary, China. Remote Sens. 2020, 12, 1851. [Google Scholar] [CrossRef]
- Suh, S.W.; Lee, H.Y.; Kim, H.J. Spatio-temporal variability of tidal asymmetry due to multiple coastal constructions along the west coast of Korea. Estuar. Coast. Shelf Sci. 2014, 151, 336–346. [Google Scholar] [CrossRef]
- Zhu, M.S.; Sun, T.; Shao, D. Impact of Land Reclamation on the Evolution of Shoreline Change and Nearshore Vegetation Distribution in Yangtze River Estuary. Wetlands 2016, 36, 11–17. [Google Scholar] [CrossRef]
- Patel, P.; Ghosh, S.; Kaginalkar, A.; Islam, S.; Karmakar, S. Performance evaluation of WRF for extreme flood forecasts in a coastal urban environment. Atmos. Res. 2019, 223, 39–48. [Google Scholar] [CrossRef]
- Liguori, S.; Rico-Ramirez, M.A.; Schellart, A.N.A.; Saul, A.J. Using probabilistic radar rainfall nowcasts and NWP forecasts for flow prediction in urban catchments. Atmos. Res. 2012, 103, 80–95. [Google Scholar] [CrossRef]
- Luo, C.; Wang, W.; Sheng, L.; Zhou, Y.; Hu, Z.; Qu, W.; Li, X.; Hai, S. Influence of polluted dust on chlorophyll-a concentration and particulate organic carbon in the subarctic North Pacific Ocean based on satellite observation and the WRF-Chem simulation. Atmos. Res. 2020, 236, 104812. [Google Scholar] [CrossRef]
- Von Schuckmann, K.; Le Traon, P.Y.; Smith, N.; Pascual, A.; Djavidnia, S.; Gattuso, J.P.; Grégoire, M.; Aaboe, S.; Alari, V.; Alexander, B.E. Copernicus Marine Service Ocean State Report, Issue 5. J. Oper. Oceanogr. 2021, 14, 1–185. [Google Scholar] [CrossRef]
- Evans, J.P.; Ekström, M.; Ji, F. Evaluating the performance of a WRF physics ensemble over South-East Australia. Clim. Dyn. 2012, 39, 1241–1258. [Google Scholar] [CrossRef]
- Tian, J.; Liu, J.; Yan, D.; Li, C.; Chu, Z.; Yu, F. An assimilation test of Doppler radar reflectivity and radial velocity from different height layers in improving the WRF rainfall forecasts. Atmos. Res. 2017, 198, 132–144. [Google Scholar] [CrossRef]
- Dutta, S.; Satyanarayana, A. Sensitivity studies of cloud microphysical schemes of WRF-ARW model in the simulation of trailing stratiform squall lines over the Gangetic West Bengal region. J. Atmos. Sol.-Terr. Phys. 2020, 209, 105396. [Google Scholar]
- Ratnam, J.V.; Behera, S.K.; Krishnan, R.; Doi, T.; Ratna, S.B. Sensitivity of Indian summer monsoon simulation to physical parameterisation schemes in the WRF model. Clim. Res. 2017, 74, 43–66. [Google Scholar] [CrossRef] [Green Version]
- Sharma, A.; Fernando, H.J.S.; Hamlet, A.F.; Hellmann, J.J.; Barlage, M.; Chen, F. Urban meteorological modeling using WRF: A sensitivity study. Int. J. Climatol. 2017, 37, 1885–1900. [Google Scholar] [CrossRef]
- Wang, W.; Luo, C.; Sheng, L.; Zhao, C.; Zhou, Y.; Chen, Y. Effects of biomass burning on chlorophyll-a concentration and particulate organic carbon in the subarctic North Pacific Ocean based on satellite observations and WRF-Chem model simulations: A case study. Atmos. Res. 2021, 254, 105526. [Google Scholar] [CrossRef]
- Kulaya, K.; Sujittra, R.; Pakpoom, R. Sensitivity of different physics schemes using WRF model in Typhoon Damrey (2017) over the Indochina region. J. Phys. Conf. Ser. 2021, 2145, 012046. [Google Scholar]
- Bethel, B.J.; Dong, C.; Zhou, S.; Cao, Y. Bidirectional Modeling of Surface Winds and Significant Wave Heights in the Caribbean Sea. J. Mar. Sci. Eng. 2021, 9, 547. [Google Scholar] [CrossRef]
- Florin, O.; Liliana, R.; Gabriel, C.; Eugen, B.R. Wave Farms Impact on the Coastal Processes-A Case Study Area in the Portuguese Nearshore. J. Mar. Sci. Eng. 2021, 9, 262. [Google Scholar]
- Ou, S.; Liau, J.; Hsu, T.; Tzang, S. Simulating typhoon waves by SWAN wave model in coastal waters of Taiwan. Ocean Eng. 2002, 29, 947–971. [Google Scholar] [CrossRef]
- Yuksel, Y.; Yuksel, Z.T.; Islek, F.; Sahin, C.; Ari, G.H.A. Spatiotemporal long-term trends of wind and wave climate and extreme characteristics over the Sea of Marmara. Ocean Eng. 2021, 228, 108946. [Google Scholar] [CrossRef]
- Holthuijsen, L.H.; Booij, N.; Ris, R.C.; Andorka Gal, J.H.; de Jong, J.C.M. A verification of the third-generation wave model SWAN along the southern north sea coast. In Proceedings of the 3rd International Symposium on Ocean Wave Measurement and Analysis, Virginia Beach, VA, USA, 3–7 November 1997; pp. 49–63. [Google Scholar]
- Guo, X.; Du, J.; Bolaños, R.; Larsen, S. On the impact of wind on the development of wave field during storm Britta. Ocean Dyn. 2017, 67, 1407–1427. [Google Scholar]
- Kenny, T.C.; Lim, K.S.; Dong, C.; Liu, H.; Wu, R.; Zhang, H. Effects of Model Coupling on Typhoon Kalmaegi (2014) Simulation in the South China Sea. Atmosphere 2020, 11, 432. [Google Scholar]
- Zambon, J.B.; He, R.; Warner, J.C. Investigation of hurricane Ivan using the coupled ocean-atmosphere-wave-sediment transport (COAWST) model. Ocean Dyn. 2014, 64, 1535–1554. [Google Scholar] [CrossRef]
- Warner, J.C.; Sherwood, C.R.; Signell, R.P.; Harris, C.K.; Arango, H.G. Development of a three-dimensional, regional, coupled wave, current, and sediment-transport model. Comput. Geosci. 2008, 34, 1284–1306. [Google Scholar] [CrossRef]
- Olabarrieta, M.; Warner, J.C.; Armstrong, B.; Zambon, J.B.; He, R. Ocean–atmosphere dynamics during Hurricane Ida and Nor’Ida: An application of the coupled ocean–atmosphere–wave–sediment transport (COAWST) modeling system. Ocean Model. 2012, 43–44, 112–137. [Google Scholar] [CrossRef] [Green Version]
- Mohan, P.R.; Venkata, S.C.; Yesubabu, V.; Baskaran, R.; Venkatraman, B. Simulation of a heavy rainfall event over Chennai in Southeast India using WRF: Sensitivity to microphysics parameterisation. Atmos. Res. 2018, 210, 83–99. [Google Scholar] [CrossRef]
- Mohapatra, G.N.; Rakesh, V.; Ramesh, K.V. Urban extreme rainfall events: Categorical skill of WRF model simulations for localized and non-localized events. Q. J. R. Meteor. Soc. 2017, 147, 2340–2351. [Google Scholar] [CrossRef]
- Otieno, G.; Mutemi, J.N.; Opijah, F.J.; Ogallo, L.A.; Omondi, M.H. The sensitivity of rainfall characteristics to cumulus parameterisation schemes from a WRF model. Pure Appl. Geophys. 2019, 1, 1095–1110. [Google Scholar]
- Gholami, S.; Ghader, S.; Khaleghi, H. Sensitivity of WRF-simulated 10 m wind over the Persian Gulf to different boundary conditions and PBL parameterization schemes. Atmos. Res. 2020, 247, 105–147. [Google Scholar] [CrossRef]
- Shen, J.; Zhang, S.; Zhang, J.; Zeng, M.; Fang, W. Observation of continental shelf wave propagating along the eastern Taiwan Strait during Typhoon Meranti 2016. J. Oceanol. Limnol. 2021, 39, 45–55. [Google Scholar] [CrossRef]
- Yang, J.; Lin, C.; Liu, H.; Li, L.; Wu, T.; Wang, P.; Li, B.; Liu, P. Effects of Island Topography on Storm Surge in Taiwan Strait during Typhoon Maria. J. Waterw. Port Coast. Ocean. Eng. 2021, 147, 04020057. [Google Scholar] [CrossRef]
- Agyakwah, W.; Lin, Y. Generation and enhancement mechanisms for extreme orographic rainfall associated with Typhoon Morakot (2009) over the Central Mountain Range of Taiwan. Atmos. Res. 2021, 247, 105160. [Google Scholar] [CrossRef]
- Li, X.; Fan, K.; Yu, E. Hindcast of extreme rainfall with high-resolution WRF: Model ability and effect of physical schemes. Theor. Appl. Climatol. 2020, 139, 639–658. [Google Scholar]
- Tian, J.; Liu, R.; Ding, L.; Guo, L.; Liu, Q. Evaluation of the WRF physical parameterisations for Typhoon rainstorm simulation in southeast coast of China. Atmos. Res. 2021, 247, 105130. [Google Scholar] [CrossRef]
- Du, M.; Hou, Y.; Qi, P.; Wang, K. The impact of different historical typhoon tracks on storm surge: A case study of Zhejiang, China. J. Mar. Syst. 2020, 206, 103318. [Google Scholar] [CrossRef]
- WRF Official Website. Available online: https://www2.mmm.ucar.edu/wrf/users/ (accessed on 1 March 2023).
- Chen, X.; Wang, Y.; Zhao, K.; Wu, D. A numerical study on rapid intensification of typhoon Vicente (2012) in the South China Sea. Mon. Weather Rev. 2017, 145, 877–898. [Google Scholar] [CrossRef]
- Castorina, G.; Caccamo, M.T.; Colombo, F.; Magazù, S. The Role of Physical Parameterizations on the Numerical Weather Prediction: Impact of Different Cumulus Schemes on Weather Forecasting on Complex Orographic Areas. Atmosphere 2021, 12, 616. [Google Scholar] [CrossRef]
- Chinta, S.; Yaswanth, S.J.; Balaji, C. Assessment of WRF Model Parameter Sensitivity for High-Intensity Precipitation Events During the Indian Summer Monsoon. Earth Space Sci. 2021, 8, e2020EA001471. [Google Scholar] [CrossRef]
- Hong, S.Y.; Noh, Y.; Dudhia, J. A new vertical diffusion package with an explicit treatment of entrainment processes. Mon. Weather Rev. 2006, 134, 2318–2341. [Google Scholar] [CrossRef] [Green Version]
- Lim, K.S.S.; Hong, S.Y. Development of an effective double-moment cloud microphysics scheme with prognostic cloud condensation nuclei (CCN) for weather and climate models. Mon. Weather Rev. 2010, 138, 1587–1612. [Google Scholar] [CrossRef] [Green Version]
- Ji, F.; Evans, J.P.; Teng, J.; Scorgie, Y.; Argüeso, D.; Luca, A.D. Evaluation of longterm precipitation and temperature Weather Research and Forecasting simulations for southeast Australia. Clim. Res. 2016, 67, 99–115. [Google Scholar] [CrossRef] [Green Version]
- Yuan, X.; Liang, X.; Wood, E.F. WRF ensemble downscaling seasonal forecasts of China winter precipitation during 1982–2008. Clim. Dyn. 2011, 39, 2041–2058. [Google Scholar] [CrossRef]
- Cai, Y.; Lu, X.; Chen, G.; Yang, S. Diurnal cycles of Mei-yu rainfall simulated over eastern China: Sensitivity to cumulus convective parameterization. Atmos. Res. 2018, 213, 236–251. [Google Scholar] [CrossRef]
- Grell, G.A.; Freitas, S.R. A scale and aerosol aware stochastic convective parameterisation for weather and air quality modeling. Atmos. Chem. Phys. 2014, 14, 5233–5250. [Google Scholar] [CrossRef] [Green Version]
- Kain, J.S. The Kain-Fritsch convective parameterisation: An update. J. Appl. Meteorol. 2004, 43, 170–181. [Google Scholar] [CrossRef]
- Ahasan, M.N.; Khan, A.Q. Simulation of a flood producing rainfall event of 29 July 2010 over north-west Pakistan using WRF-ARW model. Nat. Hazards 2013, 69, 351–363. [Google Scholar] [CrossRef]
- Srivastava, P.K.; Han, D.; Rico-Ramirez, M.A.; O’Neill, P.; Islam, T.; Gupta, M.; Dai, Q. Performance evaluation of WRF-Noah Land surface model estimated soil moisture for hydrological application: Synergistic evaluation using SMOS retrieved soil moisture. J. Hydrol. 2015, 529, 200–212. [Google Scholar] [CrossRef]
- Taylor, K. Summarizing multiple aspects of model performance in a single diagram. J. Geophys. Res. 2001, 106, 7183–7192. [Google Scholar] [CrossRef]
- Gleckler, P.J.; Taylor, K.; Doutriaux, C. Performance metrics for climate models. J. Geophys. Res. 2008, 113, 1–20. [Google Scholar] [CrossRef]
- Baker, N.C.; Taylor, P.C. A Framework for Evaluating Climate Model Performance Metrics. J. Clim. 2016, 29, 1773–1782. [Google Scholar] [CrossRef]
- China Meteorological Administration Tropical Cyclone Data Center Official Website. Available online: https://tcdata.typhoon.org.cn/ (accessed on 1 March 2023).
- Fujian Marine Forecast Station Official Website. Available online: http://www.fjhyyb.cn/Ocean863Web_MAIN/ (accessed on 1 March 2023).
Figure 1.
The Weather Research and Forecasting (WRF) simulated domain (whole figure) and the Simulating WAves Nearshore (SWAN) simulated region (orange square). The tracks of typhoon Goni (purple line), Dujuan (red line), and Meranti (blue line). Red triangles are the locations of buoys in the Taiwan Strait.

Figure 2.
Taylor diagrams of the wind speed for three typhoon events and 27 experiments. Red dots stand for experiments, and blue dots stand for ensemble prediction.
Figure 2.
Taylor diagrams of the wind speed for three typhoon events and 27 experiments. Red dots stand for experiments, and blue dots stand for ensemble prediction.

Figure 3.
The temporal distributions of the wind speeds (m/s) obtained from experiment 19 (blue line) and the buoy observations (red dot) during typhoon Goni at the locations of four buoys.
Figure 3.
The temporal distributions of the wind speeds (m/s) obtained from experiment 19 (blue line) and the buoy observations (red dot) during typhoon Goni at the locations of four buoys.

Figure 4.
The temporal distributions of wind speeds (m/s) obtained from experiment 12 (blue line) and the buoy observations (red dot) during typhoon Dujuan at the locations of four buoys.
Figure 4.
The temporal distributions of wind speeds (m/s) obtained from experiment 12 (blue line) and the buoy observations (red dot) during typhoon Dujuan at the locations of four buoys.

Figure 5.
The temporal distributions of wind speeds (m/s) obtained from experiment 19 (blue line) and the buoy observations (red dot) during typhoon Meranti at the locations of four buoys.
Figure 5.
The temporal distributions of wind speeds (m/s) obtained from experiment 19 (blue line) and the buoy observations (red dot) during typhoon Meranti at the locations of four buoys.

Figure 6.
Taylor diagrams of the wind direction for the three typhoon events and 27 experiments. Red dots stand for experiments, and blue dots stand for ensemble prediction.
Figure 6.
Taylor diagrams of the wind direction for the three typhoon events and 27 experiments. Red dots stand for experiments, and blue dots stand for ensemble prediction.

Figure 7.
The temporal distributions of wind directions (degree) obtained from experiment 26 (blue dot) and buoy observations (red dot) during typhoon Goni at the locations of four buoys.
Figure 7.
The temporal distributions of wind directions (degree) obtained from experiment 26 (blue dot) and buoy observations (red dot) during typhoon Goni at the locations of four buoys.

Figure 8.
The temporal distributions of wind directions (degree) obtained from experiment 23 (blue dot) and buoy observations (red dot) during typhoon Dujuan at the locations of four buoys.
Figure 8.
The temporal distributions of wind directions (degree) obtained from experiment 23 (blue dot) and buoy observations (red dot) during typhoon Dujuan at the locations of four buoys.

Figure 9.
The temporal distributions of wind directions (degree) obtained from experiment 2 (blue dot) and buoy observations (red dot) during typhoon Meranti at the locations of four buoys.
Figure 9.
The temporal distributions of wind directions (degree) obtained from experiment 2 (blue dot) and buoy observations (red dot) during typhoon Meranti at the locations of four buoys.

Figure 10.
Taylor diagrams of the significant wave height for the three typhoon events and 27 experiments. Red dots stand for experiments, and blue dots stand for ensemble prediction.
Figure 10.
Taylor diagrams of the significant wave height for the three typhoon events and 27 experiments. Red dots stand for experiments, and blue dots stand for ensemble prediction.

Figure 11.
The temporal distributions of significant wave heights (m) obtained from experiment 19 (red line) and buoy observations (blue dot) during typhoon Goni at the locations of four buoys.
Figure 11.
The temporal distributions of significant wave heights (m) obtained from experiment 19 (red line) and buoy observations (blue dot) during typhoon Goni at the locations of four buoys.

Figure 12.
The temporal distributions of significant wave heights (m) obtained from experiment 1 (red line) and buoy observations (blue dot) during typhoon Dujuan at the locations of four buoys.
Figure 12.
The temporal distributions of significant wave heights (m) obtained from experiment 1 (red line) and buoy observations (blue dot) during typhoon Dujuan at the locations of four buoys.

Figure 13.
The temporal distributions of significant wave heights (m) obtained from experiment 20 (red line) and buoy observations (blue dot) during typhoon Meranti at the locations of four buoys.
Figure 13.
The temporal distributions of significant wave heights (m) obtained from experiment 20 (red line) and buoy observations (blue dot) during typhoon Meranti at the locations of four buoys.

Figure 14.
The tracks of typhoon Noul (red line), Soudelor (blue line), and Nepartak (purple line).


Table 1.
The characteristics of WRF grids.
| Grid Type | Arakawa C |
|---|---|
| Map projection | Mercator |
| Time step | 120 s |
| Vertical level | 30 |
| Top pressure | 5000 Pa |
Table 2.
The simulation start and end times of three typhoons.
| Simulation Start Time (UTC) | Simulation End Time (UTC) | |
|---|---|---|
| Goni | 8 September 2015, 00:00 | 27 August 2015, 00:00 |
| Dujuan | 17 September 2015, 00:00 | 30 September 2015, 00:00 |
| Meranti | 9 July 2016, 00:00 | 17 September 2016, 00:00 |
Table 3.
Basic set of the SWAN model.
| Mode | Two Dimensions |
|---|---|
| Coordinate system | Spherical |
| Grid type | Regular |
| Minimum depth | 0.05 m |
| Model physics | Gen3 |
Table 4.
Twenty-seven physical parameterization combinations for typhoon simulation experiments.
| Experiment ID | Microphysics | Long/Short Wave Radiation | Cumulus |
|---|---|---|---|
| 1 | Lin | RRTM/Dudhia | KF |
| 2 | Lin | RRTM/Dudhia | G3D |
| 3 | Lin | RRTM/Dudhia | TDK |
| 4 | Lin | CAM/CAM | KF |
| 5 | Lin | CAM/CAM | G3D |
| 6 | Lin | CAM/CAM | TDK |
| 7 | Lin | RRTMG/RRTMG | KF |
| 8 | Lin | RRTMG/RRTMG | G3D |
| 9 | Lin | RRTMG/RRTMG | TDK |
| 10 | WSM6 | RRTM/Dudhia | KF |
| 11 | WSM6 | RRTM/Dudhia | G3D |
| 12 | WSM6 | RRTM/Dudhia | TDK |
| 13 | WSM6 | CAM/CAM | KF |
| 14 | WSM6 | CAM/CAM | G3D |
| 15 | WSM6 | CAM/CAM | TDK |
| 16 | WSM6 | RRTMG/RRTMG | KF |
| 17 | WSM6 | RRTMG/RRTMG | G3D |
| 18 | WSM6 | RRTMG/RRTMG | TDK |
| 19 | Morrison | RRTM/Dudhia | KF |
| 20 | Morrison | RRTM/Dudhia | G3D |
| 21 | Morrison | RRTM/Dudhia | TDK |
| 22 | Morrison | CAM/CAM | KF |
| 23 | Morrison | CAM/CAM | G3D |
| 24 | Morrison | CAM/CAM | TDK |
| 25 | Morrison | RRTMG/RRTMG | KF |
| 26 | Morrison | RRTMG/RRTMG | G3D |
| 27 | Morrison | RRTMG/RRTMG | TDK |
Table 5.
R statistics of the wind speed simulation in the three typhoon events.
| Correlation | Range | Best Value | Best Experiment |
|---|---|---|---|
| Goni | 0.55–0.65 | 0.636 | 5 |
| Dujuan | 0.7–0.8 | 0.769 | 11 |
| Meranti | 0.65–0.8 | 0.762 | 6 |
Table 6.
σn statistics of the wind speed simulation in the three typhoon events.
| σn | Range | Best Value | Best Experiment |
|---|---|---|---|
| Goni | 0.6–0.8 | 0.817 | 19 |
| Dujuan | 0.75–0.9 | 0.897 | 3 |
| Meranti | 0.7–0.85 | 0.824 | 23 |
Table 7.
En statistics of the wind speed simulation in the three typhoon events.
| En | Range | Best Value | Best Experiment |
|---|---|---|---|
| Goni | 0.75–0.85 | 0.766 | 5 |
| Dujuan | 0.65–0.75 | 0.639 | 11 |
| Meranti | 0.65–0.75 | 0.641 | 21 |
Table 8.
Mean skill score of the single physical parameterization in the wind speed simulation.
| Physical Parameterization | Goni | Dujuan | Meranti | |
|---|---|---|---|---|
| Microphysics | Lin | 73.00 | 83.87 | 78.70 |
| WSM6 | 73.86 | 83.99 | 78.86 | |
| Morrison | 75.48 | 84.37 | 81.23 | |
| Longwave/shortwave radiation | RRTM/Dudhia | 75.26 | 84.66 | 80.01 |
| CAM/CAM | 75.59 | 83.86 | 80.35 | |
| RRTMG/RRTMG | 71.48 | 83.72 | 78.44 | |
| Cumulus | KF | 75.93 | 84.23 | 79.70 |
| G3D | 74.62 | 83.04 | 78.37 | |
| TDK | 71.79 | 84.97 | 80.74 |
Table 9.
R statistics of the wind direction simulation in the three typhoon events.
| Correlation | Range | Best Value | Best Experiment |
|---|---|---|---|
| Goni | 0.5–0.9 | 0.914 | 26 |
| Dujuan | 0.15–0.95 | 0.948 | 23 |
| Meranti | 0.3–0.8 | 0.791 | 2 |
Table 10.
σn statistics of the wind direction simulation in the three typhoon events.
| σn | Range | Best Value | Best Experiment |
|---|---|---|---|
| Goni | 0.6–1.1 | 0.993 | 6 |
| Dujuan | 0.6–1.5 | 0.998 | 24 |
| Meranti | 0.75–1.1 | 1.01 | 24 |
Table 11.
En statistics of the wind direction simulation in the three typhoon events.
| En | Range | Best Value | Best Experiment |
|---|---|---|---|
| Goni | 0.4–0.9 | 0.409 | 14 |
| Dujuan | 0.3–1.5 | 0.322 | 23 |
| Meranti | 0.6–1.2 | 0.614 | 2 |
Table 12.
Mean skill score of the single physical parameterization in the wind direction simulation.
Table 12.
Mean skill score of the single physical parameterization in the wind direction simulation.
| Physical Parameterization | Goni | Dujuan | Meranti | |
|---|---|---|---|---|
| Microphysics | Lin | 88.31 | 70.97 | 76.06 |
| WSM6 | 91.40 | 74.16 | 76.45 | |
| Morrison | 93.73 | 82.44 | 73.62 | |
| Longwave/shortwave radiation | RRTM/Dudhia | 93.82 | 74.88 | 72.79 |
| CAM/CAM | 85.02 | 84.07 | 78.52 | |
| RRTMG/RRTMG | 94.59 | 68.62 | 74.81 | |
| Cumulus | KF | 86.39 | 73.99 | 77.51 |
| G3D | 93.41 | 83.05 | 75.88 | |
| TDK | 93.62 | 70.52 | 72.74 |
Table 13.
R statistics of the significant wave height simulation in the three typhoon events.
| Correlation | Range | Best Value | Best Experiment |
|---|---|---|---|
| Goni | 0.45–0.55 | 0.519 | 5 |
| Dujuan | 0.7–0.8 | 0.789 | 11 |
| Meranti | 0.7–0.8 | 0.776 | 10 |
Table 14.
σn statistics of the significant wave height simulation in the three typhoon events.
| Σn | Range | Best Value | Best Experiment |
|---|---|---|---|
| Goni | 0.6–0.7 | 0.712 | 19 |
| Dujuan | 0.75–0.85 | 0.822 | 1 |
| Meranti | 0.65–0.75 | 0.766 | 5 |
Table 15.
En statistics of the significant wave height simulation in the three typhoon events.
| En | Range | Best Value | Best Experiment |
|---|---|---|---|
| Goni | 0.8–0.9 | 0.839 | 6 |
| Dujuan | 0.6–0.7 | 0.629 | 11 |
| Meranti | 0.6–0.7 | 0.639 | 10 |
Table 16.
Mean skill score for the single physical parameterization in the significant wave height simulation.
Table 16.
Mean skill score for the single physical parameterization in the significant wave height simulation.
| Physical Parameterization | Goni | Dujuan | Meranti | |
|---|---|---|---|---|
| Microphysics | Lin | 64.15 | 82.53 | 77.24 |
| WSM6 | 64.51 | 82.39 | 76.28 | |
| Morrison | 66.62 | 83.15 | 76.17 | |
| Longwave/shortwave radiation | RRTM/Dudhia | 67.01 | 83.21 | 78.08 |
| CAM/CAM | 65.78 | 82.49 | 76.35 | |
| RRTMG/RRTMG | 62.49 | 82.37 | 75.27 | |
| Cumulus | KF | 66.98 | 83.05 | 76.33 |
| G3D | 64.83 | 82.25 | 77.66 | |
| TDK | 63.47 | 82.76 | 75.70 |
Table 17.
Skill scores of the wind speed, wind direction, and significant wave height obtained from the best simulation experiments for typhoons Noul, Soudelor, and Nepartak.
Table 17.
Skill scores of the wind speed, wind direction, and significant wave height obtained from the best simulation experiments for typhoons Noul, Soudelor, and Nepartak.
| Skill Score | Noul | Soudelor | Nepartak |
|---|---|---|---|
| Wind speed | 79.51 | 87.6 | 82.31 |
| Wind direction | 89.82 | 92.66 | 86.42 |
| Significant wave height | 70.12 | 85.71 | 70.88 |
Disclaimer/Publisher’s Note: The statements, opinions and data contained in all publications are solely those of the individual author(s) and contributor(s) and not of MDPI and/or the editor(s). MDPI and/or the editor(s) disclaim responsibility for any injury to people or property resulting from any ideas, methods, instructions or products referred to in the content. |
© 2023 by the authors. Licensee MDPI, Basel, Switzerland. This article is an open access article distributed under the terms and conditions of the Creative Commons Attribution (CC BY) license (https://creativecommons.org/licenses/by/4.0/).
Share and Cite
MDPI and ACS Style
Luo, C.; Shang, S.; Xie, Y.; He, Z.; Wei, G.; Zhang, F.; Wang, L. Evaluation of the Effect of WRF Physical Parameterizations on Typhoon and Wave Simulation in the Taiwan Strait. Water 2023, 15, 1526. https://doi.org/10.3390/w15081526
AMA Style
Luo C, Shang S, Xie Y, He Z, Wei G, Zhang F, Wang L. Evaluation of the Effect of WRF Physical Parameterizations on Typhoon and Wave Simulation in the Taiwan Strait. Water. 2023; 15(8):1526. https://doi.org/10.3390/w15081526
Chicago/Turabian StyleLuo, Chenghan, Shaoping Shang, Yanshuang Xie, Zhigang He, Guomei Wei, Feng Zhang, and Lei Wang. 2023. "Evaluation of the Effect of WRF Physical Parameterizations on Typhoon and Wave Simulation in the Taiwan Strait" Water 15, no. 8: 1526. https://doi.org/10.3390/w15081526
Note that from the first issue of 2016, this journal uses article numbers instead of page numbers. See further details here.