
Analysis of the Effect of Climate Change on the Characteristics of Rainfall in Igeldo-Gipuzkoa (Spain)

1
Engineering Department, Public University of Navarra, Campus de Arrosadía, 31006 Pamplona, Spain
2
Projects Department, University of Córdoba, Campus de Rabanales, 14004 Cordoba, Spain
*
Author to whom correspondence should be addressed.
Water 2023, 15(8), 1529; https://doi.org/10.3390/w15081529
Submission received: 20 March 2023
/
Revised: 9 April 2023
/
Accepted: 10 April 2023
/
Published: 13 April 2023
(This article belongs to the Special Issue Climate Change Impact on Hydrological Cycle and Water Resources Management)
Abstract
:In recent years, numerous studies have been carried out on changes in the temperature and precipitation regimes and in the frequency of the extreme events that are a result of climate change. While there is evidence of an increase in temperature at a global level, this globality does not seem to occur with precipitation. The Igeldo weather station (San Sebastian) has one of the longest recorded rainfall intensity series in Spain and can be considered as representative of the Cantabrian coast. This circumstance makes it the ideal place to analyse the trend of the pluviometric regime of this area, and this was precisely the objective of this study. A total of 165 series of pluviometric parameters were obtained to characterise the pluviometric regime. The Mann–Kendall and Spearman tests were applied to evaluate the trends of the different parameters, and the Pettitt test was applied to detect the existence of change points. In all the series, it was proven that there were no significant trends or change points. Significant increasing trends were only detected in the series of maximum winter precipitation. In general terms, it can be concluded that the precipitation regime in Igeldo is quite stationary in the context of climate change.
1. Introduction
It is a recognised fact that climate change is one of the main threats to the earth in the 21st century. In the various reports of the Intergovernmental Panel on Climate Change (IPCC), the evidence of the effects of climate change and the dramatic consequences that it can have at a global level have been revealed. In the report of Working Group I of the IPCC [1], which is part of the IPCC [2], it is stated that climate change already affects all regions of the earth in multiple ways, and it is predicted that in the coming decades the changes in climatic conditions will increase in all regions. It also indicates that the change is not only taking place in terms of temperature; many regions are experiencing changes in different factors or aspects that will intensify if warming increases. Regarding precipitation, the report notes that it has also been observed that climate change is affecting precipitation patterns, and in many regions, the rain situations that produce floods and droughts are intensifying. At high latitudes, precipitation is likely to increase, while it is projected to decrease in much of the subtropics.
Precipitation is a fundamental aspect of the management and planning of water resources. Therefore, to assess the impact of climate change on water resources it is first necessary to analyse what is happening with the precipitation regime. As pointed out by [3] in a rigorous review of the trend studies in Italy, which has a climate similar to that of Spain, great attention must be dedicated to precipitation as a key component of the hydrological cycle that may be affected by climate change [4,5,6,7,8,9,10]. Authors such as Katz and Brown [11] have already suggested that the variation in the frequency of extreme events due to global climate change in the Mediterranean basin could be more important than the variation in mean values. Karl and Trenberth [12] have shown that there has been an increase in the frequency of heavy daily precipitation in warmer climates, even without any change in total precipitation. Xu et al. [13] have shown that precipitation at the Tarim river basin in the west of China has experienced a significant monotonic increase over the past 50 years. Groisman et al. [14] found disproportionate changes in heavy precipitation compared to changes in annual and seasonal precipitation. Many studies have indicated that global warming intensifies the global hydrological cycle (e.g., [15,16]) by altering precipitation patterns and causing more frequent extreme weather events, such as storms, floods, and droughts [17,18,19]. It has also been stated in some studies that there will probably be an increase in the variability of precipitation, including extreme rains [20,21]. On a global scale, there is evidence based on observation that the frequency and intensity of extreme events have changed significantly in recent decades [22,23].
As a consequence, as indicated by Caporali et al. [3], the research on changes in the precipitation regime is a topic of particular interest as it affects water resource planning and management, as well as the design of mitigation measures against flood and landslide hazards. However, these same authors indicated that the rainfall regime behaviour and change on a local scale may be different from that observed on a large scale since it is particularly difficult to detect it using observations because natural variability is particularly large for precipitation [24,25,26].
In this context, we selected the precipitation series recorded at the Igeldo weather station in San Sebastian (Gipuzkoa-Spain) to study the behaviour and changes in the rainfall regime over the 89 years of the series. The series of precipitation intensities recorded at the Igeldo weather station is one of the longest series recorded in Spain, and it can be considered representative of the climate of the Cantabrian coast in the north of Spain. These data were used to obtain the series of different characteristics associated with the precipitation regime (maximum precipitation intensities, climate change precipitation indices recommended by ETCCDI, the Gini index, and the annual and seasonal precipitation anomalies) in order to analyse them and check their trends and thus evaluate the effect of climate change on the rainfall regime for the area under study; this was the main objective of this study, whose results are presented in this manuscript. In order to detect trends in the series analysed, the following tests were applied: the return point test to analyse the randomness and independence of the series; the correlation test to examine the existence of autocorrelation; the Mann–Kendall and Spearman tests to assess possible trends; and the Pettitt test to detect the existence of change points.
2. Materials and Methods
2.1. Location and Characteristics of the Weather Station
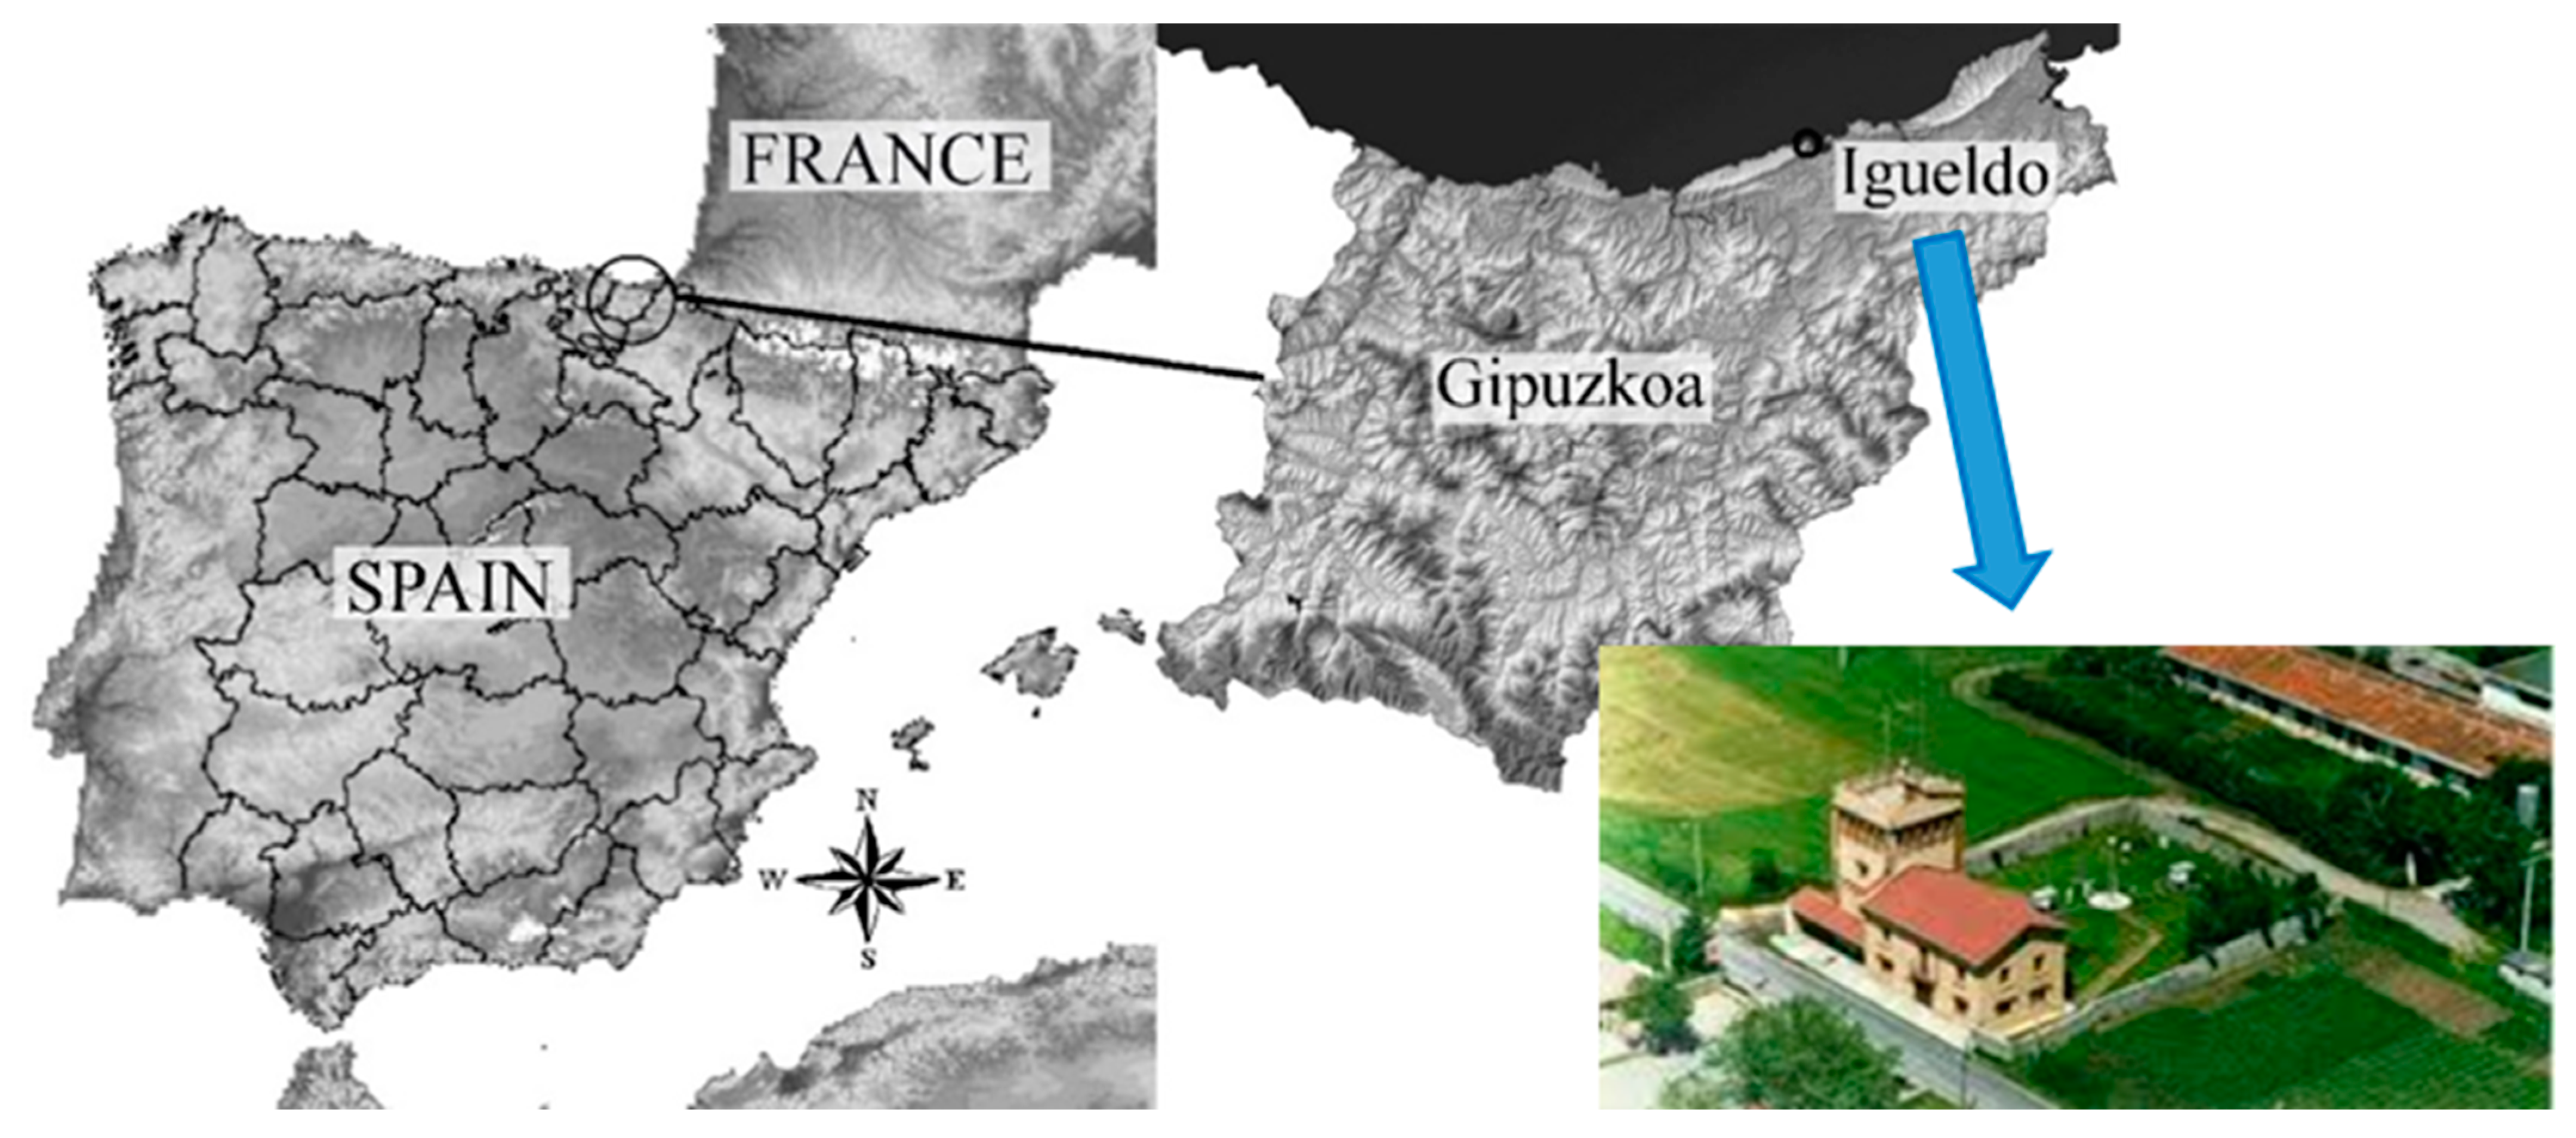
The Igeldo meteorological station, located to the west of the town of San Sebastián (Gipuzkoa) (Figure 1), belongs to the Territorial Meteorological Center in the Basque Country of the State Meteorological Agency (AEMET). It is located at an altitude of 251 m above sea level, and its geographic coordinates are: latitude 43°18′23″ N and longitude 2°2′28″ W [27].
Due to its proximity to the sea, the climate is temperate oceanic, characterised by mild temperatures, high relative humidity, frequent cloudiness, and abundant rains distributed regularly throughout the year [28]. According to the Köpen climate classification, San Sebastián has a humid temperate climate without a dry season, as classified by the Cfb code [29]. Its average annual rainfall is around 1500 mm [30].
The following precipitation series were available:
- The precipitation series with records every 10 min, obtained from the digitization of the syphon (float)-type automatic rainfall recorder, carried out by the Gipuzkoa Provincial Council with a band pluviograph owned by the State Meteorological Agency (AEMET). The series runs from 1927 to 2016 inclusive, which represents a total of 89 years of records [31].
- The daily precipitation series, from 1929 to 2018, obtained directly from the AEMET website. This series is complete.
2.2. Rainfall Characteristics Analysed
To analyse the effect of climate change on the Igeldo precipitation series, different parameters or indices that represent different aspects or characteristics of the precipitation regime were selected; these are described below.
2.2.1. Maximum Precipitation Intensities
The first aspect that was studied was the effect on the maximum intensities of precipitation. To do this, from a rainfall series recorded in 10 min, the maximum annual (Pan), seasonal (Psn), and monthly (Pms) rainfall occurrences for different durations (10 min, 20 min, 30 min, 1 h, 2 h, 4 h, 6 h, 12 h, and 24 h) were selected, and the corresponding series were thereby obtained. Table 1 shows the associated variables.
2.2.2. Climate Change Precipitation Indices (ETCCDI)
The joint CCl/CLIVAR/JCOMM Expert Team on Climate Change Detection and Indices (ETCCDI) (http://etccdi.pacificclimate.org/list_27_indices.shtml, accessed on 16 March 2022)) recommends 27 indices for the analysis and understanding of the climatic extremes and climate trends in the different regions of the world. Of these, 12 characteristics of the pluviometric regime were selected (Table 2).
2.2.3. Seasonal and Monthly Rainfall
The interest in analysing seasonal rainfall lies in the fact that its origins are usually due to different climatological phenomena.
The Cantabrian climate is characterised by a maritime climate with mild temperatures, high humidity, and abundant rainfall throughout the year. In general, the rainy season in the Cantabrian region extends from autumn to spring, with the months of November, December, and January being the wettest. During these months, there is a high frequency of rainfall events, with intense and prolonged rains being common. This period is characterised by a constant succession of Atlantic fronts that bring rainfall to the region. The rainfall during this period is often heavy and can lead to flooding in certain areas. During the spring months, the rainfall tends to be moderate. These periods can experience some occasional showers and storms, but the rainfall is generally less frequent than during the autumn and winter months. During the summer months, the rainfall is lower than in the other seasons. The region experiences long periods of sunny and dry weather during this time, with occasional isolated thunderstorms.
2.2.4. Gini Index
Another characteristic that has been analysed is the temporal distribution of daily precipitation throughout the year. This characteristic has been evaluated using the Gini index. The Gini coefficient has been used to illustrate the variability in river discharge and its chemical loads [32], the changes in flow regimes [33], and the changes in the temporal distribution of daily precipitation [34]. In the context of rainfall, the Gini index provides a measure of how rainfall (daily precipitation in this case) is distributed over the course of a year; it ranges from 0 (representing a uniform distribution of precipitation across all days within the year) to 1 (representing the case where all the precipitation occurs on a single day). Rajah et al. [34] illustrated the relationship between the Gini index and several indices adopted by the ETCCDI [35] and were able to observe that many standard measures correspond to only one aspect of the rainfall temporal distribution, whereas the Gini index represents the shape of the entire distribution.
To estimate the Gini index, the daily precipitation values were first ordered in an increasing order; then, the accumulated values were obtained, and these were converted to a percentage of the total precipitation, thus forming a “Lorenz” curve. The Gini index, G, is calculated for each year by doubling the area between the 45° line (representing a uniform precipitation distribution) and the Lorenz curve, using Equation (1), as indicated by Rajah et al. [34].
where n is the number of observations, which in this case is the number of days in a year, and yi is the accumulated precipitation value as a percentage for each wet day.
The relationship between the Gini index and the several indices adopted by the Expert Team on Climate Change Detection and Indices (ETCCDI) was illustrated by Zhang et al. [35]. They concluded that many standard measures corresponded to only one aspect of the rainfall temporal distribution, whereas the Gini index represented the shape of the entire distribution.
Rajah et al. [34] showed that the index was highly sensitive to the number of wet days in a given year; therefore, they considered two separate indices: the wet-day frequency index, WDF, which is the ratio of the number of wet days (defined as days with more than 0.1 mm precipitation) to the total number of days in the year, and the wet-day Gini index, WDG, which measures how unevenly rainfall is spread across the wet days during the year.
In this paper, in addition to the abovementioned indices, the Gini index itself was also estimated, as ADG, taking into account all the days of the year. The values of these indices were calculated, as indicated by Rajah et al. [34], from the series of daily rainfall occurrences recorded in Igeldo.
2.2.5. Climatological Standard Normals
According to the Technical Regulations of the Guide to Climatological Practices of the World Meteorological Organization (WMO) [36,37], the Climatological Standard Normals are defined as the averages of the climatological data computed for the following consecutive periods of 30 years. In this case, three consecutive periods of 30 years were selected: from 1 January 1931 to 31 December 1960; from 1 January 1961 to 31 December 1990; and from 1 January 1991 to 31 December 2018. Following the recommendations of the WMO to update the averages of the climatological variables at the beginning of each decade for the consecutive periods of 30 years, the Climatological Normals of precipitation since 1931 were recalculated for the beginning of each decade.
Climatological Normals are used for two principal purposes: to serve as a benchmark against which recent or current observations can be compared and to predict the conditions most likely to be experienced in a given location. In this sense, they are widely used implicitly or explicitly [38].
2.2.6. Rainfall Anomaly Index (RAI)
Finally, the precipitation anomalies were analysed by means of the rainfall anomaly index (RAI). The rainfall anomaly index (RAI) was proposed by van Rooy [39] and has been applied by many authors [40,41,42]. The RAI index incorporates a classification procedure to assign magnitudes to positive and negative rainfall anomalies and is calculated by Equations (2) and (3).
where P is the annual/seasonal precipitation for a given year; is the average of the annual/seasonal precipitation of the historical series; is the average of the annual/seasonal precipitation of the ten years with the highest values of the historical series; and is the average of the annual/seasonal precipitation of the ten years with the lowest values of the historical series.
The index values are evaluated based on a classification of 9 classes, according to van Rooy, ranging from extremely humid (RAI ≥ 3) to extremely dry (RAI ≤ −3). This classification is equally applicable to various periods of drought, including flash droughts, meteorological droughts, severe soil moisture droughts, and hydrological droughts, defined by the RAI calculated at different time scales [42].
Oladipo [43] indicated that the RAI index was very effective in detecting periods of drought, and the differences between this index and the more complex ones, such as Palmer’s (PSDI) and the Bhalme–Mooley drought area index (DAI) [44], were negligible.
All the series of the indices indicated in the last four sections were determined from the daily rainfall series recorded in the manual rain gauge of the Igeldo weather station from 1929 to 2018.
2.3. Methodology for the Analysis of Pluviometric Series
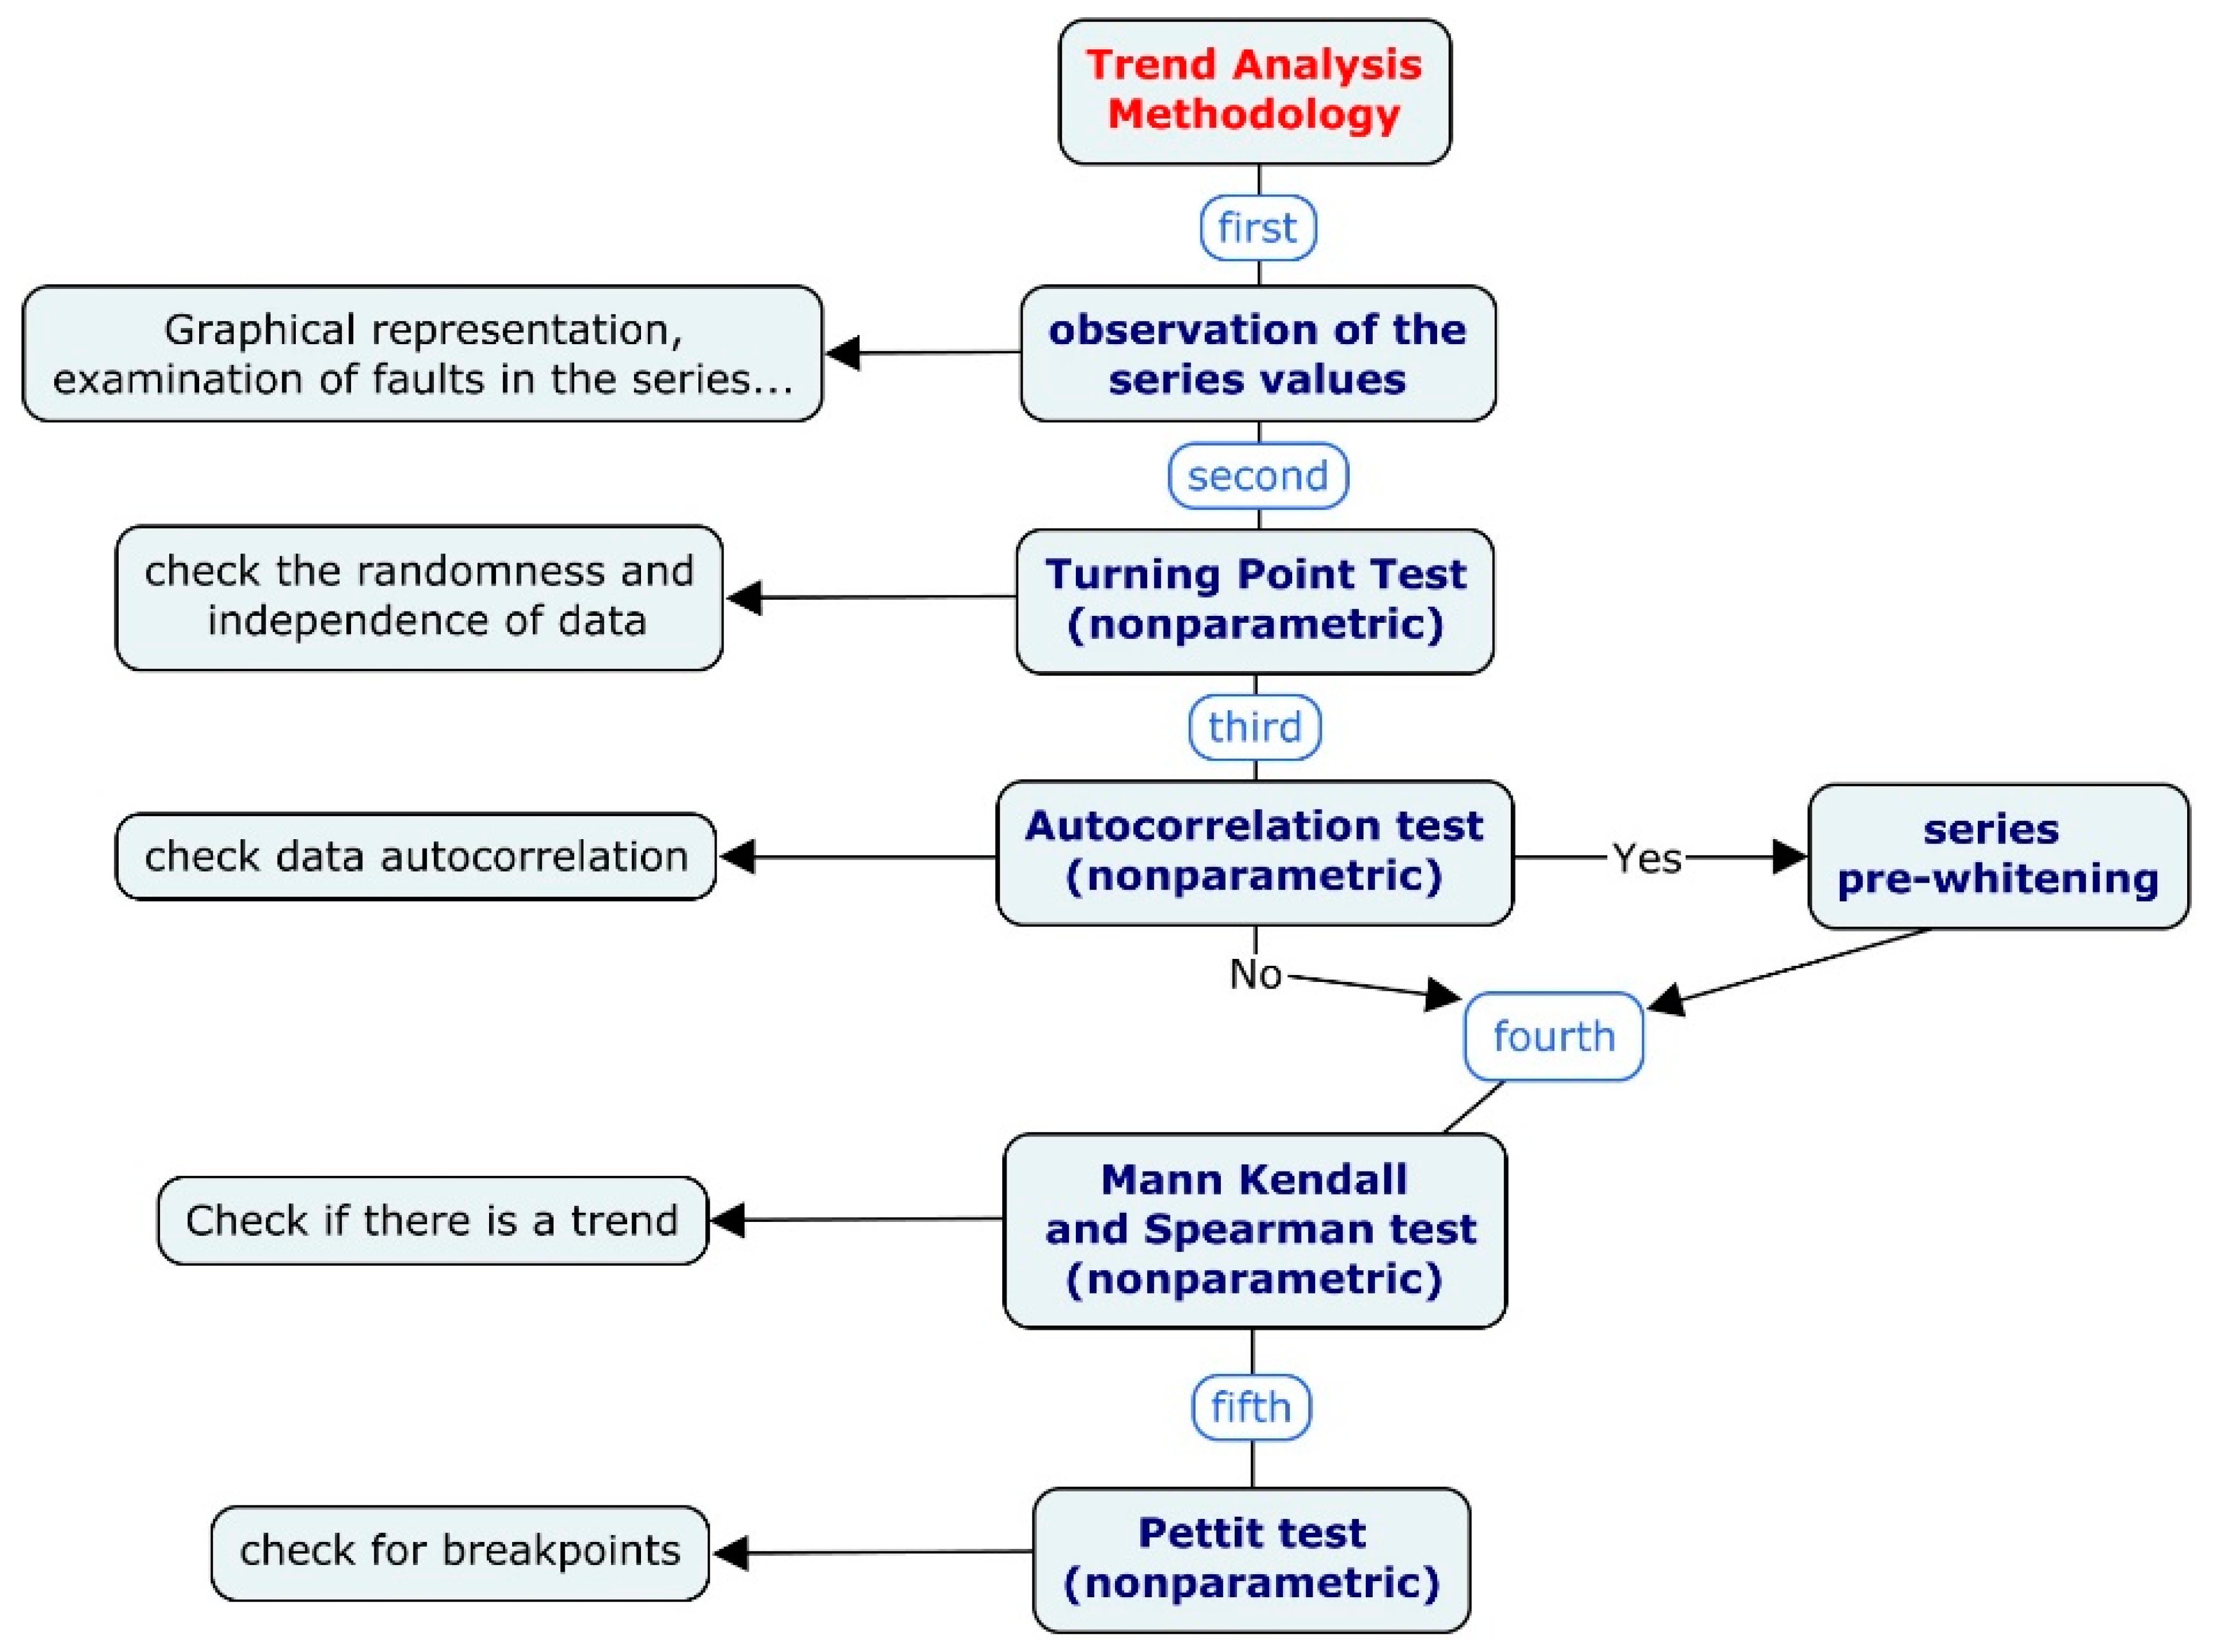
Figure 2 presents the conceptual map of the process followed for the analysis of the trends of the different series considered. Therefore, in all the selected series, the process followed for the analysis of trends was the one described below.
- As a preliminary step, it is necessary to examine the series and determine the missing data for each year in order to discard a year, if necessary. This is particularly necessary in the 10 min series, in which data are often missing. Subsequently, the simple observation of the graphical representation of the values of the series already suggests something about the existence of trends and their breakpoints.
- The first thing to do is to check that the data respond to an independent random variable and that they are identically distributed. To this end, the turning-point test was applied to all the series analysed. This test is easy to apply and is an effective test for checking randomness against systematic oscillation [45]. In this test, the null hypothesis, H0, states that the variables are independent random variables and identically distributed.
- An initial problem in checking and interpreting trends is the effect of the autocorrelation of the data in a time series. This is the statistical dependence of a time series on its own past or future values. The presence of positive or negative autocorrelation influences the detection of trends in the series [46,47]. Therefore, it is important to check the autocorrelation of the data for each series and to remove it before testing the trend if it is positive. This analysis was performed for all the series using the autocorrelation test according to the methodologies proposed by Zhang et al. [48] and Basistha et al. [49].
- Once the above was confirmed, the non-parametric Mann–Kendall and Spearman tests were applied to detect possible trends in all the time series considered. The Mann–Kendall test, proposed by Mann [50] and Kendall [51], is based on the range and is one of the widely used non-parametric tests to detect trends in the time series of hydroclimatic data [52,53,54,55,56,57,58,59,60]. It has been used and suggested by the WMO to evaluate trends in the time series of environmental data. The Spearman test [52] is a non-parametric rank-based test that is similar to the Mann–Kendall and can also be used to detect monotonic trends in time series [61,62].
- Having checked the trend of the series, it is interesting to analyse whether there are change points in the series. The Pettitt test [63,64,65] is a non-parametric, range-based, distribution-free test used to detect the occurrence of a significant abrupt change in the mean of a time series. It is particularly useful when the location of the point of change is unknown. It is widely applied to detect changes in time series of climatic and hydrological data.
3. Results
3.1. Maximum Precipitation Intensities
As previously mentioned, to analyse the maximum intensities of rain, the maximum annual, seasonal, and monthly rainfall for different durations (10 min, 20 min, 30 min, 1 h, 2 h, 4 h, 6 h, 12 h, and 24 h) was obtained from the rainfall series recorded at the Igeldo weather station from 1928 to 2016. The methodology described in the corresponding section was applied to all the series considered. First, the turning-point test was applied to all the series to check the randomness and independence of the data in each of the series; the result obtained was that all of them were random and that the data were independent. Before applying the trend analysis tests, the existence of autocorrelation in the series of different precipitation intensities was checked with the autocorrelation test according to the methodologies proposed by Zhang. et al. [48] and Basistha et al. [49]; no autocorrelation was detected in any of the series indicated. Then, the Mann–Kendall and Spearman tests were applied to detect possible trends; subsequently, the Pettitt test was applied to check for the existence of change points in the time series cited.
No statistically significant trends or breakpoints were detected in the annual maximum precipitation series for the different durations (annual maximum precipitation intensities) at the 5% significance level. Figure 3 represents the different series of maximum annual precipitation intensities analysed; a simple observation of the graphs suggests the non-existence of trends and change points.
Nevertheless, when analysing the annual maximum rainfall series for each season, significant increasing trends were detected in winter for the different durations. The values of the statistics of both tests, the Mann–Kendall and the Spearman, were higher than the critical values (in bold in Table 3). In the rest of the seasons, it was observed that the values of Sen’s slope, although not statistically significant, were negative (decreasing trend) in most of the intensities in the autumn season and in two in the spring season; in the other cases, these values were positive (increasing trend). It can therefore be said that the precipitation intensities show a certain decreasing trend in autumn, while in spring and summer the trend is increasing. Table 3 shows the values of the Mann–Kendall and Spearman statistics for all the maximum precipitation intensities in the four seasons.
The same analysis for the monthly maximum precipitation intensities showed that the results were consistent with those obtained at the seasonal level. In all the winter months, statistically significant increasing trends were detected, although not for all the durations: in January for all the durations except for 24 h and in February and March only for the sub-hourly durations. In the remaining months, no further statistically significant trends were detected except for three exceptions in the increasing trends: in August for the 4h duration; in October for the 20 min duration; and in November for the 10 min duration.
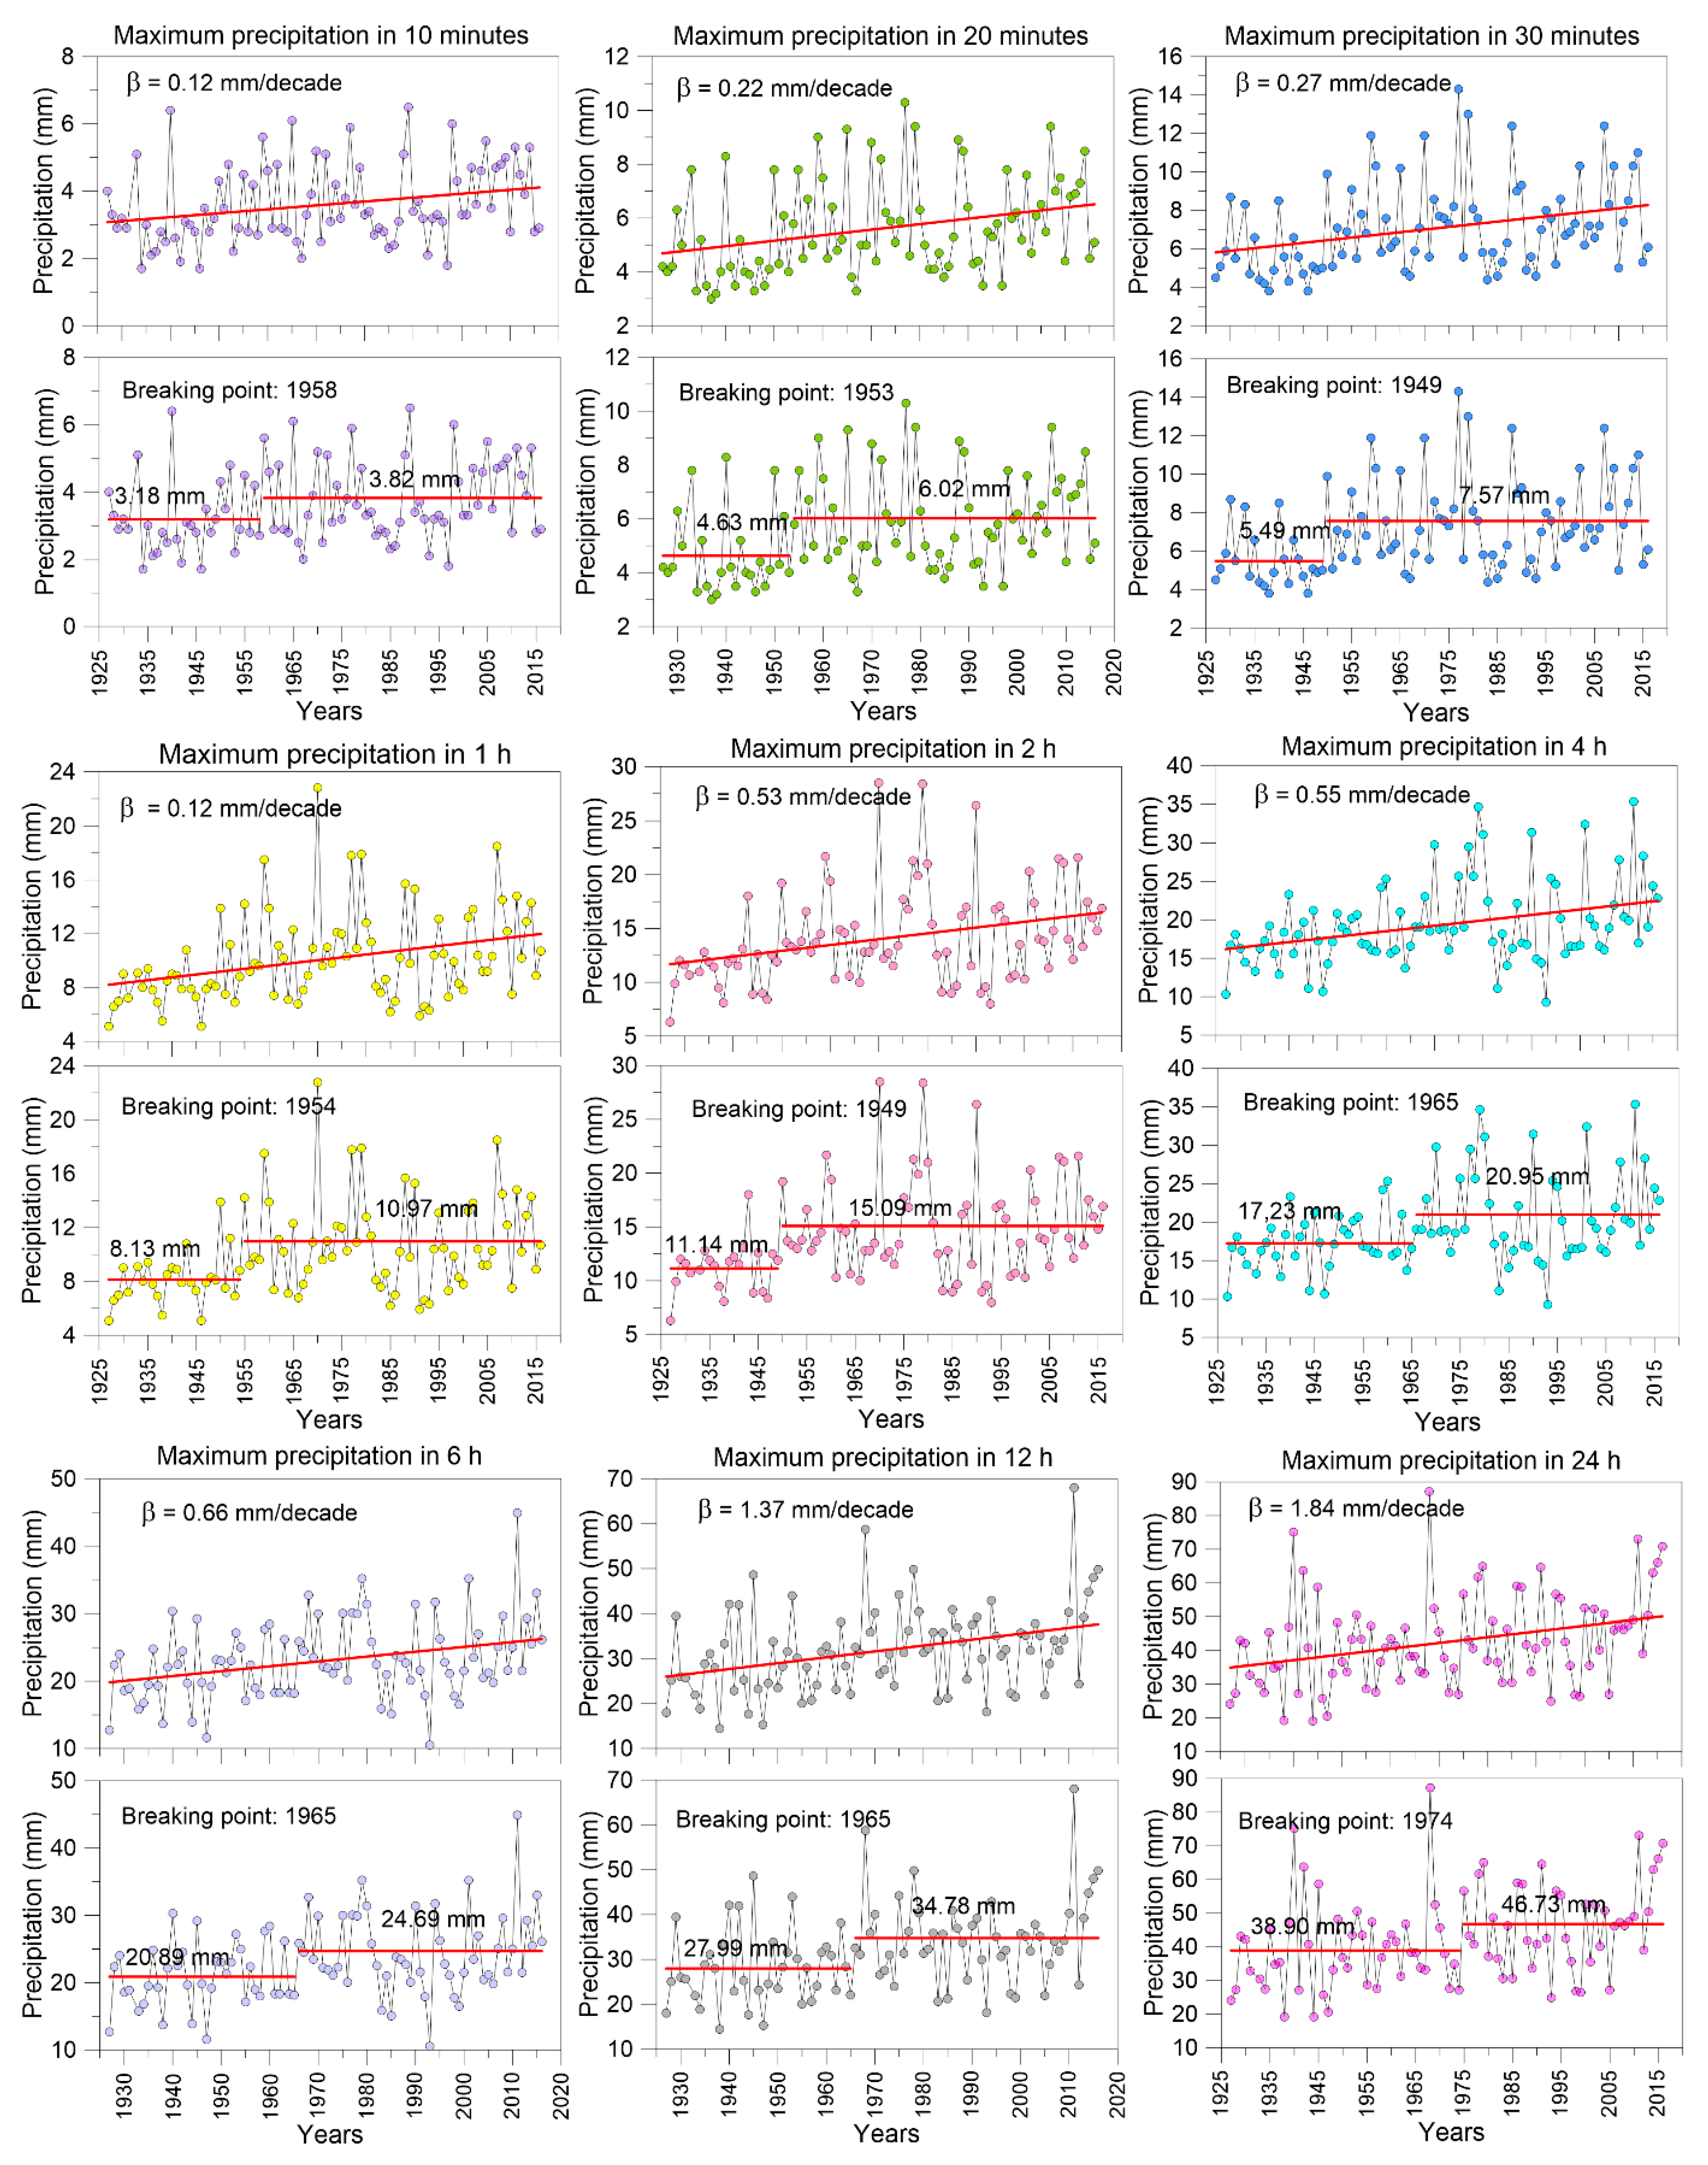
Figure 4 plots the series of winter maximum precipitation intensities with the trends according to the Mann–Kendall test with the value of Sen’s slope (up) and the change points estimated with the Pettitt test with the year of change (down).
The Pettitt test [63,64] was also applied to all the series of seasonal maximum precipitation intensities. As in the case of the trend tests, statistically significant changepoints were only detected at the 5% significance level in the winter season (Figure 4). In Figure 4, the change point is expressed by the year in which the average changed. It can be appreciated that the year of change varies according to the precipitation duration: for small durations, between 10 min and 2 h, the year of change was between 1949 and 1958; for intermediate durations, between 4 and 12 h, the year of change was 1965; and for 24 h, it was 1973.
3.2. Climate Change Precipitation Indices (ETCCDI)
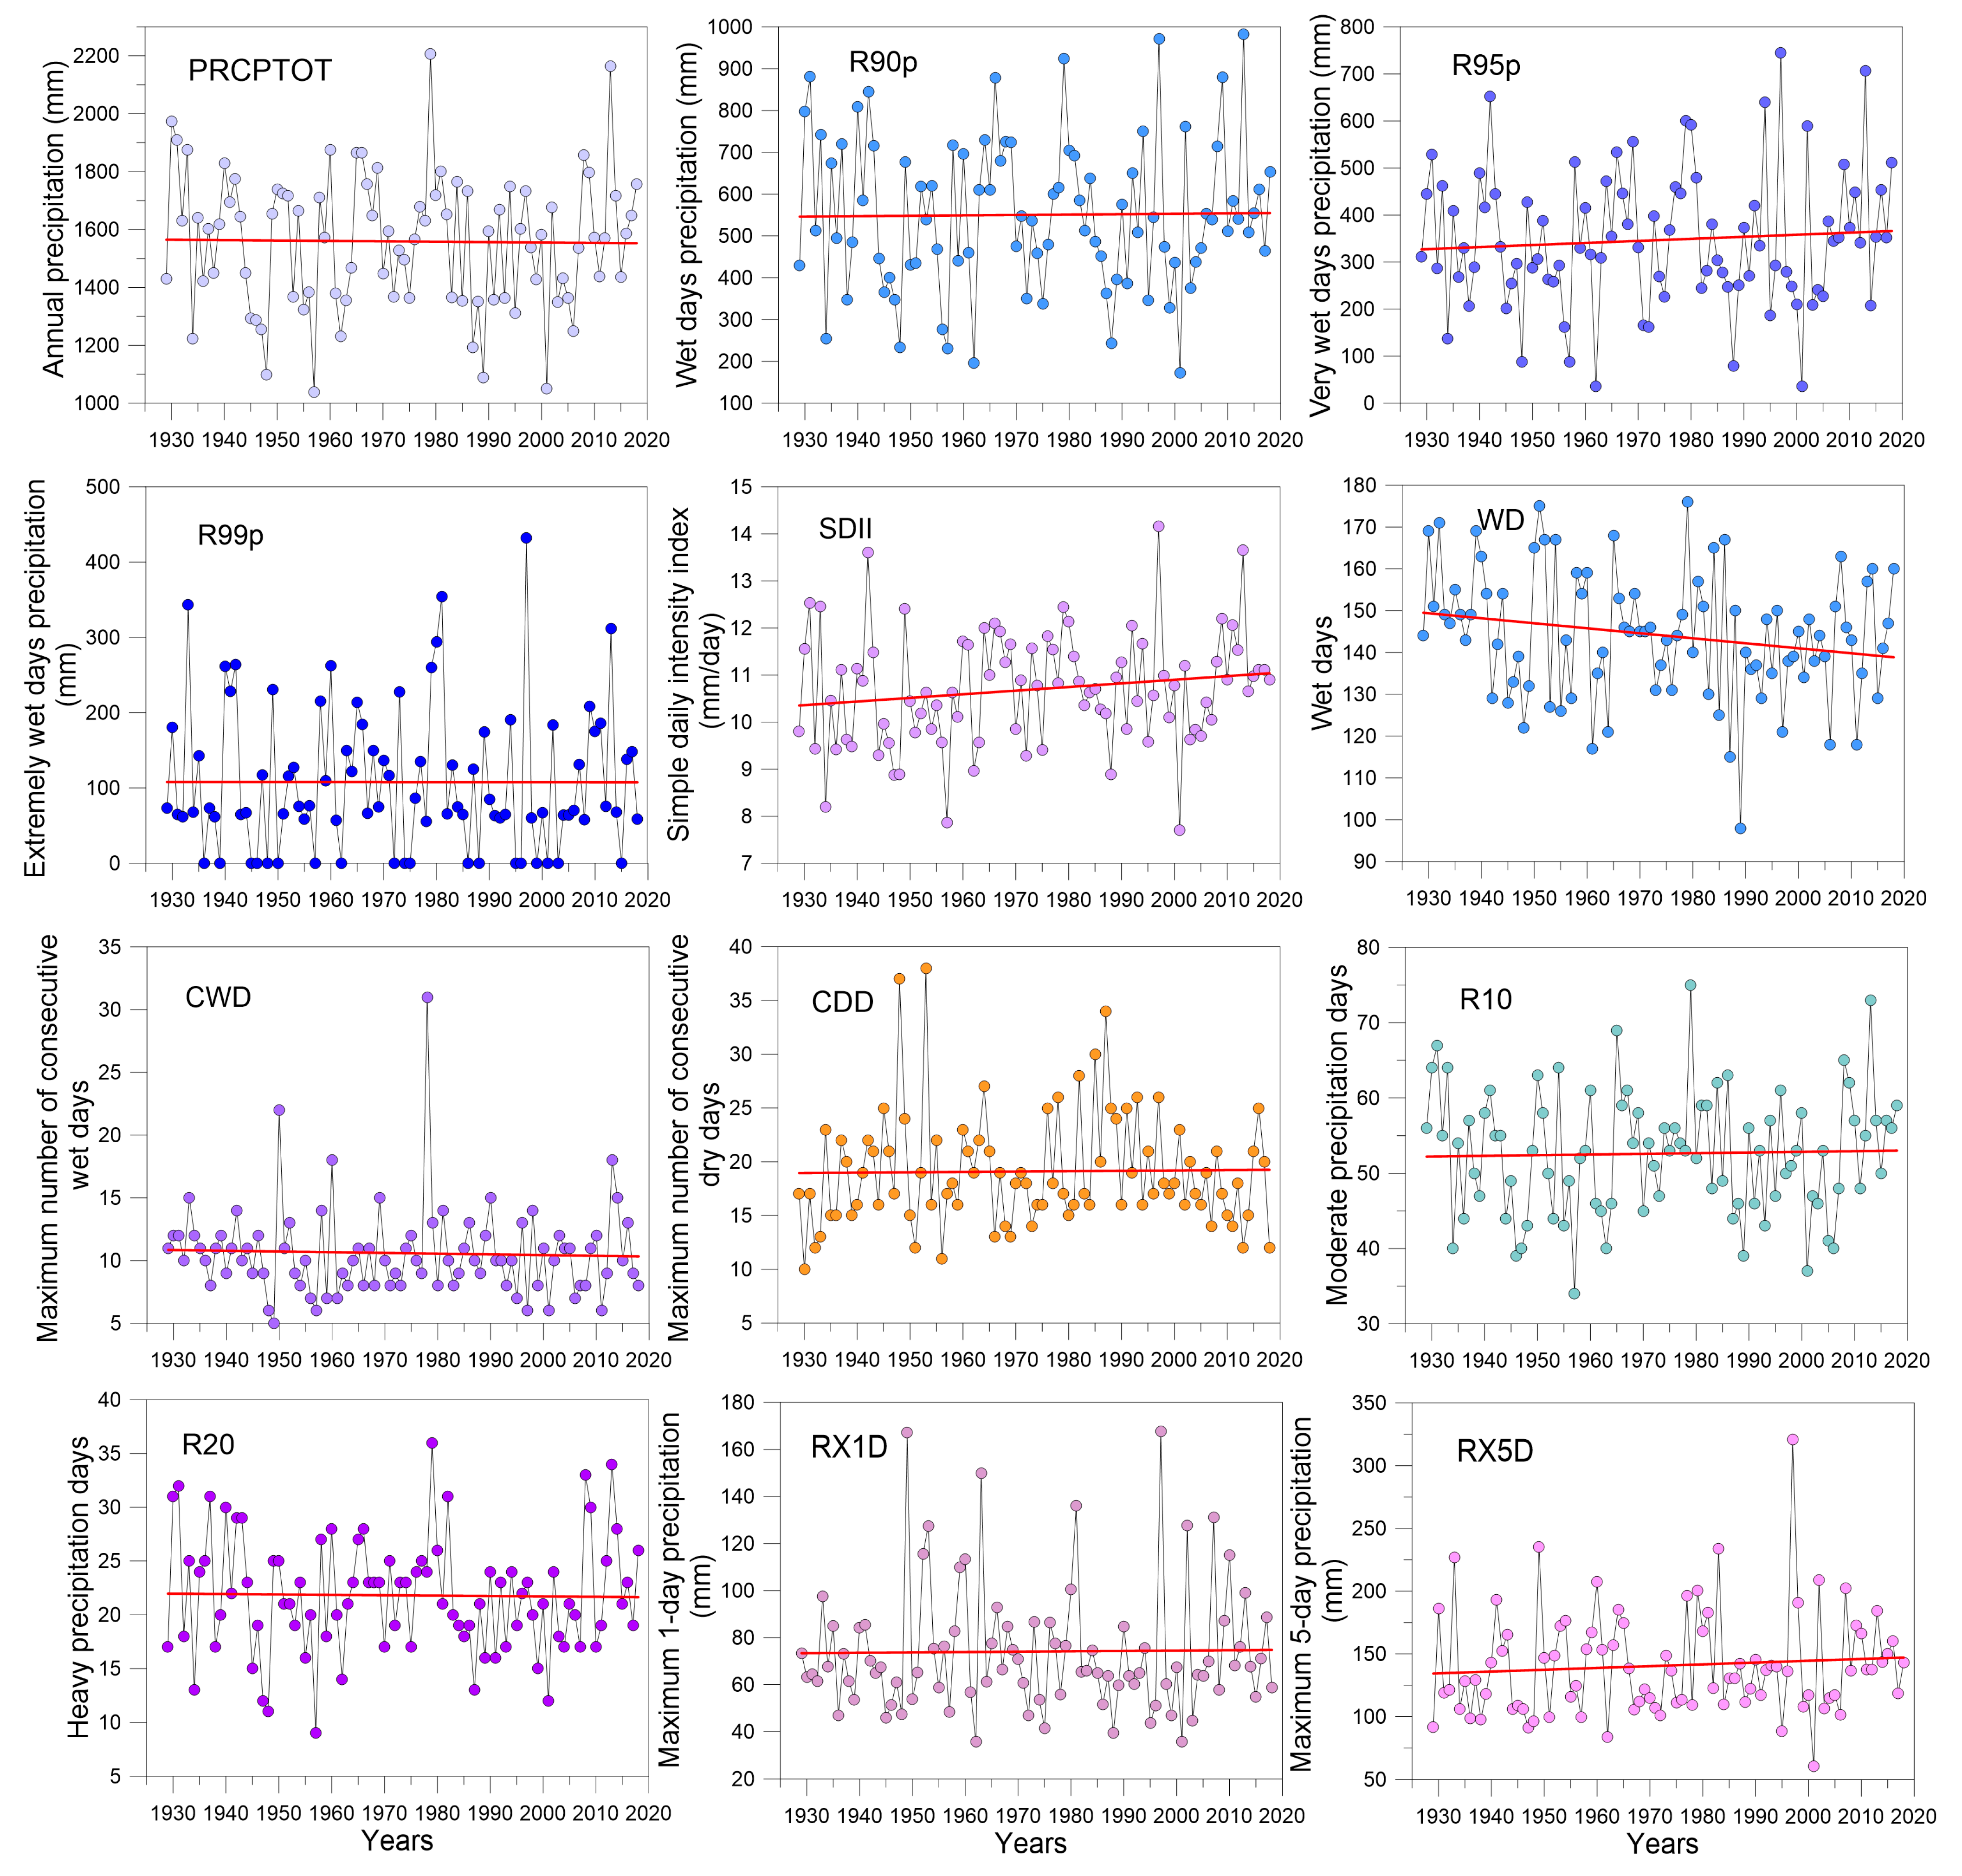
Figure 5 shows the graphical representation of the series of the different indices selected for analysis.
The results of the application of the turning-point test and the autocorrelation test confirmed that the data of the 12 series of the indices of the climate change precipitation indices (ETCCDI) were random and independent and that there was no autocorrelation between them. Then, the Mann–Kendal and Spearman tests were applied, and the non-existence of trends in all the series was confirmed. Finally, the Pettitt test was applied to analyse the existence of change points in the 12 series, and it was verified that there were no change points in the series.
3.3. Seasonal and Monthly Precipitation Analysis
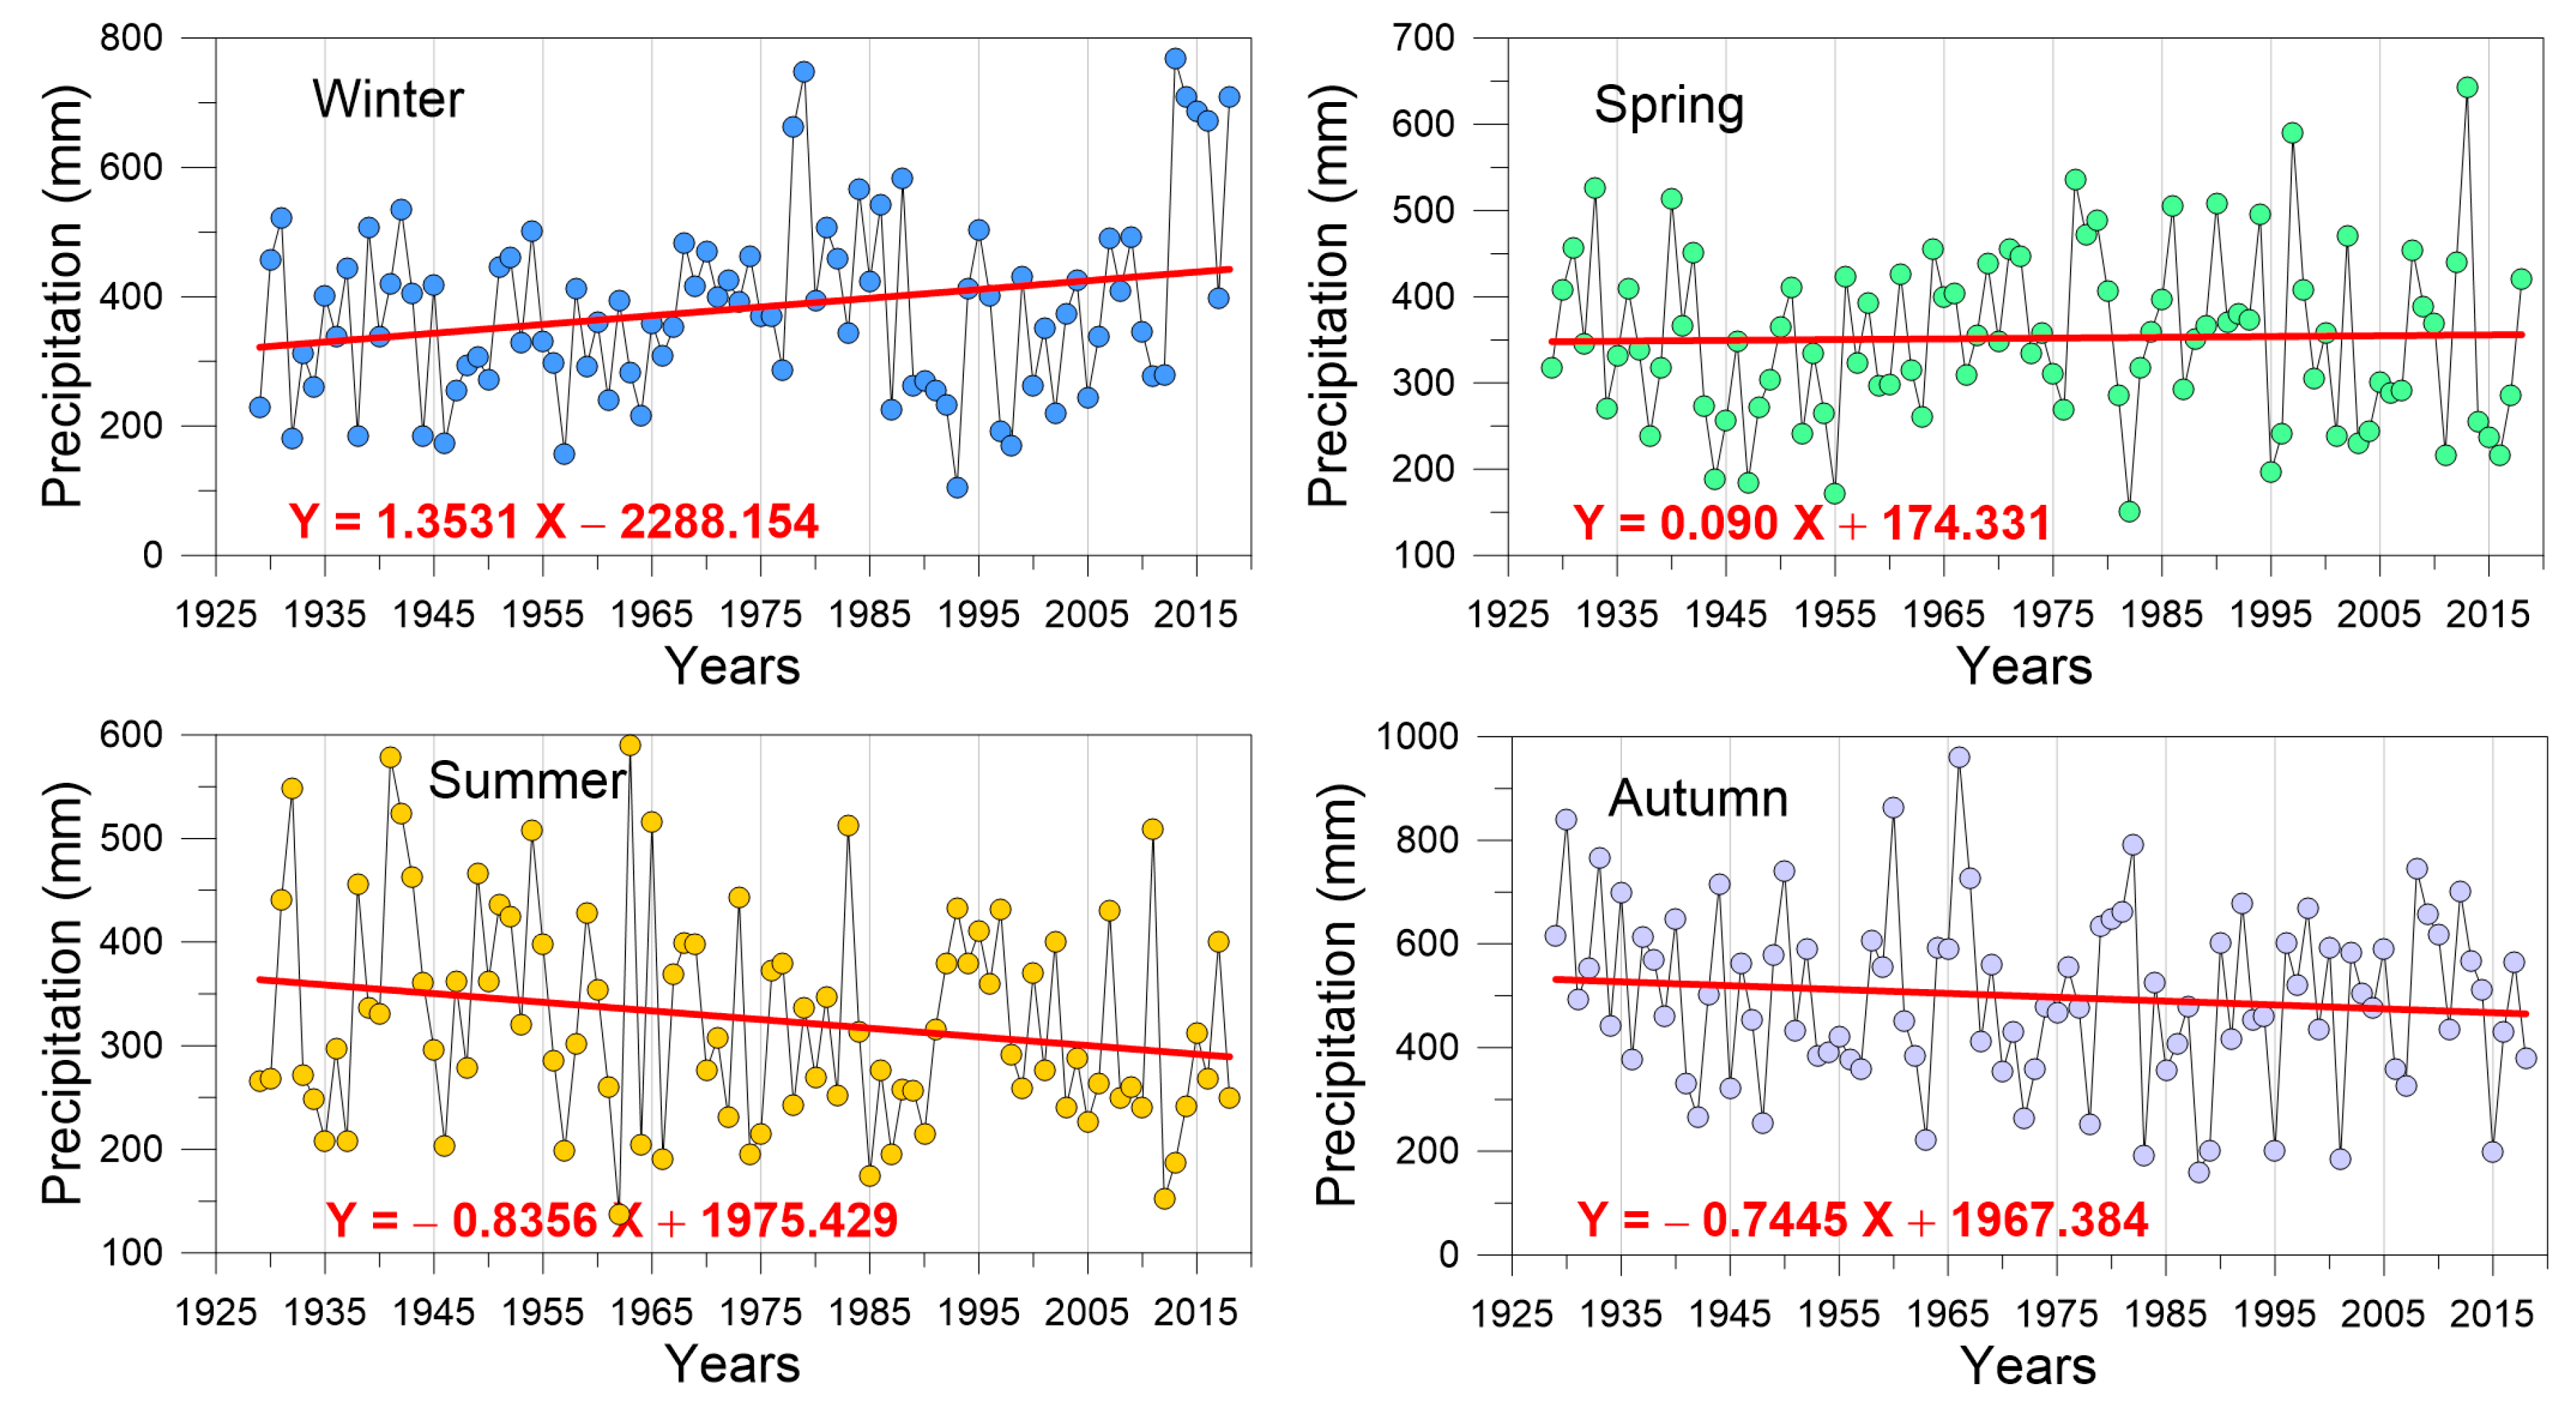
During the period studied, the average percentage of annual precipitation recorded in each of the four seasons of the year was 24.48% in winter; 22.64% in spring; 21.17% in summer; and 31.70% in autumn, with an average annual rainfall of 1558.7 mm. Autumn was the wettest season; the precipitation in the rest of the seasons was more or less evenly distributed as is characteristic of the Cantabrian climate.
Here again, the methodology described to check the randomness, independence, and autocorrelation of the data in each of the series was applied. The results agree that the series were random and the data were independent and that there was no autocorrelation between them. Once these issues were verified, the Mann–Kendal and Spearman tests were applied, and it was found that the three series did not show trends at the 5% level of significance. The same occurred with the Pettitt test; no change points appeared either. However, despite the fact that no statistically significant trends were detected, when representing the regression lines of the series it was observed that the winter precipitation showed an increasing trend while the summer and autumn precipitation showed decreasing trends and in spring there was an almost negligible trend. Figure 6 shows the seasonal precipitation with regression lines.
As for monthly rainfall, the only months that showed statistically significant trends according to the proposed methodology were March with a positive trend and September and October with negative trends. In general, in the rest of the months the trends, although not statistically significant, were consistent with those found in the seasonal ones; that is, they were positive in the winter months and negative in the summer and autumn months, except for November, which was positive.
3.4. Gini Index
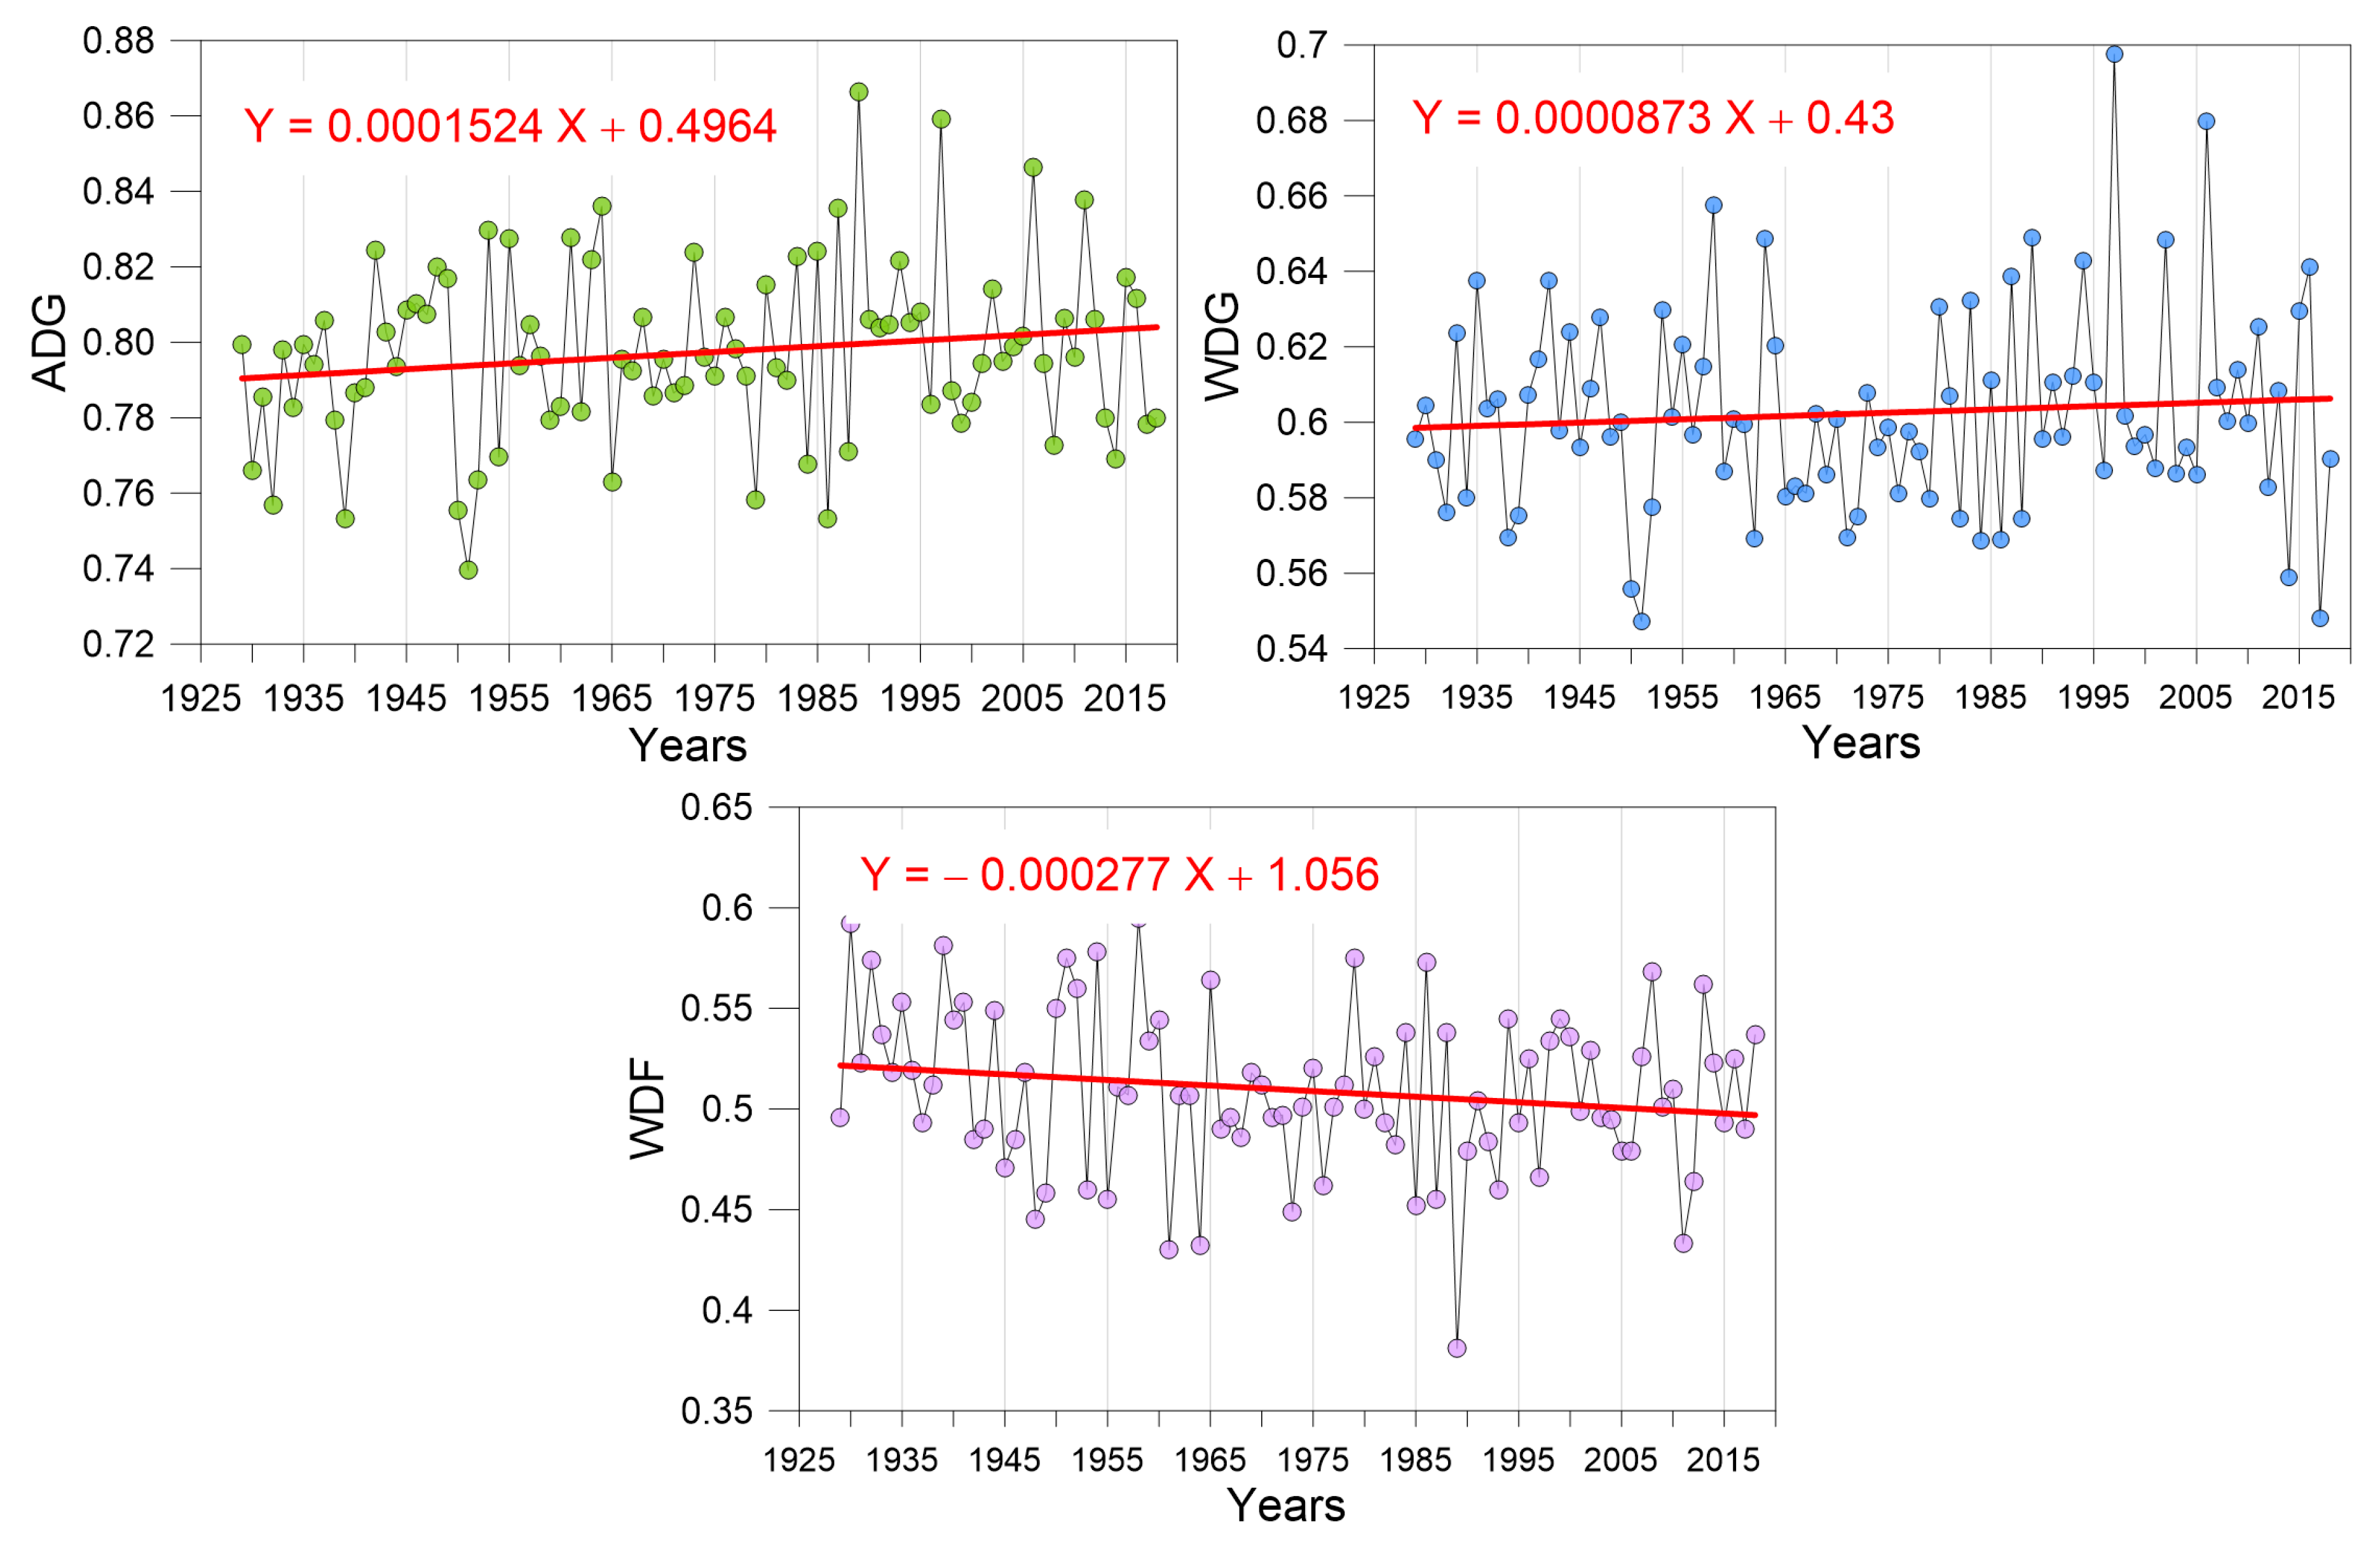
As explained above, in addition to the Gini index itself, we considered all the days of the year with the annual-day Gini (ADG); we also estimated the wet-day Gini index (WDG) and the wet-day frequency index WDF. After applying the methodology described above, it was proven that the series were random, the data were independent, and there was no autocorrelation between them and that the three series did not show trends or change points at the 5% level of significance.
Figure 7 shows the annual values of the three indices obtained for Igeldo with its linear regressions. Although these series do not show significant trends, their linear regressions do present slight trends, as can be seen in the figure. The WDF index has a slight decreasing trend, indicating that the number of wet days tends to decrease. On the other hand, the Gini (ADG, WDG) indices show an increasing trend, indicating that the temporal distribution of rainfall has a certain tendency to concentrate, which is consistent with the increasing trend of rainy days. This slight increasing trend observed in the Gini series is consistent with that pointed out by Rajah et al. [34], who showed that the frequency of wet days and the Gini values of wet days in Western Europe responded to a pattern of increasing values.
3.5. Climatological Standard Normals
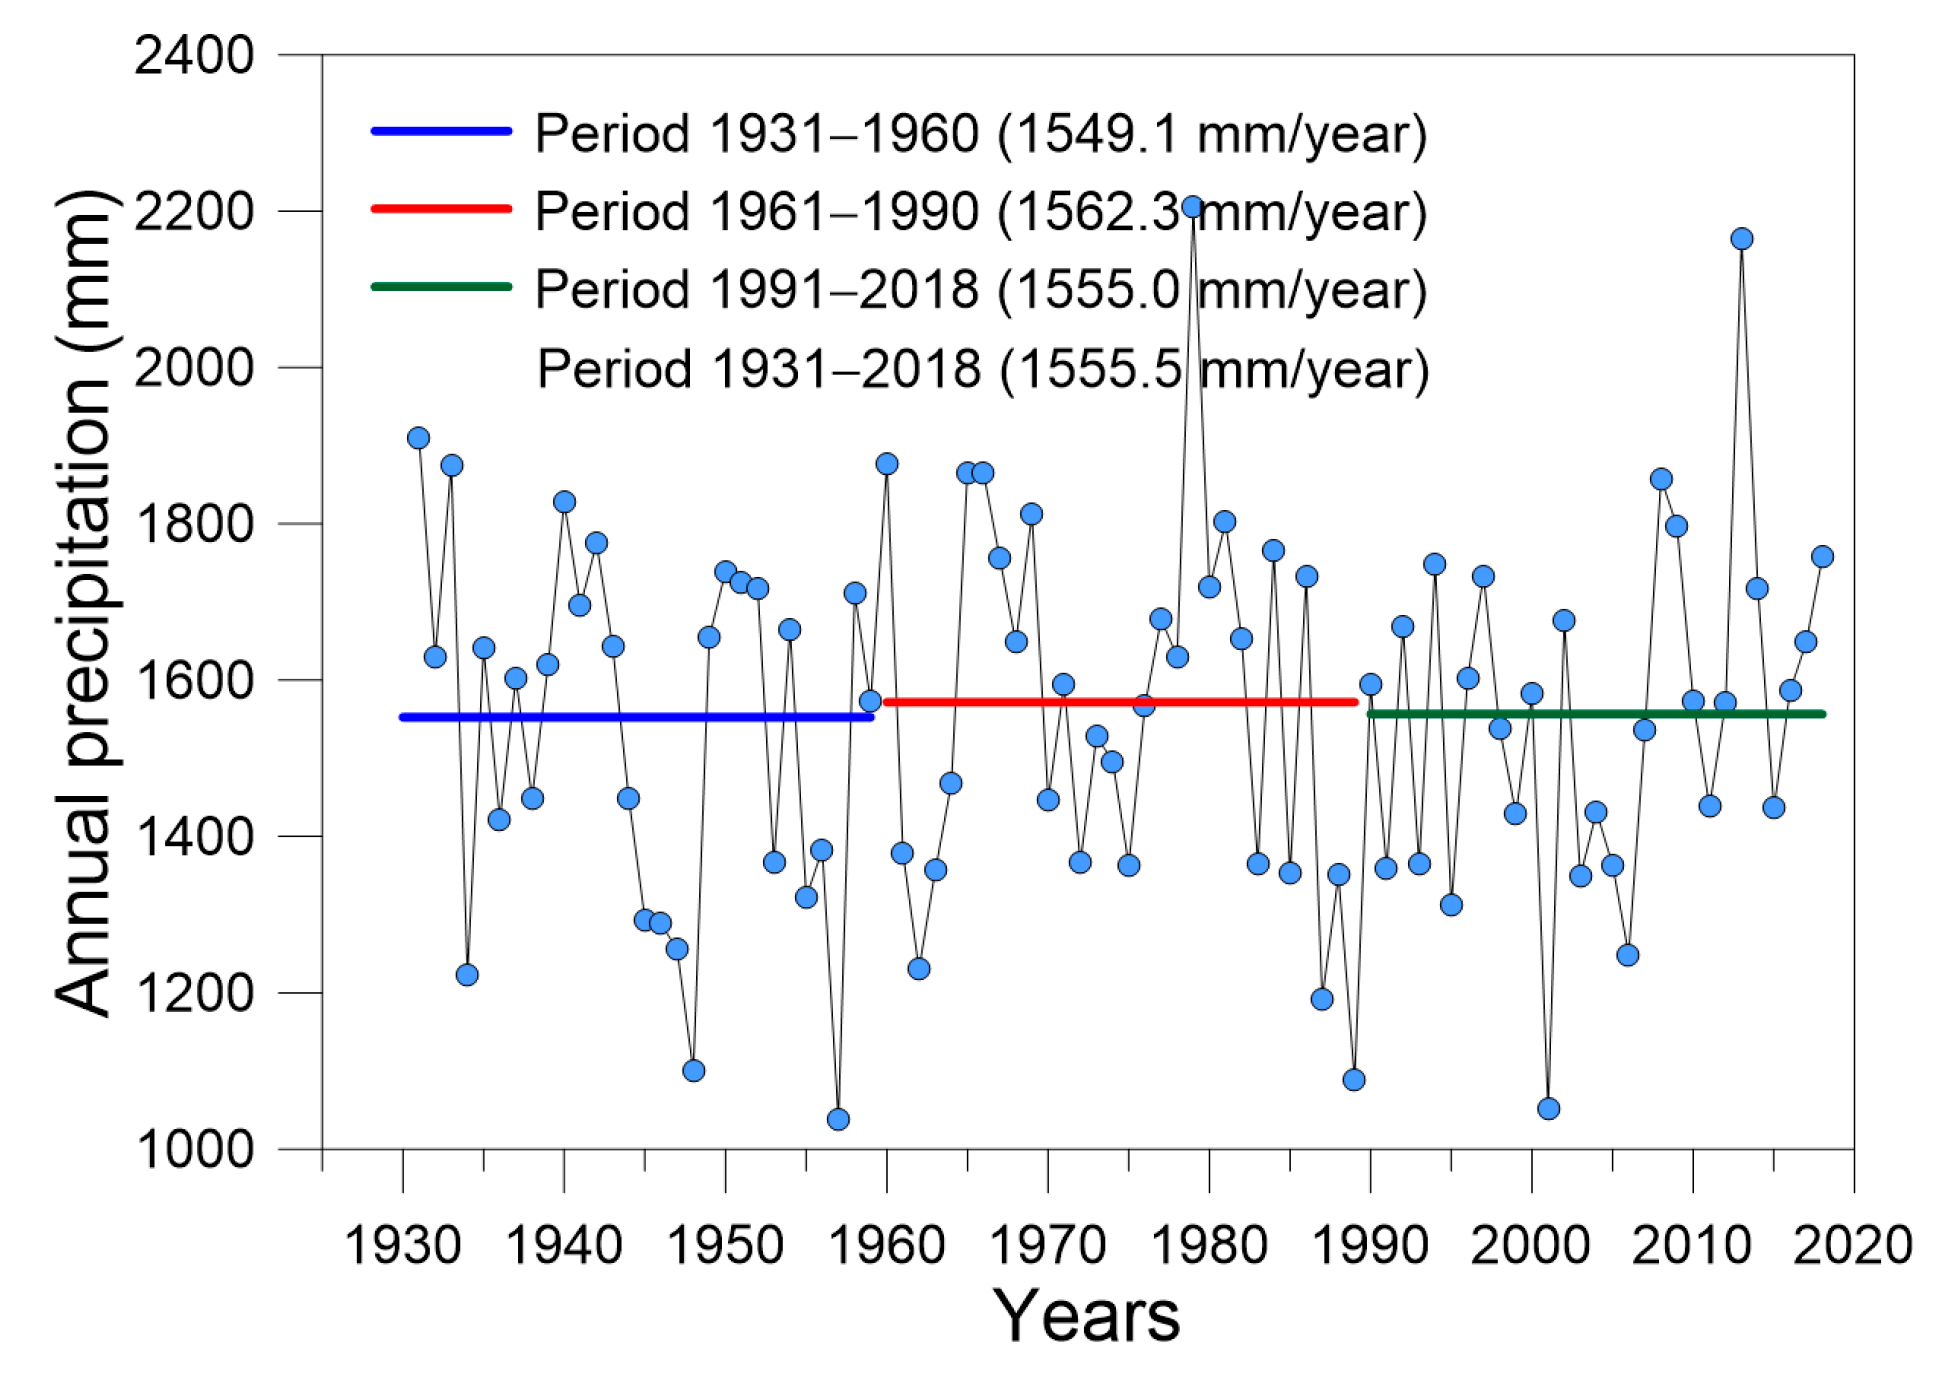
Figure 8 shows the annual precipitation values for each of the Climatological Normals (from 1 January 1931 to 31 December 1960; from 1 January 1961 to 31 December 1990; and from 1 January 1991 to 31 December 2018). With the methodology described above, in none of the three periods (Normals) were statistically significant trends detected, as can be seen in Figure 8. In addition, it was considered convenient to check that the rainfall data of the three periods belonged to the same population, for which the non-parametric Kruskal–Wallis test was applied [66]. The result corroborated the finding that the samples corresponding to the three periods belonged to the same population.
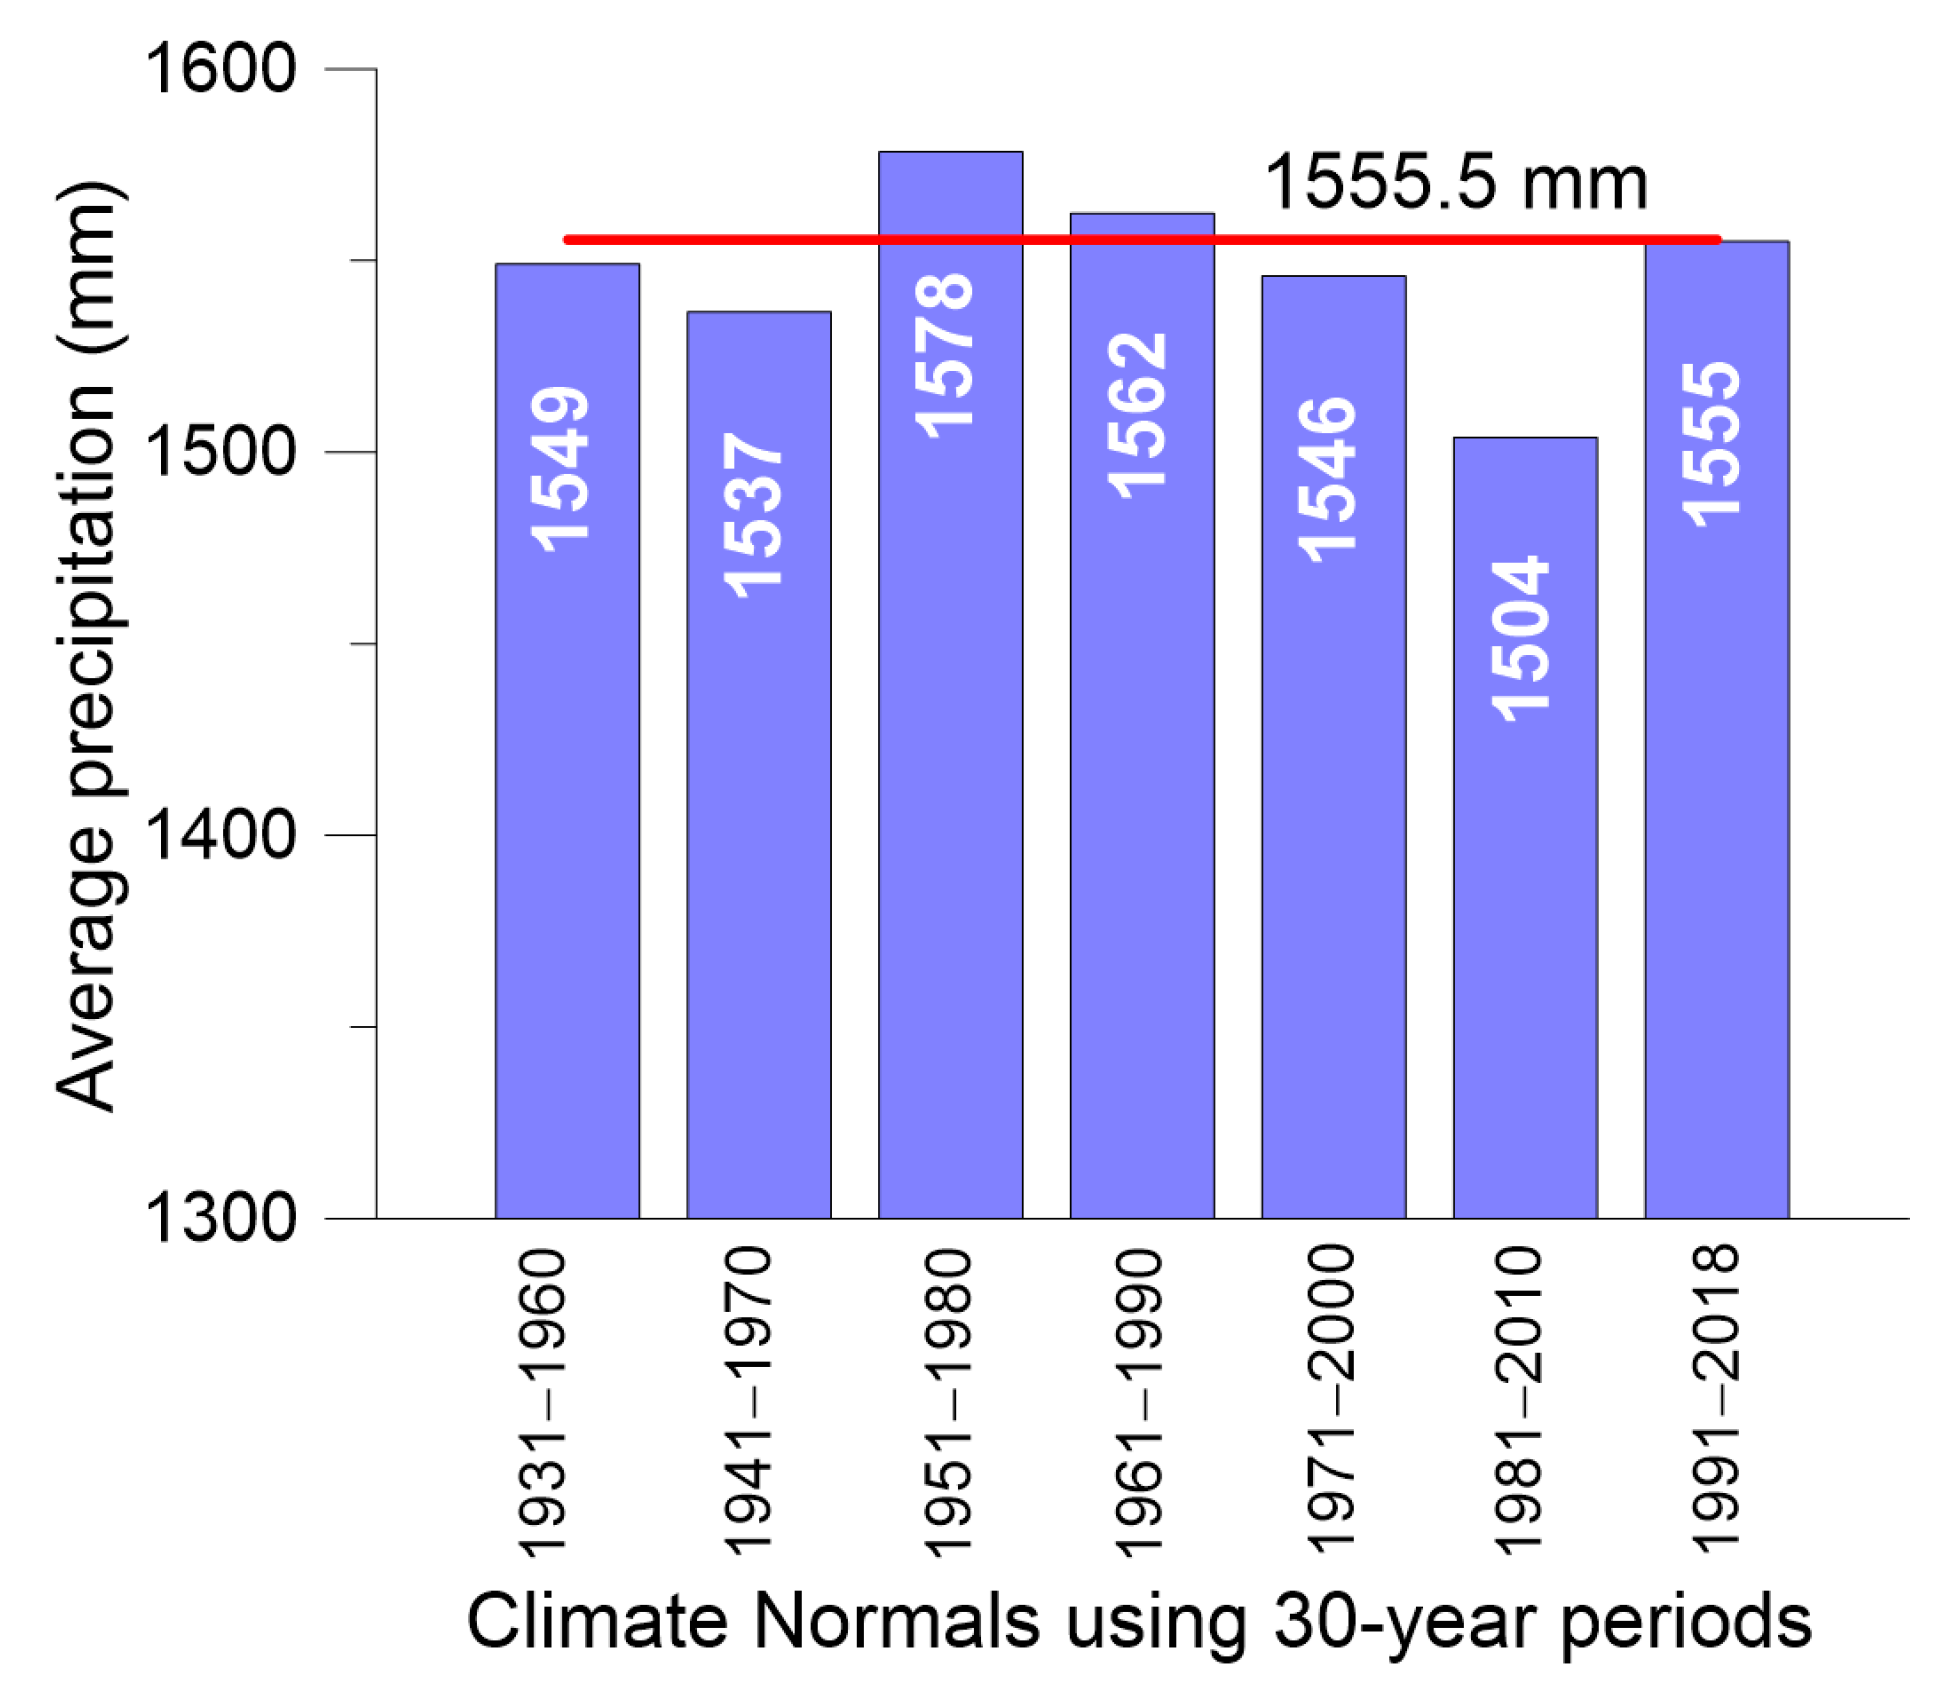
In accordance with the WMO, which established that 30-year averages should be calculated and which recommended an update at the beginning of each decade, we obtained the different Climatological Normals since the beginning of each decade, from 1931–1960 to the current period of 1991–2018, with the absence of data from the last two years, 2019 and 2020. As in the previous case, no statistically significant trends were detected in any of these Normals. Figure 9 shows the mean precipitation values for each of the Normals calculated in this way and shows that the deviations were minimal with respect to the mean annual precipitation of the entire period; the deviations ranged from 96.7% in the period of 1981–2010 to 101.5% in the period of 1951–1980.
3.6. Analysis of Annual and Seasonal Precipitation Anomalies
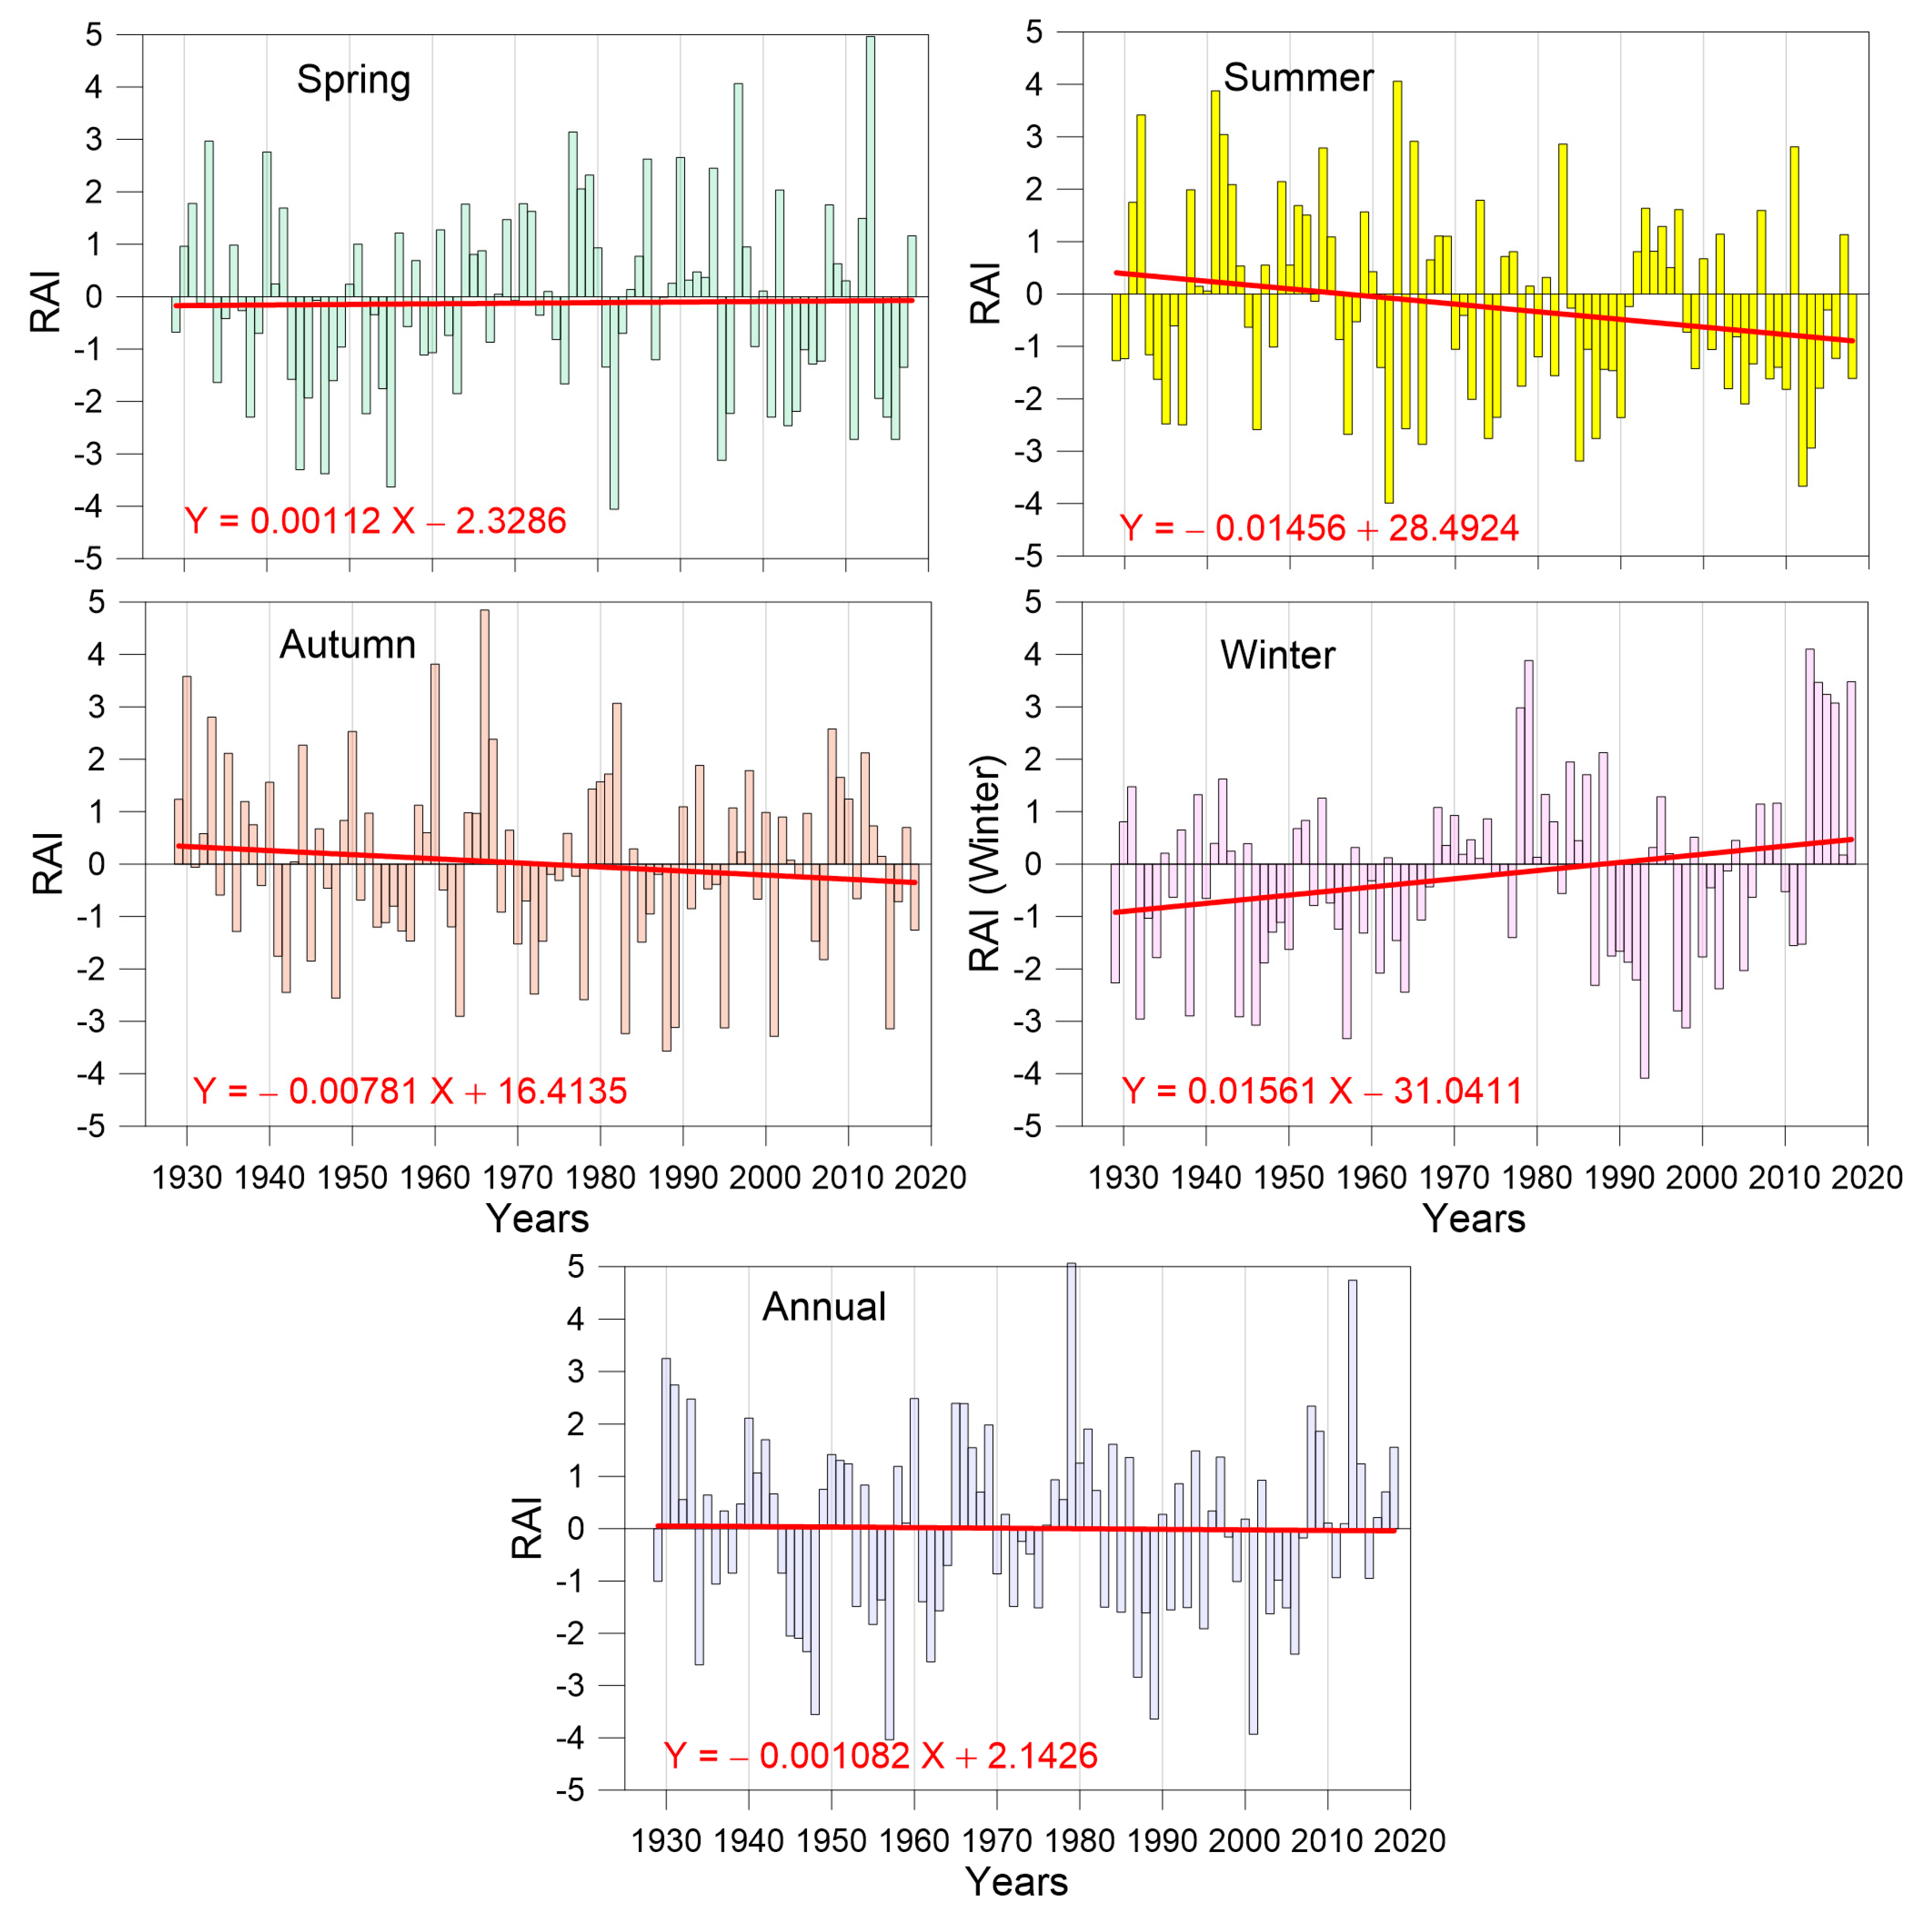
The precipitation anomalies were analysed by means of the rainfall anomaly index (RAI) proposed by van Rooy [39] and applied by several authors [40,41,42]. In this case, as in the previous ones, the RAI series was also random, the data were independent, there was no autocorrelation between them, and the series did not show trends or change points at the 5% level of significance.
It can be seen in Figure 10 that the trends of the regression lines are consistent with those of the seasonal precipitation and, to a large extent, with those of the maximum intensities. The trend of the anomalies (RAI) in winter is increasing; in spring, it is increasing, although very slightly; and in autumn and summer, it is decreasing.
4. Discussion
The Igeldo meteorological station (San Sebastian/Donostia) has a float-type recording rain gauge that has been recording precipitation intensities without interruption since 1928, with the same maintenance criteria. Therefore, the series of rainfall intensities recorded at this station is one of the longest and best maintained in Spain, which makes it very suitable for studying the behaviour and trends of these intensities. Taking advantage of these scientific data, this work was initiated with the idea of detecting trends in the series of maximum annual precipitation intensities or the maximum annual precipitation for different durations, considering that this parameter was related to the occurrence of extreme phenomena.
Reviewing the literature of recent years on precipitation trends around the study area (Table 4), most of them are regional studies analysing the trends of precipitation parameters associated with daily, monthly, or annual precipitation series (16 out of 23); five worked with hourly and higher precipitation series and only two with sub-hourly series. On the other hand, the length of the series varied greatly depending on the rainfall interval. The longest series corresponded to monthly and annual rainfall analyses; the works associated with daily rainfall series studied periods of around 60 years; those working with sub-hourly intensities were generally much shorter; and the longest ones were fractionated, as in [67].
The works reviewed also show that the behaviour of the rainfall series is highly variable, depending on the location; different trends of the same parameter can be obtained at relatively close sites, depending on the proximity to the coast or the presence of mountain ranges. Therefore, it is also important to carry out rigorous studies at the local level to assess water resources. This is the case with the Igeldo series used in this work, which allowed a detailed and rigorous study of the trends in the different aspects and parameters of the rainfall regime.
At the methodological level, it is worth highlighting two aspects of the work carried out: on the one hand, there was the systematisation of the tests to be applied; on the other, there were the pluviometric parameters to be analysed. Regarding the first aspect, the bibliography contains a multitude of tests for each of the characteristics of the series to be checked; in our case, we systematised a simple methodology with non-parametric tests that are widely used and recommended by the WMO. A suggestion for improvement, which has arisen from the analysis of the results, is to add a method that allows us to segregate the trends into categories since the Mann–Kendall test only allows us to say whether or not there are statistically significant trends. Sen [90] developed a procedure that allows the segregating or assessing of the trend by categories into “very low”, “low”, “medium”, “high”, and “very high” [91,92,93]. The second aspect refers to the parameters that were analysed.
The second methodological aspect refers to the parameters that were analysed. A total of 165 series of pluviometric parameters were obtained to characterise the trend of the rainfall regime. None of the works reviewed have analysed so many parameters; as they were regional studies, they focused on a few parameters, often conditioned by the resolution of the series. From the 89-year ten min precipitation series obtained from the digitisation of the pluviographic bands obtained in a syphon (float)-type automatic rainfall recorder, all annual (8), seasonal (32), and monthly (96) maximum rainfall series were obtained for the different rainfall durations considered. On the other hand, the 90-year daily precipitation series obtained from a conventional non-recording rain gauge made it possible to obtain the series for the rest of the parameters: the climate change precipitation indices recommended by ETCCDI (12), which evaluate different aspects of the pluviometric regime; seasonal rainfall (4), which, together with annual rainfall, is included in the indices recommended by the ETCCDI and is fundamental for estimating the water resources of an area; the Gini index (2), which expresses the degree of concentration of rainfall throughout the year or the distribution of daily rainfall throughout the year; the climatological standard normals (7), which essentially serve as a benchmark against which recent or current observations can be compared; and finally the annual and seasonal precipitation anomalies (5), representing the degree of deviation of the precipitation values from the mean value.
In relation to maximum precipitation intensities, a report by the IPCC [94] states that there is high confidence that precipitation will become more intense and frequent in the Mediterranean region due to climate change, with the largest increases in extreme precipitation projected for the western and northern parts of the region. With regard to the references consulted for Europe, it can be said that positive or increasing trends in precipitation intensities can generally be observed, as indicated in the IPCC report [94], although there are also different behaviours.
Tamm et al. [67], based on the trend analysis of precipitation series for durations between 20 and 180 min, concluded that it can be generalised that the annual maximum rainfall intensities in Estonia (northern Europe) have increased. In a study in which 14 extreme rainfall indices were analysed in terms of trends for four meteorological stations in a region of Turkey [71], it was concluded that the precipitation intensity indices (SDII) of all the stations showed increasing trends, although only two were statistically significant. Liuzzo and Freni [77] analysed the trends of precipitation series for different sub-hourly durations recorded at 65 meteorological stations in Sicily; for each duration, the results showed that in the area of study the extreme rainfall series were affected by both negative and positive statistically significant trends. In other works carried out in Sicily ([80,86]), where sub-hourly rainfall series trends were also studied, the results indicated that for short durations the historical series generally exhibited increasing trends, while for longer durations the trends were mainly negative.
In our case, as discussed above, no statistically significant trends or breakpoints were detected in the annual maximum precipitation series for different durations in Igeldo. Nevertheless, significant increasing trends were detected in winter for the different durations. For the rest of the seasons, it can be said that the precipitation intensities showed a certain decreasing trend in autumn, while in spring and summer there was an increasing trend, although in these cases it was not statistically significant.
In the case of annual and seasonal rainfall, analysing the results obtained in other studies on trends in Spain ([73,74,83,85,89]), it can be concluded that the most generalised trend of annual precipitation in the Iberian Peninsula is decreasing, although there is also a certain disparity that will be conditioned by different factors. A study of the Spanish Levante region [73] showed significant negative trends for precipitation in the Júcar area; in contrast, certain pre-littoral sectors and most of the Segura area are remaining out of these negative trends (with some local positive trends). A comprehensive analysis of the spatial and temporal variability of daily precipitation in Spain [74] showed a slight decrease in the intensity when considering single events (1- or 5-day duration), but a significant negative trend in mean and median precipitation, especially on the Mediterranean coast. In a trends studio in Andalusia [85], a negative trend in precipitation was observed for the east coast and inland stations, and an increasing trend in precipitation was observed for stations on the west coast. A general decreasing trend in seasonal precipitation, especially in winter, autumn, and spring, was observed for all stations except those on the west coast. A trend study of trends in daily rainfall in the Iberian Peninsula [89] concluded that the general behaviour showed a decrease in the daily intensity of rainfall, while the number of wet days did not reveal pronounced changes. This pattern was valid for both the annual and the seasonal values of the indices. De Lima et al. [84], in a large study in Portugal, concluded that the analyses of partial trends in the time series suggested a sequence of alternately decreasing and increasing trends in annual and monthly precipitation, which were sometimes statistically significant. On the other hand, in a study of five Mediterranean areas [68], the precipitation observed in the same period showed a negative gradient for Greece, Portugal, and Turkey and a positive trend for Spain and Tunisia, although the trends were not statistically significant. Similar behaviour was found in the rest of the Mediterranean areas with precipitation trend studies.
It can be concluded that although in many sites decreasing trends in annual and seasonal rainfall are detected, there is a great disparity in the trends detected. The location of Igeldo in the Bay of Biscay with a Cantabrian climate, quite different from that of the Mediterranean, may be the cause of the different behaviour that it has shown. We have already explained that there are no such long series in the north of Spain, but it would be important to extend this work to the region to verify that this behaviour is repeated.
5. Conclusions
This work was initiated with the idea of detecting trends in the series of annual maximum precipitation intensities or maximum annual precipitation for different durations, considering that this parameter was related to the occurrence of extreme phenomena. For this purpose, a simple and effective methodology, based on the application of different tests, was developed to evaluate the trend of the values of a series and the existence of breakpoints. After the analysis of the annual maximum precipitation intensities, according to this methodology, these series did not show significant trends or breakpoints at the 5% level of significance. In view of the absence of trends in these intensities, the series of maximum seasonal precipitation intensities were also analysed. The interest in this analysis was based on the fact that the origin of seasonal precipitation is usually associated with different climatological phenomena. In this case, the increasing trends and significant breakpoints were detected in the winter season. No significant trends or change points were detected in the rest of the seasons.
In addition to the maximum precipitation intensities, other indices or parameters were analysed, such as the 12 pluviometric indices recommended by the Expert Team on Climate Change Detection and Indices (ETCCDI) that characterise different aspects of the pluviometric regime; the seasonal precipitation; the Gini index that parametrises the temporal distribution of rainfall throughout the year; and the annual and seasonal precipitation anomalies that represent the variations with respect to the average precipitation. In all the series analysed, it was proved that the series were random, the data were independent, and there was no autocorrelation between them. Therefore, it was possible to apply the trend and change point tests. No trends (Mann–Kendal and Spearman tests) or points of change (Pettitt test) were detected at the 5% level of significance in any of the series of the parameters indicated. However, despite not having detected statistically significant trends in the different related indicators, when the linear regressions were applied to the different seasonal variables analysed (seasonal precipitation and seasonal anomalies), it was observed that the trends of the regression lines in winter are increasing, while in summer and autumn they are decreasing. This behaviour is consistent with what occurs with maximum precipitation. It can be concluded, therefore, that the different seasonal precipitation indicators show an increasing trend in the winter season, while in summer and autumn the trend is downward.
In general terms, it can be concluded that the precipitation regime in Igeldo is quite stationary without showing significant alterations in the context of climate change.
It should be noted that the study is at a local level, limited to a specific geographical point. In order to draw conclusions regarding water resources, it would be necessary to carry out a study at a regional level. Therefore, for subsequent studies it would be interesting to apply the methodology developed in this work to the representative pluviometric series of the Cantabrian climate, knowing that there are no series with historical data covering as long a period as that of Igeldo.
Author Contributions
All authors contributed to the study conception and design. The collection, processing and determination of the different data series were carried out by J.J.L., M.G. and F.N.G. The development and implementation of the test programmes was conducted by J.L.A.-M. The analysis of the results as well as the drafting of the manuscript was carried out by J.J.L. and J.L.A.-M. All authors have read and agreed to the published version of the manuscript.
Funding
This work was partially funded by the research project 0011-1365-2021-000081 corresponding to the 2021 call for R + D project grants from the Government of Navarra, which is 50% co-financed by the European Regional Development Fund through the 2014–2020 ERDF Operational Programme of Navarra.
Data Availability Statement
The series of rainfall data used can be downloaded from the AEMET website: https://www.aemet.es/es/datos_abiertos/AEMET_OpenData (accessed on 20 March 2019).
Acknowledgments
The authors would like to express their special thanks to the Directorate General of Hydraulic Works of the Provincial Council of Gipuzkoa and, in particular, to Andoni Da Silva, for his willingness to provide the data and answer all questions raised.
Conflicts of Interest
The authors declare no conflict of interest.
References
- IPCC. Climate Change 2021: The Physical Science Basis. Working Group I (WGI) Contribution to the Sixth Assessment Report (AR6) of the IPCC. 2021. Available online: https://www.ipcc.ch/report/ar6/wg1/downloads/report/IPCC_AR6_WGI_Full_Report_smaller.pdf (accessed on 10 March 2022).
- IPCC. Climate Change 2022: Impacts, Adaptation and Vulnerability. Working Group II (WGII) Contribution to the Sixth Assessment Report (AR6) of the IPCC. 2022. Available online: https://report.ipcc.ch/ar6wg2/pdf/IPCC_AR6_WGII_FinalDraft_FullReport.pdf (accessed on 10 March 2022).
- Caporali, E.; Lompi, M.; Pacetti, T.; Chiarello, V.; Fatichi, S. A review of studies on observed precipitation trends in Italy. Int. J. Climatol. 2021, 41 (Suppl. S1), E1–E25. [Google Scholar] [CrossRef]
- Burlando, P.; Rosso, R. Effects of transient climate change on basin hydrology. 1. Precipitation scenarios for the Arno River, central Italy. Hydrol. Process. 2002, 16, 1151–1175. [Google Scholar] [CrossRef]
- Sulis, M.; Paniconi, C.; Marrocu, M.; Huard, D.; Chaumont, D. Hydrologic response to multimodel climate output using a physically based model of groundwater/surface water interactions. Water Resour. Res. 2012, 48, 1–18. [Google Scholar] [CrossRef] [Green Version]
- Piras, M.; Mascaro, G.; Deidda, R.; Vivoni, E.R. Quantification of hydrologic impacts of climate change in a Mediterranean basin in Sardinia, Italy, through high-resolution simulations. Hydrol. Earth Syst. Sci. 2014, 18, 5201–5217. [Google Scholar] [CrossRef] [Green Version]
- Hegerl, G.C.; Black, E.; Allan, R.P.; Ingram, W.J.; Polson, D.; Trenberth, K.E.; Chadwick, R.S.; Arkin, P.A.; Sarojini, B.B.; Becker, A.; et al. Challenges in Quantifying Changes in the Global Water Cycle. Bull. Am. Meteorol. Soc. 2015, 96, 1097–1115. [Google Scholar] [CrossRef] [Green Version]
- Kim, J.; Ivanov, V.Y. A holistic, multi-scale dynamic downscaling framework for climate impact assessments and challenges of addressing finer-scale watershed dynamics. J. Hydrol. 2015, 522, 645–660. [Google Scholar] [CrossRef] [Green Version]
- Fatichi, S.; Rimkus, S.; Burlando, P.; Bordoy, R.; Molnar, P. High-resolution distributed analysis of climate and anthropogenic changes on the hydrology of an alpine catchment. J. Hydrol. 2015, 525, 362–382. [Google Scholar] [CrossRef]
- Huang, J.; Yu, H.; Guan, X.; Wang, G.; Guo, R. Accelerated dryland expansion under climate change. Nat. Clim. Chang. 2016, 6, 166–171. [Google Scholar] [CrossRef]
- Katz, W.R.; Brown, G. Extreme events in changing climate: Variability is more important than averages. Clim. Chang. 1992, 21, 289–302. [Google Scholar] [CrossRef]
- Karl, T.R.; Trenberth, K.E. Modern Global Climate Change. Science 2003, 302, 1719–1723. [Google Scholar] [CrossRef] [Green Version]
- Xu, Z.X.; Chen, Y.N.; Li, J.Y. Impact of Climate Change on Water Resources in the Tarim River Basin. Water Resour. Manag. 2004, 18, 439–458. [Google Scholar] [CrossRef]
- Groisman, P.Y.; Knight, R.W.; Easterling, D.R.; Karl, T.R.; Hegerl, G.C.; Razuvaev, V.N. Trends in Intense Precipitation in the Climate Record. J. Clim. 2005, 18, 1326–1350. [Google Scholar] [CrossRef]
- Milly, P.C.D.; Wetherald, R.T.; Dunne, K.A.; Delworth, T.L. Increasing risk of great floods in a changing climate. Nature 2002, 415, 414–517. [Google Scholar] [CrossRef]
- Huntington, K.W.; Blythe, A.E.; Hodges, K.V. Climate change and Late Pliocene acceleration of erosion in the Himalaya. Earth Planet. Sci. Lett. 2006, 252, 107–118. [Google Scholar] [CrossRef]
- WMO. WMO Statement on the Status of the Global Climate in 2003; World Meteorological Organization (WMO): Geneva, Switzerland, 2003. [Google Scholar]
- Zhang, Q.; Gemmer, M.; Chen, J. Climate changes and flood/drought risk in the Yangtze Delta, China, during the past millennium. Quat. Int. 2008, 176–177, 62–69. [Google Scholar] [CrossRef]
- Mishra, A.K.; Singh, V.P. A review of drought concepts. J. Hydrol. 2010, 391, 202–216. [Google Scholar] [CrossRef]
- Fowler, H.J.; Ekström, M. Multi-model ensemble estimates of climate change impacts on UK seasonal precipitation extremes. Int. J. Climatol. 2009, 29, 385–416. [Google Scholar] [CrossRef]
- Portmann, R.W.; Solomon, S.; Hegerl, G.C. Spatial and seasonal patterns in climate change, temperatures, and precipitation across the United States. Proc. Natl. Acad. Sci. USA 2009, 106, 7324–7329. [Google Scholar] [CrossRef] [Green Version]
- Perkins, S.E.; Alexander, L.V.; Nairn, J.R. Increasing frequency, intensity and duration of observed global heatwaves and warm spells. Geophys. Res. Lett. 2012, 39, L20714. [Google Scholar] [CrossRef]
- Donat, M.G.; Alexander, L.V.; Yang, H.; Durre, I.; Vose, R.; Dunn, R.J.H.; Willett, K.M.; Aguilar, E.; Brunet, M.; Caesar, J.; et al. Updated analyses of temperature and precipitation extreme indices since the beginning of the twentieth century: The HadEX2 dataset. J. Geophys. Res. Atmos. 2013, 118, 2098–2118. [Google Scholar] [CrossRef] [Green Version]
- Montanari, A.; Young, G.; Savenije, H.H.G.; Hughes, D.; Wagener, T.; Ren, L.L.; Koutsoyiannis, D.; Cudennec, C.; Toth, E.; Grimaldi, S.; et al. “Panta Rhei—Everything flows”: Change in hydrology and society—The IAHS scientific decade 2013–2022. Hydrol. Sci. J. 2013, 58, 1256–1275. [Google Scholar] [CrossRef]
- Serinaldi, F.; Kilsby, C.G. Stationarity is undead: Uncertainty dominates the distribution of extremes. Adv. Water Resour. 2015, 77, 17–36. [Google Scholar] [CrossRef] [Green Version]
- Fatichi, S.; Ivanov, V.Y.; Paschalis, A.; Peleg, N.; Molnar, P.; Rimkus, S.; Kim, J.; Burlando, P.; Caporali, E. Uncertainty partition challenges the predictability of vital details of climate change Earth future. Earth’s Future 2016, 4, 240–251. [Google Scholar] [CrossRef]
- AEMET. Análisis Estacional. Donostia/San Sebastián, Igueldo. AEMET. 2019. Available online: https://www.aemet.es/es/serviciosclimaticos/vigilancia_clima/analisis_estacional?w=&l=1024E&datos=prec (accessed on 3 June 2021).
- Gómez, J.; Saez, J.A. San Sebastian. Donostia. Geografía e Historia; 2ª Ed. Instituto geográfico vasco (INGEBA). 2017. Available online: http://www.ingeba.org/liburua/2016%20donostia%20definitivo%20baja%20resolucion.pdf (accessed on 21 May 2022).
- Sola, A. Clima. En San Sebastian. Donostia. Geografía e Historia; 2ª Ed. Instituto geográfico vasco (INGEBA). 2017. Available online: http://www.ingeba.org/index.htm (accessed on 21 May 2022).
- Lozano, P. Régimen precipitacional en el norte de Navarra y Guipúzcoa ¿Record peninsular y europeo? Nimbus. Rev. Climatol. Meteorol. Y Paisaje 2016, 17–18, 125–144. [Google Scholar]
- López, J.J.; Delgado, O.; Campo, M.A. Determinación de las curvas IDF en Igueldo-San Sebastián. Comparación de diferentes métodos. Ing. Agua. 2018, 22, 209–223. [Google Scholar] [CrossRef] [Green Version]
- Jawitz, J.W.; Mitchell, J. Temporal inequality in catchment discharge and solute export. Water Resour. Res. 2011, 47, W00J14. [Google Scholar] [CrossRef]
- Masaki, Y.; Hanasaki, N.; Takahashi, K.; Hijioka, Y. Global-scale analysis on future changes in flow regimes using Gini and Lorenz asymmetry coefficients. Water Resour. Res. 2014, 50, 4054–4078. [Google Scholar] [CrossRef]
- Rajah, K.; O’Leary, T.; Turner, A.; Petrakis, G.; Leonard, M.; Westra, S. Changes to the temporal distribution of daily precipitation. Geophys. Res. Lett. 2014, 41, 8887–8894. [Google Scholar] [CrossRef]
- Zhang, X.; Alexander, L.; Hegerl, G.C.; Jones, P.; Tank, A.K.; Peterson, T.C.; Trewin, B.; Zwiers, F.W. Indices for monitoring changes in extremes based on daily temperature and precipitation data. Wiley Interdiscip. Rev. Clim. Chang. 2011, 2, 851–870. [Google Scholar] [CrossRef]
- WMO. The Role of Climatological Normals in a Changing Climate; WCDMP-No. 61. WMO/TD-No. 1377; WMO: Geneva, Switzerland, 2007. [Google Scholar]
- WMO. Guidelines on the Calculation of Climate Normals; WMO-No. 1203; WMO: Geneva, Switzerland, 2017. [Google Scholar]
- WMO. Guide to Climatological Practices; WMO nº 100; World Meteorological Organization (WMO): Geneva. Switzerland, 2018. [Google Scholar]
- van Rooy, M.P. A Rainfall Anomaly Index independent of time and space. Notos 1965, 14, 43–48. [Google Scholar]
- Keyantash, J.; Dracup, J.A. The Quantification of Drought: An Evaluation of Drought Indices. Bull. Amer. Meteorol. Soc. 2002, 83, 1167–1180. [Google Scholar] [CrossRef]
- Hänsel, S.; Schucknecht, A.; Matschullat, J. The Modified Rainfall Anomaly Index (mRAI)—Is this an alternative to the Standardised Precipitation Index (SPI) in evaluating future extreme precipitation characteristics? Theor. Appl. Climatol. 2016, 123, 827–844. [Google Scholar] [CrossRef]
- Raziei, T. Revisiting the Rainfall Anomaly Index to serve as a Simplified Standardized Precipitation Index. J. Hydrol. 2021, 602, 126761. [Google Scholar] [CrossRef]
- Oladipo, E.O. A comparative performance analysis of three meteorological drought indices. J. Climatol. 1985, 5, 655–664. [Google Scholar] [CrossRef]
- Bhalme, H.N.; Mooley, D.A. Large scale droughts/floods and monsoon circulation. Mon. Weath. Rev. 1980, 108, 1197–1211. [Google Scholar] [CrossRef]
- Machiwal, D.; Jha, M.K. Hydrologic Time Series Analysis: Theory and Practice; Springer: Berlin/Heidelberg, Germany, 2012. [Google Scholar]
- Yue, S.; Pilon, P.; Phinney, B.; Cavadias, G. The influence of autocorrelation on the ability to detect trend in hydrological series. Hydrol. Process. 2002, 16, 1807–1829. [Google Scholar] [CrossRef]
- Yue, S.; Wang, C.Y. The Mann-Kendall test modified by effective sample size to detect trend in serially correlated hydrological series. Water Resour. Manag. 2004, 18, 201–218. [Google Scholar] [CrossRef]
- Zhang, Q.; Liu, C.; Xu, C.; Xu, Y.; Jiang, T. Observed trends of annual maximum water level and streamflow during past 130 years in the Yangtze River basin, China. J. Hydrol. 2006, 324, 255–265. [Google Scholar] [CrossRef]
- Basistha, A.; Arya, D.S.; Goel, N.K. Analysis of historical changes in rainfall in the Indian Himalayas. Int. J. Climatol. 2013, 29, 555–572. [Google Scholar] [CrossRef]
- Mann, H.B. Non-parametric test against trend. Econometrika 1945, 13, 245–259. [Google Scholar] [CrossRef]
- Kendall, M.G. Rank Correlation Methods; Charles Griffin: London, UK, 1975. [Google Scholar]
- Yue, S.; Pilon, P.; Cavadias, G. Power of Mann-Kendall and Spearman’s rho test for detecting monotonic trends in hydrological series. J. Hydrol. 2002, 299, 254–271. [Google Scholar] [CrossRef]
- Hao, X.; Chen, Y.; Xu, C.; Li, W. Impacts of climate change and human activities on the surface runoff in the Tarim River basin over the last fifty years. Water Resour. Manag. 2008, 22, 1159–1171. [Google Scholar] [CrossRef]
- Wang, S.; Zhang, X.; Liu, Z.; Wang, D. Trend Analysis of Precipitation in the Jinsha River Basin in China. J. Hydrometeorol. 2013, 14, 290–303. [Google Scholar] [CrossRef]
- Pingale, S.M.; Khare, D.; Jaty, M.-K.; Adamowski, J. Spatial and temporal trends of mean and extreme rainfall and temperature for the 33 urban centers of the arid and semi-arid state of Rajasthan, India. Atmos. Res. 2014, 138, 73–90. [Google Scholar] [CrossRef]
- Dhorde, A.G.; Korade, M.S.; Dhorde, A.A. Spatial distribution of temperature trends and extremes over Maharashtra and Karnataka States of India. Theor. Appl. Climatol. 2016, 130, 191–204. [Google Scholar] [CrossRef]
- Rahimi, M.; Hejabi, S. Spatial and temporal analysis of trends in extreme temperature indices in Iran over the period 1960–2014. Int. J. Climatol. 2018, 38, 272–282. [Google Scholar] [CrossRef]
- Ullah, S.; You, Q.; Ullah, W.; Ali, A.; Xie, W.; Xie, X. Observed changes in temperature extremes over China–Pakistan Economic Corridor during 1980–2016. Int. J. Climatol. 2019, 39, 1457–1475. [Google Scholar] [CrossRef]
- Yang, X.; Sun, W.; Mu, X.; Gao, P.; Zhao, G. Run-off affected by climate and anthropogenic changes in a large semi-arid river basin. Hydrol. Process. 2020, 34, 1906–1919. [Google Scholar] [CrossRef]
- Latif, Y.; Yaoming, M.; Yaseen, M.; Muhammad, S.; Wazir, M.A. Spatial analysis of temperature time series over the Upper Indus Basin (UIB) Pakistan. Theor. Appl. Climatol. 2020, 139, 741–758. [Google Scholar] [CrossRef] [Green Version]
- Yenigün, K.; Gümü, V.; Bulut, H. Trends in streamflow of the Euphrates basin, Turkey. Proc. Inst. Civil. Eng.-Water Manag. 2008, 161, 189–198. [Google Scholar] [CrossRef] [Green Version]
- Khaliq, M.N.; Ouarda, T.B.M.J.; Gachon, P.; Sushama, L.; St-Hilaire, A. Identification of hydrological trends in the presence of serial and cross correlations: A review of selected methods and their application to annual flow regimes of Canadian rivers. J. Hydrol. 2009, 368, 117–130. [Google Scholar] [CrossRef]
- Pettitt, A.N. A non-parametric approach to the change-point problem. Appl. Stat.-J. R. Stat. Soc. 1979, 28, 126–135. [Google Scholar] [CrossRef]
- Wijngaard, J.B.; Klein, A.M.G.; Konnen, G.P. Homogeneity of 20th Century European Daily Temperature and Precipitation Series. Int. J. Climat. 2003, 23, 679–692. [Google Scholar] [CrossRef]
- Li, D.; Xie, H.; Xiong, L. Temporal Change Analysis Based on Data Characteristics and Nonparametric Test. Water Resour. Manag. 2014, 28, 227–240. [Google Scholar] [CrossRef]
- Kruskal, W.; Wallis, V.A. Use of ranks in one-criterion variance analysis. J. Am. Stat. Assoc. 1952, 47, 583–621. [Google Scholar] [CrossRef]
- Tamm, O.; Saarem, E.; Rahkema, K.; Jaagus, J.; Tamm, T. The intensification of short-duration rainfall extremes due to climate change—Need for a frequent update of intensity–duration–frequency curves. Clim. Serv. 2023, 30, 100349. [Google Scholar] [CrossRef]
- Todaro, V.; D’Oria, M.; Secci, D.; Zanini, A.; Tanda, M.G. Climate Change over the Mediterranean Region: Local Temperature and Precipitation Variations at Five Pilot Sites. Water 2022, 14, 2499. [Google Scholar] [CrossRef]
- Kastridis, A.; Kamperidou, V.; Stathis, D. Dendroclimatological Analysis of Fir (A. borisii-regis) in Greece in the frame of Climate Change Investigation. Forest 2022, 13, 879. [Google Scholar] [CrossRef]
- Mersin, D.; Tayfur, G.; Vaheddoost, B.; Safari, M.J.S. Historical Trends Associated with Annual Temperature and Precipitation in Aegean Turkey, Where Are We Heading? Sustainability 2022, 14, 13380. [Google Scholar] [CrossRef]
- Oruc, S.; Yalcin, E. Extreme precipitation indices trend assessment over Thrace region, Turkey. Acta Geophys. 2021, 69, 307–321. [Google Scholar] [CrossRef]
- Bartels, R.J.; Black, A.W.; Keim, B.D. Trends in precipitation days in the United States. Int. J. Climatol. 2020, 40, 1038–1048. [Google Scholar] [CrossRef]
- Miró, J.J.; Estrela, M.J.; Caselles, V.; Gómez, I. Spatial and Temporal Rainfall Changes in the Júcar and Segura Basins (1955–2016): Fine-Scale Trends. Int. J. Climatol. 2018, 38, 4699–4722. [Google Scholar] [CrossRef]
- Serrano-Notivoli, R.; Beguería, S.; Saz, M.A.; de Luis, M. Recent trends reveal decreasing intensity of daily precipitation in Spain. Int. J. Climatol. 2018, 38, 4211–4224. [Google Scholar] [CrossRef]
- Cooley, A.; Chang, A.H. Precipitation Intensity Trend Detection using Hourly and Daily Observations in Portland, Oregon. Climate 2017, 5, 10. [Google Scholar] [CrossRef] [Green Version]
- Gajić-Čapka, M.; Cindrić, K.; Pasarić, Z. Trends in precipitation indices in Croatia, 1961–2010. Theor. Appl. Climatol. 2015, 121, 167–177. [Google Scholar] [CrossRef]
- Liuzzo, L.; Freni, G. Analysis of Extreme Rainfall Trends in Sicily for the Evaluation of Depth-Duration-Frequency Curves in Climate Change Scenarios. J. Hydrol. Eng. 2015, 20, 04015036. [Google Scholar] [CrossRef]
- Bartolini, G.; Messeri, A.; Grifoni, D.; Mannini, D.; Orlandini, S. Recent trends in seasonal and annual precipitation indices in Tuscany (Italy). Theor. Appl. Climatol. 2014, 118, 147–157. [Google Scholar] [CrossRef]
- van den Besselaar, E.J.M.; Klein Tank, A.M.G.; Buishand, T.A. Trends in European precipitation extremes over 1951–2010. Int. J. Climatol. 2013, 33, 2682–2689. [Google Scholar] [CrossRef]
- Arnone, E.; Pumo, D.; Viola, F.; Noto, L.V.; La Loggia, G. Rainfall statistics changes in Sicily. Hydrol. Earth Syst. Sci. 2013, 17, 2449–2458. [Google Scholar] [CrossRef] [Green Version]
- Todeschinia, S. Trends in long daily rainfall series of Lombardia (northern Italy) affecting urban stormwater control. Int. J. Climatol. 2012, 32, 900–919. [Google Scholar] [CrossRef]
- Martinez, C.J.; Maleski, J.J.; Miller, M.F. Trends in precipitation and temperature in Florida, USA. J. Hydrol. 2012, 452–453, 259–281. [Google Scholar] [CrossRef]
- Homar, V.; Ramis, C.; Romero, R.; Alonso, S. Recent trends in temperature and precipitation over the Balearic Islands (Spain). Clim. Chang. 2010, 98, 199–211. [Google Scholar] [CrossRef]
- de Lima, M.I.P.; Carvalho, S.C.P.; de Lima, J.L.M.P. Investigating annual and monthly trends in precipitation structure: An overview across Portugal. NHESS 2010, 10, 2429–2440. [Google Scholar] [CrossRef] [Green Version]
- Ruiz Sinoga, J.D.; Garcia Marin, R.; Martinez Murillo, J.F.; Gabarron Galeotea, M.A. Precipitation dynamics in southern Spain: Trends and cycles. Int. J. Climatol. 2010, 31, 2281–2289. [Google Scholar] [CrossRef]
- Bonaccorso, B.; Cancelliere, A.; Rossi, G. Detecting trends of extreme rainfall series in Sicily. ADGEO 2005, 2, 7–11. [Google Scholar] [CrossRef] [Green Version]
- Klein Tank, A.M.G.; Können, G.P. Trends in Indices of Daily Temperature and Precipitation Extremes in Europe, 1946–1999. J. Clim. 2003, 16, 3665–3680. [Google Scholar] [CrossRef]
- Adamowski, K.; Bougadis, J. Detection of trends in annual extreme rainfall. Hydrol. Process. 2003, 17, 3547–3560. [Google Scholar] [CrossRef]
- Rodrigo, F.S.; Trigo, R.M. Trends in Daily Rainfall in the Iberian Peninsula from 1951 to 2002. Int. J. Climatol. 2002, 27, 513–529. [Google Scholar] [CrossRef]
- Sen, Z. Innovative trend significance test and applications. Theor. Appl Climatol. 2017, 127, 939–947. [Google Scholar] [CrossRef]
- Dabahn, I.; Şen, Z.; Yeleğen, M.Ö.; Şişman, E.; Selek, B.; Güçlü, Y.S. Trend Assessment by the Innovative-Şen Method. Water Resour. Manag. 2016, 30, 5193–5203. [Google Scholar] [CrossRef]
- Öztopal, A.; Sen, Z. Innovative trend methodology applications to precipitation records in Turkey. Water Resour. Manag. 2017, 31, 727–737. [Google Scholar] [CrossRef]
- Alashan, S. Data Analysis in Nonstationary State. Water Resour. Manag. 2018, 32, 2277–2286. [Google Scholar] [CrossRef]
- IPCC. 2018. Global Warming of 1.5 °C. An IPCC Special Report on the Impacts of Global Warming of 1.5 °C Above Pre-Industrial Levels and Related Global Greenhouse Gas Emission Pathways, in the Context of Strengthening the Global Response to the Threat of Climate Change. 2016. Available online: https://www.ipcc.ch/site/assets/uploads/sites/2/2022/06/SR15_Chapter_1_HR.pdf (accessed on 15 March 2022).
Figure 1.
Location of the Igeldo weather station (Gipuzkoa).

Figure 2.
Conceptual map of the process followed for the analysis of trends of the different series considered.
Figure 2.
Conceptual map of the process followed for the analysis of trends of the different series considered.

Figure 3.
Representation of the different series of maximum annual precipitation intensities.

Figure 4.
Representation of the trends according to Mann–Kendall and the breaking points estimated with the Pettitt test for all the maximum precipitation intensities in the winter season. In the graphs for each duration, the Mann-Kendall trends (up) are plotted with the value of the Senn slope (β). The Pettit test plots (down) show the change point and the precipitation averages for each period.

Figure 5.
Representation of the series of the 12 climate change indices established by ETCCDI and described in Table 2.
Figure 5.
Representation of the series of the 12 climate change indices established by ETCCDI and described in Table 2.

Figure 6.
Representation of seasonal precipitation series with regression lines.

Figure 7.
Graphical representation of Wet-Day Frequency Index (WDF), Annual-Day Gini index (ADG), and Wet-Day Gini index series (WDG), with the equations of regression lines.
Figure 7.
Graphical representation of Wet-Day Frequency Index (WDF), Annual-Day Gini index (ADG), and Wet-Day Gini index series (WDG), with the equations of regression lines.

Figure 8.
Annual precipitation with the values of the average annual precipitation for each of the Climatological Normals.
Figure 8.
Annual precipitation with the values of the average annual precipitation for each of the Climatological Normals.

Figure 9.
Mean annual precipitation in the period 1931–2018 and mean annual mean values for each of the possible periods of Climatological Normals from 1931–1960 to 1991–2018.
Figure 9.
Mean annual precipitation in the period 1931–2018 and mean annual mean values for each of the possible periods of Climatological Normals from 1931–1960 to 1991–2018.

Figure 10.
Representation of the seasonal and annual values of the RAI with the equations of regression lines.
Figure 10.
Representation of the seasonal and annual values of the RAI with the equations of regression lines.


Table 1.
Parameters associated with maximum rainfall intensities.
| Index | Unit | Description |
|---|---|---|
| Pan10m; Psn10m; Pms10m | mm | annual, seasonal, and monthly maximum precipitation in 10 min |
| Pan30m; Psn20m; Pms20m | mm | annual, seasonal, and monthly maximum precipitation in 30 min |
| Pan1h; Psn1h; Pms1h | mm | annual, seasonal, and monthly maximum precipitation in 1 h |
| Pan2h; Psn2h; Pms2h | mm | annual, seasonal, and monthly maximum precipitation in 2 h |
| Pan4h; Psn4h; Pms4h | mm | annual, seasonal, and monthly maximum precipitation in 4 h |
| Pan6h; Psn6h; Pms6h | mm | annual, seasonal, and monthly maximum precipitation in 6 h |
| Pan12h; Psn12h; Pms12h | mm | annual, seasonal, and monthly maximum precipitation in 12 h |
| Pan24h; Psn24h; Pms24h | mm | annual, seasonal, and monthly maximum precipitation in 24 h |
Table 2.
Characteristic indices of the rainfall regime, recommended by ETCCDI.
| Index | Description | Unit | Definition |
|---|---|---|---|
| PRECPTOT | Annual precipitation amount | mm | Pan 1 in wet days 2 |
| R90p | Wet days precipitation | mm | Pan 1 when Pd 3 > 90th percentile |
| R95p | Very wet days precipitation | mm | Pan 1 when Pd 3 > 95th percentile |
| R99p | Extremely wet days precipitation | mm | Pan 1 when Pd 3 > 99th percentile |
| SDII | Simple daily intensity index | mm/day | mean precipitation on a wet day 2 (Pan/WD) |
| Rx1d | Maximum 1-day precipitation | mm | annual maximum 1-day rainfall |
| Rx5d | Maximum 5-day precipitation | mm | annual maximum consecutive 5-day rainfall |
| WD | Wet days 2 | days | number of days a year with Pd 3 ≥ 1 mm |
| CWD | Maximum number of consecutive wet days 2 | days | maximum number of consecutive wet days 2 |
| CDD | Maximum number of consecutive dry days 4 | days | maximum number of consecutive dry days 4 |
| R10 | Moderate precipitation days | days | number of days per year with Pd 3 ≥ 10 mm |
| R20 | Heavy precipitation days | days | number of days per year with Pd 3 ≥ 20 mm |
1 Pan: annual precipitation in wet days; 2 wet day: day with Pd ≥ 1 mm; 3 Pd: daily precipitation; 4 dry day: day with Pd ≤ 1 mm.
Table 3.
Values of the Mann–Kendall and Spearman statistics for all the maximum seasonal precipitation intensities.
Table 3.
Values of the Mann–Kendall and Spearman statistics for all the maximum seasonal precipitation intensities.
| Autumn | Winter | Spring | Summer | |||||||||
|---|---|---|---|---|---|---|---|---|---|---|---|---|
| MK | Sp | MK | Sp | MK | Sp | MK | Sp | |||||
| Z 1 | S.s. 2 | ts 3 | Z 1 | S.s. 2 | ts 3 | Z 1 | S.s. 2 | ts 3 | Z 1 | S.s. 2 | ts 3 | |
| Pmax 10 min | 0.400 | 0.04 | 0.435 | 2.743 | 0.12 | 2.854 | 1.359 | 0.16 | 1.369 | 1.521 | 0.20 | 1.486 |
| Pmax 20 min | 0.757 | −0.11 | −0.763 | 3.472 | 0.22 | 3.607 | 0.981 | 0.15 | 1.078 | 1.135 | 0.21 | 1.078 |
| Pmax 30 min | 1.037 | −0.20 | −0.991 | 3.365 | 0.27 | 3.514 | 0.818 | 0.14 | 0.843 | 1.298 | 0.30 | 1.353 |
| Pmax 1 h | 1.414 | −0.38 | −1.330 | 3.640 | 0.42 | 3.865 | 0.162 | 0.04 | 0.231 | 0.656 | 0.20 | 0.635 |
| Pmax 2 h | 1.141 | −0.37 | −1.119 | 3.591 | 0.53 | 3.662 | 0.339 | 0.11 | 0.362 | 0.800 | 0.31 | 0.838 |
| Pmax 4 h | 1.025 | −0.50 | −1.076 | 3.148 | 0.55 | 3.295 | 0.040 | −0.02 | −0.074 | 1.096 | 0.64 | 1.091 |
| Pmax 6 h | 0.364 | −0.20 | −0.468 | 2.800 | 0.66 | 2.936 | 0.014 | 0.00 | −0.056 | 0.951 | 0.57 | 0.969 |
| Pmax 12 h | 0.108 | 0.12 | 0.023 | 3.601 | 1.37 | 3.664 | 0.123 | −0.04 | −0.142 | 0.519 | 0.44 | 0.568 |
| Pmax 24 h | 1.317 | 1.23 | 1.331 | 3.278 | 1.84 | 3.477 | 0.656 | 0.56 | 0.613 | 0.184 | 0.15 | 0.247 |
1 Mann–Kendall (MK) statistic, Z; 2 Sen’s slope, S.s., (mm/decade); Zcr = 1.9604 for significance level α = 0.05; 3 Spearman (Sp) statistic, ts; −1.9876 < ts < 1.9876; tv,α/2 < ts < tv, 1 − α/2 (v= N − 2 degrees of freedom and α = 0.05).
Table 4.
References on precipitation trends over the last 20 years in the Mediterranean, Europe, and North America.
Table 4.
References on precipitation trends over the last 20 years in the Mediterranean, Europe, and North America.
| References | Number of Years | Record. Int. (*) | Study Region | |
|---|---|---|---|---|
| [67] Tamm et al. (2023) | 70 but fractioned | 20 min. | Estonia | |
| [68] Todaro et al. (2022) | 1976–2005 | 30 | daily | Mediterranean |
| [69] Kastridis et al. (2022) | 1961–2020 | 60 | daily | Central Greece |
| [70] Mersin et al. (2022) | 1973–2020 | 48 | annual | Turkey |
| [71] Oruc and Yalcin (2021) | 1950–2008 | 59 | hourly | Turkey |
| [72] Bartels et al.2020 | 1951–2015 | 65 | daily | United States |
| [73] Miró et al. (2018) | 1955–2016 | 62 | daily | Spain (east) |
| [74] Serrano-Notivoli et al. (2018) | 1950–2012 | 63 | daily | Spain |
| [75] Cooley and Chang (2017) | From 10 to 16 | hourly | U.S. (Oregon) | |
| [76] Gajić-Čapka et al. (2015) | 1961–2010 | 50 | daily | Croatia |
| [77] Liuzzo and Freni (2015) | 1950–2008 | 59 | hourly | Italy (Sicily) |
| [78] Bartolini et al. (2014) | 1955–2007 | 53 | daily | Italy (Tuscany) |
| [79] van den Besselaar et al. (2013) | 1951–2010 | 60 | daily | Europe |
| [80] Arnone et al. (2013) | From 9 to 63 | hourly | Italy (Sicily) | |
| [81] Todeschinia (2012) | From 93 to 166 | daily | Italy (Lombardia) | |
| [82] Martinez et al. (2012) | 1895–2009 | 115 | monthly | U.S. (Florida) |
| [83] Homar et al. (2010) | 1951–2006 | 56 | daily | Spain (Balearic Is.) |
| [84] de Lima et al. 2010 | From 88 to 145 | monthly | Portugal | |
| [85] Ruiz et al. (2010) | 1960–2006 | 46 | daily | Spain (Andalusia) |
| [86] Bonaccorso et al. (2005) | at least 50 years | hourly | Italy (Sicily) | |
| [87] Klein Tank et al. (2003) | 1946–1999 | 54 | daily | Europe |
| [88] Adamowski and Bougadis (2003) | at least 20 years | 5 min. | Canada (Ontario) | |
| [89] Rodrigo and Trigo (2002) | 1951–2002 | 52 | daily | Iberian Peninsula |
(*) minimum precipitation interval analysed.
Disclaimer/Publisher’s Note: The statements, opinions and data contained in all publications are solely those of the individual author(s) and contributor(s) and not of MDPI and/or the editor(s). MDPI and/or the editor(s) disclaim responsibility for any injury to people or property resulting from any ideas, methods, instructions or products referred to in the content. |
© 2023 by the authors. Licensee MDPI, Basel, Switzerland. This article is an open access article distributed under the terms and conditions of the Creative Commons Attribution (CC BY) license (https://creativecommons.org/licenses/by/4.0/).
Share and Cite
MDPI and ACS Style
López, J.J.; Ayuso-Muñoz, J.L.; Goñi, M.; Gimena, F.N. Analysis of the Effect of Climate Change on the Characteristics of Rainfall in Igeldo-Gipuzkoa (Spain). Water 2023, 15, 1529. https://doi.org/10.3390/w15081529
AMA Style
López JJ, Ayuso-Muñoz JL, Goñi M, Gimena FN. Analysis of the Effect of Climate Change on the Characteristics of Rainfall in Igeldo-Gipuzkoa (Spain). Water. 2023; 15(8):1529. https://doi.org/10.3390/w15081529
Chicago/Turabian StyleLópez, José Javier, José Luis Ayuso-Muñoz, Mikel Goñi, and Faustino N. Gimena. 2023. "Analysis of the Effect of Climate Change on the Characteristics of Rainfall in Igeldo-Gipuzkoa (Spain)" Water 15, no. 8: 1529. https://doi.org/10.3390/w15081529
Note that from the first issue of 2016, this journal uses article numbers instead of page numbers. See further details here.