
Adsorptive Performance of Walnut Shells Modified with Urea and Surfactant for Cationic Dye Removal
1
Centre de Recherche Royallieu—CS 60 319, Université de Technologie de Compiègne, ESCOM, TIMR (Integrated Transformations of Renewable Matter), 60203 Compiegne, France
2
Igor Sikorsky Kyiv Polytechnic Institute, Peremogy Ave. 37/4, 03056 Kyiv, Ukraine
3
Chuiko Institute of Surface Chemistry, National Academy of Sciences of Ukraine, General Naumov Street, 17, 03164 Kyiv, Ukraine
*
Author to whom correspondence should be addressed.
Water 2023, 15(8), 1536; https://doi.org/10.3390/w15081536
Submission received: 18 March 2023
/
Revised: 5 April 2023
/
Accepted: 12 April 2023
/
Published: 14 April 2023
(This article belongs to the Special Issue Advanced Technologies for Wastewater Treatment and Water Reuse)
Abstract
:Adsorption of cationic dye crystal violet (CV) onto a modified walnut shell (WS) adsorbent was investigated. Combined treatment of WS using urea and sodium dodecylsulfate (SDS) was carried out. Surface modification of adsorbents was confirmed by FTIR analysis, pHpzc measurements, and elemental and SEM-EDX analysis. In order to optimize the adsorption conditions, the effect of solution pH, adsorbent dose and CV concentration was studied by means of central composite face-centered design (CCFD). The highest correlation between experimental and model data was obtained for the pseudo-second-order (PSO) kinetic model, assuming an ion exchange mechanism of adsorption. A satisfactory fit of CV adsorption data was obtained from the Langmuir adsorption isotherm, supporting a single layer adsorption. According to obtained results, modified WS can be considered as a low-cost, efficient and environmentally compatible biosorbent for the removal of cationic pollutants from aqueous solutions.

1. Introduction
Synthetic dyes are used in order to color the products of different chemical industries, including textiles, leather, paper, paint, cosmetics and plastics. Each year, more than eight thousand tons of dye is consumed by these industries [1]. A considerable amount of polluted wastewater is formed, which creates a serious problem of environmental contamination and has an important influence on human health. This has focused the attention of researchers on how to dispose of wastewater polluted with dyes.
Adsorption is reputed to be an efficient, simple, low-cost, versatile and economically sustainable method which gives satisfying results and has high selectivity [2,3]. Most investigations in this area have been focused on activated carbon, and have shown promising outcomes. The main disadvantages of this material are its high cost and difficulties in regeneration [4]. Thus, the potential of other alternative low-cost, efficient and environmentally safe biosorbents is increasingly becoming an important concern. The ability of various solid agricultural wastes to remove dyes from aqueous solutions has been studied, particularly lignocellulosic materials, such as wheat and rice straw, corn stover, rice husk, sugarcane bagasse, fry kernels and walnut shells. It is important that the process of conversion of plant biomass into a high-value biosorbent should have low energy consumption, and minimal cost and waste generation.
Juglans regia L. or walnut is a valuable tree nut in the family Juglandaceae produced worldwide in the amount of 3.3 million tons per year. In Europe, the largest producers of walnuts are Turkey, Ukraine, Romania and France [5]. Ukraine is an important exporter of walnuts with an export quantity of about 100 ktonnes/year to the European Union and the Middle East. The majority of Ukrainian walnuts are exported shelled, and a large amount of walnut shells are available in walnut kernel production centers. The shell represents 40% of the weight of the fruit and is an abundant and inexpensive agricultural by-product. Only a small percentage of walnut shells are used as fuel, and the rest is waste. Any possible use of this biomass will have a positive impact from the economic, ecological and social points of view. Therefore, the use of WS as an adsorbent for water purification is a very interesting possibility to valorize this low-cost and easily available product. A recent review by Albatrni et al. [6] highlights the performance of WS-based adsorbents for the removal of organic compounds and heavy metal ions from wastewater.
Raw walnut shells mostly consist of cellulose, hemicelluloses and lignin. The functional groups of lignocellulosic biomass that could be potentially involved in the binding of pollutants during the sorption process are hydroxyl (–OH), carbonyl (–C=O) and carboxyl (–COOH) polar groups [7]. Natural WS adsorbents do not exhibit their full potential, showing slow adsorption kinetics and efficiency. An effective way to use this lignocellulosic adsorbent is to increase its binding potential by using chemical modification with alkali and acid treatment, or by the introduction of polar –NH2, –COOH and –OH groups via chemical modification [8]. Alkali and acid methods are characterized by certain disadvantages such as high operational costs and the generation of a huge quantity of liquid wastes which must be regenerated or disposed of [9]. A proper, eco-friendly and efficient alternative method is required to overcome this waste problem.
In this direction, the use of urea for the pretreatment of lignocellulosic biomass appears to be an interesting method for enhancing adsorption efficiency. Urea is known as a non-toxic low-cost industrial product which is widely used as fertilizer. Modification of biosorbents with urea is an environmentally friendly approach, allowing an increase in nitrogen content in the form of amino (–NH2) and amide (–CONH2) groups [10]. The treatment can be realized under microwave radiation without any use of solvent [11], and is followed by washing with hot water in order to remove residual urea. A certain amount of urea-rich aqueous solution is thus produced. However, in contrast to alkali and acid wastewater, urea solutions can be efficiently used and offer several environmental benefits, for example as a clean energy source or as an AdBlue additive for vehicles [12,13].
Urea treatment of lignocellulosic biomass leads to the destruction of the complex three-dimensional polysaccharide structures, an increase in biosorbent surface area, and improved adsorption properties [14]. Few research publications exist on the urea treatment of walnut shells. These studies show that combined urea–acid modification of raw walnut shells is efficient for synthetic dye sorption [15], and carbonized walnut shells N-doped by urea show a very promising results for CO2 [16,17,18], naphthalene [19] and perchloroethylene [20] adsorption.
The amount and charge of functional groups present on the adsorbent surface plays an important role in the surface interaction to enhance the adsorption capacity [21]. In order to increase the number of active sites on lignocellulosic adsorbents with a well-developed surface structure, the surfactant treatment can be applied. Several studies describe the high efficiency of surfactant-treated lignocellulosic biosorbents, including coconut coir [22], barley straw [23], barley husk [24], fallen leaves of almond [25], saw-sedge of Cladium mariscus [21], sawdust [26], cork [27] and peanut shell [28]. However, to our knowledge, no data on the surfactant modification of walnut shells in their native or urea-pretreated state for the application as biosorbents have been identified in the literature. This research is novel in that it studies the efficiency of a combined urea/surfactant treatment on the adsorption properties of walnut shells.
The objective of the present work was to evaluate the effect of urea and/or anionic surfactant modification on the adsorption capacity of walnut shells originating from Ukraine. A model synthetic dye, crystal violet, was used for the adsorption experiments. The obtained biosorbents were characterized using Fourier transform infrared (FT-IR) analysis, pHpzc measurement and elemental and SEM-EDX analysis. The influence of several operating parameters, such as solution pH, biosorbent dosage and dye concentration, were investigated to determine the optimum conditions for the adsorption process. A kinetic study was also carried out and the experimental data were fitted to existing models in order to better understand the adsorption process.
2. Materials and Methods
2.1. Materials
The walnut shells were collected from a local Ukrainian market as a low-cost lignocellulosic waste. Urea (purity of 99.9%, MW: 60.06 g·mol−1) and crystal violet (CV, high-purity biological stain, MW: 407.986 g·mol−1) were purchased from Thermo Fisher Scientific (Villebon-sur-Yvette, France) and used as received. Sodium dodecyl sulfate (SDS, purity of 99%, MW: 288.38 g·mol−1) was supplied by Sigma-Aldrich (Saint·-Quentin Fallavier, France). The SDS critical micellar concentration (CMC) of 8 mM was previously determined by the Wilhelmy plate method [29]. All others chemicals were of analytical grade.
2.2. Preparation of Biosorbents
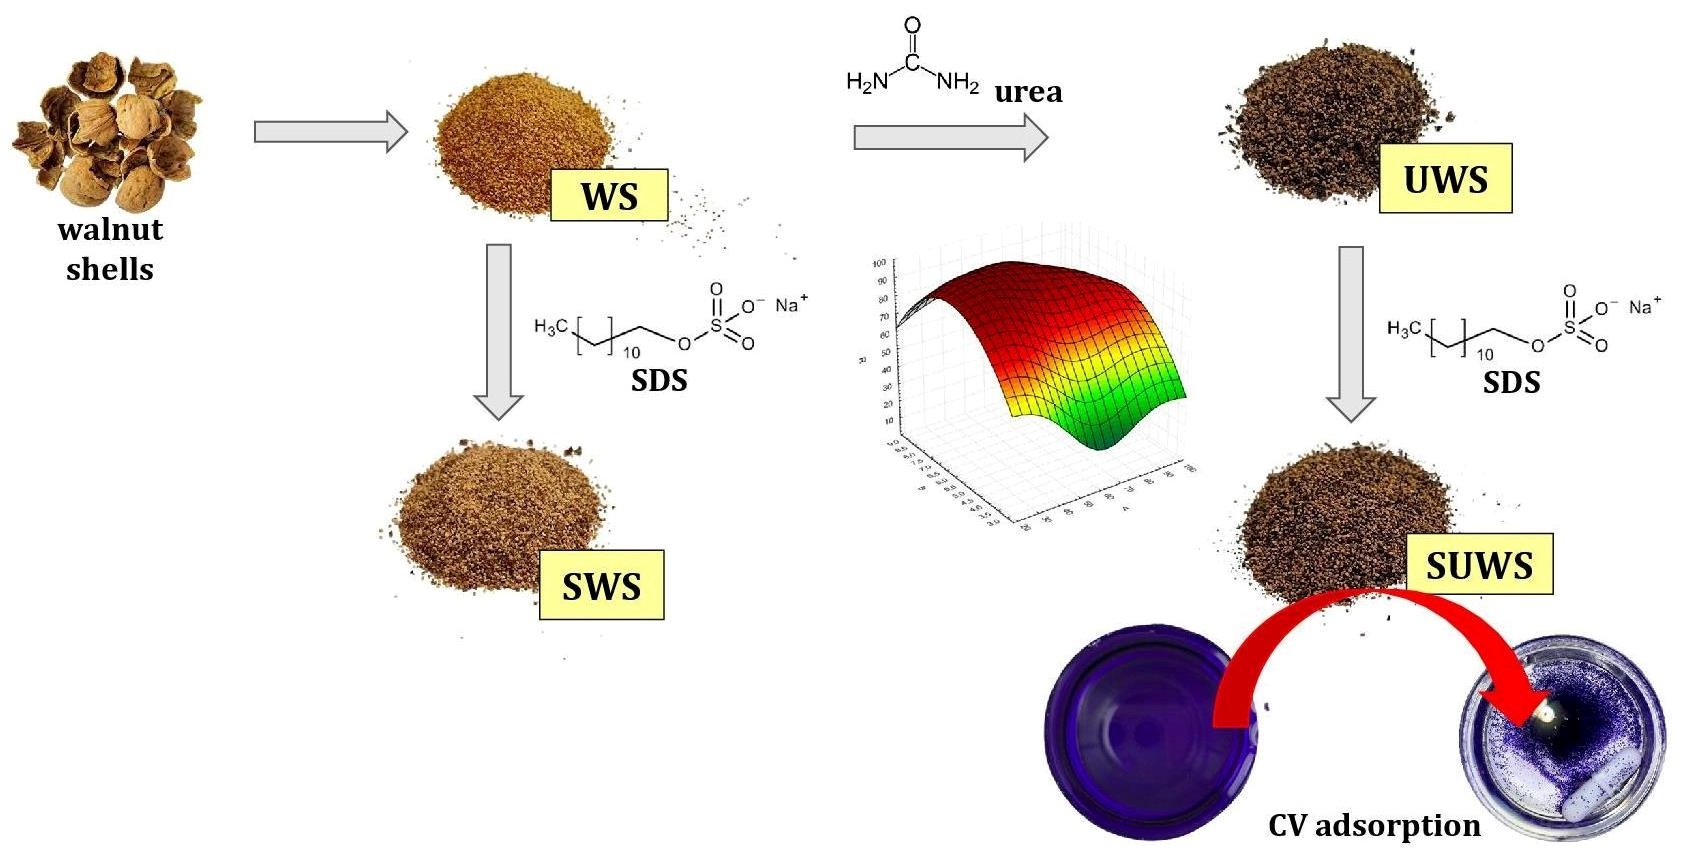
The walnut shells were firstly ground in a high-speed solid crusher (Hukoer, Shenzhen, China) with a rotational speed of 28,000 rpm and motor power of 850 W. The produced powder was sieved with a Retsch AS200 vibratory sieve shaker to obtain particle sizes between 160 and 400 μm. In order to remove the dust particles, walnut shell powder was soaked in deionized water for 24 h and thoroughly washed on a sieve of mesh size 50 μm. Wet walnut shell powder was stored overnight at room temperature and then dried in an oven at 105 °C to constant mass. This adsorbent sample was called WS.
In the first step of adsorbent modification, a simple and environmentally friendly method using urea compound was applied to burst the three-dimensional structure of the cellulose. Urea treatment of WS was realized according to a previously described method [14]. Dry WS and urea powder were blended in a heat-resistant glass bottle with a weight ratio of 1:2 to ensure homogeneous particle distribution. The mixture was irradiated for 8 min using a microwave laboratory system (230 V–50 Hz, NEOS-GR, Milestone, Italy) operating at a frequency of 2450 MHz and power of 400 W with the temperature controlled. After irradiation, the mixture was boiled in deionized water for 30 min and filtered while hot using a micro-mesh 50 μm sieve. The residues and excess urea were removed by washing in hot water (60 °C). The powder was dried at 80–90 °C in the oven until constant mass. The urea-treated adsorbent was named UWS.
In the second step, an anionic surfactant SDS was used for adsorbent modification in order to increase the number of negatively charged active sites on the surface [28]. WS and UWS samples were treated with SDS following the procedure described in the literature [28]. SDS solution in deionized water at a concentration of 8 mM was used for the treatment. This specific concentration corresponding to CMC of SDS was selected in order to maximize the amount of surfactant adsorbed onto the surface of WS and UWS, because of micelle formation above the CMC [30]. The mixture of adsorbent powder and SDS solution at a ratio 1:50 w/v was stirred at 240 rpm on the magnetic table for 24 h at room temperature (25 °C). After treatment, the mixture was filtered and washed two times with distilled water to eliminate possible unbound surfactant. Finally, the SDS-modified samples were dried overnight in the oven at 90 ± 5 °C and named SWS and SUWS for walnut shells and urea-treated walnut shells, respectively.
All solid samples were stored in plastic containers at room temperature for future experiments.
2.3. Characterization of Biosorbents
The elemental analysis of raw and modified walnut biosorbents was performed with a FLASH 2000 CHNS/O Analyzer from Thermo Scientific (Waltham, MA, USA). A point of zero charge (pHpzc) was determined using the pH drift method described by Lopez-Ramon et al. [31] as follows: 50 mL of 0.01 M NaCl solution was placed in a closed glass bottle. The solution pH was adjusted within a range of 2.5–10.0 with 0.1 M NaOH or 0.1 M HCl using a pH probe (SevenCompact S210-Basic, Mettler-Toledo, Shanghai, China). Then, 0.1 g of biosorbent was added to the solution, and the final pH value was measured after 48 h of stirring at room temperature. The average value of three measurements was considered.
Infrared spectra were recorded with a Nicolet iS5 FTIR spectrometer (Thermo Scientific, Waltham, MA, USA) equipped with iD1 Transmission tool. A 2 mg biosorbent sample was mixed with 120 mg of spectroscopic grade KBr then pressed in a standard device to produce pellets with a 13 mm diameter. A background was recorded in ambient conditions with pure KBr pellets. All samples were scanned 16 times in the wavenumber range from 400 to 4000 cm−1 with a resolution of 4 cm−1.
The surface structure of samples was examined using scanning electron microscopy (SEM) using a Quanta FEG 250 (FEI, Hillsboro, OR, USA) equipped with an energy-dispersive spectrometer for X-ray microanalysis (EDX, Bruker Nano GmbH Berlin, Berlin, Germany). SEM micrographs were acquired from the platinum-coated biosorbents (Denton Vacuum Desk V, Moorestown, NJ, USA) in secondary electron mode at low vacuum and 20 kV accelerating voltage. The surface elemental compositions were determined from the EDX analysis.
2.4. Adsorption Experiments
2.4.1. Optimization of Adsorption Conditions
A cationic compound crystal violet (CV) was used as a model dye for adsorption experiments. A stock solution of CV at 100 mg·L−1 was prepared and used to obtain the required concentration range by the dilutions in deionized water. The pH value of the suspensions was adjusted to suitable values for adsorption experiments by using 0.1 M HCl or 0.1 M NaOH solutions.
Firstly, the optimization of CV removal was carried out for each of the four adsorbent agents, WS, UWS, SWS and SUWS, by three chosen independent process variables: CV concentration, pH and biosorbent dose. According to the central composite face-centered design (CCFD) [32,33,34], six replicates at the center point and six star point experiments were performed. Each factor was set to five levels: high and low level of axial points, high and low level of factorial points, and the center point, as presented in Table 1. The zero value of the categorical factor was added, which means that the CCFD was not repeated for every combination of the categorical factor levels. In total, twenty experiments were conducted in duplicate for each biosorbent as summarized in Table 2.
The adsorption experiments of CV from aqueous solution onto biosorbent samples were performed in 100 mL closed glass bottles with a working volume of 20 mL. A predetermined amount of the biosorbent was added to CV solution of known concentration and pH. The mixture was agitated on a magnetic table at room temperature at a 150 rpm stirring rate for 60 min of contact time. At the end of experiment, the suspension was decanted for 5 min and the residual CV concentration was determined spectrophotometrically at a wavelength of 590 nm using a UV/VIS spectrometer Lambda 12 (PerkinElmer, Waltham, MA, USA).
The response of the design experiments was called removal efficiency (R) and calculated as the percentage adsorption of CV:
where is the initial concentration of CV solution (mg·L−1) and is the residual concentration of CV solution after adsorption (mg·L−1).
2.4.2. Adsorption Kinetics and Isotherm Models
The kinetic studies in batch mode were carried out in a 600 mL glass vessel with a working volume of 300 mL. Different parameters were fixed based on the results of the optimization experiments, namely CV concentration of 60 mg·L−1, biosorbent dose of 5.0 g·L−1, initial pH of solution of 6.5 for UWS and SUWS biosorbents, and 7.5 for WS and SWS biosorbents. The mixture was stirred on a magnetic table at a constant speed of 150 rpm, and the contact times were 5, 10, 15, 20, 25, 30, 40, 50, 60, 75, 90, 105, 120, 150 and 180 min. Aliquots were sampled from the glass at predetermined time intervals in a such way that the material balance of solid phase–liquid was not affected. Using the same experimental conditions of pH, temperature, adsorbent dose and agitation rate, the equilibrium adsorption isotherms were also obtained. Each adsorbent was mixed with 20 mL of CV solution at initial concentrations in the range from 10 to 100 mg·g−1 until equilibrium was achieved. As for optimization experiments, the residual dye concentration was analyzed using UV/VIS spectrophotometry at 590 nm.
The amount of adsorbed dye concentration at any given time, , was calculated according to mass balance as:
where is the initial concentration of dye (mg·L−1), corresponds to the residual concentration of dye in the aqueous phase at any given time (mg·L−1), is the mass of biosorbent (g) and is the volume of used solution (L). All experiments were performed in triplicate. Experimental data are reported as the average values of at least three measurements.
3. Results and Discussion
3.1. Biosorbent Characterizations
3.1.1. FTIR Analysis
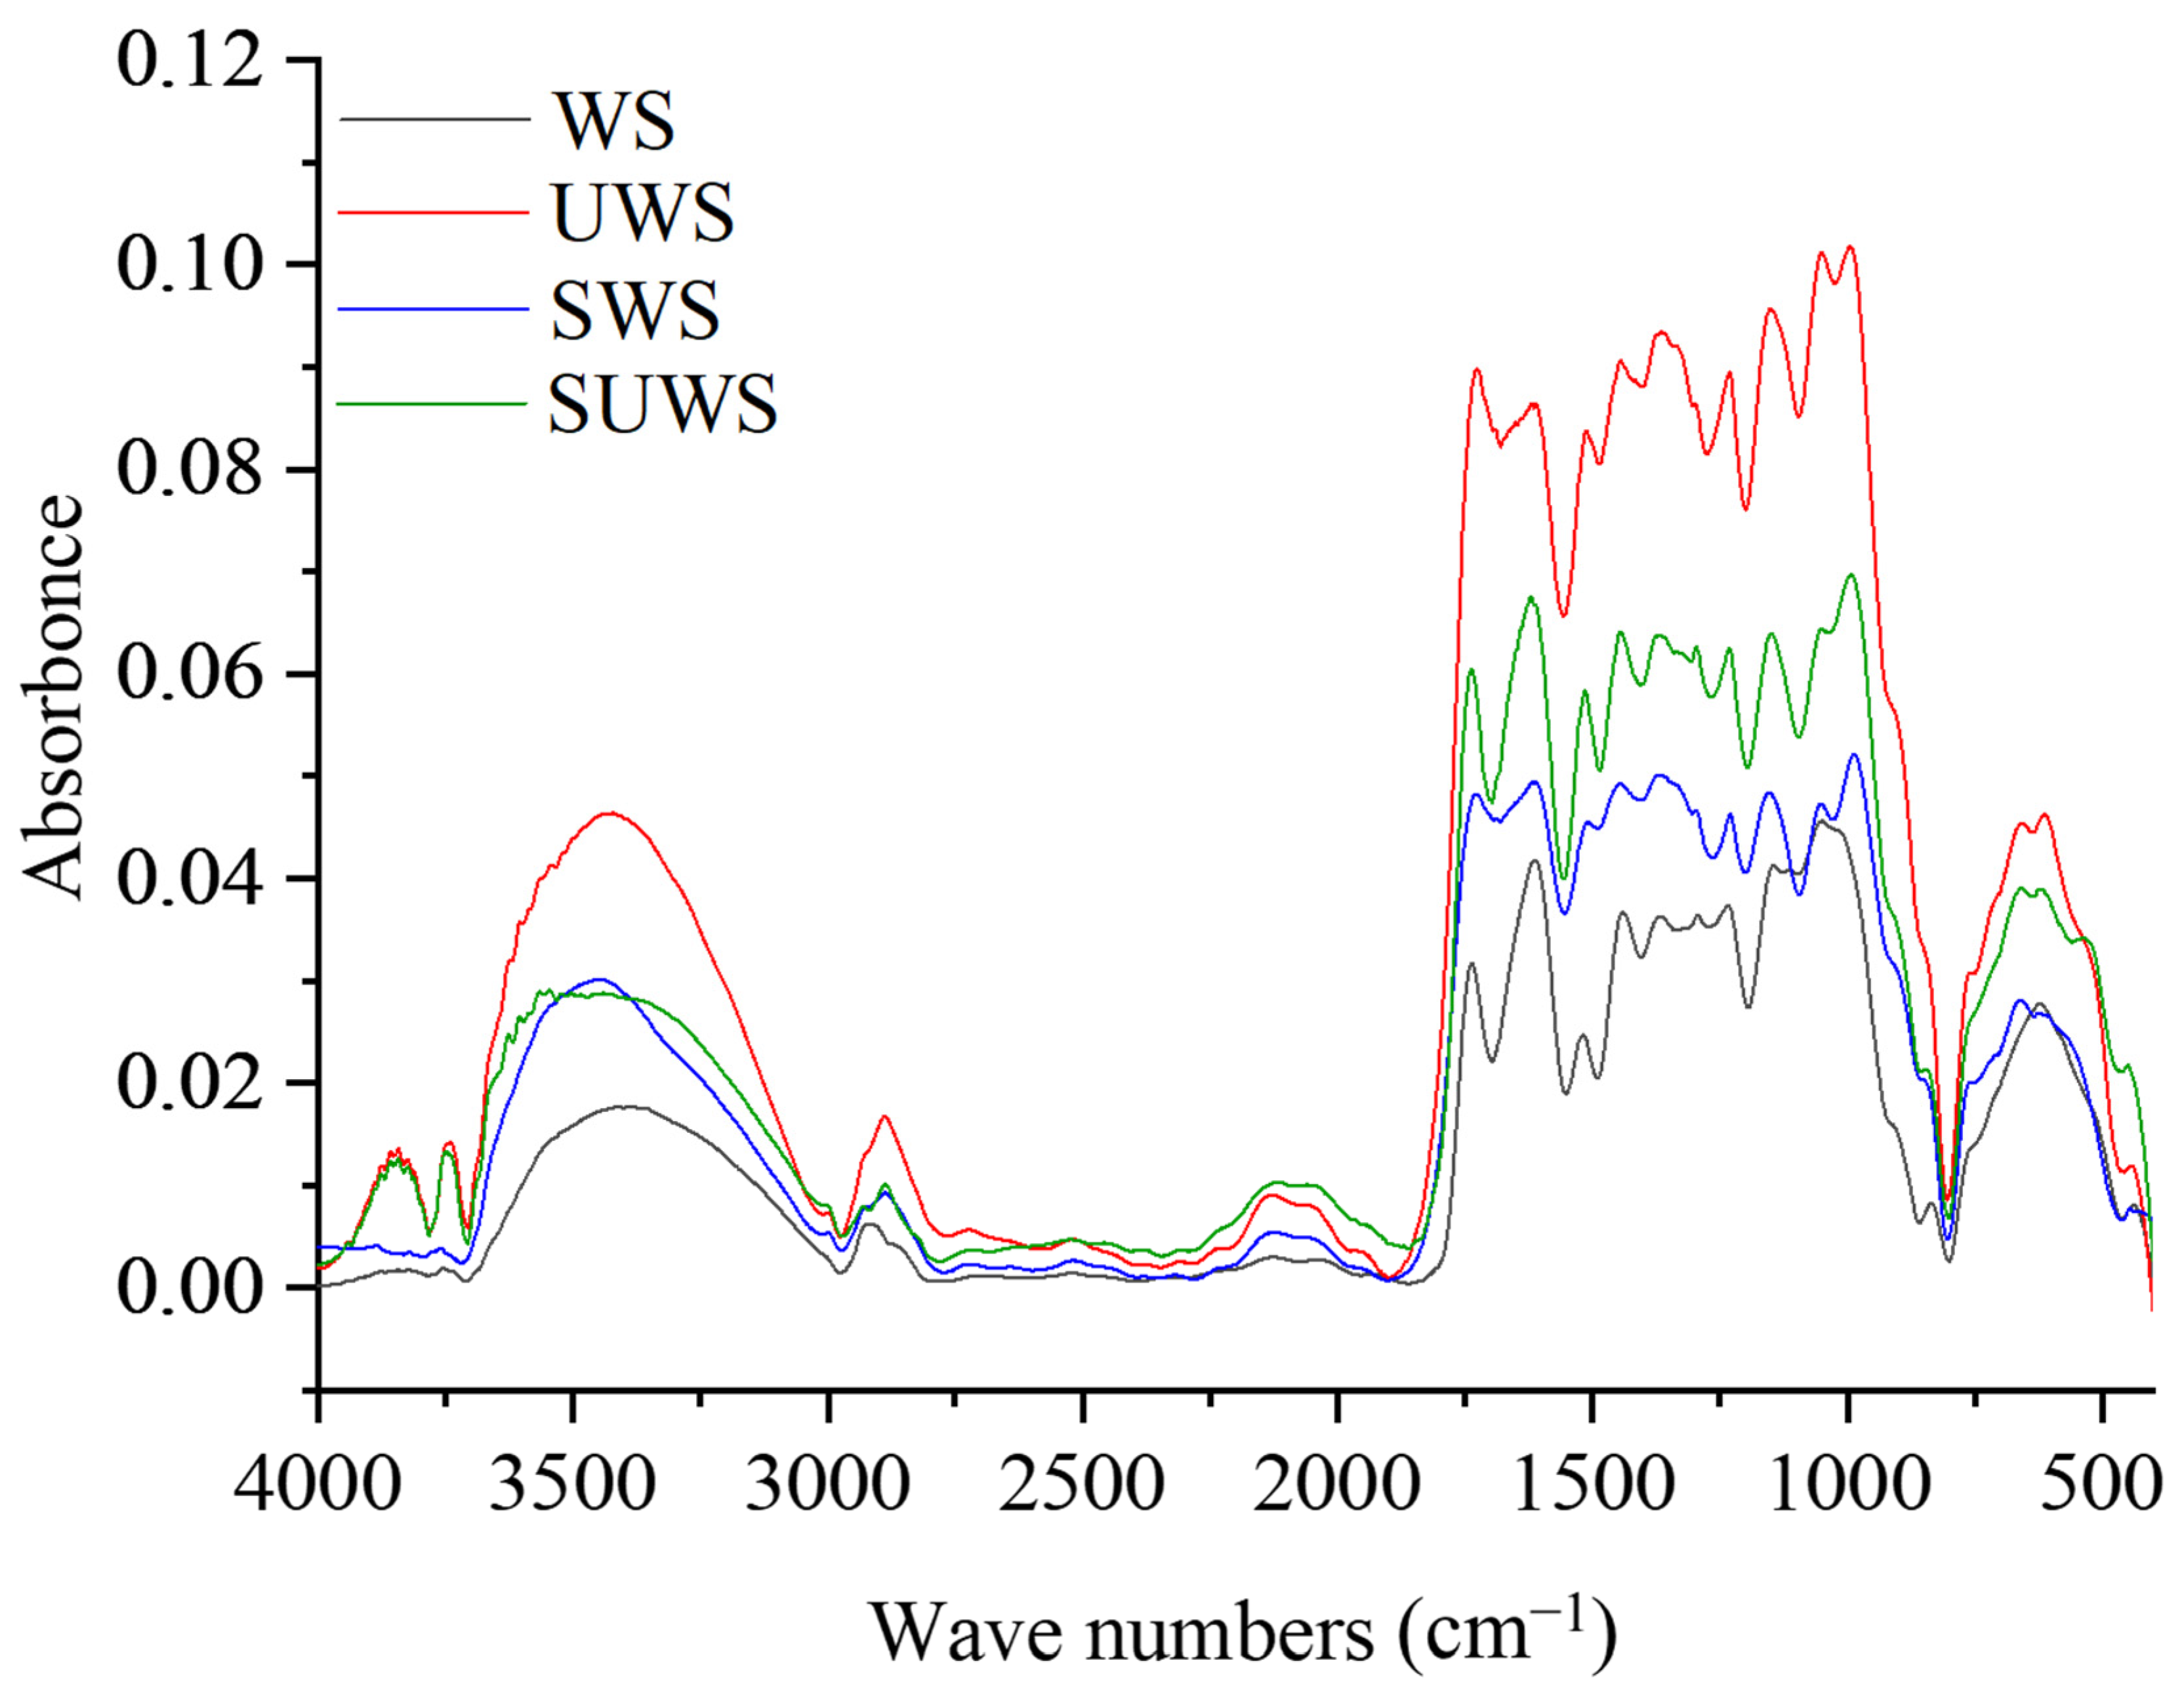
In this study, Fourier transform infrared (FTIR) spectroscopy was used to examine the structure and chemical changes induced by both urea pretreatment and SDS modification of lignocellulosic biomass. As one form of vibrational spectroscopy, FTIR is commonly used to determine chemical fingerprints of solid, liquid, and gaseous samples. In order to characterize the functional groups of WS, UWS, SWS and SUWS as potential adsorption sites, FTIR analysis was performed on these samples between 4000–400 cm−1. FTIR spectra for studied biosorbent samples are illustrated in Figure 1.
According to the obtained results, all samples show typical lignocellulosic biomass signals. A considerable broad O-H stretch absorption was observed around 3408.6, 3428.3, 3449.0 and 3439.8 cm−1, and a prominent C-H stretch absorption was observed around 2917.6, 2886.5, 2885.6 and 2886.5 cm−1 for WS, UWS, SWS and SUWS samples, respectively. This corroborates previous literature results on walnut shells [35]. These signals were not significantly affected by biosorbent modifications because of the presence of carbohydrates in cellulose. Several well-defined absorption bands can be found in the fingerprint region between 800 and 1800 cm−1, providing information on cellulose, hemicelluloses and lignin functional groups. For example, in WS spectra, the non-conjugated C=O stretch from hemicelluloses appeared at 1736.58 cm−1, while the aromatic skeletal vibration in lignin appeared at 1518.19 cm−1. The bands around 1441.0, 1366.3, 1294.0 and 1233.7 cm−1 can be attributed to the presence of lignin, whereas those around 1145.3 and 1050.0 cm−1 mainly originated from cellulose and hemicellulose (xylan, mannan) [36]. At 835.7 cm−1, wagging vibrations are associated with 1,4-disubstitution (para) C–H bonds in aromatic ring bends [37].
It can be noticed that UWS exhibited more intensive frequencies in the region of 800–1800 cm−1, which suggests that the complex three-dimensional polysaccharide lignin structures were partially broken down by the urea pretreatment. The characteristic band at 835.7 cm−1 is missing, indicating that the corresponding C–H bonds have been broken. Other bands at 657.1 and 611.8 cm−1 indicated an O=C–N bend of aliphatic secondary amides [38]. The bands between 3800 and 3700 cm−1 observed for UWS and SUWS samples can be attributed to the increased amount of free hydroxyl groups compared to WS spectra [39,40]. After urea treatment, the three-dimensional polysaccharide structure of walnut shell is partially destroyed, which leads to the liberation of –OH groups on the biosorbent surface.
In the case of SDS-modified samples, SWS and SUWS, it is apparent that there were some changes in the absorption band frequencies in the region 800–1800 cm−1, and the broad band of the hydroxyl group at around 3439.8 cm−1 was decreased by SDS. Similarly, the absorption band frequency at 2886.5 cm−1 associated with alkanes was also reduced. It is well known that electrostatic interactions cannot shift the absorption bands of functional groups present on biosorbent surfaces. Therefore, these shifts indicated complexation between ionized functional groups and the SO4− and Na+ ions of SDS [37]. The FTIR spectra of SWS and SUWS showed the inexpressive absorption band at around 2200 cm−1 characteristic for the cyanate group [41]. At the same time, the comparison of spectra yields did not reveal the presence of sulfonate functional groups around 1129 cm−1, which is possibly due to the low amount of adsorbed SDS. Similar observations have been reported for other surfactant-modified biosorbents [42].
3.1.2. Determination of Zero-Point Charge
The capacity of a biosorbent to capture dye molecules depends on its surface charge, chemical composition and existing reactive sites. pH is one of the most important factors influencing adsorption efficiency. The pH drift method allows us to estimate the acid–base properties of biosorbents. The combined influence of all the functional groups of a biosorbent determines pHpzc as the pH at which the net charge of the total surface of a biosorbent is equal to zero. At this point, the cation and anion exchange capacities are equal. When the pH falls below pHpzc, the surface charge of the biosorbent is predominantly positive, making it able to adsorb anions. On the other hand, if the pH is above the pHpzc value, the surface charge would be predominantly negative, allowing the cations to be absorbed [43].
The pH drift data are summarized in Table 3, and the correspondent curves for pHpzc determination were plotted in Figure 2. The pHpzc refers to the point at which the curve pHfinal versus pHinitial crosses the line pHinitial = pHfinal. The results show that the pHpzc of the WS was 4.7 and increased after pretreatment with urea to 5.9 for the UWS. This increased amount of negatively charged functional groups can be related to the increased surface area and loose complex polysaccharide structure after urea treatment [44], and consequently the higher amount of accessible –COOH groups.
When the pH of the medium is lower than pHpzc, it is expected that the biosorbent surface will be predominantly positively charged. As a result, less CV dye can be adsorbed as electrostatic repulsion will increase between the positively charged adsorbent and the cationic dye. Furthermore, at low pH, there is also competition for the adsorption sites between -H+ groups, which are present in a large amount, and the cationic dye. The SDS modification yielded SWS and SUWS with similar, albeit lower, pHpzc values of 4.4 and 5.6, respectively. Our results show similar trends as those in the study of Lim et al. [45], in which native Artocarpus odoratissimus skin had a pH of 4.9, however, after alkaline treatment the pH increased to 6.6 while the SDS treatment decreased it to 4.7.
According to the obtained pHpzc values for biosorbents, the estimated pH range for maximum CV removal is between 6 and 8, since the surface of biosorbents is negatively charged and dyes are positively charged (pKa of CV 8.5–8.6). Furthermore, the adsorption processes for WS, SWS, UWS and SUWS are expected to be similar since these samples have similar charge environments. Due to these charge environments, it can be assumed that at pH of 6.5 (pH of adsorption experiments) the adsorption of CV by WS, SWS and UWS, SUWS biosorbent can be favored.
3.1.3. Elemental Analysis and SEM-EDX Analysis
Elemental analysis was performed to analyze the composition of carbon (C), hydrogen (H), nitrogen (N) and sulfur (S) contents in the biosorbents (Table 4). The percentage of C and H was similar for all the samples, and corresponded to the composition of walnut shells reported in the literature [46]. The nitrogen content in modified biosorbents increased from 0.36 and 0.58% for SWS and WS, respectively, and to 2.16 and 2.73% for SUWS and UWS, respectively, proving the incorporation of covalently bonded nitrogen in the biosorbent structure by urea treatment. A slight increase in sulfur content for SWS and SUWS samples after SDS treatment can be noticed.
The surface morphology of WS-based adsorbents before and after treatment was studied using SEM equipped with an EDX analyzer. The obtained pictures and EDX spectra are shown in Figure 3. As expected, no visible changes in morphology were observed after SDS treatment of biosorbents. It was also noticed that the porosity of the adsorbent surface was not significantly affected by urea treatment. Additional BET analysis confirmed the macroporous structure of samples with the size of pores higher than 1 µm. The EDX analysis of the adsorbents revealed that carbon and oxygen were the main constituents of biosorbents. The presence of a Pt signal is due to sample metallization. The adsorption of SDS resulted in apparition of a sulfur signal for SWS and SUWS samples, and a sodium signal for the SUWS sample.
3.2. Adsorption Studies
For the adsorption studies, crystal violet (CV) was used as a model synthetic dye. This triarylmethane cationic dye is largely utilized as a purple dye in the textile industry. CV is poorly metabolized by living organisms, is non-biodegradable, and classified as toxic and carcinogenic. It can also be responsible for various health problems [47]. It is therefore interesting and desirable to explore the removal of this synthetic molecule using biosorbents.
3.2.1. Effect of Operating Parameters
The main objective of this step is to determine the optimum set of operational parameters for the CV adsorption. The optimization of CV adsorption was carried out according to three independent input factors: CV concentration, solution pH and biosorbent dose, with CV removal efficiency (R) as the response. According to the response surface methodology analyses, the relationships between variables and responses were established and expressed by the regression models [32]. Linear regression with a logit transformation was used to configure the analysis since the response was bounded by the lower and upper limits of 0% and 100% removal efficiency, respectively. The best-fitting models for each biosorbent were derived from quadratic equations. The final equations in terms of actual factors and fit statistics are summarized in Table 5.
The different fit statistics characterize the adequacy of the model equations. Values of the correlation coefficient R2 between 92.9% and 95.5% confirm a good correlation between the experimental results and values predicted by the model equation. F-values of between 14.47 and 23.32 imply that the models are significant. p-values lower than 0.05 indicate that the model can be considered as statistically significant. Adeq Precision greater than 4 indicates an adequate measure of the signal-to-noise ratio. The examination of all these parameters proved that the proposed quadratic model equations of CV removal efficiency are statistically significant and can be used for further analysis.
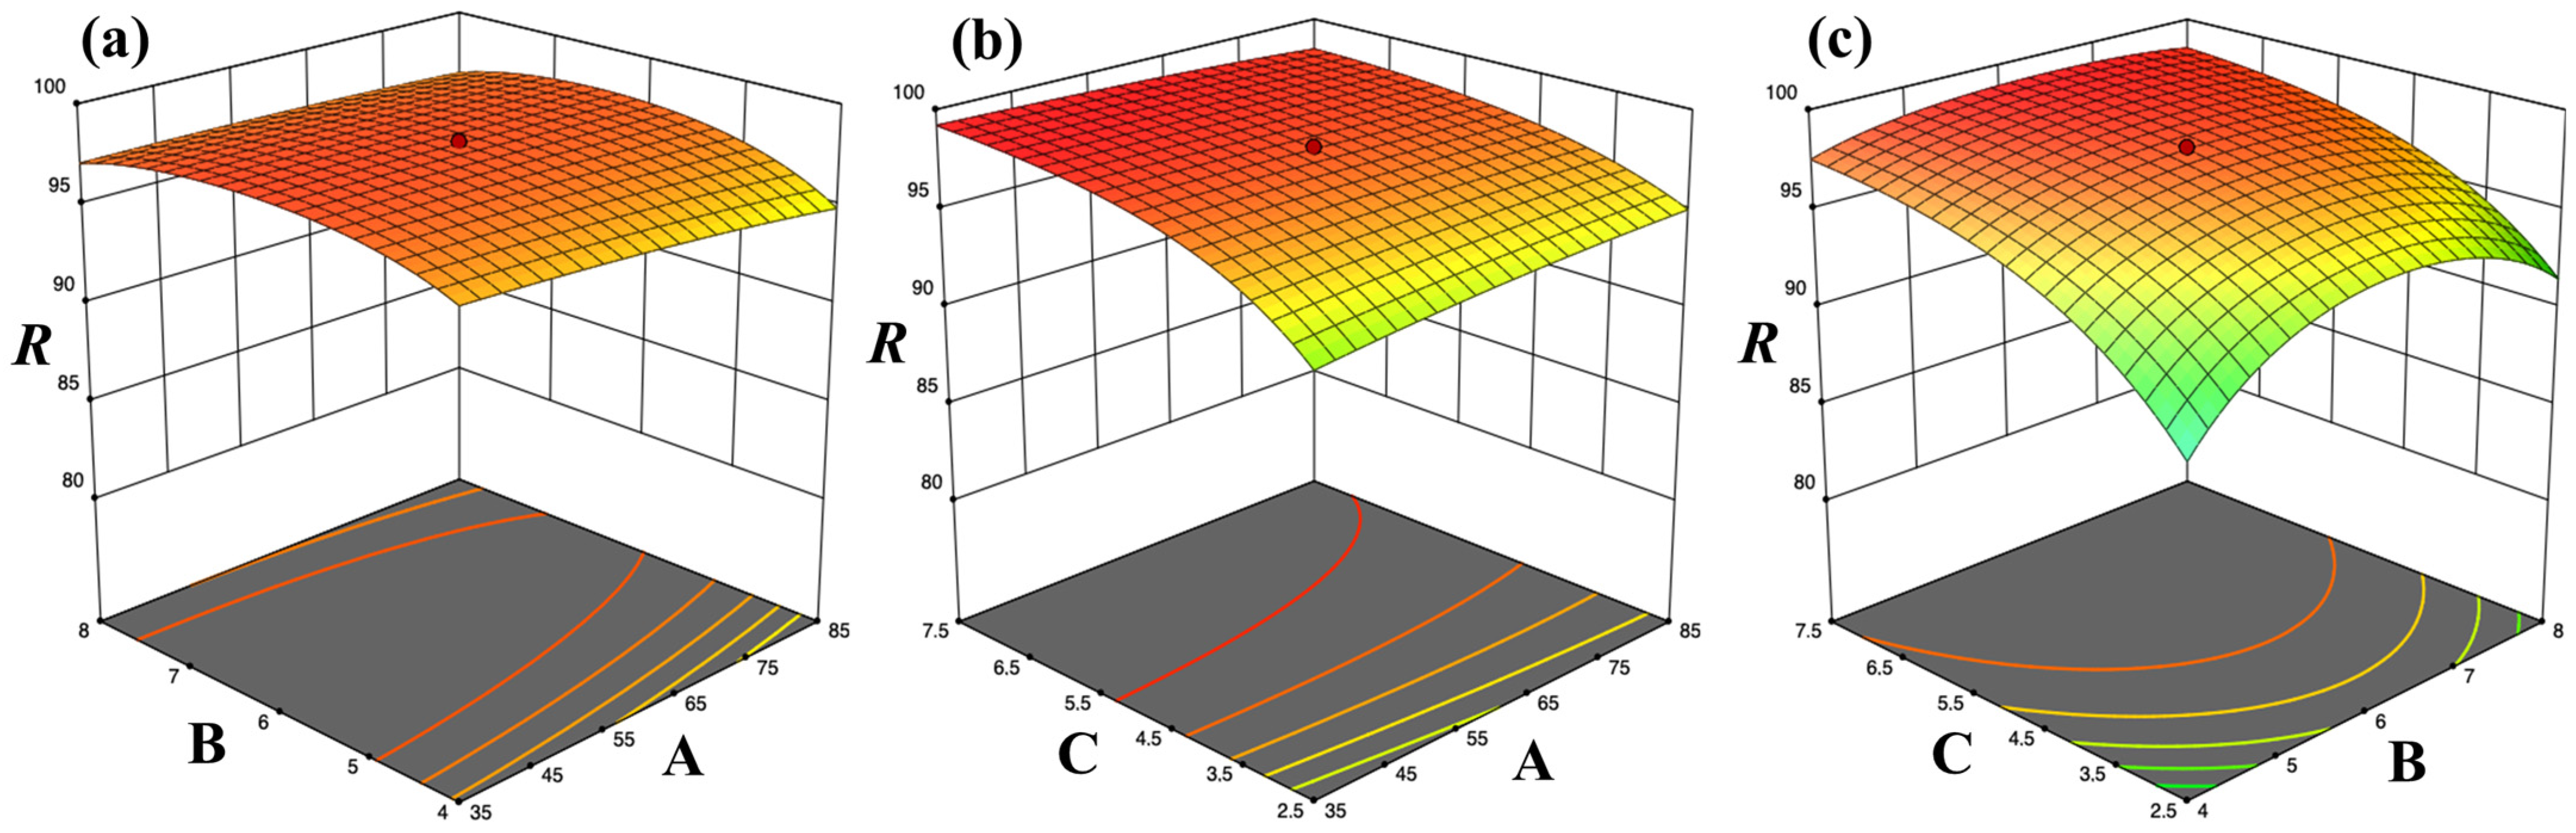
In order to evaluate the effect of the three variable parameters on CV adsorption, an experimental design model (CCFD) and response surface methodology were used [32]. The three-dimensional (3D) response surface plots provide useful information for understanding the interactions between independent variables and their effect on the response variable [48]. In these plots, the response variable is presented as a function of two independent variables, maintaining all other variables at a fixed level and using the established quadratic model equations. The results of the interactive effect of variable parameters on adsorption of CV by the SUWS biosorbent are shown in Figure 4.
Effect of pH
pH is an important parameter in sorption studies as it affects the surface properties of the adsorbent and the dissociation of the adsorbate compound [47]. The pH dependences of CV adsorption combined with initial dye concentration and biosorbent dose are illustrated in Figure 4a,c, respectively. The CV removal increased with increasing pH from 4 to 6.5, and maximum percentage of removal efficiency by the SUWS biosorbent was observed at pH 6.5. This result can be related to the pHpzc value of the biosorbent (5.6 ± 0.1). At a pH higher than zero-point charge, the deprotonation of –COOH groups is favored and the number of negatively charged groups on the biosorbent surface increases. This leads to electrostatic attraction interactions between the SUWS surface and dye cations. This observation corroborates earlier finding for other types of sorbents [48,49]. At a pH of 6.5, the maximum percentage of removal efficiency of 97–98% was obtained over the entire range of investigated CV concentrations.
Effect of Biosorbent Dose
The amount of SUWS, or the biosorbent dose, had a significant influence on CV removal efficiency. Figure 4b,c shows the interactive effect between the adsorbent dose with CV concentration and pH, respectively. It may be noted that the dye adsorption increases with increasing dose within the experimental range. Nearly 99% dye removal was achieved at a maximum biosorbent dose of 7.5 g·L−1 and a minimum dye concentration of 35 mg·L−1. On the other hand, the decrease in biosorbent dose to 2.5 g·L−1 and the increase of CV concentration to 85 mg·L−1 did not result in any important reduction in the removal efficiency, which remained higher than 95%. The increase in dose allows more adsorption sites to become available, which results in a decrease in the concentration gradient between the bulk solution and the adsorbent interface, resulting in declining adsorption rates against constant dye concentration. Conversely, for low adsorbent doses, the concentration gradient will be relatively high, leading to higher adsorption rates. For all investigated biosorbent doses, the highest efficiency was achieved at pH close to 6.5.
The response surfaces for the WS, UWS and SWS biosorbents were analyzed in the same way (Figure S1, Supplementary data). The results indicated that the optimum pH for all biosorbents was about 6.5–7.5, and the optimal biosorbent dose was of 5 g·L−1 for WS, 3.3 g·L−1 for UWS and SWS, and 2.5 g·L−1 for SUWS. These observations suggest that combined urea/surfactant treatment has a positive effect on the adsorption capacity of walnut shells, and allows the decrease in adsorbent dose for efficient CV adsorption.
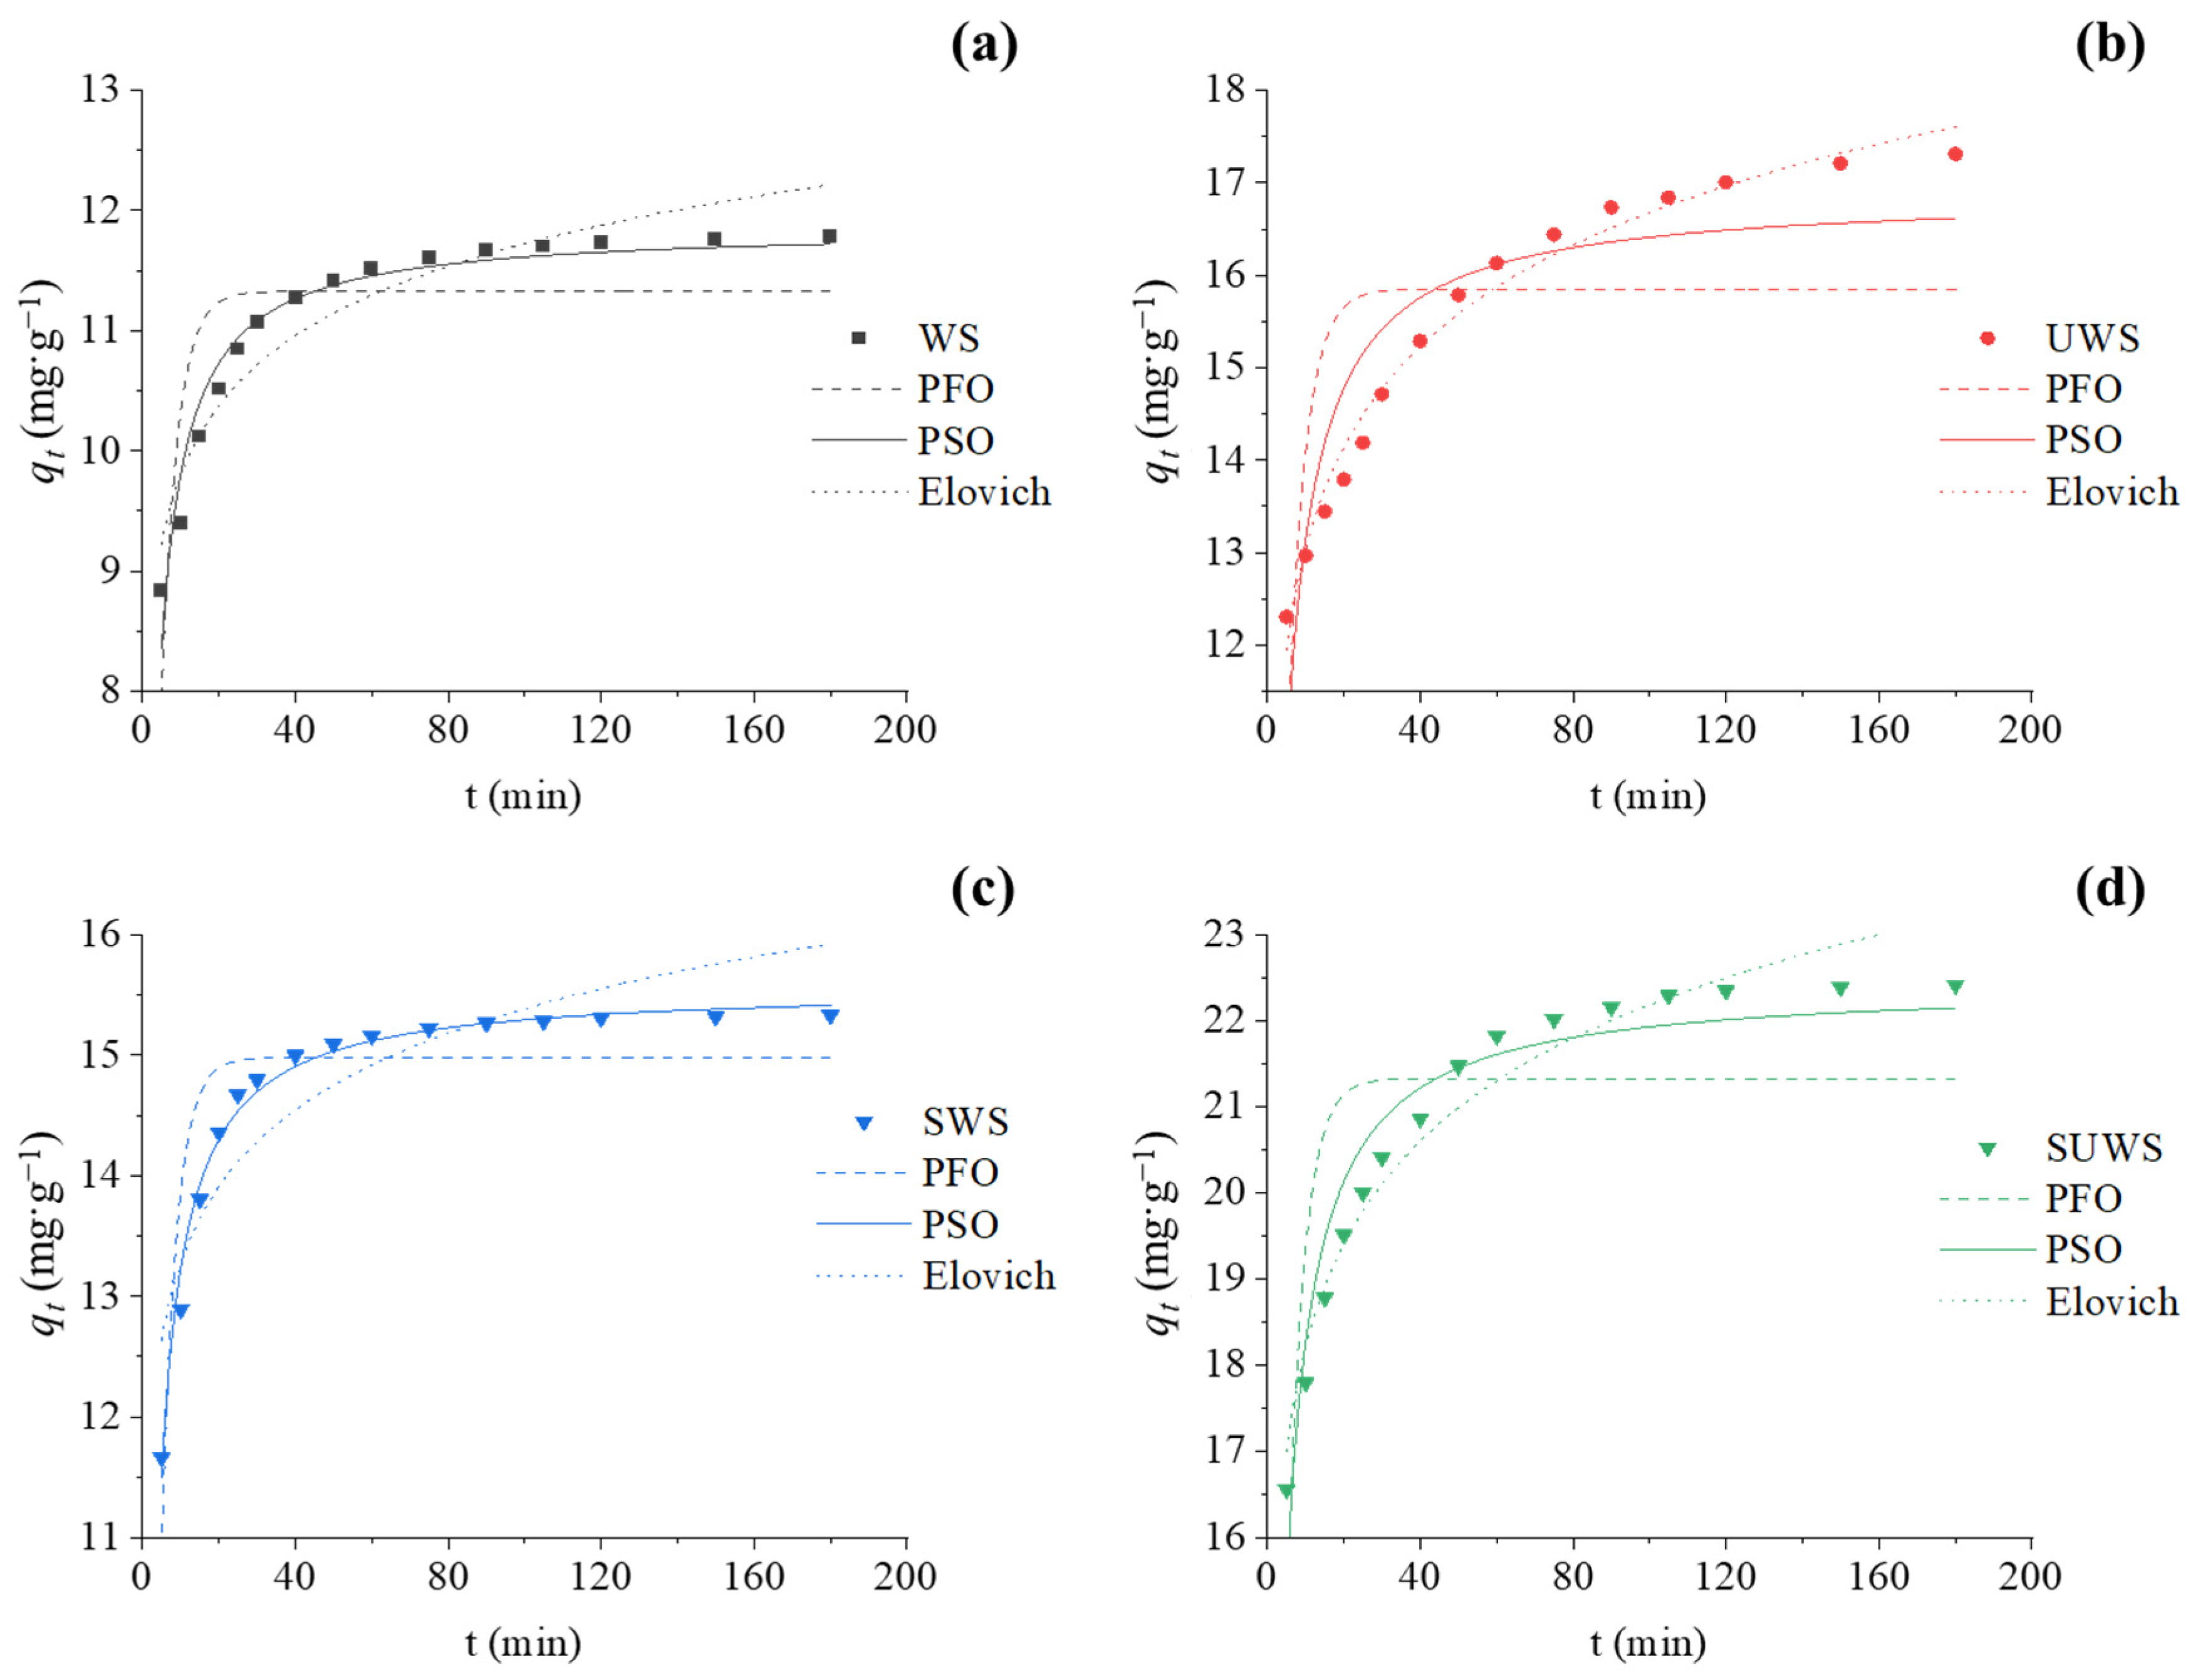
3.2.2. Adsorption Kinetics
The adsorption dynamics were investigated to assess the time dependency of the adsorption progress. The kinetic models can also indicate whether chemical or physical adsorption is dominant in the sorption process [50]. Several kinetic models including pseudo-first-order of Lagergren (PFO, Equation (3)) [51], pseudo-second-order (PSO, Equation (4)) [52] and Elovich (Equation (5)) [53] models were selected to determine the relationship between the sorption capacity and contact time. The following kinetic equations were used:
where is the adsorption capacity (mg·g−1) at any time t (min); is the sorption capacity at equilibrium (mg·g−1); k1 and k2 are the PFO rate constant (min−1) and the PSO rate constant (g·mg−1·min−1), respectively; α is the initial adsorption rate of the Elovich equation (mg·g−1·min−1) and β is the desorption constant (g·mg−1).
To obtain accurate results for the physical parameters, nonlinear fitting of the data was used. This was achieved by minimizing the difference between experimental data and predicted values of the dependent factor. In addition, with nonlinear fitting, it is possible to directly compare the correlation coefficients (R2). In linearized phenomenological equations, R2 values cannot be compared because the ordinates of the graphs are different [54]. In this study, nonlinear data fitting was applied to the nonlinear models through a user-defined function and solved with algorithms based on the Levenberg–Marquardt method using the OriginPro 2021 software.
Figure 5 illustrates the model predictions and Table 6 summarizes the parameters estimated from the application of these models. The obtained results demonstrate that the lowest correlation coefficients between 0.42 and 0.79 are obtained for PFO model, which confirms an insufficient fit between the model and the experimental data. The adsorption of CV cations on WS, UWS, SWS and SUWS is therefore not an ideal PFO process, indicating that the equilibrium concentration of dye is not constant throughout the adsorption process [55]. The PSO model was the most accurate model for describing the adsorption kinetics of CV onto WS and SWS biosorbents (correlation coefficients of 0.95 and 0.99, respectively). It is well recognized that pseudo-second-order rate expressions can be used to describe chemisorption involving electron exchange and covalent forces between adsorbent and adsorbate [56]. Therefore, the adsorption process of CV is realized via surface exchange reactions until the surface functional sites of the biosorbent are completely occupied. The adsorption process rate-limiting step in this case is chemisorption.
The best-fit model for the prediction of adsorption process for urea-pretreated biosorbents, UWS and SUWS, was the Elovich model, with correlation coefficients of 0.98 and 0.96, respectively. According to the Elovich model, the rate of adsorption is mainly controlled by chemical reactions, such as chemisorption. In the liquid phase, particularly in aqueous dye solutions, this model has been proven particularly efficient [57]. Figure 5b,d illustrates a tendency of slow adsorption for the UWS and SUWS samples. The same observation was made for systems in which the adsorbing surface is heterogeneous [58]. The lignocellulose of walnut shells has crystalline and amorphous structures. It can be hypothesized that the surface heterogeneity of UWS and SUWS biosorbents increases after delignification and depolymerization by urea treatment. Indeed, the amorphous lignocellulose is more easily decomposed by urea pretreatment as compared to crystalline lignocellulose [59]. On the other hand, the closest match of the experimental sorption capacity of SUWS (22.42 mg·g−1) was with the predicted value of 22.43 mg·g−1, indicating that CV adsorption by this biosorbent was a combination of both chemisorption and ion exchange reactions.
3.2.3. Adsorption Isotherms
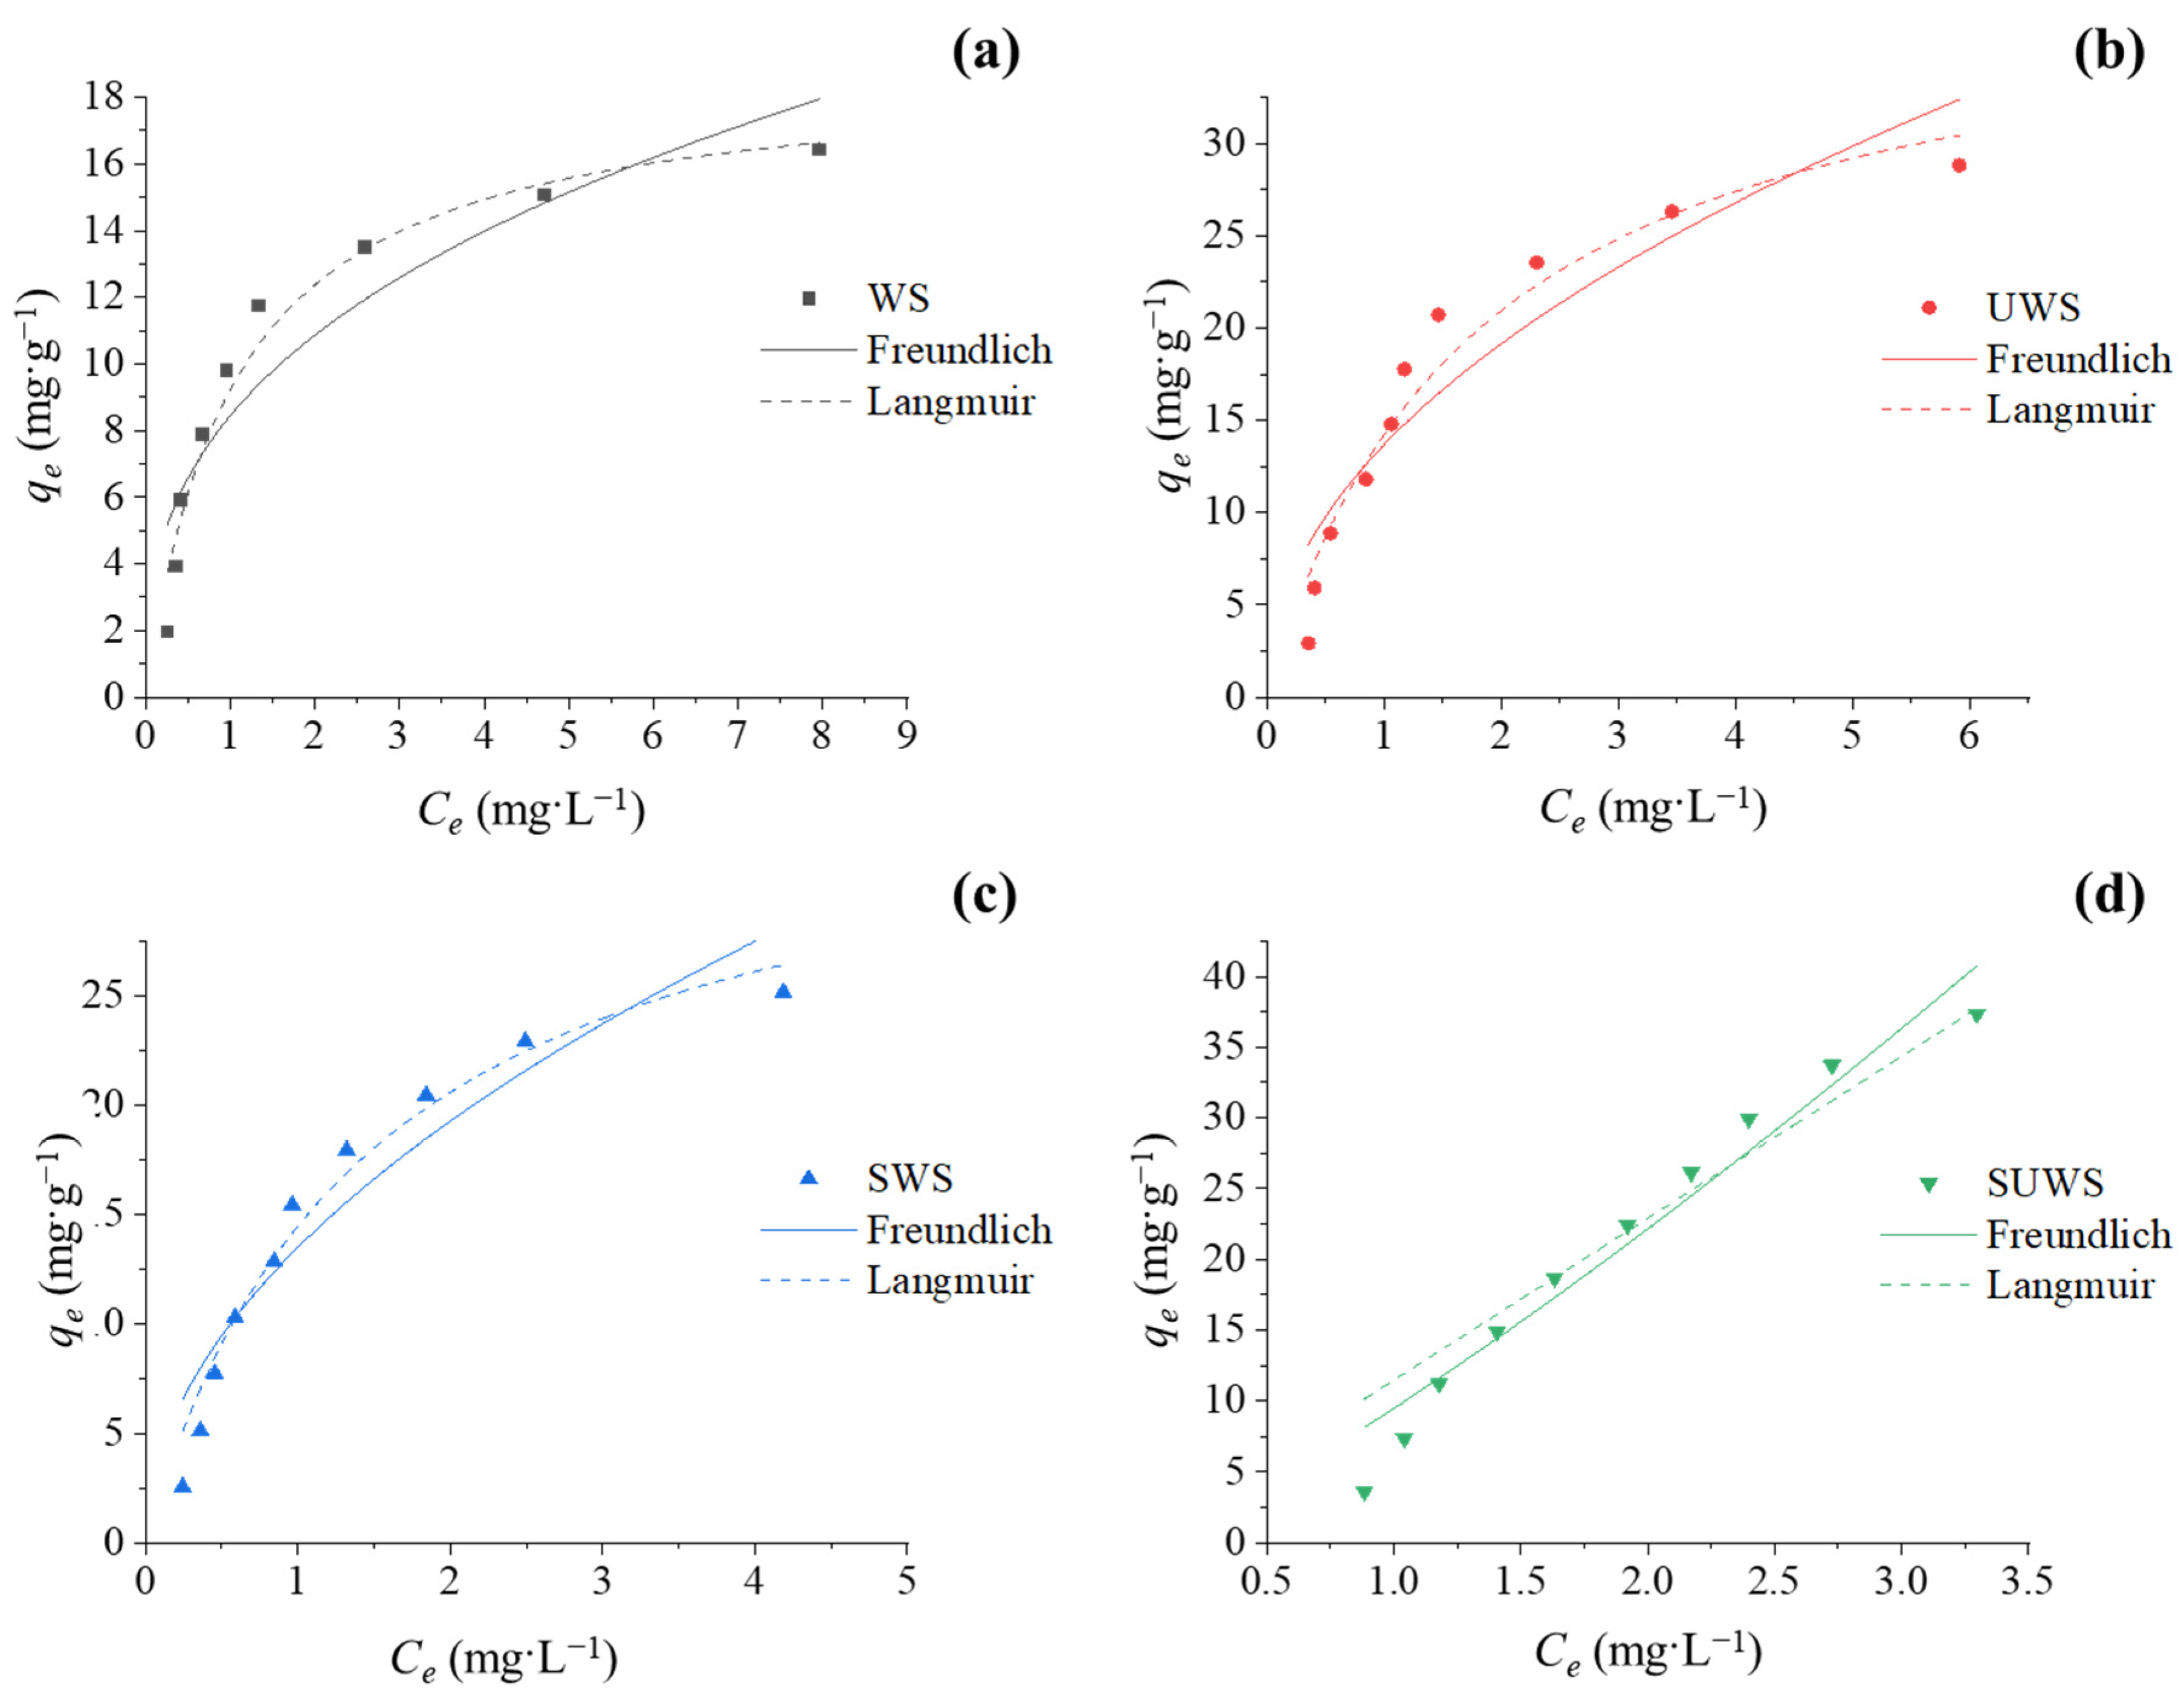
Adsorption isotherm studies are important to characterize the distribution of adsorbate between liquid and solid phases at equilibrium. The adsorption data for CV adsorption onto initial and modified WS biosorbents was analyzed using typical nonlinear Langmuir (Equation (6)) and Freundlich (Equation (7)) isotherm models [60]. A Langmuir isotherm assumes monolayer adsorption by energetically identical sites, whereas a Freundlich isotherm describes heterogeneous surfaces without assuming monolayer capacity [61].
where is the sorption capacity at equilibrium (mg.g−1); is the dye concentration at equilibrium (mg·L−1); reflects the adsorbent capacity (L·g−1); is the heterogeneity factor (unitless) ranging from 0 to 1; reflects the solute adsorptivity (L·g−1) and is related to the energy of adsorption (L·mg−1).
Figure 6 shows the equilibrium isotherm data with nonlinearly fit models of the adsorption of CV onto the biosorbents. A nonlinear regression analysis was used to estimate characteristic parameters of both models, which are summarized in Table 7.
The obtained results demonstrated that the Freundlich model is unfavorable for the fitting of experimental data. In spite of the high correlation coefficient of 0.95 for the SUWS sample, the heterogeneity factor was above the permissible range value (1.22 > 1), making the application of this model difficult. On the other hand, the Langmuir model gave suitable results for describing the equilibrium isotherms for all biosorbents, with R2 values ranging from 0.91 to 0.96. This assumes the interactions between CV molecules and biosorbent surface are on a single layer basis. Additionally, this model predicts that after occupation of the biosorbent’s active sites, no further adsorption of CV can take place at this site [45]. The monolayer coverage has also been observed for other biosorbents modified with surfactants [62]. Data presented in Figure 6 confirm the efficiency of the proposed two-step modification process of lignocellulosic biomass; indeed, the adsorption capacity of the modified SUWS sample is about two times greater than that of WS. As explained before, this increase can be related to the development of the biosorbent surface after urea treatment and a higher amount of negatively charged sites after surfactant treatment, which favors the adsorption of cationic CV compound.
3.3. Comparison of Various Low-Cost Biosorbents
Table 8 summarizes the maximum adsorption capacities of different kinds of low-cost adsorbents derived from biomass in their native or modified form (except activated carbons) for CV removal. These results show that the adsorption capacity of SUWS is lower when compared to treated ginger waste [63], wheat straw [64], coir pith [65] and pomegranate fruit shell powder [66], but of the same order of magnitude as pine bark powder [67], treated cucumber peels [68], rice bran [69], jackfruit leaf powder [70], treated rice husk [47], and significantly higher than sugarcane fiber [65] and orange peels [71]. The characteristics of the adsorption process of the same pollutants are strongly dependent on the nature of the adsorbent. Variability in dye adsorption capacity is mainly related to the differences in the structure, functional groups and surface area of each biosorbent. Based on these results, SUWS can be considered as a competitive low-cost biosorbent for the removal of cationic dye from aqueous solutions.
3.4. Proposed Adsorption Mechanism
The driving forces for dye adsorption are electrostatic interactions between oppositely charged functional groups of dye molecules and sorbent, as well as hydrophobic and hydrogen bonding interactions corresponding to the attractive forces between nonpolar species in aqueous medium [72,73]. According to the obtained results, and based on the chemical structure of CV and the surface composition of adsorbents, the proposed adsorption mechanism is presented in Figure 7.
The basic component of WS is cellulose, which contains –OH and –COOH groups. Urea treatment allows two main changes in the surface structure of cellulose: the grafting of –NH2 functions via formation of isocyanate and reaction with –OH functions of cellulose [10,74], and the destruction of the polysaccharide network with the increase in the amount of accessible –OH and –COOH groups on the biosorbent surface [14]. These modifications were confirmed for the UWS and SUWS samples by the results of FTIR, elemental analysis and pHpzc determination. Thus, urea treatment led to the formation of additional active sites for CV adsorption. On the other hand, adsorption of SDS onto cellulose surface is due to the hydrophobic interactions between carbon chains of surfactant and the inherent hydrophobic microdomains in cellulose [75].
Two main factors need to be considered in the adsorption mechanism: the molecular structure of the adsorbate and the structure of the adsorbent. CV is a cationic dye with amine groups in its structure. The positive charge of CV in water media is due to the dissociation into CV+ and Cl− [63]. Therefore, after the diffusion of the dye molecules from the bulk of the aqueous solution to the surface of the WS-based biosorbents through the boundary layer surrounding the adsorbent particles, the adsorption takes place: (i) through the electrostatic interactions between CV+ cations and negatively charged –COO− (pH > pHpzc) or –SO4− groups, (ii) via possible formation of hydrogen bonds between N atoms of CV and –OH or –HN2 groups of biosorbent. A similar mechanism of CV adsorption has been proposed in previous studies [47,76].
4. Conclusions
In this study, low cost adsorbents from waste biomass were successfully applied in the treatment of dye effluents. Four kinds of biosorbents were prepared from walnut shells with one- or two-step modification using urea and/or anionic surfactant. The efficiency of native and modified biosorbents for the removal of synthetic cationic CV dye from aqueous solutions was investigated. The optimization experiments showed that pH close to 7 ± 0.5 allowed the highest adsorption efficiency. The biosorbent treated with urea and surfactant demonstrated a high efficiency of CV removal (>95%) and adsorption capacity (37 mg·g−1). The kinetic study of adsorption was observed to follow the pseudo-second-order rate model. Which gave the most accurate correlation between experimental and model data. The adsorption isotherms of walnut biosorbents were better fitted by the Langmuir equation, supporting CV adsorption onto biosorbent in a single layer.
The results confirm that appropriate modification can efficiently increase the performance of adsorbents. The adsorption capacity of walnut shells modified using combined urea–surfactant treatment was twice that of untreated WS. This underlines the efficiency of the proposed eco-friendly modification approach due to the increase in the biosorbent surface area caused by urea treatment and the increase in the number of active negatively charged sites after SDS treatment allowing a larger amount of adsorbed cationic CV.
These investigations contribute to our knowledge of complex adsorption processes using biomass-based adsorbents. In the future, it would be interesting to expand this approach of combined modification to other types of lignocellulosic biomass. From the economical point of view, and for the potential application of industrial effluent treatment, reusability of biosorbent or regeneration process should be explored.
Supplementary Materials
The following supporting information can be downloaded at: https://www.mdpi.com/article/10.3390/w15081536/s1. Figure S1. Response surfaces at the central point levels for WS, UWS and SWS biosorbents: (a), (d), (g) effects of CV concentration (A) and pH (B) on removal efficiency (R); (b), (e), (h) effects of CV concentration (A) and biosorbent dose (C) on removal efficiency (R); (c), (f), (i) effect of pH (B) and biosorbent dose (C) on removal efficiency (R). Table S1. Experimental data of adsorption experiments.
Author Contributions
Conceptualization V.H. and A.N.; methodology Y.S. and A.N.; validation Y.S.; formal analysis Y.S.; investigation Y.S. and A.N.; writing—original draft preparation Y.S. and A.N.; writing—review and editing V.H.; visualization, A.N.; supervision A.N. and V.H.; project administration A.N.; funding acquisition A.N. All authors have read and agreed to the published version of the manuscript.
Funding
Funding for this research project was provided by the French Government program “Idex Sorbonne Université dans le cadre du soutien de l’Etat aux programmes Investissement d’Avenir”.
Data Availability Statement
The datasets used and/or analyzed during the current study are available from the corresponding author upon request.
Conflicts of Interest
The authors declare no conflict of interest.
List of Abbreviations
| CCFD | central composite face-centered design |
| CMC | critical micellar concentration |
| CV | crystal violet |
| PFO | pseudo-first-order kinetic model |
| PSO | pseudo-second-order kinetic model |
| SDS | sodium dodecylsulfate |
| SUWS | Urea- and SDS-treated walnut shell adsorbent |
| SWS | SDS-treated walnut shell adsorbent |
| UWS | urea-treated walnut shell adsorbent |
| WS | walnut shell adsorbent |
References
- Nworie, F.S.; Nwabue, F.I.; Oti, W.; Mbam, E.; Nwali, B.U. Removal of methylene blue from aqueous solution using activated rice husk biochar: Adsorption isotherms, kinetics and error analysis. J. Chil. Chem. Soc. 2019, 64, 4365–4376. [Google Scholar] [CrossRef] [Green Version]
- Godiya, C.B.; Kumar, S.; Xiao, Y. Amine functionalized egg albumin hydrogel with enhanced adsorption potential for diclofenac sodium in water. J. Hazard. Mater. 2020, 393, 122417. [Google Scholar] [CrossRef] [PubMed]
- Zhao, G.; Wu, X.; Tan, X.; Wang, X. Sorption of Heavy Metal Ions from Aqueous Solutions: A Review. Open Colloid Sci. J. 2011, 4, 19–31. [Google Scholar] [CrossRef]
- Crini, G.; Lichtfouse, E.; Wilson, L.D.; Morin-Crini, N. Conventional and non-conventional adsorbents for wastewater treatment. Environ. Chem. Lett. 2019, 17, 195–213. [Google Scholar] [CrossRef]
- Martínez, M.L.; Labuckas, D.O.; Lamarque, A.L.; Maestri, D.M. Walnut (Juglans regia L.): Genetic resources, chemistry, by-products. J. Sci. Food Agric. 2010, 90, 1959–1967. [Google Scholar] [CrossRef]
- Albatrni, H.; Qiblawey, H.; Al-Marri, M.J. Walnut shell based adsorbents: A review study on preparation, mechanism, and application. J. Water Process Eng. 2022, 45, 102527. [Google Scholar] [CrossRef]
- Ebrahimi, M.; Hassanpour, M.; Rowlings, D.W.; Bai, Z.; Dunn, K.; O’Hara, I.M.; Zhang, Z. Effects of lignocellulosic biomass type on nutrient recovery and heavy metal removal from digested sludge by hydrothermal treatment. J. Environ. Manag. 2022, 318, 115524. [Google Scholar] [CrossRef]
- Jahanban-Esfahlan, A.; Jahanban-Esfahlan, R.; Tabibiazar, M.; Roufegarinejad, L.; Amarowicz, R. Recent advances in the use of walnut (Juglans regia L.) shell as a valuable plant-based bio-sorbent for the removal of hazardous materials. RSC Adv. 2020, 10, 7026–7047. [Google Scholar] [CrossRef] [Green Version]
- Kumar, B.; Bhardwaj, N.; Agrawal, K.; Chaturvedi, V.; Verma, P. Current perspective on pretreatment technologies using lignocellulosic biomass: An emerging biorefinery concept. Fuel Process. Technol. 2020, 199, 106244. [Google Scholar] [CrossRef]
- Din, M.I.; Farooq, U.; Athar, M.; Latif Mirza, M. Environmentally benevolent urea modified Saccharum bengalense as a high capacity biosorbent for removal of Pb(II) ions: Metal uptake modeling and adsorption efficiency. Desalination Water Treat. 2014, 52, 5856–5868. [Google Scholar] [CrossRef]
- Orlando, U.S.; Baes, A.U.; Nishijima, W.; Okada, M. Comparative effectivity of different types of neutral chelating agents for preparing chelated bagasse in solvent-free conditions. J. Clean. Prod. 2004, 12, 753–757. [Google Scholar] [CrossRef]
- Hu, X.; Zhu, J.; Li, J.; Wu, Q. Urea Electrooxidation: Current Development and Understanding of Ni-Based Catalysts. ChemElectroChem 2020, 7, 3211–3228. [Google Scholar] [CrossRef]
- Rong, L.; Shanwen, T.; John, T.S.I. A direct urea fuel cell—Power from fertiliser and waste. Energy Environ. Sci. 2010, 3, 438–441. [Google Scholar] [CrossRef] [Green Version]
- Farooq, U.; Khan, M.A.; Athar, M.; Kozinski, J.A. Effect of modification of environmentally friendly biosorbent wheat (Triticum aestivum) on the biosorptive removal of cadmium(II) ions from aqueous solution. Chem. Eng. J. 2011, 171, 400–410. [Google Scholar] [CrossRef]
- Yelatonsev, D.; Mukhachev, A.; Ivanyuk, O. An Effective Biosorbent Derived from Production Waste for Water Treatment: Studying the Adsorption of Synthetic Dyes. Sci. Innov. 2021, 17, 83–96. [Google Scholar] [CrossRef]
- Yang, Z.; Zhang, G.; Guo, X.; Xu, Y. Designing a novel N-doped adsorbent with ultrahigh selectivity for CO2: Waste biomass pyrolysis and two-step activation. Biomass Convers. Biorefinery 2020, 11, 2843–2854. [Google Scholar] [CrossRef]
- Rouzitalab, Z.; Mohammady Maklavany, D.; Rashidi, A.; Jafarinejad, S. Synthesis of N-doped nanoporous carbon from walnut shell for enhancing CO2 adsorption capacity and separation. J. Environ. Chem. Eng. 2018, 6, 6653–6663. [Google Scholar] [CrossRef]
- Xu, Y.; Yang, Z.; Zhang, G.; Zhao, P. Excellent CO2 adsorption performance of nitrogen-doped waste biocarbon prepared with different activators. J. Clean. Prod. 2020, 264, 121645. [Google Scholar] [CrossRef]
- Wang, W.; Li, D.; Xiang, P.; Zheng, Y.; Zheng, Z.; Lin, X.; He, X.; Liu, C. One-Step Pyrolysis of Nitrogen-Containing Chemicals and Biochar Derived from Walnut Shells to Absorb Polycyclic Aromatic Hydrocarbons (PAHs). Int. J. Mol. Sci. 2022, 23, 15193. [Google Scholar] [CrossRef]
- Ghasemi Kahangi, M.; Rashidi, A.; Samipoorgiri, M. Adsorption methodology: Synthesis of Nanostructured nitrogen-doped porous carbon adsorbents for perchloroethylene vapor adsorption. Anal. Method Environ. Chem. J. 2020, 3, 30–39. [Google Scholar] [CrossRef]
- Bartczak, P.; Wawrzkiewicz, M.; Borysiak, S.; Jesionowski, T. Efficient Biosorbents for Removal of Hazardous Textile Dye, C.I. Basic Blue from Aqueous Solutions. Processes 2022, 10, 586. [Google Scholar] [CrossRef]
- Namasivayam, C.; Sureshkumar, M.V. Removal of chromium(VI) from water and wastewater using surfactant modified coconut coir pith as a biosorbent. Bioresour. Technol. 2008, 99, 2218–2225. [Google Scholar] [CrossRef] [PubMed]
- Oei, B.C.; Ibrahim, S.; Wang, S.; Ang, H.M. Surfactant modified barley straw for removal of acid and reactive dyes from aqueous solution. Bioresour. Technol. 2009, 100, 4292–4295. [Google Scholar] [CrossRef] [PubMed]
- Mohammed, A.A.; Ebrahim, S.E.; Alwared, A.I. Flotation and Sorptive-Flotation Methods for Removal of Lead Ions from Wastewater Using SDS as Surfactant and Barley Husk as Biosorbent. J. Chem. 2013, 2013, 413948. [Google Scholar] [CrossRef]
- Jain, S.N.; Gogate, P.R. Acid Blue 113 removal from aqueous solution using novel biosorbent based on NaOH treated and surfactant modified fallen leaves of Prunus Dulcis. J. Environ. Chem. Eng. 2017, 5, 3384–3394. [Google Scholar] [CrossRef]
- Ansari, R.; Seyghali, B.; Mohammad-khah, A.; Zanjanchi, M.A. Application of Nano Surfactant Modified Biosorbent as an Efficient Adsorbent for Dye Removal. Sep. Sci. Technol. 2012, 47, 1802–1812. [Google Scholar] [CrossRef]
- Azizi, A.; Krika, F.; Krika, A. Efficient anionic surfactant treatment of cork for cationic dye removal from aqueous media. Glob. NEST J. 2021, 23, 218–225. [Google Scholar] [CrossRef]
- Is, F.; Bonusa, N.H.; Ilmi, L.Y.; Budi, H. Enhanced adsorption capacity of peanut shell toward rhodamine B via sodium dodecyl sulfate modification. Rasayan J. Chem. 2018, 11, 1166–1176. [Google Scholar] [CrossRef]
- Bois, R.; van Hecke, E.; Pezron, I.; Nesterenko, A. Screening of Surfactant Foaming Properties Using the Gas-Sparging Method: Design of an Optimal Protocol. J. Surfactants Deterg. 2020, 23, 359–369. [Google Scholar] [CrossRef]
- Shouman, M.A.; Fathy, N.A.; Khedr, S.A.; Attia, A.A. Comparative Biosorption Studies of Hexavalent Chromium Ion onto Raw and Modified Palm Branches. Adv. Phys. Chem. 2013, 2013, 159712. [Google Scholar] [CrossRef] [Green Version]
- Lopez-Ramon, M.V.; Stoeckli, F.; Moreno-Castilla, C.; Carrasco-Marin, F. On the characterization of acidic and basic surface sites on carbons by various techniques. Carbon 1999, 37, 1215–1221. [Google Scholar] [CrossRef]
- Garg, U.K.; Kaur, M.P.; Garg, V.K.; Sud, D. Removal of Nickel(II) from aqueous solution by adsorption on agricultural waste biomass using a response surface methodological approach. Bioresour. Technol. 2008, 99, 1325–1331. [Google Scholar] [CrossRef] [PubMed]
- Garg, U.K.; Kaur, M.P.; Sud, D.; Garg, V.K. Removal of hexavalent chromium from aqueous solution by adsorption on treated sugarcane bagasse using response surface methodological approach. Desalination 2009, 249, 475–479. [Google Scholar] [CrossRef]
- Siham, H.; Ahmed, E.-S.; Nourhan, Z.; Marwa, E.-A. Application of Pineapple Leaves as Adsorbents for Removal of Rose Bengal from Wastewater: Process Optimization Operating Face-Centered Central Composite Design (FCCCD). Molecules 2020, 25, 3752. [Google Scholar] [CrossRef]
- Tang, R.; Dai, C.; Li, C.; Liu, W.; Gao, S.; Wang, C. Removal of Methylene Blue from Aqueous Solution Using Agricultural Residue Walnut Shell: Equilibrium, Kinetic, and Thermodynamic Studies. J. Chem. 2017, 2017, 8404965. [Google Scholar] [CrossRef] [Green Version]
- Wang, X.; Ren, H. Comparative study of the photo-discoloration of moso bamboo (Phyllostachys pubescens Mazel) and two wood species. Appl. Surf. Sci. 2008, 254, 7029–7034. [Google Scholar] [CrossRef]
- Sohan, S. Chemical, Structural and Elemental Characterization of Biosorbents Using FE-SEM, SEM-EDX, XRD/XRPD and ATR-FTIR Techniques. J. Chem. Eng. Process Technol. 2016, 7, 1–11. [Google Scholar] [CrossRef] [Green Version]
- Salman, M.; Athar, M.; Farooq, U.; Nazir, H.; Noor, A.; Nazir, S. Microwave-assisted urea-modified sorghum biomass for Cr (III) elimination from aqueous solutions. Korean J. Chem. Eng. 2013, 30, 1257–1264. [Google Scholar] [CrossRef]
- Nazerian, M.; Kashi, H.R.; Rudi, H.; Papadopoulos, A.N.; Vatankhah, E.; Foti, D.; Kermaniyan, H. Comparison of the Estimation Ability of the Tensile Index of Paper Impregnated by UF-Modified Starch Adhesive Using ANFIS and MLR. J. Compos. Sci. 2022, 6, 341. [Google Scholar] [CrossRef]
- Chiang, T.C.; Hamdan, S.; Osman, M.S. Urea Formaldehyde Composites Reinforced with Sago Fibres Analysis by FTIR, TGA, and DSC. Adv. Mater. Sci. Eng. 2016, 2016, 5954636. [Google Scholar] [CrossRef] [Green Version]
- Wang, C.; Mei, J.; Zhang, L. High-added-value biomass-derived composites by chemically coupling post-consumer plastics with agricultural and forestry wastes. J. Clean. Prod. 2021, 284, 124768. [Google Scholar] [CrossRef]
- Is, F.; Sahroni, I.; Dahlyani, M.S.E.; Oktaviyani, A.M.N.; Nurillahi, R. Surfactant-modified Salacca zalacca skin as adsorbent for removal of methylene blue and Batik’s wastewater. Mater. Today Proc. 2021, 44, 3211–3216. [Google Scholar] [CrossRef]
- Al-Degs, Y.S.; El-Barghouthi, M.I.; El-Sheikh, A.H.; Walker, G.M. Effect of solution pH, ionic strength, and temperature on adsorption behavior of reactive dyes on activated carbon. Dye. Pigment. 2008, 77, 16–23. [Google Scholar] [CrossRef]
- Yao, Y.; Bergeron, A.D.; Davaritouchaee, M. Methane recovery from anaerobic digestion of urea-pretreated wheat straw. Renew. Energy 2018, 115, 139–148. [Google Scholar] [CrossRef]
- Lim, L.; Priyantha, N.; Zaidi, N.; Jamil, U.A.N.; Hei Ing, C.; Zehra, T.; Liyandeniya, A. Chemical modification of artocarpus odoratissimus skin for enhancement of their adsorption capacities toward toxic malachite green dye. J. Mater Environ. Sci. 2016, 7, 3211–3224. [Google Scholar]
- Nowicki, P.; Pietrzak, R.; Wachowska, H. Sorption properties of active carbons obtained from walnut shells by chemical and physical activation. Catal. Today 2010, 150, 107–114. [Google Scholar] [CrossRef]
- Chakraborty, S.; Chowdhury, S.; Das Saha, P. Adsorption of Crystal Violet from aqueous solution onto NaOH-modified rice husk. Carbohydr. Polym. 2011, 86, 1533–1541. [Google Scholar] [CrossRef]
- Singh, K.P.; Gupta, S.; Singh, A.K.; Sinha, S. Optimizing adsorption of crystal violet dye from water by magnetic nanocomposite using response surface modeling approach. J. Hazard. Mater. 2011, 186, 1462–1473. [Google Scholar] [CrossRef]
- Önal, Y.; Akmil-Başar, C.; Eren, D.; Sarıcı-Özdemir, Ç.; Depci, T. Adsorption kinetics of malachite green onto activated carbon prepared from Tunçbilek lignite. J. Hazard. Mater. 2006, 128, 150–157. [Google Scholar] [CrossRef]
- Cao, J.-S.; Lin, J.-X.; Fang, F.; Zhang, M.-T.; Hu, Z.-R. A new absorbent by modifying walnut shell for the removal of anionic dye: Kinetic and thermodynamic studies. Bioresour. Technol. 2014, 163, 199–205. [Google Scholar] [CrossRef] [PubMed]
- Lin, J.; Wang, L. Comparison between linear and non-linear forms of pseudo-first-order and pseudo-second-order adsorption kinetic models for the removal of methylene blue by activated carbon. Front. Environ. Sci. Eng. China 2009, 3, 320–324. [Google Scholar] [CrossRef]
- Boparai, H.K.; Joseph, M.; O’Carroll, D.M. Kinetics and thermodynamics of cadmium ion removal by adsorption onto nano zerovalent iron particles. J. Hazard. Mater. 2011, 186, 458–465. [Google Scholar] [CrossRef] [PubMed]
- Chang, M.-Y.; Juang, R.-S. Equilibrium and kinetic studies on the adsorption of surfactant, organic acids and dyes from water onto natural biopolymers. Colloids Surf. A Physicochem. Eng. Asp. 2005, 269, 35–46. [Google Scholar] [CrossRef]
- Lima, E.C.; Sher, F.; Guleria, A.; Saeb, M.R.; Anastopoulos, I.; Tran, H.N.; Hosseini-Bandegharaei, A. Is one performing the treatment data of adsorption kinetics correctly? J. Environ. Chem. Eng. 2021, 9, 104813. [Google Scholar] [CrossRef]
- Brandani, S. Kinetics of liquid phase batch adsorption experiments. Adsorption 2021, 27, 353–368. [Google Scholar] [CrossRef]
- Ho, Y.-S. Review of second-order models for adsorption systems. J. Hazard. Mater. 2006, 136, 681–689. [Google Scholar] [CrossRef] [Green Version]
- Wu, F.-C.; Tseng, R.-L. High adsorption capacity NaOH-activated carbon for dye removal from aqueous solution. J. Hazard. Mater. 2008, 152, 1256–1267. [Google Scholar] [CrossRef]
- Cheung, C.W.; Porter, J.F.; McKay, G. Elovich equation and modified second-order equation for sorption of cadmium ions onto bone char. J. Chem. Technol. Biotechnol. 2000, 75, 963–970. [Google Scholar] [CrossRef]
- Shao, L.; Chen, H.; Li, Y.; Li, J.; Chen, G.; Wang, G. Pretreatment of corn stover via sodium hydroxide–urea solutions to improve the glucose yield. Bioresour. Technol. 2020, 307, 123191. [Google Scholar] [CrossRef]
- Foo, K.Y.; Hameed, B.H. Insights into the modeling of adsorption isotherm systems. Chem. Eng. J. 2010, 156, 2–10. [Google Scholar] [CrossRef]
- Ho, Y.-S.; Chiu, W.-T.; Wang, C.-C. Regression analysis for the sorption isotherms of basic dyes on sugarcane dust. Bioresour. Technol. 2005, 96, 1285–1291. [Google Scholar] [CrossRef] [PubMed]
- Fernandez, M.E.; Murguía, M.C. Biosorption of an anionic dye by peanut shell modified with gemini surfactants: A study on the stability of the modification and the removal efficiency. J. Mol. Liq. 2020, 317, 114262. [Google Scholar] [CrossRef]
- Kumar, R.; Ahmad, R. Biosorption of hazardous crystal violet dye from aqueous solution onto treated ginger waste (TGW). Desalination 2011, 265, 112–118. [Google Scholar] [CrossRef]
- Gong, R.; Zhu, S.; Zhang, D.; Chen, J.; Ni, S.; Guan, R. Adsorption behavior of cationic dyes on citric acid esterifying wheat straw: Kinetic and thermodynamic profile. Desalination 2008, 230, 220–228. [Google Scholar] [CrossRef]
- Parab, H.; Sudersanan, M.; Shenoy, N.; Pathare, T.; Vaze, B. Use of Agro-Industrial Wastes for Removal of Basic Dyes from Aqueous Solutions. CLEAN Soil Air Water 2009, 37, 963–969. [Google Scholar] [CrossRef]
- Silveira, M.B.; Pavan, F.A.; Gelos, N.F.; Lima, E.C.; Dias, S.L.P. Punica granatum Shell Preparation, Characterization, and Use for Crystal Violet Removal from Aqueous Solution. CLEAN Soil Air Water 2014, 42, 939–946. [Google Scholar] [CrossRef]
- Ahmad, R. Studies on adsorption of crystal violet dye from aqueous solution onto coniferous pinus bark powder (CPBP). J. Hazard. Mater. 2009, 171, 767–773. [Google Scholar] [CrossRef]
- Smitha, T.; Santhi, T.; Prasad, A.L.; Manonmani, S. Cucumis sativus used as adsorbent for the removal of dyes from aqueous solution. Arab. J. Chem. 2017, 10, S244–S251. [Google Scholar] [CrossRef] [Green Version]
- Wang, X.S.; Liu, X.; Wen, L.; Zhou, Y.; Jiang, Y.; Li, Z. Comparison of Basic Dye Crystal Violet Removal from Aqueous Solution by Low-Cost Biosorbents. Sep. Sci. Technol. 2008, 43, 3712–3731. [Google Scholar] [CrossRef]
- Saha, P.D.; Chakraborty, S.; Chowdhury, S. Batch and continuous (fixed-bed column) biosorption of crystal violet by Artocarpus heterophyllus (jackfruit) leaf powder. Colloids Surf. B Biointerfaces 2012, 92, 262–270. [Google Scholar] [CrossRef]
- Annadurai, G.; Juang, R.-S.; Lee, D.-J. Use of cellulose-based wastes for adsorption of dyes from aqueous solutions. J. Hazard. Mater. 2002, 92, 263–274. [Google Scholar] [CrossRef] [PubMed]
- Pham, T.D.; Pham, T.T.; Phan, M.N.; Ngo, T.M.V.; Dang, V.D.; Vu, C.M. Adsorption characteristics of anionic surfactant onto laterite soil with differently charged surfaces and application for cationic dye removal. J. Mol. Liq. 2020, 301, 112456. [Google Scholar] [CrossRef]
- Barquilha, C.E.R.; Braga, M.C.B. Adsorption of organic and inorganic pollutants onto biochars: Challenges, operating conditions, and mechanisms. Bioresour. Technol. Rep. 2021, 15, 100728. [Google Scholar] [CrossRef]
- Zhang, Y.; Yin, C.; Zhang, Y.; Wu, H. Synthesis and Characterization of Cellulose Carbamate from Wood Pulp, Assisted by Supercritical Carbon Dioxide. BioResources 2013, 8, 1398–1408. [Google Scholar] [CrossRef]
- Tardy, B.L.; Yokota, S.; Ago, M.; Xiang, W.; Kondo, T.; Bordes, R.; Rojas, O.J. Nanocellulose–surfactant interactions. Curr. Opin. Colloid Interface Sci. 2017, 29, 57–67. [Google Scholar] [CrossRef]
- Putri, K.N.A.; Keereerak, A.; Chinpa, W. Novel cellulose-based biosorbent from lemongrass leaf combined with cellulose acetate for adsorption of crystal violet. Int. J. Biol. Macromol. 2020, 156, 762–772. [Google Scholar] [CrossRef]
Figure 1.
FTIR spectra of biosorbents with indicated absorption band/peak frequencies.

Figure 2.
Curves of point zero charge determination of biosorbents.

Figure 3.
SEM micrographs and EDX analysis of biosorbents.

Figure 4.
Response surfaces at the central point levels for SUWS biosorbent: (a) effect of CV concentration (A) and pH (B), (b) effect of CV concentration (A) and biosorbent dose (C), (c) effect of pH (B) and biosorbent dose (C) on removal efficiency (R).
Figure 4.
Response surfaces at the central point levels for SUWS biosorbent: (a) effect of CV concentration (A) and pH (B), (b) effect of CV concentration (A) and biosorbent dose (C), (c) effect of pH (B) and biosorbent dose (C) on removal efficiency (R).

Figure 5.
Kinetic data for the adsorption of CV onto the biosorbents: (a)—WS; (b)—UWS; (c)—SWS; (d)—SUWS. Comparison between the experimental data (points) and predictions (lines) of the PFO, PSO and Elovich models.
Figure 5.
Kinetic data for the adsorption of CV onto the biosorbents: (a)—WS; (b)—UWS; (c)—SWS; (d)—SUWS. Comparison between the experimental data (points) and predictions (lines) of the PFO, PSO and Elovich models.

Figure 6.
Isotherms for the adsorption of CV onto the biosorbents (a) WS, (b) UWS, (c) SWS and (d) SUWS. Comparison between the experimental data (points) and predictions (lines) of the Langmuir and Freundlich models.
Figure 6.
Isotherms for the adsorption of CV onto the biosorbents (a) WS, (b) UWS, (c) SWS and (d) SUWS. Comparison between the experimental data (points) and predictions (lines) of the Langmuir and Freundlich models.

Figure 7.
Proposed adsorption mechanism of CV onto WS-based biosorbents.


Table 1.
Experimental range of independent factors and their levels.
| Factors | Ranges in Five Levels | |||||
|---|---|---|---|---|---|---|
| −1.682 | −1 | 0 | +1 | +1.682 | ||
| CV concentration (mg·L−1) | A | 18.0 | 35 | 60 | 85 | 102.1 |
| pH | B | 2.6 | 4 | 6 | 8 | 9.4 |
| Biosorbent dose (g·L−1) | C | 0.8 | 2.5 | 5 | 7.5 | 9.2 |
Table 2.
Experimental runs according to the central composite design for three independent variables.
Table 2.
Experimental runs according to the central composite design for three independent variables.
| Independent Factors | Adsorption (%) R | ||||||
|---|---|---|---|---|---|---|---|
| CV Concentration A | pH B | Biosorbent Dose C | WS | UWS | SWS | SUWS | |
| 1 | −1 | −1 | −1 | 93.2 | 86.3 | 88.8 | 84.0 |
| 2 | +1 | −1 | −1 | 81.3 | 88.2 | 89.8 | 91.9 |
| 3 | −1 | +1 | −1 | 88.8 | 76.0 | 93.9 | 91.3 |
| 4 | +1 | +1 | −1 | 83.3 | 88.1 | 91.6 | 92.0 |
| 5 | −1 | −1 | +1 | 98.6 | 97.8 | 98.2 | 98.7 |
| 6 | +1 | −1 | +1 | 95.9 | 94.0 | 96.5 | 95.9 |
| 7 | −1 | +1 | +1 | 98.5 | 98.9 | 98.5 | 98.7 |
| 8 | +1 | +1 | +1 | 97.8 | 95.1 | 98.5 | 98.7 |
| 9 | −1.682 | 0 | 0 | 97.9 | 98.2 | 97.8 | 98.5 |
| 10 | +1.682 | 0 | 0 | 90.0 | 97.8 | 93.8 | 96.7 |
| 11 | 0 | −1.682 | 0 | 80.5 | 83.2 | 88.8 | 88.5 |
| 12 | 0 | +1.682 | 0 | 96.0 | 92.8 | 92.3 | 91.3 |
| 13 | 0 | 0 | −1.682 | 73.1 | 83.1 | 85.6 | 88.5 |
| 14 | 0 | 0 | +1.682 | 98.2 | 98.2 | 98.0 | 98.9 |
| 15 | 0 | 0 | 0 | 95.1 | 94.3 | 97.8 | 98.1 |
| 16 | 0 | 0 | 0 | 95.1 | 94.3 | 97.8 | 98.1 |
| 17 | 0 | 0 | 0 | 95.1 | 94.3 | 97.8 | 98.1 |
| 18 | 0 | 0 | 0 | 95.1 | 94.3 | 97.8 | 98.1 |
| 19 | 0 | 0 | 0 | 95.1 | 94.3 | 97.8 | 98.1 |
| 20 | 0 | 0 | 0 | 95.1 | 94.3 | 97.8 | 98.1 |
Table 3.
Initial and final pH of solutions for point zero charge determination of biosorbents.
| WS | UWS | SWS | SUWS | |||||
|---|---|---|---|---|---|---|---|---|
| pH Initial | pH Final | pH Initial | pH Final | pH Initial | pH Final | pH Initial | pH Final | |
| 2.5 | 2.5 | 2.5 | 2.5 | 2.6 | 2.6 | 2.5 | 2.5 | |
| 4.1 | 4.5 | 4.0 | 4.6 | 4.1 | 4.3 | 4.0 | 4.6 | |
| 5.5 | 5.1 | 5.6 | 5.8 | 5.6 | 4.9 | 5.6 | 5.6 | |
| 7.0 | 5.3 | 7.0 | 6.0 | 7.1 | 5.4 | 7.1 | 6.3 | |
| 8.7 | 5.9 | 8.6 | 6.4 | 8.5 | 6.1 | 8.6 | 6.4 | |
| 9.9 | 6.3 | 10.0 | 6.9 | 9.9 | 6.6 | 10.0 | 7.1 | |
| pHpzc | 4.7 ± 0.1 | 5.9 ± 0.1 | 4.4 ± 0.1 | 5.6 ± 0.1 | ||||
Table 4.
Carbon, hydrogen, nitrogen and sulfur content in walnut shell biosorbents.
| Biosorbent | WS | UWS | SWS | SUWS |
|---|---|---|---|---|
| C (%) | 46.04 ± 0.03 | 47.67 ± 0.83 | 46.40 ± 0.26 | 47.48 ± 0.14 |
| H (%) | 5.49 ± 0.08 | 5.61 ± 0.17 | 5.49 ± 0.03 | 5.78 ± 0.15 |
| N (%) | 0.58 ± 0.01 | 2.73 ± 0.65 | 0.36 ± 0.06 | 2.16 ± 0.23 |
| S (%) | 0 | 0 | 0.05 ± 0.01 | 0.11 ± 0.01 |
Table 5.
Best-fitting quadratic equations for CV adsorption using WS-based biosorbents.
| Biosorbent | WS | UWS | SWS | SUWS |
|---|---|---|---|---|
| Coefficients of best-fitting model equations for coded response variables A, B and C * | ||||
| 0.0001 | 0.0005 | −0.0002 | −0.0001 | |
| −0.04 | −0.08 | −0.12 | −0.15 | |
| −0.02 | −0.01 | −0.04 | −0.04 | |
| 0.0034 | 0.0004 | 0.0006 | 0.0012 | |
| 0.03 | 0.04 | 0.00 | 0.01 | |
| −0.000 | −0.007 | −0.001 | −0.004 | |
| −0.06 | −0.03 | 0.02 | 0.02 | |
| 0.29 | 0.80 | 1.42 | 1.72 | |
| 0.36 | 0.62 | 0.75 | 0.88 | |
| 2.08 | −0.97 | −3.57 | −4.97 | |
| Fit statistics ** | ||||
| R2 | 0.93 | 0.95 | 0.93 | 0.96 |
| F-value | 15.12 | 19.52 | 14.47 | 23.32 |
| p-value | 0.0001 | <0.0001 | 0.0001 | <0.0001 |
| Adeq precision | 13.12 | 15.57 | 11.36 | 14.14 |
* A, B and C correspond to CV concentration, pH and biosorbent dose, respectively. ** data obtained using Design-Expert® software.
Table 6.
Estimated kinetic parameters for adsorption of CV onto WS-based biosorbents.
| Parameters | Biosorbent | ||||
|---|---|---|---|---|---|
| WS | UWS | SWS | SUWS | ||
| Experimental | qt,exp (mg·g−1) | 11.78 | 17.31 | 15.33 | 22.42 |
| Pseudo-first-order | qt,cal (mg·g−1) | 11.33 | 15.85 | 14.97 | 21.33 |
| k1 (min−1) | 0.242 | 0.219 | 0.259 | 0.237 | |
| R2 | 0.64 | 0.42 | 0.79 | 0.58 | |
| Pseudo-second-order | qt,cal (mg·g−1) | 11.86 | 16.88 | 15.57 | 22.43 |
| k2 (g·mg−1·min−1) | 0.040 | 0.021 | 0.036 | 0.019 | |
| R2 | 0.95 | 0.82 | 0.99 | 0.93 | |
| Elovich | qt,cal (mg·g−1) | 21.22 | 17.61 | 15.93 | 23.21 |
| α (mg·g−1·min−1) | 10,249.4 | 609.8 | 172,774.4 | 6351.0 | |
| β (g·mg−1) | 1.296 | 0.633 | 1.088 | 0.577 | |
| R2 | 0.91 | 0.98 | 0.82 | 0.96 | |
Table 7.
Parameters estimated from isotherm adsorption models.
| Parameters | Biosorbent | ||||
|---|---|---|---|---|---|
| WS | UWS | SWS | SUWS | ||
| Experimental | qe,exp (mg·g−1) | 16.89 | 28.82 | 25.16 | 37.34 |
| Freundlich | qe,cal (mg·g−1) | 22.92 | 32.36 | 28.15 | 40.78 |
| kF (L·g−1) | 8.44 | 13.68 | 13.48 | 9.49 | |
| bF | 0.363 | 0.485 | 0.514 | 1.22 | |
| R2 | 0.84 | 0.86 | 0.90 | 0.95 | |
| Langmuir | qe,cal (mg·g−1) | 17.62 | 30.43 | 26.43 | 37.75 |
| kL (L·g−1) | 18.07 | 22.18 | 24.29 | 11.45 | |
| (L·mg−1) | 0.961 | 0.560 | 0.680 | 0.000 | |
| R2 | 0.91 | 0.94 | 0.96 | 0.93 | |
Table 8.
Comparison of different low-cost biosorbents for the CV dye adsorption.
| Biosorbent | (mg·g−1) | Reference |
|---|---|---|
| Sugarcane fiber | 10.44 | Parab et al., 2009 [65] |
| Orange peels | 14.3 | Annadurai, 2002 [71] |
| WS | 22.92 | Present study |
| Pinus bark powder | 32.78 | Ahmad, 2009 [67] |
| Cucumis sativus peels treated with H2SO4 | 35.33 | Smitha et al., 2017 [68] |
| SUWS | 37.75 | Present study |
| Rice bran | 42.25 | Wang et al., 2008 [69] |
| Jackfruit leaf powder | 43.39 | Das et al., 2012 [70] |
| Rice husk treated with NaOH | 44.87 | Chakraborty et al., 2011 [47] |
| Pomegranate fruit shell powder | 50.21 | Silveira et al., 2014 [66] |
| Coir pith | 65.53 | Parab et al., 2009 [65] |
| Esterified wheat straw | 227.27 | Gong et al., 2008 [64] |
| Ginger waste treated with H2SO4-ZnCl2 | 277.7 | Kumar & Rais, 2011 [63] |
Disclaimer/Publisher’s Note: The statements, opinions and data contained in all publications are solely those of the individual author(s) and contributor(s) and not of MDPI and/or the editor(s). MDPI and/or the editor(s) disclaim responsibility for any injury to people or property resulting from any ideas, methods, instructions or products referred to in the content. |
© 2023 by the authors. Licensee MDPI, Basel, Switzerland. This article is an open access article distributed under the terms and conditions of the Creative Commons Attribution (CC BY) license (https://creativecommons.org/licenses/by/4.0/).
Share and Cite
MDPI and ACS Style
Shkliarenko, Y.; Halysh, V.; Nesterenko, A. Adsorptive Performance of Walnut Shells Modified with Urea and Surfactant for Cationic Dye Removal. Water 2023, 15, 1536. https://doi.org/10.3390/w15081536
AMA Style
Shkliarenko Y, Halysh V, Nesterenko A. Adsorptive Performance of Walnut Shells Modified with Urea and Surfactant for Cationic Dye Removal. Water. 2023; 15(8):1536. https://doi.org/10.3390/w15081536
Chicago/Turabian StyleShkliarenko, Yuliana, Vita Halysh, and Alla Nesterenko. 2023. "Adsorptive Performance of Walnut Shells Modified with Urea and Surfactant for Cationic Dye Removal" Water 15, no. 8: 1536. https://doi.org/10.3390/w15081536
Note that from the first issue of 2016, this journal uses article numbers instead of page numbers. See further details here.