Article

Enrichment of Manganese at Low Background Level Groundwater Systems: A Study of Groundwater from Quaternary Porous Aquifers in Changping Region, Beijing, China

1
Key Laboratory of Shale Gas and Geoengineering, Institute of Geology and Geophysics, Chinese Academy of Sciences, Beijing 100029, China
2
College of Earth and Planetary Sciences, University of Chinese Academy of Sciences, Beijing 100049, China
3
Academician Zhai Mingguo Workstation, Sanya University, Sanya 572000, China
4
Beijing Water Science and Technology Institute, Beijing 100048, China
5
Beijing Institute of Geo-Environment Monitoring, Beijing 100195, China
*
Author to whom correspondence should be addressed.
Water 2023, 15(8), 1537; https://doi.org/10.3390/w15081537
Submission received: 9 March 2023 / Revised: 7 April 2023 / Accepted: 11 April 2023 / Published: 14 April 2023

Abstract

:
Manganese (Mn) could adversely affect water quality and is a concern for drinking water safety. In contrast to Mn-contaminated groundwater systems, Mn concentrations can increase up to 2 orders of magnitude in low background level groundwater systems (Mn < 100 µg/L). It is interesting to explore related hydrogeological and hydrochemical processes and controlling mechanisms. Our data showed that Mn of groundwater from Quaternary porous aquifers in the Changping region of Beijing in China varied from 0.02 to 522 µg/L, with an average of 45 µg/L. The high Mn concentration (>100 µg/L) in groundwater occurred in the lower plain, while the low Mn concentration was distributed in the upper plain. Association was not obvious between the Mn concentration and the depth of the groundwater. The water–rock interaction (e.g., dissolution of Mn-bearing minerals) and redox reactions dominated the distribution of Mn in groundwater. Particularly, the reduction of Mn4+ was a major cause of increasing Mn2+ concentration in groundwater. This is further evidenced by declining dissolved oxygen (DO) and NO3 in groundwater from the upper plain to the lower plain part. This study contributes to further understandings of hydrochemical processes for the enrichment of Mn in groundwater and offers a reference for the management and oversight of groundwater containing an excessive Mn level.

1. Introduction

High manganese (Mn) concentrations in groundwater were widely reported in various aquifers around the world; Mn can be as high as 6560 µg/L for groundwater in clay-rich areas of Finland [1], 4910 µg/L in Shandong, China [2], 3410 µg/L in south China [3], 1600 µg/L in Costa Rica [4], 52,581 µg/L in northeastern India [5], 3443 µg/L in Bangladesh [6], and 4000 µg/L in North Carolina of USA [7]. Mn of above 100 µg/L in drinking water may cause undesirable taste, stain sanitary ware and laundry, form a coating (black precipitate) on pipes [8], and evidence has increasingly emerged that Mn exceeding 100 µg/L derived from drinking water could carry the risk of neurotoxic effects significantly for children [6,9,10,11]. In comparison to the high background level groundwater systems (Mn > 1000 µg/L), the enrichment of Mn may also occur in low background level groundwater systems (Mn < 100 µg/L); however, this has been rarely reported.
Mn in groundwater can originated from rainfall, soil, river, clay-rich and SO4-rich sediments [12,13], and weathering rocks (e.g., mafic and ultramafic rocks) [7,14,15,16]. The occurrence of peat, fine-grained sediments, clay in aquifers, and anthropogenic pollutants can be pronounced contributors to groundwater Mn [17,18]. Urbanization and mining can produce Mn sources in groundwater [3,18]. Mn dissolved in natural water generally ranges from <0.02 to >10,000 μg/L; natural surface water is generally less than 200 μg/L and rarely exceeds 1000 μg/L [1,19]. The natural level of Mn concentration in soil ranges from <1 to 4000 mg/kg dry weight, with average of 300 to 600 mg/kg [19]. Mn in sediments can be controlled by the penetration of oxygen from the overlying water into the sediments and benthic organic carbon supply [7,20]. Mn can enter into the water as particulate matter through water–rock interactions, or soluble Mn compounds can leach into water from the sediments [14].
Mn may appear in different oxidation states, and the chemistry of Mn in groundwater shows complexity [21]. The environmental chemistry of Mn is largely governed by pH and redox conditions [22]. Some Mn compounds are readily soluble in water at low pH and anaerobic conditions [8,19], while Mn has low solubility in oxidizing systems at pH levels near or slightly above neutrality [23]. Mn exists in the aquatic environment in two main forms (Mn2+ and Mn4+), and transformation occurs via oxidation and reduction reactions that may be abiotic or microbially mediated [19]. Mn mainly exists in the form of Mn2+ at a lower pH and redox potential (Eh) in groundwater [12]. At pH > 5.5 and in an oxidizing environment, Mn is primarily in the form of colloidal Mn (Mn4+) oxides or hydroxides [24].
The Changping region is a suburb of Beijing, located in the piedmont recharge zone of the Beijing plain, where groundwater is the main water source for drinking and irrigation. Many studies primarily focused on groundwater stable isotopes, major ions [25,26], heavy metals (Hg, Cu, Cd, As) [27], fluoride [28,29], water types [30], nitrate [31], and the groundwater table [32]. However, the distribution and controlling mechanism of Mn in groundwater are not well understood. The primary objectives of this paper are to delineate the spatial distribution of groundwater Mn, identify the controlling factors and analyze the evolution process along the groundwater flow path, and improve understanding of the enrichment process of Mn in groundwater systems, particularly in low background level groundwater systems.

2. Materials and Methods
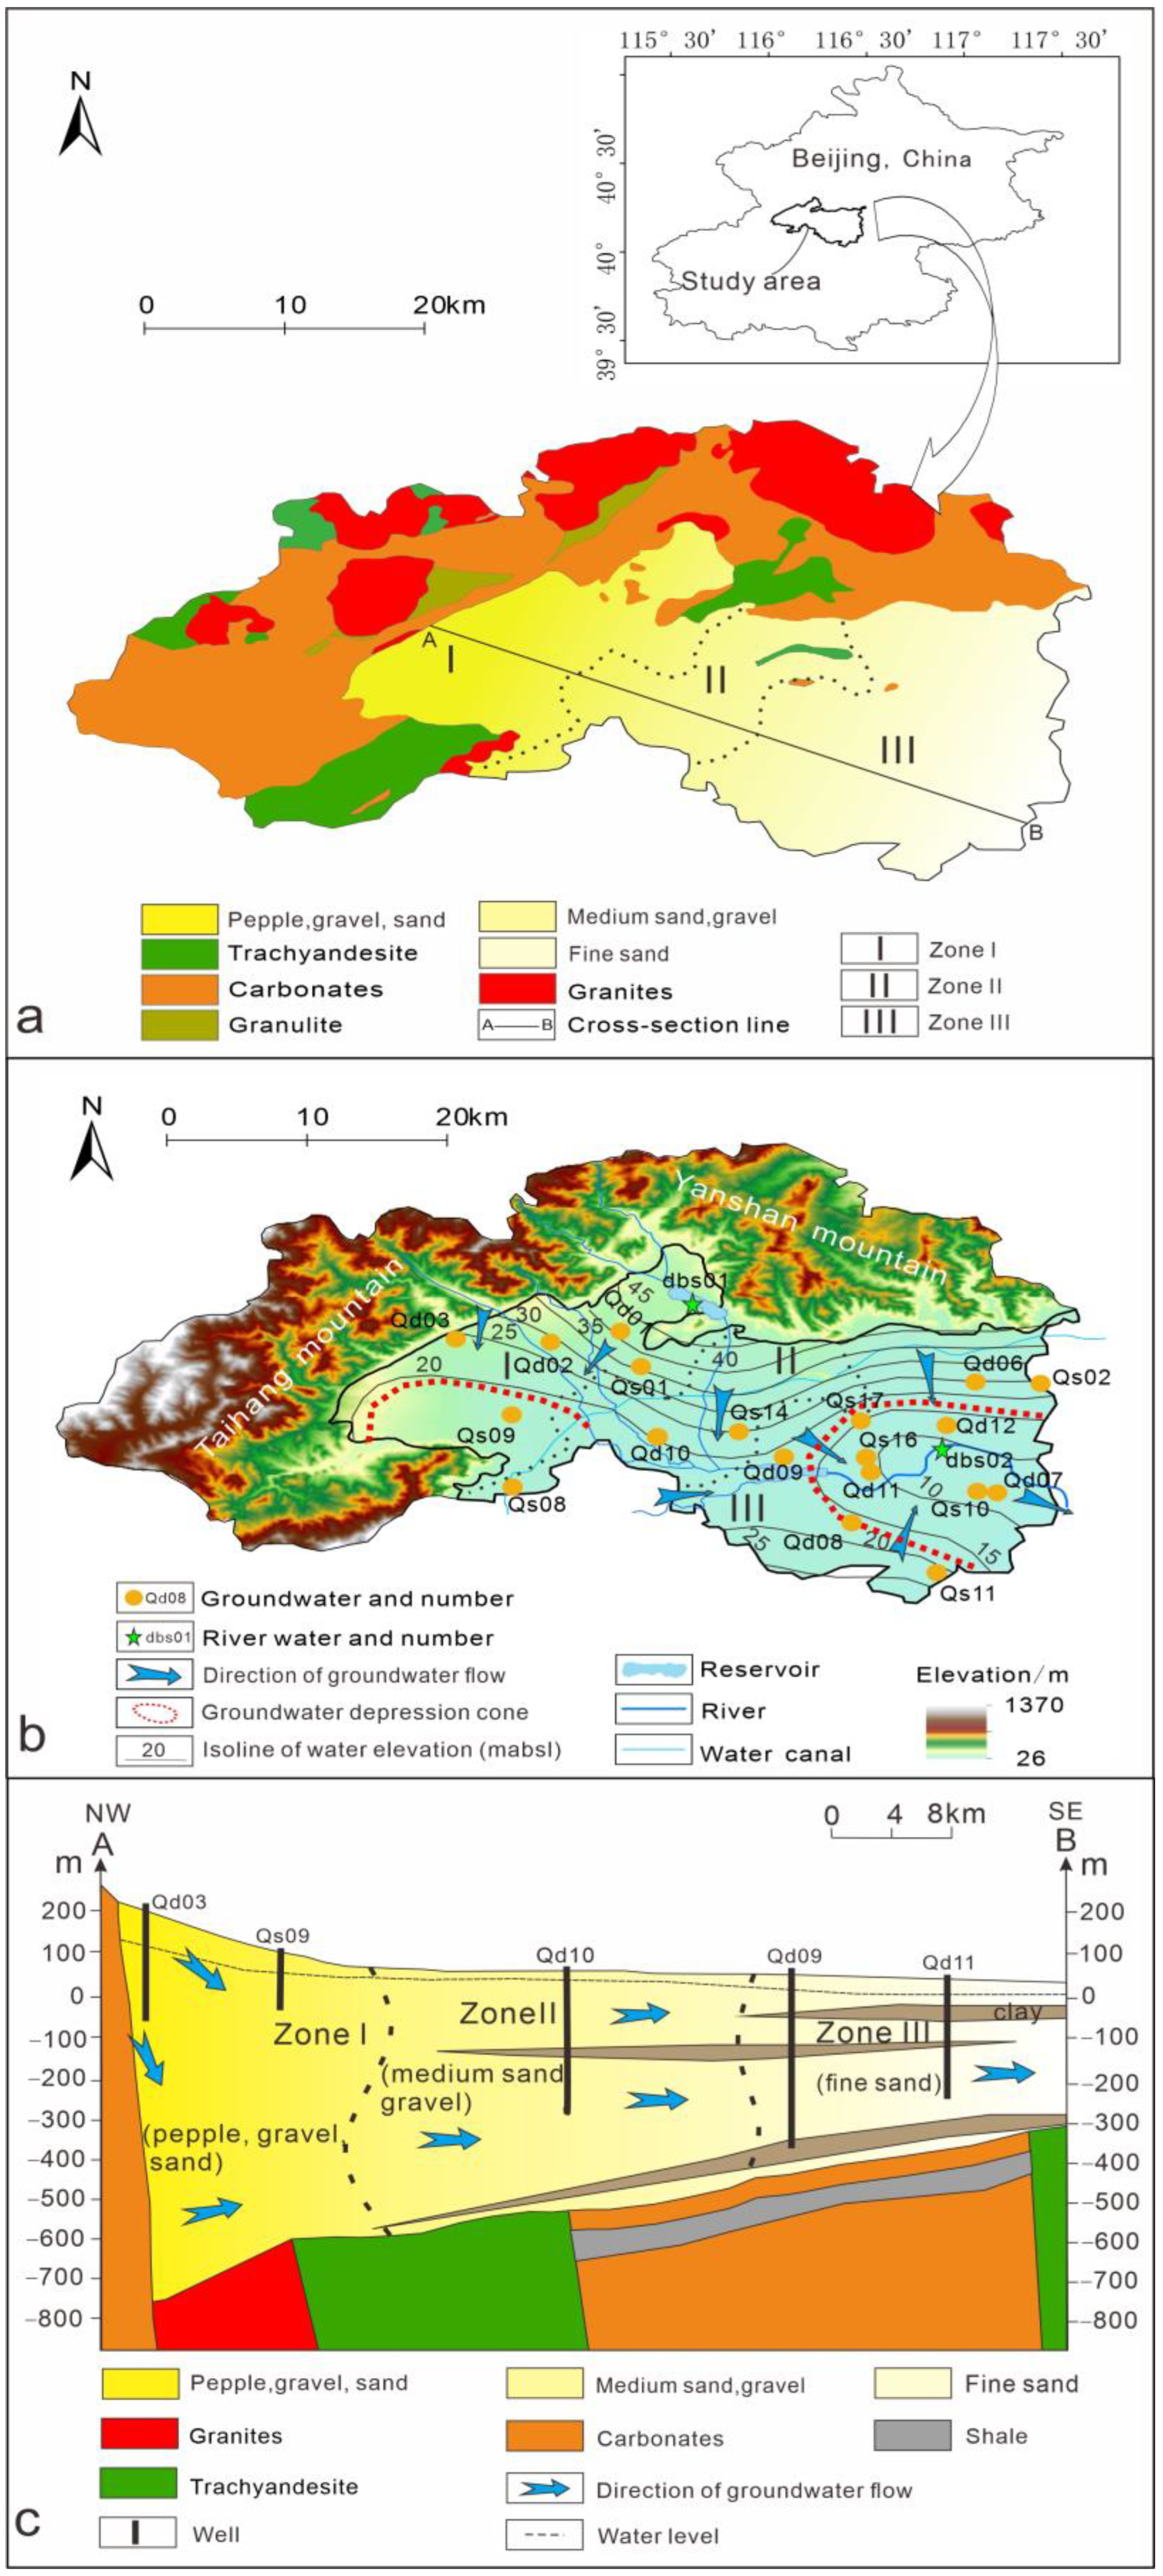
2.1. Study Area

Changping district, situated in the northwest of Beijing, China, is 1352 km2 in area, which consists of 800 km2 of mountainous area to the northwest and 552 km2 of plain area to the southeast (Figure 1b). The climate is impacted by the semiarid continental monsoon climate, characterized by hot, wet summers and cold, dry winters. The mean annual temperature is 12.6 °C, with a maximum value of 41.4 °C in July and a minimum value of −19.0 °C in January. The average annual humidity is 52%. The average annual precipitation is 507 mm, with over 80% of the rainfall occurring during the monsoon period from June to September.
The rock types of the mountain areas and the basement of the Quaternary plains in Changping are granite, monzonite, syenite, dacite, trachyandesite, shale, limestone, and dolomite (Figure 1a,c). The concentration of Mn in these rocks is abundant (Table 1).
The plain is made of Quaternary alluvial and flood fan that mainly consists of pebble, gravel, sand, and clay (Figure 1c), with the grain size decreasing from northwest to southeast and the thickness ranging from 15 m to 800 m. The aquifer system is located in the mountain front alluvial and fluvial fans. Beijing Geological Survey [29,38] has divided the aquifer system into four zones according to the content of pebble, sand, and clay: (1) Single layer of pebble and sand; (2) A total of 2–3 layers of pebble and sand; (3) Multiple layer of sand and pebble; (4) Multiple layer of sand and clay. In this paper, three zones (Zone I, Zone II, Zone III) were divided based on the changes in particle sizes and corresponding hydraulic conductivity (Figure 1b,c). Zone I is located in the upper plain close to the recharge area, mainly consists of coarse sand, pebble, and gravel, and is high permeable that the horizontal and vertical hydraulic conductivity (Kh, Kv) are in 75 to 95 m/d and 7.5 to 9.5 m/d, respectively [39]. Zone II, situated in the middle plain with multiple layers of medium sand and gravel, is intermediately permeable (Kh = 65 to 70 m/d, Kv = 6.5 to 7 m/d). Zone III, located in the lower plain, is low permeable (Kh < 60 m/d, Kv < 6 m/d) due to the increase of clay and fine sand content. Hydraulic connection and water transfer between the different aquifers decreased from the mountain front single aquifer to multiple aquifers.
In natural conditions, groundwater recharges from the north mountain front and flows southward (Figure 1b). Heavy groundwater exploitation has been conducted for tens of years, and groundwater level decreased at a rate of 1 to 2 m/a. Two depression cones have developed with the long axis direction of west–east, which is perpendicular to the flow direction of north–south. One depression cone is located in Zone I; the other is located in Zone III (Figure 1b). Groundwater abstraction could exert influence on the groundwater flow path and hydraulic connection within the aquifer and between aquifers.

2.2. Sampling and Measurement

Groundwater samples in the Quaternary porous aquifers were collected in July 2018, including 5 samples in Zone I, 3 samples in Zone II, and 11 samples in Zone III, with two samples of surface water (dbs01 and dbs04). The groundwater samples were from a depth between 55 and 340 m bgl (below ground level). The distribution of sampling points is shown in Figure 1b.
All water samples were taken from drinking water supply wells; these wells are running nonstop every day and can guarantee samples of water fresh. The figuration of the water supply well is cased with steel tubes in the upper part and screened in the lower part. Each well is equipped with a submersible pump. Although it is hard to designate a precise depth for the outflow of the aquifer, a depth of for the individual water sample based on the well depth can be roughly designated. Here we have two categories: shallow groundwater samples from shallow wells (well depth < 150 m) and deep groundwater samples from deep wells (well depth > 150 m). This is available for the water samples from Zone II and III where a multilayered aquifer is developed. However, it is not so meaningful for Zone I, where a single thick aquifer is developed. Therefore, Zone I and Zone III represent different hydrogeological and physiochemical conditions. Zone II is in between.
Monitoring wells were not selected during sampling for low sampling efficiency (labor- and time-consuming to purge wells). Since the depths of monitoring wells reach tens of meters to hundreds of meters, representative water samples are hard to guarantee.
Water samples were collected from the nearest water tap on the main tube of the submersible pump in the pump housing room (c.a. 20~40 m2). Plastic tubing (~10 mm ID) connected the water tap conducted tap water into the bottom of a bucket (5 L) and keep water overflowing for a while. Then, put (T, pH, DO, EC and Eh) probes into the bucket, wait for 5 parameters stable, and record. In each sampling point, pH, dissolved oxygen (DO), and redox potential (Eh) were determined with a portable WTW Multi 3430.
High-density polyethylene bottles were previously cleaned with hydrochloric acid and ultrapure water (18.2 MΩ·cm) for major ions and trace elements. The water samples were filtered in situ using 0.45-µm cellulose acetate membranes and were acidized with ultrapure nitric acid down to pH < 2. Seal the bottle cap with electrical tape and store in cool ambient. The concentrations of K, Na, Ca, Mg, SO4, HCO3, Cl, F, and NO3 were measured with ion chromatograph (Dionex DX-120) at the Laboratory of Groundwater Dating, Institute of Geology and Geophysics, Chinese Academy of Sciences, with the precision of ±5%. The concentration of HCO3 was titrated using 0.05 mol/L HCl, with the precision of ±10%.
Mn was measured at the Analytical Laboratory of Beijing Research Institute of Uranium Geology. The Mn concentration was analyzed using an inductively coupled plasma mass spectrometer (NexION300D). The detection limit of the instrument for the measured element (Mn) was 2 ng/L. The relative standard deviation for Mn was within ± 4%. Analytical quality was ensured with commercial standard solutions, recovery of spike, and duplicate analysis.

2.3. Methods

Local indicator of spatial correlation (LISA). In reference to McGrory et al. (2017), spatial correlation of the data, before running interpolations, was checked. Using spatial analysis, environmental contamination can be described as existing in either coldspots or hotspots. Spatial clusters include high values in a high-value neighborhood (high–high cluster) and low values in a low-value neighborhood (low–low cluster); spatial outliers are classified as high values in a low-value neighborhood (high–low outlier) and low values in a high-value neighborhood (low–high outlier) [40].
Kriging is an interpolation method and is applied to interpolate the value of a variable at an unmonitored location to explore the spatial structure of the data [41,42]. The main advantage of this method is the ability to estimate the interpolation error of the variable [43]. In hydrochemistry, kriging methods (e.g., ordinary kriging, universal kriging, Bayesian kriging, disjunctive kriging) are used to analyze the spatial distribution of chemical parameters in groundwater [44,45,46]. Ordinary kriging is one of the most popular methods of kriging for spatial prediction [47].
The groundwater level map was made using the universal kriging method [42,48], and the spatial map of variables (e.g., Mn, DO, NO3) in groundwater was constructed via the ordinary kriging method [49]. The Local Indicator of Spatial Association (LISA) or Local Moran’s I index [40,50] was performed to check the spatial correlation and identify outliers of the data before interpolation.
ArcGIS 10.6 was used for the spatial interpolation of the data.

3. Results and Discussion

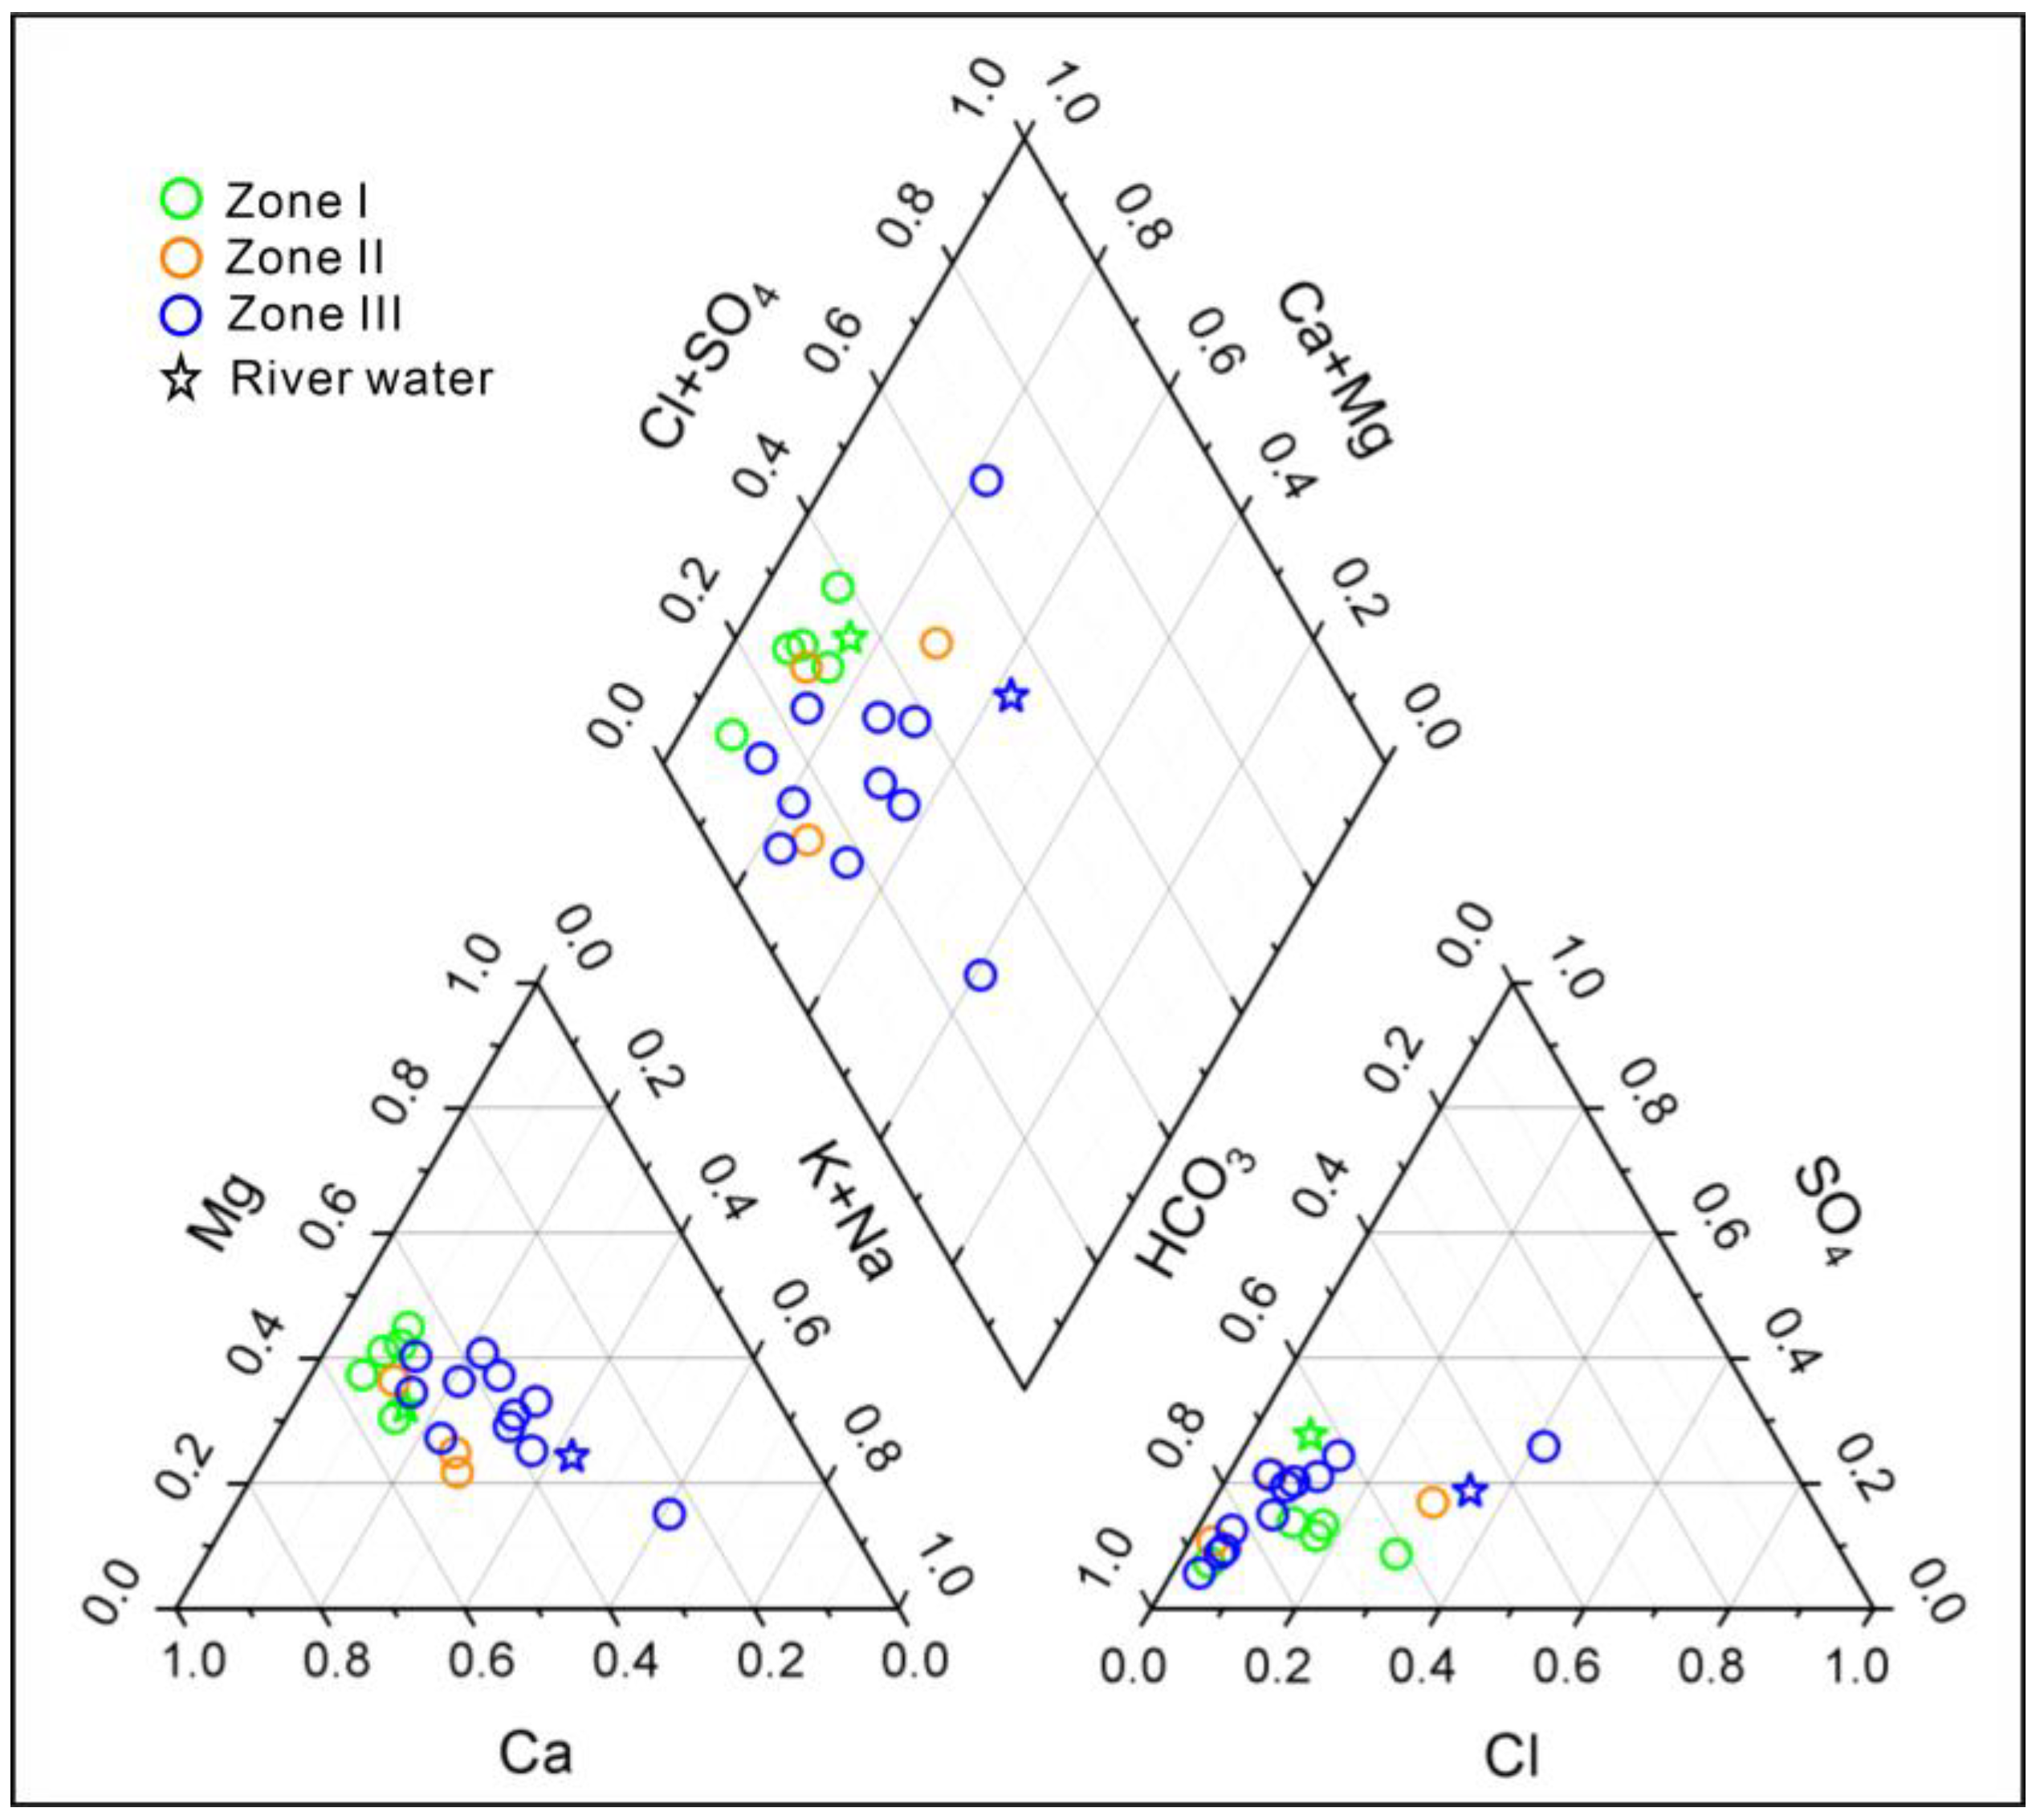
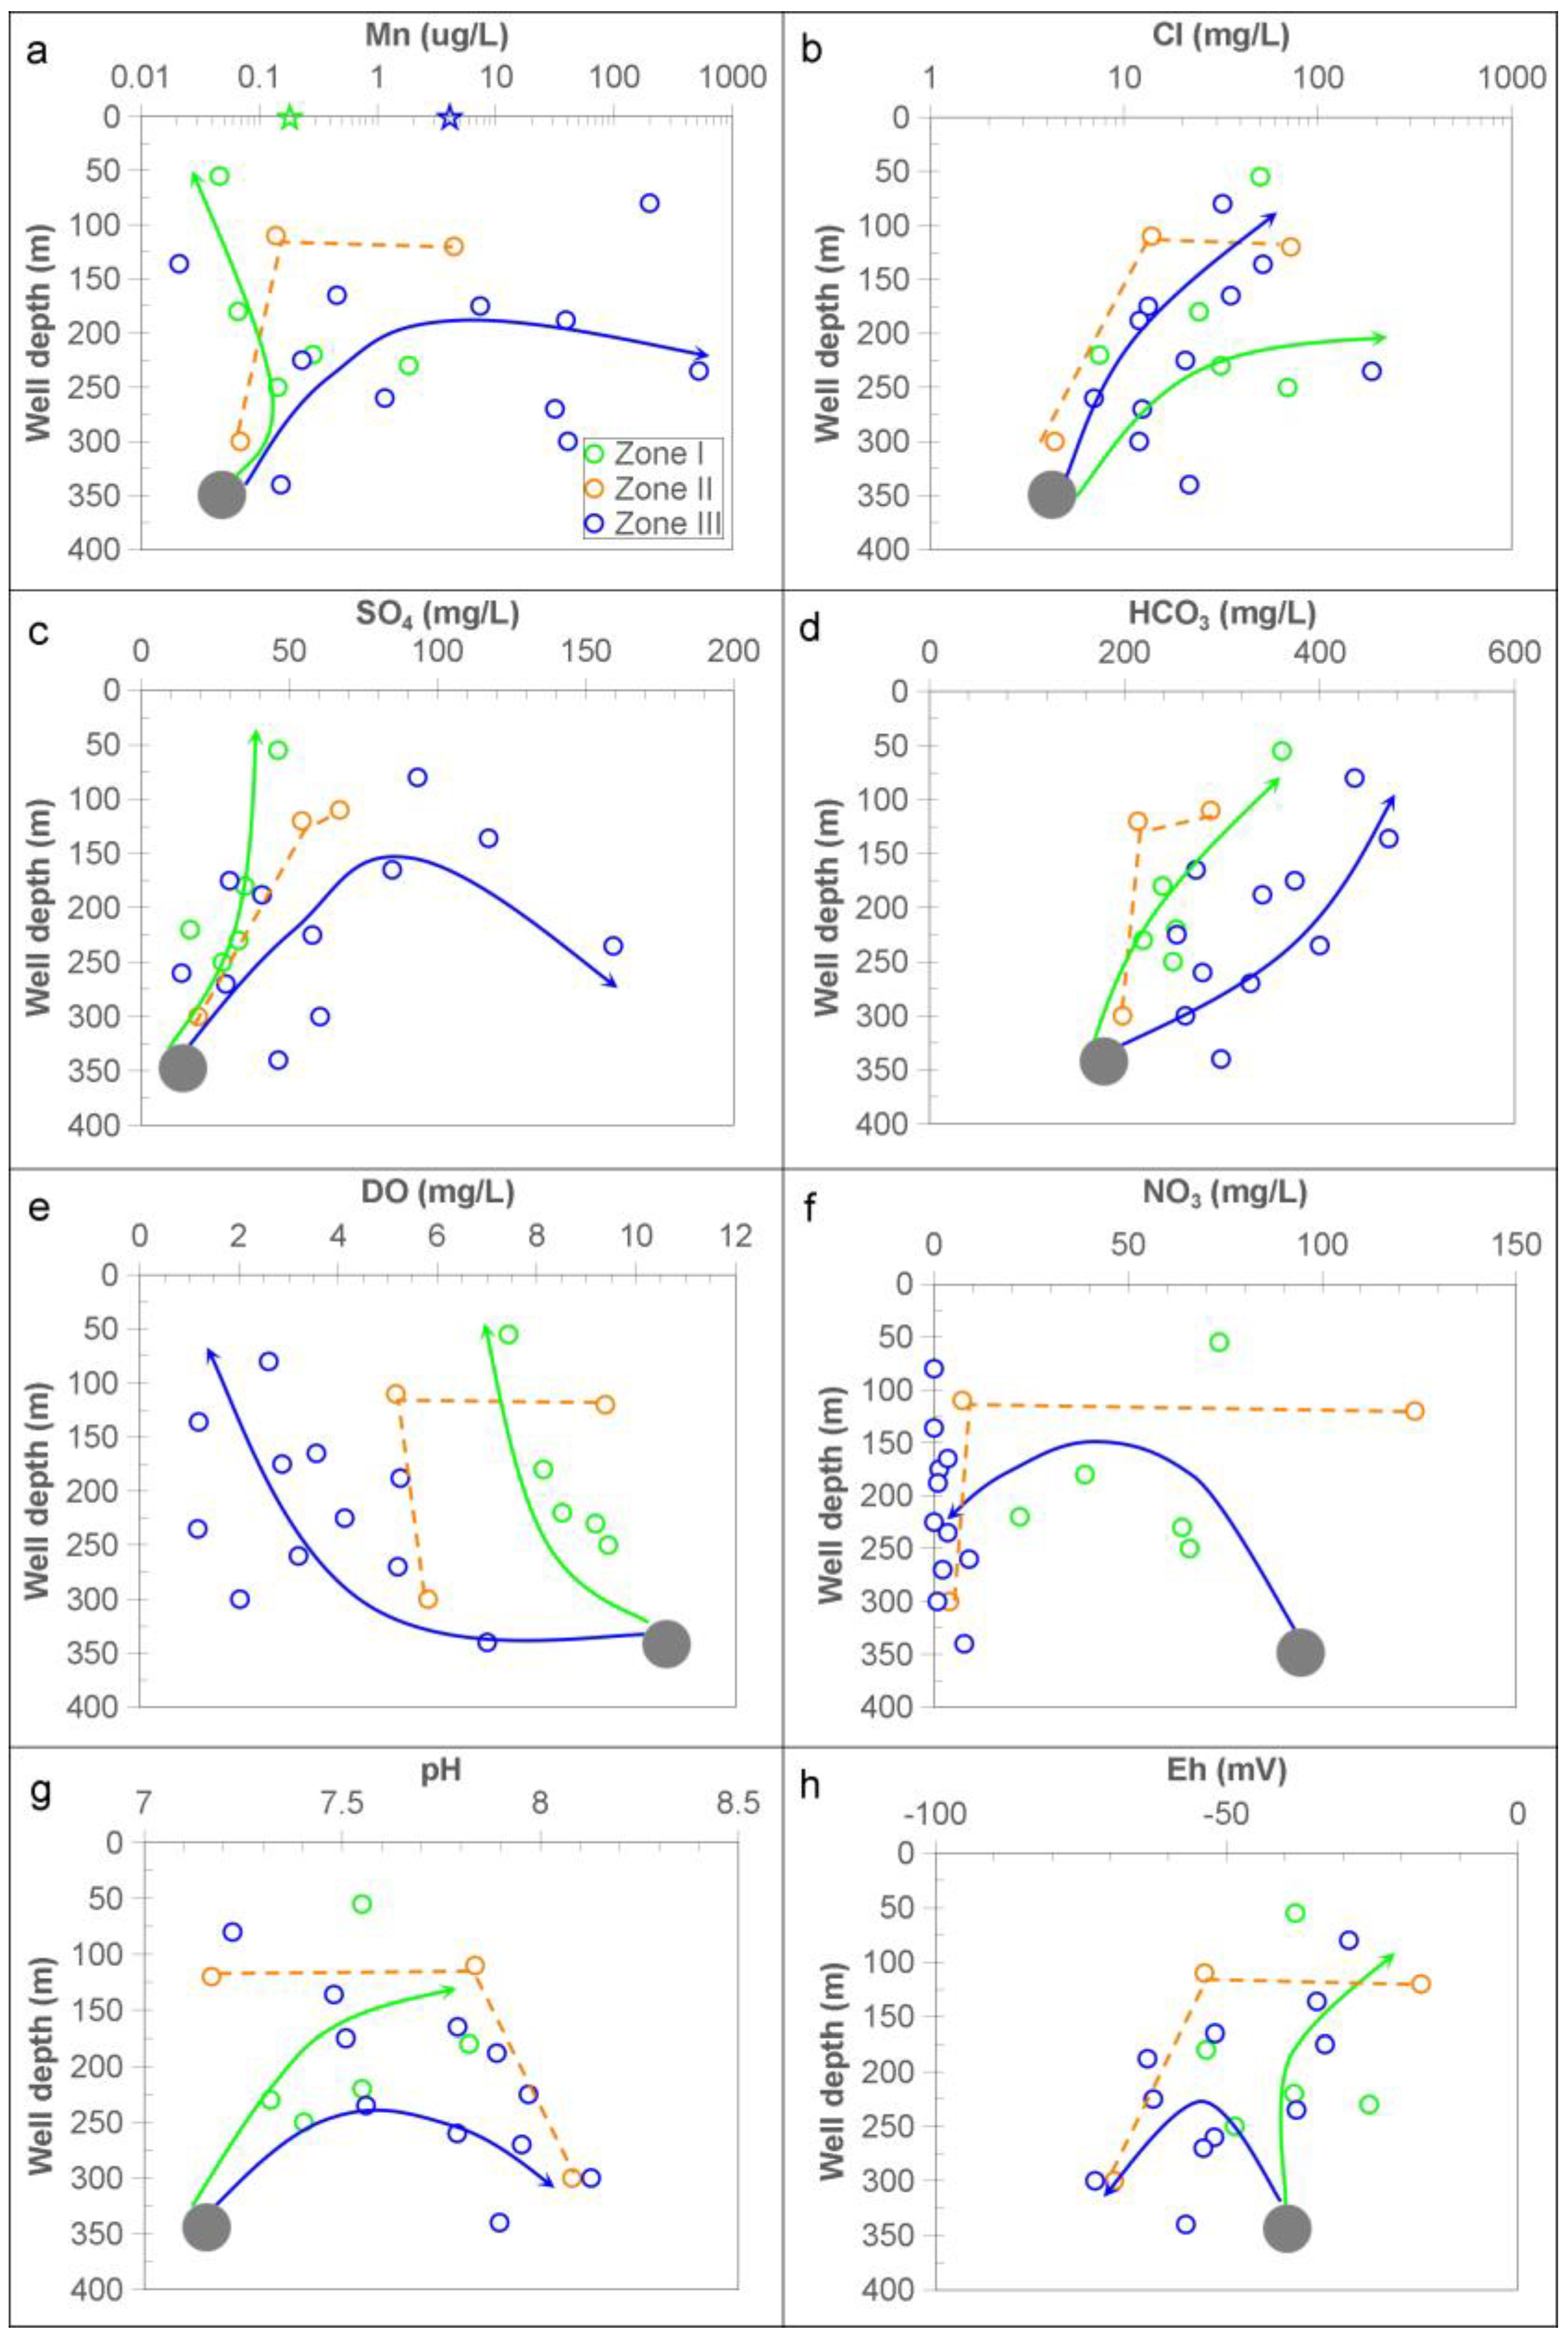
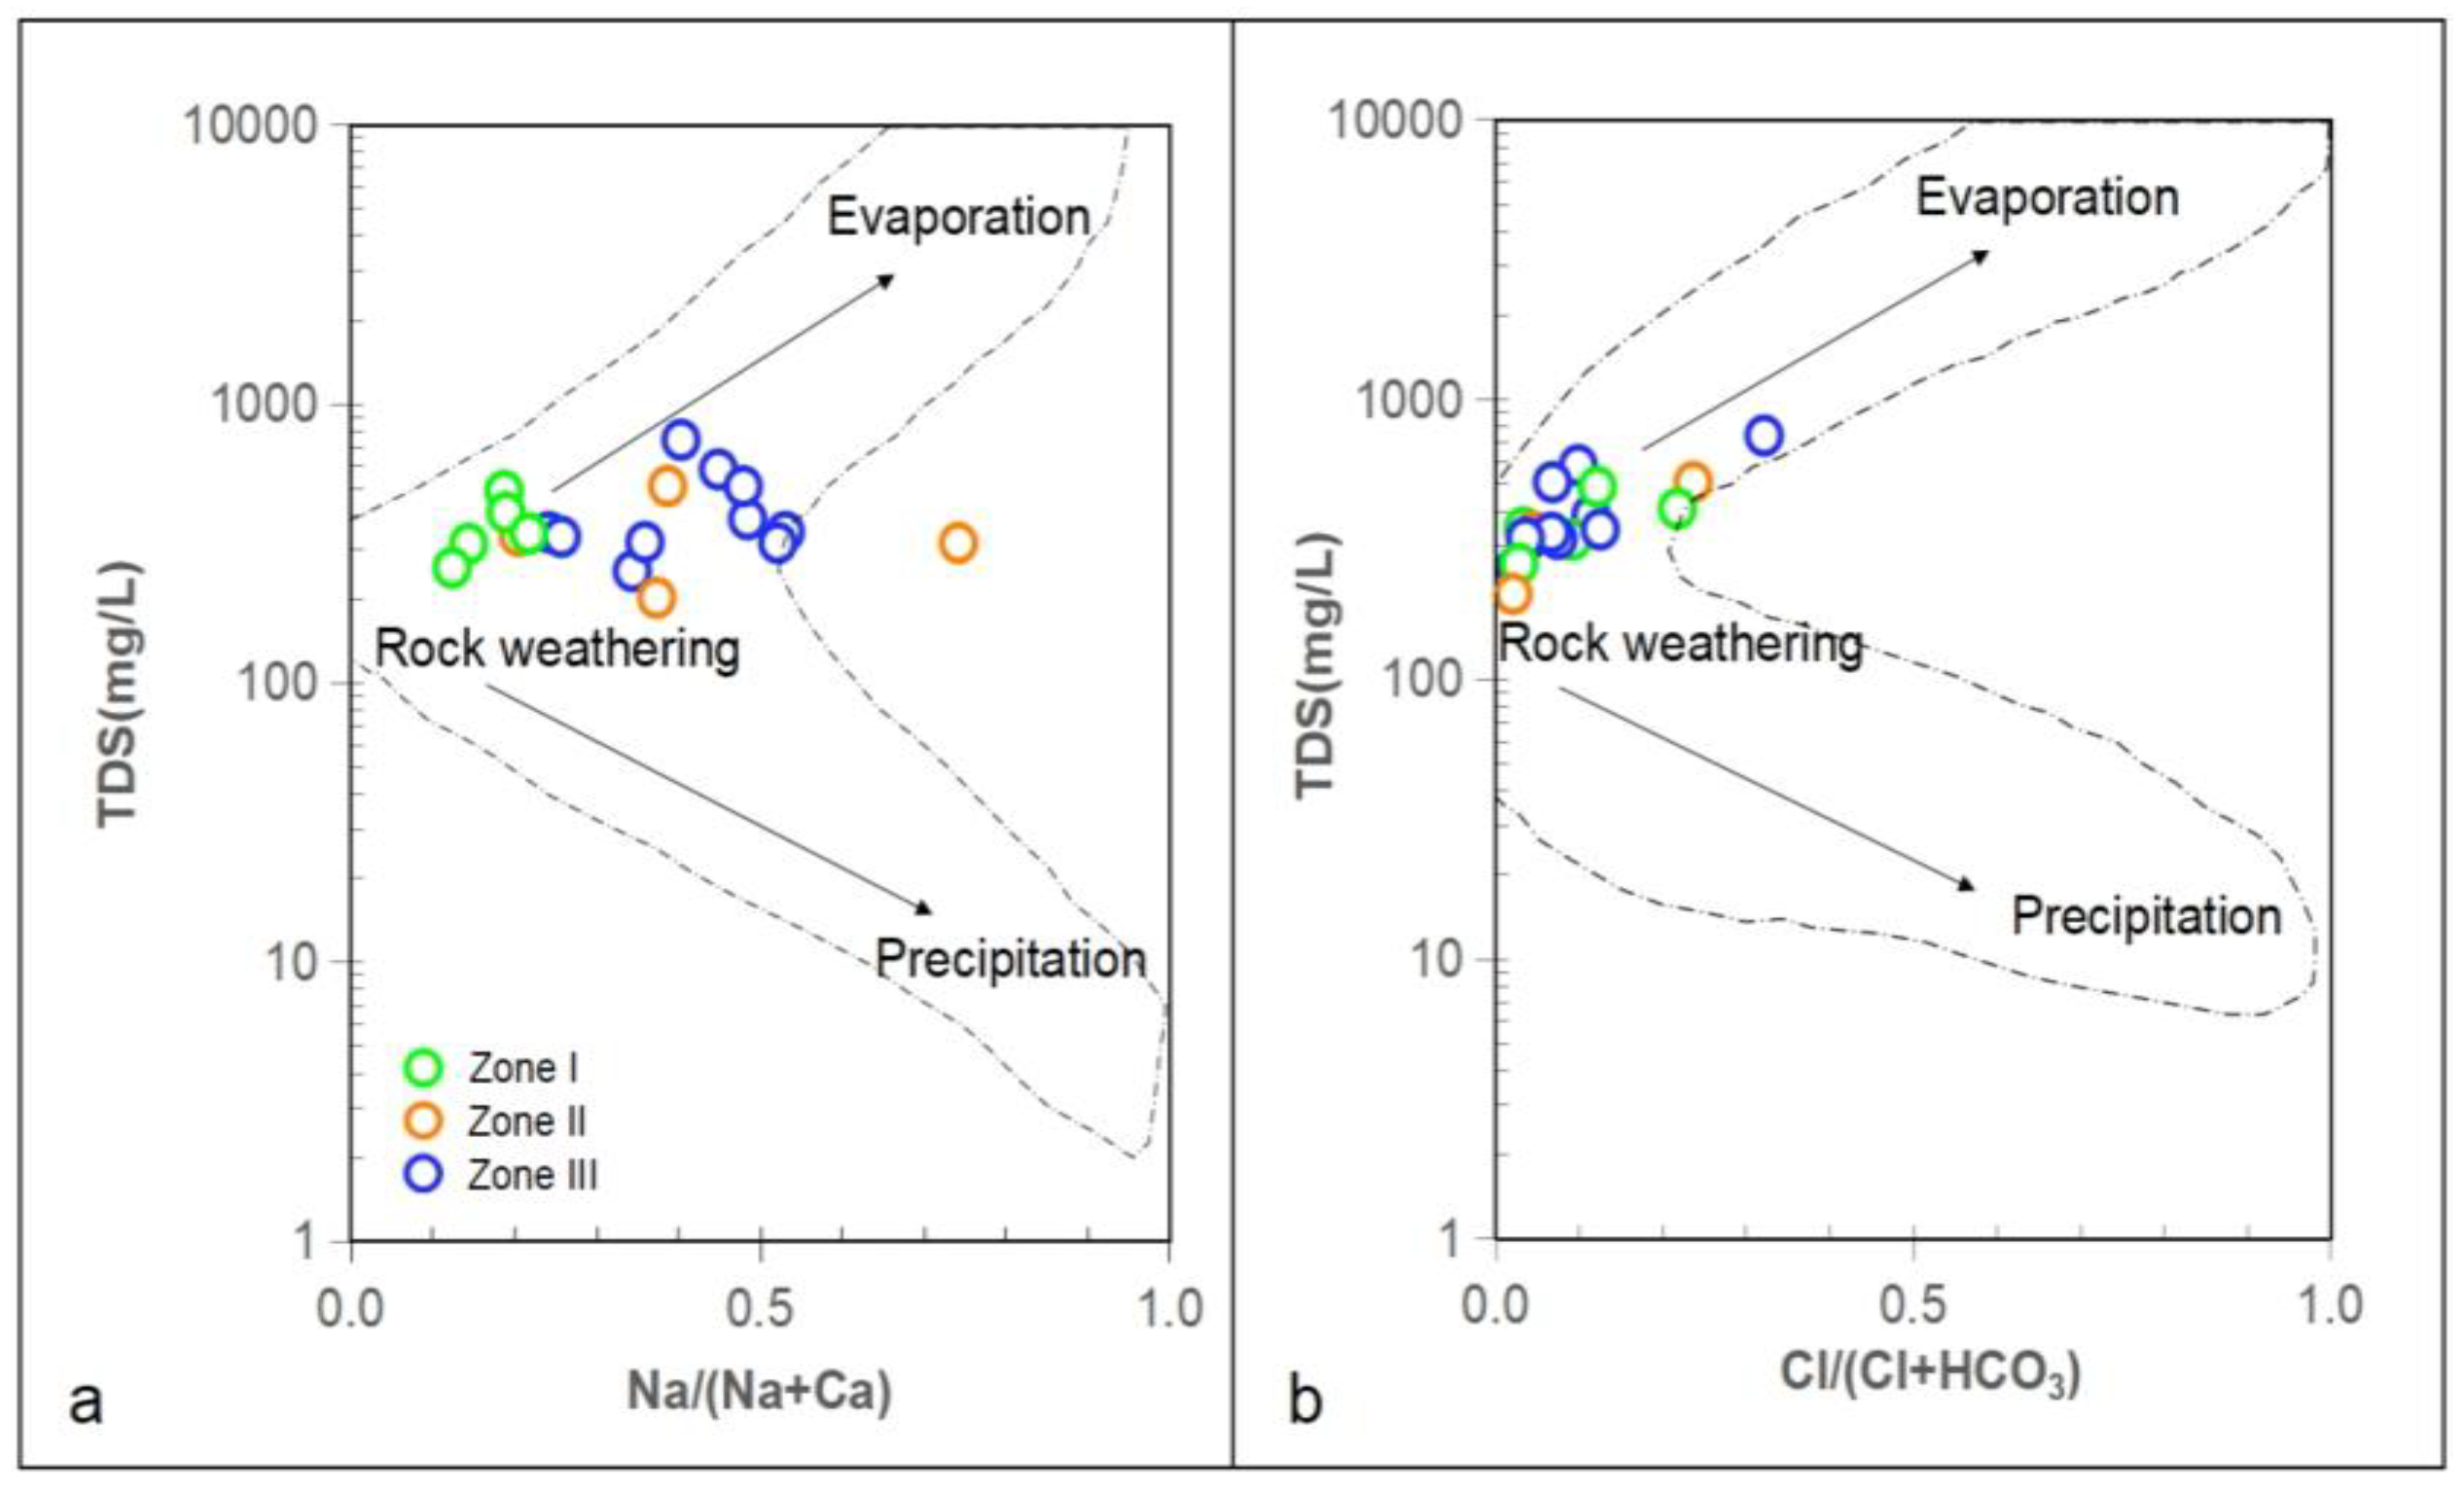
3.1. Hydrochemistry and Groundwater

The physiochemical parameters of the groundwater samples were summarized in Table 2. Most of the hydrochemical parameters were within drinking water quality guidelines. The total dissolved solids (TDS) of groundwater was 238 to 740 mg/L. The pH of the groundwater was in the range of 7.2 to 8.1, with a mean value of 7.6. The value of DO was from 1.2 to 9.4 mg/L. The value of Cl was from 4.4 to 189.9 mg/L. The concentration of SO4 varied from 13.6 to 159.3 mg/L. The value of HCO3 ranged from 190.8 to 470.7 mg/L. Four water types were identified: Ca·Mg-HCO3, Ca·Na·Mg-HCO3, Ca·Mg·Na-HCO3, and Ca·Na·Mg-HCO3·SO4 (Figure 2). Water types varied from Ca-HCO3 (low TDS) in the mountain front recharge area (Zone I) to Na·Mg-SO4 in the lowland plain (Zone III).
The NO3 concentration varied from 0.9 to 123.9 mg/L. Zone I–II groundwater samples had the highest NO3 concentrations, indicating the presence of NO3− diffused contamination (utility of chemical fertilizer). Zone III groundwater samples had the lowest NO3 concentration, without NO3 contamination.
The Mn concentration was found to reach as high as 2 orders of magnitude of groundwater background value. The Mn concentration of the river water (dbs01) was 0.19 µg/L in Zone I, while that of the river water (dbs04) in Zone III was 4.03 µg/L. The Mn concentration in the groundwater of the Quaternary aquifers ranged from 0.02 to 522 µg/L.

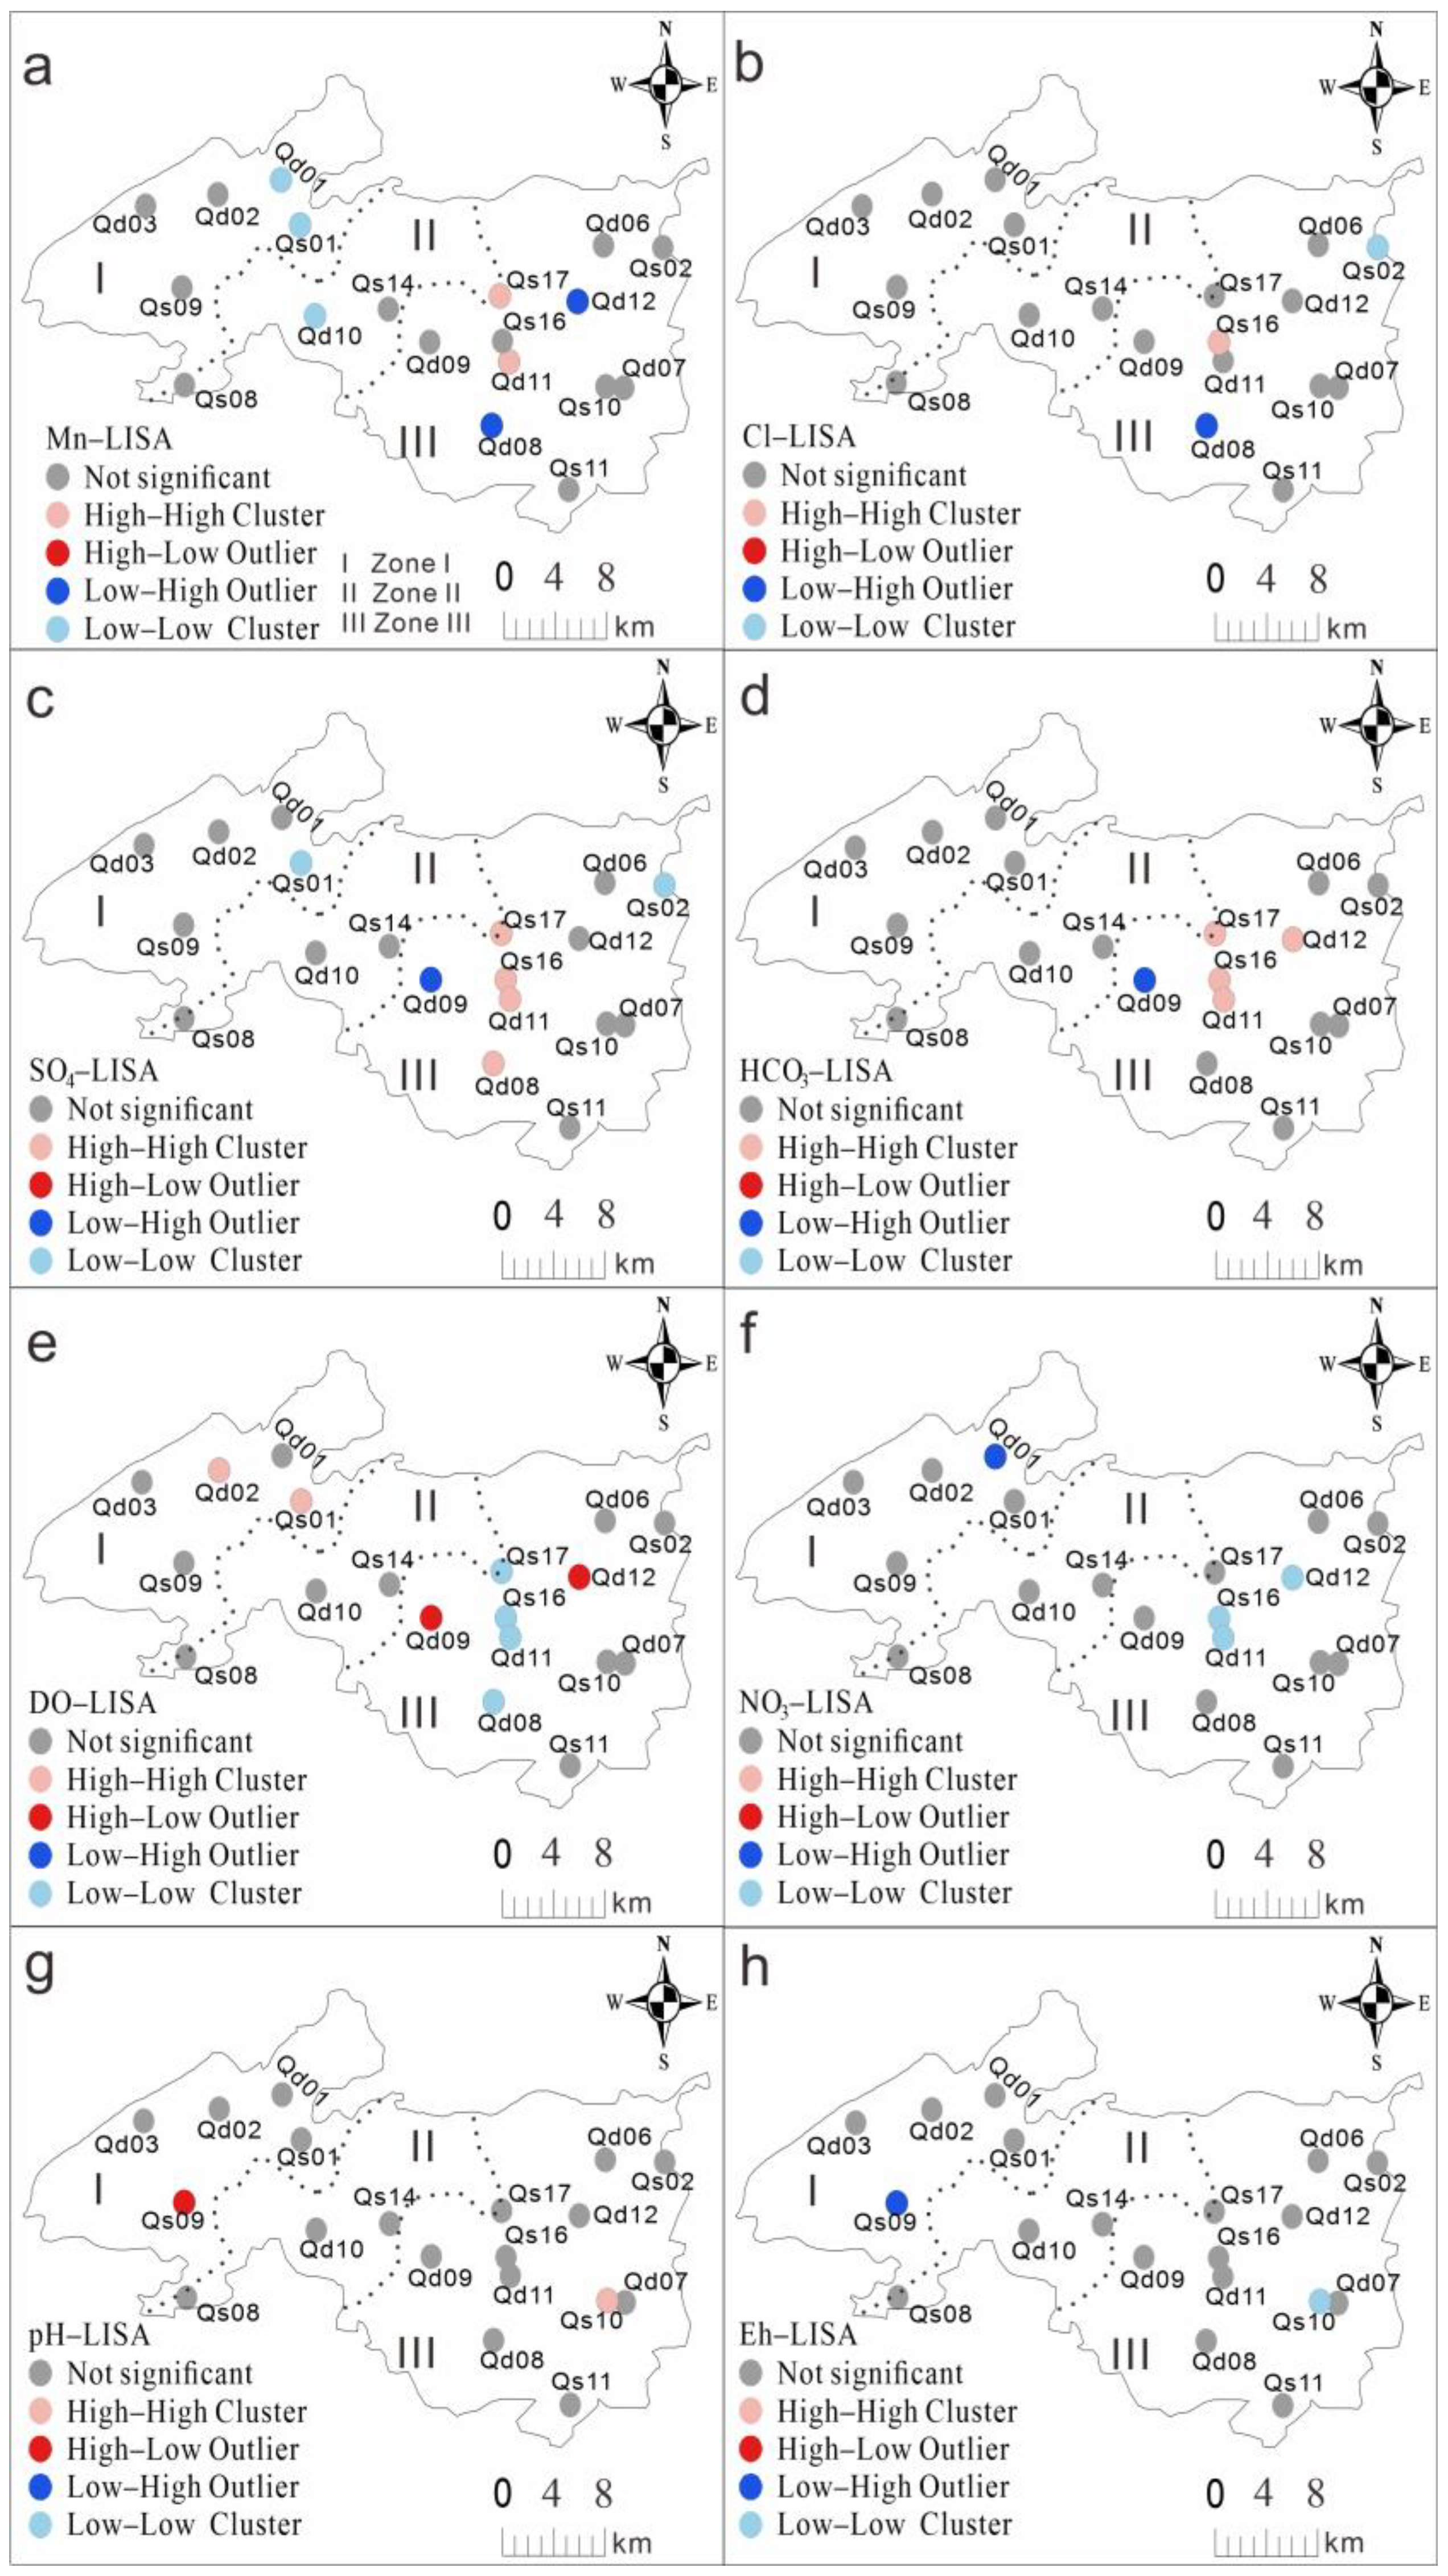
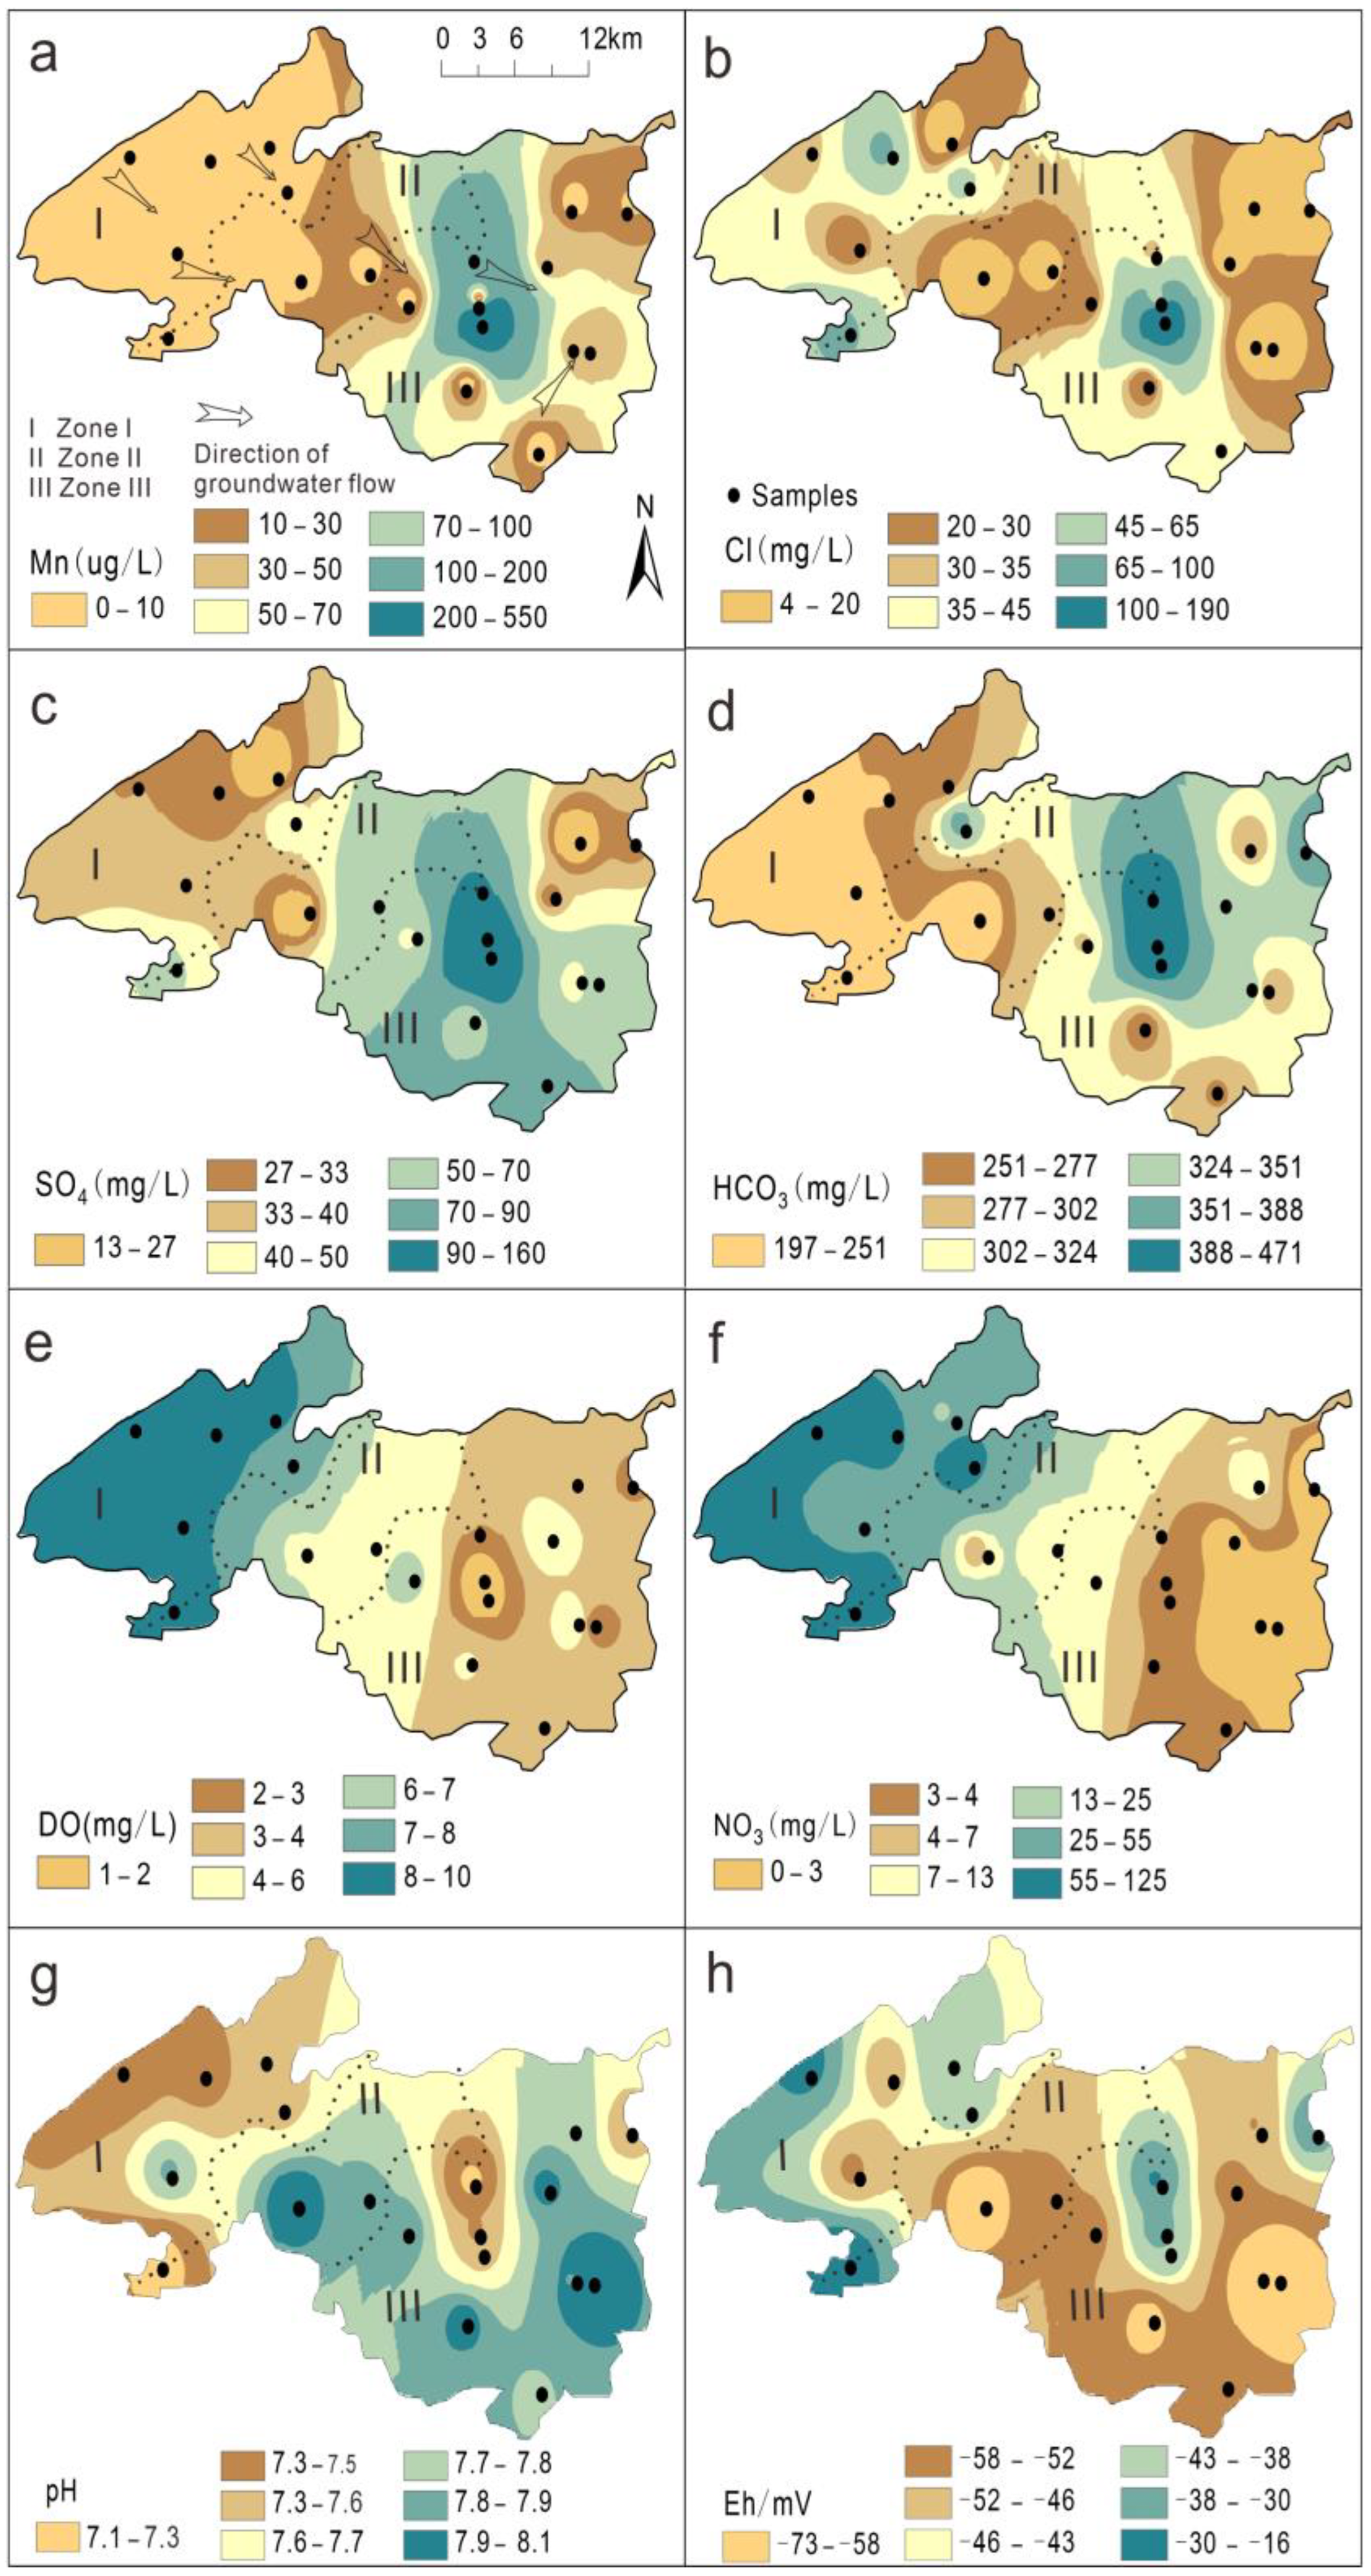
3.2. Spatial Correlation of Data and Ordinary Kriging Interpolation

Spatial correlation of the data was performed to describe both data outliers and environmental contamination as existing spatial clusters before running spatial interpolations. Each hydrochemical parameter in Figure 3 was widely characterized by location to be not significantly attributed to a cluster; this could correspond to groundwater background that represents a relatively natural property. Qs16 (Mn = 0.02 µg/L) of the low Mn concentration caused a spatial disparity in Figure 3a, it is surrounded by several high Mn water samples, is taken as an outlier and does not cope with the analysis of spatial correlation of data. Qd11 (Mn = 522 µg/L) and Qd17 (Mn = 200 µg/L) are high–high a cluster, but Qd07 (Mn = 40.7 µg/L), Qs10 (Mn = 39.1 µg/L), and Qd12 (Mn = 31.4 µg/L) are attributed to a cluster of not significant. When a large range of sample values existed in a neighborhood space, LISA spatial correlation sometimes could not figure out rational categories at a given location.
Sample Qs16 was excluded as an outlier in Figure 3a, Figure 3b–h have all of the samples for analyzing spatial correlation of data. Sample Qd08 has a Cl low–high outlier (Figure 3b). Sample Qd09 has SO4 (Figure 3c) and HCO3 (Figure 3d) low–high outliers. Samples Qd09 and Qd12 have DO high–low outliers (Figure 3e). Sample Qd01 has a NO3 low–high outlier (Figure 3f). Sample Qs09 has a pH high–low outlier (Figure 3g) and Eh low–high outliers (Figure 3h). Six samples show different outliers: low–high outliers of NO3 for Qd01, Cl for Qs02, HCO3 and SO4 for Qd09, Mn for Qs16, high–low outliers of DO for Qd09 and Qd12, and pH for Qs09.
Figure 4 was constructed with ordinary kriging interpolation using Euclidian distance, showing the spatial distribution of hydrochemical parameters. Based on Figure 3, outliers can be checked. Outliers of low Mn concentration have a large influence on categories of spatial cluster; however, other parameters do not seem to have an evident influence. Therefore, Figure 4 present the diagram of spatial distribution of hydrochemical parameters, interpolated with all of the samples in Table 2. Both LISA analyses and ordinary kriging interpolation indicate that Zone III groundwater contains higher levels of Mn enrichment and that the majority of potentially high Mn locations in the east groundwater depression cone (Figure 1b, Figure 4) are associated with elevated Cl, SO4, and HCO3 concentrations, high pH values, low DO values, and low NO3 concentrations.
Figure 5 presents the relationship of between well depth and hydrochemical parameters. Zone I is located nearest to the mountain front, and aquifers mainly consists of coarse-grained sands and less clay layers; it is taken as a single aquifer. Zone I can be regarded as a place with an initial direct recharge of rainfall and stream flows, and as an end member mostly composed of groundwater with low residence time. The initial hydrochemical end member is determined according to both Zone I groundwater and surface water nearby. One large difference in hydrochemistry: Zone III has less direct recharge, and is attributed to flow path and discharge place due to the heavy withdrawal of groundwater. Hydrdochemical compositions of the initial recharge water are assumed with the highest DO and NO3 (Qd01, Qd02, Qd03), and lowest Cl, SO4, and HCO3 (dbs01) referring to the nearest samples close to the mountain front in the recharge zone (Zone I). Qd03 is located closest to the mountain front, with the well depth of 230 m; Qd02 was taken from a well 250 m deep. According to trending scatter points in Zone I–III and the distance from the mountain front, the initial end member is rationally settled at a depth of c.a. 350 m (gray circles in Figure 4). Groundwater chemistry logically begins with the newest recharge water, since the recharge defines the initial flow conditions of the aquifer system. We can see that Zone I groundwaters have hydrochemical characteristics of shallow groundwater, and Zone III groundwaters are characterized the hydrochemistry of deep groundwater that features interior chemical evolution. Low Mn groundwater in Zone I, where modern recharge is dominated, excludes the Mn sources of new recharge. Mn concentrations were not related to well depth and this indicates that the Mn source is unrelated to potential surficial rock weathering. High Mn in Zone III is a product of internal reactions (no sources of anthropogenic pollutants and surficial weathering).
There are three water samples in Zone II; hydrochemically, sample Qs08 is close to the water in Zone I, and samples Qd10 and Qs14 are closer to the water in Zone III. In fact, three samples of Zone II can be absorbed into Zone I and Zone III, according to groundwater hydrochemistry. The advantages to having Zone II are the following two: one is to presents Zone I and Zone III, which are two subsystems of a unique aquifer; another is to present the change in the natural hydraulic connection and hydrochemical evolution between Zone I and Zone III. Zone II represents a transitional zone between Zone I and Zone III in hydrogeology and hydrochemistry.

3.3. Potential Mn Sources

The dissolution of rocks and Mn-bearing minerals is an important source of Mn in groundwater [19,21,51], e.g., MnCO3 (rhodochrosite) + CO2 + H2O = Mn(HCO3)2. As listed in Table 1, the Mn content in sediments of the study area is 593 mg/kg [52], similar to that of the earth’s upper continental crust (650 mg/kg) [13], providing sufficient material basis for Mn in groundwater.
Figure 6 shows that sample points were close to the region of rock weathering in the Gibbs diagram of TDS versus Na/(Na+Ca) and Cl/(Cl+HCO3), indicating that rock weathering could occur. However, considering that Mn was enriched only in Zone III, elevated concentrations of Mn in groundwater could be not significantly controlled by both rock weathering processes and soil releasing.
On another hand, Mn in groundwater can origin from river water, though leakage to recharge the vadose and aquifer [3,7,20,53]. As a result, in areas where river water dominates groundwater recharge, the river water could control initial groundwater chemistry. In the Changping area, groundwater is mainly recharged with rainfall, and less so by river water due to zero flow for most streams and rivers in a year. River water was not a critical factor here controlling Mn in groundwater due to its low concentrations of Mn (0.19 µg/L) in the recharge area (Zone I) and low Mn of 4.03 µg/L for treated water flowing over Zone III. In addition, at a relatively far distance from the recharge area, Zone III has lower hydraulic conductivity due to high clay content. Heavy groundwater abstraction has resulted in a wide and deep depression of the water level in a large area, which could change physiochemical conditions in groundwater systems, e.g., a more reduced environment than Zone I and Zone II, and a change in Mn species.
No direct anthropogenic activities were observed to influence the Mn concentration of groundwater. Almost all living and industrial wastewater is discharged after handling in wastewater treatment plants. The wells used to gather water samples are used as drinking water supplies and drawn continuously every day. This can exclude effects from pump and casing steel tubes.

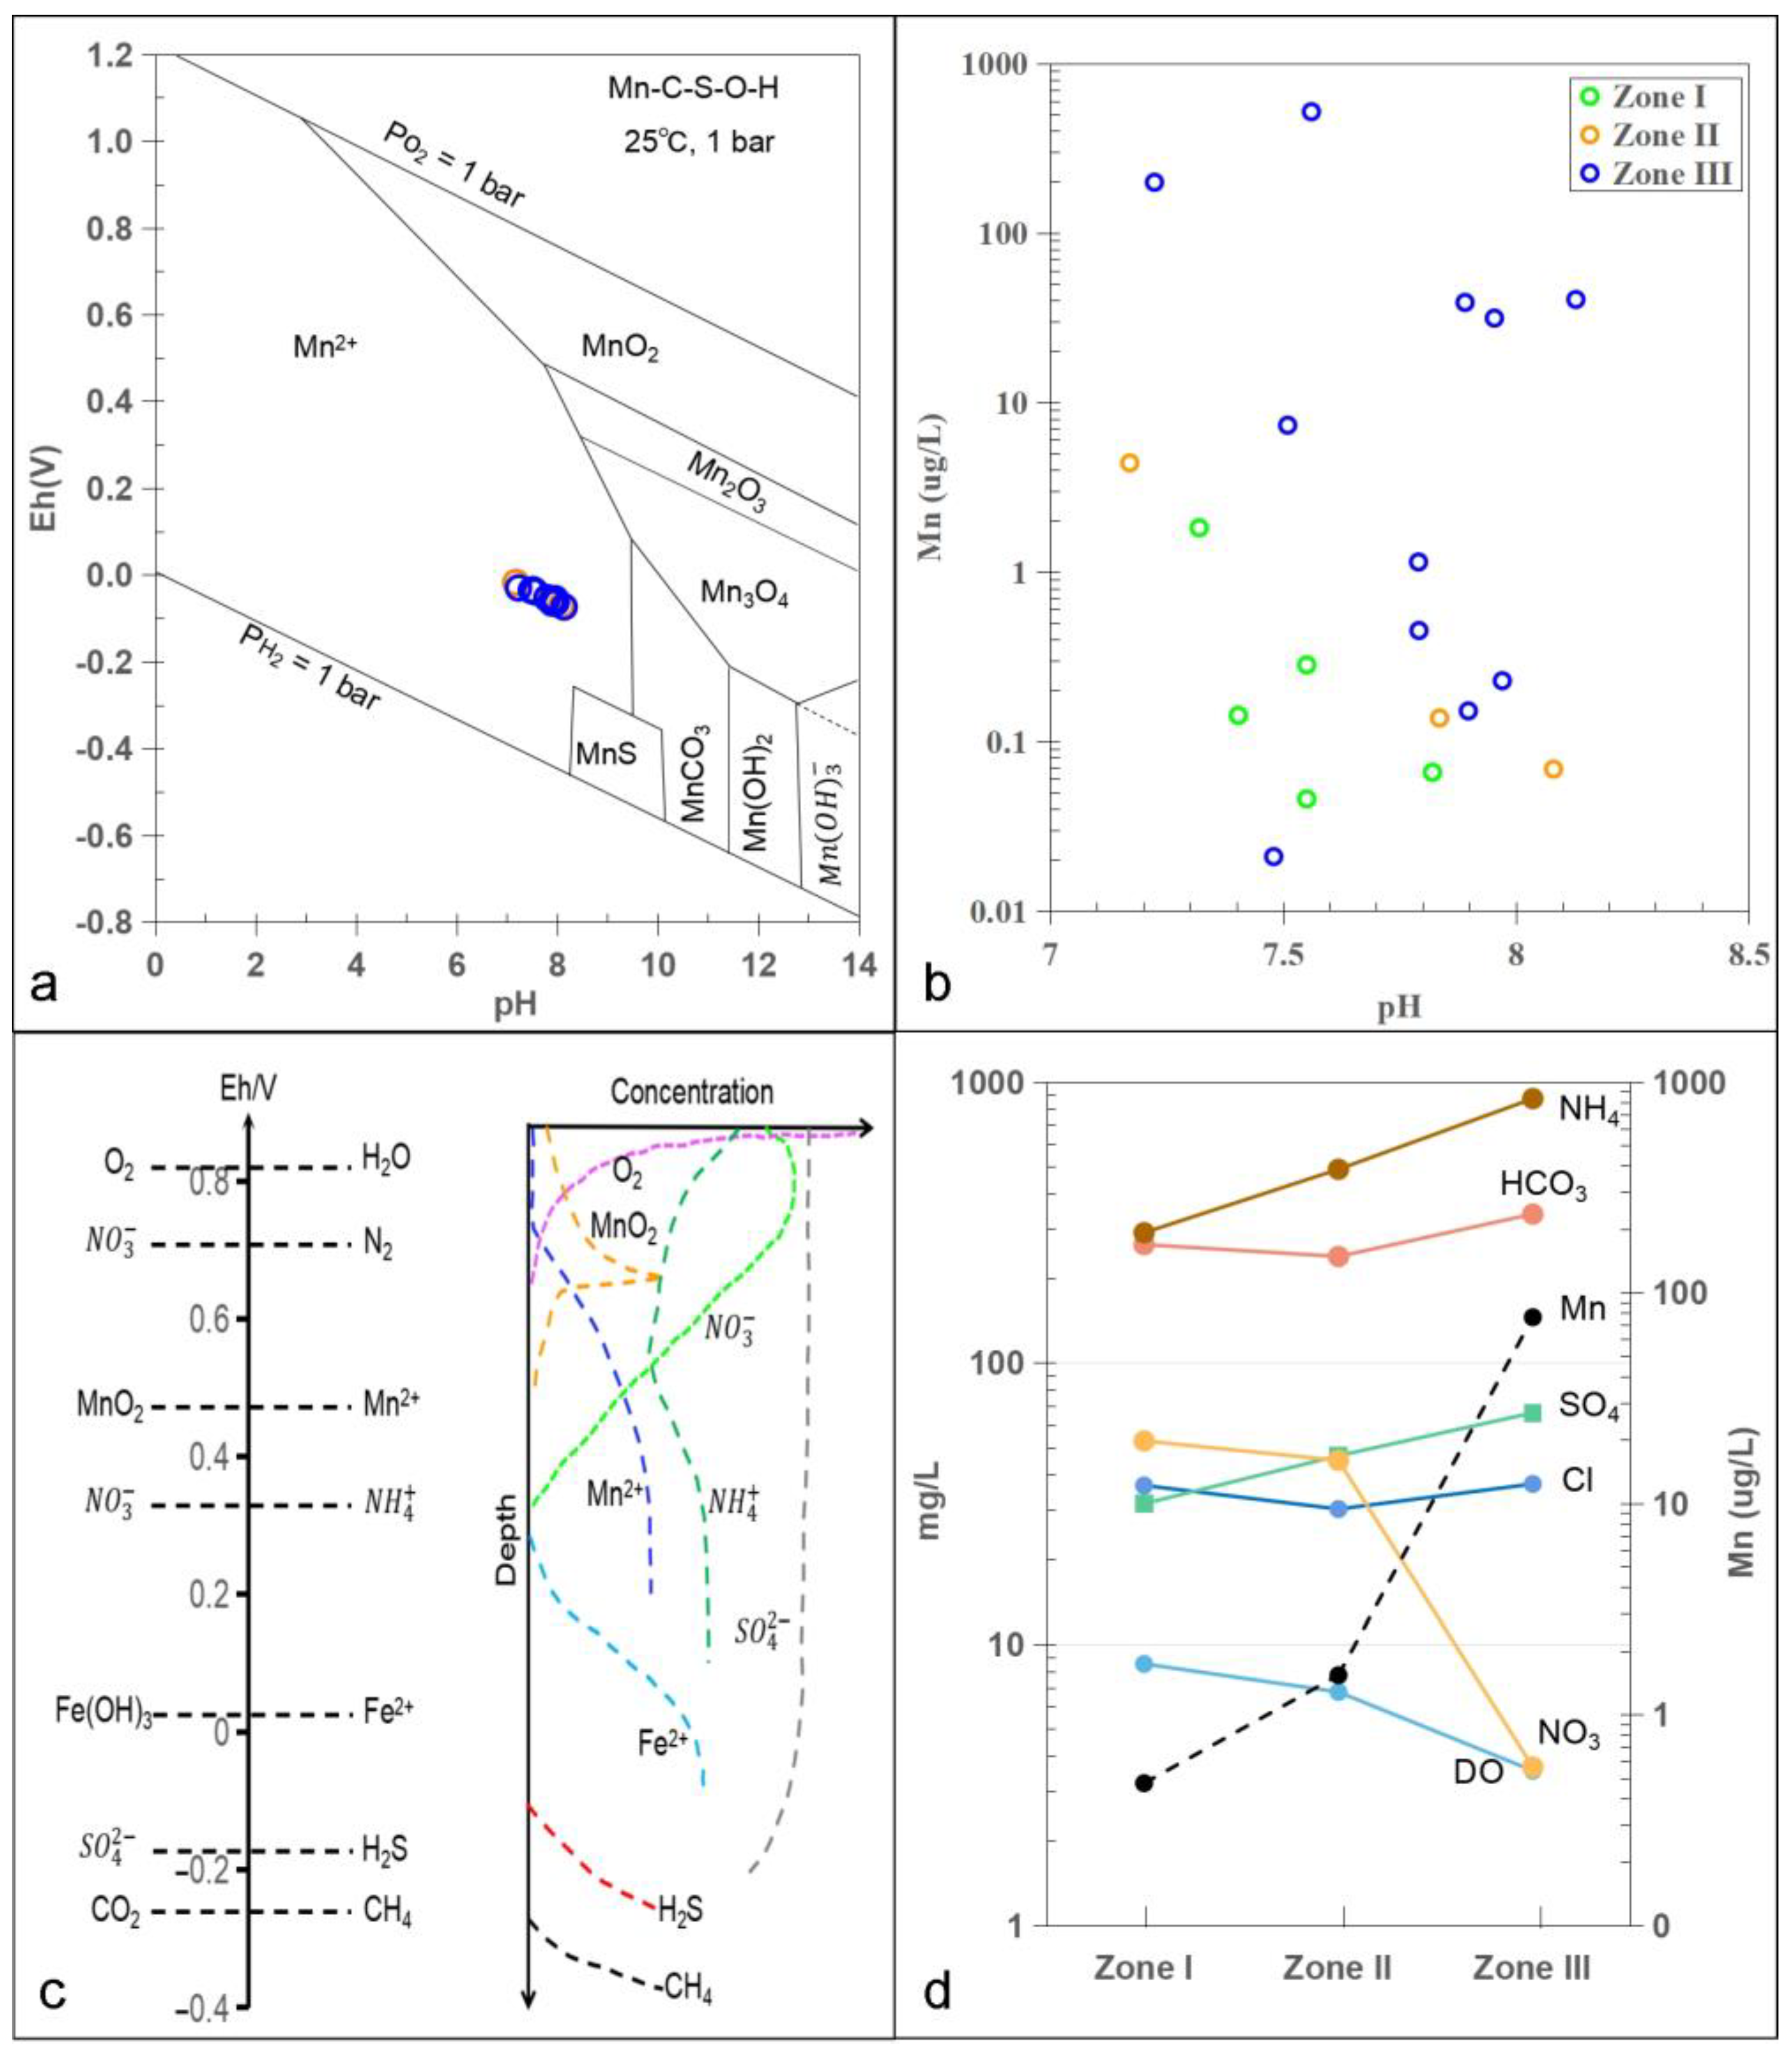
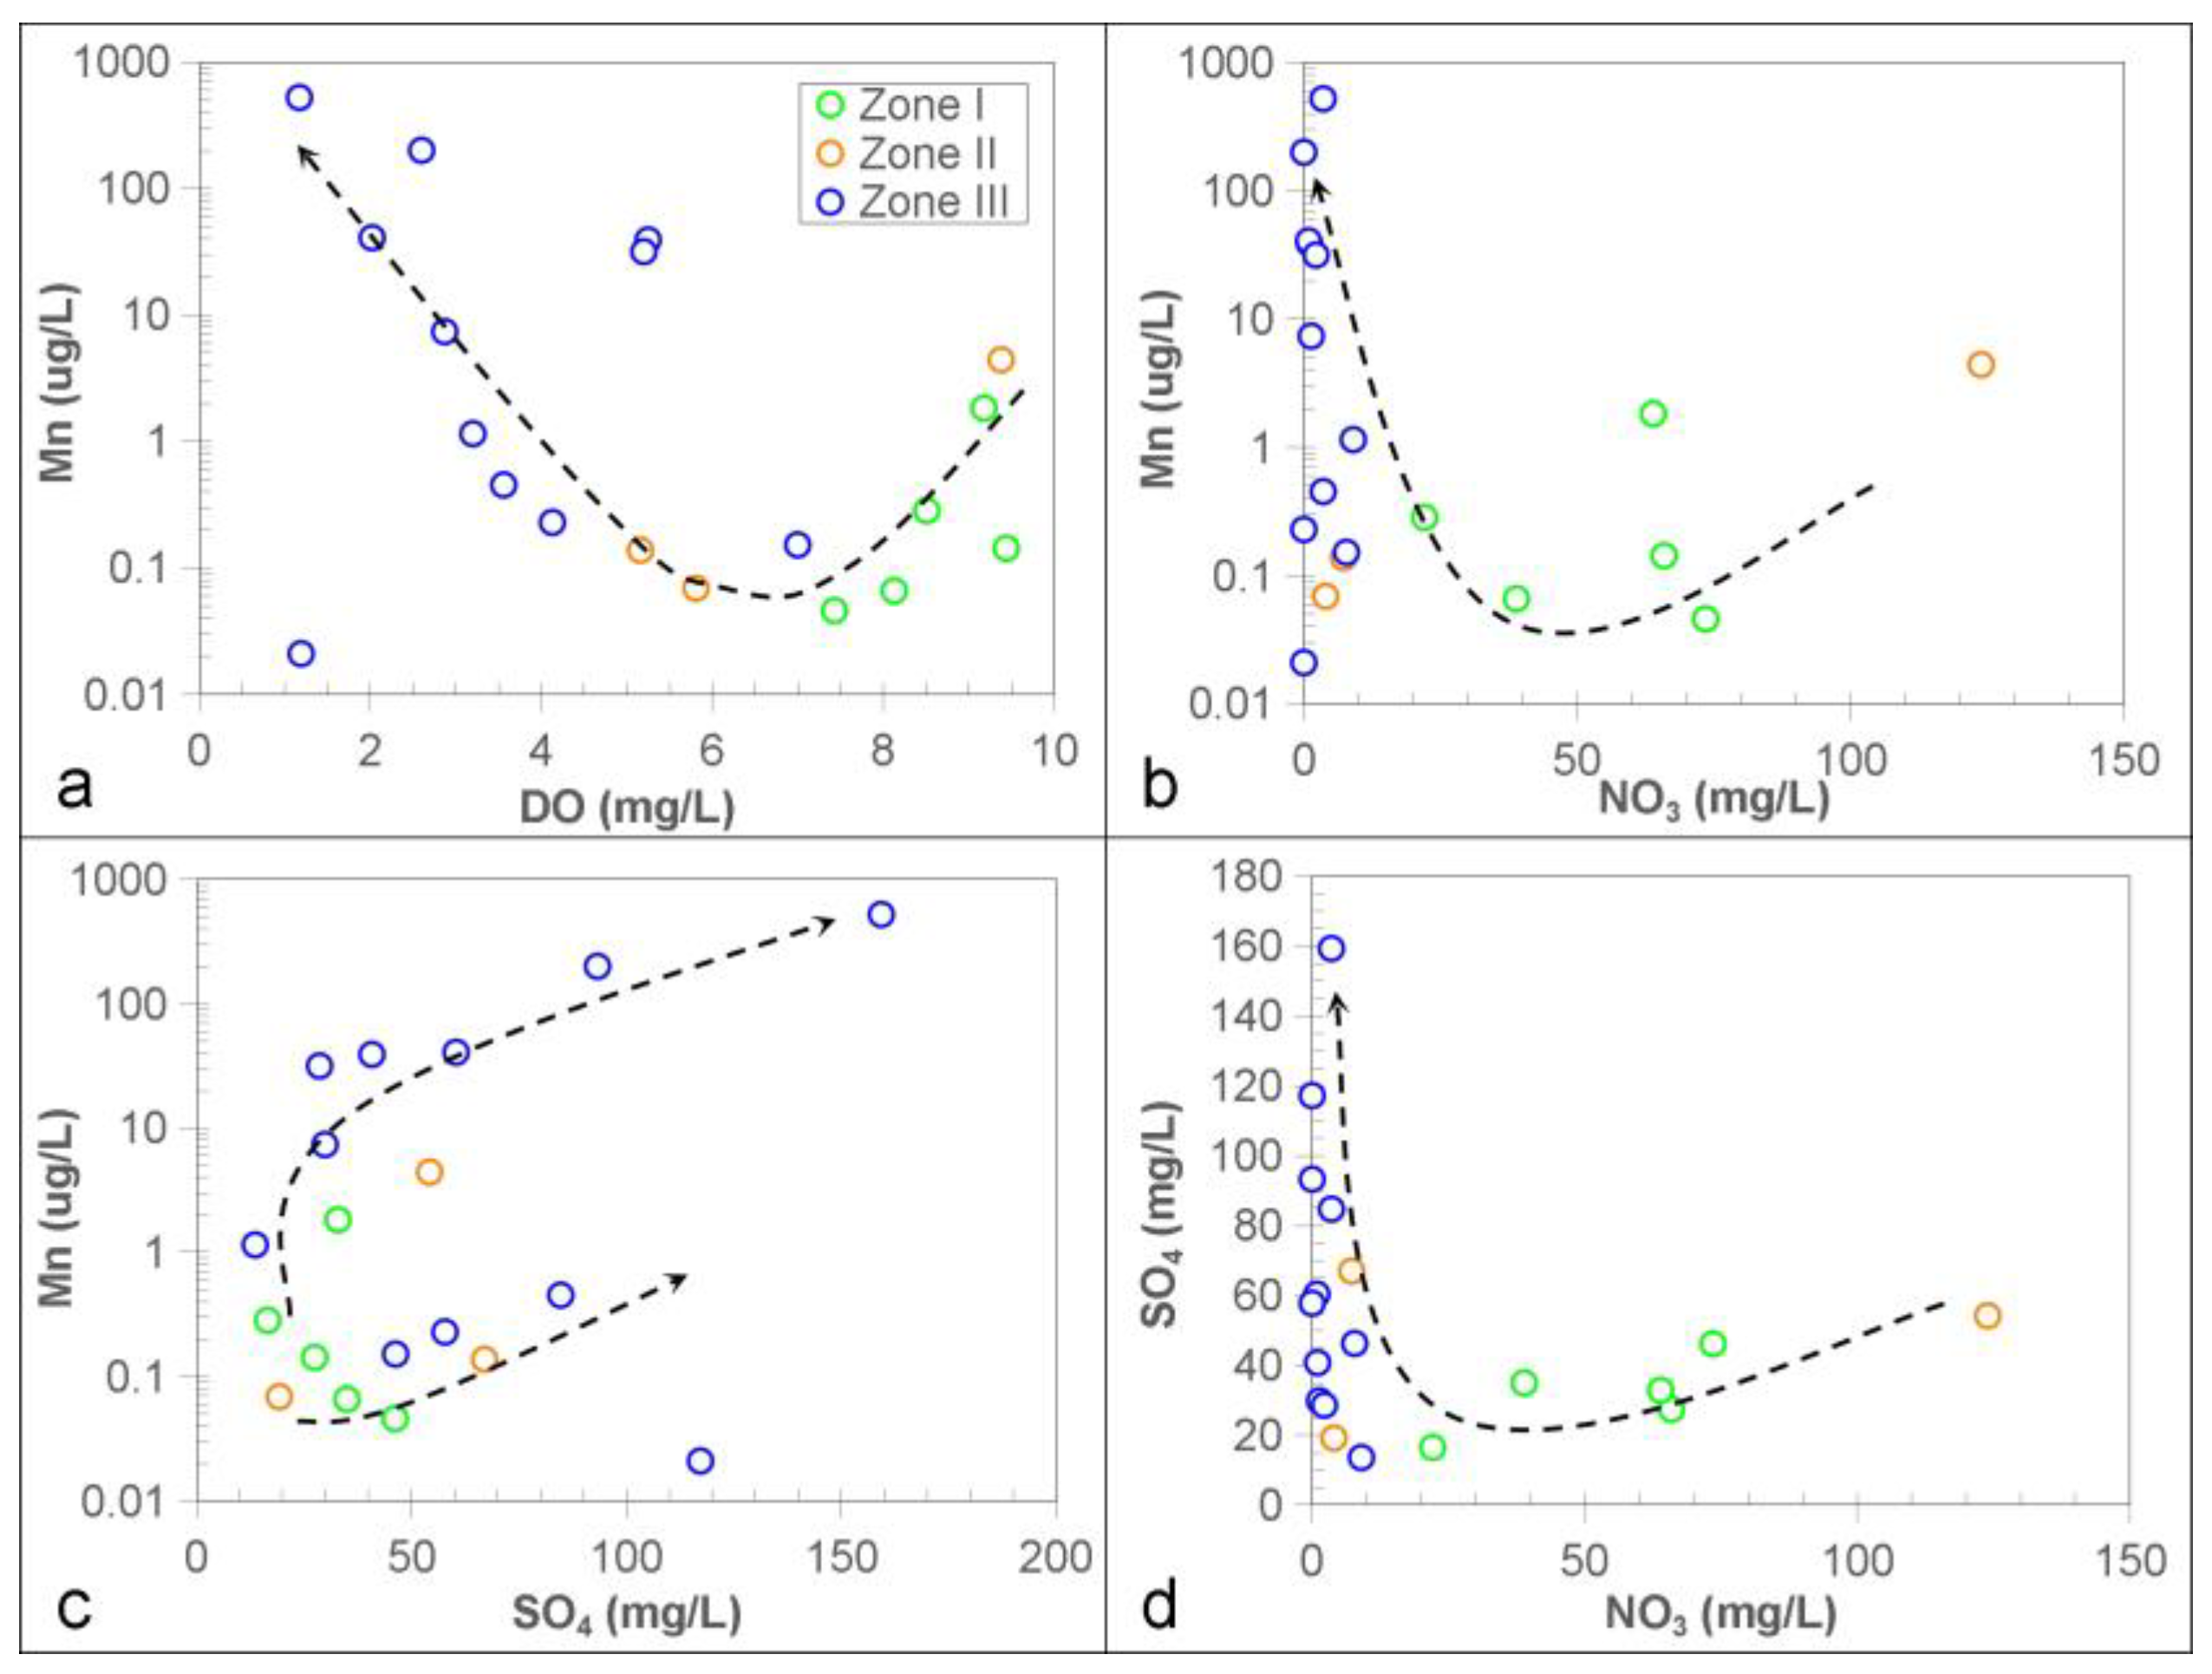
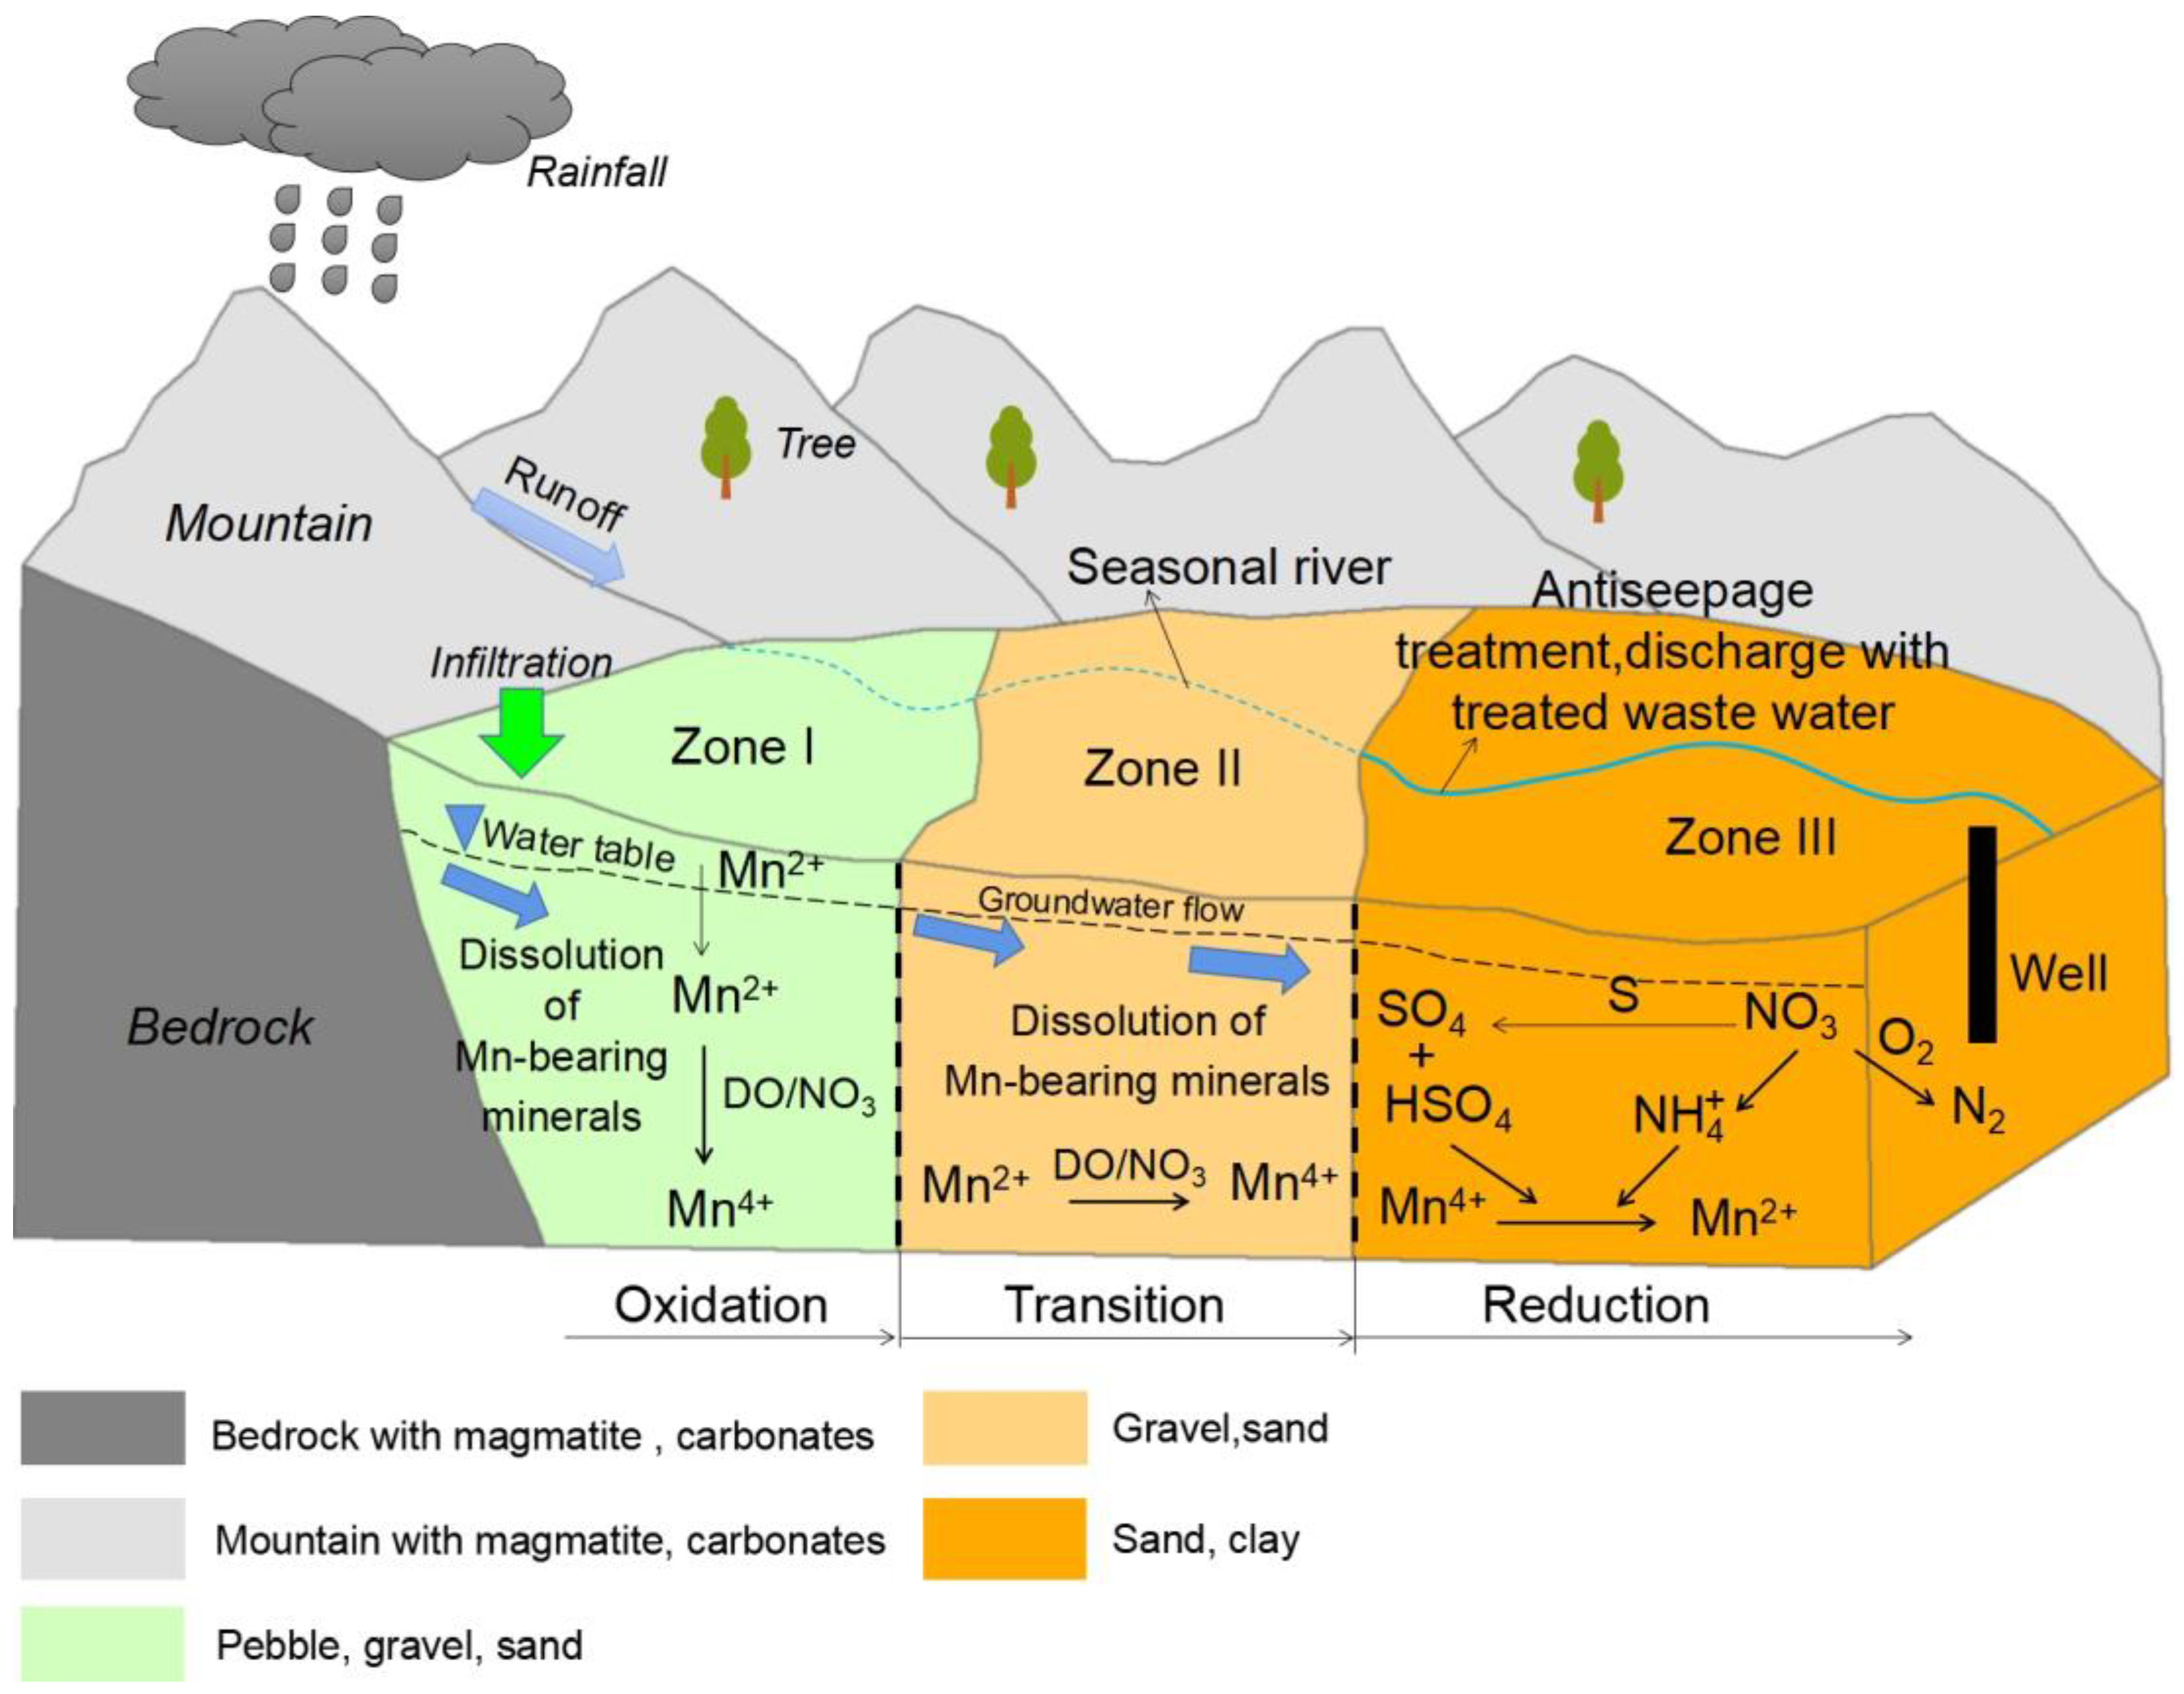
3.4. Redox Conditions for Controlling Groundwater Mn

The Eh–pH diagram shows the thermodynamic stability areas of different species in an aqueous solution without considering reaction rates or pathways [54]. It is helpful to explore the conditions under which mineral formation/dissolution take place in terms of a function of pH and Eh scales. As shown by previous reports [19,22,23], at lower pH values, Mn occurs mainly as the reduced soluble Mn2+, but it is rather unstable in neutral weak alkaline solution and can be easily oxidized into oxides or hydroxides [20,24].
Figure 7a is a diagram of Eh–pH constructed for the Mn-C-S-H2O system. All water sample points are plotted into region Mn2+ with pH < 8.5. The Mn concentration in groundwater appears to present an inverse relation with pH; however, low–high Mn concentration could develop in a similar pH range (Figure 7b). Figure 7c qualitatively shows that Eh decreases with an increase in depth.
As shown in Figure 8a, increasing Mn concentration is associated with decreasing DO in groundwater. High DO and low Mn concentration of oxidized condition in Zone I demonstrated an insignificant dissolution of Mn oxides [22], or the occurrence of soluble Mn2+ transforming into the insoluble Mn4+ in forms of oxyhydroxides or oxides as indicated with Equations (1) and (2) [12,14,24,55,56]. In Zone III, low DO and high Mn concentration could also be associated with a reduction environment and increase in soluble Mn2+ (Figure 7c).
4Mn2+ + O2 + 6H2O → 4MnOOH↓ + 8H+
2Mn2+ + O2 + 2H2O → 2MnO2↓ + 2H+
Figure 7. (a) Eh–pH diagram in the Quaternary water for part of the system Mn–C–S–O–H. (b) The relationship of between pH, Eh, and Mn in groundwater. (c) Electrode potentials of various redox couples and their concentration changes with depth in groundwater, modified from [56,57,58,59]. (d) Variation of N H 4 + , H C O 3 , Mn2+, S O 4 2 , Cl, N O 3 , and DO from Zone I to Zone III, where the units of H C O 3 , S O 4 2 , Cl, N O 3 , and DO are mg/L, with µg/L of N H 4 + and Mn2+. N H 4 + data [26].
Water 15 01537 g007
Zone III was relatively reduced and groundwater was low NO3 and high Mn (Figure 7d and Figure 8b), showing that denitrification could occur in association with Mn reduction in groundwater.
Zone I was relatively oxidized and groundwater was high NO3 and low Mn. NO3 may slightly be involved in the transformation of Mn2+ to Mn4+ in the reaction of Equation (3) [53,56,60].
2 N O 3   +   5 Mn 2 +   +   4 H 2 O     5 MnO 2   +   N 2 + 8 H +
In contrast, Zone III was more reduced and groundwater was low NO3 and high Mn. This environment may accompany high NH4 (Figure 7c), since reduction conditions would promote the dissimilatory of NO3 to NH4 [61]. In the conditions of reducing environment and NH4, Mn oxides would dissolve and produce soluble Mn2+ for the reaction of Equation (4) [56,62].
3 MnO 2   +   2 N H 4 + + 4 H +     3 Mn 2 +   +   N 2 +   2 H 2 O
Sulphur could participate in the process, as indicated by the relationship between increasing Mn and SO4 with decreasing NO3 (Figure 8c,d). High concentrations of SO4 in groundwater could result from pyrite oxidation by the Thiobacillus denitrificans bacteria [63]. Autotrophic denitrifying by bacteria such as Thiobacillus denitrificans is more likely to occur [64,65,66] (Equation (5)).
5 S + 6 N O 3 + 2 H 2 O     3 N 2   +   S O 4 2 + 4 H S O 4
In this case the production of HSO4 makes groundwater acidic and moves the balance between Mn2+ and Mn4+ toward Mn2+, elevating Mn concentrations in groundwater.

3.5. Implication for Groundwater Environment and Management

Mn concentrations in groundwater are modulated by natural processes sequencing: (1) Oxidative accumulation of secondary Mn oxides that release Mn from Mn-bearing primary mineral phases by water–rock interaction (rock weathering) in oxidative environments/O2-bearing zones in Zone I and II; (2) Reductive dissolution of the Mn oxides in reductive environments/O2-depleted zones in Zone III (Figure 9).
Mineral dissolution in aquifers acts as an important driver in Mn distribution in groundwater. The distribution of Mn in groundwater is spatially heterogeneous in the Quaternary porous aquifer in Changping plain. Groundwater with Mn concentrations below 50 µg/L are widespread, but groundwater with concentrations above 100 µg/L (522 µg/L at maximum) are only clustered within Zone III where hydraulic conductivity, DO, and Eh are low. We could see that some parameters such as clay content; low hydraulic conductivity; and low DO, NO3, and Eh could be useful indicators to predict the location of high-Mn-concentration groundwater in porous aquifers, where people are at risk of exposure.
Natural hydrologic and geochemical conditions would be modified by groundwater abstraction lowering the groundwater table and changing the redox environment. Groundwater abstraction could result in O2-depleted reductive environments in aquifers with high clay content. High Mn in groundwater totally clustered in Zone III indicates that physiochemical conditions changed by human activity have the potential to impact the magnitude, extent, and location of Mn mobilization to groundwater. Three processes may be related to the Mn upper-limit concentration at a relatively low magnitude in groundwater (<50 µg/L): (1) Near surface processes can be ignored due to deep unsaturated zone (>20 m). (2) NO3 may modulate Mn2+ and depress Mn concentration in groundwater. (3) Decreasing the groundwater abstraction in recharge areas could expand the scope of newly replenished water and depress Mn concentration in aquifers.
Integrated studies that account for the processes spanning the whole groundwater systems are essential for predicting and managing elevated concentrations of Mn, and other contaminants in groundwater. Finally, from a practical viewpoint, Mn concentrations in well water extracted from porous aquifers could be minimized by decreasing the abstraction of groundwater in recharge areas, so that high-DO freshwater can flow downward. Extended investigation is necessary, in order to determine spatial distributions and exposure to Mn in the groundwater of Quaternary porous aquifers.

4. Conclusions

The Mn chemistry of groundwater in Quaternary porous aquifers was investigated in this study. Mn in the groundwater increased from low values (up to 1.9 µg/L) in the piedmont plain up to more than 100 µg/L downstream in the lower plain. All data show that the direct inputs of various Mn sources are limited. By the low Mn background in the groundwater systems, hydrochemical conditions dominantly control Mn transport and enrichment. Transformation of Mn oxides (Mn4+) into Mn2+ could be possible, particularly under reduced condition. This process would increase Mn several to tens of times higher than the background values in groundwater systems. Factors such as DO, NO3, pH, and Eh play critical roles in mobilizing Mn in aquifers. With the consumption of DO in groundwater due to declining replenishment, NO3 could react with Sulphur and DOC and participate in producing dissoluble Mn. This research is beneficial for understanding Mn geochemical processes in groundwater systems.

Author Contributions

Conceptualization, D.Q.; methodology, W.L. and D.Q.; investigation, D.Q., W.L., Y.Y. and G.G.; writing—original draft preparation, W.L.; writing—review and editing, D.Q.; funding acquisition, D.Q. All authors have read and agreed to the published version of the manuscript.

Funding

This research was funded by the National Natural Science Foundation of China (grant number 41172215), the project of study on Baifuquan groundwater using CFC tools, Beijing Water Science and Technology Institute (No. 2020000102), and the project of key technology and demonstration of groundwater restoration in the west of the capital, Beijing Science and Technology Program (No. Z221100005222014).

Data Availability Statement

Not applicable.

Acknowledgments

We are grateful to Guangzhong Tian for his assistance during the field investigation. We would like to acknowledge three anonymous reviewers for their constructive comments, which resulted in substantial improvements to the manuscript.

Conflicts of Interest

The authors declare no conflict of interest.

References

  1. Anne, K.; Hannu, K.; Tarja, H.; Birgitta, B.; Sirpa, H. Variation in Groundwater Manganese in Finland. Environ. Geochem. Health 2021, 43, 1193–1211. [Google Scholar]
  2. Wang, N.; Wang, X.; Yang, P. Analysis on the Characteristics of Mn Excess the Standard in Shallow Groundwater in the Plain Area of Northwestern Shandong Province. Shandong Land Resour. 2021, 37, 52–59. [Google Scholar]
  3. Hou, Q.; Zhang, Q.; Huang, G.; Liu, C.; Zhang, Y. Elevated Manganese Concentrations in Shallow Groundwater of Various Aquifers in a Rapidly Urbanized Delta, South China. Sci. Total Environ. 2020, 701, 134777. [Google Scholar] [CrossRef] [PubMed]
  4. Joode, B.V.W.D.; Barbeau, B.; Bouchard, M.F.; Mora, A.M.; Skytt, A.; Córdoba, L.; Quesada, R.; Lundh, T.; Lindh, C.H.; Mergler, D. Manganese Concentrations in Drinking Water from Villages near Banana Plantations with Aerial Mancozeb Spraying in Costa Rica: Results from the Infants’ Environmental Health Study (ISA). Environ. Pollut. 2016, 215, 247–257. [Google Scholar] [CrossRef]
  5. Kshetrimayum, K.S.; Hegeu, H. The State of Toxicity and Cause of Elevated Iron and Manganese Concentrations in Surface Water and Groundwater Around Naga Thrust of Assam-Arakan Basin, Northeastern India. Environ. Earth Sci. 2016, 75, 604. [Google Scholar] [CrossRef]
  6. Khan, K.; Factor-Litvak, P.; Wasserman, G.A.; Liu, X.; Ahmed, E.; Parvez, F.; Slavkovich, V.; Levy, D.; Mey, J.; Van Geen, A.; et al. Manganese Exposure from Drinking Water and Children’s Classroom Behavior in Bangladesh. Environ. Health Perspect. 2011, 119, 1501–1506. [Google Scholar] [CrossRef]
  7. Gillispie, E.C.; Austin, R.E.; Rivera, N.A.; Bolich, R.; Duckworth, O.W.; Bradley, P.; Amoozegar, A.; Hesterberg, D.; Polizzotto, M.L. Soil Weathering as an Engine for Manganese Contamination of Well Water. Environ. Sci. Technol. 2016, 50, 9963–9971. [Google Scholar] [CrossRef]
  8. WHO. Guidelines for Drinking-Water Qualtiy; Word Health Organization: Geneva, Switzerland, 2017; p. 226. [Google Scholar]
  9. Anjum, A.; Biswas, S.; Rahman, M.; Rahman, A.; Siddique, A.E.; Karim, Y.; Aktar, S.; Nikkon, F.; Haque, A.; Himeno, S.; et al. Butyrylcholinesterasea Potential Plasma Biomarker in Manganese-induced Neurobehavioral Changes. Environ. Sci. Pollut. Res. 2019, 26, 6378–6387. [Google Scholar] [CrossRef]
  10. Krishna, S.; Dodd, C.A.; Hekmatyar, S.K.; Filipov, N.M. Brain Deposition and Neurotoxicity of Manganese in Adult Mice Exposed via the Drinking Water. Arch. Toxicol. 2014, 88, 47–64. [Google Scholar] [CrossRef]
  11. Khan, K.; Wasserman, G.A.; Liu, X.; Ahmed, E.; Parvez, F.; Slavkovich, V.; Levy, D.; Mey, J.; Van Geen, A.; Graziano, J.H.; et al. Manganese Exposure from Drinking Water and Children’s Academic Achievement. Neurotoxicology 2012, 33, 91–97. [Google Scholar] [CrossRef]
  12. Canfield, D.E.; Kristensen, E.; Bo, T. The Iron and Manganese Cycles. Adv. Mar. Biol. 2005, 48, 269–312. [Google Scholar]
  13. Gilkes, R.J.; Mckenzie, R.M. Geochemistry and Mineralogy of Manganese in Soils. In Proceedings of the International Symposium on ‘Manganese in Soils and Plants’, Waite Agricultural Research Institute, The University of Adelaide, Glen Osmond, SA, Australia, 22–26 August 1988. [Google Scholar]
  14. Kiracofe, Z.A.; Henika, W.S.; Schreiber, M.E. Assessing the Geological Sources of Manganese in the Roanoke River Watershed, Virginia. Environ. Eng. Geosci. 2017, 23, 43–64. [Google Scholar] [CrossRef]
  15. Morgan, J.J. Manganese in Natural Waters and Earth’s Crust: Its Availability to Organisms. In Metal Ions in Biological Systems, 1st ed.; CRC Press: Boca Raton, FL, USA, 2000; Volume 37, pp. 1–34. [Google Scholar]
  16. Binda, G.; Pozzi, A.; Livio, F. An integrated interdisciplinary approach to evaluate potentially toxic element sources in a mountainous watershed. Environ. Geochem. Health 2020, 42, 1255–1272. [Google Scholar] [CrossRef] [PubMed]
  17. Frisbie, S.H.; Mitchell, E.J.; Dustin, H.; Maynard, D.M.; Sarkar, B. World Health Organization Discontinues Its Drinking-Water Guideline for Manganese. Environ. Health Perspect. 2012, 120, 775–778. [Google Scholar] [CrossRef]
  18. Ewusi, A.; Sunkari, E.D.; Seidu, J.; Coffie-Anum, E. Hydrogeochemical characteristics, sources and human health risk assessment of heavy metal dispersion in the mine pit water–surface water–groundwater system in the largest manganese mine in Ghana. Environ. Technol. Innov. 2022, 26, 102312. [Google Scholar] [CrossRef]
  19. Howe, P.; Malcolm, H.; Dobson, S. Manganese and Its Compounds: Environmental Aspects; World Health Organization: Geneva, Switzerland, 2004; pp. 14–18. [Google Scholar]
  20. Mcmahon, P.B.; Belitz, K.; Reddy, J.E.; Johnson, T.D. Elevated Manganese Concentrations in United States Groundwater, Role of Land Surface-Soil-Aquifer Connections. Environ. Sci. Technol. 2019, 53, 29–38. [Google Scholar] [CrossRef]
  21. Esteller, M.V.; Kondratenko, N.; Exposito, J.L.; Medina, M.; Del Campo, M.A.M. Hydrogeochemical Characteristics of a Volcanic-sedimentary Aquifer with Special Emphasis on Fe and Mn Content: A Case Study in Mexico. J. Geochem. Explor. 2017, 180, 113–126. [Google Scholar] [CrossRef]
  22. Homoncik, S.C.; Macdonald, A.M.; Heal, K.V.; Dochartaigh, B.E.O.; Ngwenya, B.T. Manganese Concentrations in Scottish Groundwater. Sci. Total Environ. 2010, 408, 2467–2473. [Google Scholar] [CrossRef]
  23. Hem, J.D. Study and Interpretation of the Chemical Characteristics of Natural Water, 3rd ed.; Department of the Interior, US Geological Survey: Reston, VA, USA, 1985; pp. 84–88.
  24. Hem, J.D. Chemical Factors that Influence the Availability of Iron and Manganese in Aqueous Systems. Geol. Soc. Am. Bull. 1972, 83, 443–450. [Google Scholar] [CrossRef]
  25. Wang, B.; Cheng, J.; Zhang, H.; Sun, L.; Yu, H.; Sun, Y.; Zhang, J. Experimental Analysis of Preferential Flow and its Effect on Nitrate Nitrogen Migration in Soil of Farmland at Changping District in Beijing. Sci. Soil Water Conserv. 2013, 11, 36–41. [Google Scholar]
  26. Wang, Z.; Han, P.; Mi, N. Analysis of Nitrogen Spatial Distribution of Groundwater in Changping District Based on GIS. Beijing Water 2014, 1, 15–17. [Google Scholar]
  27. Gao, J.; Zhang, L.; Huang, S.; Ma, M.; Wang, Z. Preliminary Health Risk Assessment of Heavy Metals in Drinking Waters in Beijing. Huan Jing Kexue 2004, 25, 47–50. [Google Scholar]
  28. Kong, G.; Wang, Q.; Huang, Q. Evaluation of groundwater quality in Changping piedmont plain of Beijing based on BP neural network. Trans. Chi. Soc. Agric. Eng. 2017, 33, 150–156. [Google Scholar]
  29. Xiao, Y.; Shao, J.; Gu, X.; Zhao, W.; Hao, Q. Characteristics of Groundwater Pollution of Changping Plain in Beijing. South-North Water Transf. Water Sci. Technol. 2015, 13, 252–256. [Google Scholar]
  30. Jiang, T.; Qi, J.; Wang, M. Seasonal Variations of Hydrochemical Characteristics of Groundwater in Changping Plain, Beijing. J. Resour. Ecol. 2017, 8, 655–663. [Google Scholar]
  31. Zhang, B.; Lu, S. The Evaluation of Groundwater Quality in Changping District. Beijing Water 2013, 2, 32–34. [Google Scholar]
  32. Liu, E.M.; Zhang, N.; Han, P.L. Analysis of Present Situation of Groundwater Level in Changping District Based on GIS. Beijing Water 2014, 4, 24–27. [Google Scholar]
  33. Pan, Y. Petrology and Zicon U-Pb Chronology of Dykes in Nankou Beijing. Master’s Thesis, China Universtiy of Geosciences, Beijing, China, 2010. [Google Scholar]
  34. Yu, H.; Zhang, Z.; Shuai, G.; Chen, Y.; Tang, W. Volcanic Rock Age of Tiaojishan Formation in Shisanling-Xishan of Beijing and Its Geological Significance. Geol. Rev. 2016, 62, 807–826. [Google Scholar]
  35. Liu, Q.J.; Liu, Y.X.; Feng, H.; Sun, X.H.; Meng, M.S.; Cao, L. Geochemical Characteristics of Mesoproterozoic Xiamaling Formation Shales in Beijing and their Geological Significance. Acta Petrol. Mineral. 2018, 37, 230–240. [Google Scholar]
  36. Lu, L.; Jin, S.; Ye, H.; Zheng, S. Geothermometric and Barometric Studies of Metamorphism of the Miyun Group Near Beijing. Geochimica 1984, 1, 50–60. [Google Scholar]
  37. Song, T. Sedimentary Facies Indicators and Sedimentary Environments Models of the Changcheng System of Mesoproterozoic in Ming Tombs District, Beijing. J. Palaeogeogr. 2007, 5, 461–472. [Google Scholar]
  38. Gu, X.; Cui, Y.; Xiao, Y.; Hao, Q. Spatial Variability of Groundwater Levels of Piedmont in the Changping District. Hydrogeol. Eng. Geol. 2015, 42, 10–15. [Google Scholar]
  39. Wang, Y. A Model Study of Groundwater Sustainabiltiy in Beijing Plain. Ph.D. Thesis, China University of Geosciences, Beijing, China, 2014. [Google Scholar]
  40. McGrory, E.R.; Brown, C.; Bargary, N.; Williams, N.H.; Mannix, A.; Zhang, C.; Henry, T.; Daly, E.; Nicholas, S.; Petrunic, B.M.; et al. Arsenic contamination of drinking water in Ireland: A spatial analysis of occurrence and potential risk. Sci. Total Environ. 2017, 579, 1863–1875. [Google Scholar] [CrossRef] [PubMed]
  41. Matheron, G. Principles of geostatistics. Econ. Geol. 1963, 58, 1246–1266. [Google Scholar] [CrossRef]
  42. Desbarats, A.J.; Logan, C.E.; Hinton, M.J.; Sharpe, D.R. On the kriging of water table elevations using collateral information from a digital elevation model. J. Hydrol. 2002, 255, 25–38. [Google Scholar] [CrossRef]
  43. Yao, L.; Huo, Z.; Feng, S.; Mao, X.; Kang, S.; Chen, J.; Xu, J.; Steenhuis, T.S. Evaluation of spatial interpolation methods for groundwater level in an arid inland oasis, northwest China. Environ. Earth Sci. 2014, 71, 1911–1924. [Google Scholar] [CrossRef]
  44. Tabandeh, S.M.; Kholghi, M.; Hosseini, S.A. Groundwater quality assessment in two shallow aquifers with different hydrogeological characteristics (case study: Lenjanat and Babol-Amol aquifers in Iran). Environ. Earth Sci. 2021, 80, 427. [Google Scholar] [CrossRef]
  45. Aryafar, A.; Khosravi, V.; Karami, S. Groundwater quality assessment of Birjand plain aquifer using kriging estimation and sequential Gaussian simulation methods. Environ. Earth Sci. 2020, 79, 210. [Google Scholar] [CrossRef]
  46. Ahmad, M.; Chand, S. Spatial Distribution of TDS in Drinking Water of Tehsil Jampur using Ordinary and Bayesian Kriging. Pak. J. Stat. Oper. Res. 2015, 11, 377–386. [Google Scholar] [CrossRef]
  47. Nas, B.; Berktay, A. Groundwater quality mapping in urban groundwater using GIS. Environ. Monit. Assess. 2010, 160, 215–227. [Google Scholar] [CrossRef]
  48. Mubarak, N.; Hussain, I.; Faisal, M.; Hussain, T.; Shad, M.Y.; Abdel-Salam, N.M.; Shabbir, J. Spatial Distribution of Sulfate Concentration in Groundwater of South-Punjab, Pakistan. Water Qual. Expo. Health 2015, 7, 503–513. [Google Scholar] [CrossRef]
  49. Gundogdu, K.S.; Guney, I. Spatial analyses of groundwater levels using universal kriging. J. Earth Syst. Sci. 2007, 116, 49–55. [Google Scholar] [CrossRef]
  50. Tillé, Y.; Dickson, M.M.; Espa, G.; Giuliani, D. Measuring the spatial balance of a sample: A new measure based on Moran’s I index. Spat. Stat. 2018, 23, 182–192. [Google Scholar] [CrossRef]
  51. Gueiros, B.B.; Machado, W.; Lisboa, S.D.; Lacerda, L.D. Manganese Behavior at the Sediment-Water Interface in a Mangrove Dominated Area in Sepetiba Bay, SE Brazil. J. Coast. Res. 2003, 19, 550–559. [Google Scholar]
  52. Li, H.; Huang, Y.; Zhang, Q. Soil Geochemical Characteristics and Influencing Factors in Beijing Plain. Geophys. Geochem. Explor. 2021, 45, 502–516. [Google Scholar]
  53. Koopmann, S.; Froellje, H.; Hamer, K.; Kubier, A.; Pichler, T. Iron-manganese-anomalies of Groundwater:Analysis of Influencing Processes. Grundwasser 2020, 25, 113–126. [Google Scholar] [CrossRef]
  54. Douglas, G.B. Eh-pH Diagrams for Geochemistry; Springer: Berlin/Heidelberg, Germany, 1988; pp. 1–9. [Google Scholar]
  55. Farnsworth, C.E.; Voegelin, A.; Hering, J.G. Manganese Oxidation Induced by Water Table Fluctuations in a Sand Column. Environ. Sci. Technol. 2012, 46, 277–284. [Google Scholar] [CrossRef]
  56. Aller, R.C. Sedimentary Diagenesis, Depositional Environments, and Benthic Fluxes. In Treatise on Geochemistry, 2nd ed.; Holland, H.D., Turekian, K.K., Eds.; Elsevier: Oxford, UK, 2014; pp. 293–334. [Google Scholar]
  57. Philip, N.F.; Gary, P.K.; Michael, L.B.; Nile, A.L.; Heath, G.R.; Doug, C.; Paul, D.; Hammond, D.E.; Blayne, H.; Val, M. Early Oxidation of Organic Matter in Pelagic Sediments of the Eastern Equatorial Atlantic: Suboxic Diagenesis. Geochim. Cosmochim. Acta 1979, 43, 1075–1090. [Google Scholar]
  58. Lam, P.; Kuypers, M.M.M. Microbial Nitrogen Cycling Processes in Oxygen Minimum Zones. Annu. Rev. Mar. Sci. 2011, 3, 317–345. [Google Scholar] [CrossRef]
  59. Dong, Z.; Zhang, L.; Wang, C.; Zhang, B.; Peng, Z.; Zhu, M.; Feng, J.; Xie, Y. Progress and Problems in Understanding Sedimentary Manganese Carbonate Metallogenesis. Miner. Depos. 2020, 39, 237–255. [Google Scholar]
  60. Vandenabeele, J.; Debeer, D.; Germonpre, R.; Vandesande, R.; Verstraete, W. Influence of Nitrate on Manganese Removing Microbial Consortia from Sand Filters. Water Res. 1995, 29, 579–587. [Google Scholar] [CrossRef]
  61. Rutting, T.; Huygens, D.; Mueller, C.; Cleemput, O.V.; Godoy, R.; Boeckx, P. Functional Role of DNRA and Nitrite Reduction in a Pristine South Chilean Nothofagus Forest. Biogeochemistry 2008, 90, 243–258. [Google Scholar] [CrossRef]
  62. Liu, Y.; Li, Z.; Deng, K.; Zhou, Q.; Xu, R. Effect of Nitrogen forms on Reduction of Manganese Oxides in an Oxisol by Plant Root Exudates. Arch. Agron. Soil Sci. 2017, 63, 1725–1735. [Google Scholar] [CrossRef]
  63. Kotowski, T.; Burkowska, A. The Influence of Bacterial Reduction on Concentrations of Sulphates in Deep Aquifers in River Drainage Basin. Pol. J. Environ. Stud. 2011, 20, 379–386. [Google Scholar]
  64. Yu, L.; Yuan, Y.; Chen, S.; Zhuang, L.; Zhou, S. Direct Uptake of Electrode Electrons for Autotrophic Denitrification by Thiobacillus Denitrificans. Electrochem. Commun. 2015, 60, 126–130. [Google Scholar] [CrossRef]
  65. Torrentó, C.; Cama, J.; Urmeneta, J.; Otero, N.; Soler, A. Denitrification of groundwater with pyrite and Thiobacillus denitrificans. Chem. Geol. 2010, 278, 80–91. [Google Scholar] [CrossRef]
  66. Schedel, M.; Trüper, H.G. Anaerobic Oxidation of Thiosulfate and Elemental Sulfur in Thiobacillus Denitrificans. Arch. Microbiol. 1980, 124, 205–210. [Google Scholar] [CrossRef]
Figure 1. Generalized map of geological background (a), groundwater table contour (b), and cross profile (c) in the study area.
Water 15 01537 g001
Figure 2. The Piper diagram for groundwater in the study area.
Water 15 01537 g002
Figure 3. Geostatistical analysis of hydrochemical data using LISA hotspot analysis, (a) Mn-LISA, (b) Cl-LISA, (c) SO4-LISA, (d) HCO3-LISA, (e) DO-LISA, (f) NO3-LISA, (g) pH-LISA, (h) Eh-LISA.
Water 15 01537 g003
Figure 4. The spatial distribution of Mn (a), Cl (b), SO4 (c), HCO3 (d), DO (e), NO3 (f), pH (g) and Eh (h) in groundwater from Quaternary aquifers of the study area, interpolating with the ordinary kriging method.
Water 15 01537 g004
Figure 5. The relationship between well depth and hydrochemical parameters in groundwater, well depth vs. Mn (a), Cl (b), SO4 (c), HCO3 (d), DO (e), NO3 (f), pH (g) and Eh (h).Green, yellow and blue lines indicate the variable of path in Zone I, Zone II and Zone III, respectively. The gray solid circle presents parameters for initial recharge. Stars are for river water samples, green for dbs 01 and blue for dbs04.
Water 15 01537 g005
Figure 6. The diagram of Gibbs for groundwater in the study area, (a) TDS vs. Na/(Na + Ca), (b) TDS vs. Cl/(Cl + HCO3).
Water 15 01537 g006
Figure 8. Diagram of Mn vs. DO (a), NO3 (b), and SO4 (c), and NO3 vs. SO4 (d) in groundwater.
Water 15 01537 g008
Figure 9. Conceptual model of the evolution of groundwater Mn in the Quaternary porous aquifer.
Water 15 01537 g009
Table 1. Mn concentrations in major rock types of the Changping region.
Rock TypeGranite *Dacite &Monzonite *Syenite *Shale #Limestone ##Granulite @Trachy-
Andesite &
Upper Crust a
Mn (mg/kg)3106208509307005402000770650
Note: * from [33], & from [34], # from [35], @ from [36], ## from [37], a [13].
Table 2. Physicochemical data of groundwater and surface water samples in the study area.
ZoneSampleWater TypeWell DepthpHEhDOTDSNaKMgCaClSO4NO3HCO3Mn
m mVmg/Lµg/L
Zone IQs01Quaternary water557.6−38.27.448516.71.943.372.350.446.273.53610.05
Qs091807.8−53.58.13149.61.627.956.824.335.038.92390.07
Qd012207.6−38.48.52577.70.722.154.27.516.522.12530.28
Qd022507.4−48.69.440615.51.135.466.069.727.565.92500.14
Qd032307.3−25.59.234217.24.320.861.531.532.963.92191.83
dbs01River water 8.3−839.723813.23.116.143.113.159.52.01750.19
Zone IIQs08Quaternary water1207.2−16.69.450545.41.618.871.772.554.2123.92144.42
Qs141107.8−53.85.233515.61.225.760.113.967.07.32880.14
Qd103008.1−69.35.820122.91.111.838.24.419.24.01980.07
Zone IIIQs02Quaternary water1757.5−33.12.934519.60.532.161.213.329.91.43747.37
Qs101887.9−63.65.334650.10.526.444.212.040.81.034139.10
Qs111657.8−523.638547.41.425.150.235.584.73.52730.45
Qs161367.5−34.51.258058.30.644.071.352.0117.20.04710.02
Qs17807.2−292.650461.60.429.966.732.293.30.0436200
Qd062607.8−52.13.225122.70.614.343.17.013.69.02801.15
Qd073008.1−72.62.031670.10.49.224.311.960.40.926240.70
Qd082258.0−62.64.131648.00.917.543.920.757.80.02530.23
Qd093407.9−577.033320.90.825.260.121.746.37.82990.15
Qd112357.6−381.274053.90.753.079.5189.9159.33.5400522
Qd122708.0−545.231929.60.727.252.712.428.62.232931.60
dbs04River water 8.3−829.346067.015.122.851.2109.079.426.02004.03
Disclaimer/Publisher’s Note: The statements, opinions and data contained in all publications are solely those of the individual author(s) and contributor(s) and not of MDPI and/or the editor(s). MDPI and/or the editor(s) disclaim responsibility for any injury to people or property resulting from any ideas, methods, instructions or products referred to in the content.

