Article

Estimating Reed Bed Cover in Hungarian Fish Ponds Using NDVI-Based Remote Sensing Technique

1
Research Center for Fisheries and Aquaculture, Institute of Aquaculture and Environmental Safety, Hungarian University of Agriculture and Life Sciences, 35 Anna liget, 5540 Szarvas, Hungary
2
Institute of Animal Sciences, Hungarian University of Agriculture and Life Sciences, 40 Guba, 7400 Kaposvar, Hungary
3
Center for Irrigation and Water Management, Institute of Environmental Sciences, Hungarian University of Agriculture and Life Sciences, Anna liget 35, 5540 Szarvas, Hungary
4
Institute of Agricultural Economics Nonprofit Kft. (AKI), 3-5 Zsil u., 1093 Budapest, Hungary
*
Author to whom correspondence should be addressed.
Water 2023, 15(8), 1554; https://doi.org/10.3390/w15081554
Submission received: 13 March 2023 / Revised: 11 April 2023 / Accepted: 13 April 2023 / Published: 15 April 2023
(This article belongs to the Section Water, Agriculture and Aquaculture)

Abstract

:
In the EU, aquaculture ponds cover an area of 360,000 ha and are a crucial part of the rural landscape. As many ecosystem services (e.g., habitats for protected wildlife, nutrient cycling, etc.) are correlated with the proportion of reed beds relative to open-water areas, it is important in environmental studies to be able to accurately estimate the extent and the temporal dynamics of reed cover. Here, we propose a method for mapping reed cover in fish ponds from freely available Sentinel-2 imagery using the normalized difference vegetation index (NDVI), which we applied to Hungary, the third largest carp producer in the EU. The dynamics of reed cover in Hungarian fish ponds mapped using satellite imagery show a high degree of agreement with the ground-truth points, and when compared with data reported in the annual aquaculture reports for Hungary, it was found that the calculation of reed cover based on the NDVI-based approach was more consistent than the estimates provided in the report. We discuss possible applications of this remote sensing technique in estimating reed-like vegetation cover in fish ponds and the possible use of the results for climate change studies and ecosystem services assessment.

1. Introduction

Carp farming in ponds is the second largest sub-segment of freshwater aquaculture in the EU after cold-water flow-through systems, accounting for 38% of total freshwater production. The total area of fish ponds in the EU is estimated to be 360,000 ha, most of which are located in protected areas [1]. In addition to their primary function of fish production (90,000 t per year), Central European pond aquaculture is recognized for providing a wide range of other ecosystem services, including water and nutrient retention, flood protection, nature conservation, biodiversity maintenance, and recreation [2,3]. Reed beds (mainly comprising species of Phragmites and Typha) growing within the fish-pond boundaries contribute significantly to ecosystem functions. Areas covered with emergent macrophytes provide habitats and refuges for protected invertebrate and vertebrate species [4]. In French carp ponds, bird richness is significantly correlated with reed bed coverage [5]. The relatively high net primary production of emergent macrophytes makes them important players in biogeochemical cycles, contributing to pond ecosystem services in terms of nutrient retention and carbon sequestration [6]. For the wetlands in India, carbon sequestration potential was found to be positively correlated with the proportion of reed areas [7]. The high nitrogen and phosphorus uptake capacity of reed beds is often used to treat nutrient-rich aquaculture effluent [8]. In addition to their ecological role, the social value of fish ponds is positively influenced by reed beds, which support diverse landscape mosaics and enrich the aesthetic effect of large pond areas [9,10].
Pond areas covered with emergent macrophytes change over time, mainly as a result of hydrological and environmental factors, grazing pressure, and mechanical disturbance. More frequent water shortages due to climate change and the resulting lower water levels in catchment ponds favor germination and recruitment of reed beds [11]. However, despite its positive ecological value, excessive reed cover is undesirable for fish farmers as it is associated with a reduction in the aquatic area available for production [12]. Areas colonized by reed-like vegetation trap organic sediments and contribute to the terrestrialization of ponds [13]. In general, high reed cover indicates a degraded aquaculture production infrastructure, and there is often an inverse relationship between yields per hectare and the ratio of reed cover to total pond area [14]. Therefore, reed cutting in fish ponds is a routine management practice aimed at controlling the area covered by vegetation and maintaining the open water surface required for fish production.
This study focuses on Hungary, the third largest carp producer in the EU, with a production of 13,592 tons in 2021 [15]. The total area of fish ponds is approximately 30,000 ha, out of which 26,000–27,000 ha has been cultivated in recent years [15]. Although the 2015 annual statistical reports on the aquaculture sector provide data on reed cover (as a percentage of the total pond area in use) at both national and regional levels, these are calculated by aggregating farmers’ self-reported data. Farmers find it difficult to estimate reed cover; therefore, the published data are inconsistent over the years, with unsubstantiated changes from one year to another. For example, in the largest aquaculture-producing region (Northern Great Plain), the proportions of reed areas were reported to be 7%, 21%, 36%, and 11% for the years 2015, 2017, 2020, and 2021, respectively. Unreliable estimations of reed cover hinder the use of statistical reports for ecosystem studies and assessments of pond productivity. Given the impact of reed-like vegetation on ecosystem services and the general state of production infrastructure, it is important for various stakeholders in the aquaculture industry to have accurate information on the extent and temporal dynamics of reed cover in cultivated ponds. Easy-to-use tools that provide accurate information on open-water areas may also be needed in the future for the allocation of area-based subsidies [16].
Remote sensing techniques offer a viable solution for mapping large, complex, and difficult-to-access areas. Although farmers can estimate the extent of reed beds in their own ponds simply by observing the vegetation cover, more automated remote sensing techniques are required for larger-scale environmental studies and regional or national monitoring of production infrastructure. Thus, remote sensing techniques have the advantages of being able to cover large study areas with the same state of plant phenology or inundation, employing sensors with spectral sensitivity to variations in water body surface composition, and being more cost-effective for repeated data collection compared to field surveys [17]. In recent years, several image classification methods based on spectral indexes and machine learning (ML) algorithms have been applied to measure the extent and understand the ecological dynamics of reed-like vegetation. Object-based image analysis techniques have been applied to unmanned aerial vehicle (UAV) imagery to map the spread of invasive infestations of Phragmites sp. [18,19]. Aerial remote sensing and image classification have also been used in Hungary to assess the ecophysiology of reed beds along the shores of Lake Balaton [20] and to map aquatic vegetation [21]. In [22], the applicability of aerial remote sensing (LiDAR, UAV, orthophotos, etc.) and satellite data for the determination of the reed cover in fish ponds with different sizes and geographic characteristics was analyzed. The most accurate results were obtained using a combination of LiDAR and orthophotos. However, it was concluded that, although the accuracy of the satellite-based analysis was lower, it could be improved by pre-processing the base data, improving image classification, and automating image processing to create a system suitable for continuous monitoring.
In our study, we used the normalized difference vegetation index (NDVI) to assess the reed-like vegetation in Hungarian fish ponds. Several empirical studies have shown the wide application of this method. NDVI-based phenology metrics have been successfully applied to track the growth of macrophytes in Lake Balaton throughout the growing season [23]. Similarly, the NDVI thresholding method has been applied to MODIS imagery to define typical wetland vegetation phenology and to derive a relationship between photosynthetic activity and spring runoff volume [24]. In addition, time series of the NDVI and other vegetation indices have been used to characterize rapid vegetation succession in salt marshes [25]. Successful applications of NDVI-based biomass estimation models have also been reported for wetland vegetation [26]. Improvements in supervised classification based on the NDVI have been achieved that helped in understanding the effect of surface water fluctuations on macrophyte distribution [27].
Although the accuracy level of NDVI threshold-based classification is considered relatively low compared to classification using other machine learning (ML) algorithms [28,29], this conventional technique has several advantages over ML models. Firstly, it is a challenge to collect enough field data to train different ML models [30]; secondly, in order to improve the performance of such models, it is preferable for the training and test image datasets to be similar (in terms of image resolution, sensors and camera systems used) and, furthermore, the application of such models with a larger spatial extent is limited by the compatibility of modern computer hardware, which can deteriorate detection performance [31]. In contrast, the NDVI threshold-based method does not require any input training data, nor is it resource-intensive in terms of computational time and computer processing power, even when it comes to larger-scale applications. However, the use of the NDVI as a proxy variable to detect the presence of vegetation can result in inconsistencies depending on the type of habitat and seasons, so the user must carefully select the appropriate rules and thresholds.
With data accessibility and tool applicability for larger-scale studies as the primary motives, we here present an easy-to-use method for mapping reed-like vegetation cover in fish ponds and tracking its spatial and temporal dynamics. After testing and validating the presented tool, the mapped area of the reed cover (between 2017 and 2021) for major Hungarian fish-producing regions was determined, and these values were compared with published data in statistical reports. Finally, we explored potential NDVI-based reed area assessment applications for climate change studies. As it was not the aim of this study to classify reed-like vegetation into different aquatic plant species, we use the terms “reed cover” and “reed-like vegetation” to refer to any type of emergent macrophyte cover within a pond (with dominant species such as Typha latifolia (common cattail) and Phragmites australis (common reed)), and we use these terms interchangeably.

2. Materials and Methods
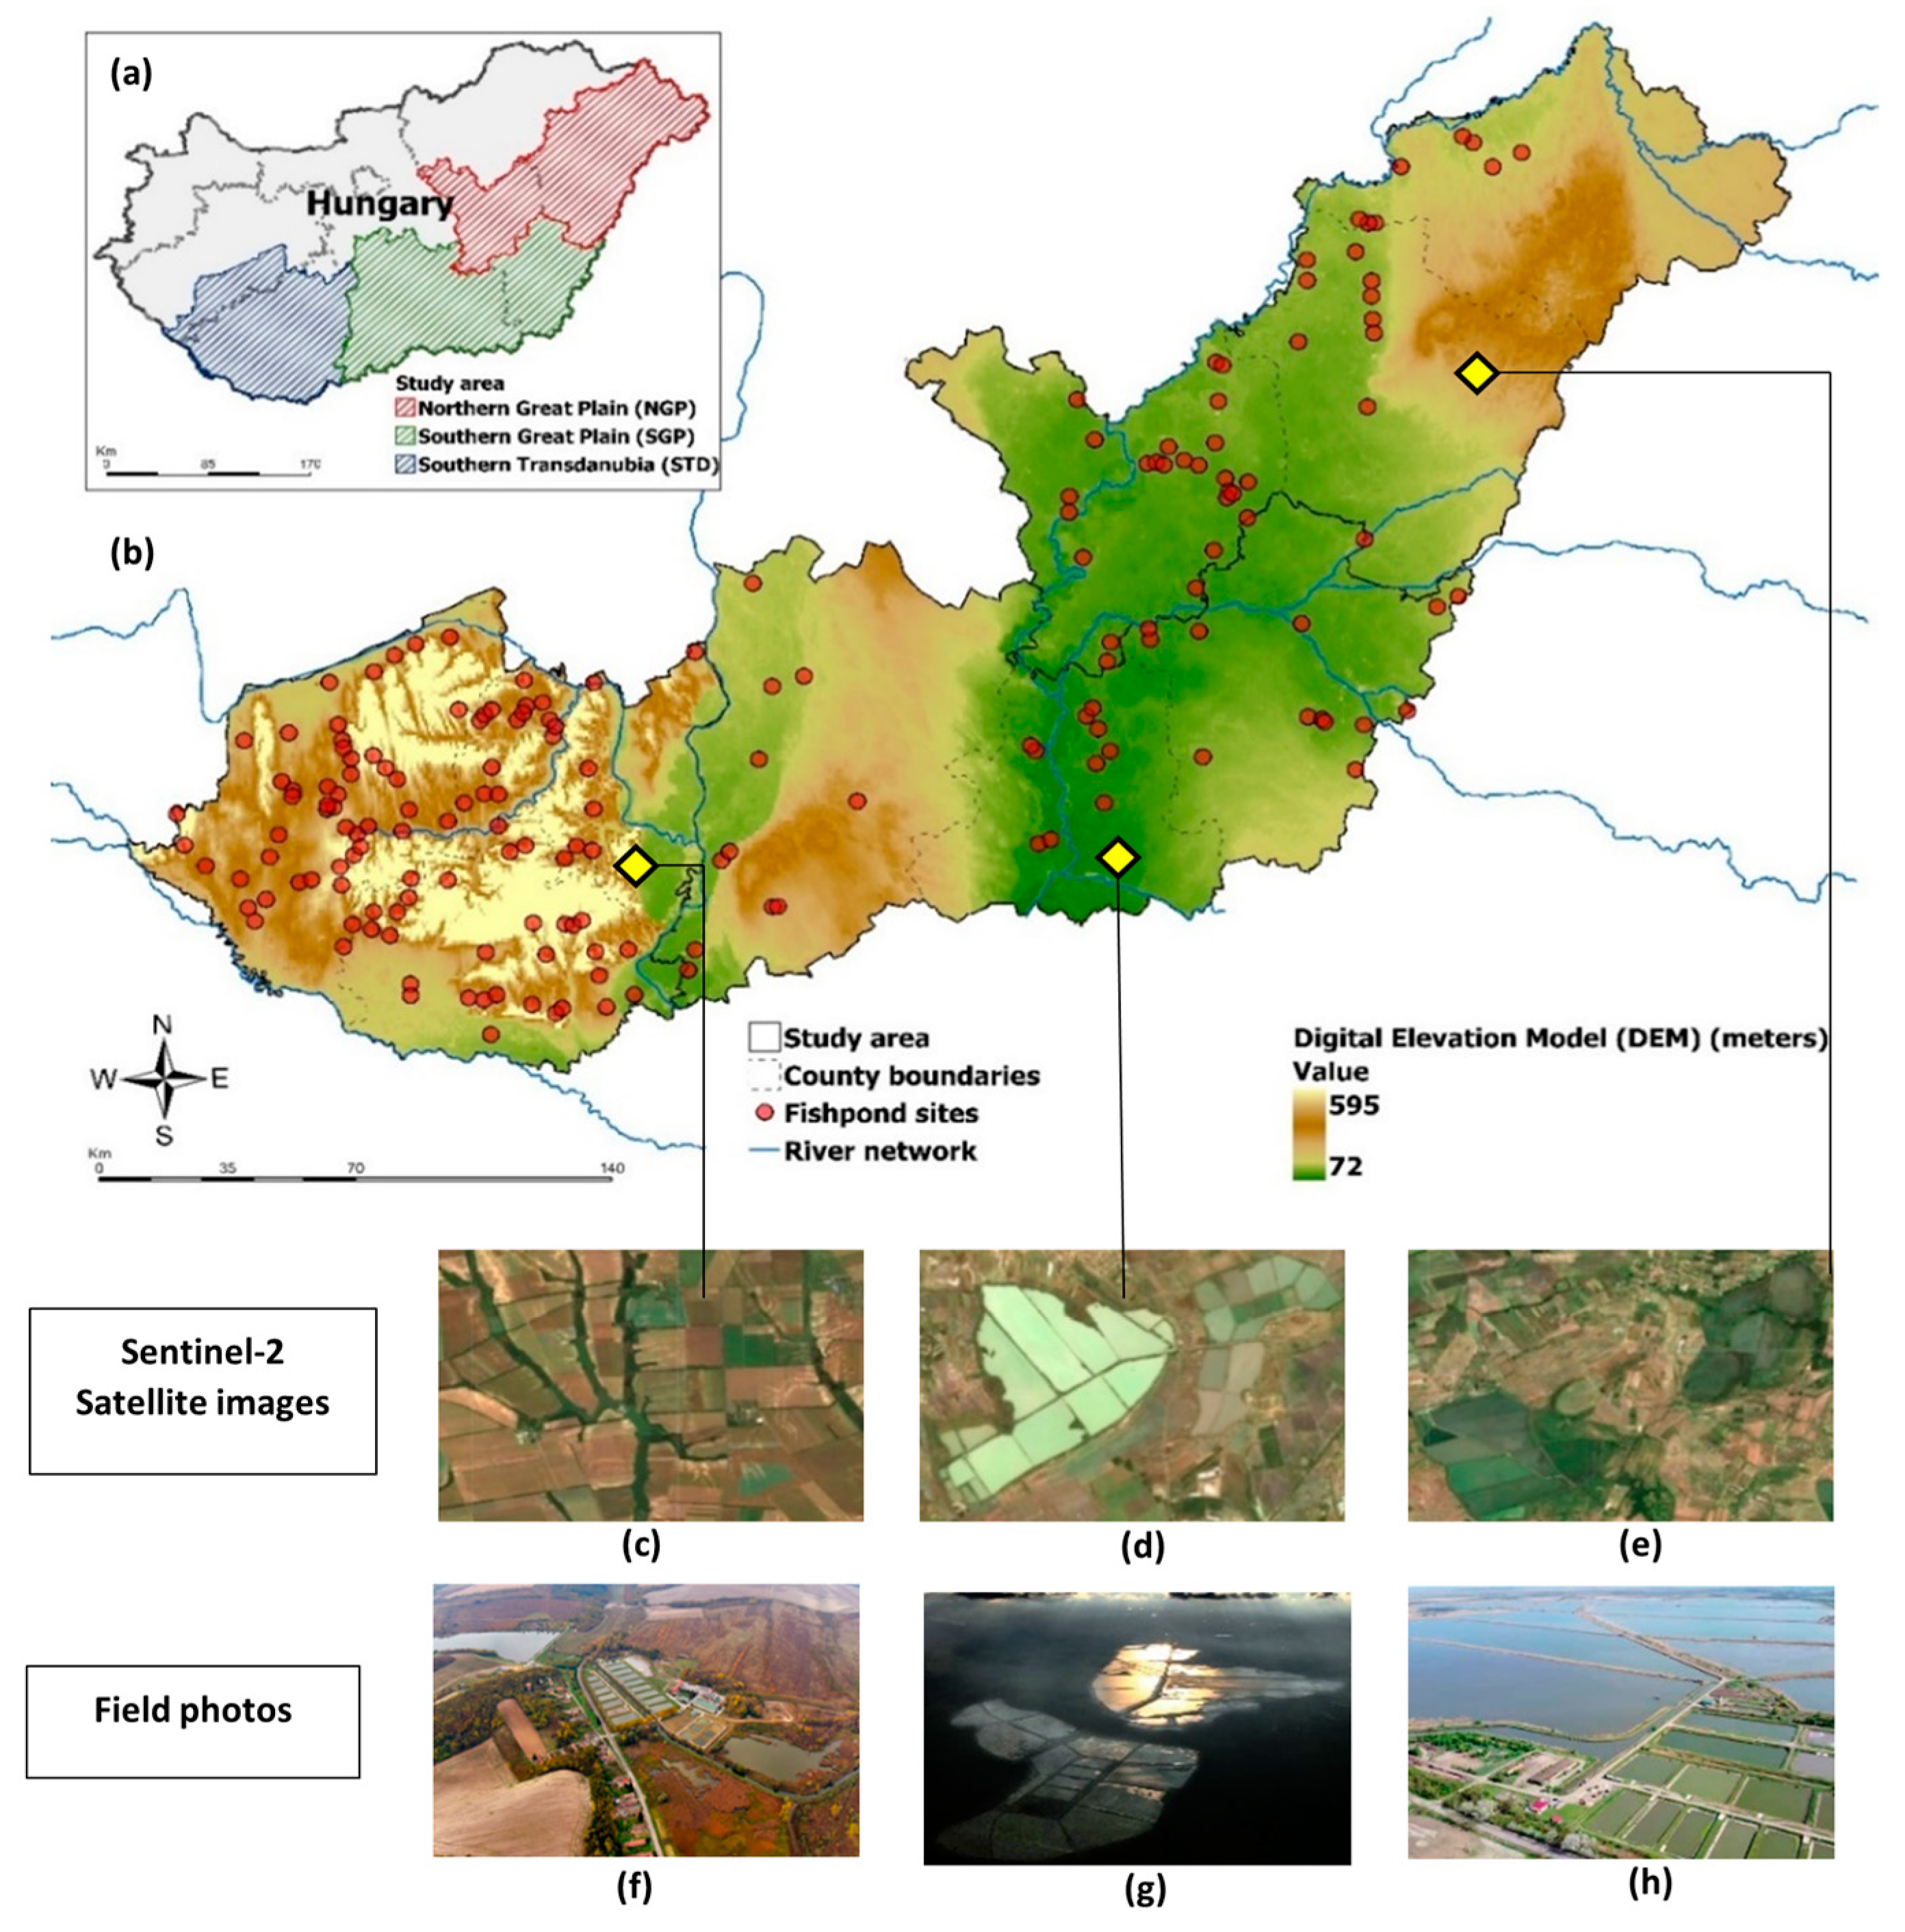
2.1. Study Area

Based on the knowledge gained from the previous statistical reports, our study area corresponded to the three major fish-producing regions in Hungary at the NUTS-2 level; namely, Southern Transdanubia (STD), the Northern Great Plain (NGP), and the Southern Great Plain (SGP) (Figure 1). These three regions accounted for 83% and 82% of the total Hungarian fish pond area and production output in 2021, respectively [32]. In terms of the number of fish farm sites, the STD region has the highest number of fish farms in the country (i.e., 100), followed by the NGP with 50 fish farms, and the SGP is third on the list with 34 fish farms. Fish farms are more densely concentrated in the STD region. The Mendeley dataset associated with this study also provides details on the numbers of fish farms and their geo-coordinates and areas.
Water management regimes differ significantly for ponds in hilly (STD) and flat (NGP and SGP) terrain.
  • Barrage ponds (also called watershed ponds), constructed in hilly areas by damming a smaller watercourse, are characteristic of the Transdanubian region. These barrage ponds are supplied with water directly from the natural watercourse and the water availability depends on the precipitation in a smaller catchment area. Therefore, the operation of these Transdanubian ponds is more heavily affected by temporal water scarcity induced by climate change. Barrage ponds are smaller in size and longitudinal in shape, and their depth varies from the point of inflow to the outflow;
  • Round-dam ponds (also called embankment ponds) are widely used for fish farming in the Hungarian Great Plain. These excavated ponds are built by removing the soil from the area that will be the pond bottom and building around the pond perimeter. Their water levels are higher than the surrounding areas, and water is deliberately supplied from artificial irrigation channels. Water can be obtained using gravity—if the supply canal is elevated—or by pumping. The availability of water is not limited by the actual rainfall, as these irrigation canals are supplied by larger rivers (the River Tisza and its main tributaries). The ponds have a rectangular shape and are 1–1.2 m deep. Most of Hungary’s fish pond aquaculture takes place in dug-out artificial ponds in the Great Hungarian Plains [33].

2.2. Available Datasets

2.2.1. Reference Datasets

We accessed the publicly available data on fish farm locations in Hungary from the Fisheries Information System (HALir) of the Institute of Agricultural Economics (AKI) [34]. The data format was interpreted visually as geo-coordinates. In this study, only registered locations of cultivated fish ponds (characterized by regular filling and emptying) were selected, and other points referring to ponds such as angling ponds and uncultivated ponds were ignored. Using this refined point-based dataset (a detailed list of point coordinates is presented in the Mendeley dataset), we selected the polygons corresponding to these points from the database of surface water bodies in Hungary provided by the General Directorate of Water Management (OVF) (available on request). All the fish pond polygons were first pre-processed to ensure consistency. We corrected and fine-tuned the Shape files based on expert visual analysis and high-spatial-resolution imagery available in Google Earth Pro.
Statistical data on reed coverage at the national and regional levels were obtained from the AKI annual reports for the period between 2017 and 2021 [32,35,36,37,38]. The reports publish information at the regional (NUTS-2) level on total and cultivated pond areas (ha), reed cover (%) in the cultivated pond area, production indicators, and input use (including water withdrawal (m3)). The reports are compiled based on self-reported data from farmers. The annual statistical reports do not contain geospatial information, so this data source did not allow for the annual adjustment of the Shape file of the area of fish ponds in operation. For this reason, the fish pond area was kept constant throughout the study period (2017–2021) at the level determined during the process described above. However, both the yearly fluctuations in operating fish pond areas and the deviations between the geo-located fish pond areas were marginal. Therefore, the Shape file used in our study provided fairly accurate estimates of the fish pond area under cultivation for the years 2017–2021 (Figure 2).

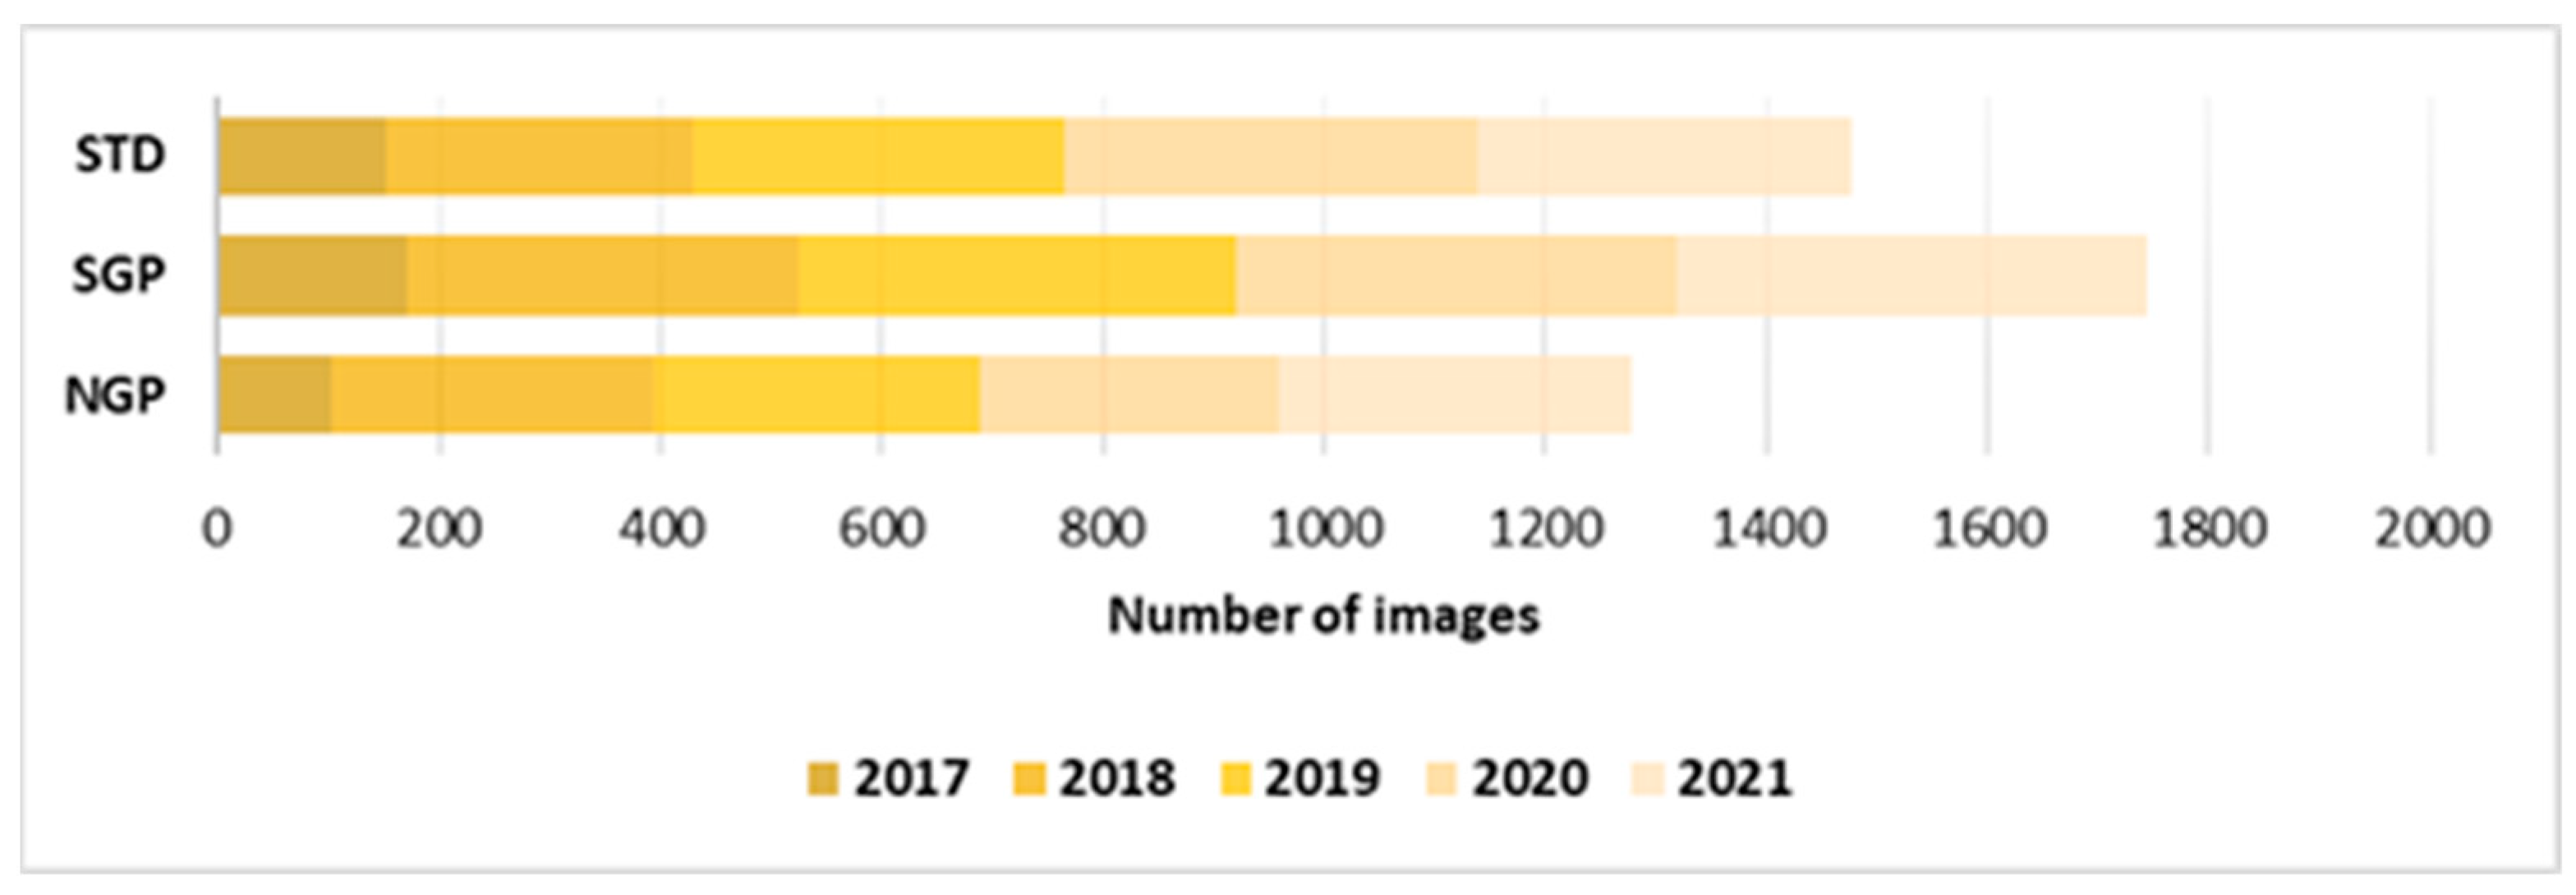
2.2.2. Satellite Data
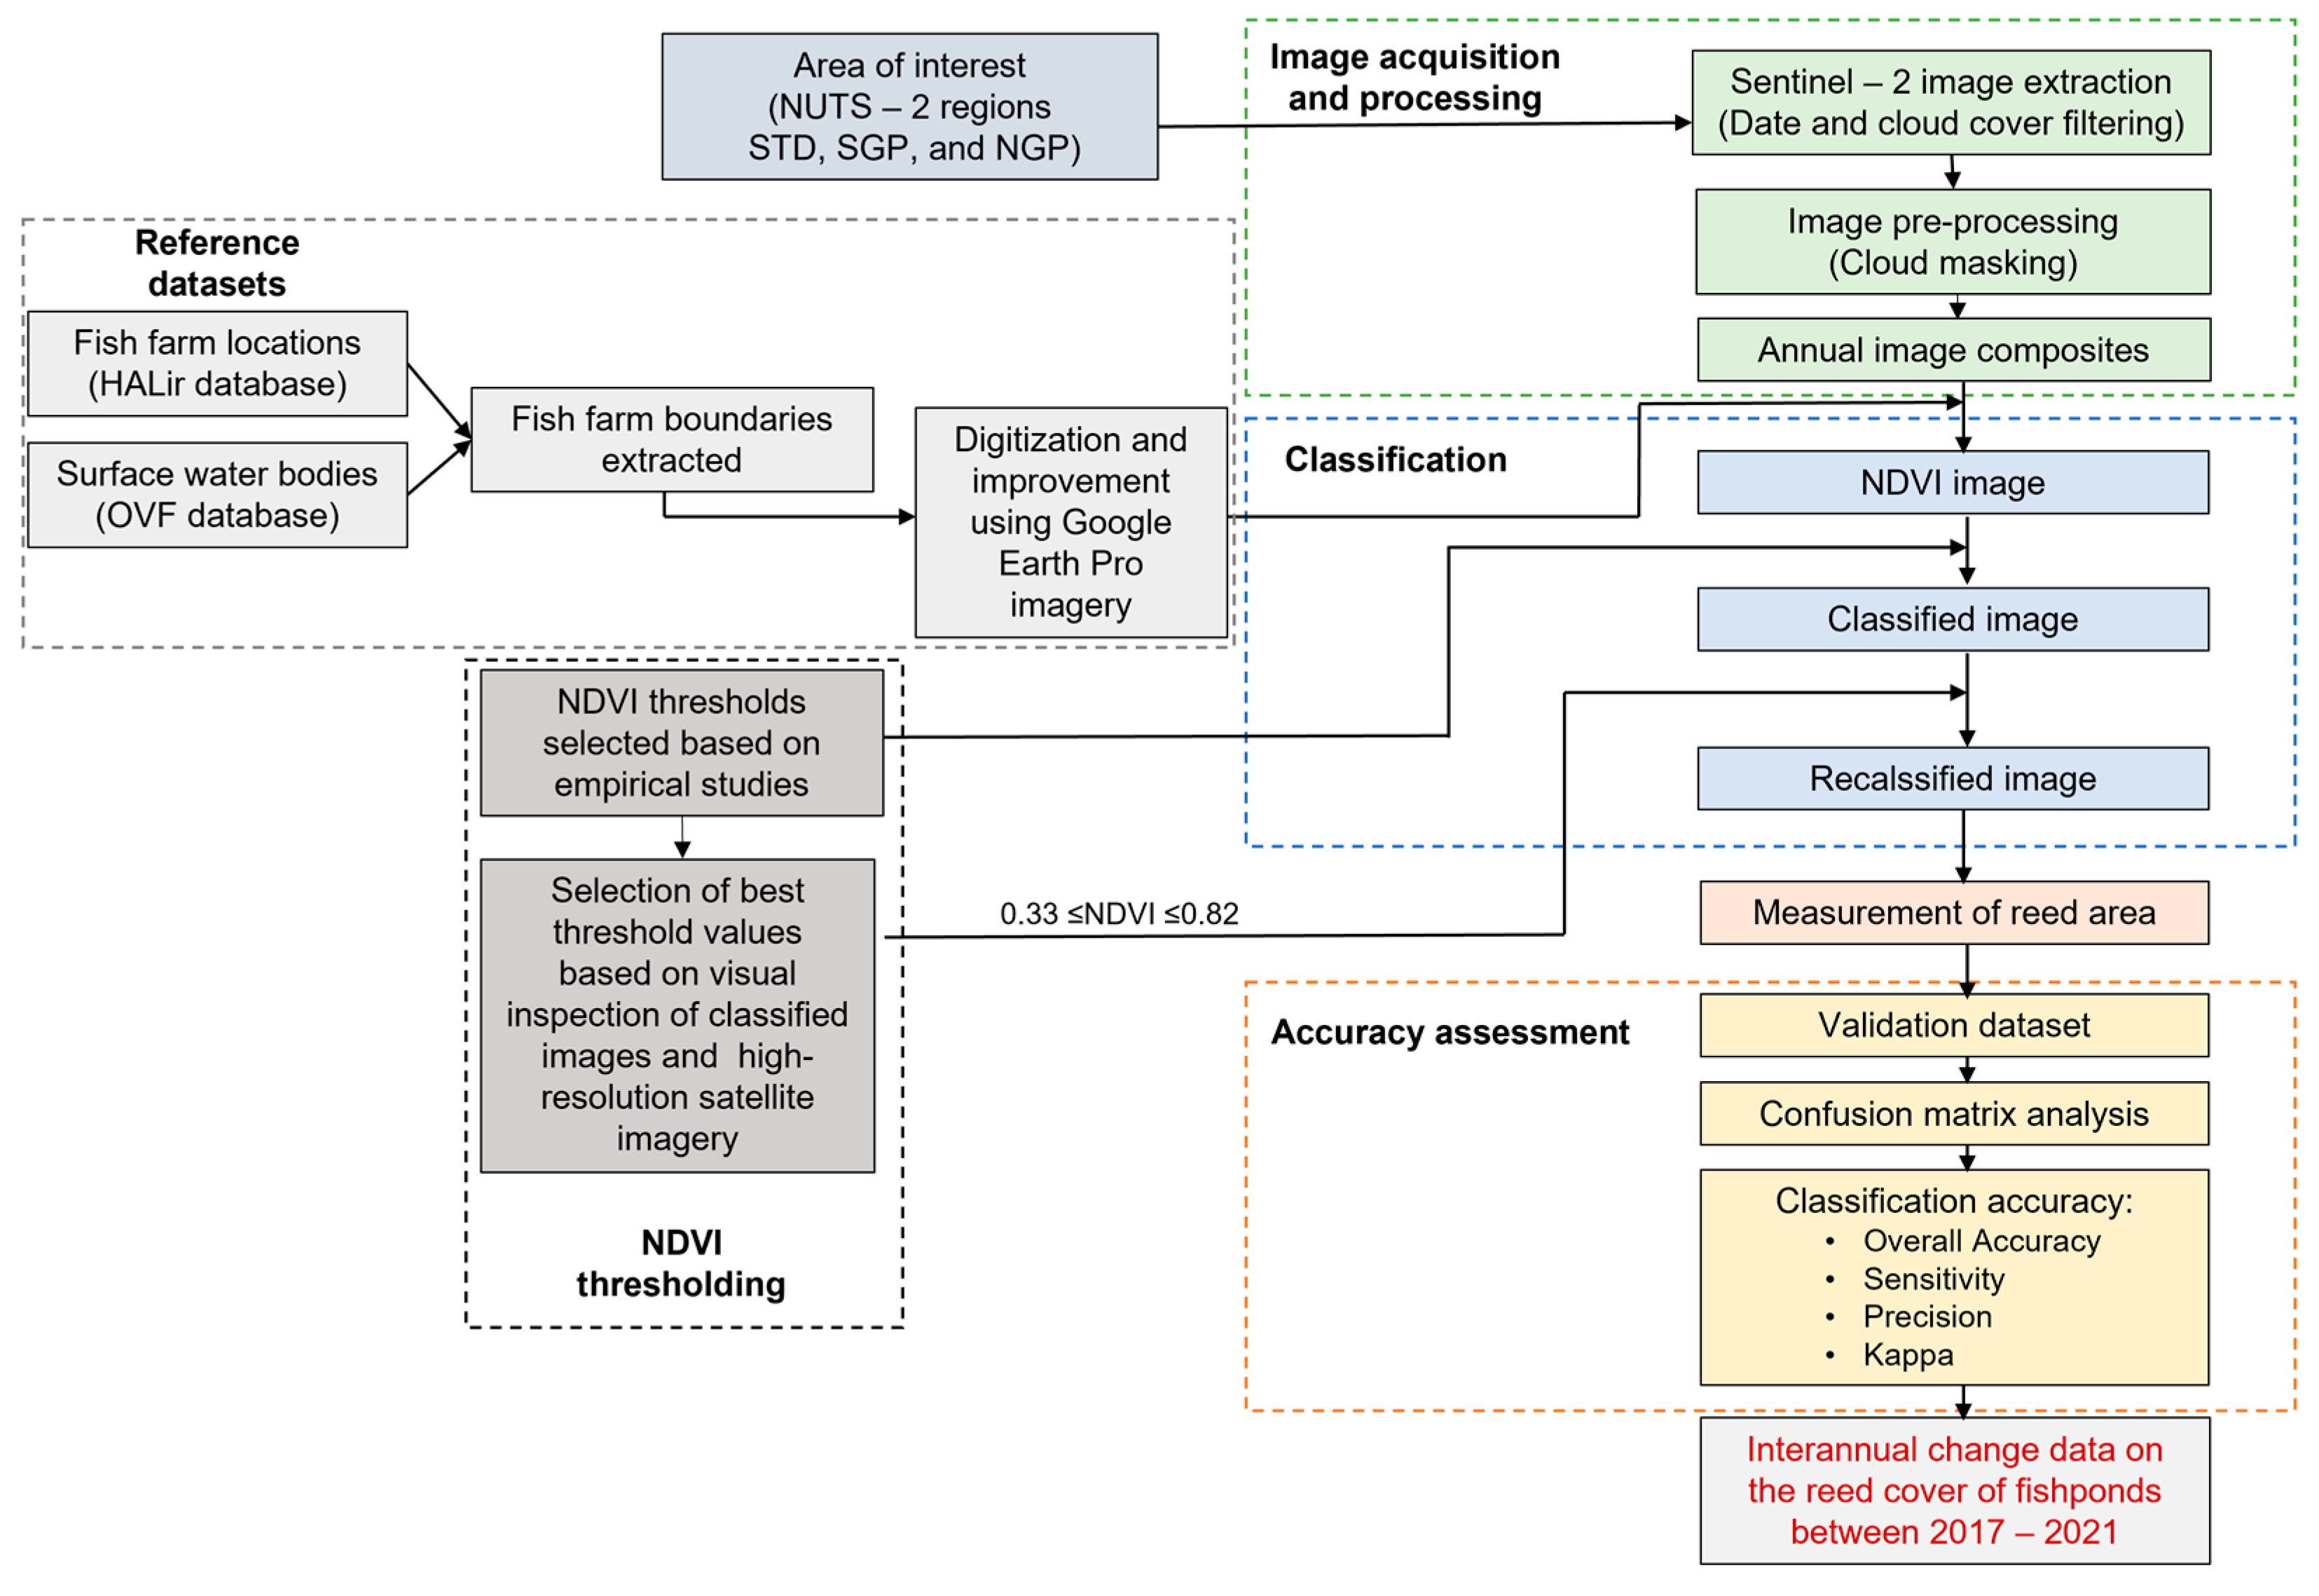
To map the reed-like vegetation within the pond systems, we collected multi-temporal Sentinel-2 satellite images from the European Space Agency (ESA) website (https://www.esa.int/ (accessed on 30 October 2022)) covering the area of STD, the SGP, and the NGP in Hungary between 2017 and 2021. As the scope of this work did not include tracking the seasonal variation in reed cover in fish ponds, we opted for annual collection of satellite imagery for better nationwide coverage. Furthermore, due to the dynamic nature of the reed cover, multi-temporal imagery improves mapping accuracy. The Sentinel-2 collection consists of wide-swath, high-resolution (10 m), and multispectral imagery, with the level-1C (L1C) product providing geo-coded top of atmosphere (TOA) reflectance and the level-2A (L2A) product providing surface reflectance along with radiometric, atmospheric, and geometric correction. A total of 1476 images for STD, 1744 for the SGP, and 1277 for the NGP were pre-processed and used in the analysis. A detailed description of the number of images extracted per year is given in Figure 3.

2.3. Methods

All the steps for mapping and calculating the reed cover in the fish ponds, including pre-processing, calculation of indices, and accuracy assessment, were carried out within the Google Earth Engine (GEE) and ArcGIS Pro platform (3.0.3). An overview of the methodology can be seen in the workflow shown in Figure 4.
As part of the pre-processing of the satellite imagery, a threshold of less than 10% was used to exclude images and produce a cloud-free composite. We defined a function that applied a cloud mask to the selected images to remove noisy observation pixels using bits 10 and 11 (clouds and cirrus, respectively) in the QA60 bitmask band. The image collection was then reduced to a single image per year by creating a median composite, where each pixel in the output was composed of the median value of all the images in the collection. This process was followed up by clipping the images.
Among various vegetation indices, the NDVI has always been a popular indicator for vegetation detection. The NDVI values are calculated from the spectral reflectance measurements acquired in the visible (red band) and near-infrared regions and range between −1 and +1 [39]. Increasing positive values for the index indicates increasing green vegetation and negative values indicate non-vegetated surface features, such as water, barren land, ice, snow, or clouds.
In addition, these NDVI images can be used to detect vegetation with different thresholds [40] and to identify the pattern of change in vegetation communities [41]. A similar technique was used in our study to extract reed-like vegetation cover as a feature within the fish ponds. After the images were clipped with the fish pond boundary polygons, the NDVI value was calculated for each image pixel by applying the standard normalized band ratio given in Equation (1).
NDVI = ( ρ NIR ρ Red ) ( ρ NIR + ρ Red )
where ρ NIR and ρ Red are the near-infrared (842 nm) and red (665 nm) bands of the Sentinel-2 images.
Following the calculation of the NDVI index, several attempts were made to identify the best NDVI thresholds for extraction of the reed cover. The results of a study mapping macrophyte photo-physiological traits using the NDVI [42] showed that the seasonal variations in the maximum NDVI values for Phragmites sp. in Lake Balaton (Hungary) ranged from 0.691 ± 0.008 to 0.703 ± 0.006. Using averaged spectroradiometer hyperspectral data, the authors of [43] calculated minimum and maximum NDVI values of 0.22–0.80 and 0.26–0.82 for cattails and Phragmites stands, respectively. UAV-derived mean NDVI values for Phragmites, cattails, and lotus in the mid-growing season (i.e., in August (0.76, 0.77, 0.81)) differed significantly from those in the late growth period (i.e., in October (0.45, 0.23, 0.12)) [44]. Some studies report inconsistencies in the use of multispectral indices to derive the extent of vegetation [45], which, in our case, was observed in the over-representation of rows of trees on the dikes, lawns, embankments, and standing vegetation around the water channels in the fish ponds. To avoid this uncertainty, we also carried out a visual analysis using satellite imagery in GEE. Therefore, based on these observations, we selected the threshold of 0.33 to 0.82 for the final reclassification of pixels.

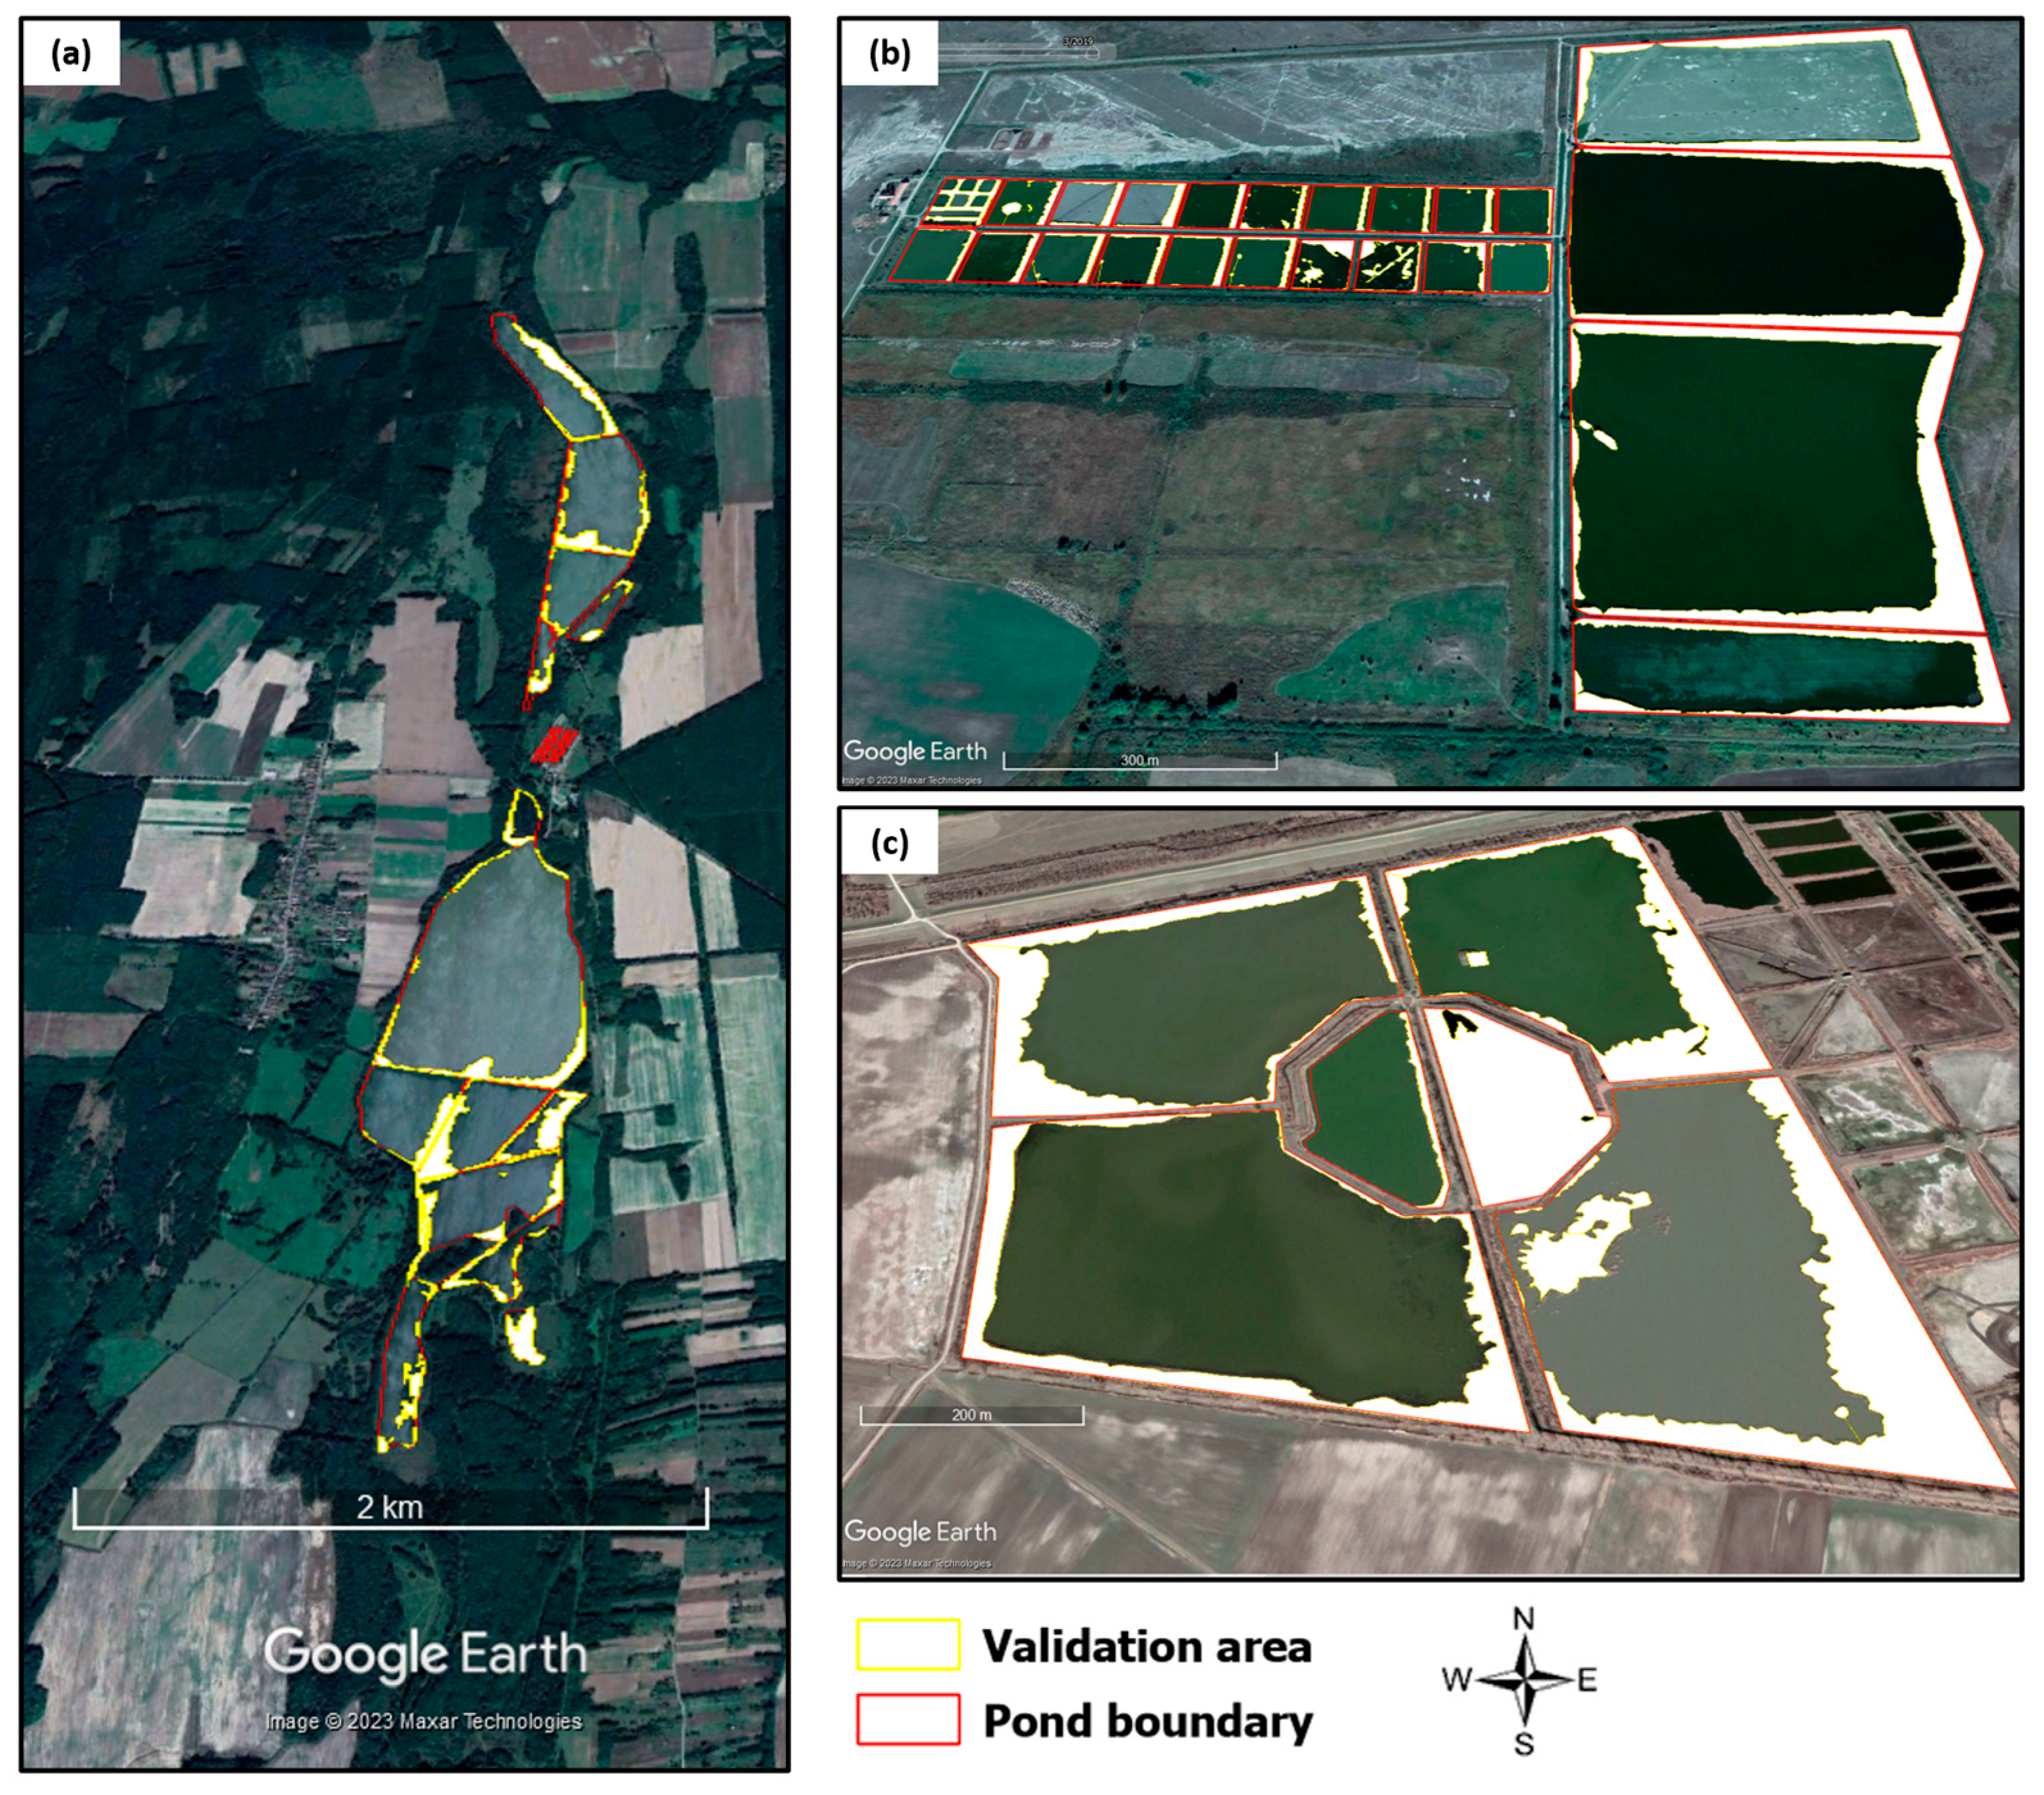
2.4. Accuracy Assessment

We used the direct validation method to assess the accuracy of the classified reed cover. This method involves comparing the pixel-scale product with independently observed data for the same ground parameter at the same time and place [46]. Here, for each NUTS-2 region and for each year of image acquisition, we randomly selected fish farms (covering almost one third of the total fish farm area in the region). To create the validation datasets, we first manually digitized reference polygons (examples are shown in Figure 5) based on the high-resolution satellite imagery and then converted them into raster images for comparison with our results. The two main classes of concern in the study (i.e., reed and non-reed) were represented within each pond boundary.
The pixel markers were tallied using ArcPro and Google Earth to further generate a binary confusion matrix. This was used to calculate the most commonly used validation index, the overall accuracy (OA) (Equation (2)). It is crucial to report the overall accuracy with caution, as the results may be biased due to (a) asymmetrical class distribution and (b) uneven distribution in the creation of the validation class [28]. Therefore, we additionally included other accuracy measures, such as sensitivity (S) (Equation (3)), which describes the ratio of the correctly predicted positive reed classes to the total number of positives; precision (P) (user’s accuracy, consumer’s accuracy, or positive predictive value) (Equation (4)); and the Kohen-kappa (K) (Equation (5)), to see how the classification results compared to values assigned by chance [47] (Cohen, 1960).
Overall   Accuracy   ( OA ) = TP + TN TP + FP + TN + FN
Sensitivity   ( S ) = TP TP + FN
Precision   ( P ) = TP TP + FP
Kappa   ( K ) = P 0 P e 1   - P e
where TP, TN, FP, and FN denote true positive, true negative, false positive, and false negative, respectively; P 0 is the relative observed agreement between the classification result and the reference; and P e is the hypothetical probability of chance agreement.

3. Results

3.1. Accuracy Assessment of Reed Cover Maps

For the years ranging from 2017 to 2021, we evaluated the accuracy of the extracted reed-like vegetation cover. We compared the extent of the reed-like vegetation cover within the fish ponds with sample polygons based on the Google Earth Pro images at 0.35–0.50 m resolution. The results for each region in the form of a confusion matrix are presented in Table 1.
Our results showed that the overall accuracy of the mapped reed cover in the fish ponds from all three regions was 92%, which indicated the high efficiency of the applied methodology. On the other hand, the calculated sensitivity, precision, and kappa index for the applied method were in the ranges of 0.60–0.75, 0.65–0.78, and 0.60–0.77, respectively. As these values were close to +1, the classification results were interpreted as being in good agreement with the validation sets. These values also suggested that the NDVI threshold-based approach has the ability to correctly identify pixels with reed-like vegetation (i.e., true positives) while minimizing the number of false negatives (where reed-like vegetation was identified on the ground but not by the classification method we used). The results showed that the NDVI-based approach is reliable for the comprehensive extraction of reed characteristics; however, in some cases, it was found that reed patches were not correctly delineated, as the number of false negatives was almost equal to the number of false positives. The possible reason for this ambiguity is discussed in Section 4.3.

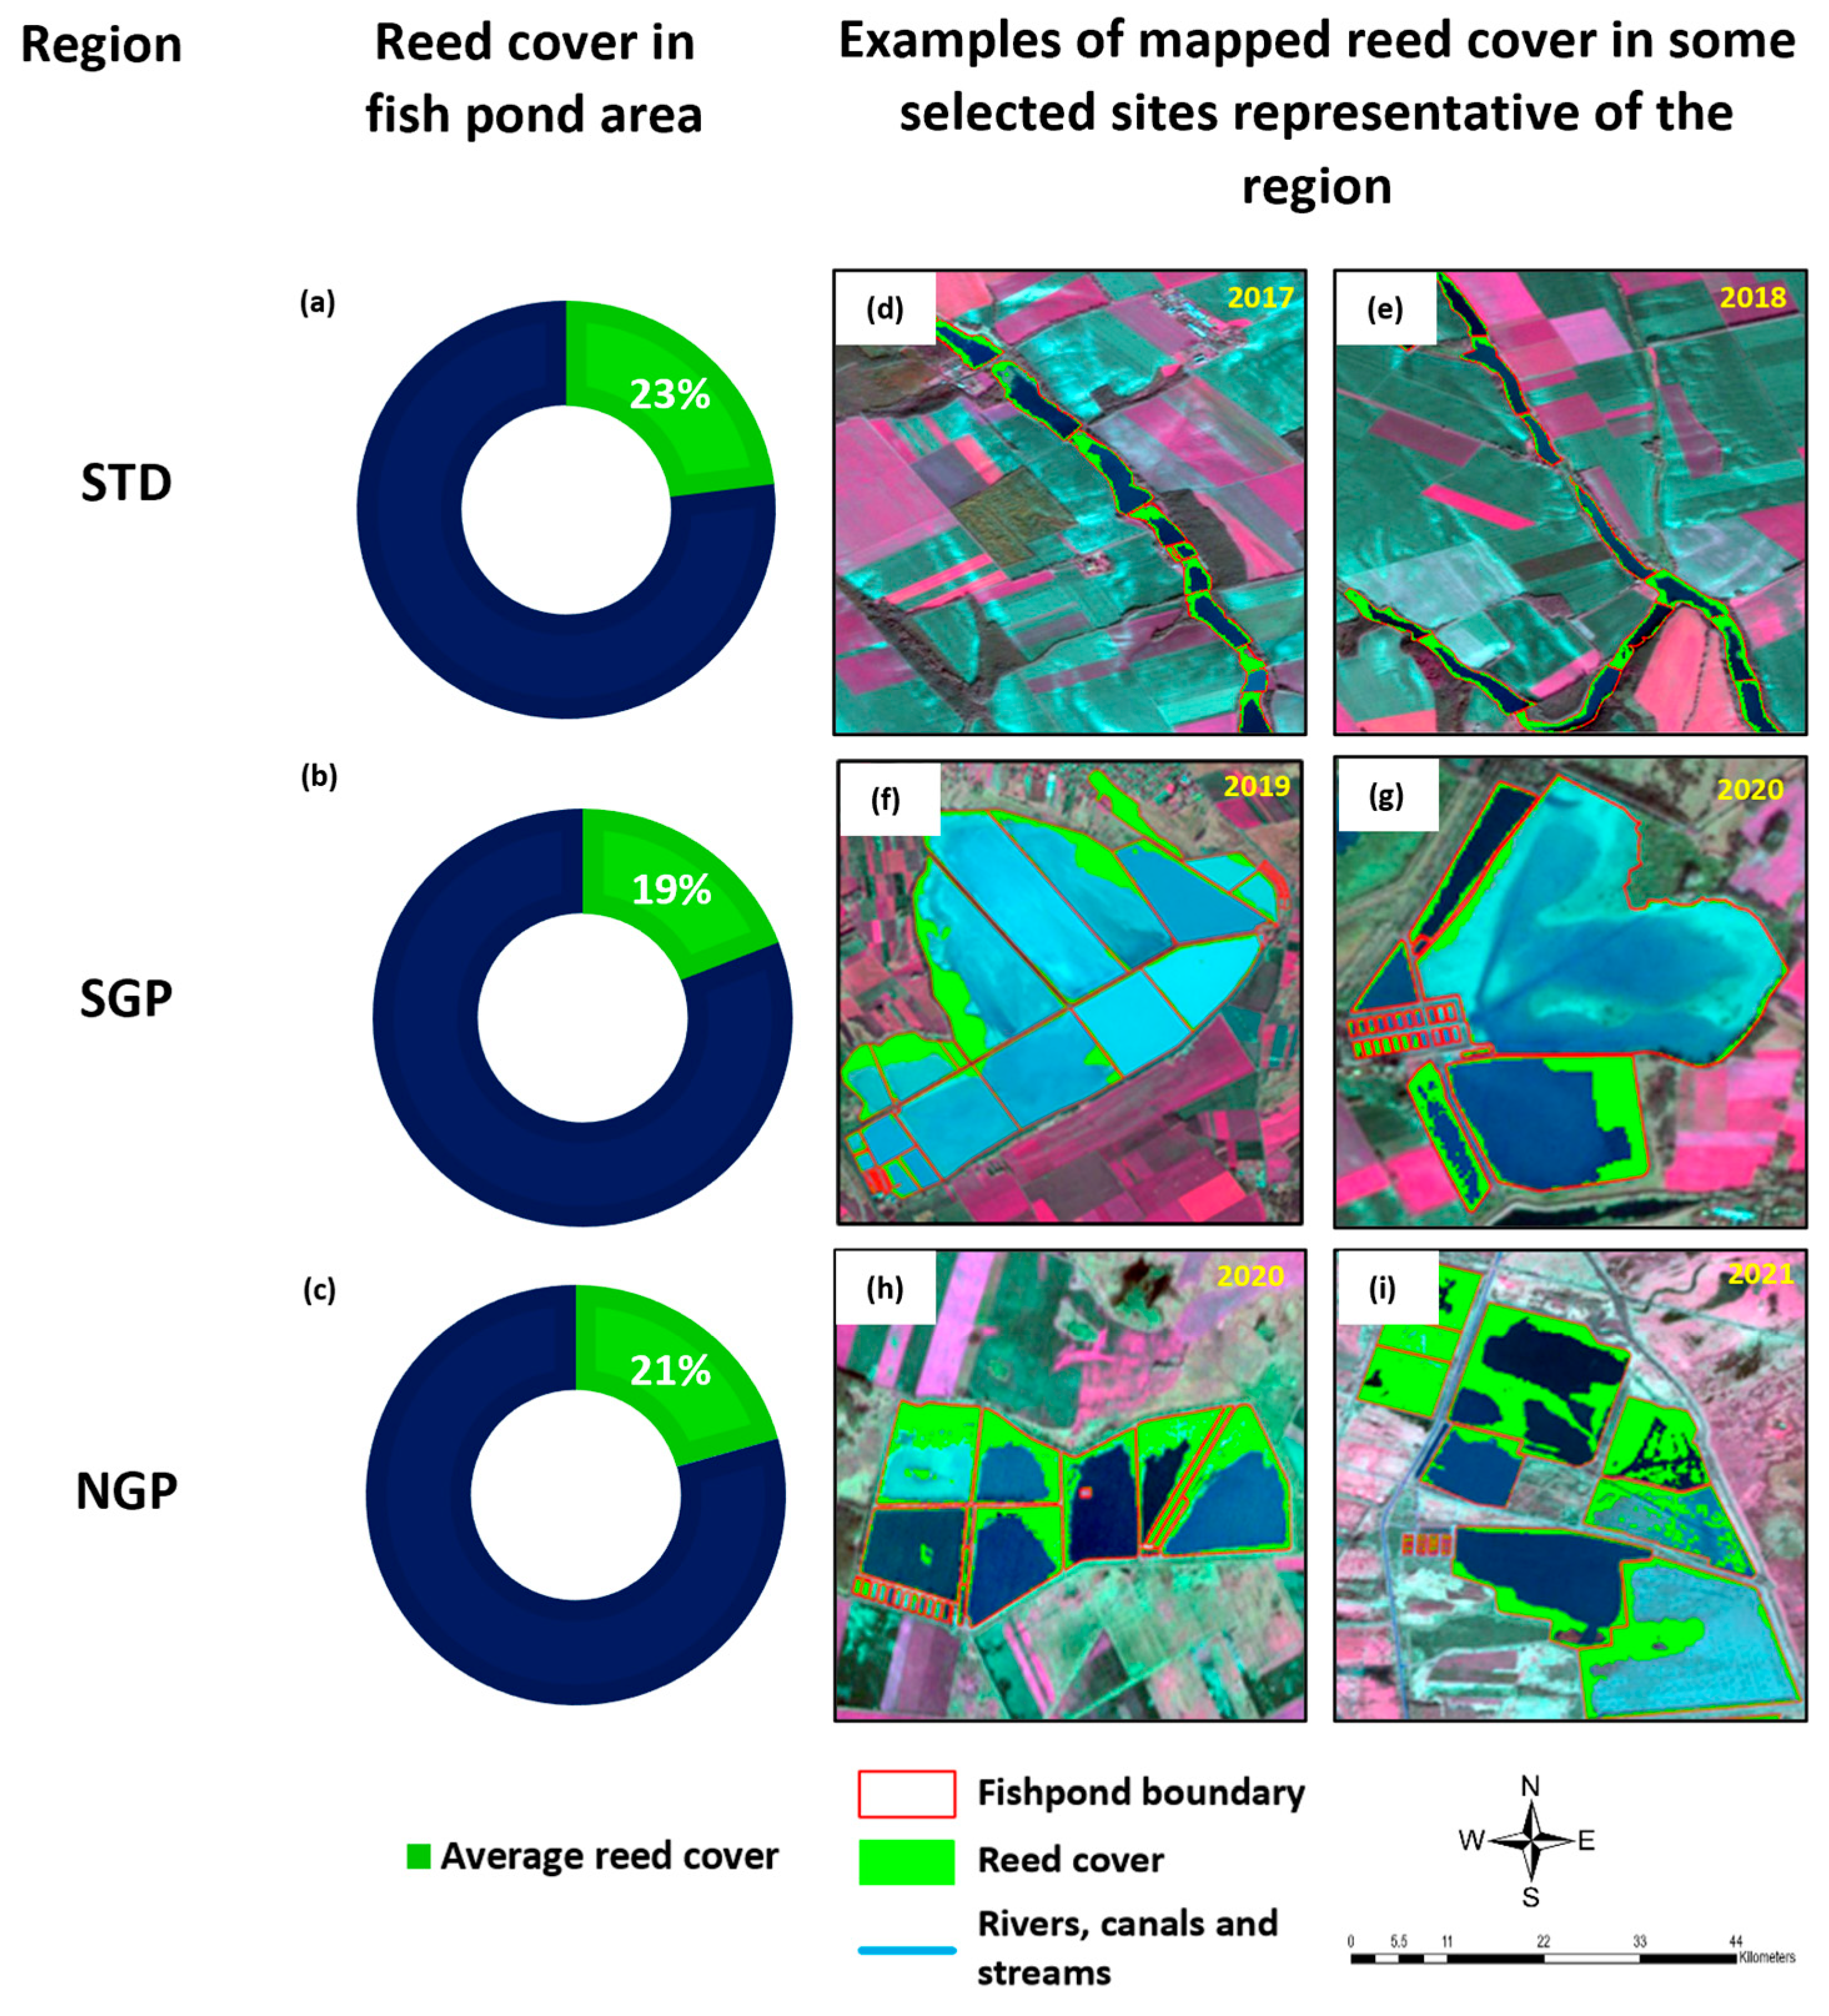
3.2. Spatial Extent of Reed Cover in Major Fish Production Regions

Based on the NDVI thresholds, we extracted the reed-like vegetation in the fish ponds in the three main fish-producing regions in Hungary. The average extent of reed cover between 2017 and 2021 was 29.90% in STD fish ponds, 26.04% in NGP fish ponds, and 23.64%, in SGP fish ponds. The reed areas in longitudinal barrage ponds were more often characterized by vegetated areas along the shorelines of the ponds, whereas, in the round-dam ponds with larger sizes (>20 ha), the reed vegetation had a more irregular shape, often forming an island within the pond not directly connected to the littoral reed cover. Figure 6 shows the results of reed mapping for several representative sites.

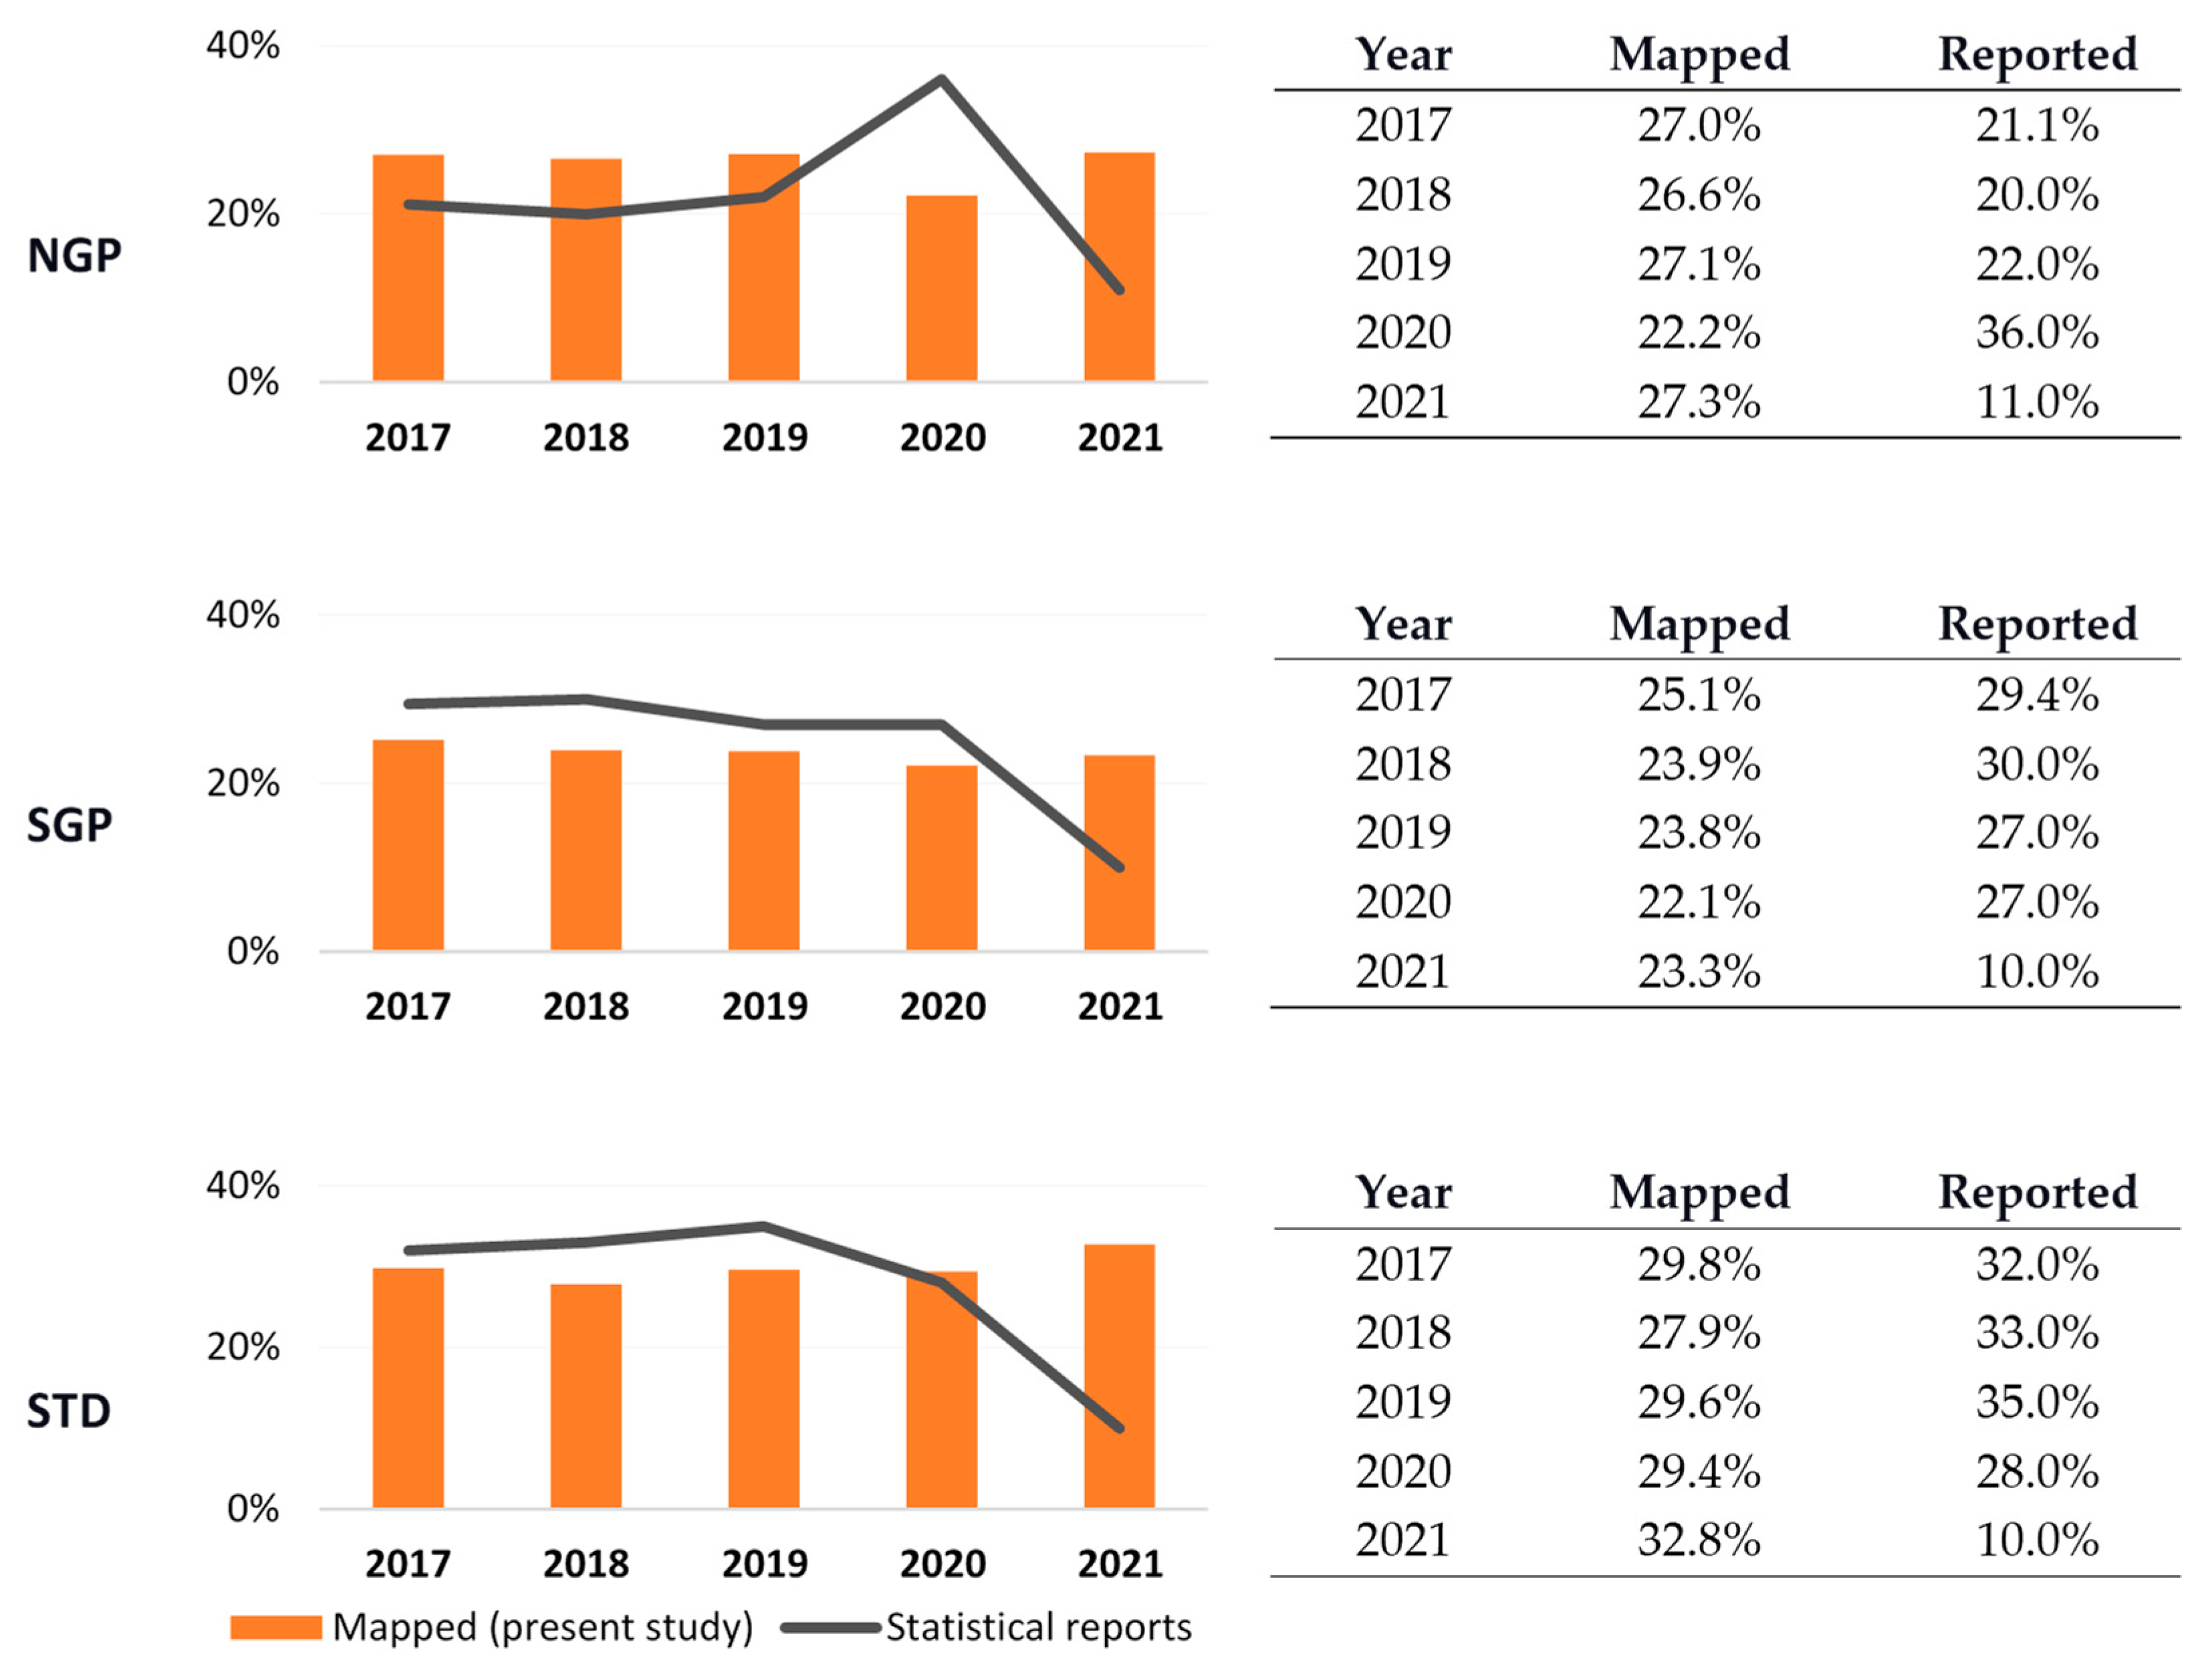
3.3. Interannual Changes in Reed Cover in Fish Ponds from 2017 to 2021

Figure 7 shows the change in mapped reed cover over time in the main carp-producing regions over the period covered in the study. To facilitate comparison with officially published data, values from sectorial statistical reports are also plotted in the figure. The variation in the yearly mapped values (the difference between the minimum and maximum values in the period studied) was smaller than that in the official reports.
The highest values were mapped for the STD region, where the typical elongated shape of the ponds makes the ratio of pond perimeter to pond area higher than that of the large, rectangular round-dam-shaped ponds in the Great Plains.

4. Discussion

4.1. Advantages of Reed Mapping Using NDVI-Based Remote Sensing Technique

In order to manage the aquaculture sector in a sustainable manner, policymakers, regulators, scientists, farmers, environmentalists, and other stakeholders need accurate data on production and environmental performance indicators, the state of production infrastructure, and so on. As field data collection has limitations in terms of data quality and is often costly, large-scale remote sensing surveys (especially using satellite imagery) have gained importance due to their ability to provide critical information on the global aquaculture sector, including yield and pond area predictions [48], information regarding site selection for the initiation of sustainable shrimp farming [49], information regarding the monitoring of algal bloom in salmon farming [50], remotely sensed information for the determination of the impact of climate change on site suitability for scallop aquaculture [51], etc.
Several studies indicate that data availability, data quality, and data suitability limit the application of GISs in aquaculture management [52]. In our study, we sought to identify a tool that would generate more accurate information than existing data sources at a broader (national and regional) scale. Figure 7 suggests that data on annual reed cover found in official aquaculture reports exhibit unjustified variations from one year to another, making this source of information, which is based on farmers’ self-reporting, unreliable for environmental studies. In contrast to official statistics, data generated from satellite imagery using the NDVI are more consistent over the years, and there may be reasons behind the small fluctuations in the data (e.g., climatic and ecological drivers, managerial interventions). The resulting products from the satellite imagery can serve as a permanent, geographically linked image database for the monitoring of the future contraction and spread of reed-like vegetation in fish ponds over time. High-precision mapping of reed-like vegetation can also provide a reference for the restoration and management of the emergent macrophyte vegetation in and around fish ponds to further strengthen their biodiversity maintenance and nutrient-cycling ecological functions.

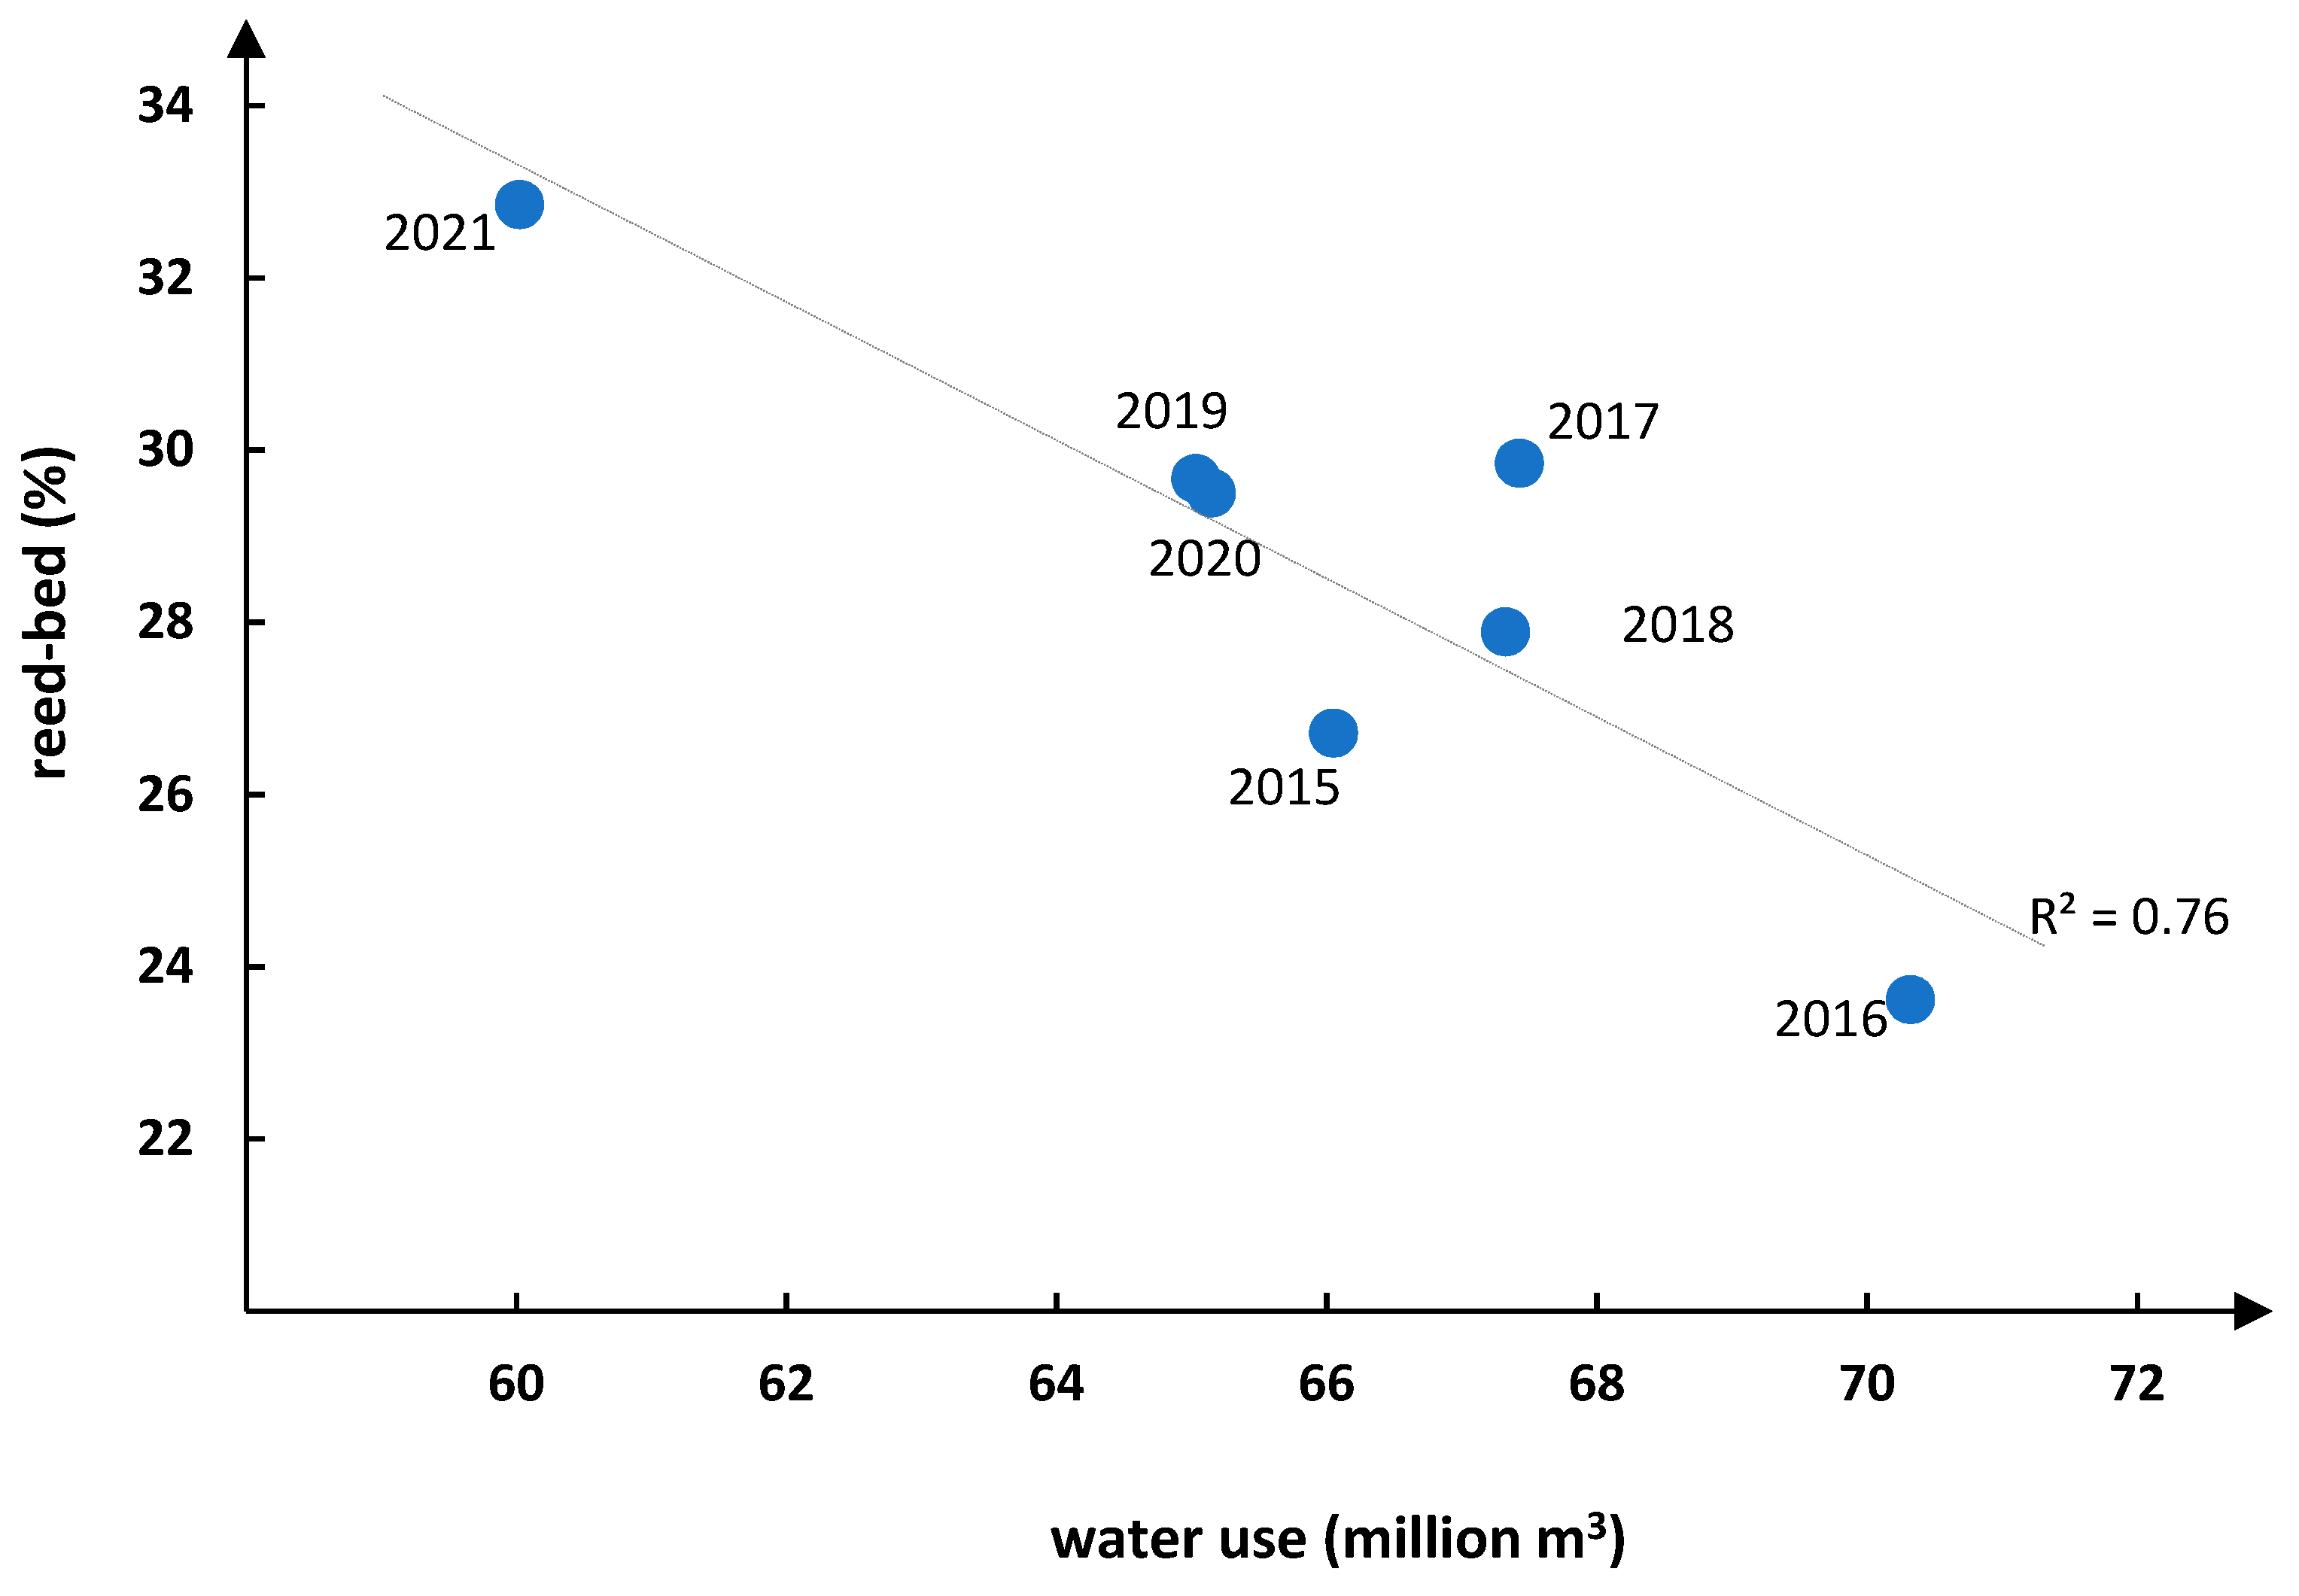
4.2. Potential Use in Climate Change Studies

Among the potential applications, we can highlight the suitability of the NDVI-based reed mapping tool for tracking the impact of temporal water scarcity on reed cover. With significantly altered precipitation patterns and increasing evaporation rates, climate change is associated with increased frequency of periods of inadequate water supply in catchment ponds. In addition to the immediate negative effects (reduced aquatic space, concentrated nutrient levels, oxygen depletion, etc.), the resulting lower water levels also have longer-term negative effects on production by facilitating the expansion of reed beds.
In Hungary, STD fish ponds are supplied by a relatively small catchment area and are, therefore, more sensitive to water shortages caused by climate change. In recent production seasons characterized by dry weather and, consequently, low water flows in watercourses, farm managers have not been able to fully fill ponds to the desired operational levels. According to AKI statistics, aquaculture water consumption in the STD region decreased in 2019, 2020, and 2021 compared to the preceding years. Figure 8 plots the annual values for water use against mapped reed cover for the years for which water use statistics are available from the annual reports. Although the plot suggests that there is an inverse relationship between water levels (determined by water availability) and reed-like vegetation area, it is beyond the scope of this paper to provide a detailed statistical analysis of the effects of water scarcity.
Rather, we aim to highlight the potential use of NDVI-based reed mapping tools in climate change studies, given the importance of the issue. Given the increasing availability of historical satellite imagery sets, the tool is well-placed to generate the long-term, large-scale data required to conduct climate change studies.

4.3. Uncertainties and Limitations

In this study, rather than developing a novel method, we focused on demonstrating the application of remote sensing techniques, including the well-known vegetation index (i.e., the NDVI), for the extraction of the reed-like vegetation cover in fish ponds. We exclusively used the free satellite imagery from Sentinel-2, which is available in the public domain for larger areas (e.g., at the national level) and can be easily used by different types of stakeholders. Compared to the images from unmanned aerial vehicles (UAVs), Sentinel-2 images have a lower resolution (i.e., 10 m × 10 m), which negatively affected our reed classification results. It is also important to note that we created a median value (i.e., DN, TOA, or reflectance) on a pixel-by-pixel basis from the annual composite of satellite imagery. There is a good chance that, if the median image is not produced in the best possible way, a significantly different classification result will be obtained [53]. Furthermore, the consistency of the time series and the availability of multispectral imagery are both limited by cloud cover.
Although the pixel-based approach used in our study is straightforward to implement, in some cases, it may show an inconsistent pattern of classification. As the NDVI is a measure of reflectance, real-world objects with comparable reflectance may fall into the same class or classes. Optically active materials, such as plankton, silt, and organic molecules, also affect the scattering and absorption of radiation [54]. When interpreting the radiometric signal of macrophyte reed beds in shallow water, bottom reflectance also has a considerable effect.
In addition, water management practices, which affect water level fluctuations in fish-pond systems, are critical to capturing the reflectance measurements of reed-like vegetation [12]. For example, when fish ponds are overfilled with water during the production season, the optical spectral region of electromagnetic radiation is strongly absorbed by the water, significantly reducing the radiometric signal. However, later in the year, the absence or scarcity of water in the fish ponds results in higher reflectance values, leading to an overestimation of the vegetation cover [55]. Therefore, certain environmental thresholds need to be carefully established to extract the reed cover in different fish ponds.

5. Conclusions

The dataset of reed cover in the fish ponds of the main production regions of Hungary generated using high-resolution satellite imagery in this study is the first of its kind. By applying an effective NDVI threshold-based approach to Sentinel-2 time-series imagery data, we identified reed-like vegetation cover and its interannual changes between 2017 and 2021. The extracted reed cover maps showed an overall accuracy of more than 90%, demonstrating that the dataset generated in this study provided a reliable match with the ground reality. This work serves as a basis for the development of an improved and cost-effective method for mapping the reed-like vegetation coverage within fish ponds, and the resulting fine-resolution information can provide a data-supported foundation for the planning and management of reed cover in fish ponds and promote sustainable aquaculture practices.

Author Contributions

Conceptualization, P.S., G.G., G.K., and B.K.; methodology, P.S., G.G., B.K., and G.K.; software, P.S. and G.K.; validation, P.S. and G.K.; data curation, P.S., G.G., M.V., B.K., B.H.-K., G.K., E.B., and M.G.; writing—original draft preparation, P.S. and G.G.; writing—review and editing, P.S., G.G., M.V., B.K., B.H.-K., G.K., E.B., and M.G.; visualization, P.S. and G.G.; supervision, G.G., M.V., B.H.-K., and E.B.; funding acquisition, G.G., M.V., B.H.-K., and E.B. All authors have read and agreed to the published version of the manuscript.

Funding

This research was carried out as part of the EATFISH project, funded by the European Union’s Horizon 2020 research and innovation program under grant agreement no. 956697.

Data Availability Statement

Data are available in a publicly accessible repository. The data presented in this study are openly available in Mendeley Data as: Sharma, Priya; Varga, Mónika; Kerezsi, György; Kajári, Balázs; Halasi-Kovács, Béla; Bozánné Békefi, Emese; Márta, Gaál; Gyalog, Gergő (2023), “Dataset: Geographical distribution and reed cover of Hungarian fishponds”, Mendeley Data, VI, doi: 10.17632/dh6n2zfkn4.1.

Conflicts of Interest

The authors declare no conflict of interest. The funders had no role in the design of the study; in the collection, analyses, or interpretation of data; in the writing of the manuscript; or in the decision to publish the results.

References

  1. European Market Observatory for Fisheries and Aquaculture Products. The EU Fish Market; Publications Office of the European Union: Luxembourg, 2021. [Google Scholar]
  2. Bekefi, E.; Varadi, L. Multifunctional Pond Fish Farms in Hungary. Aquac. Int. 2007, 15, 227–233. [Google Scholar] [CrossRef]
  3. Palásti, P.; Kiss, M.; Gulyás, Á.; Kerepeczki, É. Expert Knowledge and Perceptions about the Ecosystem Services and Natural Values of Hungarian Fishpond Systems. Water 2020, 12, 2144. [Google Scholar] [CrossRef]
  4. Rejmánková, E. The Role of Macrophytes in Wetland Ecosystems. J. Ecol. Environ. 2011, 34, 333–345. [Google Scholar] [CrossRef]
  5. Boyd, C.E.; Gross, A. Water Use and Conservation for Inland Aquaculture Ponds. Fish. Manag. Ecol. 2000, 7, 55–63. [Google Scholar] [CrossRef]
  6. Farrant, D.N.; Frank, K.L.; Larsen, A.E. Reuse and Recycle: Integrating Aquaculture and Agricultural Systems to Increase Production and Reduce Nutrient Pollution. Sci. Total Environ. 2021, 785, 146859. [Google Scholar] [CrossRef] [PubMed]
  7. Nag, S.K.; Das Ghosh, B.; Nandy, S.; Aftabuddin, M.; Sarkar, U.K.; Das, B.K. Comparative Assessment of Carbon Sequestration Potential of Different Types of Wetlands in Lower Gangetic Basin of West Bengal, India. Environ. Monit. Assess. 2023, 195, 154. [Google Scholar] [CrossRef]
  8. Kerepeczki, É.; Gál, D.; Kosáros, T.; Hegedűs, R.; Gyalog, G.; Pekár, F. Natural Water Treatment Method for Intensive Aquaculture Effluent Purification. Stud. Univ. Vasile Goldis Ser. Stiintele Vietii 2011, 21, 827–837. [Google Scholar]
  9. Popp, J.; Békefi, E.; Duleba, S.; Oláh, J. Multifunctionality of Pond Fish Farms in the Opinion of the Farm Managers: The Case of Hungary. Rev. Aquac. 2019, 11, 830–847. [Google Scholar] [CrossRef]
  10. Turkowski, K.; Lirski, A. Non-Productive Functions of Fish Ponds and Their Possible Economic Evaluation. In Carp Culture in Europe. Current Status, Problems, Perspectives; Lirski, A., Pyć, A., Eds.; IRŚ Olsztyn Pub.: Kazimierz Dolny, Poland, 2011; pp. 25–42. [Google Scholar]
  11. Francová, K.; Šumberová, K.; Kučerová, A.; Šorf, M.; Grill, S.; Exler, N.; Vrba, J. Drivers of Plant Species Composition of Ecotonal Vegetation in Two Fishpond Management Types. Wetl. Ecol. Manag. 2021, 29, 93–110. [Google Scholar] [CrossRef]
  12. Francová, K.; Šumberová, K.; Kučerová, A.; Čtvrtlíková, M.; Šorf, M.; Borovec, J.; Drozd, B.; Janauer, G.A.; Vrba, J. Macrophyte Assemblages in Fishponds under Different Fish Farming Management. Aquat. Bot. 2019, 159, 103131. [Google Scholar] [CrossRef]
  13. Francová, K.; Šumberová, K.; Janauer, G.A.; Adámek, Z. Effects of Fish Farming on Macrophytes in Temperate Carp Ponds. Aquac. Int. 2019, 27, 413–436. [Google Scholar] [CrossRef]
  14. Gyalog, G.; Berzi-Nagy, L.; Tóth, F.; Békefi, E.; Bojtárné Lukácsik, M. An Analysis of Production Factors in Carp Farming in Hungary (A Hazai Pontyhozamokat Meghatározó Tényezők És a Termelést Korlátozó Erőforrások Elemzése Termelési Függvény Alapján). GAZDÁLKODÁS Sci. J. Agric. Econ. 2021, 65, 130–140. [Google Scholar] [CrossRef]
  15. Kiss, G. Statisztikai Jelentések. Lehalászás Jelentés 2007–2021 [Statistical Report on Harvest Results in the Aquaculture Sector (2007–2021)]; Agrárközgazdasági Intézet: Budapest, Hungary, 2022. [Google Scholar]
  16. Hancz, C.; Nagy, Z.; Gál, D.; Varga, D. Issues of Ecological and Economical Sustainability of Fish Culture in the Southern Hydrological Basin of Lake Balaton. Acta Agrar. Kvar. 2015, 19, 25–29. [Google Scholar]
  17. Dronova, I. Object-Based Image Analysis in Wetland Research: A Review. Remote Sens. 2015, 7, 6380–6413. [Google Scholar] [CrossRef]
  18. Anderson, C.J.; Heins, D.; Pelletier, K.C.; Bohnen, J.L.; Knight, J.F. Mapping Invasive Phragmites Australis Using Unoccupied Aircraft System Imagery, Canopy Height Models, and Synthetic Aperture Radar. Remote Sens. 2021, 13, 3303. [Google Scholar] [CrossRef]
  19. Mohler, R.L.; Morse, J.M. Using UAV Imagery to Map Invasive Phragmites Australis on the Crow Island State Game Area, Michigan, USA. Wetl. Ecol. Manag. 2022, 30, 1213–1229. [Google Scholar] [CrossRef]
  20. Stratoulias, D.; Balzter, H.; Zlinszky, A.; Tóth, V.R. Assessment of Ecophysiology of Lake Shore Reed Vegetation Based on Chlorophyll Fluorescence, Field Spectroscopy and Hyperspectral Airborne Imagery. Remote Sens. Environ. 2015, 157, 72–84. [Google Scholar] [CrossRef]
  21. Burai, P.; Lövei, G.; Lénárt, C.; Nagy, I.; Enyedi, E. Mapping Aquatic Vegetation of the Rakamaz-Tiszanagyfalui Nagy-Morotva Using Hyperspectral Imagery. AGD Landsc. Environ. 2021, 4, 2010–2011. [Google Scholar]
  22. Burai, P.; Gaál, M.; Molnár, A.; Bekő, L. Halastavak Vizsgálata Távérzékelési Módszerekkel. In Az Elmélet és a Gyakorlat Találkozása a Térinformatikában X.: Theory Meets Practice in GIS; Molnár, V.É., Ed.; Debrecen University Press: Debrecen, Hungary, 2019. [Google Scholar]
  23. Tóth, V.R. Monitoring Spatial Variability and Temporal Dynamics of Phragmites Using Unmanned Aerial Vehicles. Front Plant Sci. 2018, 9, 728. [Google Scholar] [CrossRef]
  24. Petus, C.; Lewis, M.; White, D. Monitoring Temporal Dynamics of Great Artesian Basin Wetland Vegetation, Australia, Using MODIS NDVI. Ecol. Indic. 2013, 34, 41–52. [Google Scholar] [CrossRef]
  25. Zhao, B.; Yan, Y.; Guo, H.; He, M.; Gu, Y.; Li, B. Monitoring Rapid Vegetation Succession in Estuarine Wetland Using Time Series MODIS-Based Indicators: An Application in the Yangtze River Delta Area. Ecol. Indic. 2009, 9, 346–356. [Google Scholar] [CrossRef]
  26. Zhao, Y.; Mao, D.; Zhang, D.; Wang, Z.; Du, B.; Yan, H.; Qiu, Z.; Feng, K.; Wang, J.; Jia, M. Mapping Phragmites Australis Aboveground Biomass in the Momoge Wetland Ramsar Site Based on Sentinel-1/2 Images. Remote Sens. 2022, 14, 694. [Google Scholar] [CrossRef]
  27. Damtew, Y.T.; Verbeiren, B.; Awoke, A.; Triest, L. Satellite Imageries and Field Data of Macrophytes Reveal a Regime Shift of a Tropical Lake (Lake Ziway, Ethiopia). Water 2021, 13, 396. [Google Scholar] [CrossRef]
  28. Kajári, B.; Bozán, C.; Van Leeuwen, B. Monitoring of Inland Excess Water Inundations Using Machine Learning Algorithms. Land 2023, 12, 36. [Google Scholar] [CrossRef]
  29. Heung, B.; Ho, H.C.; Zhang, J.; Knudby, A.; Bulmer, C.E.; Schmidt, M.G. An Overview and Comparison of Machine-Learning Techniques for Classification Purposes in Digital Soil Mapping. Geoderma 2016, 265, 62–77. [Google Scholar] [CrossRef]
  30. Berhane, T.M.; Lane, C.R.; Wu, Q.; Anenkhonov, O.A.; Chepinoga, V.V.; Autrey, B.C.; Liu, H. Comparing Pixel- and Object-Based Approaches in Effectively Classifying Wetland-Dominated Landscapes. Remote Sens. 2018, 10, 46. [Google Scholar] [CrossRef] [PubMed]
  31. Ayhan, B.; Kwan, C.; Budavari, B.; Kwan, L.; Lu, Y.; Perez, D.; Li, J.; Skarlatos, D.; Vlachos, M. Vegetation Detection Using Deep Learning and Conventional Methods. Remote Sens. 2020, 12, 2502. [Google Scholar] [CrossRef]
  32. Kiss, G. Statisztikai Jelentések. Lehalászás Jelentés 2021. Év [Harvest Report for the Year 2021]. Available online: http://repo.aki.gov.hu/3943/ (accessed on 7 March 2023).
  33. Bordós, G.; Urbányi, B.; Micsinai, A.; Kriszt, B.; Palotai, Z.; Szabó, I.; Hantosi, Z.; Szoboszlay, S. Identification of Microplastics in Fish Ponds and Natural Freshwater Environments of the Carpathian Basin, Europe. Chemosphere 2019, 216, 110–116. [Google Scholar] [CrossRef]
  34. Institute of Agricultural Economics (AKI). Available online: https://www.aki.gov.hu/ (accessed on 7 March 2023).
  35. Kiss, G. Statisztikai Jelentések. Lehalászás Jelentés 2017. Év [Harvest Report for the Year 2017]. Available online: http://repo.aki.gov.hu/3175/ (accessed on 7 March 2023).
  36. Kiss, G. Statisztikai Jelentések. Lehalászás Jelentés 2018. Év [Harvest Report for the Year 2018]. Available online: http://repo.aki.gov.hu/3414/ (accessed on 7 March 2023).
  37. Kiss, G. Statisztikai Jelentések. Lehalászás Jelentés 2019. Év [Harvest Report for the Year 2019]. Available online: http://repo.aki.gov.hu/3584/ (accessed on 7 March 2023).
  38. Kiss, G. Statisztikai Jelentések. Lehalászás Jelentés 2020. Év [Harvest Report for the Year 2020]. Available online: http://repo.aki.gov.hu/3773/ (accessed on 7 March 2023).
  39. Kumar, G.; Singh, K.K. Mapping and Monitoring the Selected Wetlands of Punjab, India, Using Geospatial Techniques. J. Indian Soc. Remote Sens. 2020, 48, 615–625. [Google Scholar] [CrossRef]
  40. Aryal, J.; Sitaula, C.; Aryal, S. NDVI Threshold-Based Urban Green Space Mapping from Sentinel-2A at the Local Governmental Area (LGA) Level of Victoria, Australia. Land 2022, 11, 351. [Google Scholar] [CrossRef]
  41. Cetin, M.; Isik Pekkan, O.; Bilge Ozturk, G.; Senyel Kurkcuoglu, M.A.; Kucukpehlivan, T.; Cabuk, A. Examination of the Change in the Vegetation Around the Kirka Boron Mine Site by Using Remote Sensing Techniques. Water Air Soil Pollut. 2022, 233, 254. [Google Scholar] [CrossRef]
  42. Tóth, V.R.; Szabo, K. Morphometric Structural Analysis of Phragmites Australis Stands in Lake Balaton. Ann. Limnol.-Int. J. Limnol. 2012, 48, 241–251. [Google Scholar] [CrossRef]
  43. Lantz, N. Detection and Mapping of Phragmites Australis Using High Resolution Multispectral and Hyperspectral Satellite Imagery. Master’s Thesis, The University of Western Ontario, London, ON, Canada, 2012. [Google Scholar]
  44. Abeysinghe, T.; Milas, A.S.; Arend, K.; Hohman, B.; Reil, P.; Gregory, A.; Vázquez-Ortega, A. Mapping Invasive Phragmites Australis in the Old Woman Creek Estuary Using UAV Remote Sensing and Machine Learning Classifiers. Remote Sens. 2019, 11, 1380. [Google Scholar] [CrossRef]
  45. Xue, J.; Su, B. Significant Remote Sensing Vegetation Indices: A Review of Developments and Applications. J. Sens. 2017, 2017, 1353691. [Google Scholar] [CrossRef]
  46. Liu, G. Basic Problems and Frontier of Hydrology. Adv. Water Sci. 2020, 31, 685–689. [Google Scholar] [CrossRef]
  47. Cohen, J. A Coefficient of Agreement for Nominal Scales. Educ. Psychol. Meas. 1960, 20, 37–46. [Google Scholar] [CrossRef]
  48. Ottinger, M.; Clauss, K.; Kuenzer, C. Opportunities and Challenges for the Estimation of Aquaculture Production Based on Earth Observation Data. Remote Sens. 2018, 10, 1076. [Google Scholar] [CrossRef]
  49. Rajitha, K.; Mukherjee, C.K.; Vinu Chandran, R. Applications of Remote Sensing and GIS for Sustainable Management of Shrimp Culture in India. Aquac. Eng. 2007, 36, 1–17. [Google Scholar] [CrossRef]
  50. Khan, R.M.; Salehi, B.; Mahdianpari, M.; Mohammadimanesh, F.; Mountrakis, G.; Quackenbush, L.J. A Meta-Analysis on Harmful Algal Bloom (HAB) Detection and Monitoring: A Remote Sensing Perspective. Remote Sens. 2021, 13, 4347. [Google Scholar] [CrossRef]
  51. Saitoh, S.I.; Mugo, R.; Radiarta, I.N.; Asaga, S.; Takahashi, F.; Hirawake, T.; Ishikawa, Y.; Awaji, T.; In, T.; Shima, S. Some Operational Uses of Satellite Remote Sensing and Marine GIS for Sustainable Fisheries and Aquaculture. ICES J. Mar. Sci. 2011, 68, 687–695. [Google Scholar] [CrossRef]
  52. Falconer, L.; Middelboe, A.L.; Kaas, H.; Ross, L.G.; Telfer, T.C. Use of Geographic Information Systems for Aquaculture and Recommendations for Development of Spatial Tools. Rev. Aquac. 2020, 12, 664–677. [Google Scholar] [CrossRef]
  53. Noi Phan, T.; Kuch, V.; Lehnert, L.W. Land Cover Classification Using Google Earth Engine and Random Forest Classifier—The Role of Image Composition. Remote Sens. 2020, 12, 2411. [Google Scholar] [CrossRef]
  54. Kirk, J.T.O. Light and Photosynthesis in Aquatic Ecosystems, 2nd ed.; Cambridge University Press: Cambridge, UK, 1994; p. 509. [Google Scholar]
  55. Zhou, J.; Zhou, W.; Zhou, Q.; Zhu, Y.; Xie, F.; Liang, S.; Hu, Y. The Impact of Multiple Pond Conditions on the Performance of Dike-Pond Extraction. Fishes 2022, 7, 144. [Google Scholar] [CrossRef]
Figure 1. General information on the study area: (a) the NUTS-2 regions and the regions selected as the study area; (b) the three main fish production regions in Hungary and their topography; (ce) Sentinel-2 images showing typical examples of fish pond structure; (fh) field photographs of the fish ponds in (c,f) STD, (dg) the SGP, and (eh) the NGP.
Water 15 01554 g001
Figure 2. The area of geo-located fish ponds in the Shape files (presented in the Mendeley dataset) used for our study vs. the area of cultivated fish ponds in the annual reports for the region: (a) STD, (b) NGP, and (c) SGP.
Water 15 01554 g002
Figure 3. Number of high-quality Sentinel-2 images used in the study.
Water 15 01554 g003
Figure 4. Workflow of the reed cover estimation methodology.
Water 15 01554 g004
Figure 5. Example illustrating the use of high-resolution Google Earth Pro imagery to create the validation sets for the fish ponds in (a) STD for the year 2018, (b) the NGP for the year 2020, and (c) the SGP for the year 2019.
Water 15 01554 g005
Figure 6. (ac) The average area of mapped reed cover in the fish ponds in the three regions studied. Examples of mapped reed cover within the fish ponds: (d) the reed cover in fish ponds typical for STD in the year 2017 and (e) in 2018; (f) the reed cover in fish ponds typical for the SGP in the year 2019 and (g) in the year 2020; and (h) the reed cover in ponds typical for the NGP in the year 2020 and (i) in the year 2021. The Sentinel-2 false-color composite image (B11, B8, B2) was used as a basis for (di).
Water 15 01554 g006
Figure 7. Yearly values for NDVI-based mapped reed area as a percentage of total pond area (orange columns). Line graphs representing data from official statistical reports are superimposed on the bar charts.
Water 15 01554 g007
Figure 8. A comparative plot of annual values for water uses in pond aquaculture in the STD region according to official statistical reports versus the mapped reed area as a percentage of the total pond area.
Water 15 01554 g008
Table 1. Confusion matrix showing classification accuracy of reed cover mapped between the years 2017 and 2021 in STD, NGP, and SGP fish ponds.
YearNUTS-2 RegionAccuracy (OA)Sensitivity (S)Precision (P)Kappa (K)
2017STD0.880.850.350.44
NGP0.910.430.840.52
SGP0.930.920.760.80
2018STD0.940.830.580.65
NGP0.910.460.800.54
SGP0.920.860.730.75
2019STD0.930.820.490.58
NGP0.940.650.860.70
SGP0.870.700.910.70
2020STD0.950.810.650.70
NGP0.920.820.470.56
SGP0.950.790.890.80
2021STD0.920.510.880.61
NGP0.940.710.910.76
SGP0.920.780.960.80
AverageSTD0.920.760.650.60
NGP0.920.810.850.77
SGP0.920.610.780.62
Disclaimer/Publisher’s Note: The statements, opinions and data contained in all publications are solely those of the individual author(s) and contributor(s) and not of MDPI and/or the editor(s). MDPI and/or the editor(s) disclaim responsibility for any injury to people or property resulting from any ideas, methods, instructions or products referred to in the content.

