Article

Ecological Risk Assessment and Source Contributions of Heavy Metals in the Sediment of the Chan Thnal Reservoir, Kampong Speu, Cambodia

by
Lita Chheang
1,
Pichet Limsuwan
2,
Nisakorn Thongkon
1,
Tongchai Sriwiriyarat
3 and
Sudtida Pliankarom Thanasupsin
4,*
1
Department of Chemistry, Faculty of Science, King Mongkut’s University of Technology Thonburi, Bangkok 10140, Thailand
2
Department of Physics, Faculty of Science, King Mongkut’s University of Technology Thonburi, Bangkok 10140, Thailand
3
Department of Chemical Engineering, Faculty of Engineering, Burapha University, Chonburi 20131, Thailand
4
Chemistry for Green Society and Healthy Living Research Unit, Faculty of Science, King Mongkut’s University of Technology Thonburi, Bangkok 10140, Thailand
*
Author to whom correspondence should be addressed.
Water 2023, 15(8), 1566; https://doi.org/10.3390/w15081566
Submission received: 9 February 2023 / Revised: 15 March 2023 / Accepted: 15 March 2023 / Published: 17 April 2023
(This article belongs to the Section Ecohydrology)

Abstract

:
Metal contamination from farming, inadequate wastewater treatment, and poor disposal of municipal garbage are major threats to public health. This research aimed to (1) assess the extent of heavy metal contamination in sediment samples, (2) describe the distribution of heavy metals by locating likely pollution sources using a positive matrix factorization (PMF) model, and (3) quantify the potential ecological consequences associated with these metals at six different places around the Chan Thnal Reservoir. The findings indicated steady degradation and suggested moderate to high metal contamination. Fe > Zn > Cr > Cu > Pb > Co > As > Mn > Cd was the trend of metal concentrations in the sediment. Various soil pollution indices showed that most of the studied sediment samples were clean, moderately clean, or slightly contaminated. However, Co and Cd reached high-risk conditions posing a severe problem to the local population living in and around the Chan Thnal Reservoir. Principal component analysis (PCA) was used to estimate primary factors in PMF analysis. It was found that the contamination of As, Cu, Zn, Cd, and Pb originated from agricultural and traffic vehicle sources; however, Zn, Fe, Mn, Cr, and Cu were derived from natural sources (e.g., atmospheric deposition and compost amendment). Furthermore, Fe, Cd, Mn, Co, Pb, and Cr were generated from urban and industrial sources (metal coatings, plastic burning, wastewater irrigation, and sewage sludge). Accordingly, this research improves our knowledge of the prevalence of heavy metal pollution in agroecosystems, which may be used to foresee and mitigate the risks of heavy metal exposure to humans and other organisms.

1. Introduction

The world’s fast-growing population contributes to rising industrial and agricultural production [1]. Heavy metals have been extensively used in modern industry and agriculture. Metals, including arsenic (As), copper (Cu), cadmium (Cd), lead (Pb), cobalt (Co), zinc (Zn), manganese (Mn), and iron (Fe), are widely used across a wide range of industries [2,3]. Heavy metals enter the environment through several processes, such as soil erosion of metal ions and leaching of heavy metals, metal corrosion, sediment resuspension, and atmospheric deposition. Parent rocks and metal-bearing minerals dominate their natural sources. The weathering of metal-bearing rocks and volcanic eruptions are essential processes contributing to heavy metal pollution. The primary anthropogenic sources are industrial and metallurgical activities, agricultural activities, transportation, wastewater discharge, and waste disposal [2,3,4,5]. These activities cause an escalating heavy metal accumulation in the environment.
The degree of heavy metal pollution in the environment is related to several components, such as their reaction rate, transport, and fate, which depend on the speciation and form of each metal. Many environmental processes may contribute to the relatively low levels of heavy metal contamination in the water or a high level in sediment or soil. These processes include biological immobilization, chemical precipitation and dissolution, plant uptake, complexation in water, ion exchange, adsorption, and transpiration [5]. Ecological risk is generally used to describe the threats posed by different metals [6,7,8,9,10,11]. Quantifying the ecological risk of sediment pollution is of the utmost importance in evaluating the impact of heavy metal pollution on ecosystems. Using sediment pollution indices, such as the geoaccumulation index (Igeo), ecological risk (ER), and potential ecological risk (PER), provides information on the pollution and risk levels of sediment quality based on individual metals [7,8,9,10,11,12]. Source identification and apportionment studies are indispensable for preventing and controlling pollution from heavy metal contamination. In this regard, many models are capable of identifying sources of heavy metal pollution, e.g., principal component analysis (PCA) [13,14,15,16,17], chemical mass balance (CMB) [5,18], or positive matrix factorization (PMF) [18,19,20]. Naturally, each model has different strengths and sensitivities. These models can be used for the analyses of source identification and source contribution of the concerned contamination or pollution in various environmental samples, such as surface water, soil, sediment, ambient air, and wet deposition [5,20,21,22,23,24].
PMF is a multivariate receptor model that does not require source profiles but can minimize many variables in complex analytical datasets and group them into source types and source contributions. Providing robust estimates and uncertainty diagnostics without constraints to negative results makes it more effective than other approaches. The model can be used to analyze the source identification and contribution of the concerned contamination or pollution in various environmental samples, such as surface water, soil, sediment, ambient air, and wet deposition [5,20,21,24].
Cambodia has the typical two seasons of a tropical monsoon climate. The central region lies in a floodplain where the Tonle Sap and Mekong Rivers meet, while hilly mountains are located in the north and south. In Cambodia, agriculture dominates all other forms of economic activity. Rice is a staple food, and Cambodia’s primary income source comes from rice exports. Most of the arable land is used for rice farming. Vegetables are usually planted during the dry season after the rice is harvested. To attain marginal crop production, fertilizers and pesticides are generally used in paddy and crop farming. However, chemical fertilizers and pesticides remain essential to commercial cultivation and household production as they quickly increase yields and eradicate unwanted pests and weeds [25]. Direct exposure to the misuse of these chemicals has a detrimental effect on the health of farmers. Since pesticides and chemical fertilizers contain various heavy metals, drainage from agricultural areas where they are used may result in heavy metal contamination in natural water bodies. This circumstance leads to many hazards due to their toxicity, biodegradable persistence in the environment, and ability to bioaccumulate [18,25,26]. Additionally, the persistent contamination of toxic metals in natural waters leads to accumulation in sediments, water, animals, and plants, reaching levels that are potentially detrimental to typical ecosystem functioning and re-entering humans through the chain [18,25,26].
Focusing on the study area, Chan Thnal Reservoir, located in Kampong Speu, is the water source for Krang Chek commune’s and nearby communities’ agriculture and consumption. The abundance of aquatic flora (such as various lotus species) and aquatic life in the Chan Thnal Reservoir makes it a vital food bank for the community. However, urbanization heavily affects the Chan Thnal Reservoir, resulting in settlements of households, communities, markets, shops, and animal farms around the reservoir. Additionally, inadequate management of environmental sanitation and infrastructure development has created problems with urban waste management, including untreated sewage from homes and communities being discharged into the reservoir.
The primary goals of this study were to (1) assess the extent of heavy metal contamination in the sediment of the Chan Thnal Reservoir, (2) quantify the potential ecological risks associated with eight metals, and (3) identify the potential sources of metal contamination in the sediment using a positive matrix factorization (PMF) model.

2. Materials and Methods
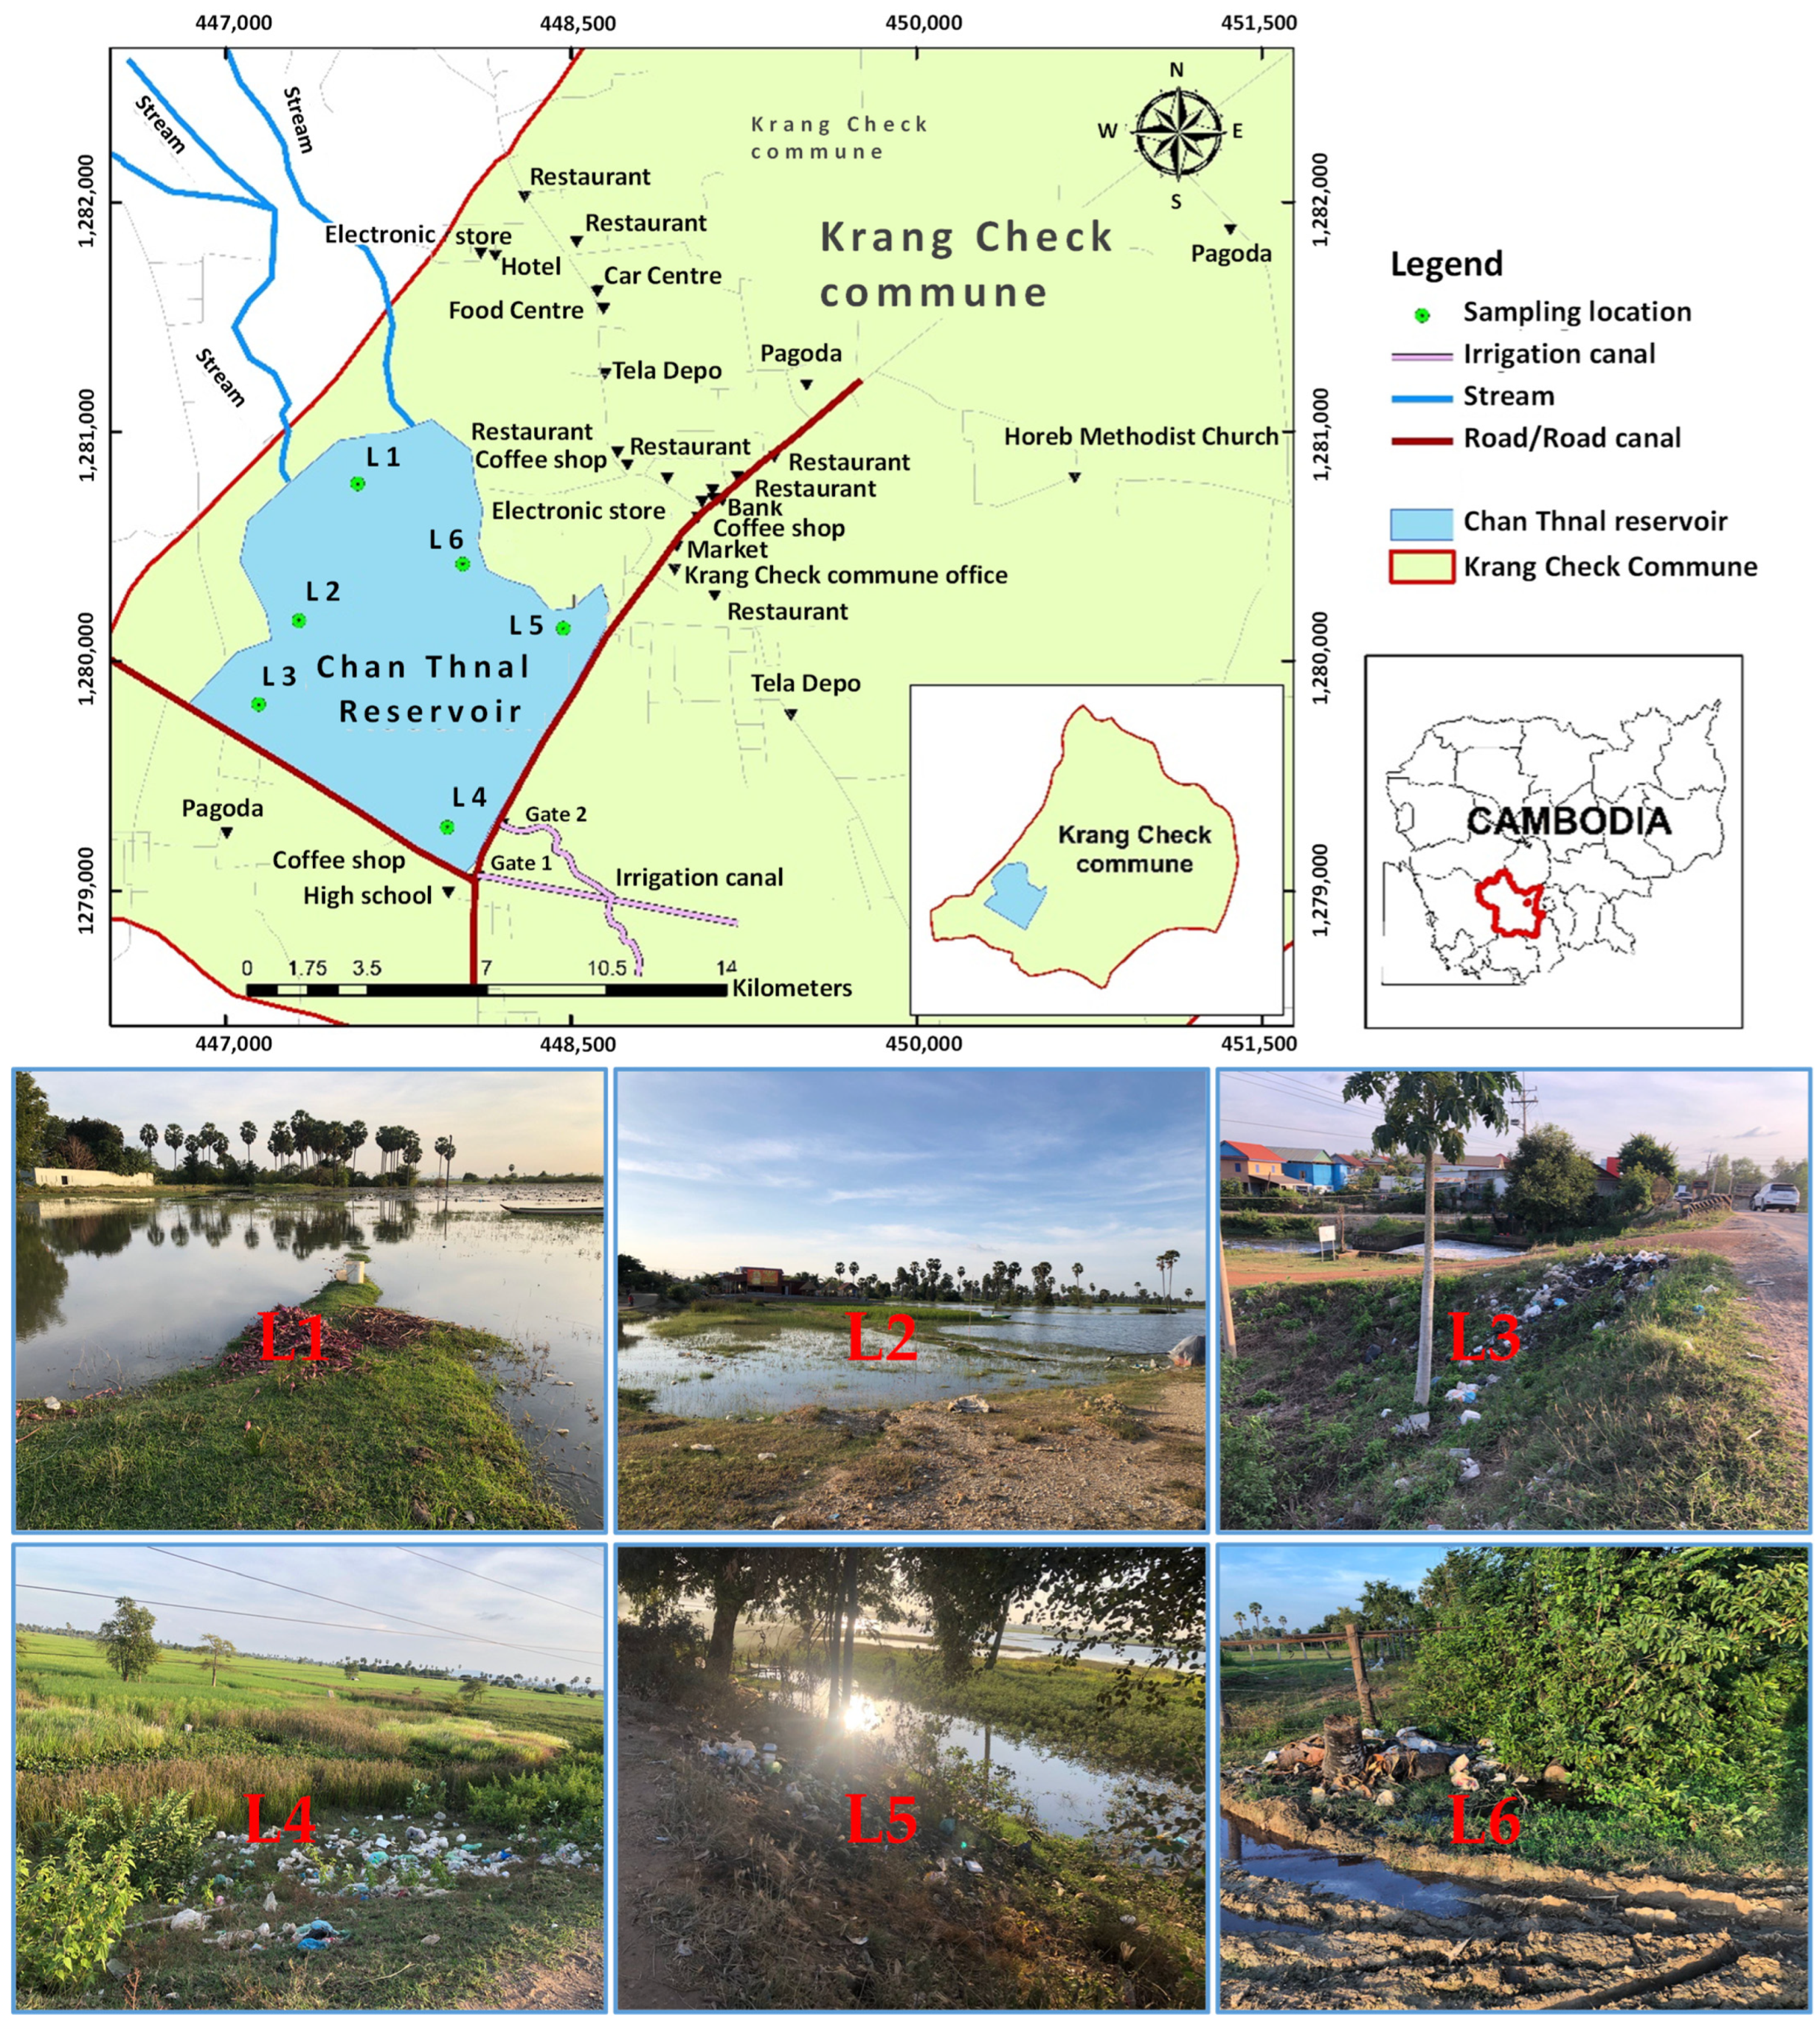
2.1. Study Area

The Chan Thnal Reservoir is situated at latitude 11°34′38.5″ N and longitude 104°31′18.2″ E in the Krang Chek district of Kampong Speu Province. The average annual rainfall is approximately 1400 mm. The reservoir’s catchment area is approximately 268 km2 resulting in a maximum capacity of three million cubic meters. It supplies the water from the main irrigation gate to the irrigation canals totaling 7320 m. The primary crop cultivated in this area is rice paddy. The reservoir is a water source and a community food bank for 2300 households in the Krang Check commune. The sediment characteristics are sand, loam, clay, or a combination of these three forms [1].

2.2. Sampling

There were 18 sediment samples collected using a grab sampler at a depth of approximately 0–20 cm from six locations in the Chan Thnal Reservoir during the dry and wet seasons in 2022 (Figure 1). As shown in Figure 1, each location is classified into the following categories:
L1: This location receives its inlet water from two major streams.
L2: This location is abundant in lotus growth, and it receives the discharge from agricultural activities (i.e., rice paddies and vegetable crops).
L3 and L4: These locations are near roads and canals that might carry runoff and discharge from areas, such as schools, rice paddies, and farmer households.
L5 and L6: These locations receive discharge from markets, petroleum stations, and cattle and poultry farms.

2.3. Sample Preparation

Sediment samples collected from six locations around the Chan Thnal Reservoir were transferred to acid-washed polyethylene bags, kept at 3–4 °C, and transported back to the laboratory within 24 h [1,8,27]. Upon arrival, the samples were air-dried for one week at room temperature before grinding with agate mortar and sieving with 2 mm nylon mesh [13]. Then, 1 g of dried sediment samples was digested with a mixture of 5 mL of 65% HNO3, 15 mL of 37% HCl, and 10 mL of 30% H2O2 at 180–220 °C on a hotplate in a fume hood for 2 h. The liquid mixtures were then filtered through Whatman filter paper (grade no. 42, diameter 70 mm), followed by filtration through a nylon membrane filter before adjusting to 25 mL with deionized water [28,29,30]. The concentrations of heavy metals were quantified by an inductively coupled plasma optical emission spectrometer (ICP-OES, Perkin Elmer, Optima 8000 DV, Waltham, MA, USA). The recovery percentages and the R2 values of the heavy metal measurements in the sediment samples were as follows: Cd (93 ± 9%, R2 = 0.999), Cu (103 ± 6%, R2 = 1), Zn (97 ± 8%, R2 = 0.9999), Pb (93 ± 6%, R2 = 0.9999), As (115 ± 7%, R2 = 0.9977), Cr (110 ± 6%, R2 = 0.9997), Mn (105 ± 7%, R2 = 1), Co (85 ± 3%, R2 = 0.9999), and Fe (115 ± 9%, R2 = 1). The method precision was evaluated based on the relative standard deviation (RSD). The values ranged from 1.54 to 10.46% (n = 3).

2.4. Pollution Assessment Methods

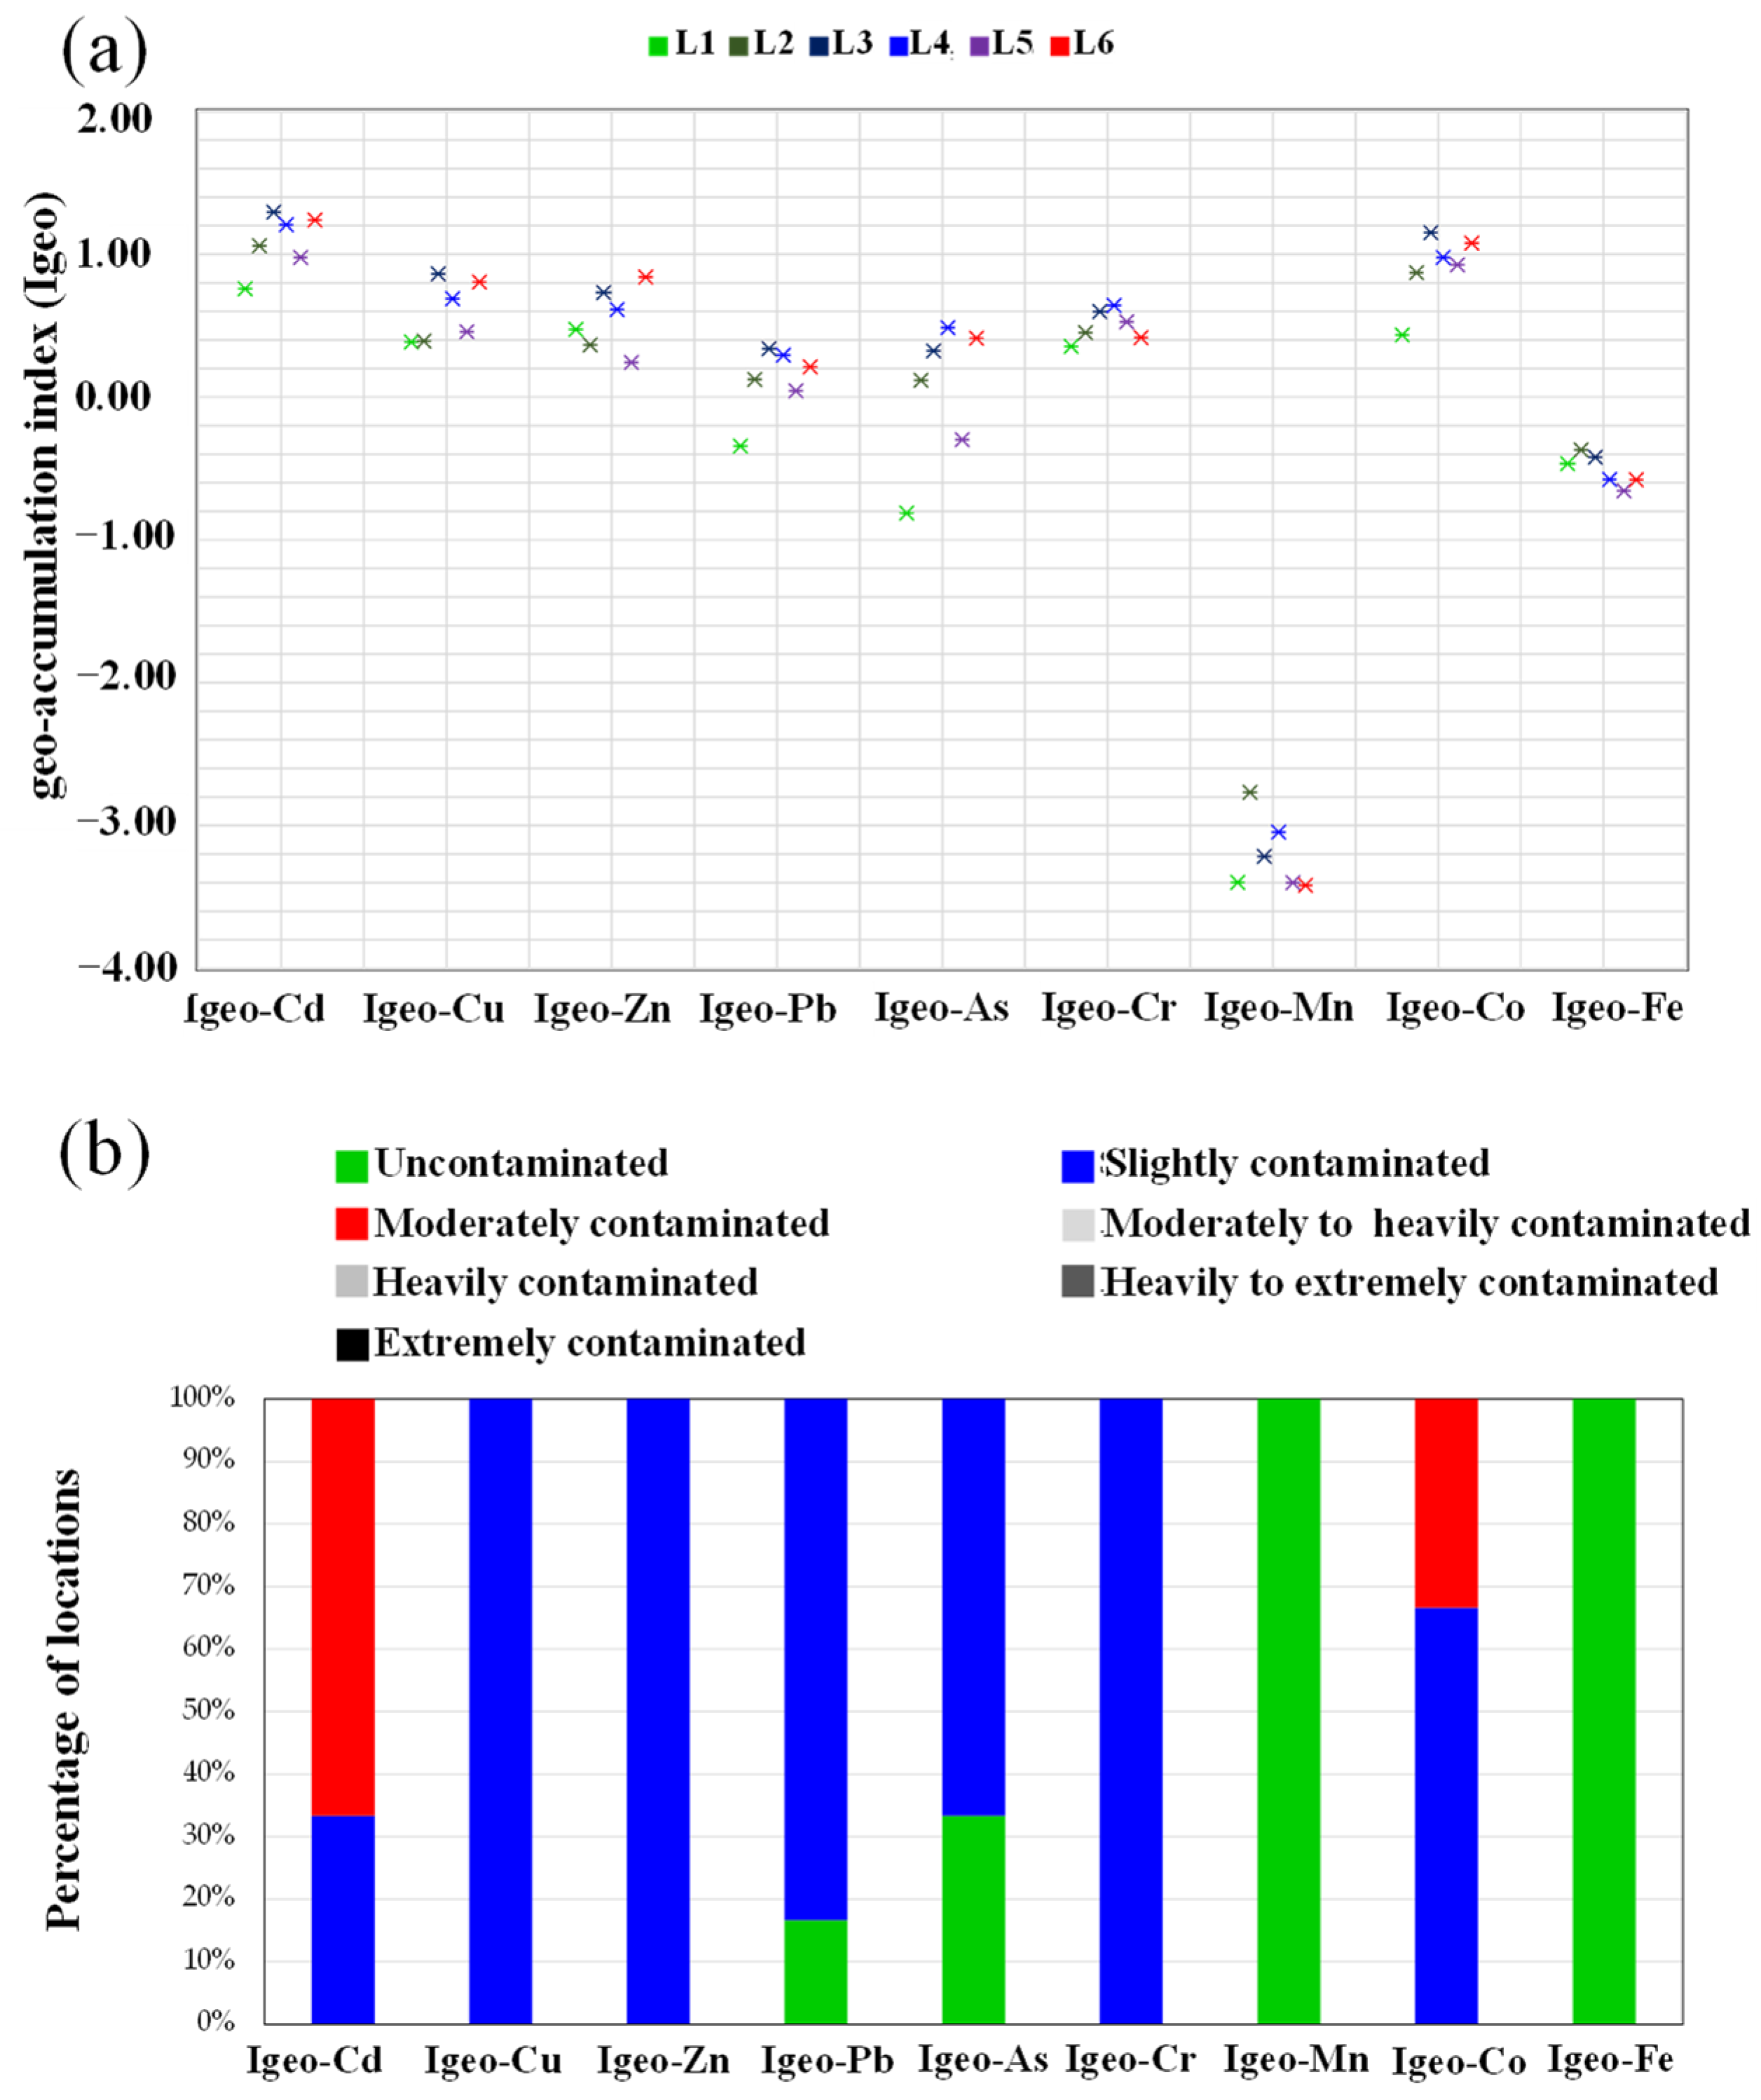
2.4.1. Geoaccumulation Index (Igeo)

It is common practice to utilize the Igeo to evaluate sediment metal deposition at the level of individual metals [1,8,15,31]. The Igeo values can be calculated using the following equation to evaluate the metal pollution level in the sediment.
I geo = log 2 ( C n 1 . 5 B n )
where Cn is the metal concentration “n” in the sediment and Bn is the background concentration of the metal. The reference of the Bn values is provided in Table 1. A factor of 1.5 is used for the background matrix correction and lessening effects from lithogenic compositions [8,15,31]. The interpretation of this index is as follows: uncontaminated (Igeo ≤ 0), slightly contaminated (0 < Igeo ≤ 1), moderately contaminated (1 < Igeo ≤ 2), moderately to heavily contaminated (2 < Igeo ≤ 3), heavily contaminated (3 < Igeo ≤ 4), heavily to extremely contaminated (4 < Igeo ≤ 5), and extremely contaminated (Igeo ≥5) [1,15].

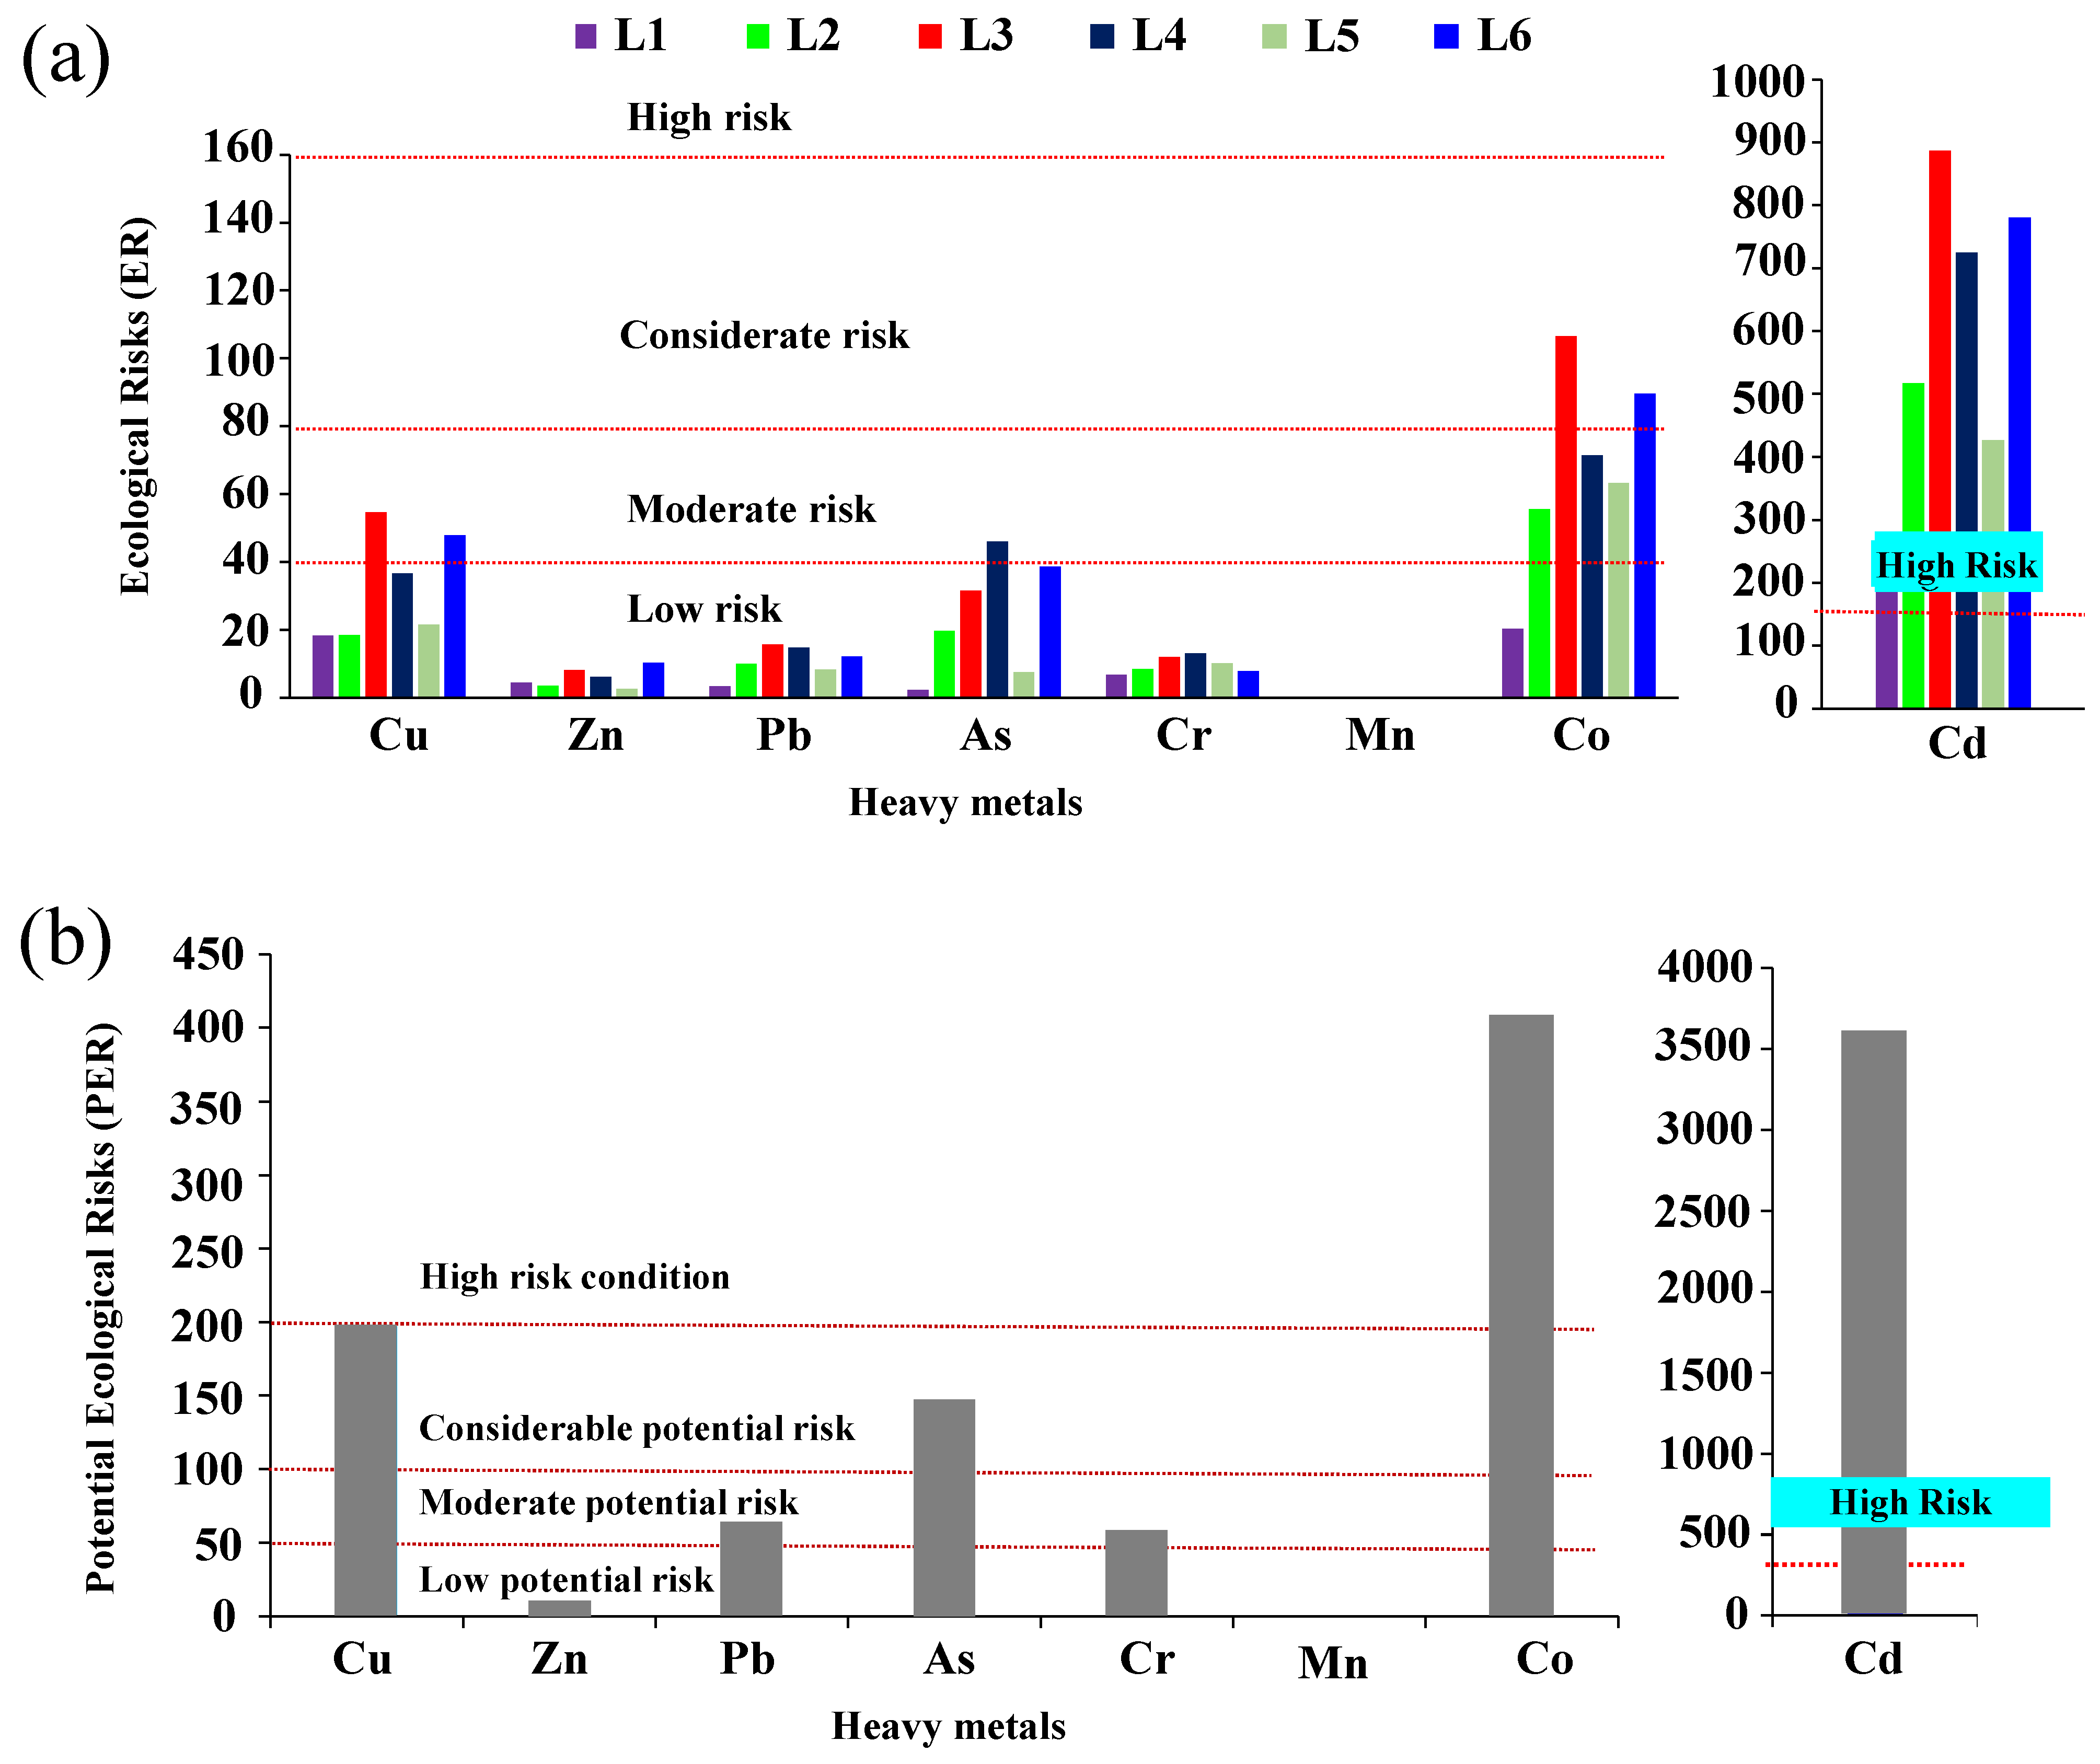
2.4.2. Ecological Risk (ER) and Potential Ecological Risk (PER)

The ER and PER are used to assess the ecological risk of the concerned metals in sediment based on their toxicity and environmental response [1,15,27,32,33]. The ER and PER can be calculated as follows:
ER = E r i = T r i   ×   ( C i C o )
PER = i = 1 n T r i   ×   ( C i C o )
where Ci is the concentration of individual metal “i” in the sediment, Co is the background concentration of the metal, and Tr refers to the biological toxicity factor of a single metal. According to previous studies, the Tr of the concerned metals is as follows: Cu = Pb = 5, Zn = 1, and Cd = 30 [33,34]. What this index means is as follows: low risk (ER < 40), moderate risk (40 ≤ ER < 80), considerable risk (80 ≤ ER < 160), and high risk (ER > 160). The classification of PER is as follows: low potential risk (PER < 50), moderate potential risk (50 ≤ PER < 100), considerable potential risk (100 ≤ PER < 200), and high-risk condition (PER > 200) [15,35].

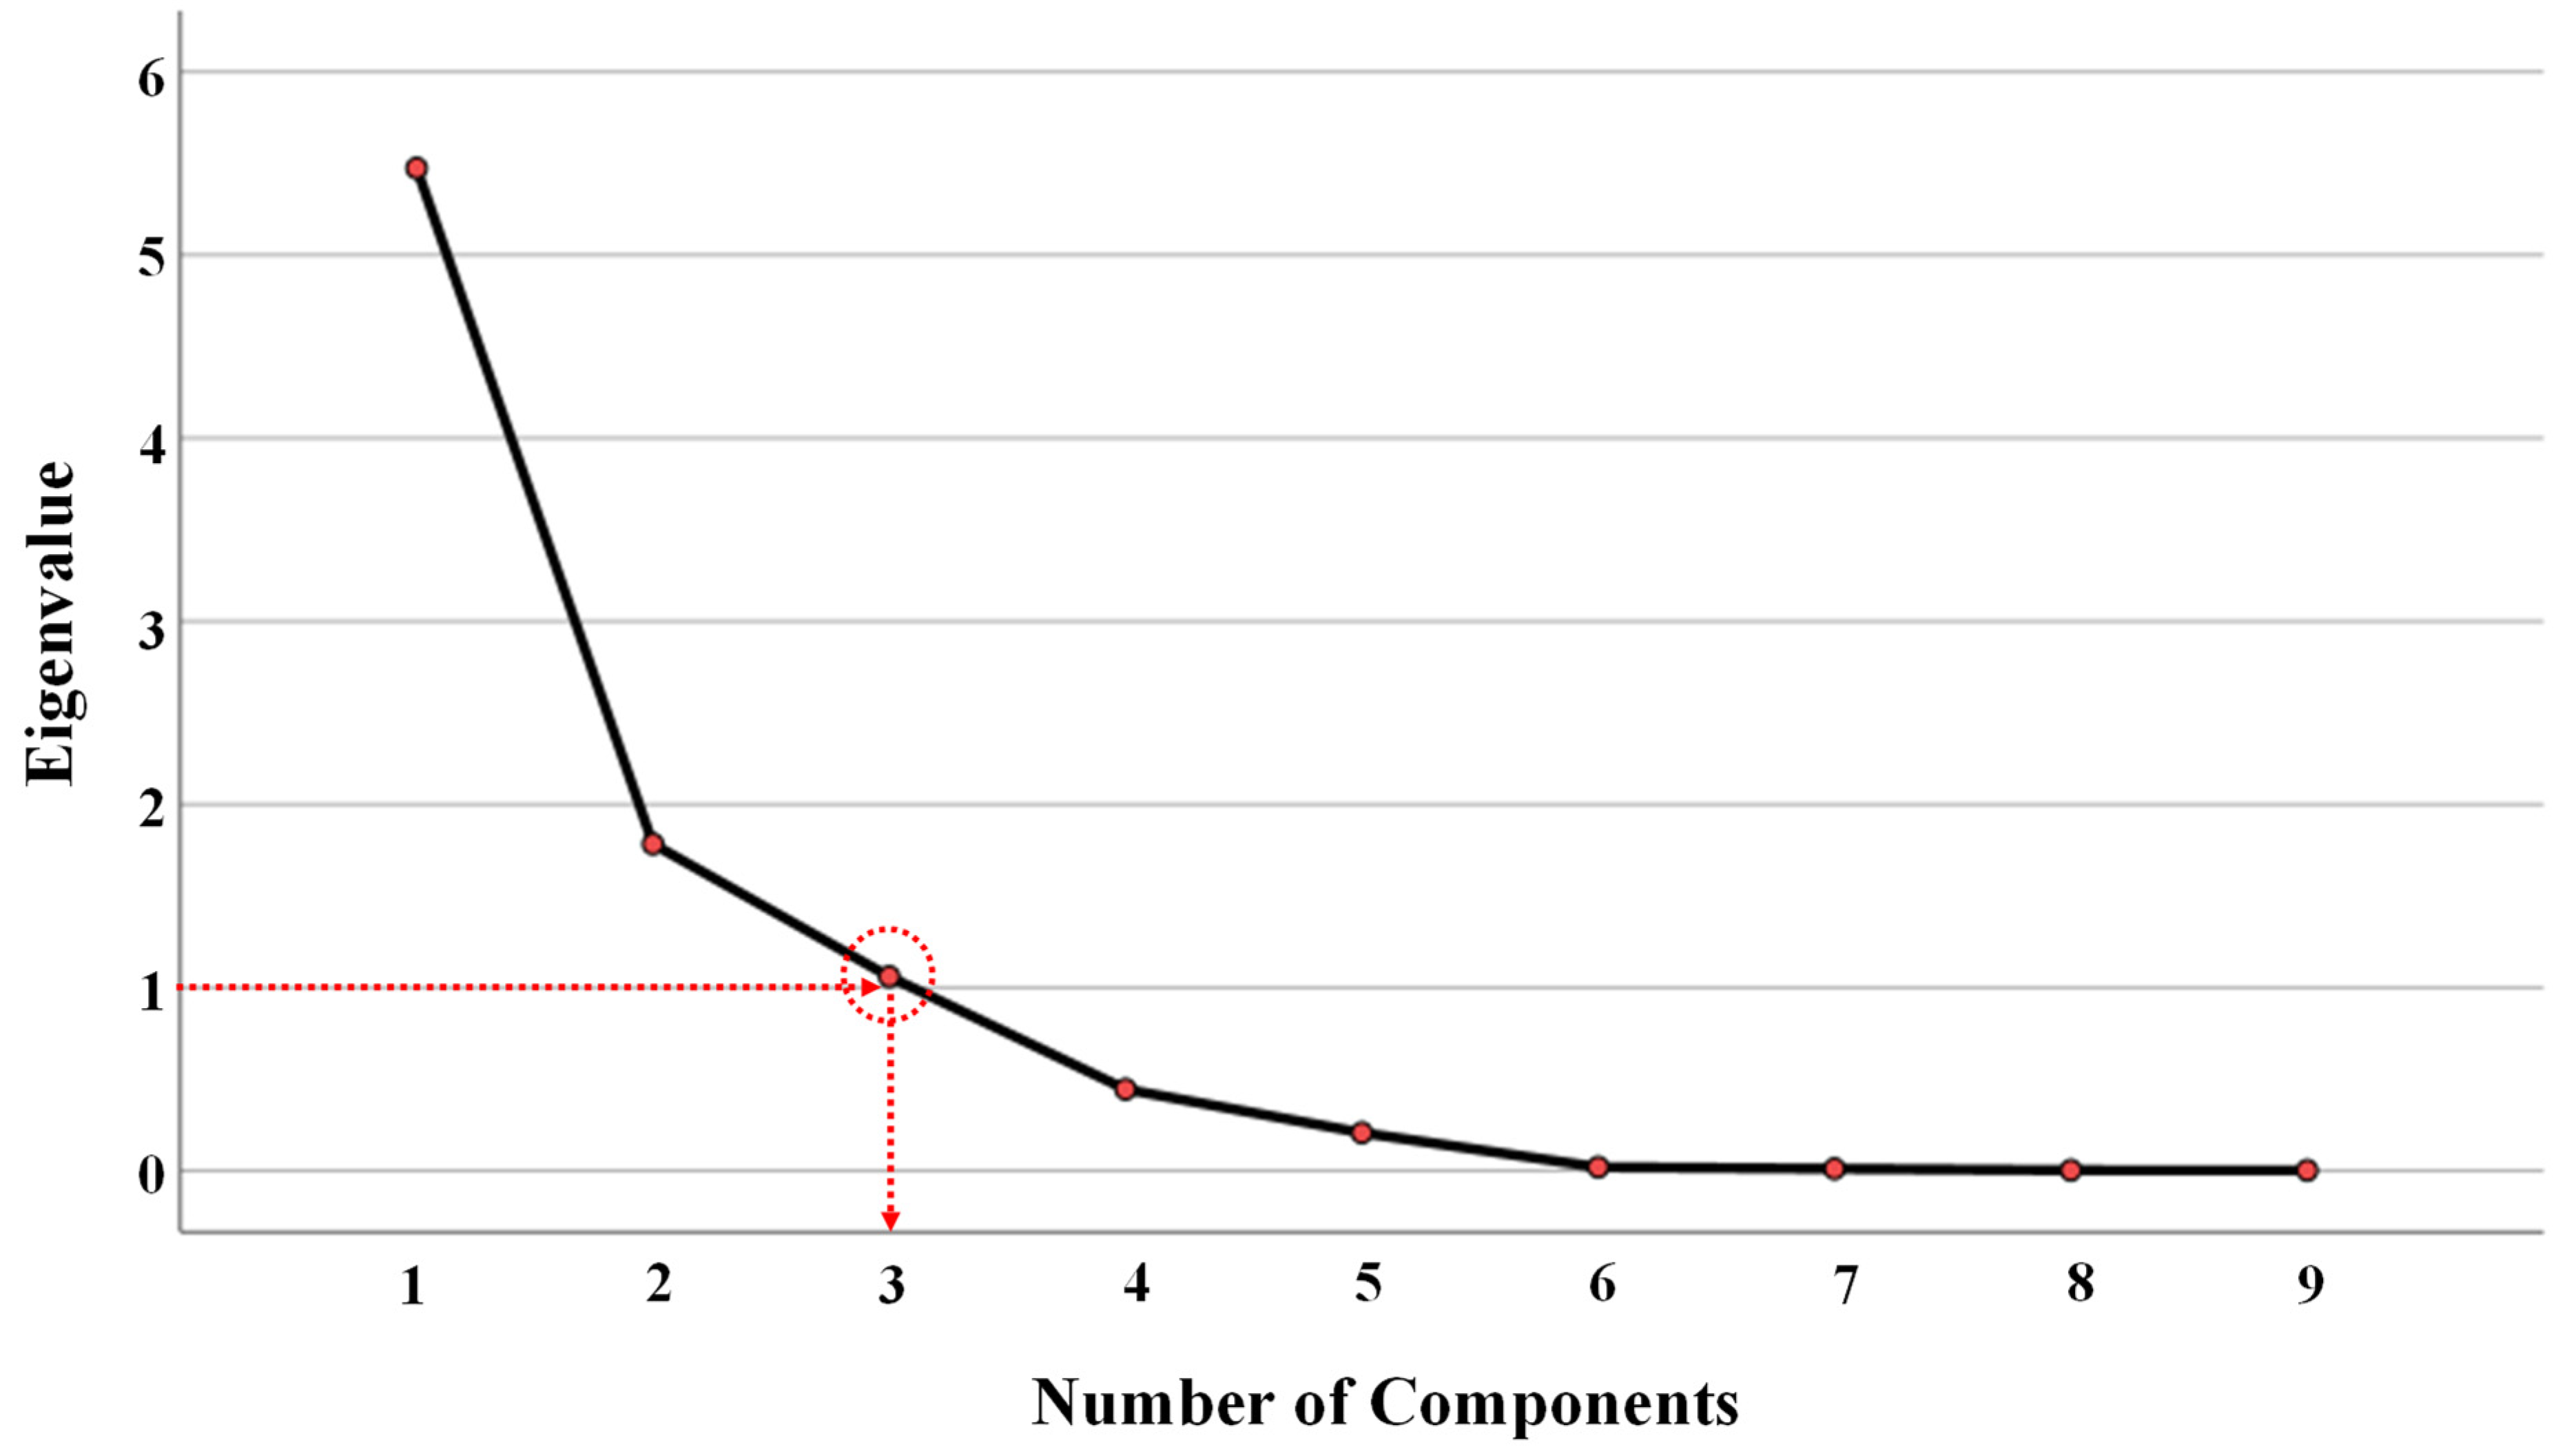
2.4.3. Contamination Source Analysis

The source identification for heavy metal contamination in the sediment of the Chan Thnal Reservoir was primarily screened using principal component analysis in Minitab version 16.0. Later, the data were analyzed with the positive matrix factorization (PMF) model version 5.0 [36]. A factorization of the original matrix Eik into two-factor matrices Xij and Yjk and a residual matrix Zik is shown in the picture below as part of the PMF model computing technique.
E ik   = j = 1 p X ij ·   Y jk + Z ik   ( i = 1 ,   2 , ,   n ;   k = 1 ,   2 , ,   m )
where Eik represents the kth metal concentration in the ith sample, Xij represents the jth metal impact on the ith sample, Yjk represents the factorization of the jth metal’s neighbor, metal k and Zik represent the residual for each sample. To obtain Xij (the factor contributions) and Yjk (the factor profiles), the objective function Q was minimized inside the PMF receptor model [36].
Q = i = 1 n k = 1 m ( Z ik t ik ) 2
where tik is the heavy metal sample uncertainty. If the concentration of heavy metals is more than the method detection limit (MDL), it can be determined as follows:
Unc = [(error fraction×concentration)2 + (MDL)2]1/2; otherwise, it is calculated using:
Unc = 5/6 × MDL, where Unc represents the uncertainty EPA positive matrix factorization (PMF) 5.0 fundamentals and user guide [36].

2.5. Statistical Analysis

The data analysis was conducted using Minitab 16 and Microsoft Excel 2016. A positive matrix factorization model was used for the heavy metal source investigation. The data analysis, geoaccumulation index, possible ecological risk assessment findings, and ecological risk warning assessment outcomes were all carried out using Minitab 16 and Microsoft Excel 2016.

3. Results and Discussion

3.1. Contamination Levels

Generally, the heavy metal concentrations in the sediment were higher than those in the water samples, which was attributed to a significant settling of absorbed heavy metals, as shown in Table S1 [37]. The metal contents in sediment can vary depending on the rock type and the surrounding environmental conditions. During soil formation, Cd and Pb are less likely to accumulate in river sediment [38]. The metal concentrations in shales and clays in igneous and sedimentary rocks followed the decreasing order of Fe > Zn > Cr > Cu > Pb > Co > As > Mn > Cd [39]. The results also revealed a significant variation (p < 0.05) in heavy metal concentrations of the sediment in all the locations. Details of the statistical analysis of heavy metals in the sediment are presented in Table 1. The mean concentrations of Cd, Cu, Zn, Pb, As, Cr, Mn, Co, and Fe in the sediment of our study were 0.20, 15.13, 21.09, 10.61, 3.64, 16.50, 0.54, 8.14, and 1659.35 mg/kg, respectively. Consistent with a previous report [1], our study revealed the same order of Fe > Zn > Cr > Cu > Pb > Co > As > Mn > Cd, indicating that the decomposition of sedimentary rocks formed the sediment in the study area. Our data’s coefficient of variance (CV) ranged from 2.16 to 7.13. According to [18,20], CV ≤ 20 indicates low and homogeneous variability of the values. The mean concentrations of all heavy metals were significantly higher than the background concentrations of metals in soil [40] except for Mn and Fe, and these results indicated there is an input of the heavy metals from human activities in the Chan Thnal Reservoir. Additionally, it was observed that the mean concentrations of Cd, Zn, Pb, As, Cr, and Mn were beyond the permissible limits of heavy metals in the sediment recommended by the World Health Organization: 0.1, 1, 5, 0.2–1.5, 0.1, and 0.2 mg/kg for Cd, Zn, Pb, As, Cr, and Mn, respectively [41]. It should be noted that the mean concentration of Cd was 2.2 times higher than the average of Earth’s crust composition and Thailand’s criteria for sediment quality in surface water sources. This finding implies a relatively high enrichment of Cd in the sediment of the Chan Thnal Reservoir to a level that might harm benthic fauna and decrease biodiversity. In addition to Cd, other heavy metal deposits were evident in several reservoir locations. Considering the a and b values in Table 1, L3 and L6 were the top two locations with Cd levels significantly different from the mean value. The accumulation of these metals in sediments has been linked to reduced macronutrient bioavailability and sediment acidity [26].
Table 1. Heavy metal concentrations in the sediment of the Chan Thnal Reservoir and the acceptable levels.
LocationsMean Concentrations (mg/kg) in Sediment Samples
CdCuZnPbAsCrMnCoFe
L10.09 e8.39 d16.06 d3.33 f0.35 f11.52 f0.29 d2.45 e1794.70 b
L20.17 c8.51 d12.54 e9.77 d2.95 d14.42 d1.25 a6.68 d2236.00 a
L30.30 a25.11 a29.10 b16.04 a4.74 c20.25 b0.45 c12.79 a1990.00 b
L40.24 b16.84 c22.11 c14.45 b6.90 a22.37 a0.66 b8.56 c1388.60 c
L50.14 d9.90 d9.45 e8.14 e1.13 e17.14 c0.29 d7.60 c,d1160.20 c
L60.26 b22.00 b37.30 a11.95 c5.80 b13.28 d0.28 d10.76 b1386.60 c
Average ± SD0.20 ± 0.0115.13 ± 0.9821.09 ± 1.4210.61 ± 0.723.64 ± 0.2516.50 ± 0.720.54 ± 0.048.14 ± 0.581659.35 ± 102.67
CV (%)56.476.736.796.874.362.167.136.19
Earth’s crust 10.092867174.8929502041,000
Bn 20.012.33.64.91.53.44880.63500
WHO 30.120<150.2–1.50.10.2-5
Thailand 40.1621.580361045.5---
Data are presented as the average triplication in each location; SD refers to the standard deviation obtained from the average of 6 locations. Values with the same letters refer to “no significant difference”, whereas a, b, c, d, e, and f refer to “significant difference” (p < 0.05) with the following order: a < b < c < d < e < f (Minitab 16 ANOVA one-way test). CV refers to the coefficient of variation. 1 is the Earth’s crust composition, 2 refers to Thailand—background concentration of metals in soil [40], 3 refers to the World Health Organization regulatory limits in sediment [41], and 4 refers to the criteria for sediment quality in surface water sources to protect benthos [42].

3.2. Environmental Quality Evaluation of the Sediment from the Chan Thnal Reservoir

For each metal found in the sediment, the corresponding geoaccumulation index (Igeo) was calculated and is shown in Figure 2a. The average index values of the heavy metals were ranked in the order of Cd > Co > Cu > Zn > Cr > Pb > As > Fe > Mn. The average index values of the heavy metals were higher than zero, apart from Fe (−0.51) and Mn (−3.21). This result indicated that the sediment of the Chan Thnal Reservoir is polluted with Cd (1.09), Co (0.91), Cu (0.60), Zn (0.54), Cr (0.50), Pb (0.11), and As (0.04). With an average Igeo value greater than 1, Cd was the primary heavy metal contaminant in the sediment with a moderate degree of contamination. Locations 3 and 6 were moderately contaminated by Co. The highest contamination levels of Cd and Co were found at location 3. The percentages of locations at different pollution levels among the total sample locations are shown in Figure 2b. Uncontaminated levels were found for Fe (100%), Mn (100%), As (33.33%), and Pb (16.67%). All of the locations had slight contamination levels for Cu, Zn, and Cr, while 83.33% and 66.67% of the locations had slight contamination levels for Pb and As, respectively. It was also noted that 66.67% and 33.33% of the locations were moderately contaminated with Cd and Co, respectively. The percentage of sample locations with varying degrees of pollution was inversely proportional to the percentage of moderately contaminated sample locations for both Cd and Co. This variation in percentage also considerably altered the order in which the Igeo values for all the heavy metals were presented. Our study revealed the degree of contamination for nine heavy metals as follows: Fe and Mn < As < Pb < Cu, Zn, and Cr < Co < Cd.

3.3. Potential Ecological Risk Assessment

The possible ecological risk posed by each heavy metal was evaluated using the method outlined in Section 2.4.2. Figure 3a,b show the results of the ecological risk (ER) and potential ecological risk (PER), respectively. Considering the individual ecological risk (ER) from Figure 3a, the average values of each heavy metal were ranked in the order of Cd > Co > Cu > As > Pb > Cr > Zn > Mn, with values of 598.945, 67.810, 32.881, 24.294, 10.831, 9.704, 5.859 and 0.001, respectively. With ER values lower than 40, the contamination of Cu, As, Pb, Cr, Zn, and Mn in the sediment revealed a low level of risk. The mean ER value for Co was between 40 and 80, indicating a moderate ecological risk. In addition, a considerable risk of Co contamination was observed at locations 3 and 6. Similar to the results of the Igeo in this study, the ER values of Cd in the sediments at all locations exceeded the upper limit of 160, indicating a high level of risk to the ecosystem.
The PER value was calculated based on eight heavy metals (i.e., Cd, Cu, Zn, Pb, As, Cr, Mn, and Co) without Fe due to the absence of an iron biological toxicity factor. The results revealed a relatively high potential ecological risk of metal pollution in the Chan Thnal Reservoir. As presented in Figure 3b, the evaluation of potential ecological risk exhibited a low contamination risk for Zn and Mn, a moderate contamination risk for Pb and Cr, a considerable potential risk for Cu and As, and a high-risk condition for Co and Cd. However, discrepancies were found to some extent between the potential ecological risk index (PER) and the geoaccumulation index (Igeo). The Igeo value showed slight contamination and slight-to-moderate contamination for Cu and Co, respectively; however, the PER revealed considerable and high ecological risk potential, respectively. This inconsistency can be explained as follows: the geoaccumulation index estimates the concentration of each metal detected in sediments relative to the background concentration of lithogenic compositions, while ER emphasizes the relative toxicity of individual heavy metals, and PER expresses the cumulative ecological risk of all studied metals. The PER, regarded as the potential risk index, revealed the ecological risk contributions from heavy metal contamination as follows: Cd > Co > Cu > As > Pb > Cr > Zn > Mn. The average value of PER in the sediment was 500.532, which indicates that all sample locations in the sediment had a high potential ecological risk level. In agreement with the Igeo results, a location-based evaluation revealed the potential ecological risk of heavy metal contamination as follows: L6 > L3 > L4 > L2 > L5 > L1. In particular, the PER evaluation revealed a high level of ecological risk spread predominantly in L6, L3, and L4. Similar to previous reports, these locations are located near urban areas and have the highest concentration of human and agricultural activities [43,44,45]. As shown in Figure 1 and Figure S1, L3 and L4 connect to the road canal and receive runoff and discharge from areas, such as schools, rice paddies, and farming households. L5 and L6 receive discharge from the municipal area (i.e., markets, petroleum stations, and local shops) and cattle and poultry farms.

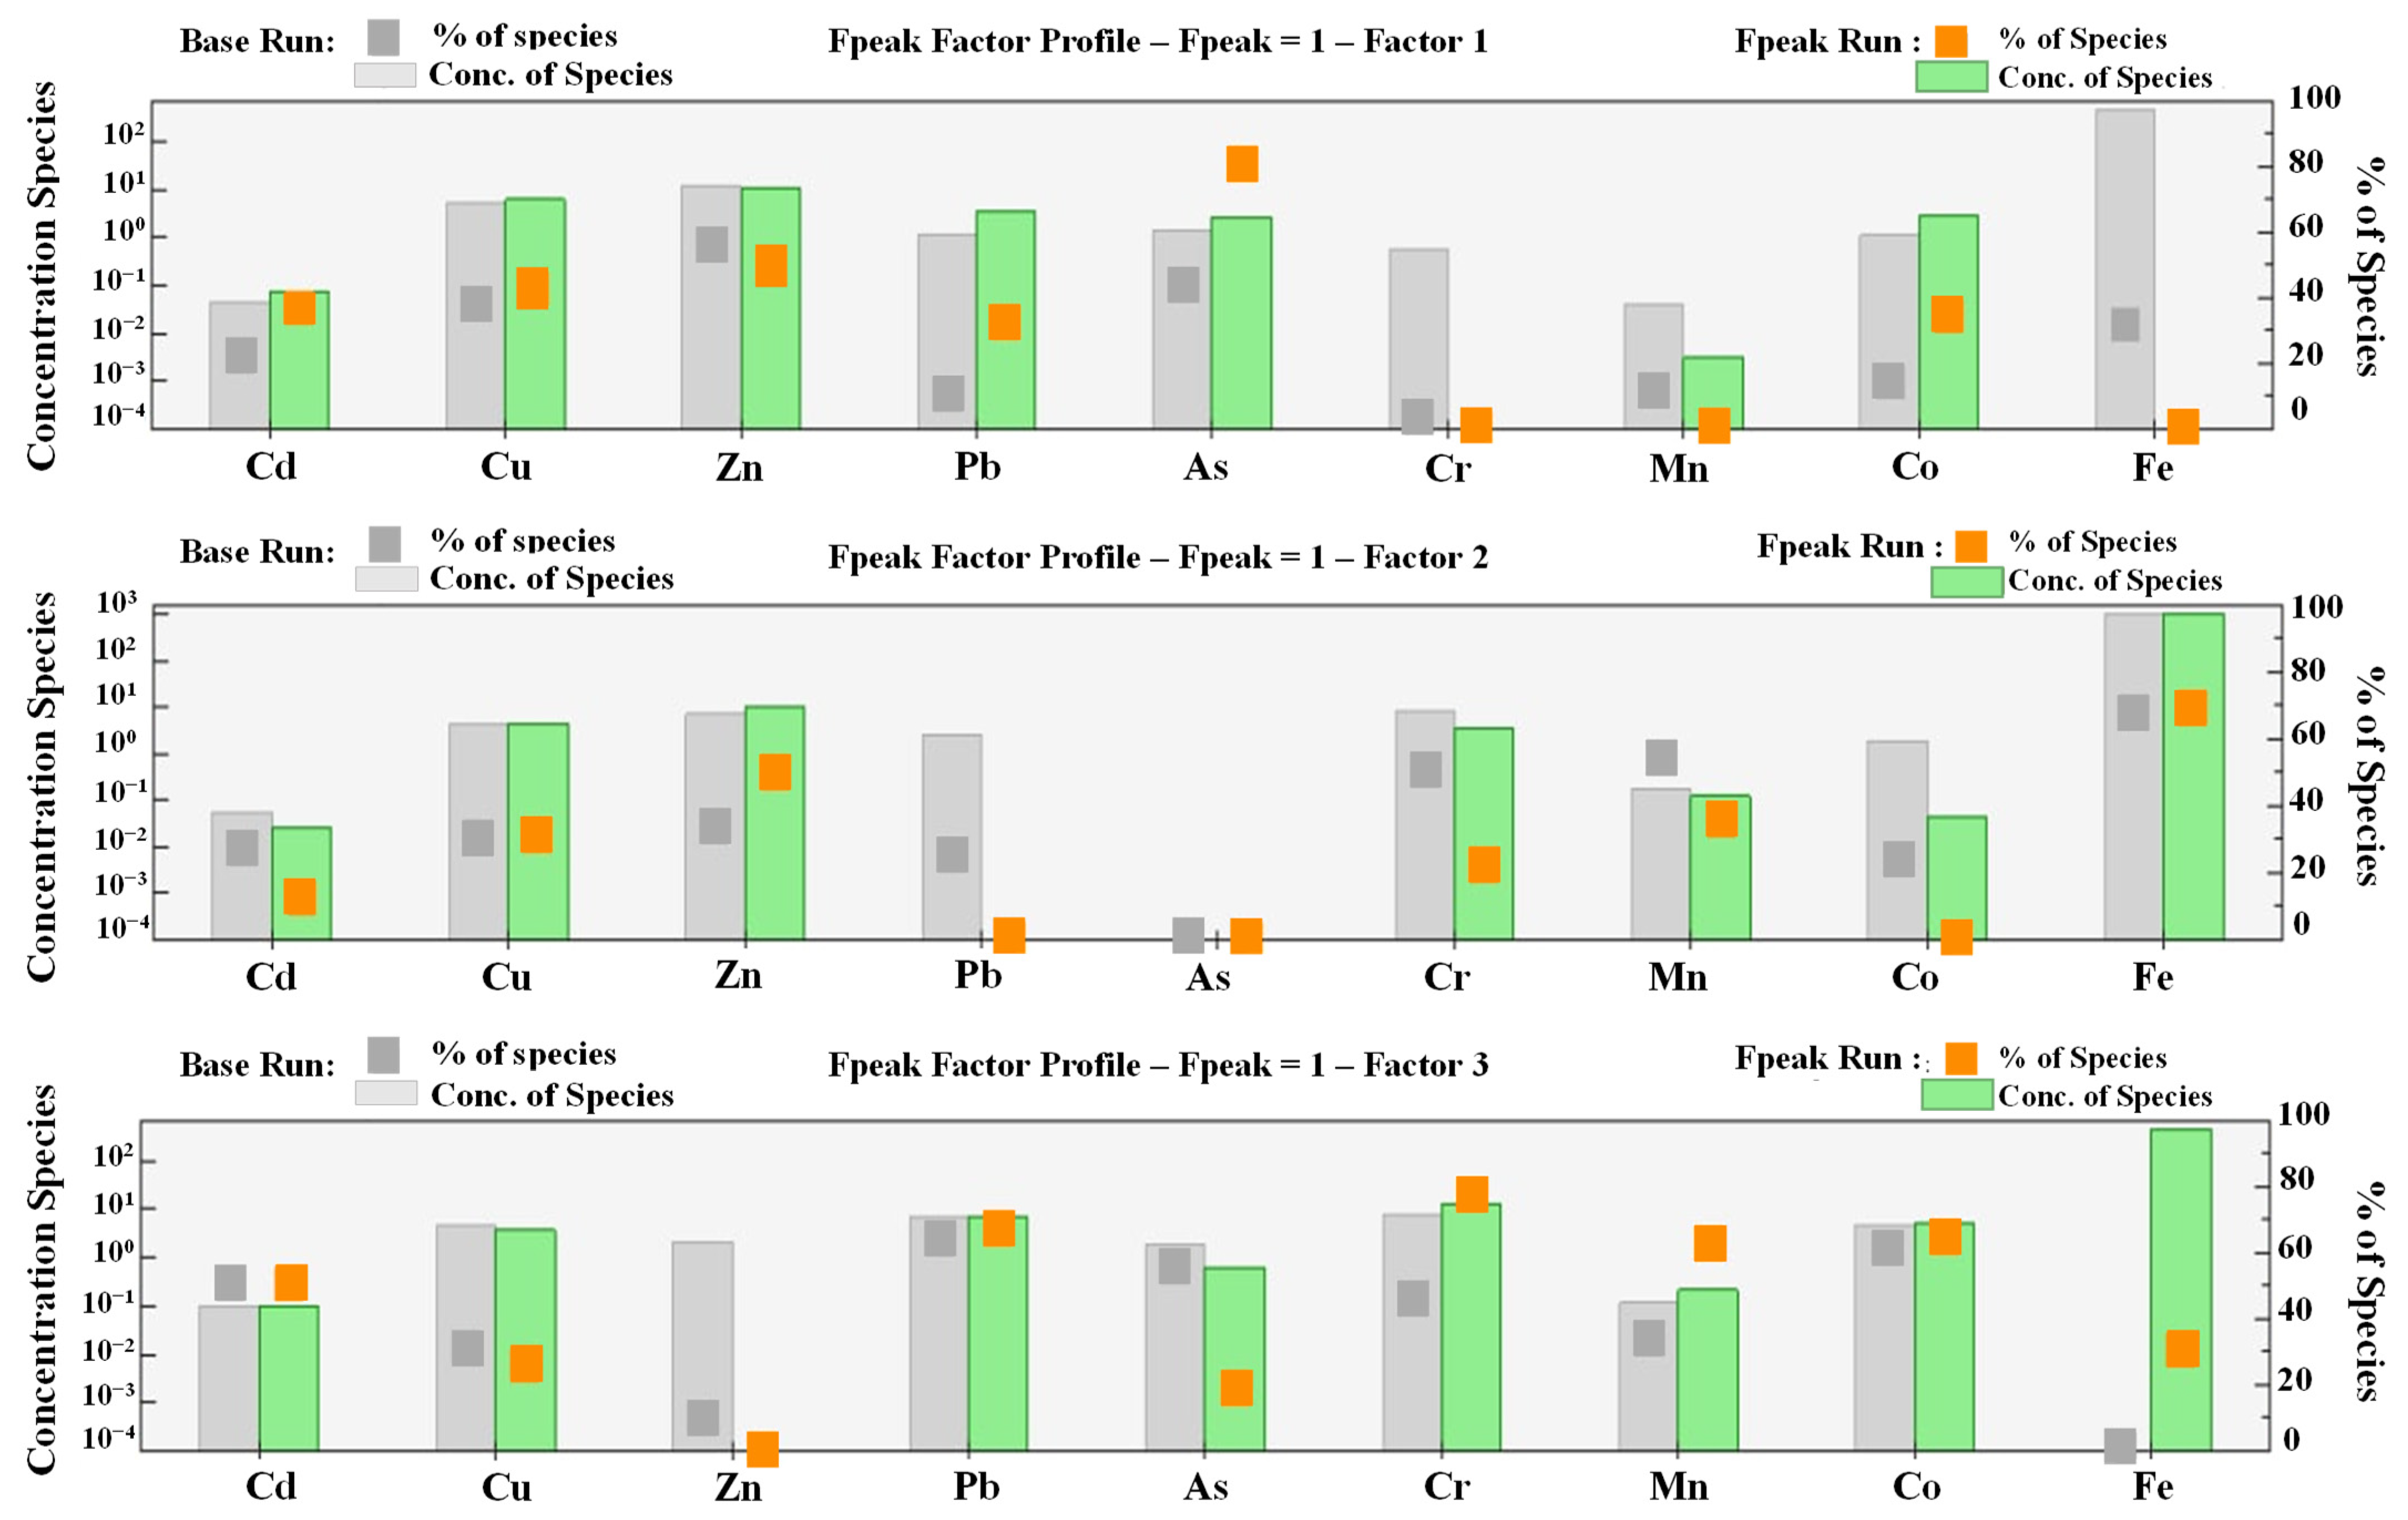
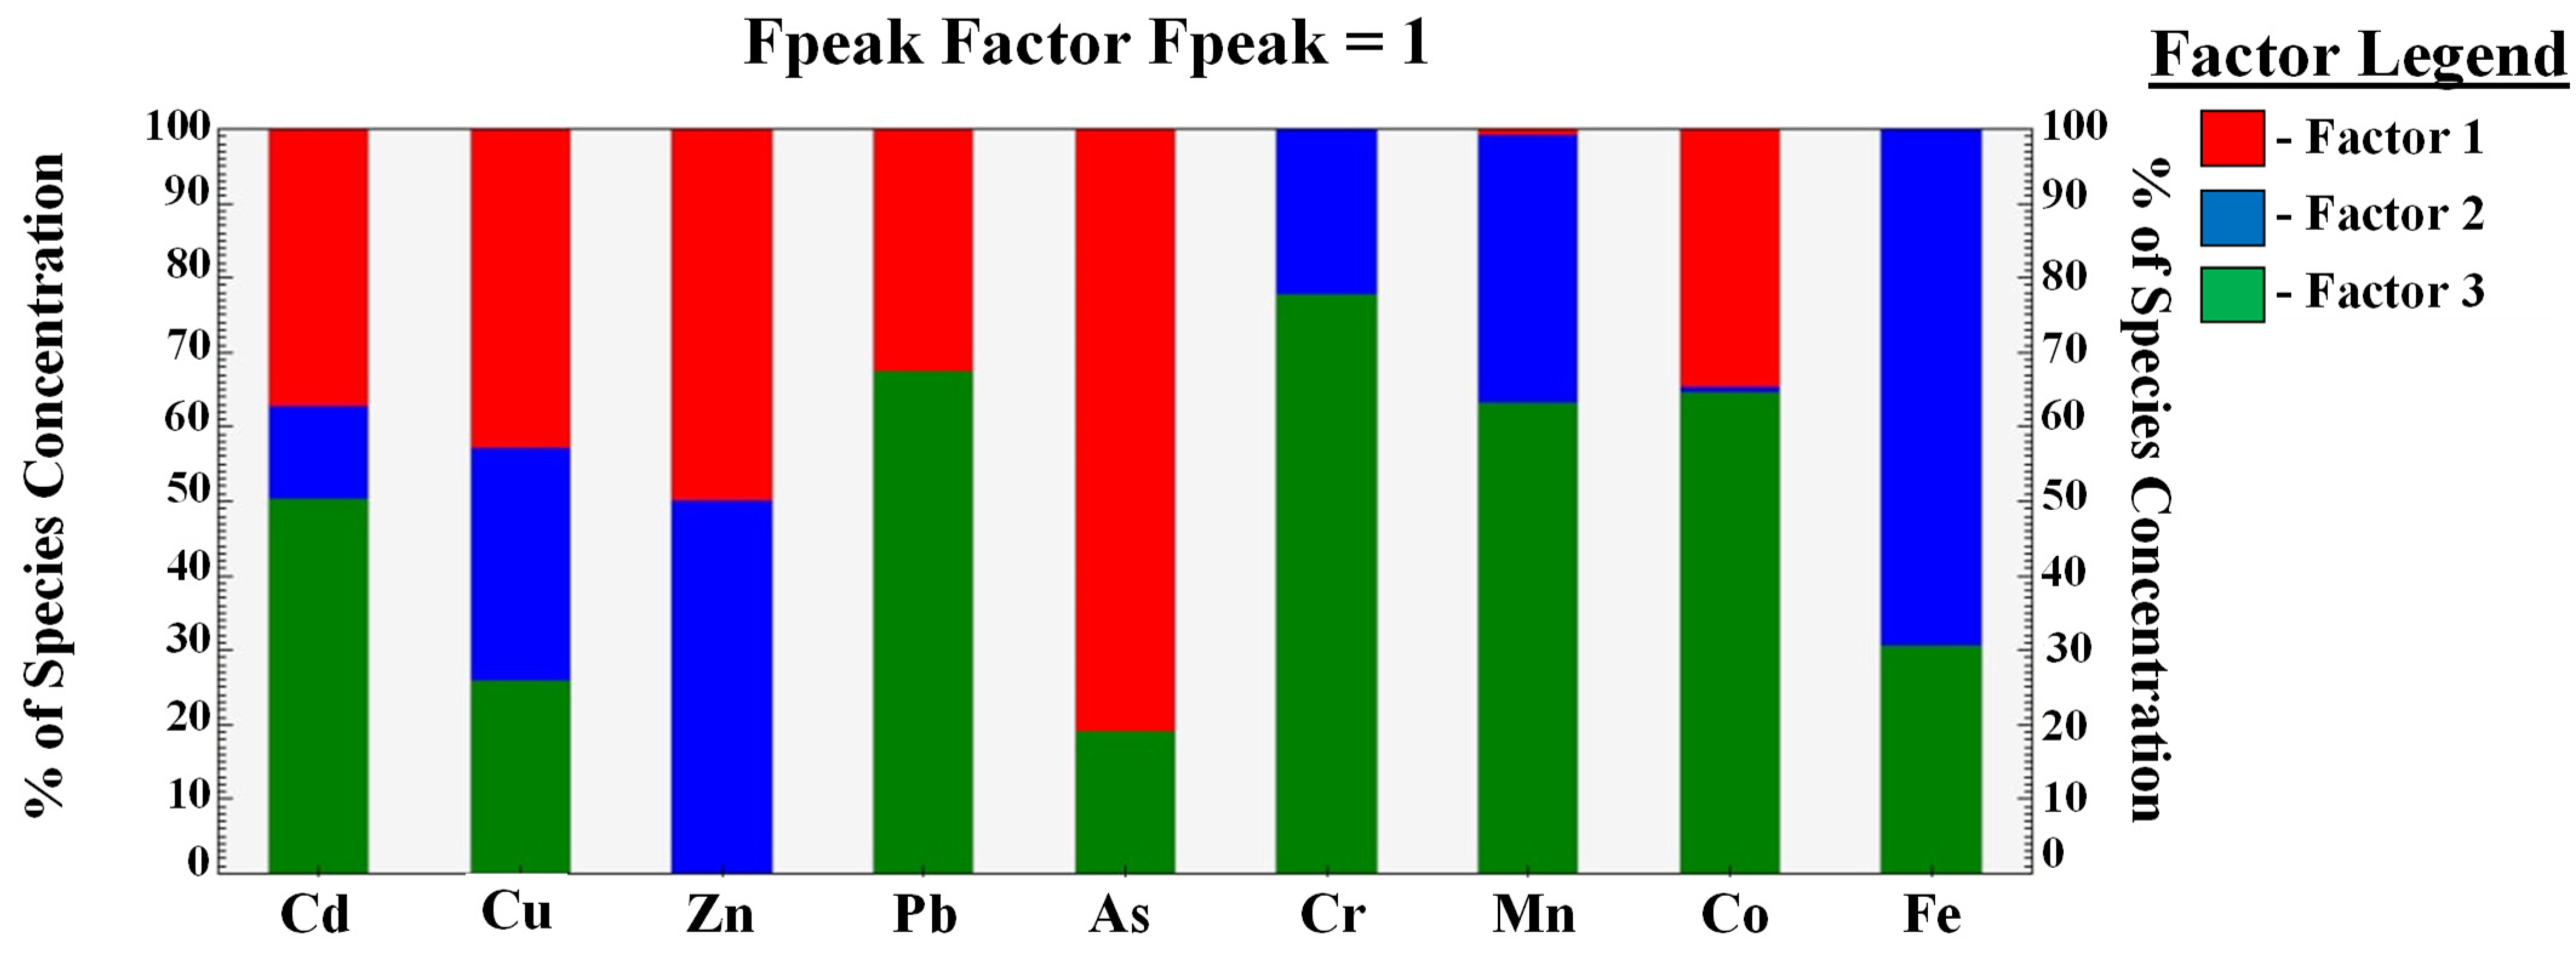
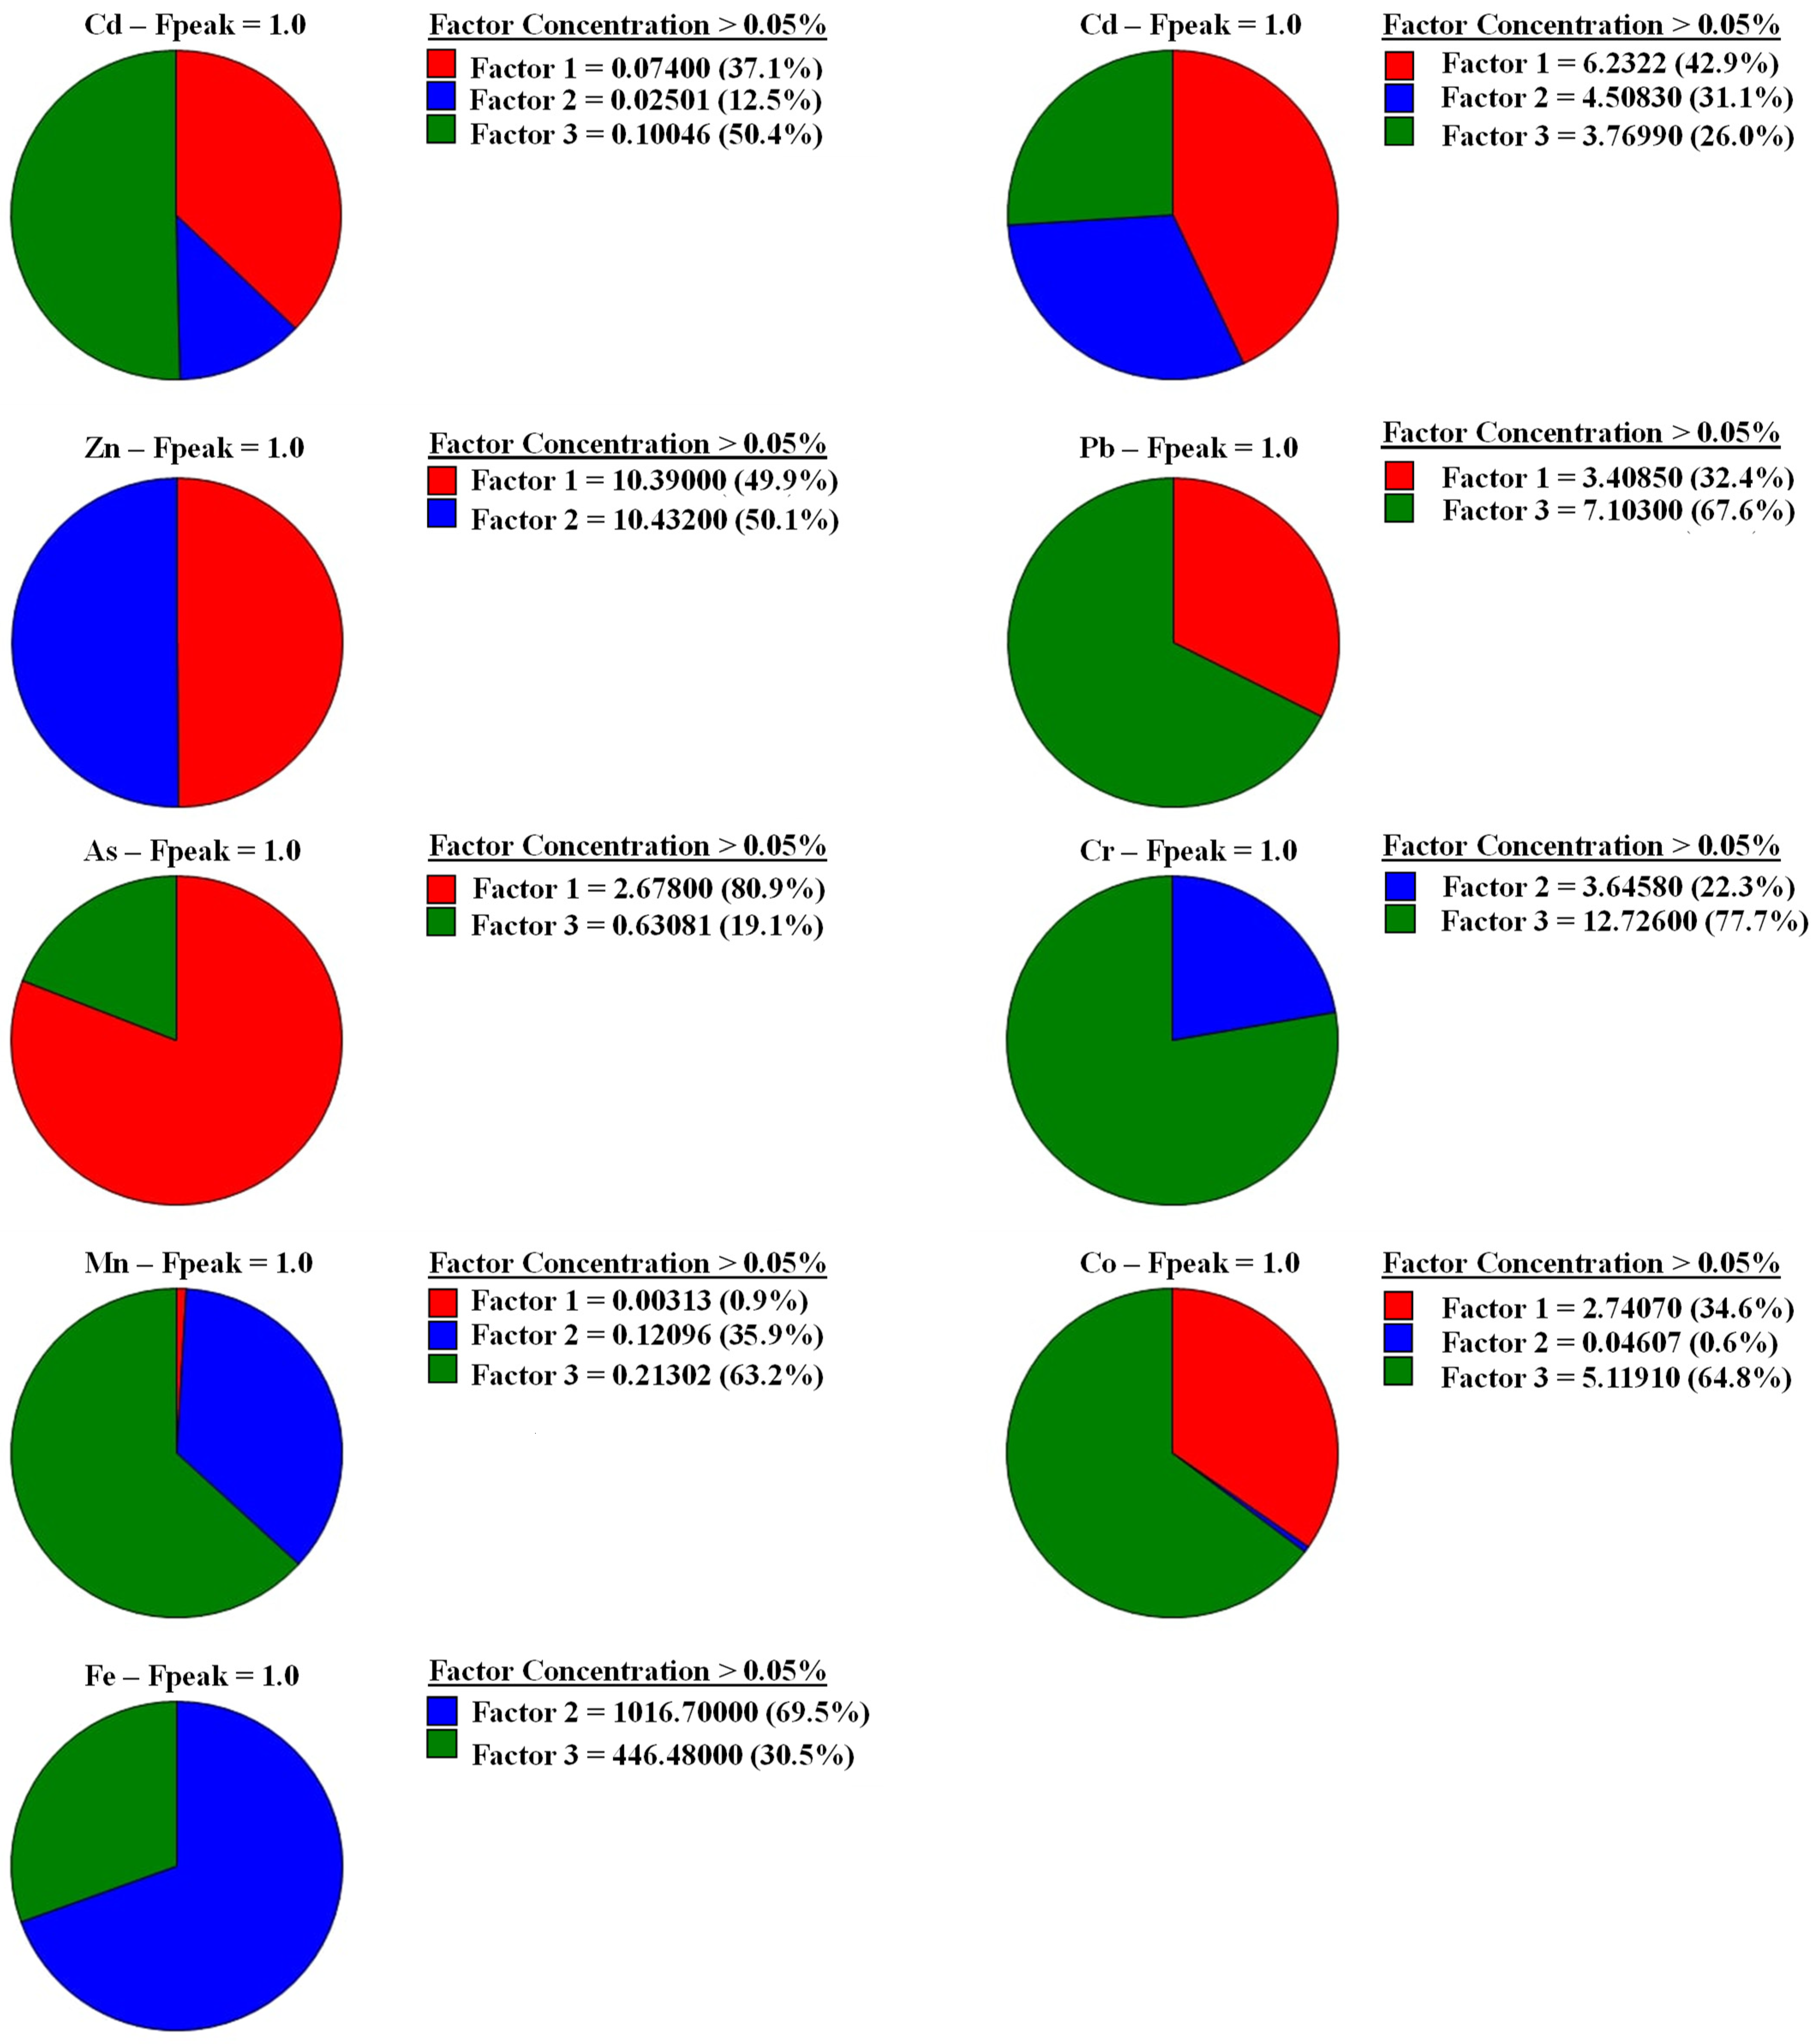
3.4. Identification of the Contamination Source

Prior to the PMF analysis, the concentration data were examined with the principal component analysis (PCA) using Minitab 16.0. As shown in Figure 4, the eigenvalue of 1.0 suggests the decision to use a three-factor model for the PMF base model. All analyzed concentrations and corresponding uncertainty values were input into the PMF model. We performed 20 iterations with a random starting seed. When just three components were involved, the Q value was shown to be the steadiest and most consistent. Figure 5 depicts the metal source profiles and the sediment features caused by the three causes.
As shown in Figure 5, Cu, Co, Cd, and Mn contributed to all factors by more than 40–50% of their total amounts. For example, factors 1 and 2 contributed significantly to Zn contamination. Likewise, factors 1 and 3 contributed to a large extent of Pb and As contamination, and factors 2 and 3 contributed considerably to Cr and Fe contamination. Figure 6 depicts the PMF-derived factor fingerprints of metals, and Figure 7 illustrates the PMF-derived factor contribution of metals. Additional information regarding the source contributing factors can be found in Figures S1–S3.
The first factor accounted for 80.9% of the As contribution, followed by Cu (42.9%) and Zn (4.49%). Most of the sample locations showed evidence of As, Cu, and Zn pollution, with As, in particular, reaching a level of slight contamination and considerable potential risk. Agricultural activities are the priority sources, as shown in Figure 1 and Figure S1. Most of the villagers around the Chan Thnal Reservoir are farmers and work in agriculture, such as planting rice and growing vegetables. Pesticides and herbicides are harmful chemicals that farmers use to control pests and weeds and maintain their marginal crop production. The sources of these heavy metals are pesticides, herbicides, fungicides, and phosphate fertilizers [2,3,46,47,48,49,50,51]. Traffic vehicular pollution is generally the most important source of Cd, Pb, Cu, and Zn [7,12,52]. However, Cd, Pb, Cu, and Zn accumulation in urban soils could somewhat depend on atmospheric deposition [53]. Another factor includes vehicle exhaust emissions and dust deposits. From the literature, Pb poses the most significant threat from redeposited road dust [1,54]. According to Harvey et al., 2017 [55], road dust is one of the urban soil’s most important sources of Pb contamination. In addition, this source produces possible spillage of vehicle-related mineral oil or gasoline. Automobile tires also emit significant amounts of Zn [19,56]. Consistent with the literature, Cd, Pb, Cu, Zn, and As exhibited comparable geographical fluctuations, and their high-value regions overlapped in the study area.
The second factor presented high loadings of Zn (50.1%) and Fe (69.5%) and a significant loading of Mn (35.9%). One study has suggested that the coexistence of Zn and Fe contamination in the sediment is from atmospheric deposition and compost amendment [2]. However, according to Jing et al., relatively small loadings of Cr (22.3%) and Cu (31.1%) were suggested to be indicators of a natural origin in soil [19]. In addition, secondary Fe–Mn oxides formed from the most prevalent metal-bearing phases in sediment and weathering products on particles are attributed to the accumulation of such metals in sediment [55]. Hence, factor 2 was identified as a natural source in this study.
The last factor was identified by Fe (30.5%), Cd (50.4%), Mn (63.2%), Co (64.8%), Pb (67.6%), and Cr (77.7%). To the best of our knowledge, factor 3 was identified as urban and industrial activities in which anthropogenic activities, such as metal coatings, plastic burning, wastewater irrigation, and sewage sludge, were the primary sources of these heavy metals. In addition, one study reported that iron oxides contained high Pb levels (up to 27.3 wt% PbO). The occurrence of smelter-derived slag-like particles is possibly windblown from slag dumps and smelting emissions [55]. Open dumping and burning of municipal waste, including metal coatings, plastic burning, wastewater irrigation, and sewage sludge, have also been reported as major contributors to these heavy metal contaminations [2,3].
According to the ER and PER results, the Cd contamination in the sediment revealed the highest risk condition, revealing an increased accumulation of Cd in the sediment. From the PMF model, the sources of Cd contamination in the reservoir were from all three factors. The contribution percentage of Cd contamination is ranked as follows: factor 3 (50.4%) > factor 1 (37.1%) > factor 2 (12.5%). Significant sources of Cd contamination are likely from urban activities, such as the burning of plastic wastes, open dumping of electronic waste and other Cd-containing solid waste (e.g., empty bottles of pesticides, herbicides, fungicides, and phosphate fertilizers, etc.), and direct discharge of wastewater from municipalities (e.g., households, barber and salon, motorcycle repair shops, waste sorting, and recycling shops) [57,58,59].

4. Conclusions

Fe > Zn > Cr > Cu > Pb > Co > As > Mn > Cd describes the average individual metal composition of the investigated sediment samples. The results of the Igeo, ER, and PER soil pollution indices showed that most of the studied sediment samples were clean, moderately clean, or slightly contaminated. However, high Co and Cd pollution in the sediment of the Chan Thnal Reservoir is likely to pose an ecological risk and possible human health risk conditions to the local population living in and around the Chan Thnal Reservoir. Before PMF analysis, Pearson’s correlation coefficient analysis (PCA) can be effectively used to estimate the number of sources contributing to heavy metal pollution in the sediment. Heavy metal accumulation in the sediment of the Chan Thnal Reservoir is likely from three primary sources. High loadings of As, Cu, Zn, Cd, and Pb suggest that the first source is expected to be agricultural and traffic vehicle sources. The second source correlates to the high loading of Zn, Fe, Mn, Cr, and Cu in the sediment, likely from natural sources or natural origins (i.e., rock formation and weathering, atmospheric deposition, and compost amendment). The third source contributes to the high loading of Fe, Cd, Mn, Co, Pb, and Cr in the sediment, likely from urban and industrial sources (metal coatings, plastic burning, wastewater irrigation, and sewage sludge). This study highlighted the high ecological risk of Cd accumulation in the sediment of the Chan Thnal Reservoir. The sources of Cd contamination in the reservoir were from all three factors with the percentages as follows: factor 3 (50.4%) > factor 1 (37.1%) > factor 2 (12.5%). The primary sources of Cd contamination are likely from urban activities, such as the open dumping and burning of plastic and electronic wastes and other Cd-containing solid waste (e.g., empty bottles of pesticides, herbicides, fungicides, hair dyes, and phosphate fertilizers) and the direct discharge of wastewater from municipalities (e.g., households, barber and salon, motorcycle repair shops, waste sorting, and recycling shops). The second contributing source of Cd pollution is likely agricultural runoff attributed to pesticides, herbicides, phosphate fertilizers, etc. Our study contributes to society as a whole in identifying a significant source of metal contamination in reservoirs. Local governments may use the results of our research to establish appropriate measures to control point and nonpoint sources and to determine the proper sorting and disposal of municipal waste. To mitigate the risks of Cd contamination in the Chan Thnal Reservoir, it is necessary to control the direct discharge from significant point sources, promote good agricultural practices, and improve waste management through proper sorting and disposal practices.

Supplementary Materials

The following supporting information can be downloaded at: https://www.mdpi.com/article/10.3390/w15081566/s1. Table S1. Heavy metal concentrations in the water of the Chan Thnal reservoir and the acceptable levels; Figure S1. Open dumping and outdoor chemical storage in the study area; Figure S2. Direct discharge from municipal area and poultry farm in the study area; Figure S3. Road dust, vehicle exhaust and open burning in the study area.

Author Contributions

L.C. conducted all experiments, analyzed the data, developed the methodology, and drafted the original version of the manuscript. P.L. reviewed and edited the first version of the manuscript. N.T. supervised and validated the analytical methods. T.S. partly supervised, discussed results, and edited the final manuscript. S.P.T. conceptualized, planned, designed, directed the project, supervised, and wrote, reviewed, and edited the final version of the manuscript. All authors have read and agreed to the published version of the manuscript.

Funding

This study was financially supported by the Department of Chemistry, Faculty of Science, King Mongkut’s University of Technology Thonburi. The student was financially supported by the Petchra Pra Jom Klao Ph.D. research scholarship.

Institutional Review Board Statement

Not applicable.

Informed Consent Statement

Not applicable.

Data Availability Statement

Not available.

Acknowledgments

We would like to express our gratitude to Prapat Pongkiatkul of the Environmental Engineering Department for his valuable advice on the PMF analysis. We especially appreciate the help of the local personnel who provided helpful information and flexible support throughout the collection and sample delivery processes.

Conflicts of Interest

The authors declare no conflict of interest.

References

  1. Chheang, L.; Thongkon, N.; Sriwiriyarat, T.; Thanasupsin, S.P. Heavy metal contamination and human health implications in the Chan Thnal reservoir, Cambodia. Sustainability 2021, 13, 13538. [Google Scholar] [CrossRef]
  2. Agrawal, S.B.; Singh, A.; Sharma, R.K.; Agrawal, M. Bioaccumulation of Heavy Metals in Vegetables: A Threat to Human Health. Terr. Aquat. Environ. Toxicol. 2007, 1, 13–23. [Google Scholar]
  3. Kladsomboon, S.; Jaiyen, C.; Choprathumma, C.; Tusai, T.; Apilux, A. Heavy metals contamination in soil, surface water, crops, and resident blood in Uthai District, Phra Nakhon Si Ayutthaya, Thailand. Environ. Geochem. Health 2020, 42, 545–561. [Google Scholar] [CrossRef] [PubMed]
  4. Bradl, H.B. Chapter 1 Sources and origins of heavy metals. In Interface Science and Technology; Elsevier: Amsterdam, The Netherlands, 2005; Volume 6, pp. 1–27. [Google Scholar]
  5. Agyeman, P.C.; Ahado, S.K.; John, K.; Kebonye, N.M.; Vašát, R.; Borůvka, L.; Kočárek, M.; Němeček, K. Health risk assessment and the application of CF-PMF: A pollution assessment–based receptor model in an urban soil. J. Soils Sediments 2021, 21, 3117–3136. [Google Scholar] [CrossRef]
  6. Radomirović, M.; Ćirović, Ž.; Maksin, D.; Bakić, T.; Lukić, J.; Stanković, S.; Onjia, A. Ecological Risk Assessment of Heavy Metals in the Soil at a Former Painting Industry Facility. Front. Environ. Sci. 2020, 8, 560415. [Google Scholar] [CrossRef]
  7. Adimalla, N.; Chen, J.; Qian, H. Spatial characteristics of heavy metal contamination and potential human health risk assessment of urban soils: A case study from an urban region of South India. Ecotoxicol. Environ. Saf. 2020, 194, 110406. [Google Scholar] [CrossRef]
  8. Egbueri, J.C.; Ukah, B.U.; Ubido, O.E.; Unigwe, C.O. A chemometric approach to source apportionment, ecological and health risk assessment of heavy metals in industrial soils from southwestern Nigeria. Int. J. Environ. Anal. Chem. 2020, 102, 3399–3417. [Google Scholar] [CrossRef]
  9. Khademi, H.; Gabarrón, M.; Abbaspour, A.; Martínez-Martínez, S.; Faz, A.; Acosta, J.A. Environmental Impact Assessment of Industrial Activities on Heavy Metals Distribution in Street Dust and Soil; Elsevier Ltd.: Amsterdam, The Netherlands, 2019. [Google Scholar]
  10. Monged, M.H.E.; Hassan, H.B.; El-Sayed, S.A. Spatial Distribution and Ecological Risk Assessment of Natural Radionuclides and Trace Elements in Agricultural Soil of Northeastern Nile Valley, Egypt. Water Air Soil Pollut. 2020, 231, 338. [Google Scholar] [CrossRef]
  11. Zhuang, S.; Lu, X.; Yu, B.; Fan, X.; Yang, Y. Ascertaining the pollution, ecological risk and source of metal(loid)s in the upstream sediment of Danjiang River, China. Ecol. Indic. 2021, 125, 107502. [Google Scholar] [CrossRef]
  12. Men, C.; Liu, R.; Xu, F.; Wang, Q.; Guo, L.; Shen, Z. Pollution characteristics, risk assessment, and source apportionment of heavy metals in road dust in Beijing, China. Sci. Total Environ. 2018, 612, 138–147. [Google Scholar] [CrossRef]
  13. Ahamad, M.I.; Song, J.; Sun, H.; Wang, X.; Mehmood, M.S.; Sajid, M.; Su, P.; Khan, A.J.K. Contamination Level, Ecological Risk, and Source Identification of Heavy Metals in the Hyporheic Zone of the Weihe River, China. Int. J. Environ. Res. Public Health 2020, 17, 1070. [Google Scholar] [CrossRef] [PubMed]
  14. Nhien, H.T.H.; Nguyen, G.T. Environmental soil, water, and sediment quality of dong thang landfill in Can Tho City, Vietnam. Appl. Environ. Res. 2019, 41, 73–83. [Google Scholar] [CrossRef]
  15. Rostami, S.; Kamani, H.; Shahsavani, S.; Hoseini, M. Environmental monitoring and ecological risk assessment of heavy metals in farmland soils. Hum. Ecol. Risk Assess. Int. J. 2021, 27, 392–404. [Google Scholar] [CrossRef]
  16. Thongyuan, S.; Khantamoon, T.; Aendo, P.; Binot, A.; Tulayakul, P. Ecological and health risk assessment, carcinogenic and non-carcinogenic effects of heavy metals contamination in the soil from municipal solid waste landfill in Central, Thailand. Hum. Ecol. Risk Assess. 2020, 27, 876–897. [Google Scholar] [CrossRef]
  17. Zhang, L.; Qin, S.; Shen, L.; Li, S.; Cui, J.; Liu, Y. Bioaccumulation, trophic transfer, and human health risk of quinolones antibiotics in the benthic food web from a macrophyte-dominated shallow lake, North China. Sci. Total Environ. 2020, 712, 136557. [Google Scholar] [CrossRef]
  18. Defarge, N.; Spiroux de Vendômois, J.; Séralini, G.E. Toxicity of formulants and heavy metals in glyphosate-based herbicides and other pesticides. Toxicol. Rep. 2018, 5, 156–163. [Google Scholar] [CrossRef]
  19. Jiang, H.H.; Cai, L.M.; Wen, H.H.; Hu, G.C.; Chen, L.G.; Luo, J. An integrated approach to quantifying ecological and human health risks from different sources of soil heavy metals. Sci. Total Environ. 2020, 701, 134466. [Google Scholar] [CrossRef]
  20. Kuerban, M.; Maihemuti, B.; Waili, Y.; Tuerhong, T. Ecological risk assessment and source identification of heavy metal pollution in vegetable bases of Urumqi, China, using the positive matrix factorization (PMF) method. PLoS ONE 2020, 15, e0230191. [Google Scholar] [CrossRef]
  21. Liu, C.; Yi, L.; Lu, A.; Xie, B.; Peng, H. Evaluating Metal(loid)s Contamination in Soil of a Typical In-Dustry Smelting Site in South Central China: Levels, Possible Sources and Human Health Risk Analysis. Sustainability 2021, 13, 11294. [Google Scholar] [CrossRef]
  22. Liu, P.; Zhan, X.; Wu, X.; Li, J.; Wang, H.; Gao, S. Effect of weathering on environmental behavior of microplastics: Properties, sorption and potential risks. Chemosphere 2020, 242, 125193. [Google Scholar] [CrossRef] [PubMed]
  23. Pluhator, M.M.; Thomson, A.B.R.; Fedorak, R.N. Clinical aspects of trace elements: Zinc in human nutrition—Assessment of zinc status. Can. J. Gastroenterol. 1996, 10, 37–42. [Google Scholar] [CrossRef]
  24. Polissar, A.V.; Hopke, P.K.; Paatero, P.; Malm, W.C.; Sisler, J.F. Atmospheric aerosol over Alaska 2. Elemental composition and sources. J. Geophys. Res. Atmos. 1998, 103, 19045–19057. [Google Scholar] [CrossRef]
  25. Sokcheng, S.; Socheat, K.; Molideth, S. Pesticide Use Practices in Cambodia’s Vegetable Farming; Cambodia Development Resource Institute (CDRI): Phnom Penh, Cambodia, 2021. [Google Scholar]
  26. Alengebawy, A.; Abdelkhalek, S.T.; Qureshi, S.R.; Wang, M.Q. Heavy Metals and Pesticides Toxicity in Agricultural Soil and Plants: Ecological Risks and Human Health Implications. Toxics 2021, 9, 42. [Google Scholar] [CrossRef] [PubMed]
  27. Shen, F.; Mao, L.; Sun, R.; Du, J.; Tan, Z.; Ding, M. Contamination evaluation and source identification of heavy metals in the sediments from the lishui river watershed, southern China. Int. J. Environ. Res. Public Health 2019, 16, 336. [Google Scholar] [CrossRef] [PubMed]
  28. Chand, V.; Prasad, S. ICP-OES assessment of heavy metal contamination in tropical marine sediments: A comparative study of two digestion techniques. Microchem. J. 2013, 111, 53–61. [Google Scholar] [CrossRef]
  29. Ruchuwararak, P.; Intamat, S.; Tengjaroenkul, B.; Neeratanaphan, L. Bioaccumulation of heavy metals in local edible plants near a municipal landfill and the related human health risk assessment. Hum. Ecol. Risk Assess. 2018, 25, 1549–7860. [Google Scholar] [CrossRef]
  30. Sriuttha, M.; Tengjaroenkul, B.; Intamat, S.; Phoonaploy, U.; Thanomsangad, P.; Neeratanaphan, L. Cadmium, chromium, and lead accumulation in aquatic plants and animals near a municipal landfill. Hum. Ecol. Risk Assess. 2017, 23, 350–363. [Google Scholar] [CrossRef]
  31. Ali, M.M.; Ali, M.L.; Islam, M.S.; Rahman, M.Z. Preliminary assessment of heavy metals in water and sediment of Karnaphuli River, Bangladesh. Environ. Nanotechnol. Monit. Manag. 2016, 5, 27–35. [Google Scholar] [CrossRef]
  32. Genc, T.O.; Yilmaz, F. Metal pollution assessment in water and sediment of Sarıcay stream in Mugla-Turkey. J. Chem. Pharm. Res. 2016, 8, 786–794. [Google Scholar]
  33. Siddiqui, E.; Pandey, J. Assessment of heavy metal pollution in water and surface sediment and evaluation of ecological risks associated with sediment contamination in the Ganga River: A basin-scale study. Environ. Sci. Pollut. Res. 2019, 26, 10926–10940. [Google Scholar] [CrossRef] [PubMed]
  34. Suresh, G.; Ramasamy, V.; Meenakshisundaram, V.; Venkatachalapathy, R.; Ponnusamy, V. Influence of mineralogical and heavy metal composition on natural radionuclide concentrations in the river sediments. Appl. Radiat. Isot. 2011, 69, 1466–1474. [Google Scholar] [CrossRef] [PubMed]
  35. Khan, S.; Cao, Q.; Zheng, Y.M.; Huang, Y.Z.; Zhu, Y.G. Health risks of heavy metals in contaminated soils and food crops irrigated with wastewater in Beijing, China. Environ. Pollut. 2008, 152, 686–692. [Google Scholar] [CrossRef] [PubMed]
  36. US EPA. EPA Positive Matrix Factorization (PMF) 5.0 Fundamentals and User Guide; Environmental Protection Agency Office of Research and Development, Publushing House: Washington, DC, USA, 2014; p. 136.
  37. Weber, P.; Behr, E.R.; De Lellis Knorr, C.; Secretti Vendruscolo, D.; Flores, E.M.M.; Dressler, V.L.; Baldisserotto, B. Metals in the water, sediment, and tissues of two fish species from different trophic levels in a subtropical Brazilian river. Microchem. J. 2013, 106, 61–66. [Google Scholar] [CrossRef]
  38. Yan, A.; Wang, Y.; Tan, S.N.; Mohd Yusof, M.L.; Ghosh, S.; Chen, Z. Phytoremediation: A Promising Approach for Revegetation of Heavy Metal-Polluted Land. Front. Plant Sci. 2020, 11, 359. [Google Scholar] [CrossRef] [PubMed]
  39. Abel, M.T.; Suedel, B.; Presley, S.M.; McDaniel, L.N.; Rigdon, R.; Goebel, T.; Lascano, R.J.; Zartman, R.; Anderson, T.A.; Cobb, G.P. Contribution of Soil Lead to Blood Lead in Children: A Study from New Orleans, LA. J. Environ. Prot. 2012, 3, 1704–1710. [Google Scholar] [CrossRef]
  40. Zarcinas, A.B.; Pongsakul, P.; McLaughlin, J.M.; Cozens, G. Heavy metals in soils and crops in Southeast Asia. 2. Thailand. Environ. Geochem. Health 2004, 26, 359–371. [Google Scholar] [CrossRef]
  41. Olayinka-Olagunju, J.O.; Olatunji-Ojo, A.M. Bioaccumulation of Heavy Metals in Pelagic and Benthic Fishes of Ogbese River, Ondo State, South-Western Nigeria. Water Air Soil Pollut. 2021, 232, 44. [Google Scholar] [CrossRef]
  42. Pollution Control Department. Sediment Quality Criteria in Surface Water Resources; Pollution Control Department, Ministry of Natural Resources and Environment: Bangkok, Thailand, 2018.
  43. Zhu, D.; Wei, Y.; Zhao, Y.; Wang, Q.; Han, J. Heavy Metal Pollution and Ecological Risk Assessment of the Agriculture Soil in Xunyang Mining Area, Shaanxi Province, Northwestern China. Bull. Environ. Contam. Toxicol. 2018, 101, 178–184. [Google Scholar] [CrossRef]
  44. Ebrahimpour, M.; Mushrifah, I. Heavy metal concentrations in water and sediments in Tasik Chini, a freshwater lake, Malaysia. Environ. Monit. Assess. 2008, 141, 297–307. [Google Scholar] [CrossRef]
  45. Karbassi, A.R.; Monavari, S.M.; Nabi Bidhendi, G.R.; Nouri, J.; Nematpour, K. Metal pollution assessment of sediment and water in the Shur River. Environ. Monit. Assess. 2008, 147, 107–116. [Google Scholar] [CrossRef] [PubMed]
  46. Vlotman, D.E.; Ngila, J.C.; Ndlovu, T.; Malinga, S.P. Hyperbranched polymer integrated membrane for the removal of arsenic(III) in water. J. Membr. Sci. Res. 2018, 4, 53–62. [Google Scholar]
  47. Jayasumana, C.; Fonseka, S.; Fernando, A.; Jayalath, K.; Amarasinghe, M.; Siribaddana, S.; Gunatilake, S.; Paranagama, P. Phosphate fertilizer is a main source of arsenic in areas affected with chronic kidney disease of unknown etiology in Sri Lanka. SpringerPlus 2015, 4, 90. [Google Scholar] [CrossRef] [PubMed]
  48. Smith, A.H.; Marshall, G.; Liaw, J.; Yuan, Y.; Ferreccio, C.; Steinmaus, C. Mortality in young adults following in utero and childhood exposure to arsenic in drinking water. Environ. Health Perspect. 2012, 120, 1527–1531. [Google Scholar] [CrossRef]
  49. World Health Organization. Preventing Disease through Healthy Environment—Exposure to Arsenic: A Major Public Health Concern; WHO: Geneva, Switzerland, 2019; pp. 1–5.
  50. Plum, L.M.; Rink, L.; Hajo, H. The essential toxin: Impact of zinc on human health. Int. J. Environ. Res. Public Health 2010, 7, 1342–1365. [Google Scholar] [CrossRef]
  51. Wongsasuluk, P.; Chotpantarat, S.; Siriwong, W.; Robson, M. Heavy metal contamination and human health risk assessment in drinking water from shallow groundwater wells in an agricultural area in Ubon Ratchathani province, Thailand. Environ. Geochem. Health 2014, 36, 169–182. [Google Scholar] [CrossRef]
  52. Chen, B.; Liu, K.; Liu, Y.; Qin, J.; Peng, Z. Source identification, spatial distribution pattern, risk assessment and influencing factors for soil heavy metal pollution in a high-tech industrial development zone in Central China. Hum. Ecol. Risk Assess. 2021, 27, 560–574. [Google Scholar] [CrossRef]
  53. Xie, T.; Wang, M.; Chen, W.; Uwizeyimana, H. Impacts of urbanization and landscape patterns on the accumulation of heavy metals in soils in residential areas in Beijing. J. Soils Sediments 2019, 19, 148–158. [Google Scholar] [CrossRef]
  54. Roy, S.; Gupta, S.K.; Prakash, J.; Habib, G.; Baudh, K.; Nasr, M. Ecological and human health risk assessment of heavy metal contamination in road dust in the National Capital Territory (NCT) of Delhi, India. Environ. Sci. Pollut. Res. 2019, 26, 30413–30425. [Google Scholar] [CrossRef]
  55. Harvey, P.J.; Rouillon, M.; Dong, C.; Ettler, V.; Handley, H.K.; Taylor, M.P.; Tyson, E.; Tennant, P.; Telfer, V.; Trinh, R. Geochemical sources, forms and phases of soil contamination in an industrial city. Sci. Total Environ. 2017, 584–585, 505–514. [Google Scholar] [CrossRef]
  56. Jin, Z.; Lv, J. Integrated receptor models and multivariate geostatistical simulation for source apportionment of potentially toxic elements in soils. Catena 2020, 194, 104638. [Google Scholar] [CrossRef]
  57. Pehlić, E.; Nanić, H.; Jukić, H.; Aldžić, A. Determination of Heavy Metals in Hair Dyes by the Atomic Absorption Spectrophotometry. Lect. Notes Netw. Syst. 2019, 42, 561–567. [Google Scholar]
  58. Mostafaii, G.; Karamali, F.; abooSaedi, Z.; Atoof, F.; Hesami Arani, M.; Miranzadeh, M.B. Determination of Heavy Metals in Hair Dye Sale in Iranian Market: Dermal Sensitivity and Carcinogenicity Assessment. Biol. Trace Elem. Res. 2022, 200, 1464–1472. [Google Scholar] [CrossRef] [PubMed]
  59. Ahmed, H.A.M.; Goher, A.S.; Alzubaidi, A.A.A.M. Risk assessment of heavy metals content in different hair dyes and their users’ urine samples. Int. J. Environ. Anal. Chem. 2021, 101, 1116–1125. [Google Scholar] [CrossRef]
Figure 1. Sampling locations (L1 to L6) in the study area and the circumstance connected to each location (L1 to L6).
Water 15 01566 g001
Figure 2. Results of the geoaccumulation index: (a) Igeo values of each heavy metal in all locations and (b) location-based percentage Igeo for each heavy metal.
Water 15 01566 g002
Figure 3. (a) Ecological risks and (b) potential ecological risks.
Water 15 01566 g003
Figure 4. Principal component analysis method for factor prediction. The red arrow indicates the number of components corresponding to the Eigenvalue equal to 1.
Water 15 01566 g004
Figure 5. Source profiles of metals and source contribution percentages from the PMF model.
Water 15 01566 g005
Figure 6. Factor fingerprints of metals resulting from the PMF model.
Water 15 01566 g006
Figure 7. Factor contribution of heavy metal contamination in the sediment from the PMF model.
Water 15 01566 g007
Disclaimer/Publisher’s Note: The statements, opinions and data contained in all publications are solely those of the individual author(s) and contributor(s) and not of MDPI and/or the editor(s). MDPI and/or the editor(s) disclaim responsibility for any injury to people or property resulting from any ideas, methods, instructions or products referred to in the content.

