
Impacts of Riverine Floods on Morphodynamics in the Yellow River Delta
by
 ,
,
Yutao Fu
1,2,
Richard G. J. Bellerby
1,2,*,
Hongyu Ji
1,
Shenliang Chen
1,*,
Yaoshen Fan
3 and
Peng Li
1 1
State Key Laboratory of Estuarine and Coastal Research, East China Normal University, Shanghai 200241, China
2
Norwegian Institute of Water Research, 5006 Bergen, Norway
3
Yellow River Institute of Hydraulic Research, Yellow River Conservancy Commission, Zhengzhou 450003, China
*
Authors to whom correspondence should be addressed.
Water 2023, 15(8), 1568; https://doi.org/10.3390/w15081568
Submission received: 1 March 2023
/
Revised: 30 March 2023
/
Accepted: 14 April 2023
/
Published: 17 April 2023
(This article belongs to the Section Hydrology)
Highlights
What are the main findings?
- High-energy riverine floods can cause significant hydrodynamic changes.
- The deltaic morphodynamics is vulnerable to episodic extreme floods.
What is the implication of the main finding?
- The methods presented here are easily applicable to similar systems.
Abstract
:The geomorphological stability and ecological environment of megadeltas worldwide are of vital importance for their sustainable development. Deltaic hydro-morphodynamics is extremely sensitive to high riverine flow due to reduced sediment supply. However, the morphological evolution and response of deltas under high riverine flow have remained inadequately quantified. As one of the typical megadeltas, the Yellow River Delta (YRD), is becoming increasingly sensitive to environmental changes and intensified human interventions. In this study, a numerical model and field data were used to investigate the hydrodynamic changes and morphodynamic evolution induced by extreme river discharge in the YRD. The numerical experiments with different runoff scenarios reveal that high-energy riverine floods can cause significant hydrodynamic changes in bed shear stresses, water levels, and flow velocities, particularly in the abandoned river mouth. Moreover, it enhances the ebb-dominated tidal asymmetry, which considerably intensifies fluvial sediment resuspension and transport processes. The results also show high-energy riverine floods in the flood seasons trigger severe erosion in the Yellow River submerged delta, with a net erosion volume reaching −0.07 × 10⁸ m3/year. The hydrodynamic increment in the abandoned river mouth is more significant, and therefore, severe erosion occurs, with the maximum erosion thickness reaching 7 m. These findings highlight the role of high riverine floods on the hydro-sediment dynamics of large river deltas under a sediment starvation condition.
1. Introduction
Deltas are the most densely populated areas of the world and are of essential socio-economic and ecological importance [1,2,3,4]. As the transition zones of the land-ocean margins, deltas are susceptible to interactions between riverine and oceanic processes [5]. Riverine runoff and tidal hydrodynamics not only dominate sediment delivery near the estuary, but also affect the morphodynamic development of deltas [6,7,8]. Deltas are highly sensitive to increasing risks arising from local human activities, sea-level rise, land subsidence, and extreme storm and flood events [7,9,10,11,12]. Wherein, extreme riverine floods have significant impacts on deltaic hydrodynamic changes and sediment budgets [13,14,15,16,17]. In recent decades, fluvial sediments delivered to the sea have drastically reduced due to the integrated effects of climate change and anthropogenic interventions in the river basins. Many megadeltas in the world are suffering from potentially irreversible erosion risks due to sediment starvation, which has been witnessed in the Yangtze [18], Mississippi [19], Nile [20], Mekong [21], and Ganges-Brahmaputra deltas [22]. Sediment-starved runoffs have direct effects on variations in the short- or long-term erosion/accretion patterns of the deltaic systems [16,23,24,25]. During extreme riverine floods, the large-scale sediment transport and resuspension processes can be significantly intensified [13,26,27,28]. Therefore, understanding the deltaic response and morphological changes induced by extreme riverine floods is critical for developing integrated management and sustainability strategies.
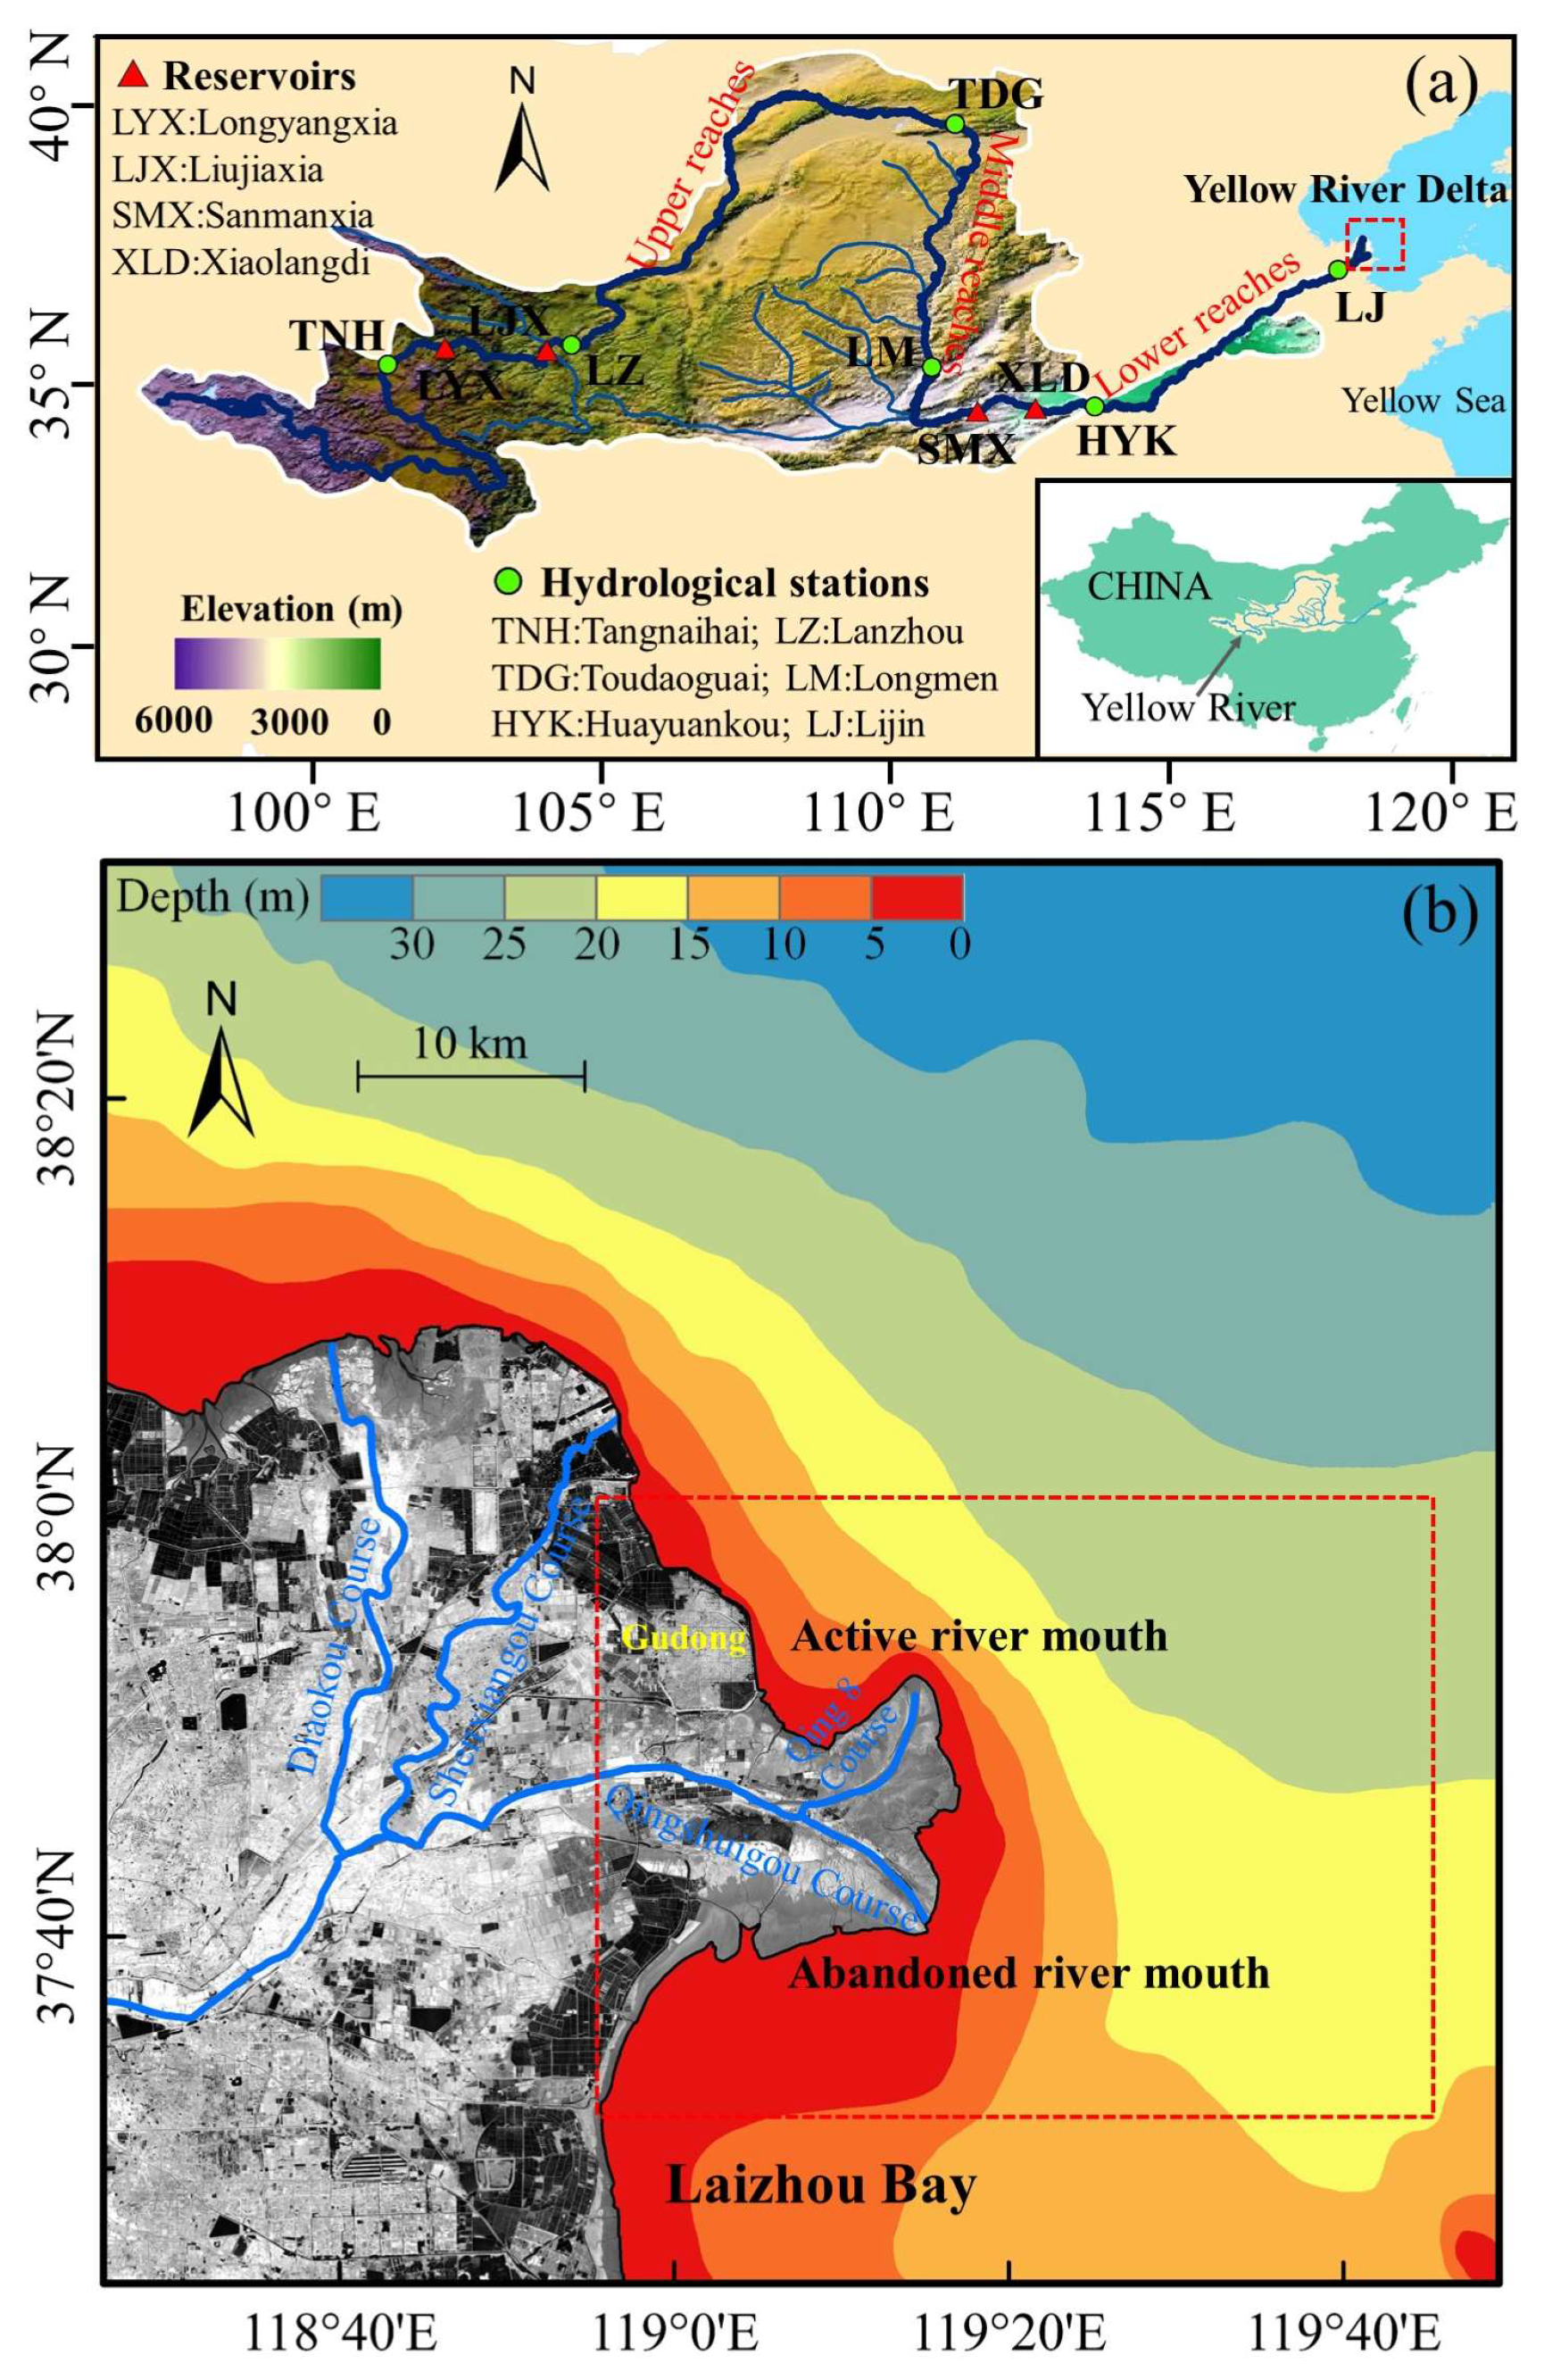
The Yellow River Delta (YRD) is located on the west coast of the Bohai Sea and is a typical fluvial-dominated delta (Figure 1a) which is significantly affected by various natural forcing and anthropogenic interventions [10,23,29,30]. Recent studies showed that rising sea levels, land subsidence, storm events, and human activities may have impacted deltaic hydrodynamics and morphodynamics. Specifically, Li et al. [31] examined how sea level rise affects tidal dynamics in the Bohai Sea and revealed that the amphidromic point of the tidal constituent shifted under sea level rise conditions. Higgins et al. [10] indicated that land subsidence inevitably affected the geomorphic variation of the YRD. Fan et al. [32] found that frequent storm processes enhanced the residual velocities and decreased the tidal shear front, which considerably intensified the sediment transport and resuspension in the YRD. Zhu et al. [33] demonstrated that human activities such as reclamation projects have altered shoreline and regional tidal dynamics. Although the interaction between river discharge and the tide shear front in the YRD has been examined [15], its hydro-morphodynamics caused by high runoff during the flood seasons is still unclear.
Over recent decades, under natural forcing and intensified human intervention in the river catchment, the river discharge delivered to the YRD has declined dramatically. Before 1999, the average runoff and sediment discharge at Lijin station in the flood seasons (from July to October) were 5.27 × 10⁹ m3 and 1.84 × 10⁸ t, respectively [23]. After 2000, the mean water and sediment discharge during the flood seasons declined to 2.11 × 10⁹ m3 and 0.23 × 10⁸ t, respectively [23]. Moreover, the mean suspended sediment concentration (SSC) reached 29.0 kg/m3 before 2000, and decreased to 6.6 kg/m3 after 2000 [15]. Therefore, the relatively balanced sediment budget in the downstream area of the YRD has been altered, inducing the risk of sediment starvation and severe erosion [23,34,35]. In the YRD, high riverine floods may influence short-term and seasonal erosion-accretion processes. Extreme riverine floods are essential triggers for the geomorphic evolution of deltas [7,27,36]. Recently, extensive research has been conducted on the morphological evolution of subaerial and subaqueous deltas [23,34,37], the spatial and temporal variations of suspended particulate matter in the Bohai Sea [38], the impact of storm events [32,39], as well as the distribution of nutrients [40]. However, little emphasis has been made on quantifying the YRD’s geomorphic response to high riverine floods, especially the hydrodynamic and morphodynamic changes induced by extreme floods under sediment starvation conditions.
Therefore, the primary objectives of our paper are as follows: (1) to explore the hydrodynamic changes of the YRD under low runoff and extreme riverine floods; (2) to identify the erosion-accretion patterns induced by high runoffs during the flood seasons; and (3) to quantify the impacts of extreme riverine floods on hydro-morphodynamics. This research will help gain insights into understanding the effects of extreme floods on deltaic systems, as well as provide scientific foundations for the long-term sustainability and management of megadeltas worldwide.
2. Study Area
The Yellow River is the second-largest river in China, with a total length of 5464 km and a drainage area of 7.95 × 10⁵ km2 (Figure 1a). The main stream of the river is divided into upper, middle, and lower reaches (Figure 1b). Historically, there have been more than 1593 channel avulsions in the YRD. The deltaic course has migrated from the Shenxiangou course (1953–1964) and the Diaokouhe course (1964–1976) to the Qingshuigou course (1976–1996). After that, the course was artificially shifted to the Qing 8 course in 1996 [41]. Almost 20% of the annual fluvial sediment was delivered to the deltaic channel, and most sediments were deposited in the Yellow River submerged delta and partly transported offshore [42,43]. Over the past 70 years, the SSC in the YRD indicated a significantly decreasing trend, particularly in the flood season. The mean SSC has fallen to 24% of the 1950–1985 level (see Figure S1 in supplementary material).
The YRD is characterized by its irregular semi-diurnal tide with mean tidal range reaching 0.7–1.8 m [44]. The residual current is driven by fluvial discharge and monsoon winds with an average value of 0.2–0.3 m/s [45]. Tidal current is generally parallel to the coastline, flowing southward during flood tide and northward during ebb tide, with a current speed of 1.0–2.0 m/s [46].
3. Data and Methods
3.1. Datasets
In this study, a series of data was systematically collected to analyze deltaic hydro-morphodynamics, including river discharge, suspended sediment concentration, field observations, bathymetry, and satellite images.
River discharge and suspended sediment concentration data at the Lijin hydrological monitoring station were collected from the Yellow River Conservancy Commission (YRCC). The magnitude and frequency of high runoff are analyzed by using monthly river discharge and SSC from 1950 to 2021. Therefore, we chose 4 runoff values as the model inputs: Q500, Q1500, Q4000, and Q7500 m3/s. During the flood seasons (July–October), the cumulative frequencies of the four constant runoffs are 20%, 55%, 95% and 100%, respectively (Figure S2a). Total river discharges in 2018 and 2020 were higher than any previous discharge in the 25 years since 1996, especially at the start of the flood season (Figure S2b). In 2021, another flood occurred and discharge increased to over 4000 m3/s in October (Figure S2b,c). Additionally, daily river discharges in 2018 and 2020 were also gathered from the YRCC as runoff inputs.
Hydrodynamic data from observed sites in the YRD included water levels, flow velocities, and flow directions. These data are utilized to compare with computed results and assess the performance of the model. Water levels were recorded at tidal gauge sites along the Bohai Sea coast from 17 August to 31 August 2018 (1 spring-neap tide cycle). Flow velocities and flow directions were also measured in August 2018 at six fixed stations near the Diaokouhe abandoned estuary (D1 and D2), the Gudong littoral zone (G1 and G2), and the active YRD (Y1 and Y2). Hourly flow velocities and flow directions of 6 different layers (Hsurface, H0.2, H0.4, H0.6, H0.8, Hbottom) were collected using Acoustic Doppler Current Profilers (ADCPs) at each station. The hourly depth-averaged values of flow velocity and flow direction were also calculated based on these hydrodynamic data. The other field-observed data include the in situ-observed suspended sediment concentration at fixed sites (SA1, SA2, SB1, SB2, SC1, and SC2) in July 2019. Meanwhile, hourly suspended sediment samples were collected at 3 water layers (Hsurface, H0.6, Hbottom) for 25 h, covering one flood-ebb cycle.
High-resolution subaqueous bathymetric data of the YRD were gathered in 2018 and 2020, and were applied to examine erosion and accretion patterns in the flood season. These bathymetric data were provided by the YRCC. In addition, the Landsat-8 OLI satellite images in 2018, 2019 and 2020 were obtained from the United States Geological Survey (USGS) Center (https://www.usgs.gov/ (accessed on 5 December 2022)).
3.2. Methods
3.2.1. Model Setup
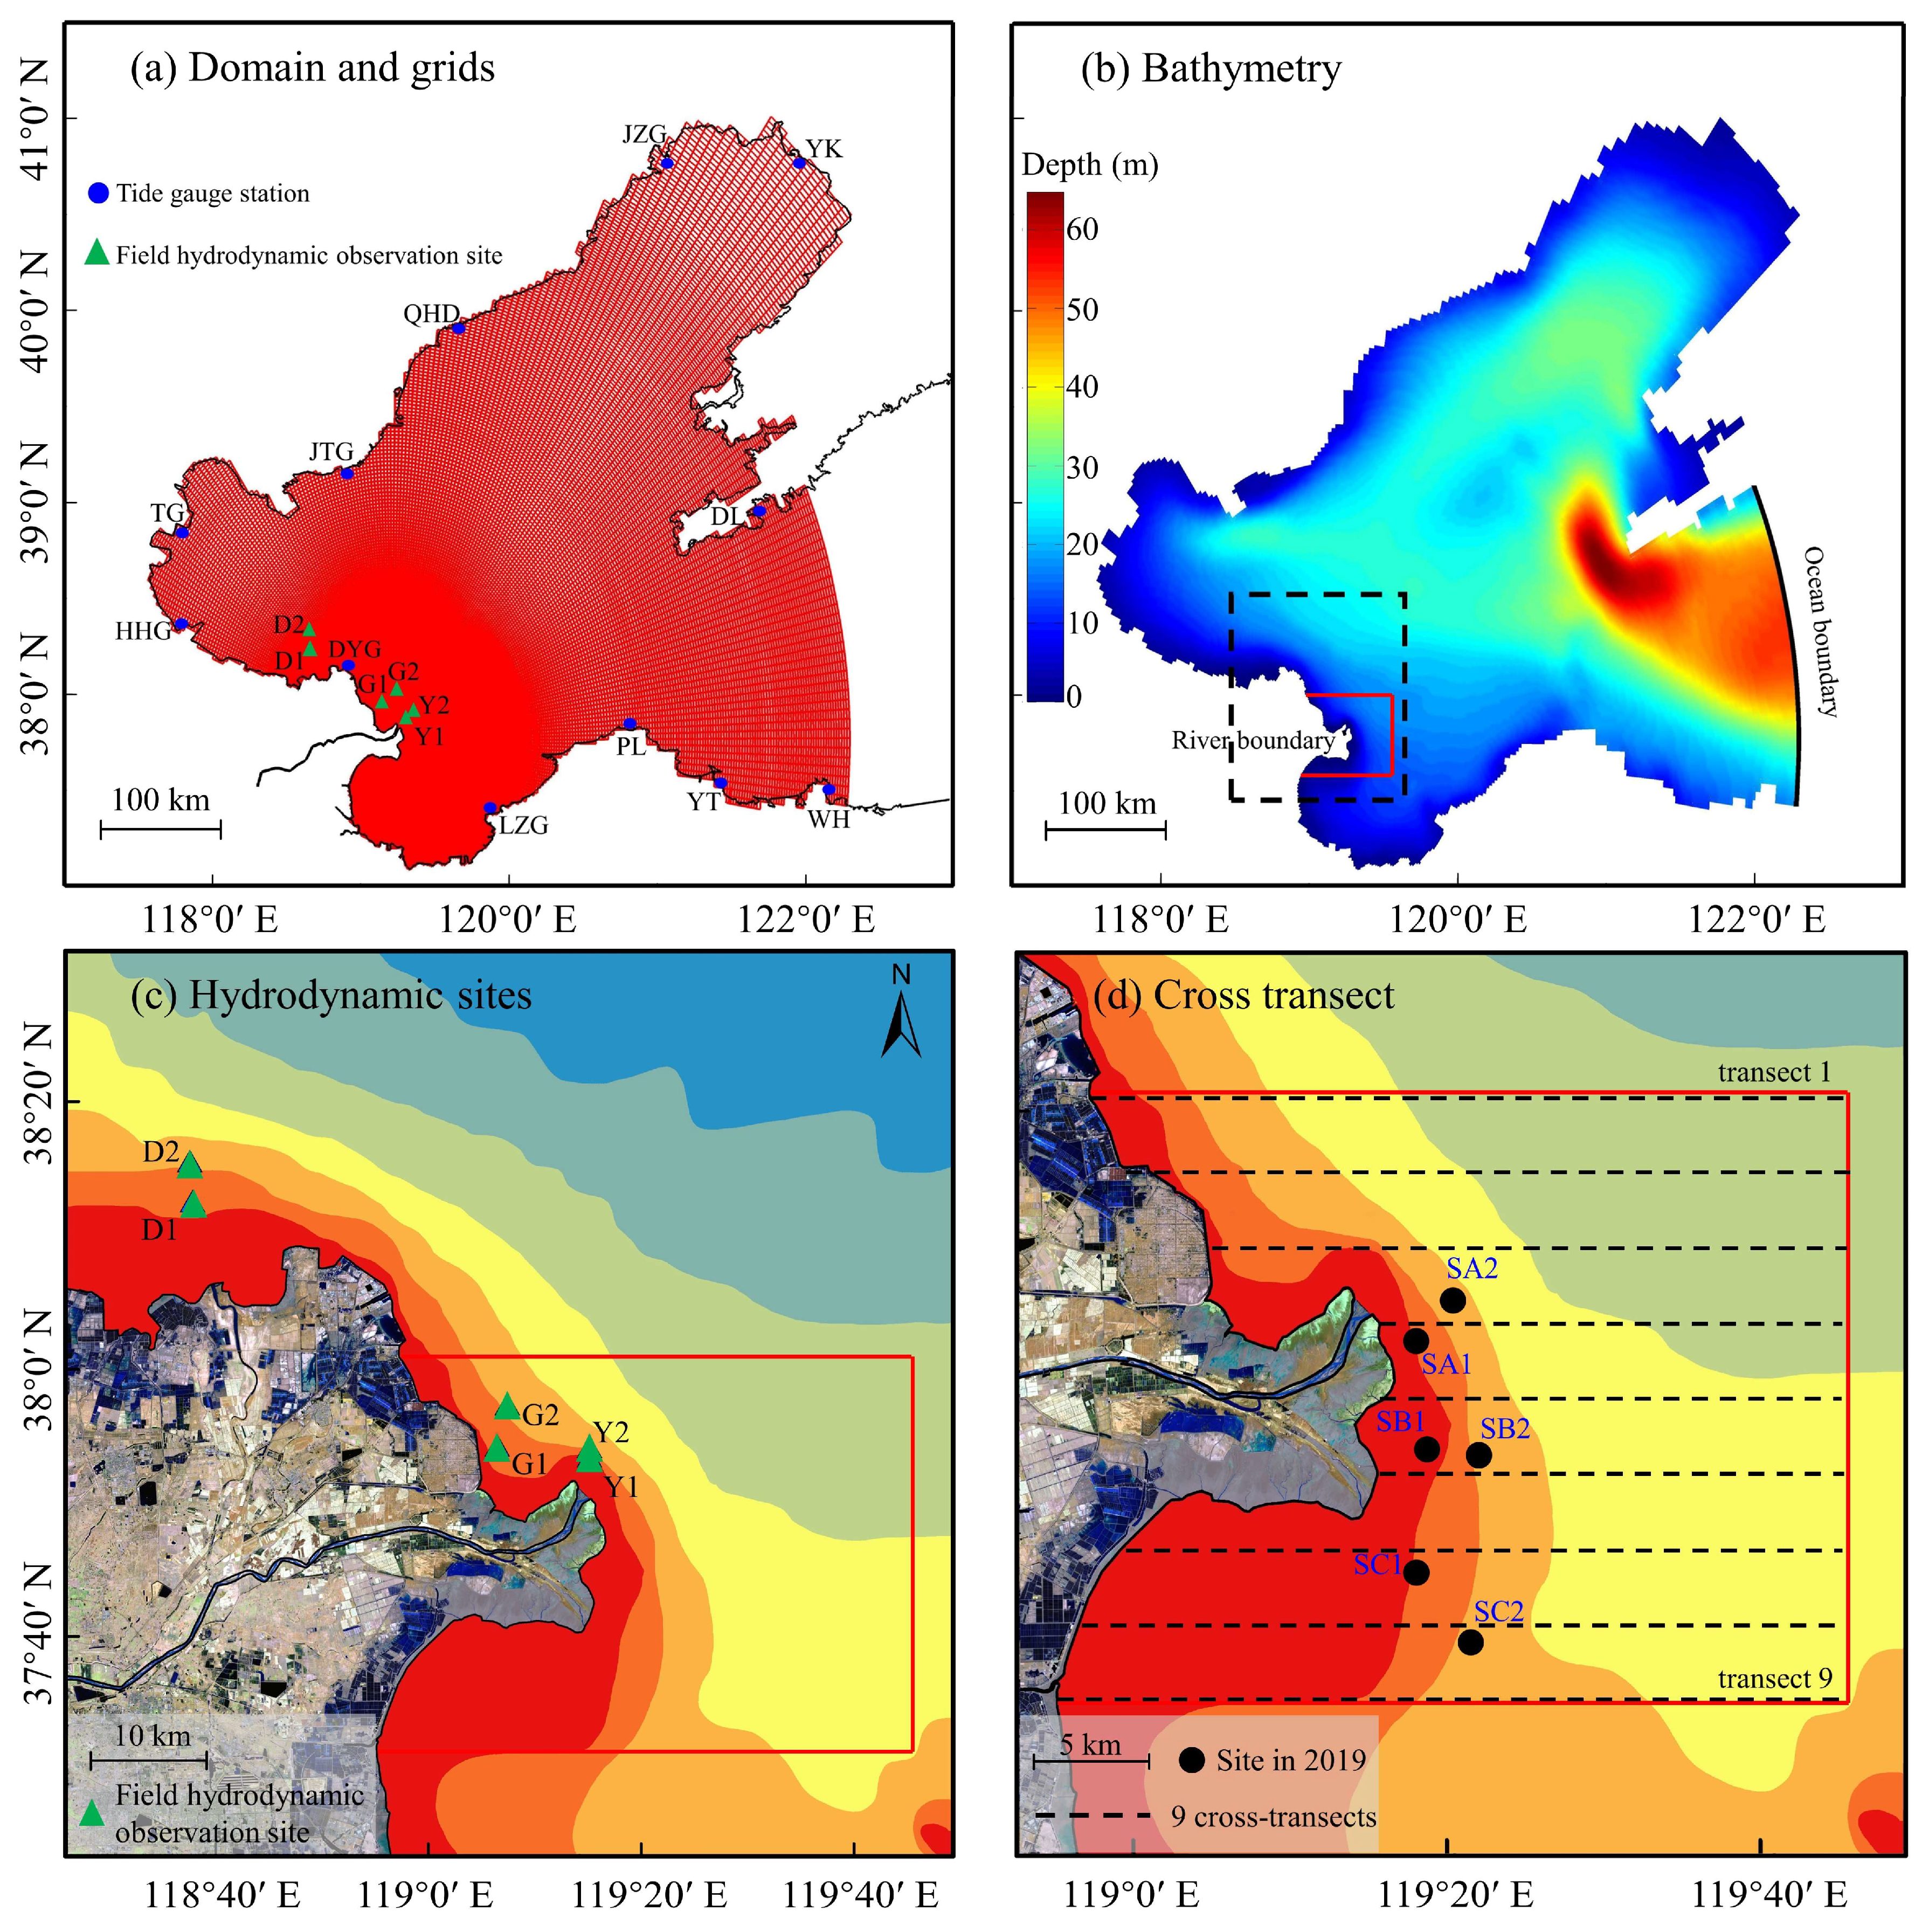
A three-dimensional hydrodynamic model was utilized to quantify hydrodynamic changes based on the Delft3D model. The computational domain covers the whole Bohai Sea and a portion of the north Yellow Sea, spanning 37°05′ to 41°0′ N in latitude and 117°35′ to 122°23′ E in longitude, as shown in Figure 2a. The spatial ranges of the domain varied from 3 km at the offshore boundary to roughly 100 m of the active river mouth area, with a total grid of 338 × 313 cells (Figure 2a). The model used sigma coordinates in the vertical direction, and each layer of σ was equally set to 0.2 from the bottom to the top layer. The shoreline boundary was extracted from the Landsat satellite image in 2018, which closely followed the real distribution. Moreover, the Manning coefficient m was calculated using bathymetric data [47]:
where h is the water depth (m). As a result of model validation, a uniform Manning coefficient of 0.025 is set for water depths less than 1 m. According to CFL criteria, the hydrodynamic time step was limited to 2 min (Courant, Friedrichs and Lewy).
In this model, both seaward open boundary and river boundary were considered (Figure 2b). The river boundary was prescribed based on the observed daily discharge in July 2018 and August 2020 and four constant values (Q500, Q1500, Q4000, and Q7500 m3/s) at the Lijin hydrological station. The seaward open boundary was driven by an astronomic tidal forcing with 8 tide constituents (M2, S2, N2, K2, K1, O1, P1, and Q1), which were derived from the TPXO 8.0 Global Tidal Models (https://www.tpxo.net/global (accessed on 5 December 2022)). Water temperature, sediment, salinity, and wind waves are not considered in this model.
3.2.2. Model Validations
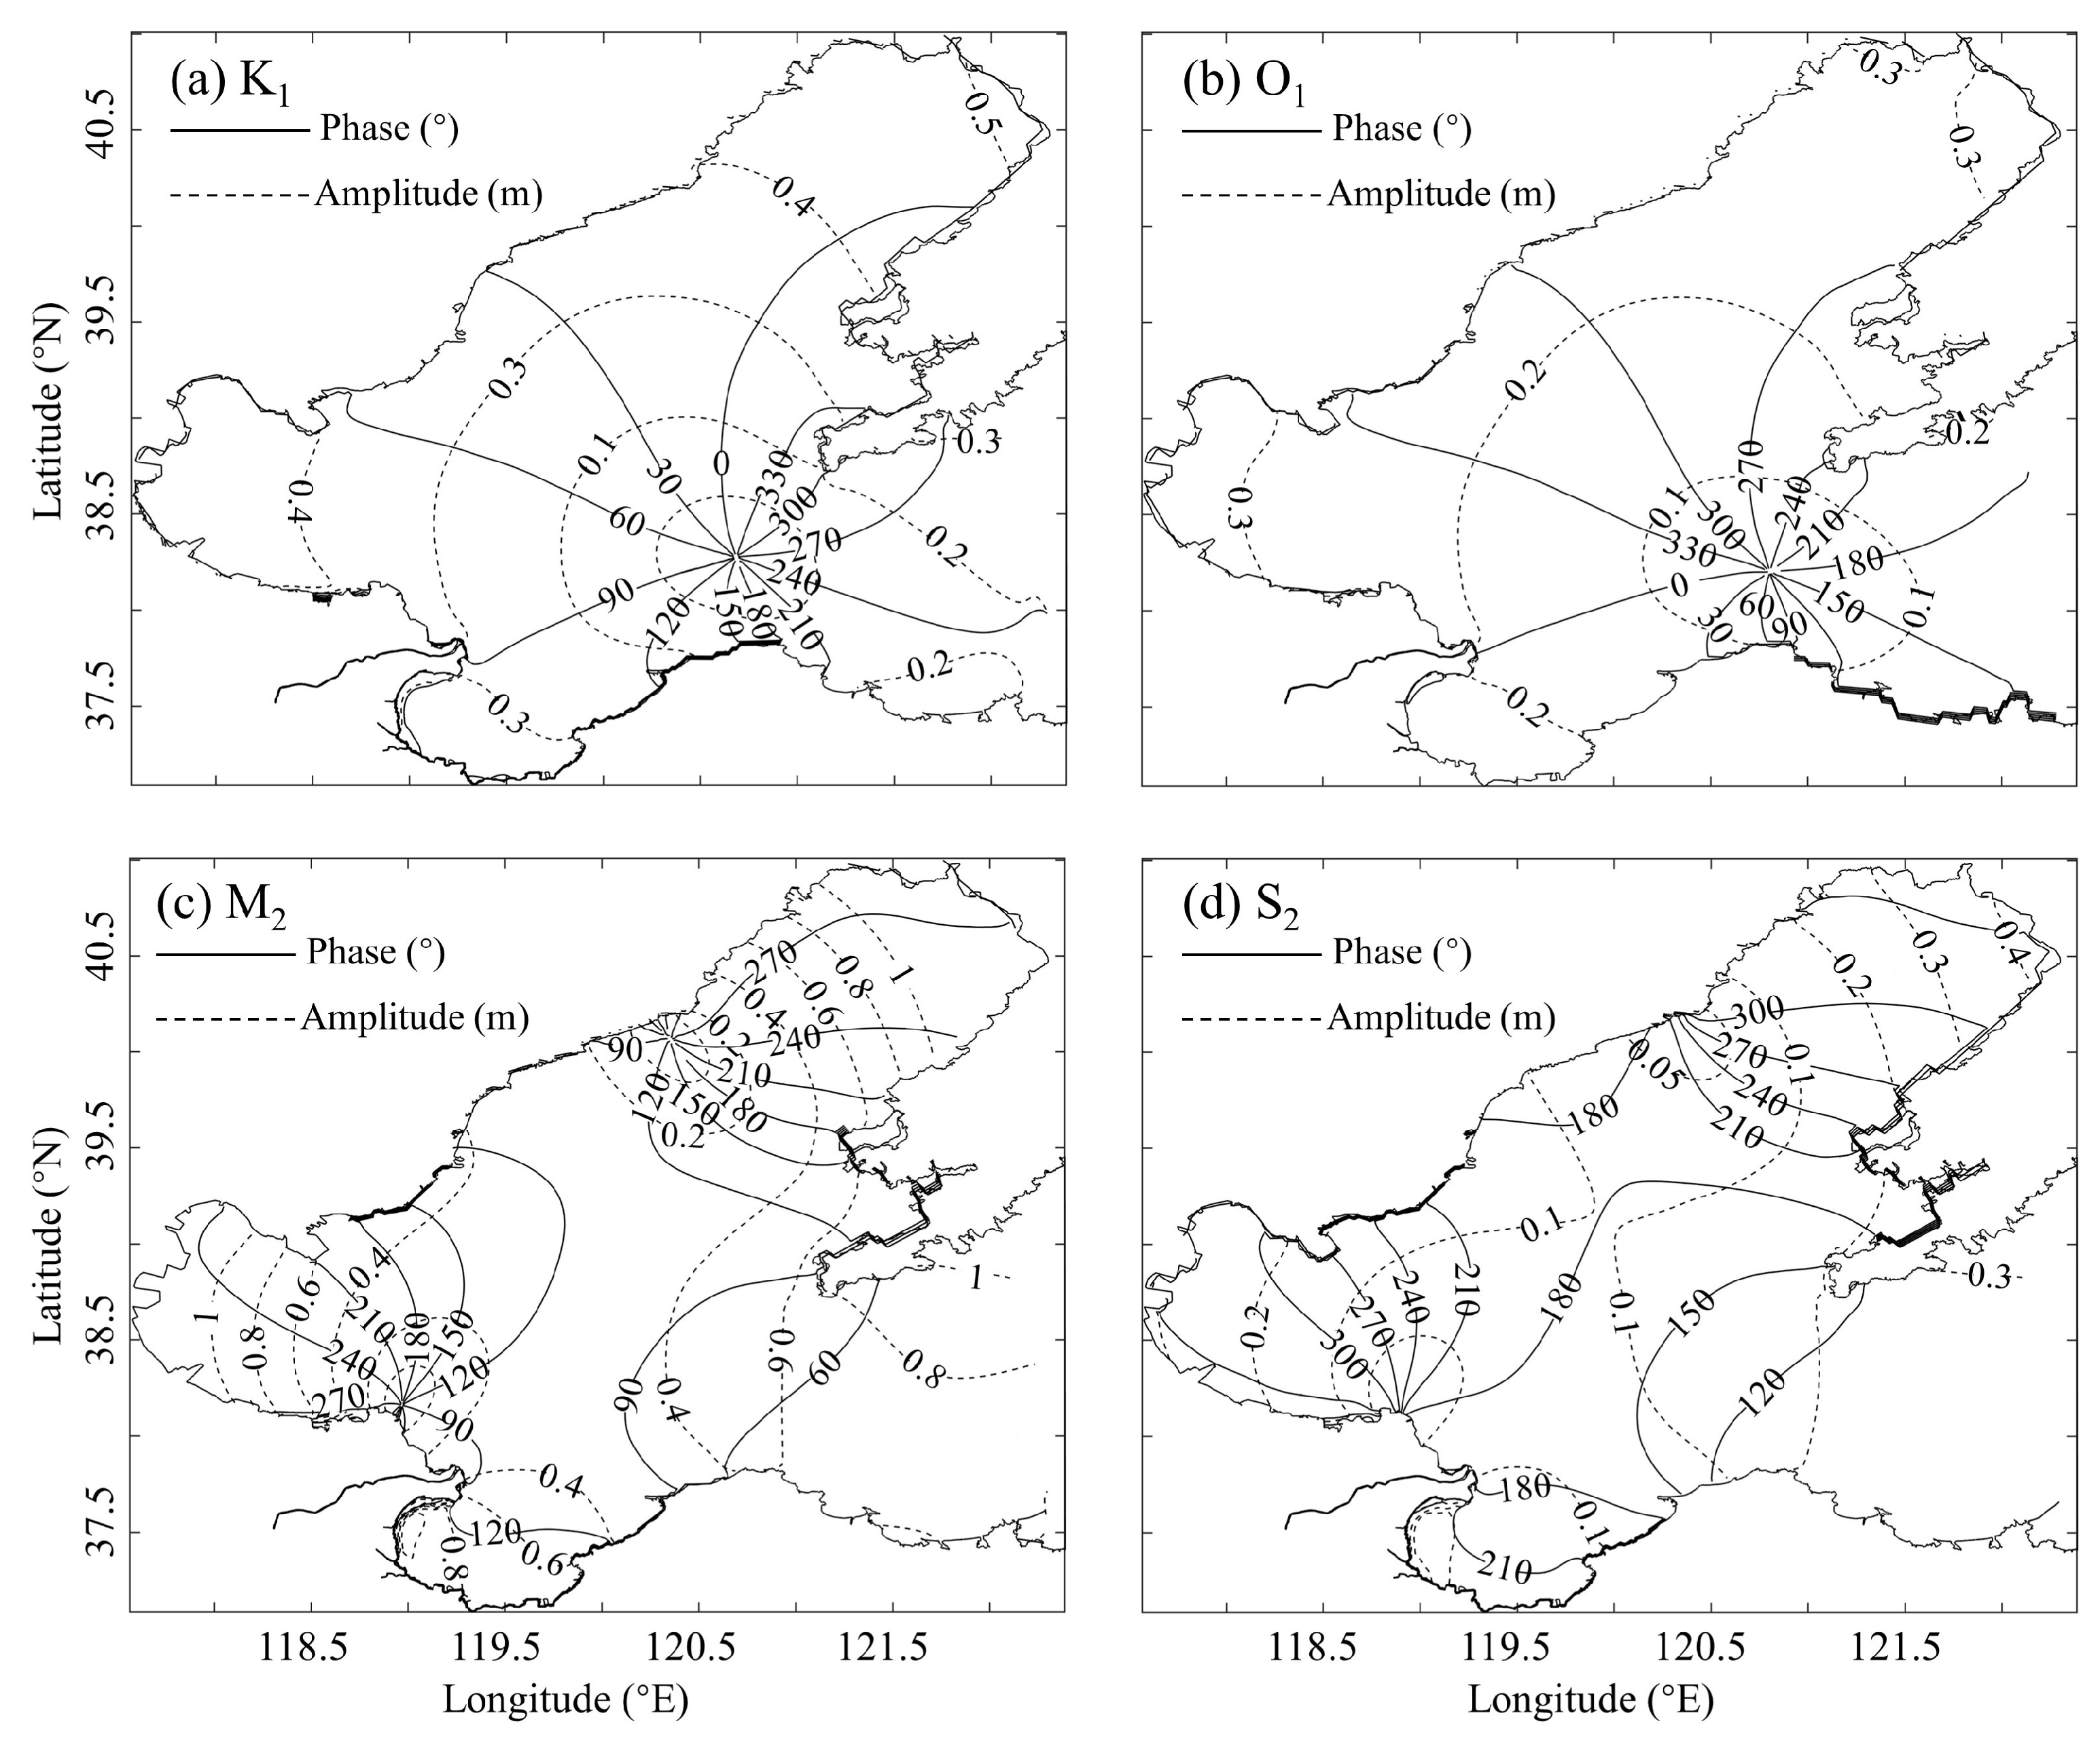
Tide dynamics in the Bohai Sea were calculated using the harmonic analysis method of Pawlowicz et al. [48]. The tide amplitude and phases for M2, S2, K1, and O1 tidal constituents are shown in Figure 3a–d. In the Bohai Sea, there are two amphidromic points for semidiurnal tidal constituents (M2 and S2), one near QHD and the other near DYG. One amphidromic point for diurnal tidal constituents (K1 and O1) appears in the Bohai Strait. The results are generally consistent with previous research [15,49].
The root-mean-square error (RMSE) and correlation coefficient (CC) between the modeled and observed results were used to evaluate the model performance [15,50,51]:
where Xi and Yi are the values of modeled and observed data, respectively. and are the time-average values of Xi and Yi, respectively, and N is the number of Yi.
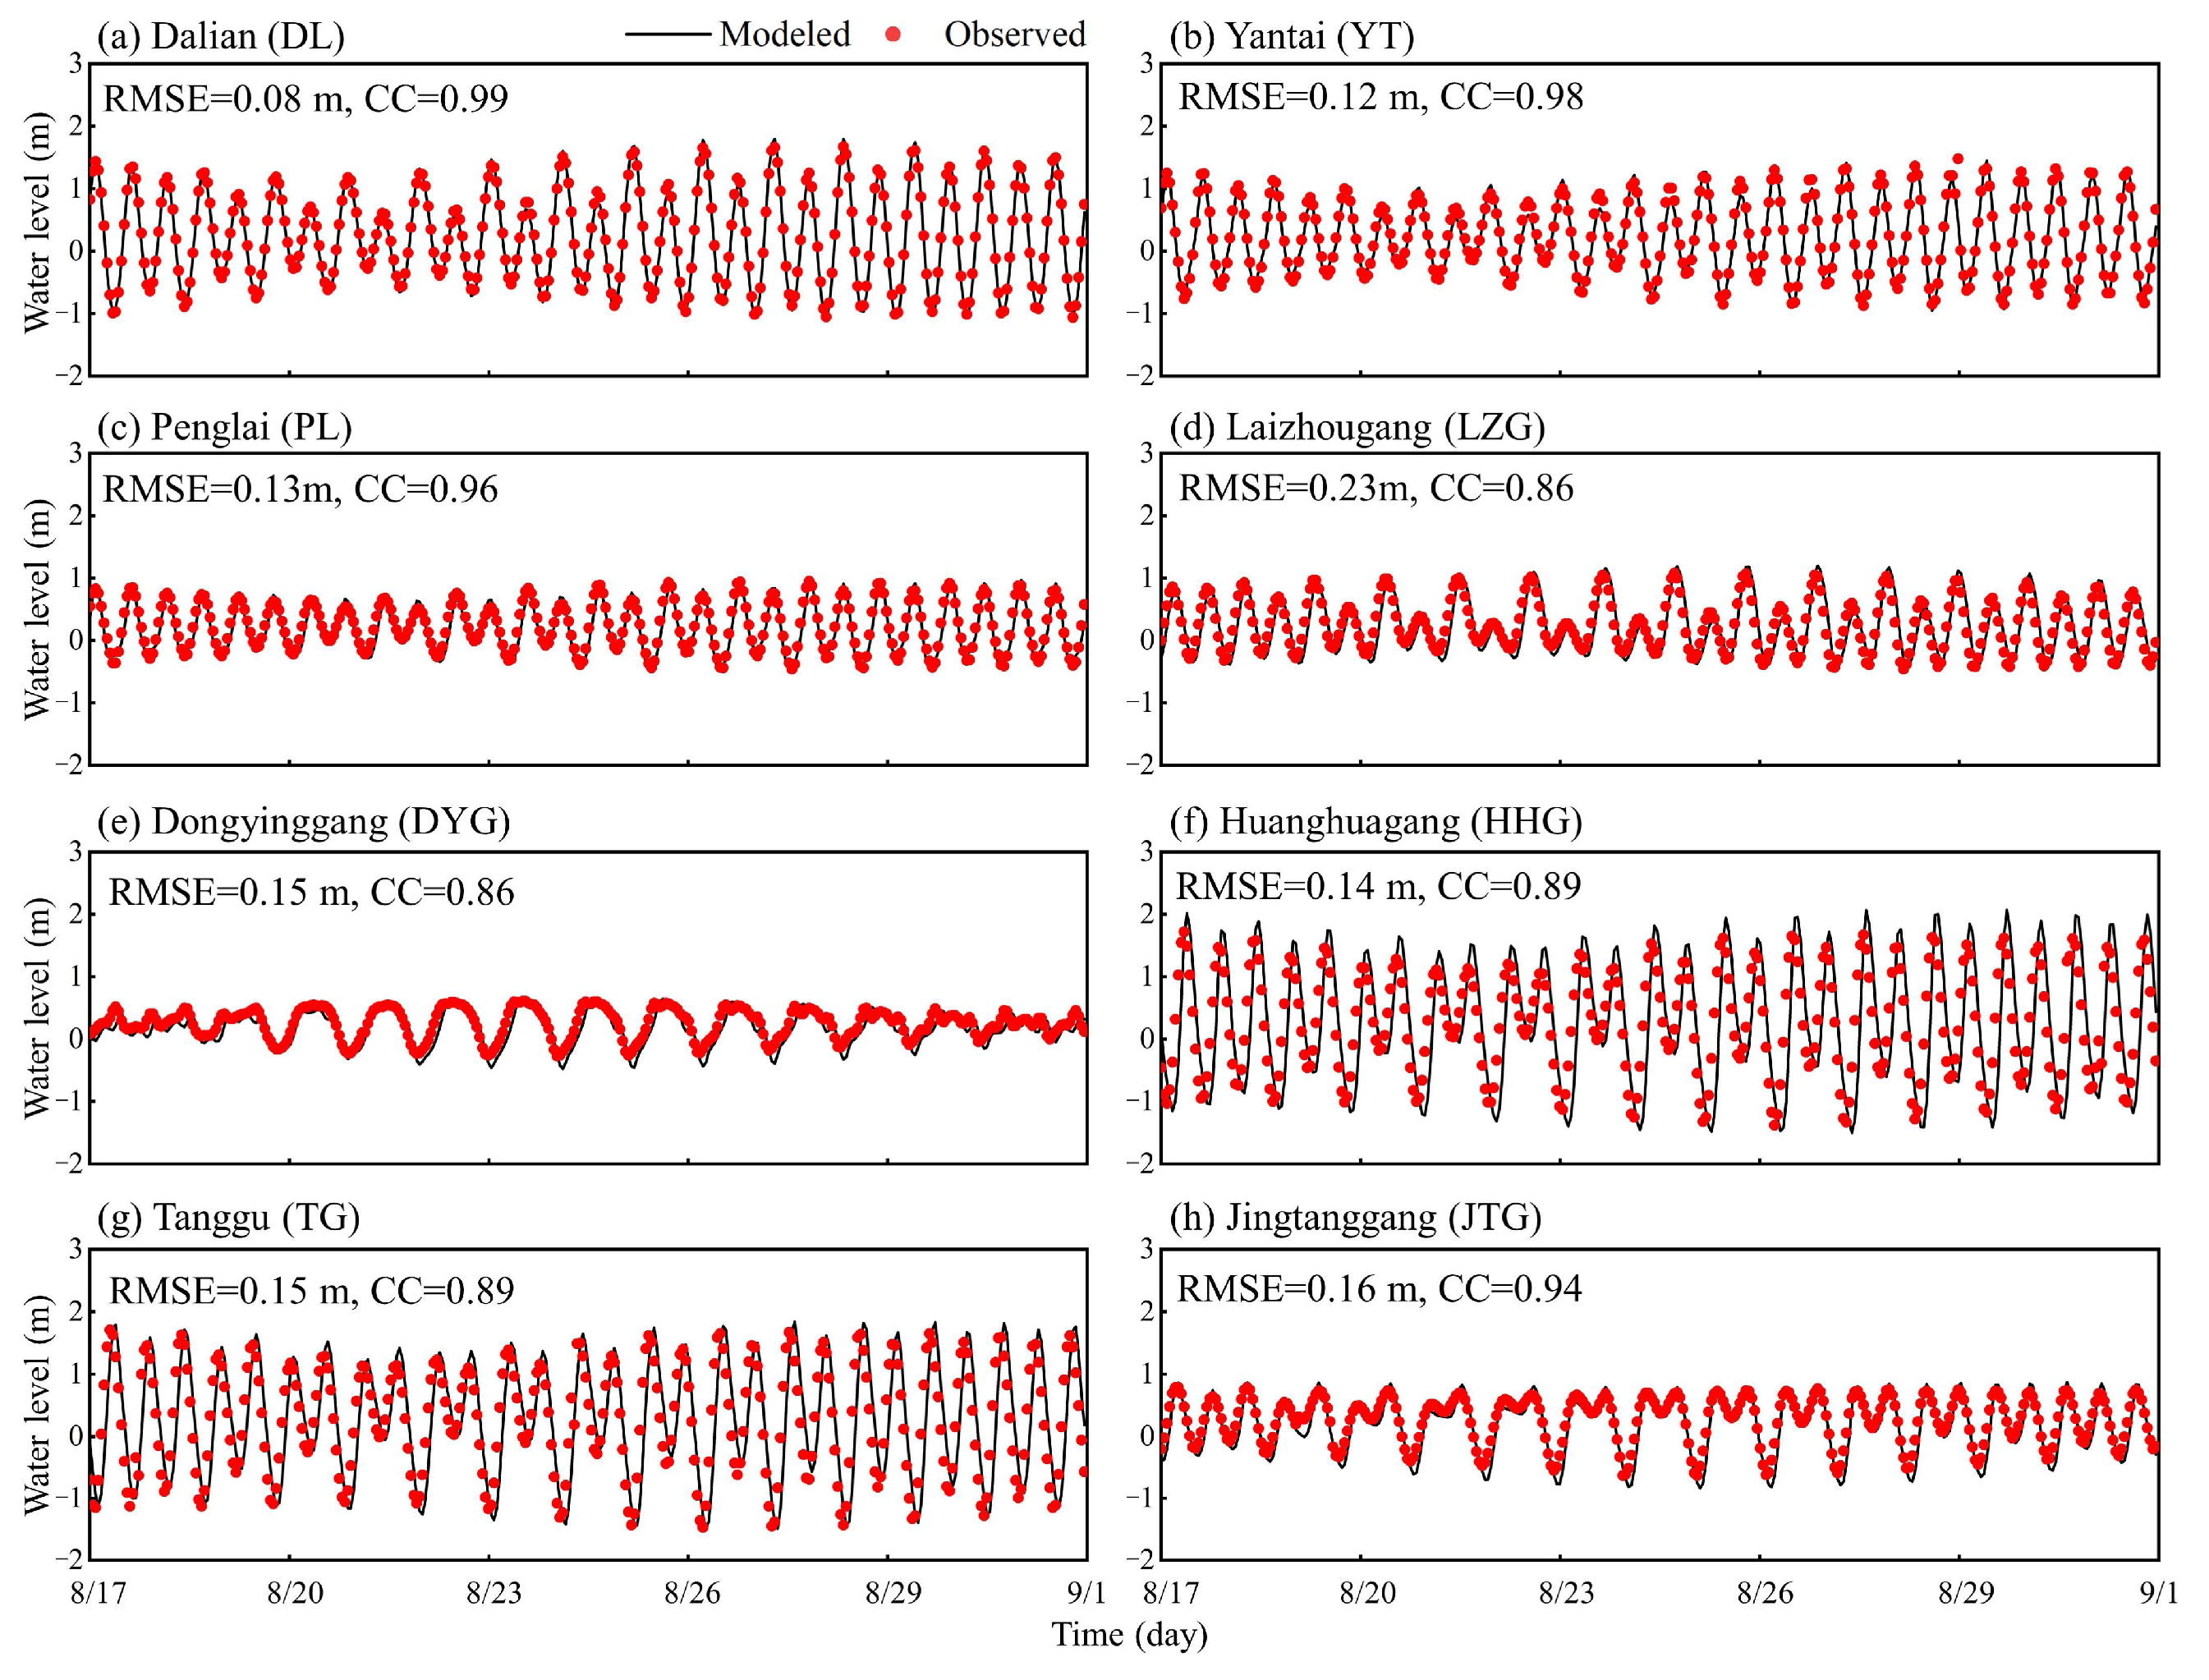
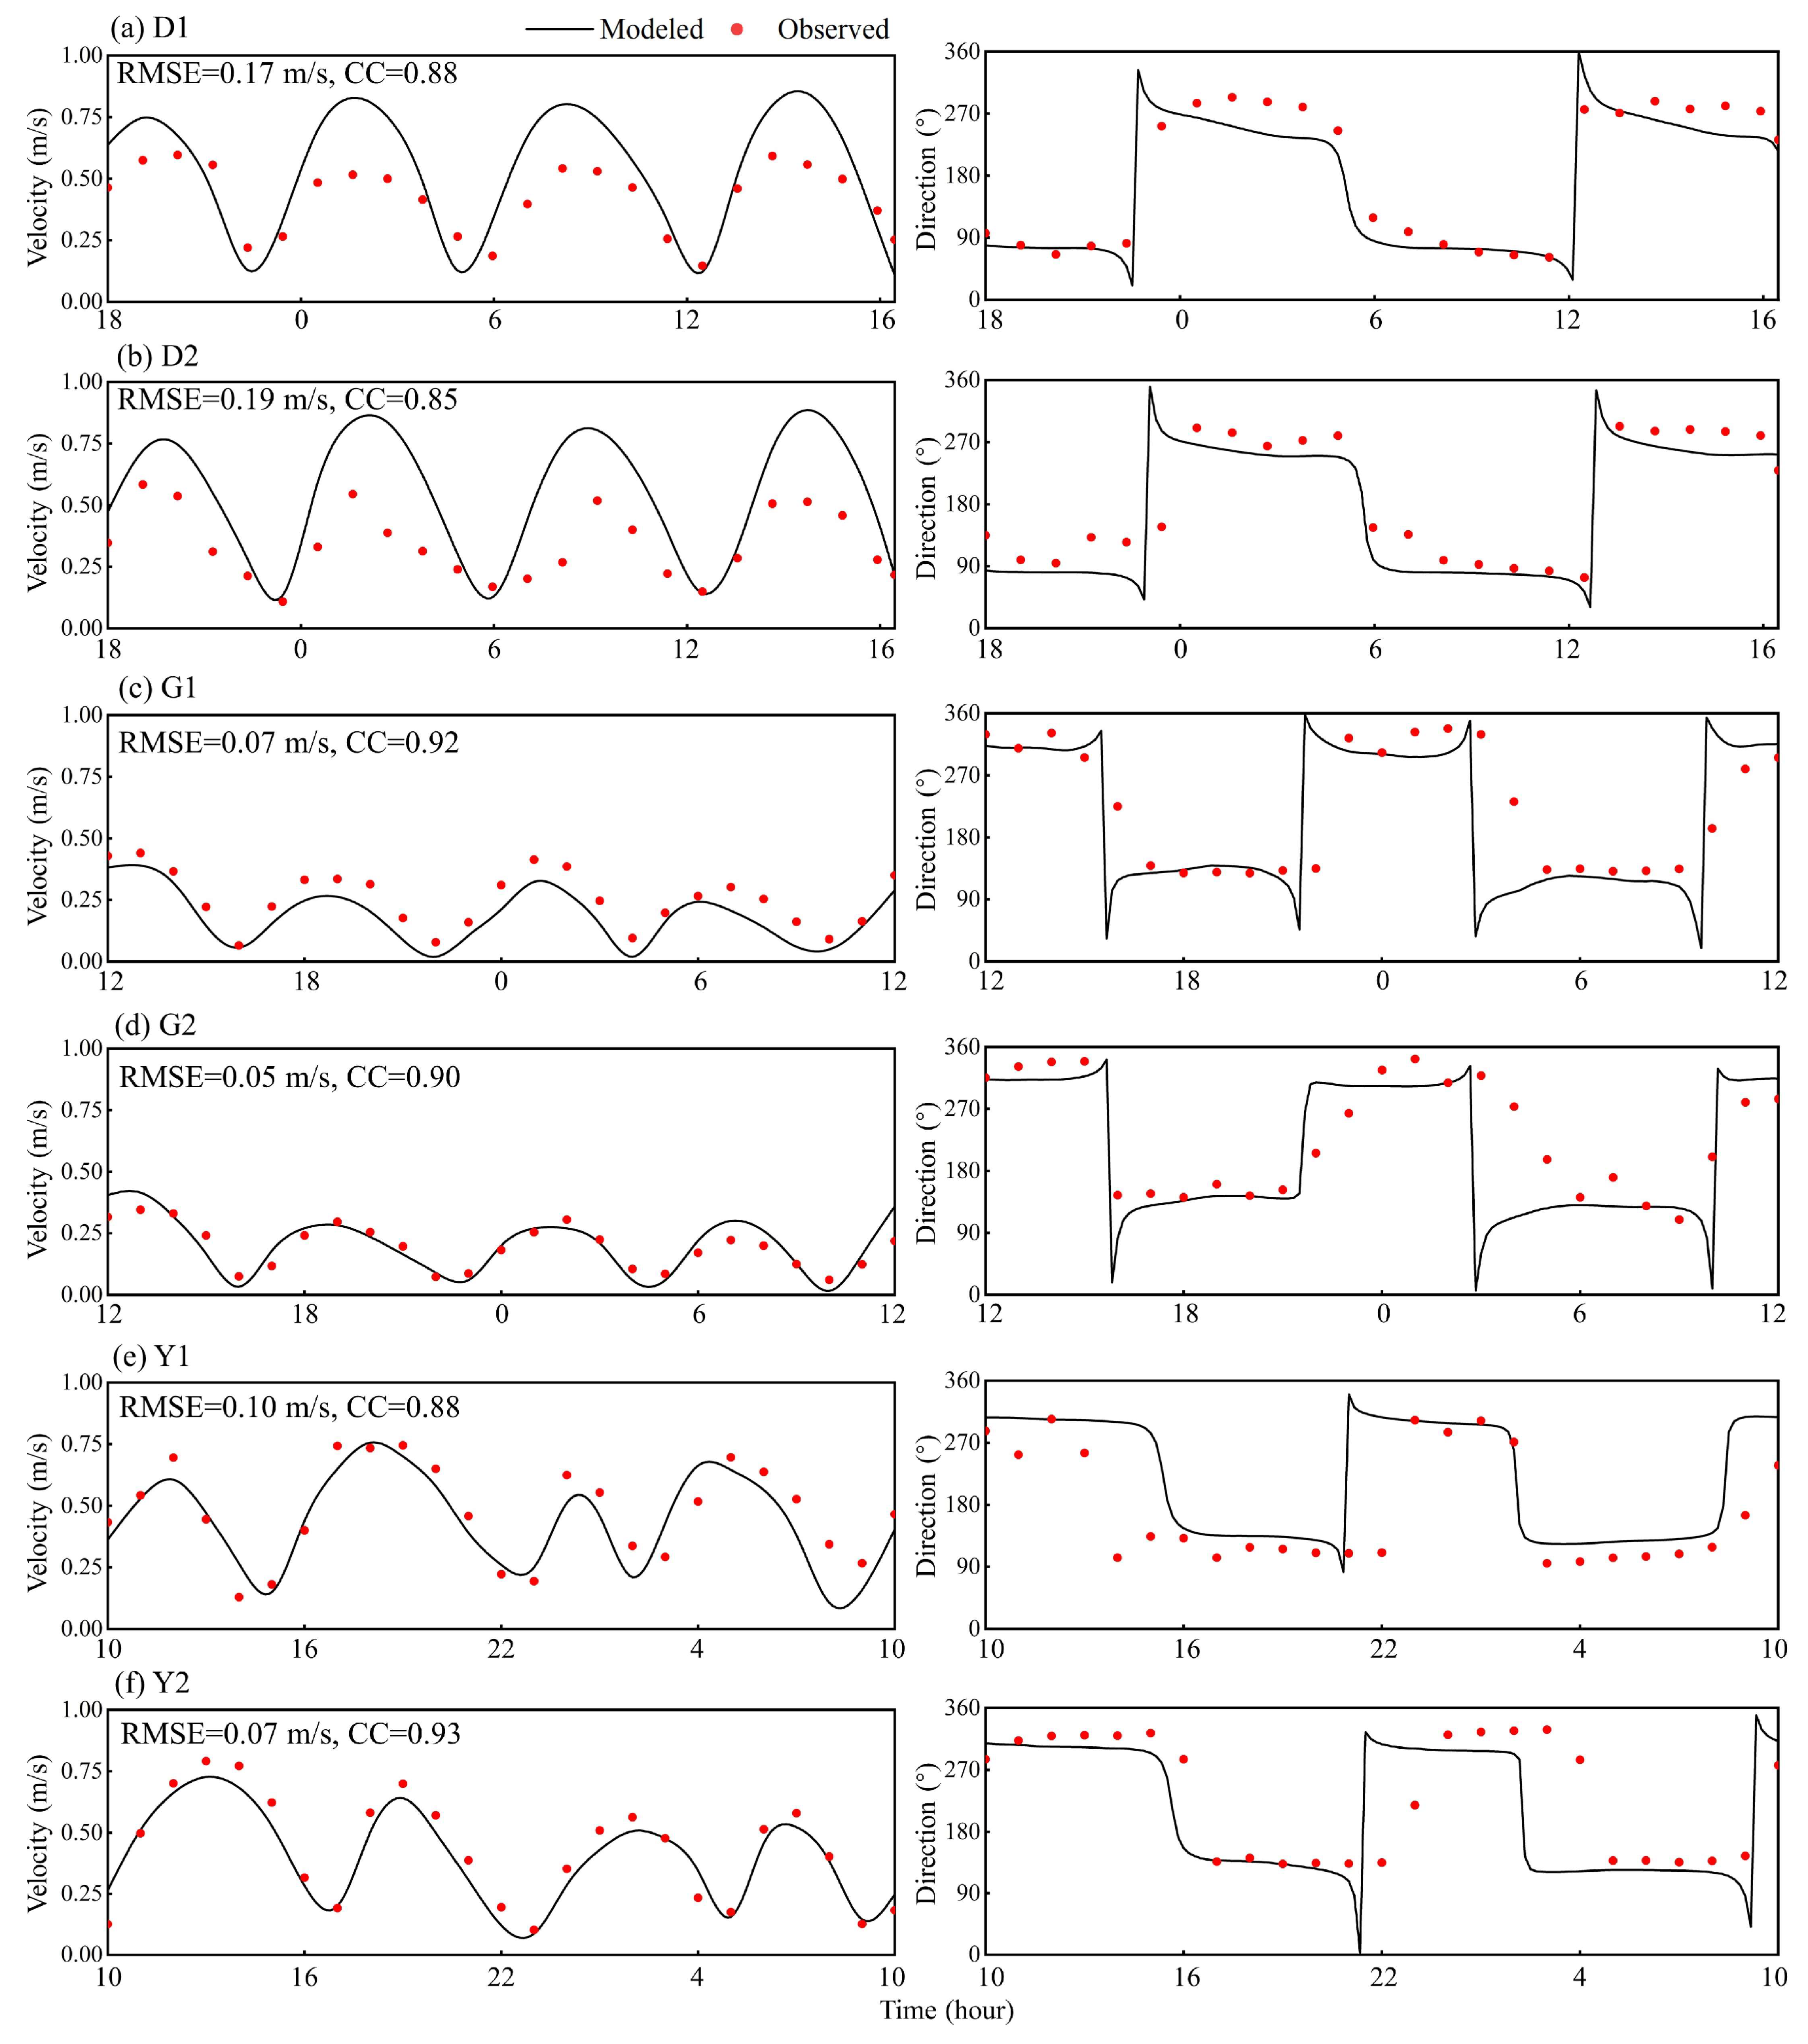
Figure 4 shows the RMSE values of water levels at 12 tidal gauge stations are 0.08–0.23 m, and CC values are higher than 0.85 from 17st to 31st August in 2018. The RMSE values show that flow velocities at six observation stations range from 0.08 to 0.25 m/s, with CC values all reaching 0.86, except for D2, shown in Figure 5. Overall, the model validation indicates that the model can successfully simulate the tide dynamics.
3.2.3. Simulated Hydrological Scenarios
In our study, we consider six different runoff scenarios consisting of Q500, Q1500, Q4000, and Q7500 m3/s, and daily river discharge in July 2018 and August 2020 (represent low, moderate, and high runoff during the flood season). In July 2018 and August 2020, the minimum river discharges were 1220 m3/s and 1950 m3/s, the maximum values were 3590 m3/s and 4230 m3/s, and the monthly average values were 2518 m3/s and 2860 m3/s, respectively. All modeled runoff scenarios were run for 45 days (from 17 July 2018 to 31 August 2018). The model results for the latter 30 days (covering two spring-neap tide cycles) were used for subsequent analysis to remove the initial influence in the former 15 days lead-in phase.
3.2.4. Hydrodynamic Parameter Settings
The hydrodynamic parameters (water level, flow velocity, and bed shear stress) were obtained by postprocessing with Delft3D-QUICKPLOT. At the cross-sections, the mean values of water level, flow velocity, and bed shear stress were estimated under modeled runoff scenarios. The mean and maximum bed shear stress were also calculated based on different hydrological scenarios. The delineation of the mean and maximum bed shear stress was achieved by Surfer 11.0 software. Furthermore, we also examined the hydrodynamic effects of high-energy riverine floods by contrasting high runoffs with low runoffs during the flood seasons. The subaqueous deltaic morphological evolution is also associated with flood events.
Tidal asymmetry has direct impacts on the residual sediment transport and morphological development of deltas. A detailed analysis method proposed by Friedrichs and Aubrey [52] was used to quantify the tidal asymmetry in our study.
3.2.5. Erosion-Accretion Calculation
To examine the subaqueous geomorphic variation of the YRD during the flood season, we employed bathymetric data in 2018 and 2020. Both underwater topography data were based on the Yellow Sea Datum. The digital elevation models (DEMs) were built in Surfer 11.0 software using the Kriging interpolation technique with a cell resolution of 100 m × 100 m. The subaqueous erosion-accretion patterns were determined by comparing DEMs from two years. The area and volume change of the erosion-accretion can be also obtained by the volume calculation tool.
4. Results
4.1. Hydrodynamic Results under Different Runoff Scenarios
4.1.1. Low Runoff Scenario
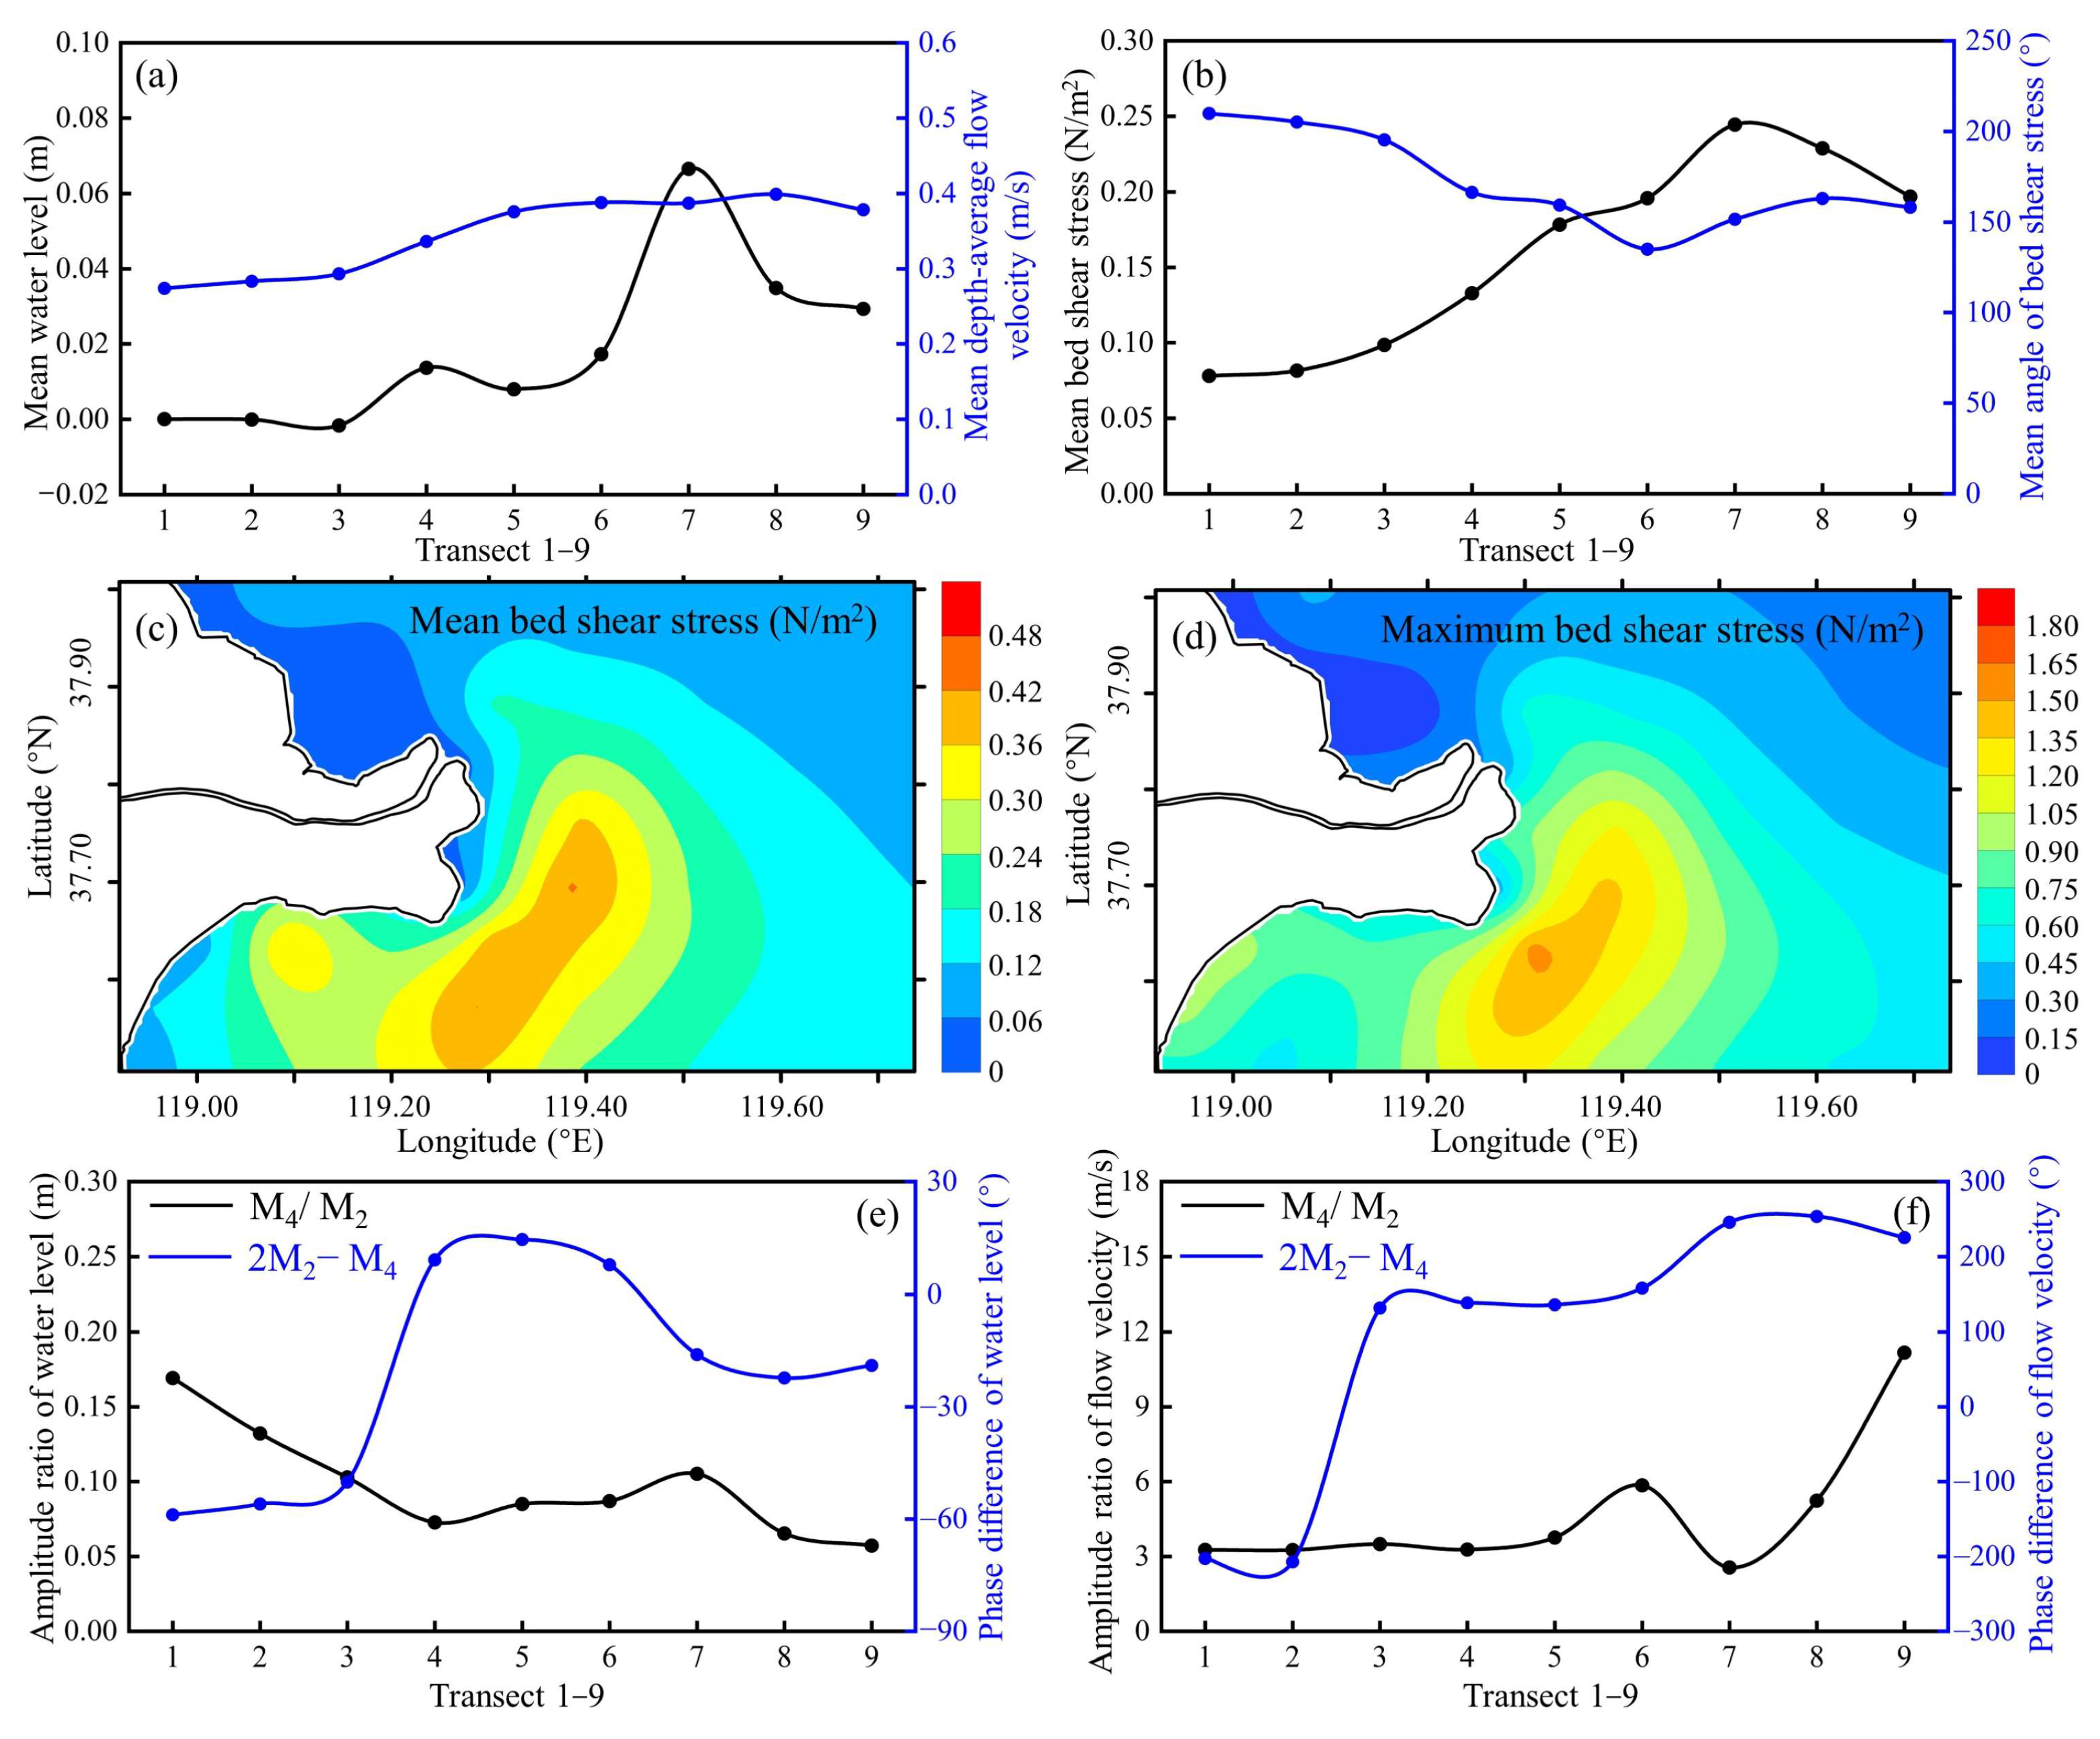
Under the low runoff scenario (Q500), the mean water level of each cross-section increases rapidly and presents two peaks: a peak of 0.014 m in the transect 4, and a value of 0.067 m in the transect 7 (Figure 6a). The depth-averaged flow velocity increases slowly and remains stable over the 9 cross-sections, with a mean depth-averaged velocity of 0.346 m/s (Figure 6a and Table 1). From transect 1 to 7, the average bed shear stress also rises significantly, from 0.078 N/m2 to a peak of 0.244 N/m2, before falling to 0.197 N/m2 (Figure 6b). Moreover, its angle revolves southward until the transect 6 and then moves slightly northward (Figure 6b).
The mean bed shear stress greater than the value of 0.24 N/m2 is mainly concentrated near the abandoned river mouth (Figure 6c). The overall region with bed shear stress larger than 0.24 N/m2 is 829.07 km2, which accounts for 26.00% of the entire study area (Table 2). The region (>0.12 N/m2) significantly protrudes to the northwest. Among them, the area of 0.36–0.42 N/m2 looks like a peanut shape (Figure 6c). The maximum bed shear stress (>0.90 N/m2) is also located in the abandoned river mouth and partly distributed along the west coast of Laizhou Bay, covering a total region of 701.87 km2 (Figure 6d). The lowest values of mean bed shear stress and maximum bed shear stress have occurred in the Gudong littoral zone. The mean bed shear stress frequency distribution shows a peak between 0.06 N/m2 and 0.18 N/m2 (Figure S3a), whereas the maximum bed shear stress frequency distribution presents a crest value at 0.30–0.90 N/m2 (Figure S3b).
According to the tide harmonic analysis of the Q500 runoff, the M2 component of the water level propagates southward and grows linearly by 0.42 m before the transect 8, and then slightly increases by 0.04 m on the transect 9 (Figure S4a). Correspondingly, the M4 amplitude progressively decreases before the transect 4, then rapidly increases by 0.03 m until the transect 7, and then slowly declines again (Figure S4b). As a result, the amplitude ratio of the water level gradually grows near the abandoned delta lobe (Figure 6e). Moreover, the phases of the two tidal harmonic constituents of water levels also rise rapidly after transect four (Figure S4c,d). Its difference ranges between −90° and 90°, indicating a flood-dominant tidal asymmetry (Figure 6e). The flow velocity amplitudes of two tidal harmonic constituents grow in the transect 5, and then show the opposite changes (Figure S5a,b). The amplitude ratio increases steadily until the transect 6, and then changes sharply (Figure 6f).
4.1.2. Moderate Runoff Scenario
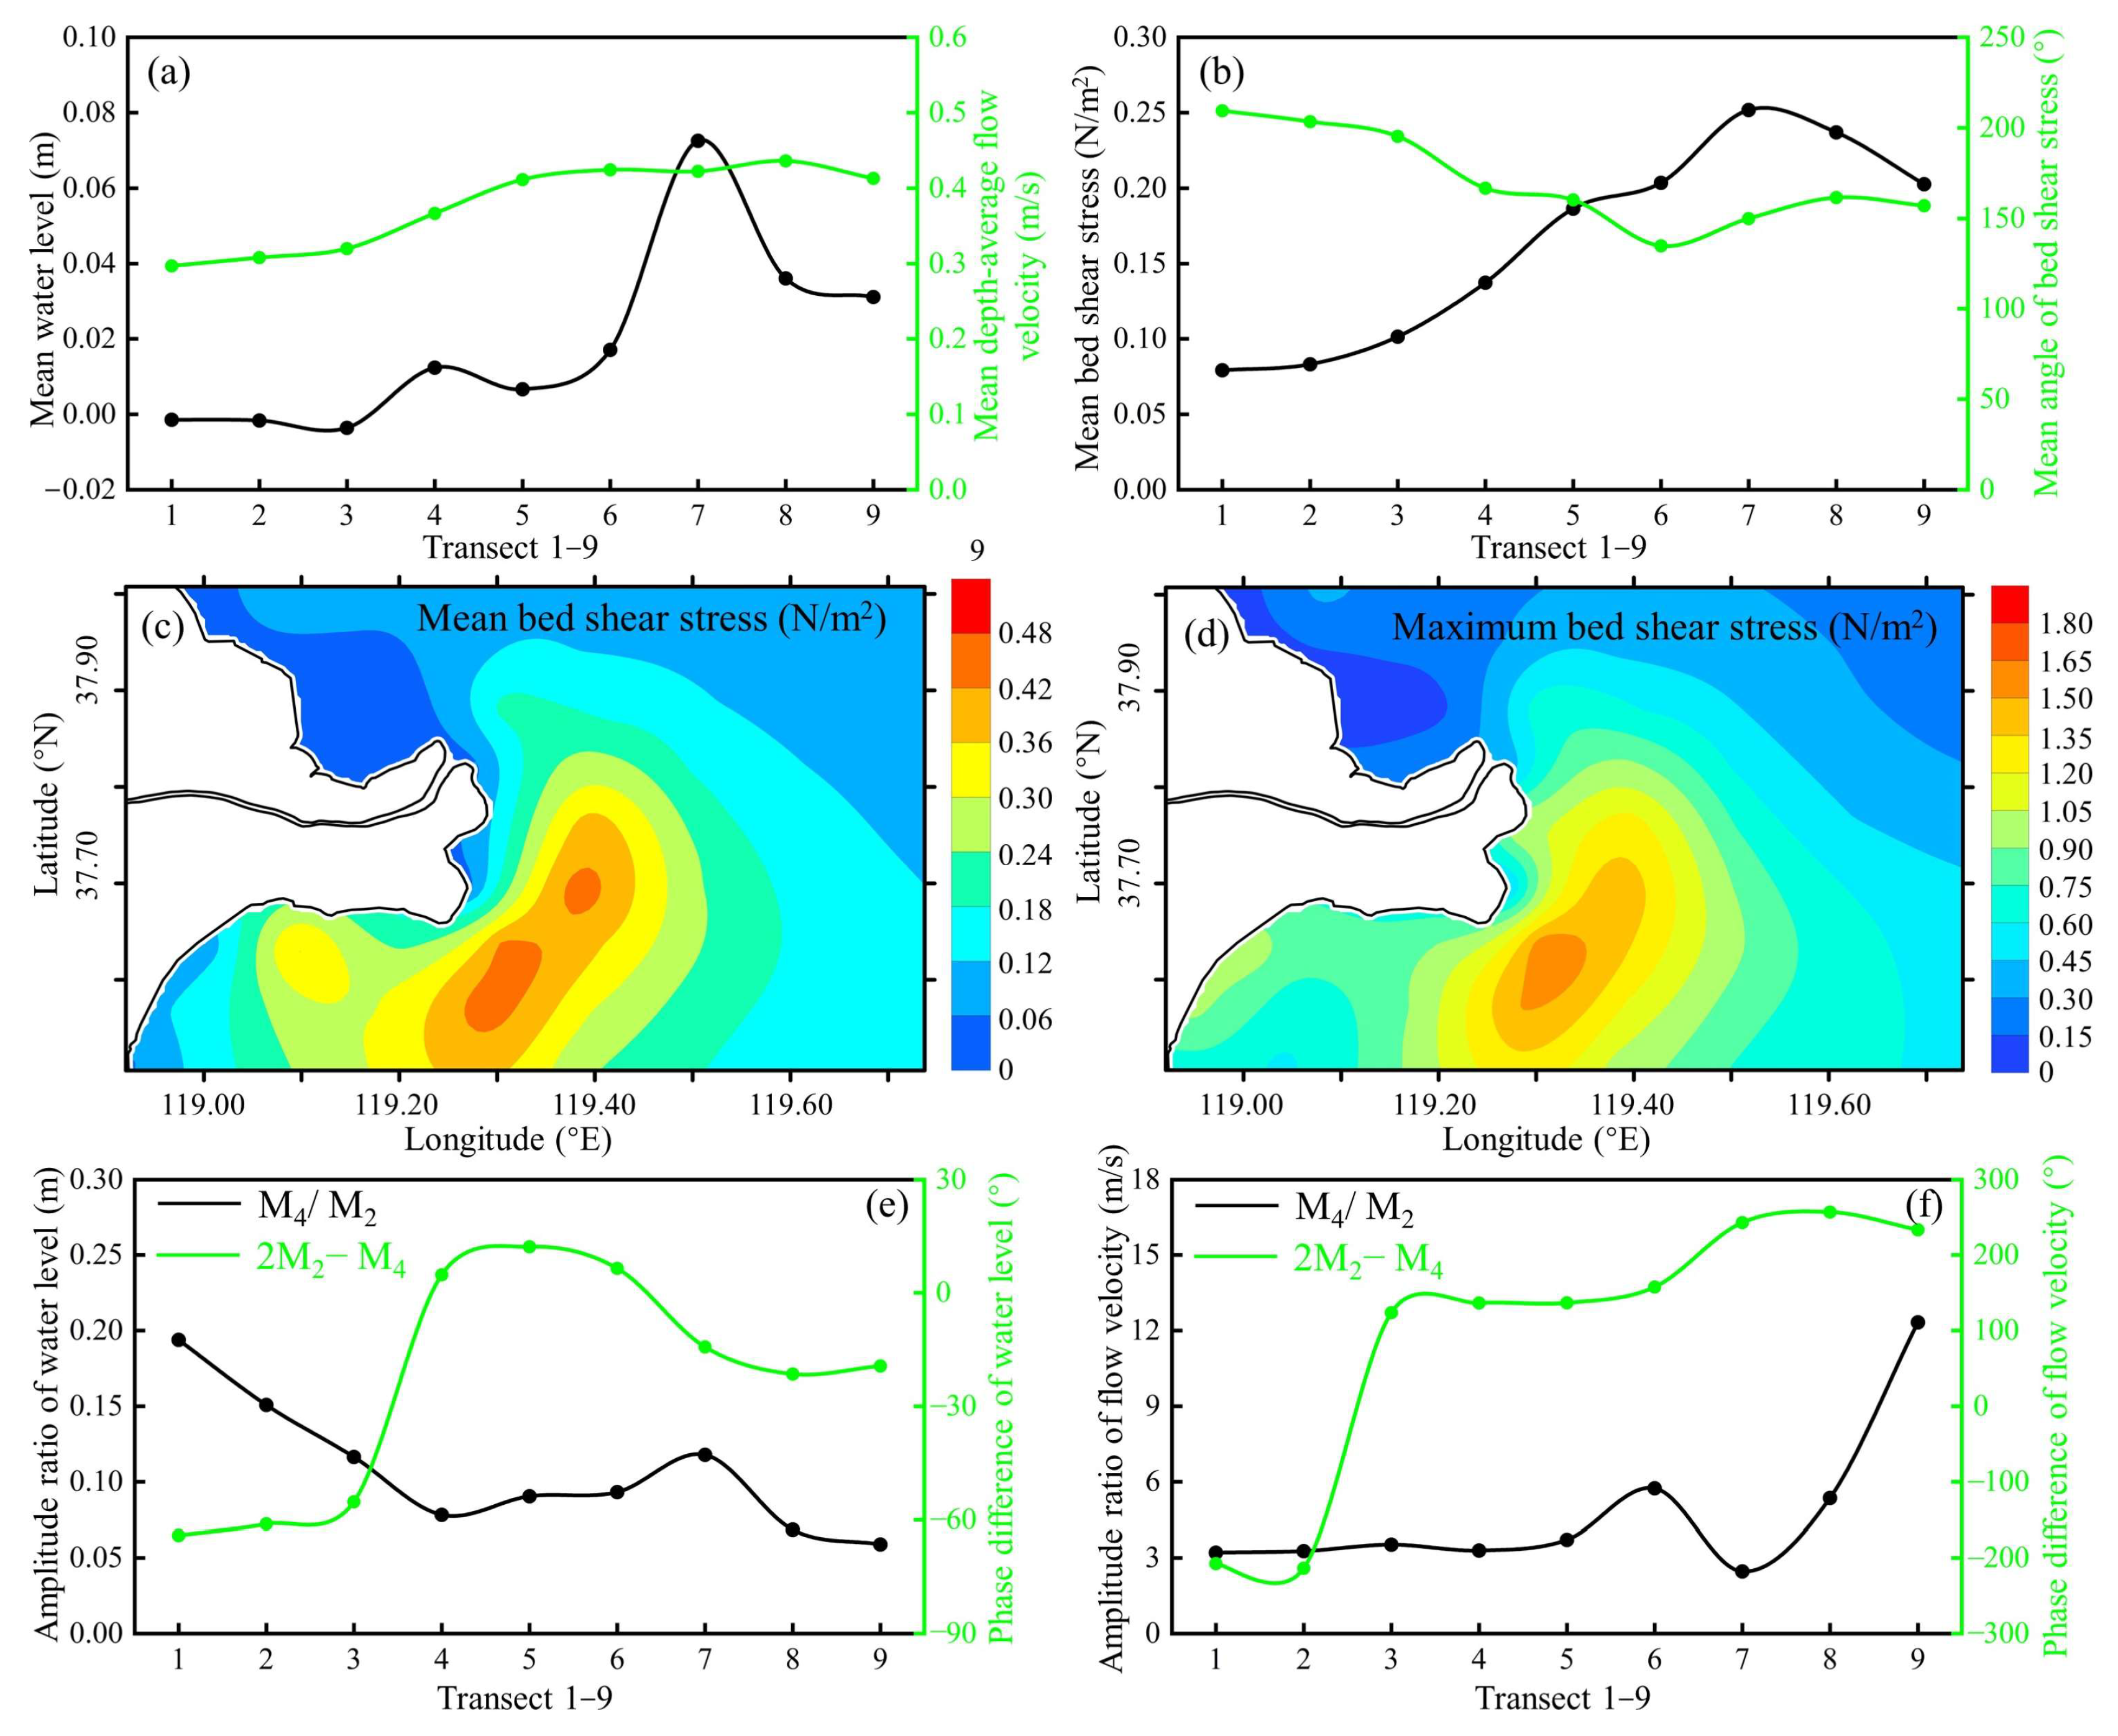
In the Q1500 runoff scenario, the hydrodynamic variations along the transects 1 to 9 indicate a similar trend to the Q500 scenario (Figure 7). Specifically, the higher runoff causes higher water levels (a mean value of 0.020 m), with the greatest rise in the transect 7 (Figure 7a and Table 1). The increased runoff also causes faster flow velocity, and the total depth-average velocity rises to 0.378 m/s (Figure 7a). The average value of mean bed shear stress is 3.10% higher than the Q500 scenario, with a lower angle that is moving southward (Figure 7b and Table 1).
Under the Q1500 scenario, the region over 0.24 N/m2 expands to 876.84 km2 (27.48% to the total YRD), generally to the northwest (Table 2; Figure 7c), and the region greater than 0.36 N/m2 grows considerably (Figure 7c and Figure S3a). In addition, two high-stress centers with an area greater than 0.42 N/m2 appeared simultaneously (Figure 7c and Figure S3a). For the maximum bed shear stress, the areas with higher values also shifted northwestward (Figure 7d). Compared with the low runoff (the Q500 scenario), the region greater than 0.90 N/m2 expands from 701.87 km2 to 782.27 km2 (Table 2; Figure 7d). There is still a region with the lowest maximum shear stress in the Gudong littoral zone (Figure 7d and Figure S3b).
Harmonic analysis indicates that when runoff input rises, the M2 and M4 constituents of the water level increases at all cross sections. However, the magnitude of the M4 constituent has a rapid growth after the transect 4 and reaches a maximum on the transect 7 (Figure S4a,b). Thus, the tidal asymmetry is increased at the abandoned river mouth, which is associated with enhanced tidal energy transmission. However, the tidal asymmetry decreases rapidly near the Gudong littoral zone (Figure 7e). The phase difference of two tidal harmonic constituents of the water levels grows as runoff increases near the active YRD and the Gudong littoral zone; however, it decreases in the abandoned delta lobe (Figure 7e). In terms of the calculated velocity, both amplitude ratio and phase difference change significantly, with the highest values near the abandoned river mouth (Figure 7f).
4.1.3. High Runoff Scenario
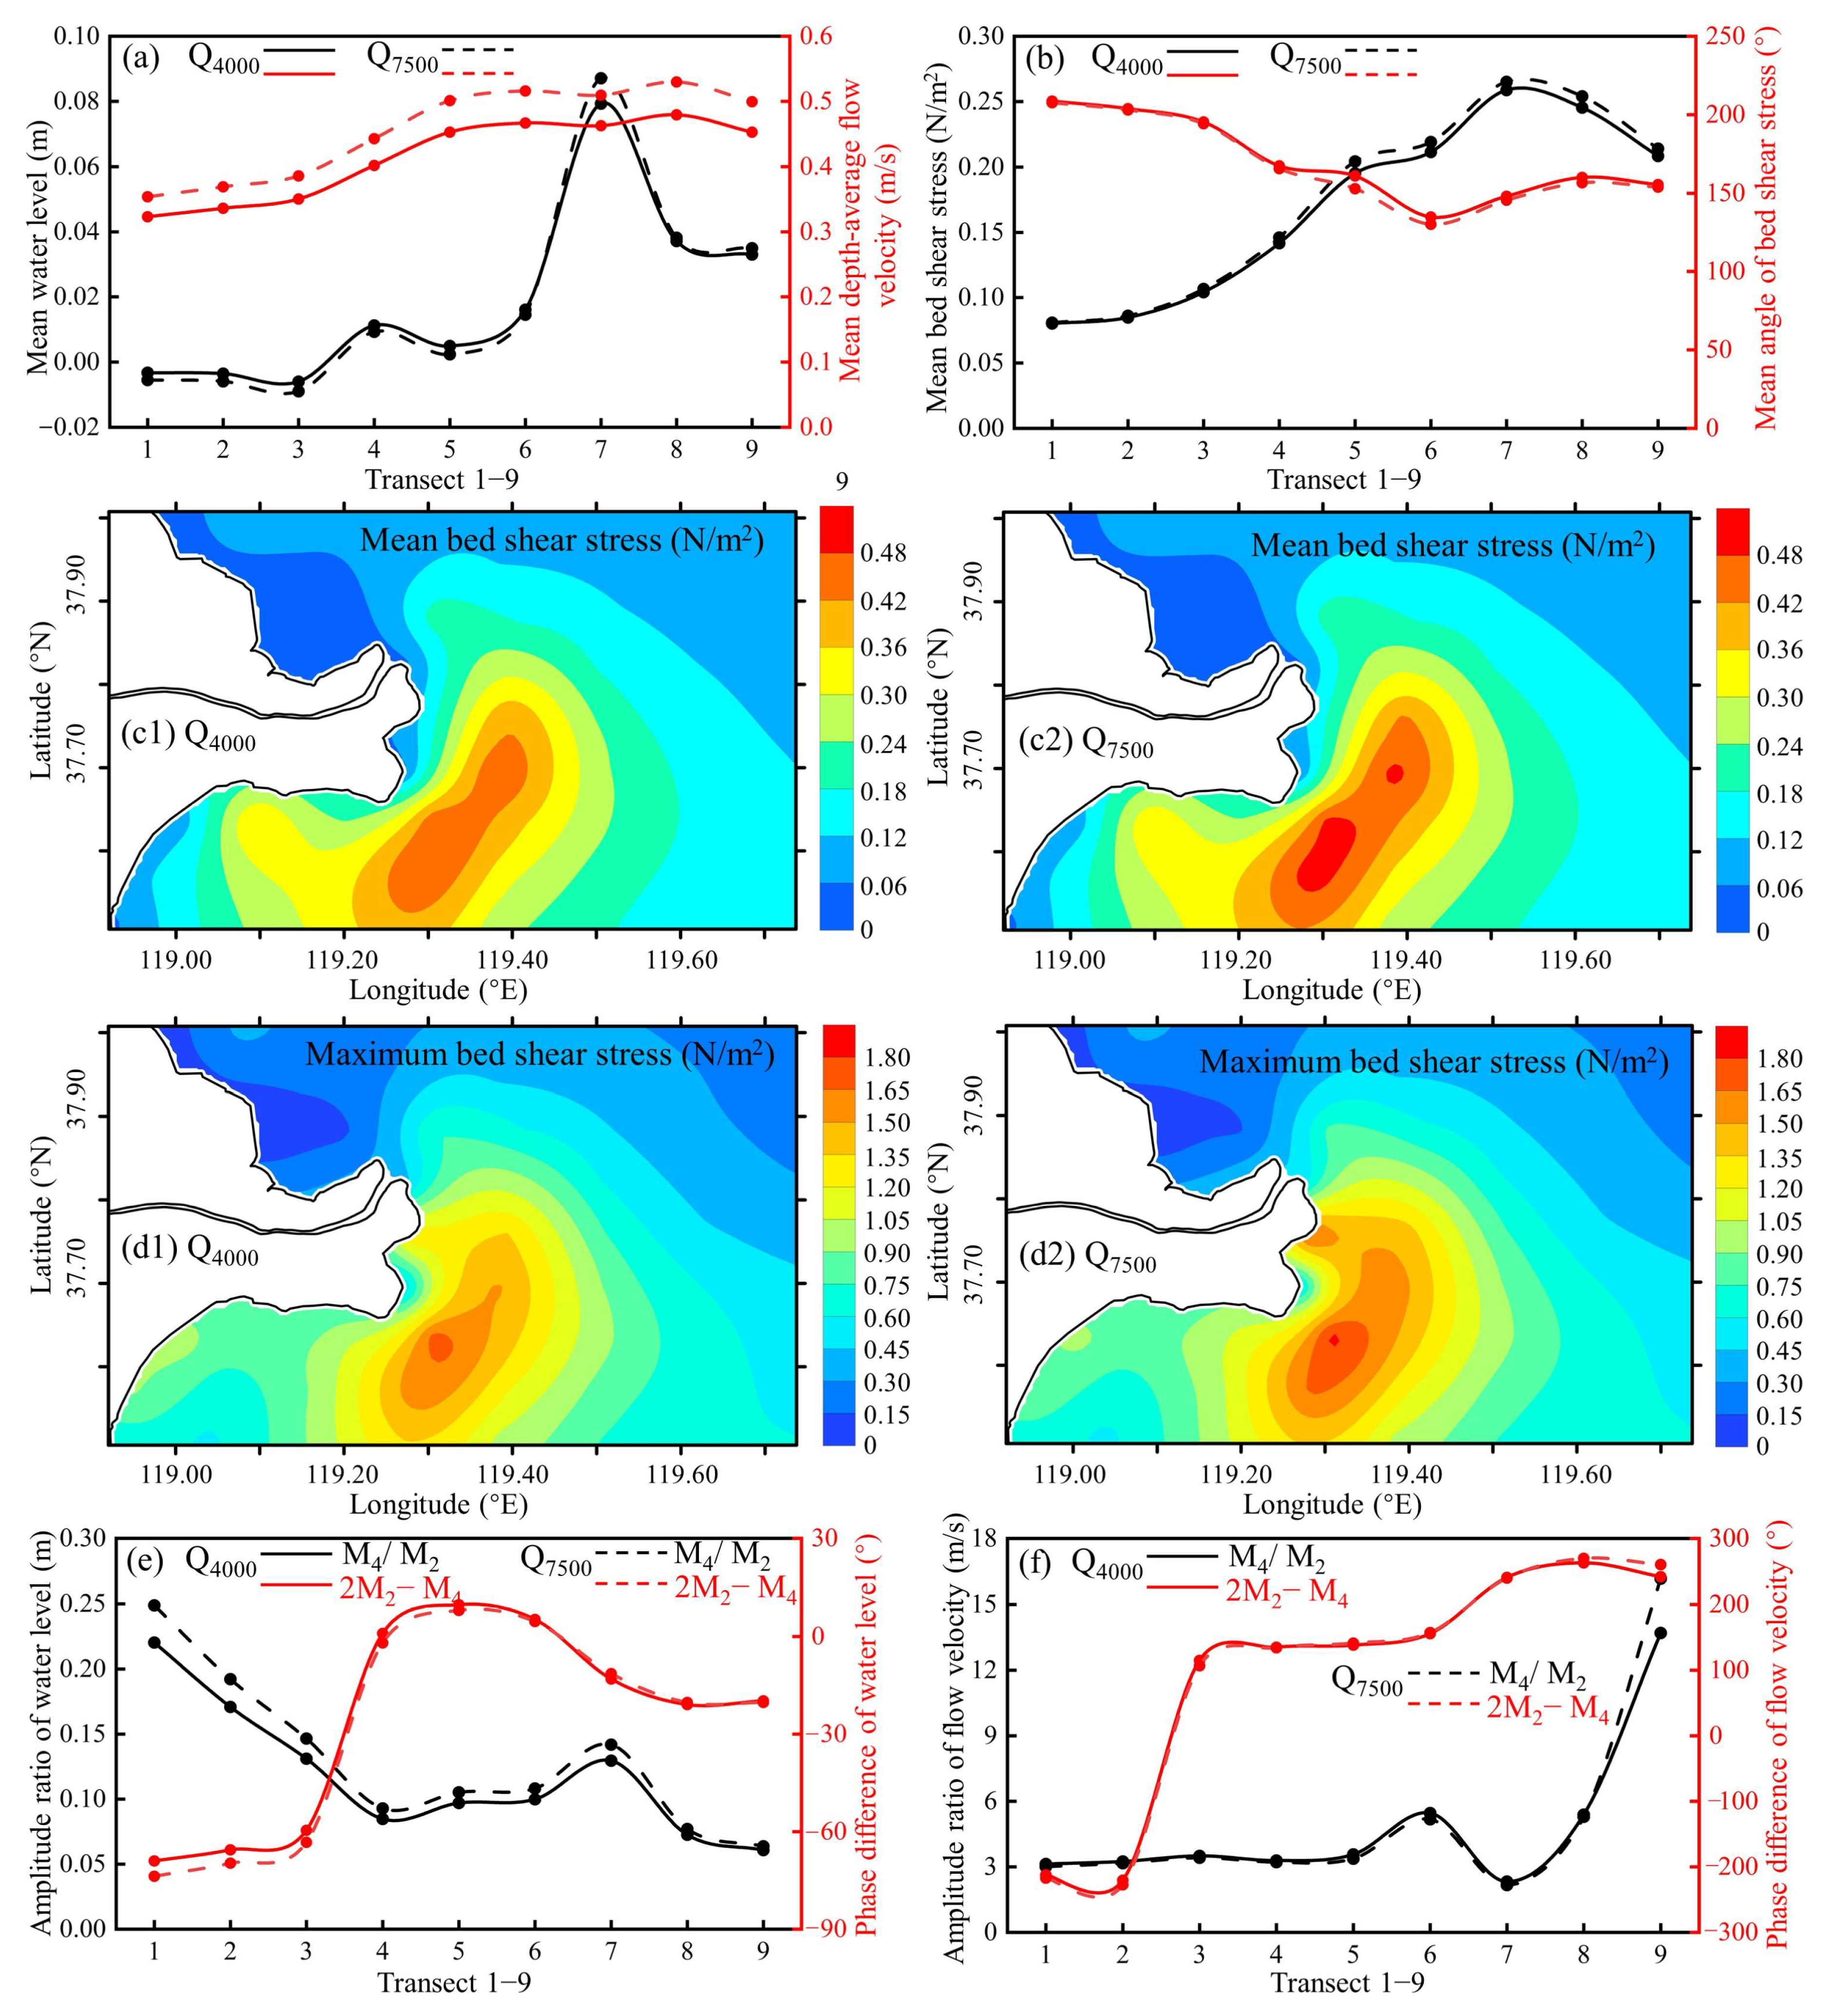
Under the Q4000 and Q7500 runoffs, the mean water level on the 9 cross-sections rises dramatically, and the greatest increase is in the vicinity of the abandoned river mouth (Figure 8a). From the Q500 runoff to Q7500 runoff, the total average value of mean water level rises by 0.002 m (0.021–0.023 m) (Figure 8a and Table 1). Correspondingly, the mean velocity under the Q7500 scenario is 0.456 m/s, which is 31.79% higher than that of the Q500 scenario (Figure 8a and Table 1). Moreover, increased river flow also induces greater bed shear stress, which increased by 113.41% in the entire YRD (Figure 8b and Table 1). The mean angle also decreases slightly across all cross-sections (Figure 8b).
Significantly, the area of the mean bed shear stress (over 0.24 N/m2) grows to 920.41 km2 under the Q4000 scenario, and to 957.10 km2 under the Q7500 scenario (Figure 8c1,c2). The high-stress center continues to develop in the vicinity of the abandoned river mouth; however, the enhancement is limited in the Gudong littoral zone and the active YRD (Figure 8c1,c2). Comparing both the Q500 scenario and Q7500 scenario, the region greater than 0.30 N/m2 grows by 40.84% (Figure 8c1,c2; Table 2). Moreover, the maximum bed shear stress is also substantially increased, and the region greater than 0.90 N/m2 enhances from 847.03 km2 (Q4000 scenario) to 913.07 km2 (Q7500 scenario) (Figure 8d1,d2). In the Q7500 scenario, the areas of high bed shear stress continue to expand northwestward (Figure 8d2).
The amplitude of the tidal harmonic constituents of water levels increases over the 9 cross sections during extreme riverine floods (Figure S4a,b). The magnitude of the M4 constituent displays a similar fluctuating trend to the Q1500 runoff scenario. Moreover, the harmonic analysis shows that the tidal asymmetry grows dramatically in the vicinity of the abandoned river mouth; however, it is weaker in the Gudong littoral zone (Figure 8e). The phase difference in water levels is larger in the Gudong littoral zone and the active river mouth, and smaller near the abandoned delta lobe (Figure 8e). The magnitudes of the M2 and M4 components of the velocity are lower in the Gudong littoral zone (Figure S5a,b). Therefore, the amplitude ratio and phase difference of flow velocity both weaken (Figure 8f). Overall, high riverine floods result in greater hydrodynamics in the abandoned river mouth.
4.2. Bathymetric Changes Induced by High Riverine Flows in the Flood Seasons
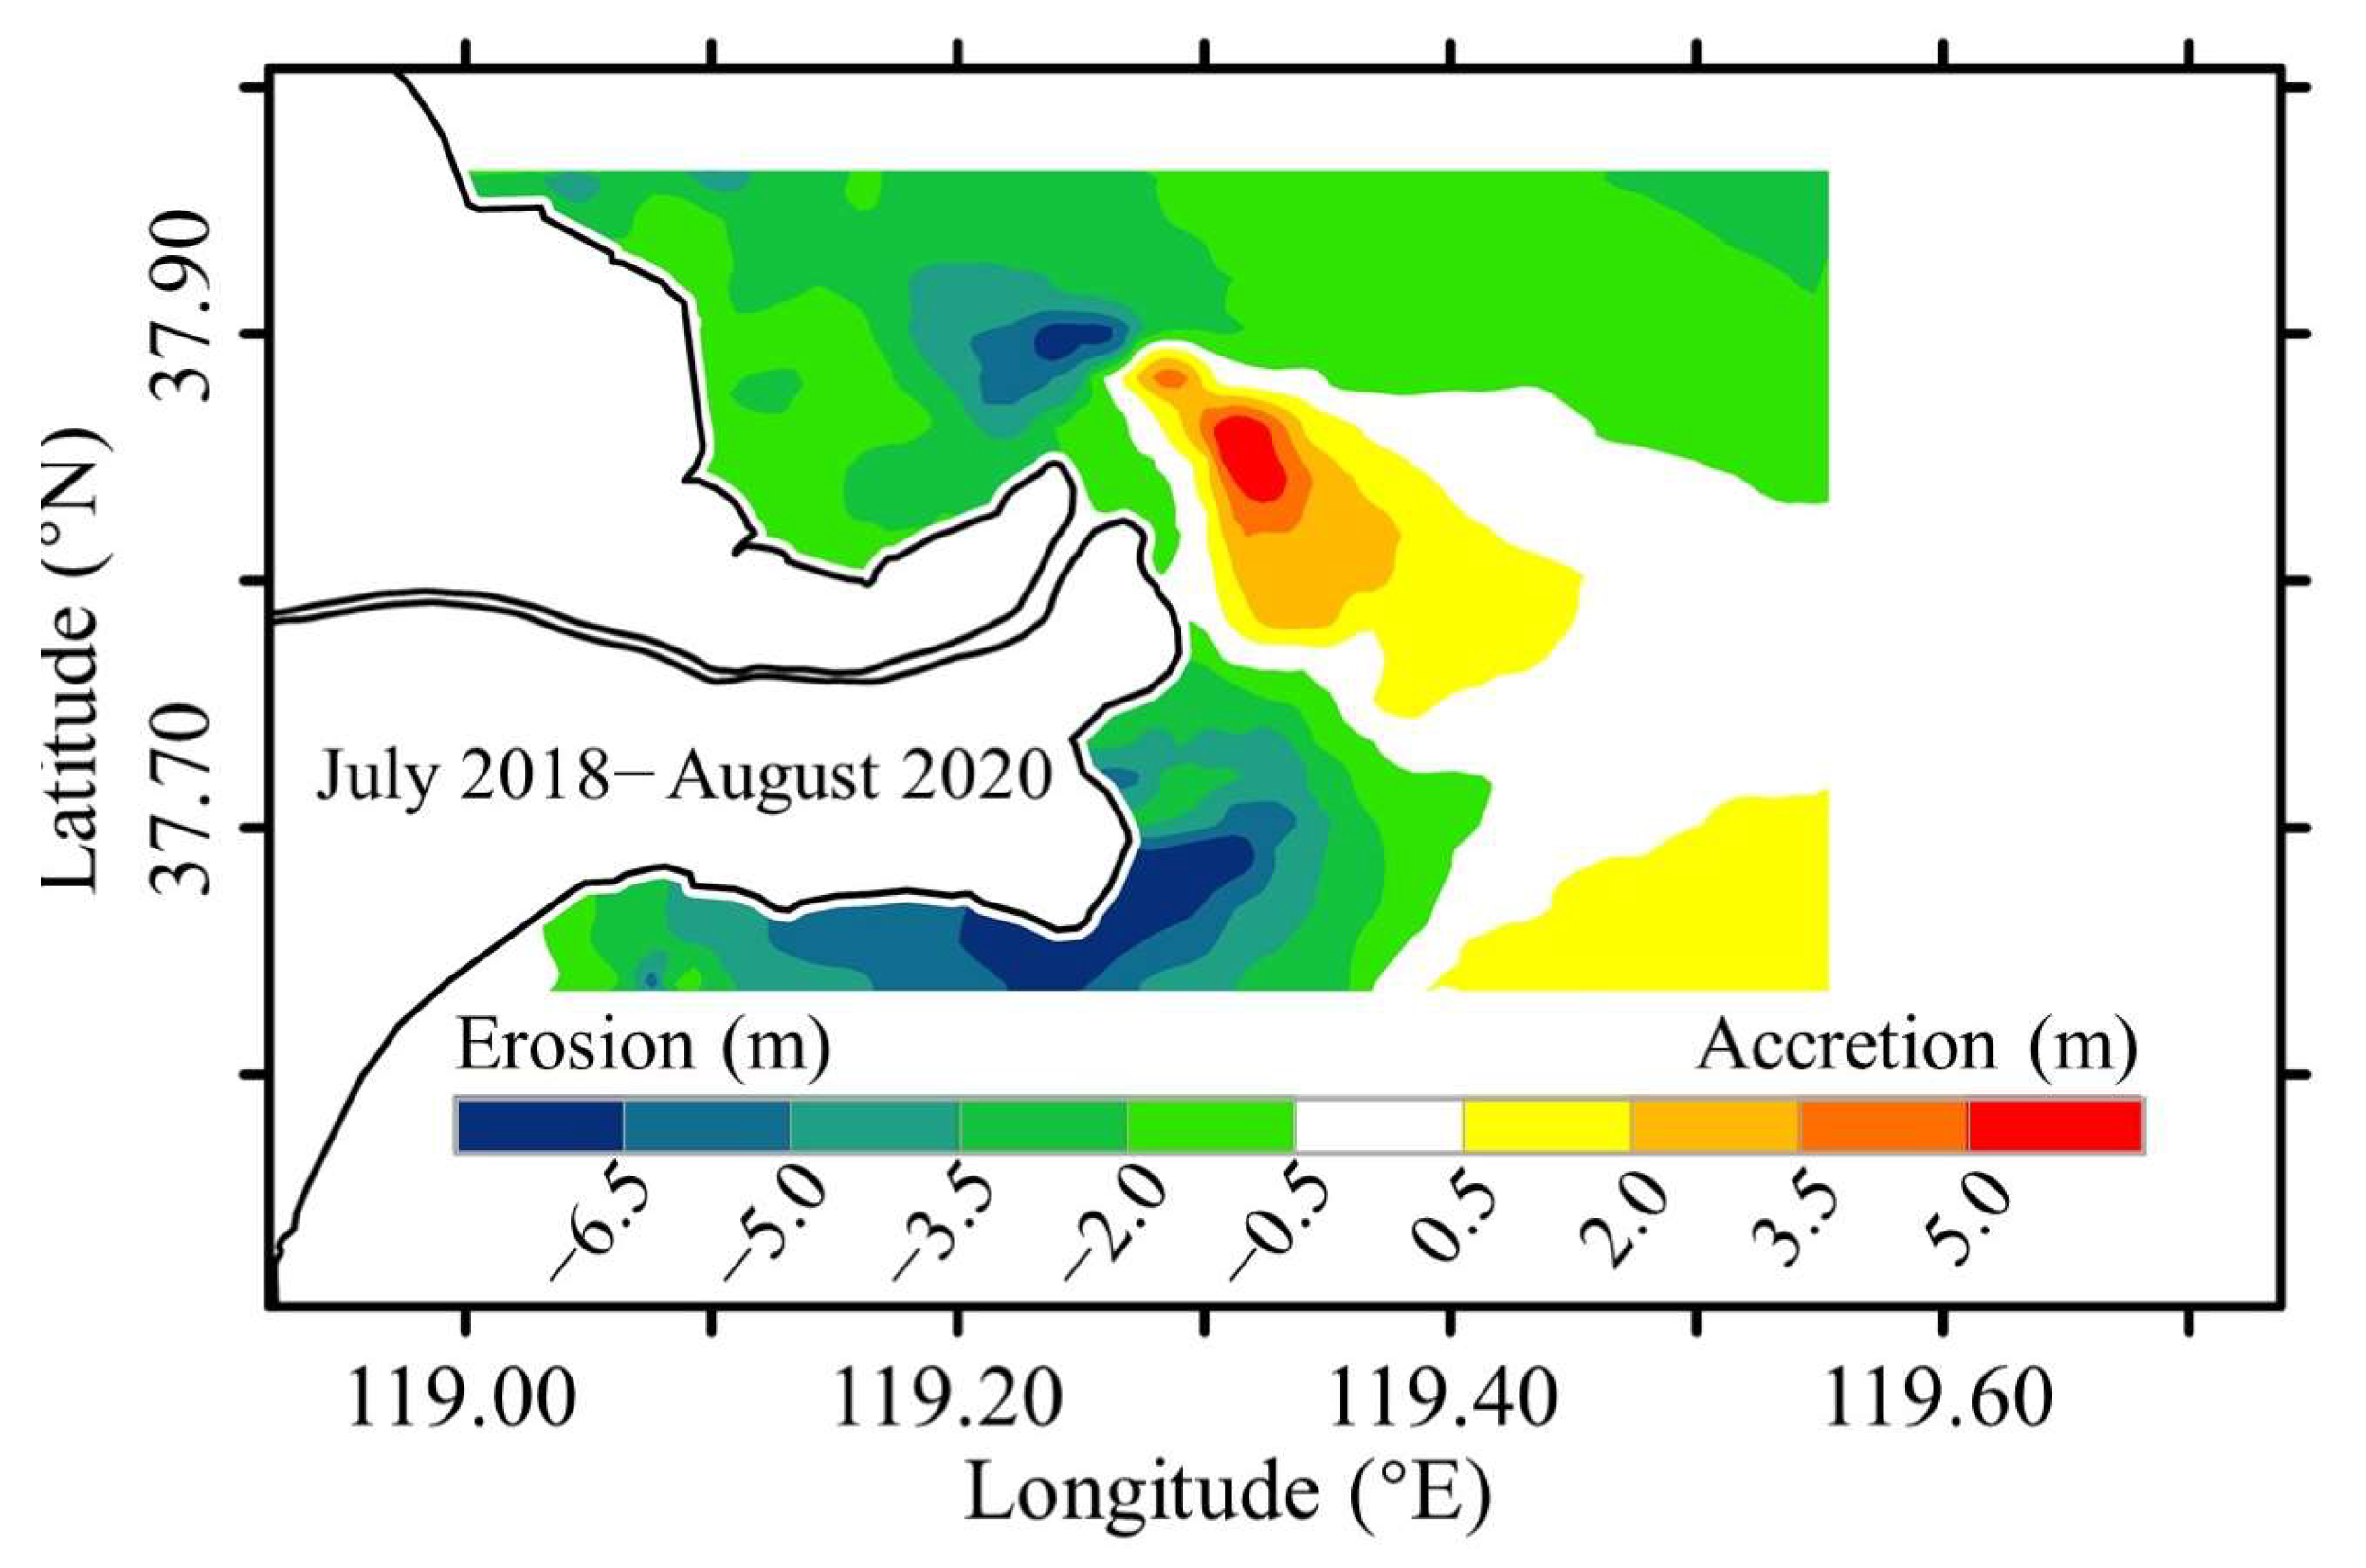
Figure 9 shows the erosion and accretion rates of the YRD during the 2018 and 2020 extreme floods. During the flood season, net erosion occurred in the subaqueous delta at a volume change rate of −0.07 × 10⁸ m3/year (Table 3). The abandoned river mouth was subjected to severe scouring, resulting in a maximum erosion thickness reaching 8 m (Figure 9). Comparatively, the Gudong littoral zone experienced only weak erosion. Furthermore, a depo-center was found near the active river mouth, with an average deposition rate of 1.71 m/year (Figure 9). The eroded area accounted for 71.25% of the total area, and the net erosion volume was up to −0.20 × 10⁸ m3 (Figure 9 and Table 3). Approximately 0.04 × 10⁸ t/year of fluvial sediment was deposited in the submerged delta under extreme floods. Therefore, during the flood season in 2020, the high flow caused significant erosion in the Yellow River subaqueous delta, especially in the vicinity of the abandoned river mouth.
5. Discussion
5.1. Effects of River Discharge on Hydrodynamics
The complex interaction between river input and coastal tides controls deltaic hydrodynamics and sediment transport processes, particularly during high riverine flow conditions [6,7,36]. Our results indicated that high runoff during the flood season can trigger significant changes in fluvial-tidal hydrodynamics, especially in the abandoned delta lobe. In the Q7500 scenario, high runoff induces a higher mean water level near the abandoned river mouth, whereas tidal forcing is relatively restricted near the Gudong littoral zone (Figure 6a, Figure 7a and Figure 8a). High flow velocities and bed shear stresses occur at the abandoned river mouth, although their magnitude is smaller within the Gudong littoral zone and near the active delta lobe (Figure 6a–d, Figure 7a–d and Figure 8a–d). High runoff input can also cause strong tidal asymmetry of water levels, and slightly weak velocity asymmetry (Figure 8e,f).
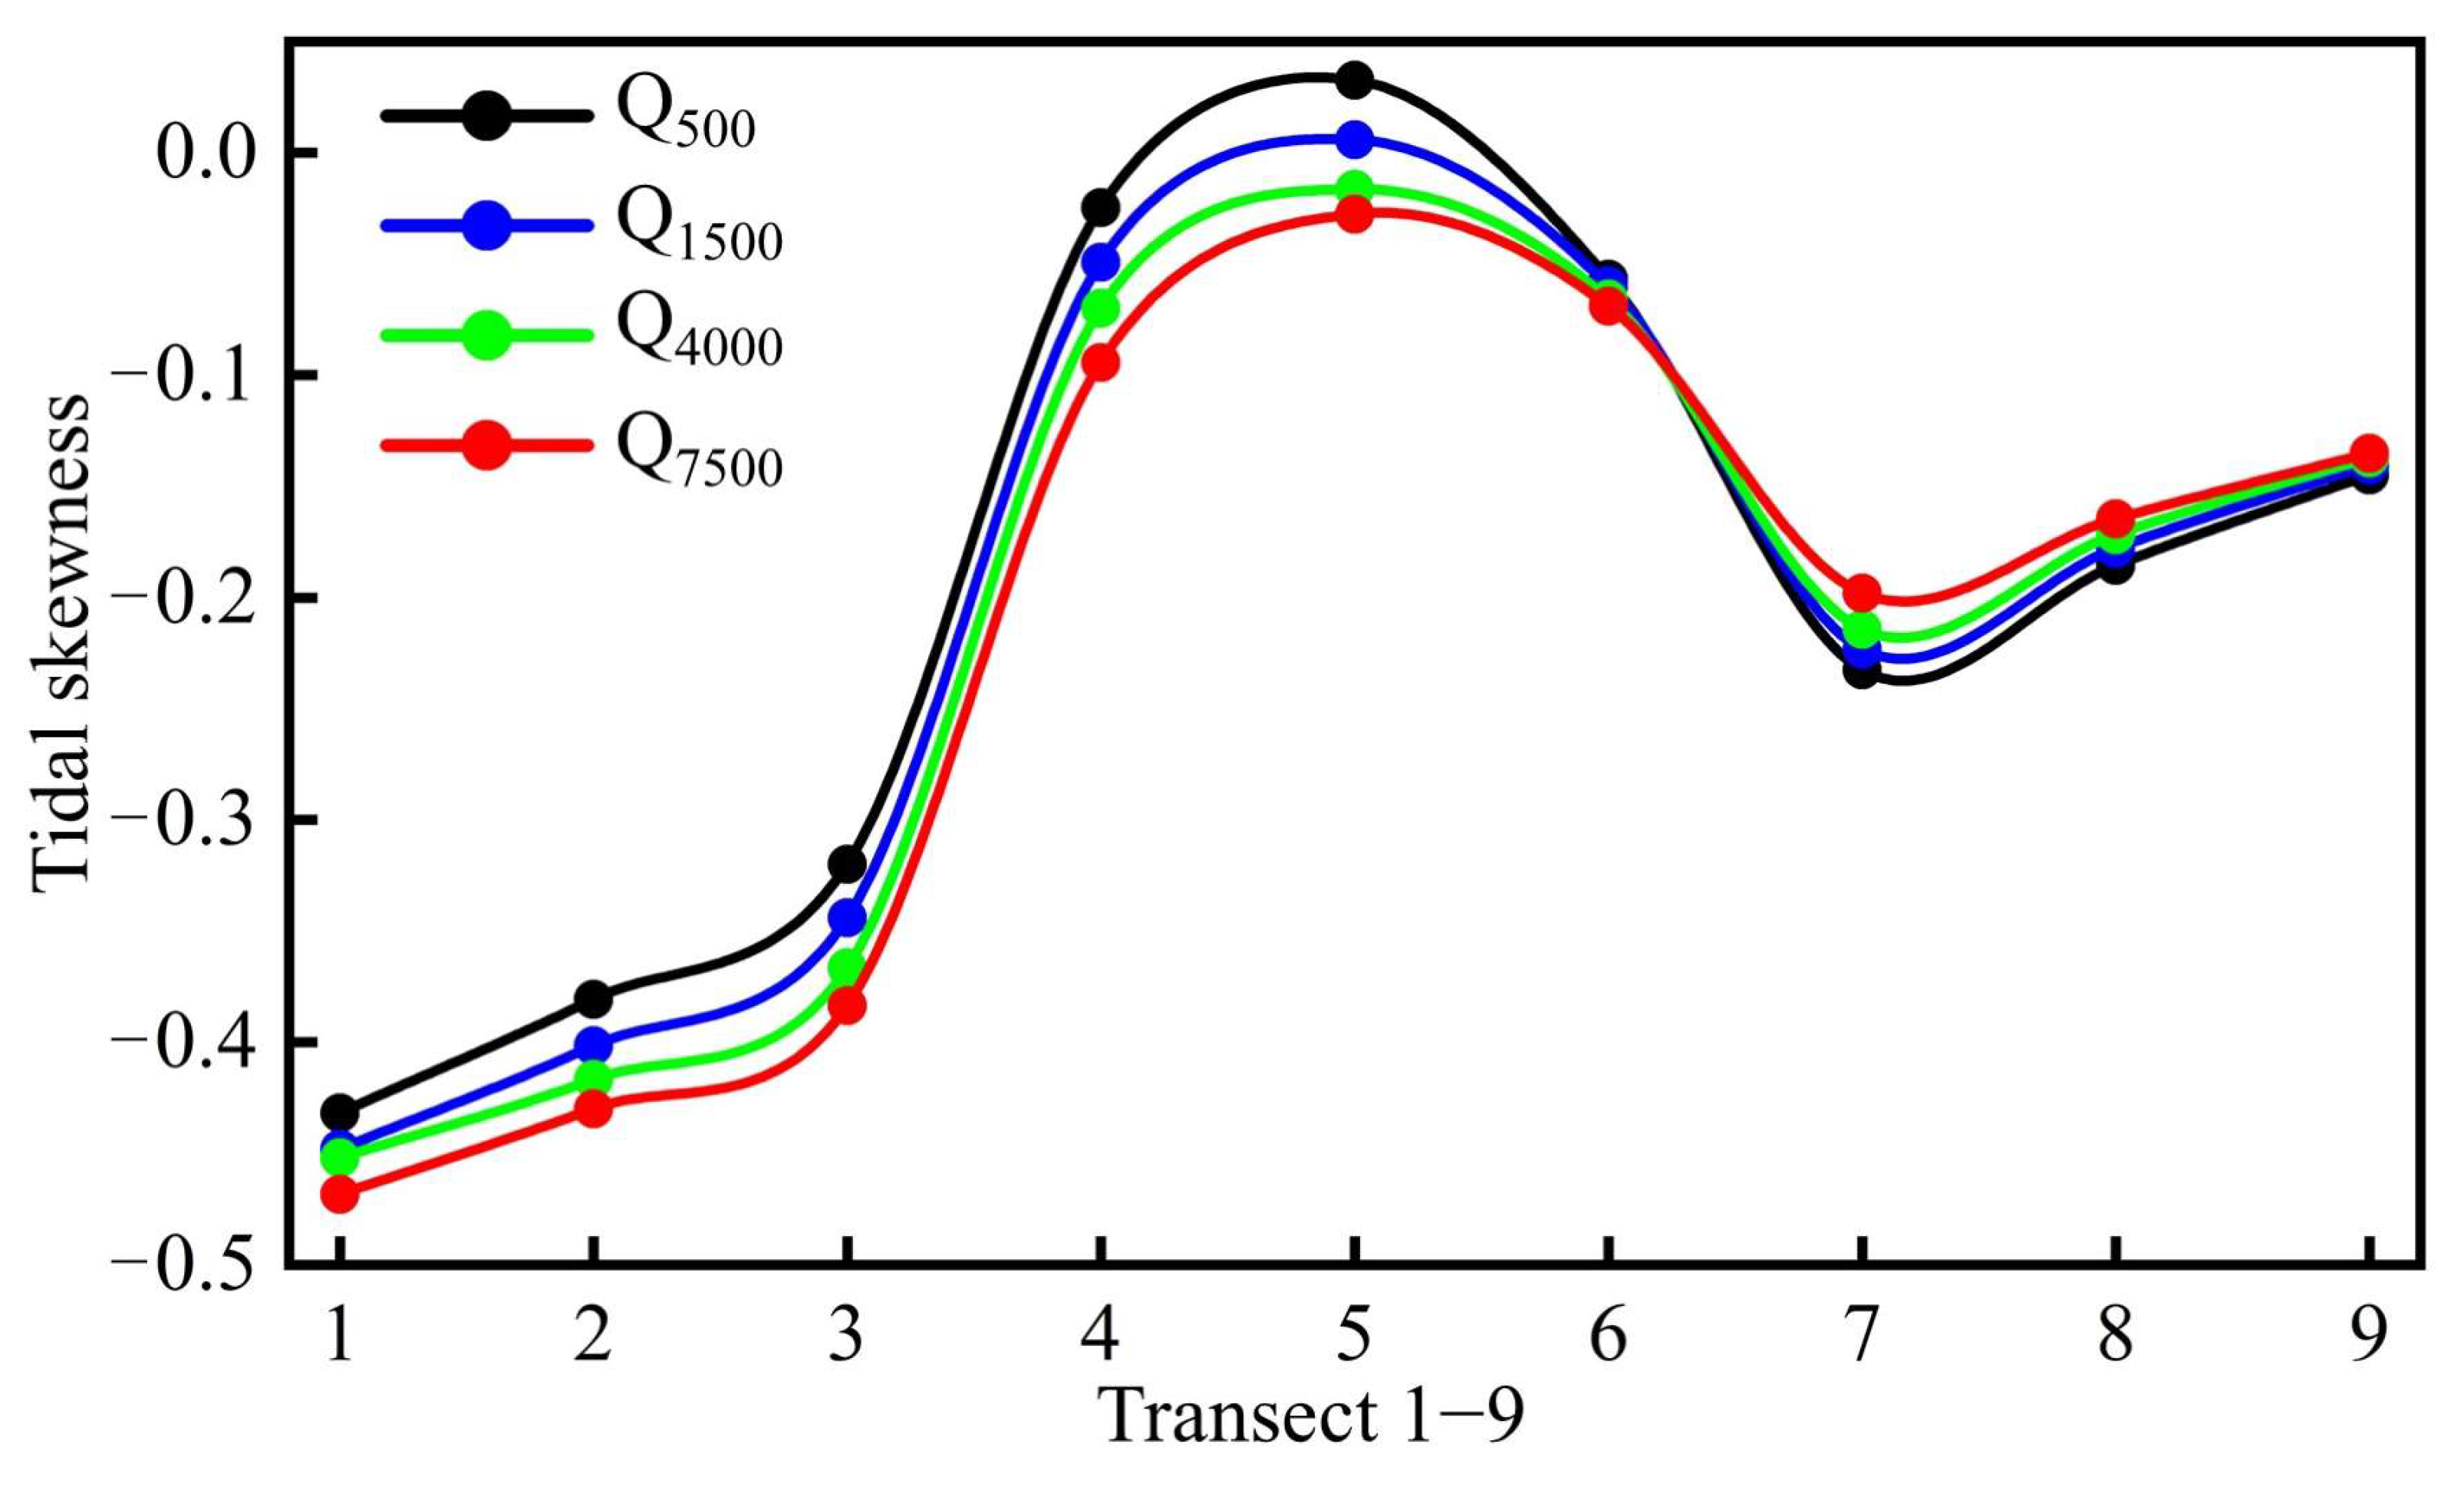
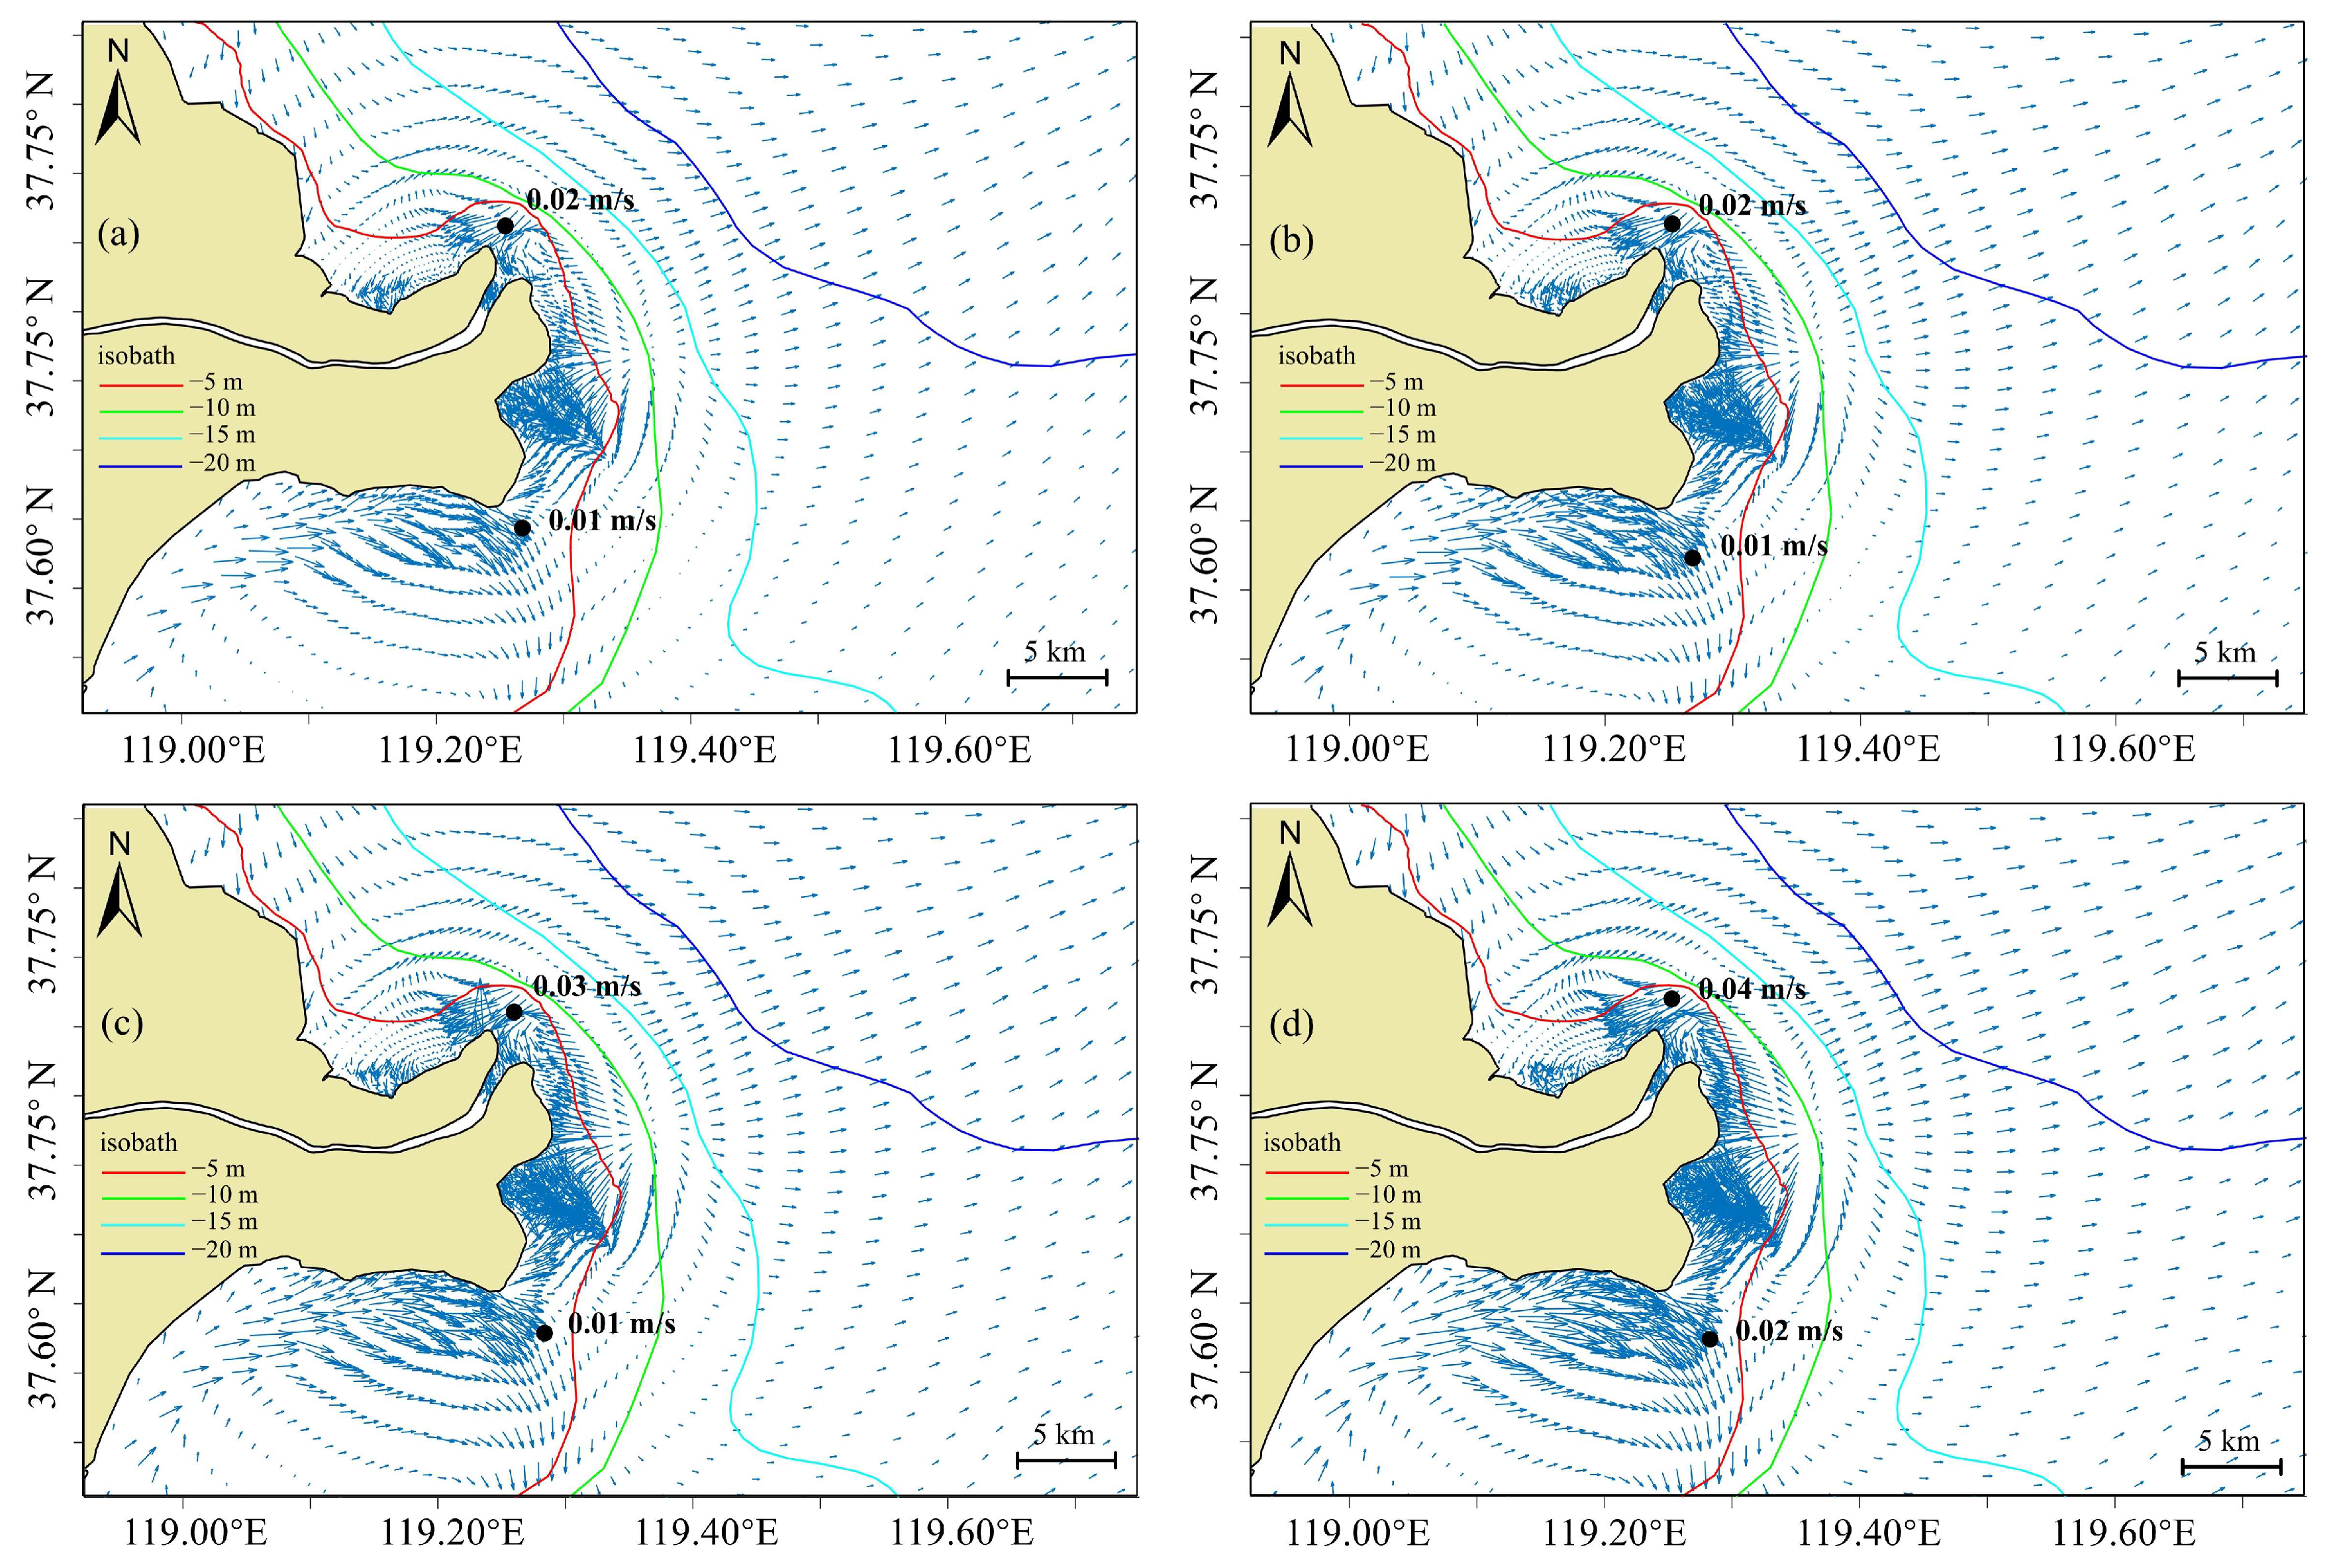
Furthermore, the tidal skewness of water level is also analyzed. More detailed methods can be referred to Nidzieko [54]. Figure 10 shows that ebb-tide duration changes during the four simulated runoff scenarios. High riverine flow directly induces increased ebb-tide velocity and duration time, both of which are critical for the direction and intensity of residual currents [55,56,57]. A previous study [58] showed that residual currents can be used to define the strength and direction of flow and fluvial sediment transfer by the mean tidal currents. Using the average-velocity vectors, the Euler residual currents for the four runoff scenarios were estimated during a spring tide (24 h). As shown in Figure 11, Euler residual velocities during spring tide in the YRD are enhanced under extreme riverine floods. In the Q7500 runoff scenario, the residual velocity in the active river mouth is about 0.04 m/s, and increases to 0.02 m/s in the abandoned river mouth (Figure 11d). The increase of magnitude in residual flow would affect fluvial sediment transport processes and cause changes in the erosion-accretion trends of the submerged delta (Figure 9).
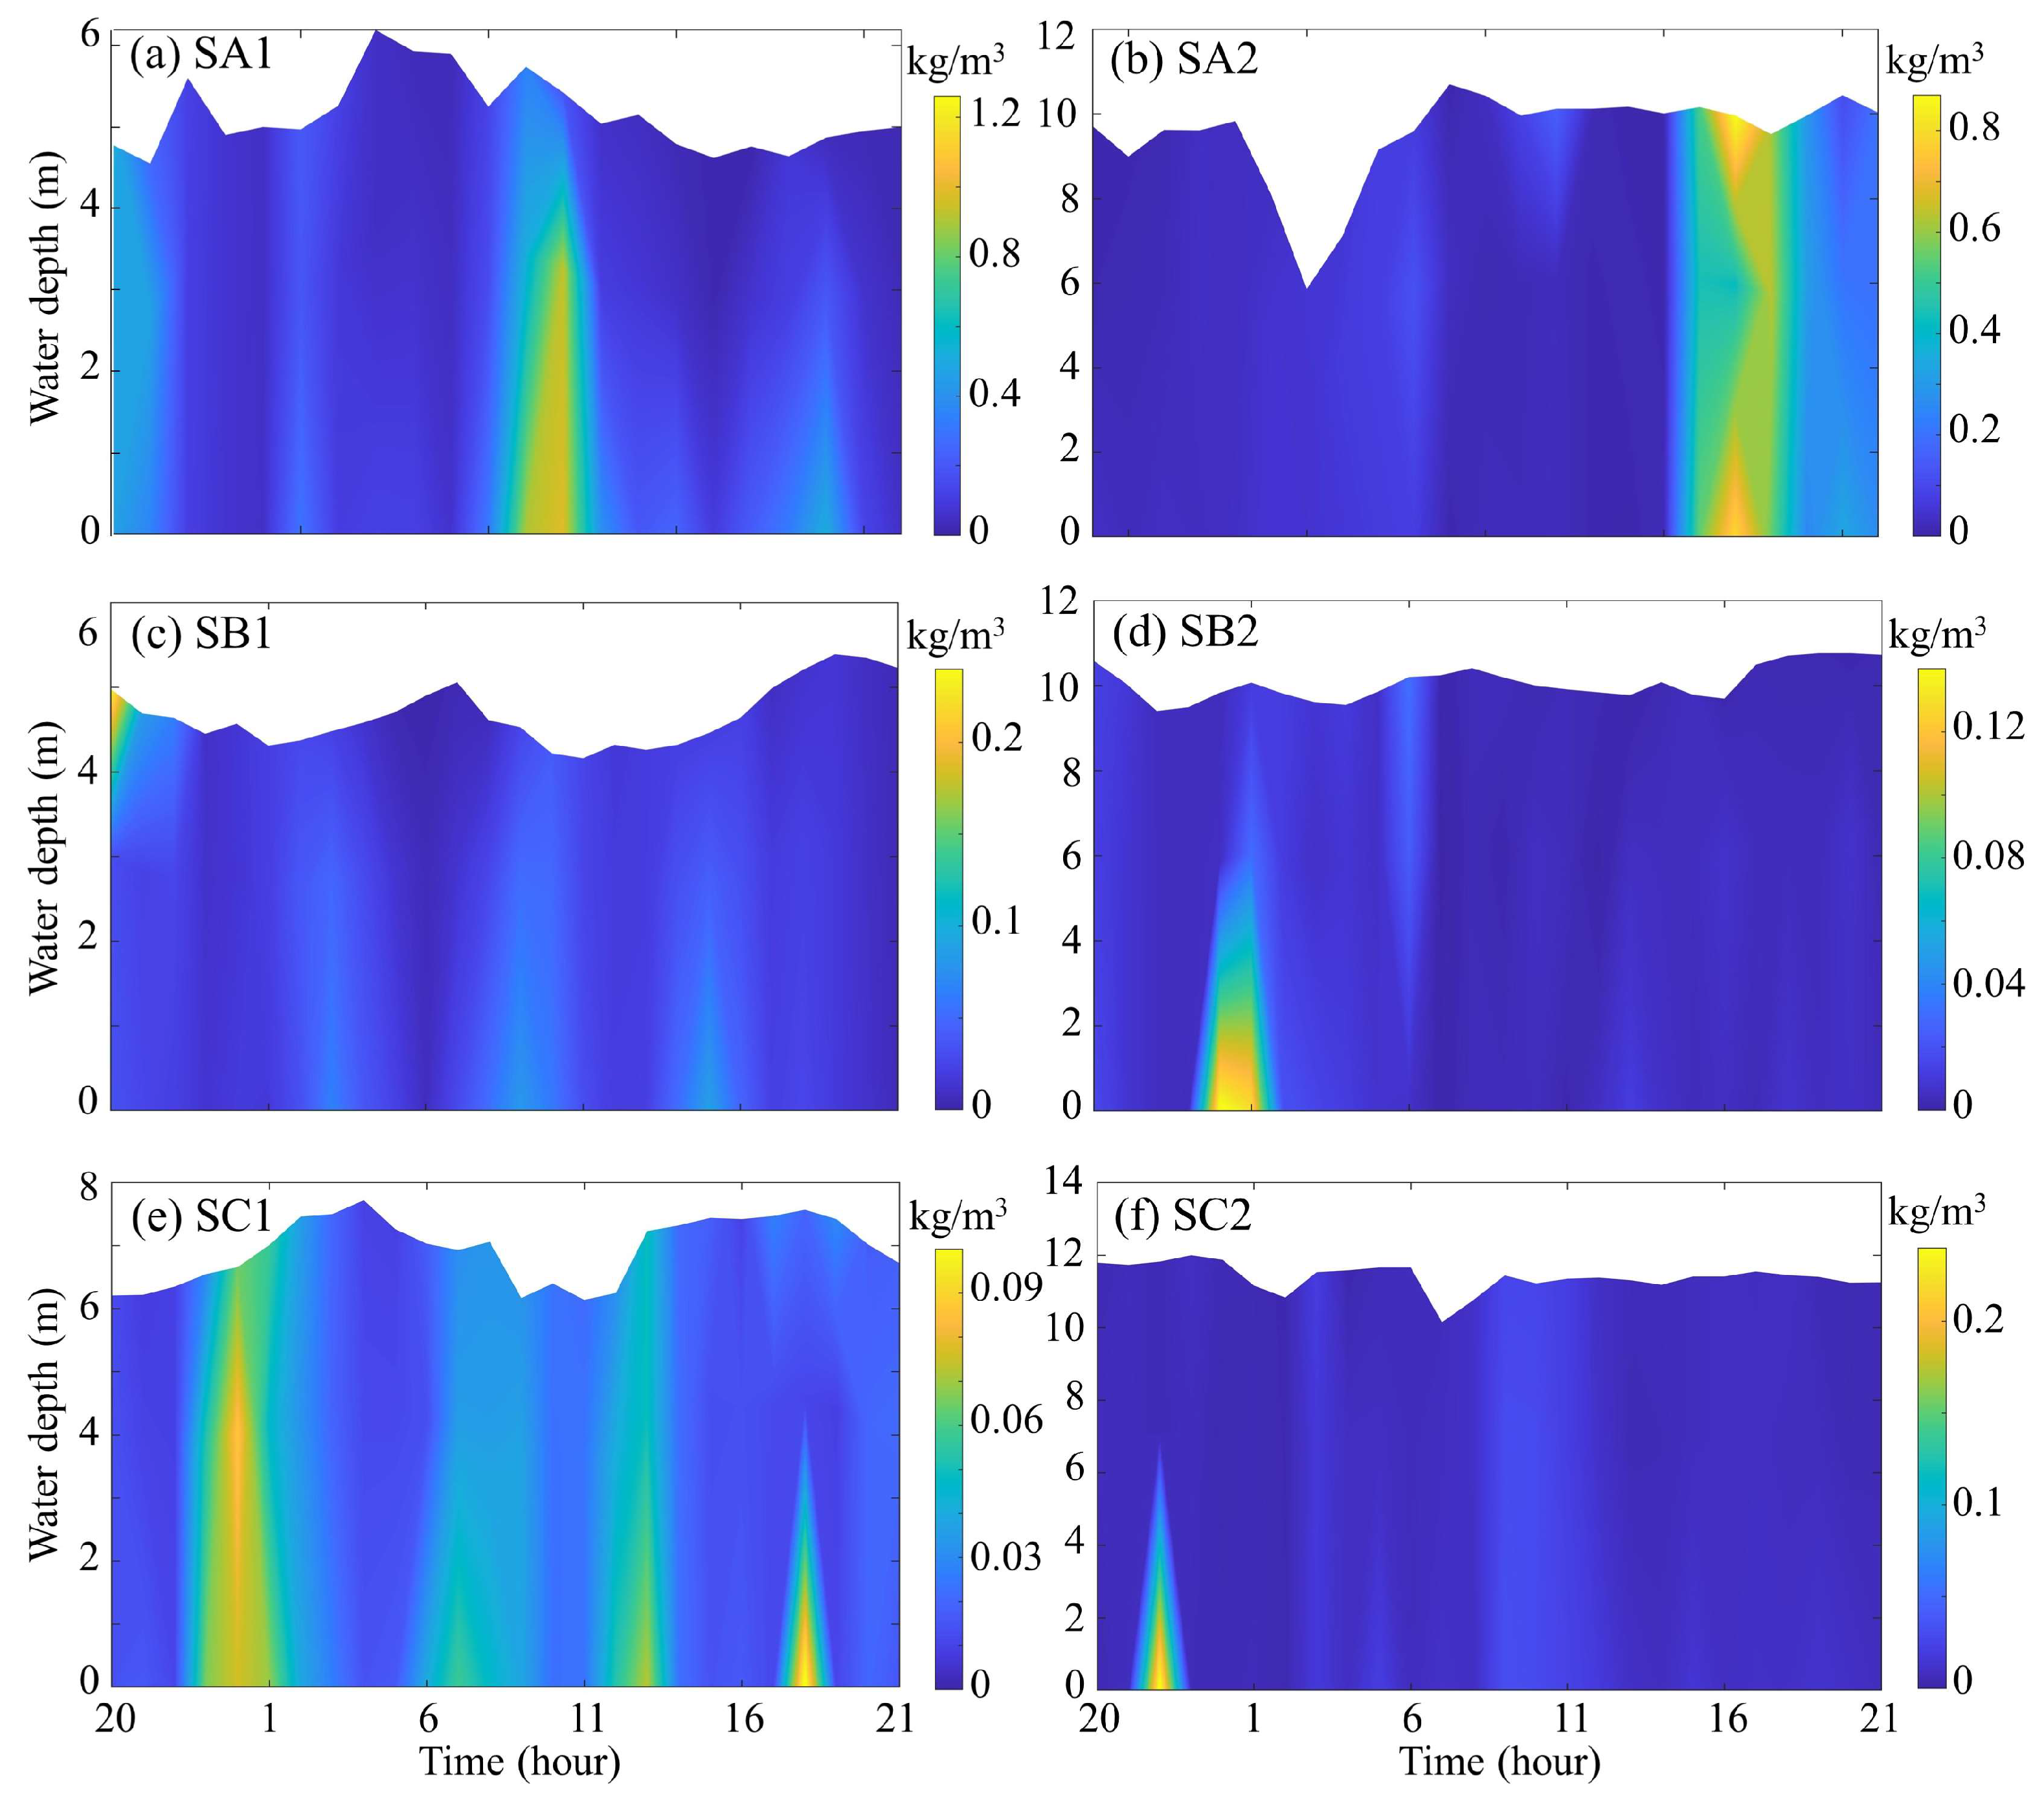
Furthermore, the distribution of SSC can reflect sediment transport processes during extreme riverine floods. Figure 12 shows the vertical distribution of SSC during a spring tide in July 2019. The SSC significantly increased near the active river mouth (SA1 site) and the abandoned delta lobe (SC1 and SC2 sites) compared to other sites (Figure 12). During flood season, high-energy riverine floods can induce strong residual currents and high bed shear stress near the abandoned river mouth (Figure 8 and Figure 11), thus causing the bed shear stress to exceed the critical bed shear stress. It indicates that extreme riverine floods induce large-scale sediment transport and resuspension processes, which lead to the formation of high-turbidity zones. Moreover, under the influence of strong bed shear stress and ebb-dominated residual current, the sediment plume gradually expanded to the center of Laizhou Bay (Figure 12f). Satellite images further show that the SSC in the abandoned and the active river mouth increased significantly, and the sediment plume progressively migrated southward following high riverine floods (Figure S6).
Overall, flood-induced ebb-tidal current dominates, transporting eroded or resuspended sediments to the offshore area. Similar hydrodynamics and sediment transport trends are also witnessed in the Mississippi, the Yangtze, and the Rhone Delta [13,16,59]. The combined influences of climate change and human intervention are triggering more frequent extreme flood events, and the likelihood of catastrophic floods may be increasing in the future, which can shift the geomorphological equilibrium of deltas.
5.2. Morphological Response to High Riverine Floods
Riverine inputs, sea level rise, storm events, and tidal dynamics are the primary drivers of the delta morphologic variability [7,32,37,59,60]. Wherein, sufficient sediment supply plays a more critical and direct role in the geomorphic evolution of the river-dominated delta. Over the past 70 years, the fluvial sediment delivered to the sea has undergone a drastic decrease (Figure S1). In addition, the scouring potential of the coastal current will be significantly increased during extreme riverine floods. When low sediment loads coincide with extreme riverine floods, it can cause abnormal deposition or the erosion of deltas. Overall, the superposition of low sediment loads and extreme riverine floods can cause significant variations in the erosion/deposition patterns of deltas [13,61,62,63]. Therefore, this study emphasizes that the deltaic geomorphic variations and response under extreme riverine floods are of great significance in sediment starvation conditions (Figure 13).
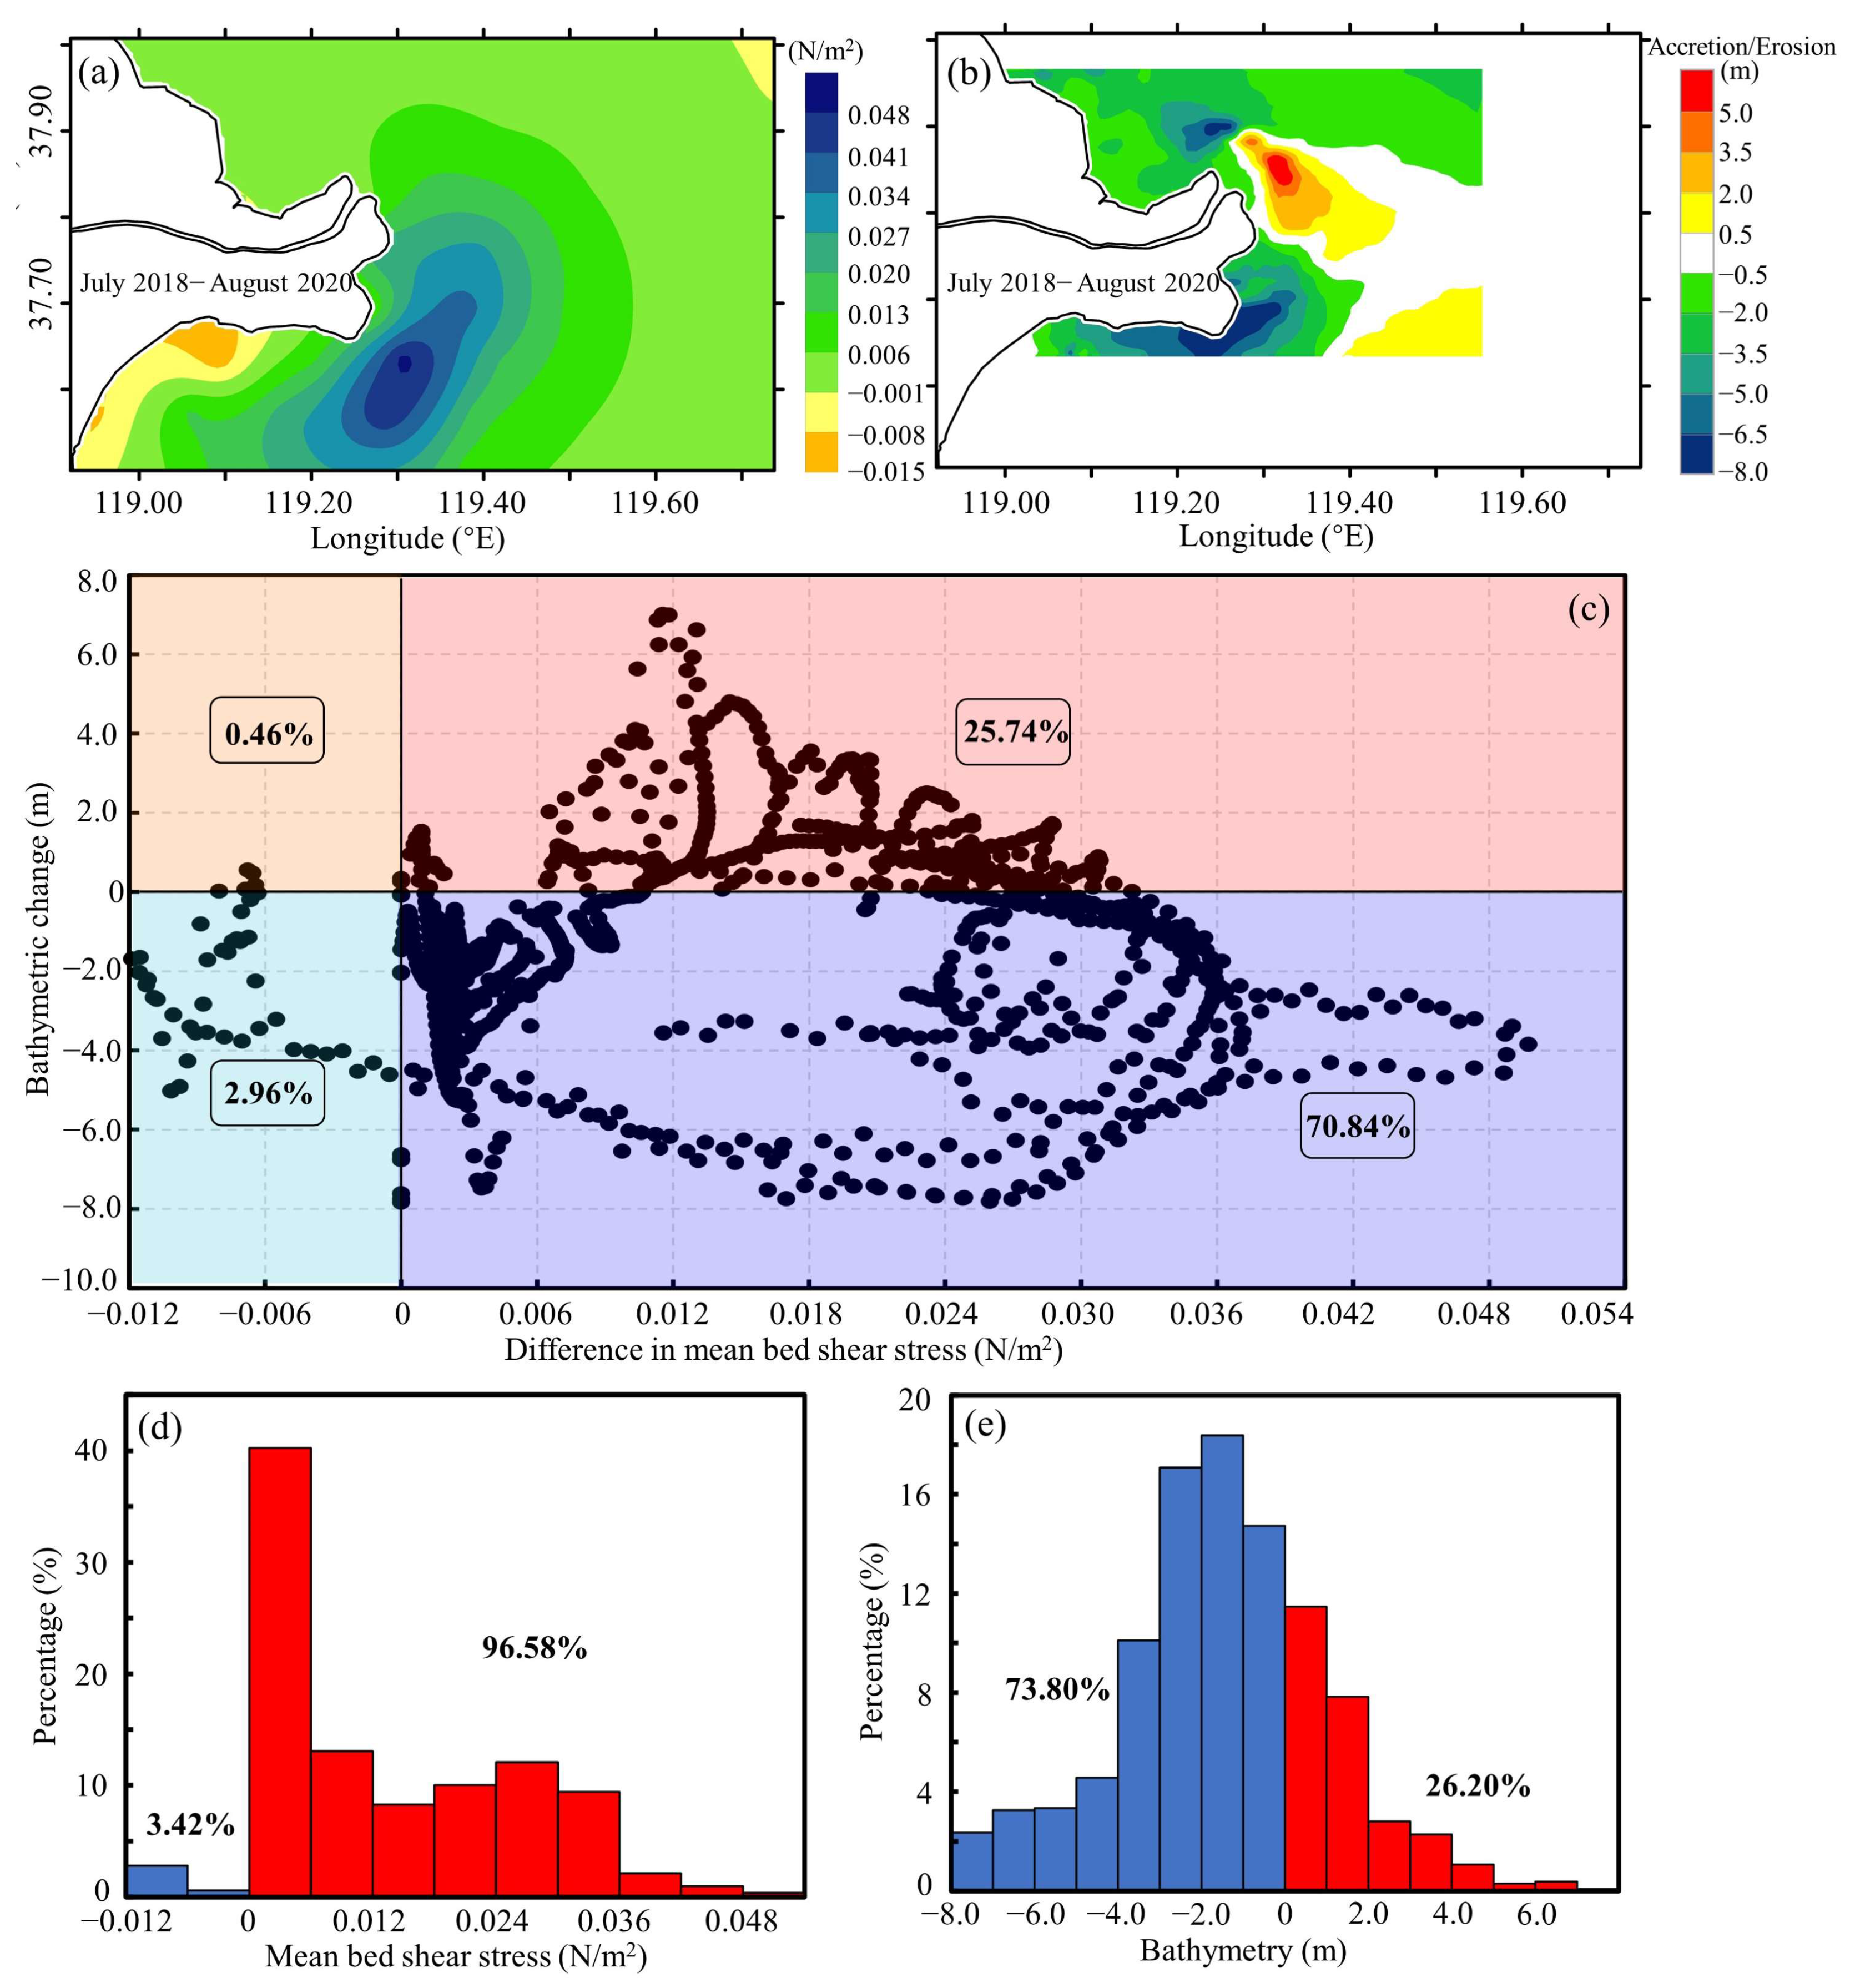
Bathymetric variations can present hydrodynamic changes and sediment delivery [1,37,64]. Due to the lack of bathymetry data in dry seasons, we only investigated the bathymetric changes during flood seasons. During the 2018 and 2020 extreme floods (July 2018 and August 2020), the calculated mean bed shear stress increased considerably, especially near the abandoned Qingshuigou delta lobe, ranging from 0.034 to 0.055 N/m2 (Figure 13a). In the entire YRD, the increase in bed shear stress presents spatial protruding patterns toward the northwest, and then gradually weakens. High river discharge during the flood season scoured the submerged delta and triggered serious erosion, with a net erosion of −0.07 × 10⁸ m3/year (Figure 13b and Table 3). In addition, the four-quadrant relationship between the bathymetric change and mean shear stress is shown in Figure 13c; 70.84% of the region has increased bed shear stress due to geomorphic erosion, particularly near the abandoned river mouth (Figure 13c). Correspondingly, despite increased bed shear stresses, 25.74% of the region suffers deposition with an average thickness of 3.25 m (Figure 13c,e). Overall, 96.58% of the total region has a rise in mean bed shear stress, which is mostly centered in the range of 0–0.036 N/m2 (Figure 13d); 73.80% of the region experiences severe erosion with a value of 0–4 m, whereas the sedimentary region makes up just 26.20% of the whole region between 0 and 3 m (Figure 13e). Therefore, high bed shear stress induced by high-energy floods could trigger more significant erosion, especially in the abandoned river mouth. Although the total fluvial sediment to the sea was 3.14 × 10⁸ t following high riverine floods in 2020, which was larger than the 2.97 × 10⁸ t in 2018 (Figure S1), severe erosion still occurred in the subaqueous delta. It indicated that more intense and faster high-energy riverine floods in the flood seasons pose an increasing erosion risk to the delta landscape.
From the perspective of hydrodynamics and morphodynamics, the development of intensive shore-parallel currents and the shear front trigger the deposition of abundant fine-grained sediment in the active delta lobe [60,65]. During the flood season, the abandoned Qingshuigou delta lobe suffers from severe erosion, and the superimposed effects of high-energy runoff and ebb-tidal current accelerate this process (Figure 13). Boudet et al. [13] found that extreme riverine floods induced large-scale resuspension and sediment transport processes in areas of high turbidity. Due to the barrier effect of the tidal shear front, the depo- and erosion-centers mainly occurred within 10 m depth contour [15,65]. Therefore, the interaction between marine dynamics and sediment transport processes under high-energy flow in the flood season has a powerful impact on delta evolution.
5.3. Model Limitations and Future Works
In this study, the development model may encounter some limitations. We did not consider the following:
(1) The impact of water temperature, sediment, salinity, and wind waves. These physical factors can affect hydrodynamics in the Bohai Sea. For example, water temperature and salinity can affect the density of the water and further affect the circulation and mixing of water masses [32,44,66]. Density differences create vertical stratification, which affects the horizontal movement of water. Sediment can change the shape of the seabed, which can affect the flow velocity and direction. The impacts of different bed compositions, such as mud or sand, on the hydro-morphodynamic model results is also unknown. Moreover, sediment transport modelling is also crucial for further hindcasting and predicting deltaic morphological development [67,68,69,70]. Wind and waves can also impact the movement of water masses. The direction and strength of the wind can determine the flow velocity and direction. In addition, waves can also create turbulence and mixing, which can affect sediment transport processes [32].
(2) The error introduced by the calculation of the Manning coefficient. In the Delft3D model, the Manning coefficient is typically calculated using bathymetric data, which was also the most commonly used method in previous studies [32,47]. Although this is acceptable, it can cause errors in the model if the data is not accurate. Hence, it is important to carefully consider the sources of error and uncertainty when using bathymetric data to calculate the Manning coefficient in Delft3D.
(3) The impact of episodic events like extreme storms and typhoons on the hydrodynamics and sediment delivery in the YRD. A previous study indicated that extreme events can also enhance the residual currents and inhibit the development of tidal shear front in shallow regions [32]. At the same time, the hydrodynamic variations can significantly drive sediment resuspension and transport processes in the YRD. As a result, high SSC occurred during a storm condition, which has been confirmed in the study of Fu et al. [23]. Under the combined influence of hydrodynamics and sediment transport, the delta will be facing high erosion risk.
(4) The multiple successive bathymetry data for evaluating the deltaic morphological development during flood periods. Our study only investigated the two bathymetric surveys (2018 and 2020), which were much longer than the time-scale of extreme floods. Therefore, bathymetric changes triggered by high-energy floods may not have become completely evident, particularly since other processes, such as strong alongshore tidal currents and storm events, could have a greater impact [17,28,39].
Therefore, future studies based on integrated physical factors, long-time series of data, and process-based morphodynamic modeling approaches are still very much needed, and can provide a better opportunity for deltaic sustainable development in the future.
5.4. Implications
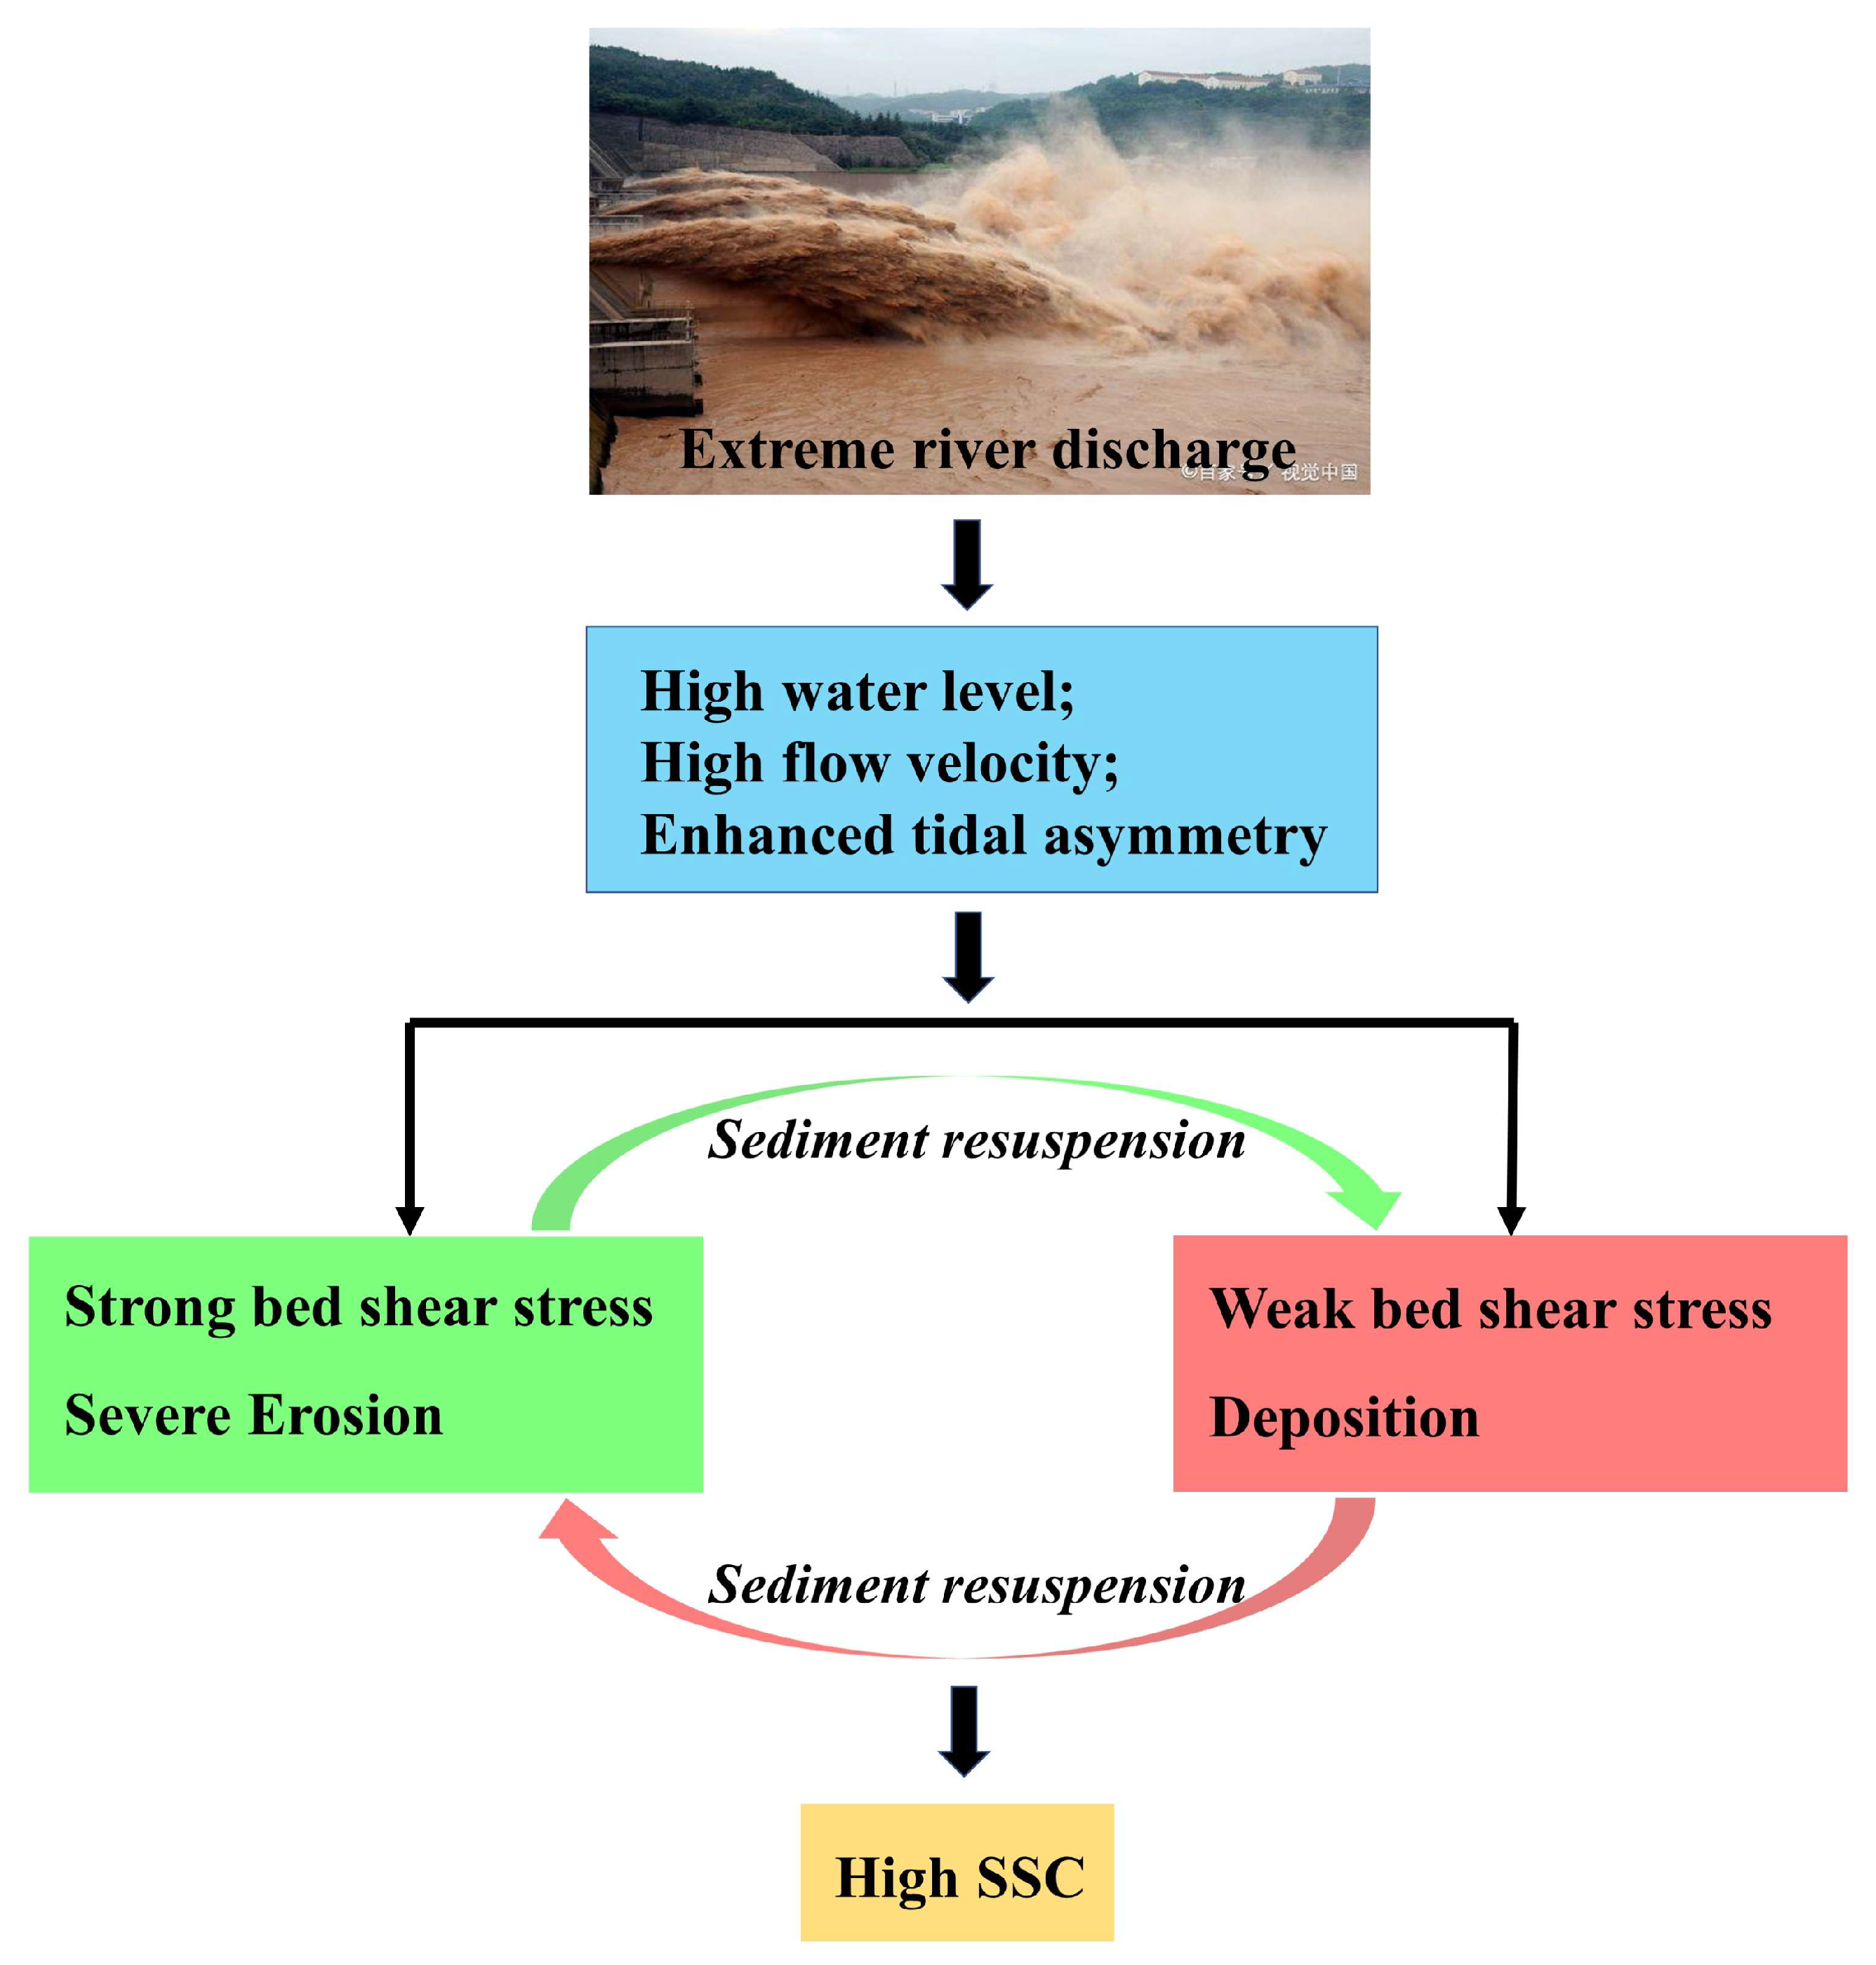
Riverine flood processes have significant impacts on the evolution of deltaic systems on both short-term and long-term timescales [26,71,72]. As shown in Figure 14, high-energy riverine floods can induce hydrodynamic changes and sediment-redistributed processes within the delta. Most megadeltas are currently undergoing irreversible changes triggered by decreasing sediment supply, rising sea levels, intensive human interferences (such as dam-building, deforestation, mining, industrial development, and agricultural expansion), and frequent catastrophic events (including natural disasters, such as storms and floods, as well as human-made disasters, such as oil spills or industrial accidents.) [9,18,21,73,74]. Considering the combined implications of insufficient sediment supply and these environmental forcing changes, the delta may not sustain its current morphology. Our research focuses on the deltaic hydrodynamic alterations and morphological responses induced by river discharge, which may provide a potential solution for the sustainable development of similar estuaries and deltas worldwide.
Furthermore, the present study has methodological advantages. The numerical model is a widely used and well-established hydrodynamic model that can accurately simulate complex flow and sediment transport processes in riverine and coastal environments. This makes it a suitable tool for studying hydro-morphodynamics in the Yellow River Delta. Studies in recent years based on analytical and numerical models have largely improved our understanding of hydrodynamics and sediment dynamics [32,60,65,75,76,77]. However, none of these studies takes the impacts of extreme riverine floods on hydro-morphodynamics in the YRD into account. Findings from our study reveal that the hydrodynamics are sensitive to high riverine floods in the YRD. During flood seasons, high bed shear stress induced by high-energy floods could trigger more significant erosion. The combined effects of strong tidal asymmetry and Euler residual currents intensify large-scale resuspension and sediment transport processes in areas of high turbidity. This implies that the findings can inform the study and management of similar estuaries and deltas undergoing intensified human interferences and environmental forcing changes worldwide. Although the model may have some inherent limitations in its configuration, it still possesses the potential to provide valuable insights into investigating the long-term fate and sustainable development of deltaic systems.
6. Conclusions
In this study, the impacts of extreme riverine floods on the hydrodynamics and morphodynamics in the YRD were investigated using field data and numerical simulations. The results show that extreme riverine floods induce higher water levels, flow velocities, and bed shear stresses near the abandoned river mouth, while the effect is relatively weak in the Gudong littoral zone. During high-energy riverine floods, changes in the tidal constituents of the water level led to stronger tidal asymmetry. Therefore, the ebb-dominated Euler residual currents enhanced sediment resuspension and transport processes, which induced suspended sediment transported southward. Changes in hydrodynamics and sediment transport significantly impact erosion and accretion patterns in the YRD. From July 2018 to August 2020, high riverine flows with low SSC during the flood seasons caused severe erosion in the submerged delta, with a net erosion volume reaching −0.07 × 10⁸ m3/year. Simultaneously, severe erosion occurred in the abandoned river mouth and the maximum erosion thickness reached 7 m. However, approximately 0.04 × 10⁸ t/year of fluvial sediment discharge was deposited in the submerged delta under the extreme riverine floods. Under the superimposed pressures of natural change and sediment starvation in the future, high-energy riverine floods will intensify erosion risks in river deltas. This study can provide some implications for understanding deltaic morphodynamics and sustainable development under extreme flood events.
Supplementary Materials
The following supporting information can be downloaded at: https://www.mdpi.com/article/10.3390/w15081568/s1, Figure S1: (a,b) Monthly mean water discharge and SSC at Lijin station during four periods from 1950 to 2021. (c) Relationship between monthly water discharge and SSC and the colormap represents progressive years. (d) Power exponential correlation equations in four stages and whole study period (black dotted line); Figure S2: (a) Magnitude and frequency of monthly water discharge during the flood season (July–October) at Lijin station from 1950 to 2021. The red dots represent four typical water flux levels (500 m3/s, 1500 m3/s, 4000 m3/s and 7500 m3/s). (b) Mean water discharge in six years. (c) Photo of extreme floods passing, taken at the Xiaolangdi reservoir; Figure S3: Frequency distributions of modeled mean and maximum bed shear stress in four scenarios; Figure S4: Amplitudes and phases of two principal tidal harmonic constituents of modeled water levels over the 9 cross sections, (a,c) M2 constituent, (b,d) M4 constituent; Figure S5: Amplitudes and phases of two principal tidal harmonic constituents of modeled flow velocities over the 9 cross sections, (a,c) M2 constituent, (b,d) M4 constituent; Figure S6: Landsat satellite images showing spatial patterns of flow-sediment transports during the flood season in the Yellow River Delta. The annual water discharge in these three years was higher than normal years, especially in 2018, 2019 and 2020, when the extreme flood events occurred.
Author Contributions
Conceptualization, Y.F. (Yutao Fu) and S.C.; methodology, Y.F. (Yutao Fu); software, Y.F. (Yutao Fu) and R.G.J.B.; validation, Y.F. (Yutao Fu) and H.J.; formal analysis, Y.F. (Yutao Fu) and Y.F. (Yaoshen Fan); investigation, Y.F. (Yutao Fu) and P.L.; resources, S.C.; data curation, Y.F. (Yutao Fu); writing-original draft preparation, Y.F. (Yutao Fu); writing-review and editing, Y.F. (Yutao Fu), S.C. and R.G.J.B.; visualization, Y.F. (Yutao Fu); supervision, S.C. and R.G.J.B.; project administration, S.C.; funding acquisition, S.C. All authors have read and agreed to the published version of the manuscript.
Funding
This study was supported by the National Natural Science Foundation of China (NSFC, No. U1706214), the National Natural Science Foundation of China (No. 42071396), and the joint PhD program of the China Scholarship Council for Overseas Studies (No. 202106140093).
Data Availability Statement
Data are available as Supplementary Materials. Additional data can be obtained from the corresponding author upon reasonable request.
Acknowledgments
We would like to acknowledge the hydrological dataset provided by the Yellow River Conservancy Commission, Ministry of Water Resources of China, and the open-source remote sensing data provided by the USGS. We would also like to express our gratitude to the editor and reviewers for their invaluable insights and constructive feedback on the original manuscript.
Conflicts of Interest
The authors declare to have no conflict of interest that could have influenced the work reported in this research article.
References
- Fagherazzi, S.; Mariotti, G.; Banks, A.; Morgan, E.; Fulweiler, R. The relationships among hydrodynamics, sediment distribution, and chlorophyll in a mesotidal estuary. Estuar. Coast. Shelf Sci. 2014, 144, 54–64. [Google Scholar] [CrossRef]
- Kuenzer, C.; Renaud, F.G. Climate and environmental change in river deltas globally: Expected impacts, resilience, and adaptation. In The Mekong Delta System: Interdisciplinary Analyses of a River Delta; Springer: Berlin/Heidelberg, Germany, 2012; pp. 7–46. [Google Scholar]
- Nienhuis, J.H.; Ashton, A.D.; Edmonds, D.A.; Hoitink, A.; Kettner, A.J.; Rowland, J.C.; Törnqvist, T.E. Global-scale human impact on delta morphology has led to net land area gain. Nature 2020, 577, 514–518. [Google Scholar] [CrossRef] [PubMed]
- Syvitski, J.P.; Kettner, A.J.; Overeem, I.; Hutton, E.W.; Hannon, M.T.; Brakenridge, G.R.; Day, J.; Vörösmarty, C.; Saito, Y.; Giosan, L. Sinking deltas due to human activities. Nat. Geosci. 2009, 2, 681–686. [Google Scholar] [CrossRef]
- Goodbred, S., Jr.; Kuehl, S.A. The significance of large sediment supply, active tectonism, and eustasy on margin sequence development: Late Quaternary stratigraphy and evolution of the Ganges–Brahmaputra delta. Sediment. Geol. 2000, 133, 227–248. [Google Scholar] [CrossRef]
- Fagherazzi, S.; Edmonds, D.A.; Nardin, W.; Leonardi, N.; Canestrelli, A.; Falcini, F.; Jerolmack, D.J.; Mariotti, G.; Rowland, J.C.; Slingerland, R.L. Dynamics of river mouth deposits. Rev. Geophys. 2015, 53, 642–672. [Google Scholar] [CrossRef]
- Hoitink, A.; Wang, Z.B.; Vermeulen, B.; Huismans, Y.; Kästner, K. Tidal controls on river delta morphology. Nat. Geosci. 2017, 10, 637–645. [Google Scholar] [CrossRef]
- Leonardi, N.; Canestrelli, A.; Sun, T.; Fagherazzi, S. Effect of tides on mouth bar morphology and hydrodynamics. J. Geophys. Res. Ocean. 2013, 118, 4169–4183. [Google Scholar] [CrossRef]
- Becker, M.; Papa, F.; Karpytchev, M.; Delebecque, C.; Krien, Y.; Khan, J.U.; Ballu, V.; Durand, F.; Le Cozannet, G.; Islam, A.S. Water level changes, subsidence, and sea level rise in the Ganges–Brahmaputra–Meghna delta. Proc. Natl. Acad. Sci. USA 2020, 117, 1867–1876. [Google Scholar] [CrossRef] [PubMed]
- Higgins, S.; Overeem, I.; Tanaka, A.; Syvitski, J.P. Land subsidence at aquaculture facilities in the Yellow River delta, China. Geophys. Res. Lett. 2013, 40, 3898–3902. [Google Scholar] [CrossRef]
- Syvitski, J.P.; Saito, Y. Morphodynamics of deltas under the influence of humans. Glob. Planet. Chang. 2007, 57, 261–282. [Google Scholar] [CrossRef]
- Tessler, Z.; Vörösmarty, C.J.; Grossberg, M.; Gladkova, I.; Aizenman, H.; Syvitski, J.P.; Foufoula-Georgiou, E. Profiling risk and sustainability in coastal deltas of the world. Science 2015, 349, 638–643. [Google Scholar] [CrossRef]
- Boudet, L.; Sabatier, F.; Radakovitch, O. Modelling of sediment transport pattern in the mouth of the Rhone delta: Role of storm and flood events. Estuar. Coast. Shelf Sci. 2017, 198, 568–582. [Google Scholar] [CrossRef]
- Cao, Y.; Zhang, W.; Zhu, Y.; Ji, X.; Xu, Y.; Wu, Y.; Hoitink, A. Impact of trends in river discharge and ocean tides on water level dynamics in the Pearl River Delta. Coast. Eng. 2020, 157, 103634. [Google Scholar] [CrossRef]
- Ji, H.; Pan, S.; Chen, S. Impact of river discharge on hydrodynamics and sedimentary processes at Yellow River Delta. Mar. Geol. 2020, 425, 106210. [Google Scholar] [CrossRef]
- Wang, J.; Dai, Z.; Fagherazzi, S.; Zhang, X.; Liu, X. Hydro-morphodynamics triggered by extreme riverine floods in a mega fluvial-tidal delta. Sci. Total Environ. 2022, 809, 152076. [Google Scholar] [CrossRef]
- Zăinescu, F.; Vespremeanu-Stroe, A.; Anthony, E.; Tătui, F.; Preoteasa, L.; Mateescu, R. Flood deposition and storm removal of sediments in front of a deltaic wave-influenced river mouth. Mar. Geol. 2019, 417, 106015. [Google Scholar] [CrossRef]
- Yang, S.; Milliman, J.; Li, P.; Xu, K. 50,000 dams later: Erosion of the Yangtze River and its delta. Glob. Planet. Chang. 2011, 75, 14–20. [Google Scholar] [CrossRef]
- Blum, M.D.; Roberts, H.H. Drowning of the Mississippi Delta due to insufficient sediment supply and global sea-level rise. Nat. Geosci. 2009, 2, 488–491. [Google Scholar] [CrossRef]
- Stanley, D.J.; Warne, A.G. Nile Delta in its destruction phase. J. Coast. Res. 1998, 14, 795–825. [Google Scholar]
- Anthony, E.J.; Brunier, G.; Besset, M.; Goichot, M.; Dussouillez, P.; Nguyen, V.L. Linking rapid erosion of the Mekong River delta to human activities. Sci. Rep. 2015, 5, 14745. [Google Scholar] [CrossRef] [PubMed]
- Wilson, C.A.; Goodbred, S.L., Jr. Construction and maintenance of the Ganges-Brahmaputra-Meghna delta: Linking process, morphology, and stratigraphy. Annu. Rev. Mar. Sci. 2015, 7, 67–88. [Google Scholar] [CrossRef]
- Fu, Y.; Chen, S.; Ji, H.; Fan, Y.; Li, P. The modern Yellow River Delta in transition: Causes and implications. Mar. Geol. 2021, 436, 106476. [Google Scholar] [CrossRef]
- Maloney, J.M.; Bentley, S.J.; Xu, K.; Obelcz, J.; Georgiou, I.Y.; Miner, M.D. Mississippi River subaqueous delta is entering a stage of retrogradation. Mar. Geol. 2018, 400, 12–23. [Google Scholar] [CrossRef]
- Mei, X.; Dai, Z.; Darby, S.E.; Gao, S.; Wang, J.; Jiang, W. Modulation of extreme flood levels by impoundment significantly offset by floodplain loss downstream of the Three Gorges Dam. Geophys. Res. Lett. 2018, 45, 3147–3155. [Google Scholar] [CrossRef]
- Luan, H.L.; Ding, P.X.; Wang, Z.B.; Ge, J.Z.; Yang, S.L. Decadal morphological evolution of the Yangtze Estuary in response to river input changes and estuarine engineering projects. Geomorphology 2016, 265, 12–23. [Google Scholar] [CrossRef]
- Maillet, G.M.; Vella, C.; Berné, S.; Friend, P.L.; Amos, C.L.; Fleury, T.J.; Normand, A. Morphological changes and sedimentary processes induced by the December 2003 flood event at the present mouth of the Grand Rhône River (southern France). Mar. Geol. 2006, 234, 159–177. [Google Scholar] [CrossRef]
- Wang, J.; Dai, Z.; Mei, X.; Fagherazzi, S. Tropical cyclones significantly alleviate mega-deltaic erosion induced by high riverine flow. Geophys. Res. Lett. 2020, 47, e2020GL089065. [Google Scholar] [CrossRef]
- Jiang, C.; Pan, S.; Chen, S. Recent morphological changes of the Yellow River (Huanghe) submerged delta: Causes and environmental implications. Geomorphology 2017, 293, 93–107. [Google Scholar] [CrossRef]
- Vörösmarty, C.J.; Meybeck, M.; Fekete, B.; Sharma, K.; Green, P.; Syvitski, J.P. Anthropogenic sediment retention: Major global impact from registered river impoundments. Glob. Planet. Chang. 2003, 39, 169–190. [Google Scholar] [CrossRef]
- Li, Y.; Zhang, H.; Tang, C.; Zou, T.; Jiang, D. Influence of rising sea level on tidal dynamics in the Bohai Sea. J. Coast. Res. 2016, 74, 22–31. [Google Scholar] [CrossRef]
- Fan, Y.; Chen, S.; Pan, S.; Dou, S. Storm-induced hydrodynamic changes and seabed erosion in the littoral area of Yellow River Delta: A model-guided mechanism study. Cont. Shelf Res. 2020, 205, 104171. [Google Scholar] [CrossRef]
- Zhu, L.; Hu, R.; Zhu, H.; Jiang, S.; Xu, Y.; Wang, N. Modeling studies of tidal dynamics and the associated responses to coastline changes in the Bohai Sea, China. Ocean Dyn. 2018, 68, 1625–1648. [Google Scholar] [CrossRef]
- Bi, N.; Wang, H.; Wu, X.; Saito, Y.; Xu, C.; Yang, Z. Phase change in evolution of the modern Huanghe (Yellow River) Delta: Process, pattern, and mechanisms. Mar. Geol. 2021, 437, 106516. [Google Scholar] [CrossRef]
- Ji, H.; Chen, S.; Pan, S.; Xu, C.; Jiang, C.; Fan, Y. Morphological variability of the active Yellow River mouth under the new regime of riverine delivery. J. Hydrol. 2018, 564, 329–341. [Google Scholar] [CrossRef]
- Leonardi, N.; Kolker, A.S.; Fagherazzi, S. Interplay between river discharge and tides in a delta distributary. Adv. Water Resour. 2015, 80, 69–78. [Google Scholar] [CrossRef]
- Wu, X.; Bi, N.; Xu, J.; Nittrouer, J.A.; Yang, Z.; Saito, Y.; Wang, H. Stepwise morphological evolution of the active Yellow River (Huanghe) delta lobe (1976–2013): Dominant roles of riverine discharge and sediment grain size. Geomorphology 2017, 292, 115–127. [Google Scholar] [CrossRef]
- Li, P.; Chen, S.; Ke, Y.; Ji, H.; Li, P.; Fan, Y. Spatiotemporal dynamics of suspended particulate matter in the Bohai Sea, China over the past decade from the space perspective. Sci. Total Environ. 2022, 851, 158210. [Google Scholar] [CrossRef]
- Xie, W.; Wang, X.; Guo, L.; He, Q.; Dou, S.; Yu, X. Impacts of a storm on the erosion process of a tidal wetland in the Yellow River Delta. Catena 2021, 205, 105461. [Google Scholar] [CrossRef]
- Wang, Y.; Liu, D.; Lee, K.; Dong, Z.; Di, B.; Wang, Y.; Zhang, J. Impact of Water-Sediment Regulation Scheme on seasonal and spatial variations of biogeochemical factors in the Yellow River estuary. Estuar. Coast. Shelf Sci. 2017, 198, 92–105. [Google Scholar] [CrossRef]
- Chu, Z.; Sun, X.; Zhai, S.; Xu, K. Changing pattern of accretion/erosion of the modern Yellow River (Huanghe) subaerial delta, China: Based on remote sensing images. Mar. Geol. 2006, 227, 13–30. [Google Scholar] [CrossRef]
- Wang, C.; Cao, W.; Zhang, S. Tidal current and sediment transport capacity in Yellow River estuary. J. Hydraul. Eng. 2008, 39, 1256–1263. (In Chinese) [Google Scholar]
- Dong, H.; Chen, Y.; Wang, J.; Zhang, Y.; Zhang, P.; Li, X.; Zou, J.; Zhou, A. Interactions of microplastics and antibiotic resistance genes and their effects on the aquaculture environments. J. Hazard. Mater. 2021, 403, 123961. [Google Scholar] [CrossRef] [PubMed]
- Yang, Z.; Ji, Y.; Bi, N.; Lei, K.; Wang, H. Sediment transport off the Huanghe (Yellow River) delta and in the adjacent Bohai Sea in winter and seasonal comparison. Estuar. Coast. Shelf Sci. 2011, 93, 173–181. [Google Scholar] [CrossRef]
- Zhang, J.; Huang, W.W.; Shi, M.C. Huanghe (Yellow River) and its estuary: Sediment origin, transport and deposition. J. Hydrol. 1990, 120, 203–223. [Google Scholar] [CrossRef]
- Wang, H.; Bi, N.; Wang, Y.; Saito, Y.; Yang, Z. Tide-modulated hyperpycnal flows off the Huanghe (Yellow River) mouth, China. Earth Surf. Process. Landf. 2010, 35, 1315–1329. [Google Scholar] [CrossRef]
- Xing, F.; Wang, Y.P.; Wang, H.V. Tidal hydrodynamics and fine-grained sediment transport on the radial sand ridge system in the southern Yellow Sea. Mar. Geol. 2012, 291, 192–210. [Google Scholar] [CrossRef]
- Pawlowicz, R.; Beardsley, B.; Lentz, S. Classical tidal harmonic analysis including error estimates in MATLAB using T_TIDE. Comput. Geosci. 2002, 28, 929–937. [Google Scholar] [CrossRef]
- Huang, J.; Xu, J.; Gao, S.; Lian, X.; Li, J. Analysis of influence on the Bohai Sea tidal system induced by coastline modification. J. Coast. Res. 2015, 73, 359–363. [Google Scholar] [CrossRef]
- Luo, Z.; Zhu, J.; Wu, H.; Li, X. Dynamics of the sediment plume over the Yangtze Bank in the Yellow and East China Seas. J. Geophys. Res. Ocean. 2017, 122, 10073–10090. [Google Scholar] [CrossRef]
- Ralston, D.K.; Geyer, W.R.; Lerczak, J.A. Structure, variability, and salt flux in a strongly forced salt wedge estuary. J. Geophys. Res. Ocean. 2010, 115, C06005. [Google Scholar] [CrossRef]
- Friedrichs, C.T.; Aubrey, D.G. Non-linear tidal distortion in shallow well-mixed estuaries: A synthesis. Estuar. Coast. Shelf Sci. 1988, 27, 521–545. [Google Scholar] [CrossRef]
- He, C.; Li, X.; Zuo, X. Analysis and research on sediment bulk density test in coastal area of Yellow River estuary. Water Res. Dev. Manag. 2017, 4, 70–76. [Google Scholar]
- Nidzieko, N.J. Tidal asymmetry in estuaries with mixed semidiurnal/diurnal tides. J. Geophys. Res. Ocean. 2010, 115, C08006. [Google Scholar] [CrossRef]
- Cheng, P.; Mao, J.; Yu, F.; Chen, N.; Wang, A.; Xu, F. A numerical study of residual flow induced by eddy viscosity-shear covariance in a tidally energetic estuary. Estuar. Coast. Shelf Sci. 2019, 230, 106446. [Google Scholar] [CrossRef]
- Matte, P.; Secretan, Y.; Morin, J. Drivers of residual and tidal flow variability in the St. Lawrence fluvial estuary: Influence on tidal wave propagation. Cont. Shelf Res. 2019, 174, 158–173. [Google Scholar] [CrossRef]
- Vaz, N.; Dias, J.M. Residual currents and transport pathways in the Tagus estuary, Portugal: The role of freshwater discharge and wind. J. Coast. Res. 2014, 70, 610–615. [Google Scholar] [CrossRef]
- Dyer, K.R. Estuaries: A Physical Introduction; Wiley: London, UK, 1973. [Google Scholar]
- Lamb, M.P.; Nittrouer, J.A.; Mohrig, D.; Shaw, J. Backwater and river plume controls on scour upstream of river mouths: Implications for fluvio-deltaic morphodynamics. J. Geophys. Res. 2012, 117, F01002. [Google Scholar] [CrossRef]
- Ji, H.; Chen, S.; Pan, S.; Xu, C.; Tian, Y.; Li, P.; Liu, Q.; Chen, L. Fluvial sediment source to sink transfer at the Yellow River Delta: Quantifications, causes, and environmental impacts. J. Hydrol. 2022, 608, 127622. [Google Scholar] [CrossRef]
- Allison, M.A.; Weathers, H.D., III; Meselhe, E.A. Bottom morphology in the Song Hau distributary channel, Mekong River delta, Vietnam. Cont. Shelf Res. 2017, 147, 51–61. [Google Scholar] [CrossRef]
- Do, A.T.; Sottolichio, A.; Huybrechts, N.; Gardel, A. Circulation patterns and implication for fine sediment transport in a preserved tropical estuary: The case of the Maroni (French Guiana). Reg. Stud. Mar. Sci. 2020, 40, 101493. [Google Scholar] [CrossRef]
- Kitheka, J.U.; Obiero, M.; Nthenge, P. River discharge, sediment transport and exchange in the Tana Estuary, Kenya. Estuar. Coast. Shelf Sci. 2005, 63, 455–468. [Google Scholar] [CrossRef]
- Angamuthu, B.; Darby, S.; Nicholls, R. Impacts of natural and human drivers on the multi-decadal morphological evolution of tidally-influenced deltas. Proc. R. Soc. A 2018, 474, 20180396. [Google Scholar] [CrossRef] [PubMed]
- Wang, N.; Li, G.; Qiao, L.; Shi, J.; Dong, P.; Xu, J.; Ma, Y. Long-term evolution in the location, propagation, and magnitude of the tidal shear front off the Yellow River Mouth. Cont. Shelf Res. 2017, 137, 1–12. [Google Scholar] [CrossRef]
- Cheng, X.; Zhu, J.; Chen, S. Dynamics of the extension of the Yellow River plume in the Bohai Sea. Cont. Shelf Res. 2021, 222, 104438. [Google Scholar] [CrossRef]
- Guo, L.; van der Wegen, M.; Roelvink, D.J.; Wang, Z.B.; He, Q. Long-term, process-based morphodynamic modeling of a fluvio-deltaic system, part I: The role of river discharge. Cont. Shelf Res. 2015, 109, 95–111. [Google Scholar] [CrossRef]
- Luan, H.L.; Ding, P.X.; Wang, Z.B.; Ge, J.Z. Process-based morphodynamic modeling of the Yangtze Estuary at a decadal timescale: Controls on estuarine evolution and future trends. Geomorphology 2017, 290, 347–364. [Google Scholar] [CrossRef]
- Tu, L.X.; Thanh, V.Q.; Reyns, J.; Van, S.P.; Anh, D.T.; Dang, T.D.; Roelvink, D. Sediment transport and morphodynamical modeling on the estuaries and coastal zone of the Vietnamese Mekong Delta. Cont. Shelf Res. 2019, 186, 64–76. [Google Scholar] [CrossRef]
- Van der Wegen, M.; Jaffe, B.; Roelvink, J. Process-based, morphodynamic hindcast of decadal deposition patterns in San Pablo Bay, California, 1856–1887. J. Geophys. Res. 2011, 116, F02008. [Google Scholar] [CrossRef]
- Cooper, J. The role of extreme floods in estuary-coastal behaviour: Contrasts between river-and tide-dominated microtidal estuaries. Sediment. Geol. 2002, 150, 123–137. [Google Scholar] [CrossRef]
- Olliver, E.A.; Edmonds, D.; Shaw, J.B. Influence of floods, tides, and vegetation on sediment retention in Wax Lake Delta, Louisiana, USA. J. Geophys. Res. 2020, 125, e2019JF005316. [Google Scholar] [CrossRef]
- De Dominicis, M.; Wolf, J.; Jevrejeva, S.; Zheng, P.; Hu, Z. Future interactions between sea level rise, tides, and storm surges in the world’s largest urban area. Geophys. Res. Lett. 2020, 47, e2020GL087002. [Google Scholar] [CrossRef]
- Nicholls, R.J.; Cazenave, A. Sea-level rise and its impact on coastal zones. Science 2010, 328, 1517–1520. [Google Scholar] [CrossRef]
- Wang, Y.; Xia, J.; Deng, S.; Zhou, M.; Wang, Z.; Xu, X. Numerical simulation of bank erosion and accretion in a braided reach of the Lower Yellow river. Catena 2022, 217, 106456. [Google Scholar] [CrossRef]
- Lu, J.; Qiao, F.; Wang, X.; Wang, Y.; Teng, Y.; Xia, C. A numerical study of transport dynamics and seasonal variability of the Yellow River sediment in the Bohai and Yellow seas. Estuar. Coast. Shelf Sci. 2011, 95, 39–51. [Google Scholar] [CrossRef]
- Qiao, L.; Bao, X.; Wu, D.; Wang, X. Numerical study of generation of the tidal shear front off the Yellow River mouth. Cont. Shelf Res. 2008, 28, 1782–1790. [Google Scholar] [CrossRef]
Figure 1.
(a) Sketch map of the Yellow River basin showing geographic locations of major hydrological stations, reservoirs, and tributaries. (b) Topographic map of the Yellow River subaqueous delta. The red polygon denotes the study area.
Figure 1.
(a) Sketch map of the Yellow River basin showing geographic locations of major hydrological stations, reservoirs, and tributaries. (b) Topographic map of the Yellow River subaqueous delta. The red polygon denotes the study area.

Figure 2.
(a) Computational domain and mesh, locations of the tide gauge stations (blue points) and hydrodynamic observation sites (green triangles). (b) Topography of the Bohai Sea, the river boundary and the offshore boundary are shown. (c) Hydrodynamic observation sites are used for model validations. (d) Nine equally spaced cross-sections (black dotted lines) are used for hydrodynamic analysis; the six black dots show observation sites in July 2019.

Figure 3.
Co-tidal charts of (a) K1, (b) O1, (c) M2, and (d) S2 tide constituents from the model simulations.
Figure 3.
Co-tidal charts of (a) K1, (b) O1, (c) M2, and (d) S2 tide constituents from the model simulations.

Figure 4.
Comparison of modeled and observed water levels at eight tide gauge stations: (a) Dalian, (b) Yantai, (c) Penglai, (d) Laizhougang, (e) Dongyinggang (f) Huanghuagang, (g) Tanggu, and (h) Jingtanggang.
Figure 4.
Comparison of modeled and observed water levels at eight tide gauge stations: (a) Dalian, (b) Yantai, (c) Penglai, (d) Laizhougang, (e) Dongyinggang (f) Huanghuagang, (g) Tanggu, and (h) Jingtanggang.

Figure 5.
Comparison of modeled and observed flow velocities and directions at six observation sites.
Figure 5.
Comparison of modeled and observed flow velocities and directions at six observation sites.

Figure 6.
Q500 runoff scenario: modeled hydrodynamic results averaged over the 9 cross-sections in (a) mean water level and mean depth-averaged flow velocity, (b) mean bed shear stress and its angle. (c,d) Modeled mean and maximum bed shear stress in the YRD. (e,f) The amplitude ratio and phase difference of two constituents lead to tidal asymmetry.

Figure 7.
Q1500 runoff scenario: modeled hydrodynamic results averaged over the 9 cross-sections in (a) mean water level and mean depth-averaged flow velocity, (b) mean bed shear stress and its angle. (c,d) Modeled mean and maximum bed shear stress in the YRD. (e,f) The amplitude ratio and phase difference of two constituents lead to tidal asymmetry.

Figure 8.
Q4000 and Q7500 runoff scenarios: modeled hydrodynamic results averaged over the 9 cross-sections in (a) mean water level and mean depth-averaged flow velocity, (b) mean bed shear stress and its angle. (c,d) Modeled mean and maximum bed shear stress in the YRD. (e,f) The amplitude ratio and phase difference of two constituents lead to tidal asymmetry.

Figure 9.
Erosion and accretion patterns in the subaqueous delta during the period of 2018–2020.

Figure 10.
Tidal skewness of four runoff scenarios in the 9 cross-sections.

Figure 11.
Residual current of the four runoff scenarios during spring tide: (a) Q500, (b) Q1500, (c) Q4000, and (d) Q7500.
Figure 11.
Residual current of the four runoff scenarios during spring tide: (a) Q500, (b) Q1500, (c) Q4000, and (d) Q7500.

Figure 12.
Vertical distribution of SSC at six sites (a–f) during spring tide in July 2019.

Figure 13.
(a) Difference in mean bed shear stress, and (b) bathymetric change from July 2018 to August 2020 in the YRD. (c) The relationship between bed shear stress difference and bathymetric change. (d,e) Frequency histogram of bed shear stress difference and bathymetric change.
Figure 13.
(a) Difference in mean bed shear stress, and (b) bathymetric change from July 2018 to August 2020 in the YRD. (c) The relationship between bed shear stress difference and bathymetric change. (d,e) Frequency histogram of bed shear stress difference and bathymetric change.

Figure 14.
A straightforward conceptual model of hydrodynamics, sedimentary dynamics, and morphological variations induced by high-energy riverine flow.
Figure 14.
A straightforward conceptual model of hydrodynamics, sedimentary dynamics, and morphological variations induced by high-energy riverine flow.


Table 1.
Detailed values of modeled hydrodynamic data along 9 cross-sections under four scenarios.
| Hydrodynamic Parameters | Simulated Scenario | |||
|---|---|---|---|---|
| Q500 | Q1500 | Q4000 | Q7500 | |
| Water level (m) | 0.019 | 0.020 | 0.021 | 0.023 |
| Depth-averaged velocity (m/s) | 0.346 | 0.378 | 0.414 | 0.456 |
| Bed shear stress (N/m2) | 0.159 | 0.165 | 0.170 | 0.175 |
| Mean bed shear stress (N/m2) | 0.160 | 0.165 | 0.171 | 0.176 |
| Maximum bed shear stress (N/m2) | 0.597 | 0.620 | 0.645 | 0.673 |
Table 2.
The proportion condition of mean and maximum bed shear stress in the YRD of four runoffs.
| Mean Value (N/m2) | Maximum Value (N/m2) | ||||||||
|---|---|---|---|---|---|---|---|---|---|
| Intervals | Q500 | Q1500 | Q4000 | Q7500 | Intervals | Q500 | Q1500 | Q4000 | Q7500 |
| 0–0.06 | 7.77% | 7.41% | 7.09% | 6.80% | 0–0.15 | 4.24% | 3.78% | 3.28% | 2.71% |
| 0.06–0.12 | 26.58% | 25.97% | 25.32% | 24.86% | 0.15–0.30 | 14.37% | 13.31% | 12.07% | 10.73% |
| 0.12–0.18 | 26.10% | 25.49% | 25.05% | 24.56% | 0.30–0.45 | 16.06% | 16.25% | 16.70% | 17.12% |
| 0.18–0.24 | 13.55% | 13.65% | 13.69% | 13.78% | 0.45–0.60 | 14.39% | 13.13% | 12.03% | 12.02% |
| 0.24–0.30 | 11.43% | 10.81% | 9.86% | 9.48% | 0.60–0.75 | 16.01% | 15.86% | 16.11% | 15.96% |
| 0.30–0.36 | 8.15% | 8.15% | 8.64% | 8.54% | 0.75–0.90 | 12.93% | 13.15% | 13.26% | 12.84% |
| 0.36–0.42 | 6.41% | 6.85% | 6.29% | 5.62% | 0.90–1.05 | 7.77% | 8.12% | 7.67% | 7.51% |
| 0.42–0.48 | 0.01% | 1.67% | 4.06% | 5.19% | 1.05–1.20 | 5.72% | 5.83% | 5.68% | 5.44% |
| 0.48–0.54 | 0 | 0 | 0 | 1.17% | 1.20–1.35 | 5.41% | 5.59% | 5.89% | 5.01% |
| / | / | / | / | / | 1.35–1.50 | 2.96% | 3.90% | 4.87% | 5.71% |
| / | / | / | / | / | 1.50–1.65 | 0.14% | 1.08% | 2.23% | 3.61% |
| / | / | / | / | / | 1.65–1.80 | 0 | 0 | 0.21% | 1.31% |
| / | / | / | / | / | 1.80–1.95 | 0 | 0 | 0 | 0.03% |
Table 3.
Quantification of erosion-accretion areas and volumes during extreme riverine floods.
| July 2018–August 2020 | ||
|---|---|---|
| Erosion | Area (%) | 37.5 |
| Volume (108 m3) | −0.20 | |
| Accretion | Area (%) | 62.5 |
| Volume (108 m3) | 0.06 | |
| Net change | Volume (108 m3) | −0.14 |
| Rate (108 m3/year) | −0.07 |
Note: According to He et al. [53], the bulk density of sediment is 1.533 t/m3.
Disclaimer/Publisher’s Note: The statements, opinions and data contained in all publications are solely those of the individual author(s) and contributor(s) and not of MDPI and/or the editor(s). MDPI and/or the editor(s) disclaim responsibility for any injury to people or property resulting from any ideas, methods, instructions or products referred to in the content. |
© 2023 by the authors. Licensee MDPI, Basel, Switzerland. This article is an open access article distributed under the terms and conditions of the Creative Commons Attribution (CC BY) license (https://creativecommons.org/licenses/by/4.0/).
Share and Cite
MDPI and ACS Style
Fu, Y.; Bellerby, R.G.J.; Ji, H.; Chen, S.; Fan, Y.; Li, P. Impacts of Riverine Floods on Morphodynamics in the Yellow River Delta. Water 2023, 15, 1568. https://doi.org/10.3390/w15081568
AMA Style
Fu Y, Bellerby RGJ, Ji H, Chen S, Fan Y, Li P. Impacts of Riverine Floods on Morphodynamics in the Yellow River Delta. Water. 2023; 15(8):1568. https://doi.org/10.3390/w15081568
Chicago/Turabian StyleFu, Yutao, Richard G. J. Bellerby, Hongyu Ji, Shenliang Chen, Yaoshen Fan, and Peng Li. 2023. "Impacts of Riverine Floods on Morphodynamics in the Yellow River Delta" Water 15, no. 8: 1568. https://doi.org/10.3390/w15081568
Note that from the first issue of 2016, this journal uses article numbers instead of page numbers. See further details here.