
Municipal Sewage Treatment Technology: A2/O-VMBR Integrated Technology for Municipal Treatment and Improved Pollutant Removal
1
College of Environmental Engineering, Wuhan Textile University, Wuhan 430200, China
2
Research Center for Clean Production of Textile Dyeing and Printing, Ministry of Education, Wuhan Textile University, Wuhan 430073, China
*
Author to whom correspondence should be addressed.
Water 2023, 15(8), 1574; https://doi.org/10.3390/w15081574
Submission received: 6 March 2023
/
Revised: 11 April 2023
/
Accepted: 14 April 2023
/
Published: 18 April 2023
(This article belongs to the Special Issue Advances in Food and Textile Industry Wastewater Treatment)
Abstract
:To modernize wastewater treatment plants, a pilot-scale anaerobic/anoxic/oxic-vibrating membrane bioreactor (A2/O-VMBR) was developed and successfully operated. Despite a low C/N ratio, the A2/O-VMBR achieved removal rates of 61.10%, 93.77%, 72.86%, and 54.75% for COD, TN, TP, and NH3-N, respectively. The maximum and extremity transmembrane pressures were 45 kPa, and 80 kPa, respectively, with no sludge bulking observed. The VMBR saved over 96–98% of energy compared to traditional MBR plants, making it a better option for municipal wastewater treatment. High-throughput sequencing analysis revealed identical bacterial population structures in samples obtained from the treatment units, with genera having nitrifying, denitrifying, hydrolyzing, and glycogen-accumulating activities, which allowed for nitrogen removal. The key functional microorganisms responsible for nitrification–denitrification were species belonging to the genera FCPU426, Fusobacteria, Planctomycetes, Verrucomicrobia, and Epsilonbacteraeota. The integrated experimental system produced favorable results in improving wastewater quality, highlighting the usability of the A2/O-VMBR technology. Therefore, this technique holds potential for further investigation into the context of wastewater treatment and recovery.
1. Introduction
As economies develop, the environment is being irresistibly degraded, leading to more stringent sewage discharge standards at wastewater treatment plants (WWTPs) to prevent environmental pollution [1,2,3]. Membrane bioreactors (MBRs) have emerged as a superior technology to the conventional activated sludge (CAS) process due to their high pollutant removal rate, compact footprint, high effluent quality, flexible operation, minimal sludge formation, and high biomass concentration [4,5,6,7]. In fact, MBRs are capable of removing 30–67% total nitrogen (TN) and 12–59% total phosphorus (TP) from domestic wastewater [8,9,10]. MBRs are often paired with one or more additional treatment processes, such as anoxic or anaerobic/anoxic processes, to compensate for low nitrogen and phosphate removal rates [11]. However, membrane fouling remains a significant barrier to the long-term operation of MBRs [12,13,14,15].
Due to the widespread usage of MBRs for wastewater treatment, there is growing interest in developing energy-saving solutions to reduce membrane fouling. The vibratory shear strengthening treatment membrane assembly was initially created by the New Logic Research company in 1992 as part of Armando’s dynamic separation idea [16]. High membrane shear rates have long been thought to be one of the most effective ways to increase permeability by reducing both concentration polarization and cake build-up [17,18,19]. Low et al. [20] demonstrated that membrane vibration could be used for economical and efficient wastewater treatment and water recovery. Recently, reciprocating membrane vibration has also been shown to be a more energy-efficient technique for MBR applications, as its specific energy can be fully applied to a rotary motor to generate shear stress [21,22]. These studies suggest that membrane vibration can improve in situ fouling control and critical flux enhancement with less energy consumption.
While previous studies on vibrating MBRs (VMBRs) have primarily focused on the system’s critical flux, changes in the transmembrane pressure (TMP) and energy requirements, and the performance and microbial community of the new bioreactor in wastewater treatment, especially for actual wastewater, remain unclear. Achieving high-quality wastewater treatment in WWTPs requires a stable microbial population with different metabolic activities. Moreover, different design approaches can impact the organization of the microbial community [23,24]. The use of oxic and anoxic ponds in anaerobic/anoxic/oxic (A2/O) WWTPs has been shown to be beneficial for providing the optimum growth conditions for nitrifying and denitrifying bacteria, resulting in effective nitrogen removal [25]. Therefore, understanding the microbial population and nutrient metabolism during the process is crucial in justifying the integrated equipment used to treat urban sewage from a microorganism perspective.
Moreover, research on VMBR systems has been limited to polymer membrane components. As a more durable, hydrophilic, and pollution-resistant membrane material, ceramic membranes with a novel vibrating configuration may provide better membrane fouling control for long-term wastewater treatment [26,27]. Wang Chuansheng et al. studied three shear rates of 120, 80, and 40 RPM and found that the removal rates of TOC, COD, and NH3-N in the three stages exceeded 78.35%, 89.89%, and 99.9%, respectively, delaying the initial increase in TMP and effectively controlling membrane fouling [21]. Additionally, VMBR reduced energy consumption by 51.7% to 78.5% and better controlled membrane pollution compared to ASMBR. Nonetheless, VMBR systems for treating actual wastewater are still in the laboratory phase.
To address this gap in research, this study was conducted at Origin Water Technology Company., Ltd. (Beijing, China) to comprehensively analyze the performance of a pilot-scale vibration MBR process (A2/O-VMBR) in treating actual wastewater during long-term operation. The study used effluent from the Longwangzui municipal wastewater treatment plant (Wuhan, China), and evaluated the system’s wastewater treatment capacity through the removal efficiency of pollutants (COD, TN, TP, NH3-N, and BOD). In addition, high-throughput sequencing was employed to evaluate the microbial community in each pool of the VMBR process unit. In summary, the study aimed to achieve four main objectives: (1) Utilize the A2/O-VMBR pilot scale method to treat municipal wastewater and tailwater, and monitor the treatment impact; (2) investigate the COD, TN, TP, and NH3-N therapy mechanisms; (3) demonstrate two advantages of VMBR technology: high nitrogen removal capacity and low energy usage during operation; and (4) research biofilm properties and functional microorganisms in the VMBR system.
2. Materials and Methods
2.1. Experimental Equipment and Processes
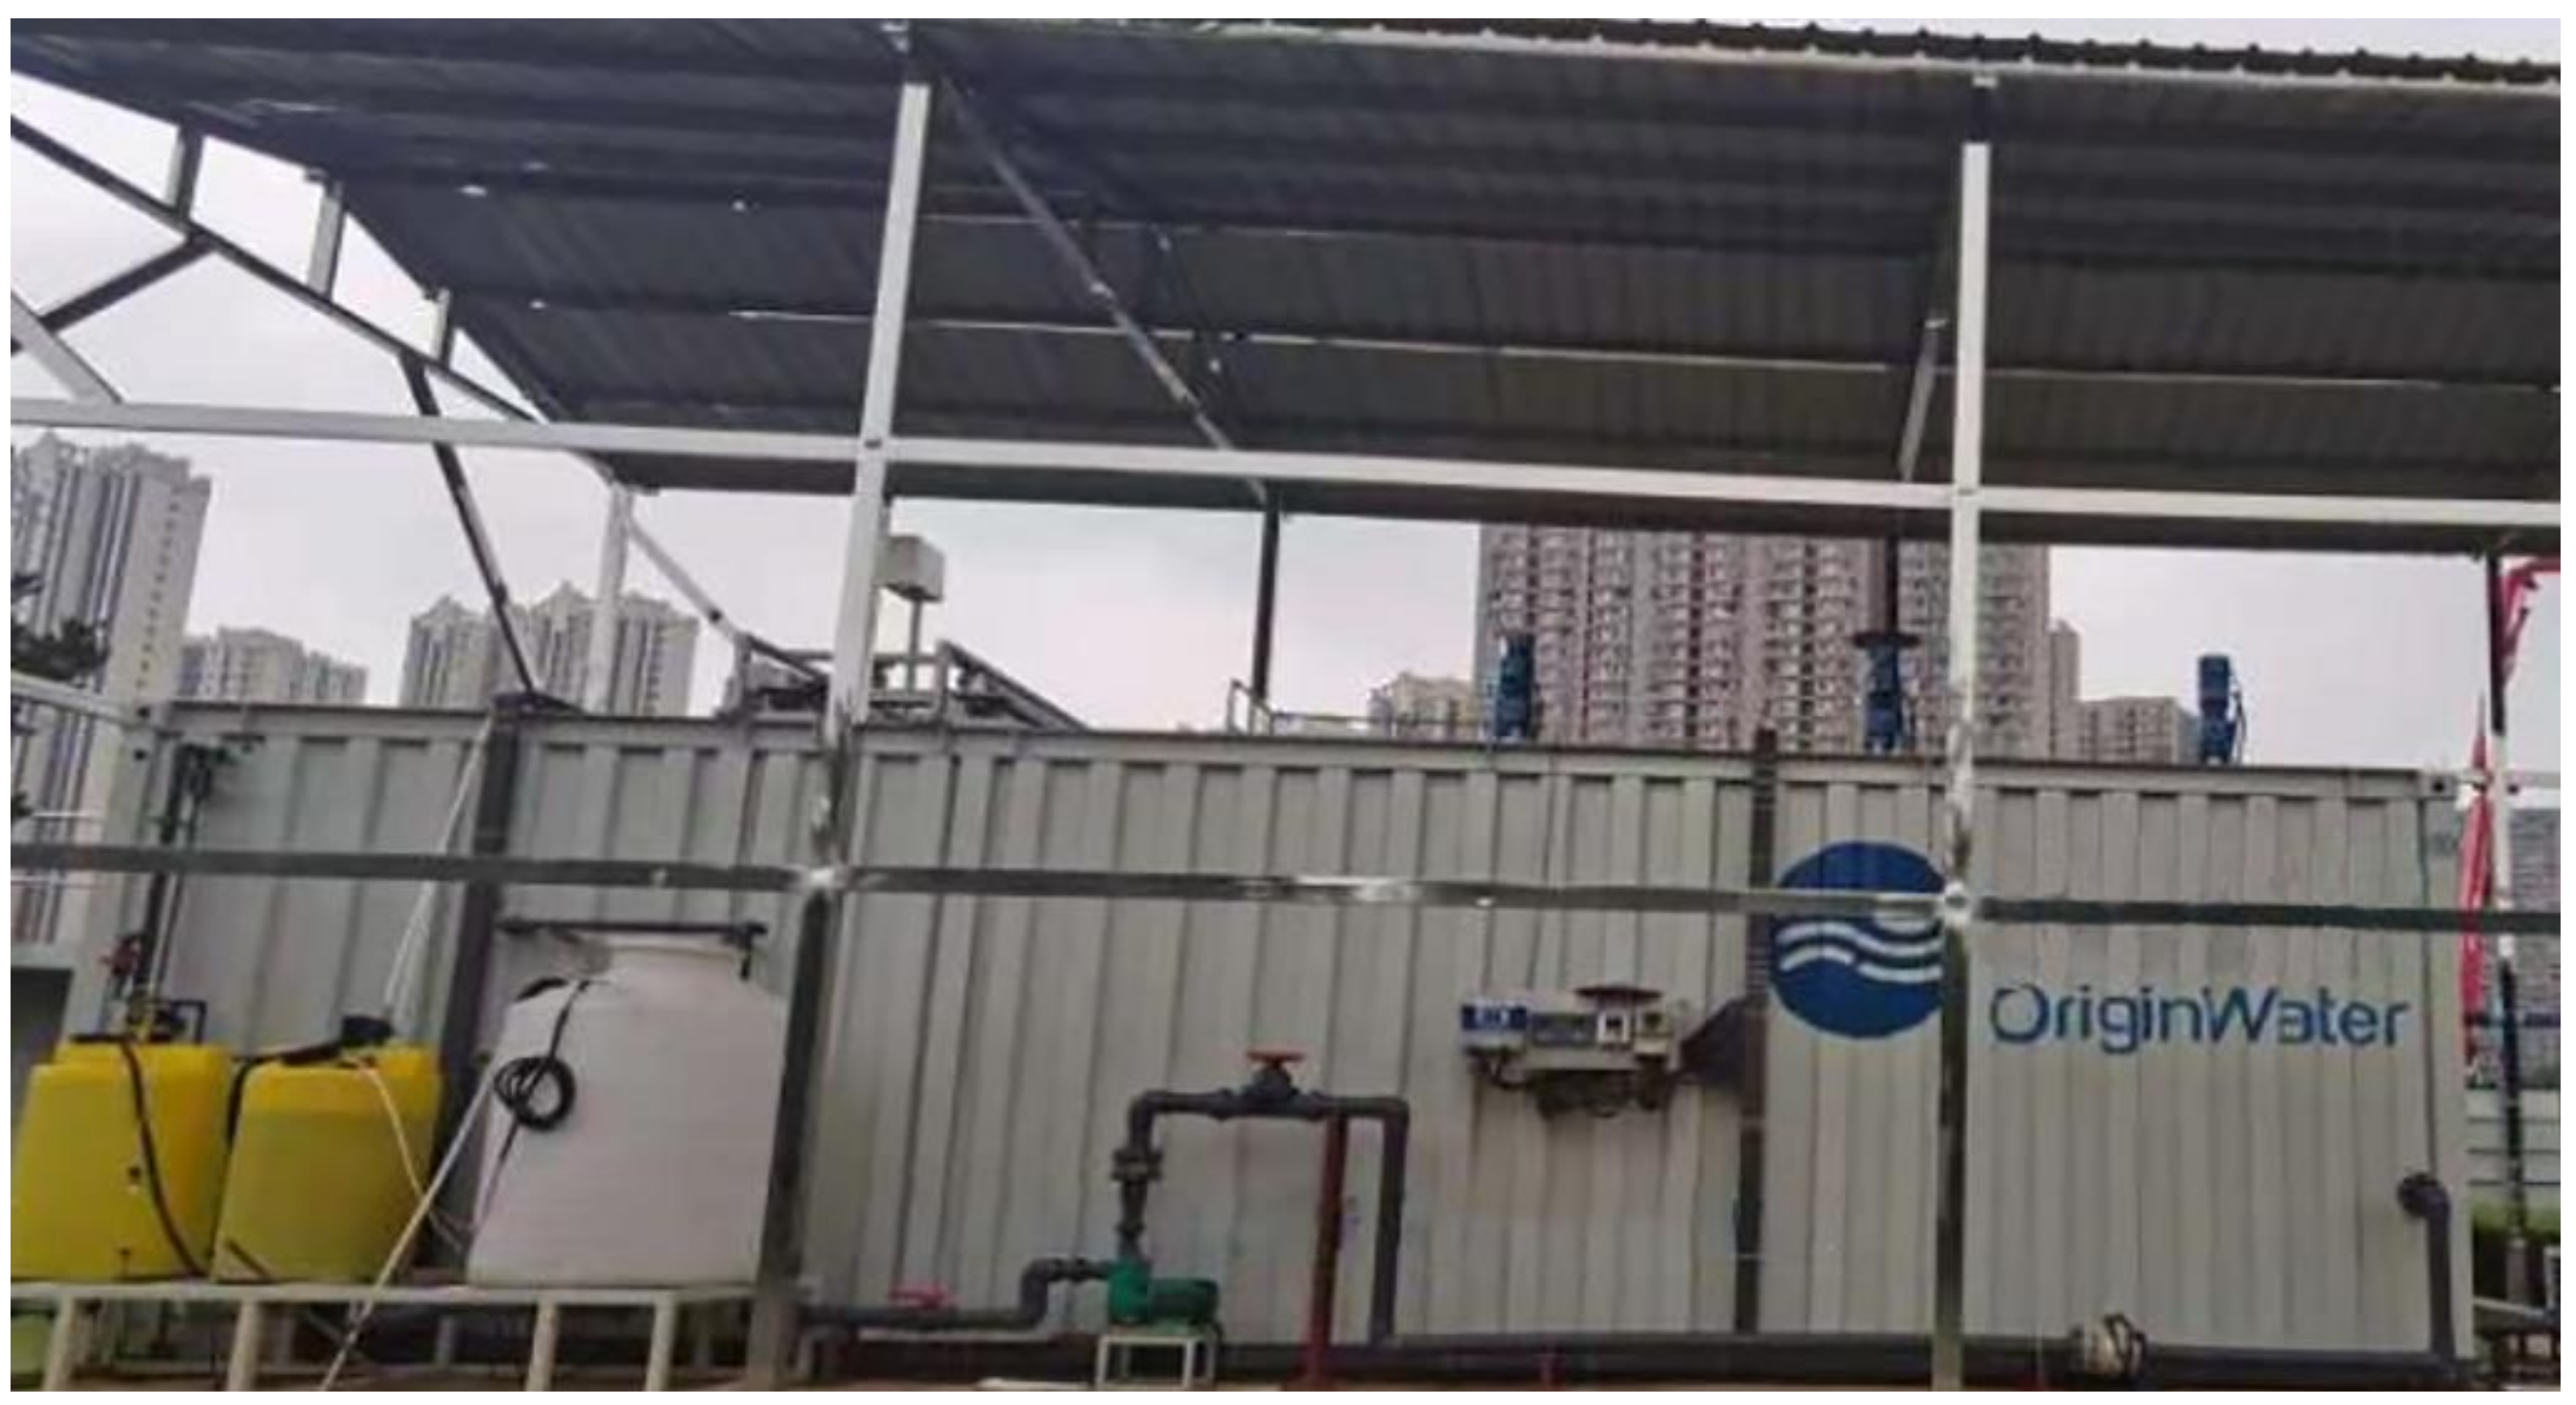
Figure 1 shows the device in WWTPs. The experiment was divided into two stages. The first stage involved the treatment of sewage plant tailwater using A2/O-VMBR (Figure 2) over a period of 69 days from October to December 2021. The second stage involved the direct treatment of municipal sewage using a new technology (Figure 3) and lasted for 59 days from May to July 2022.
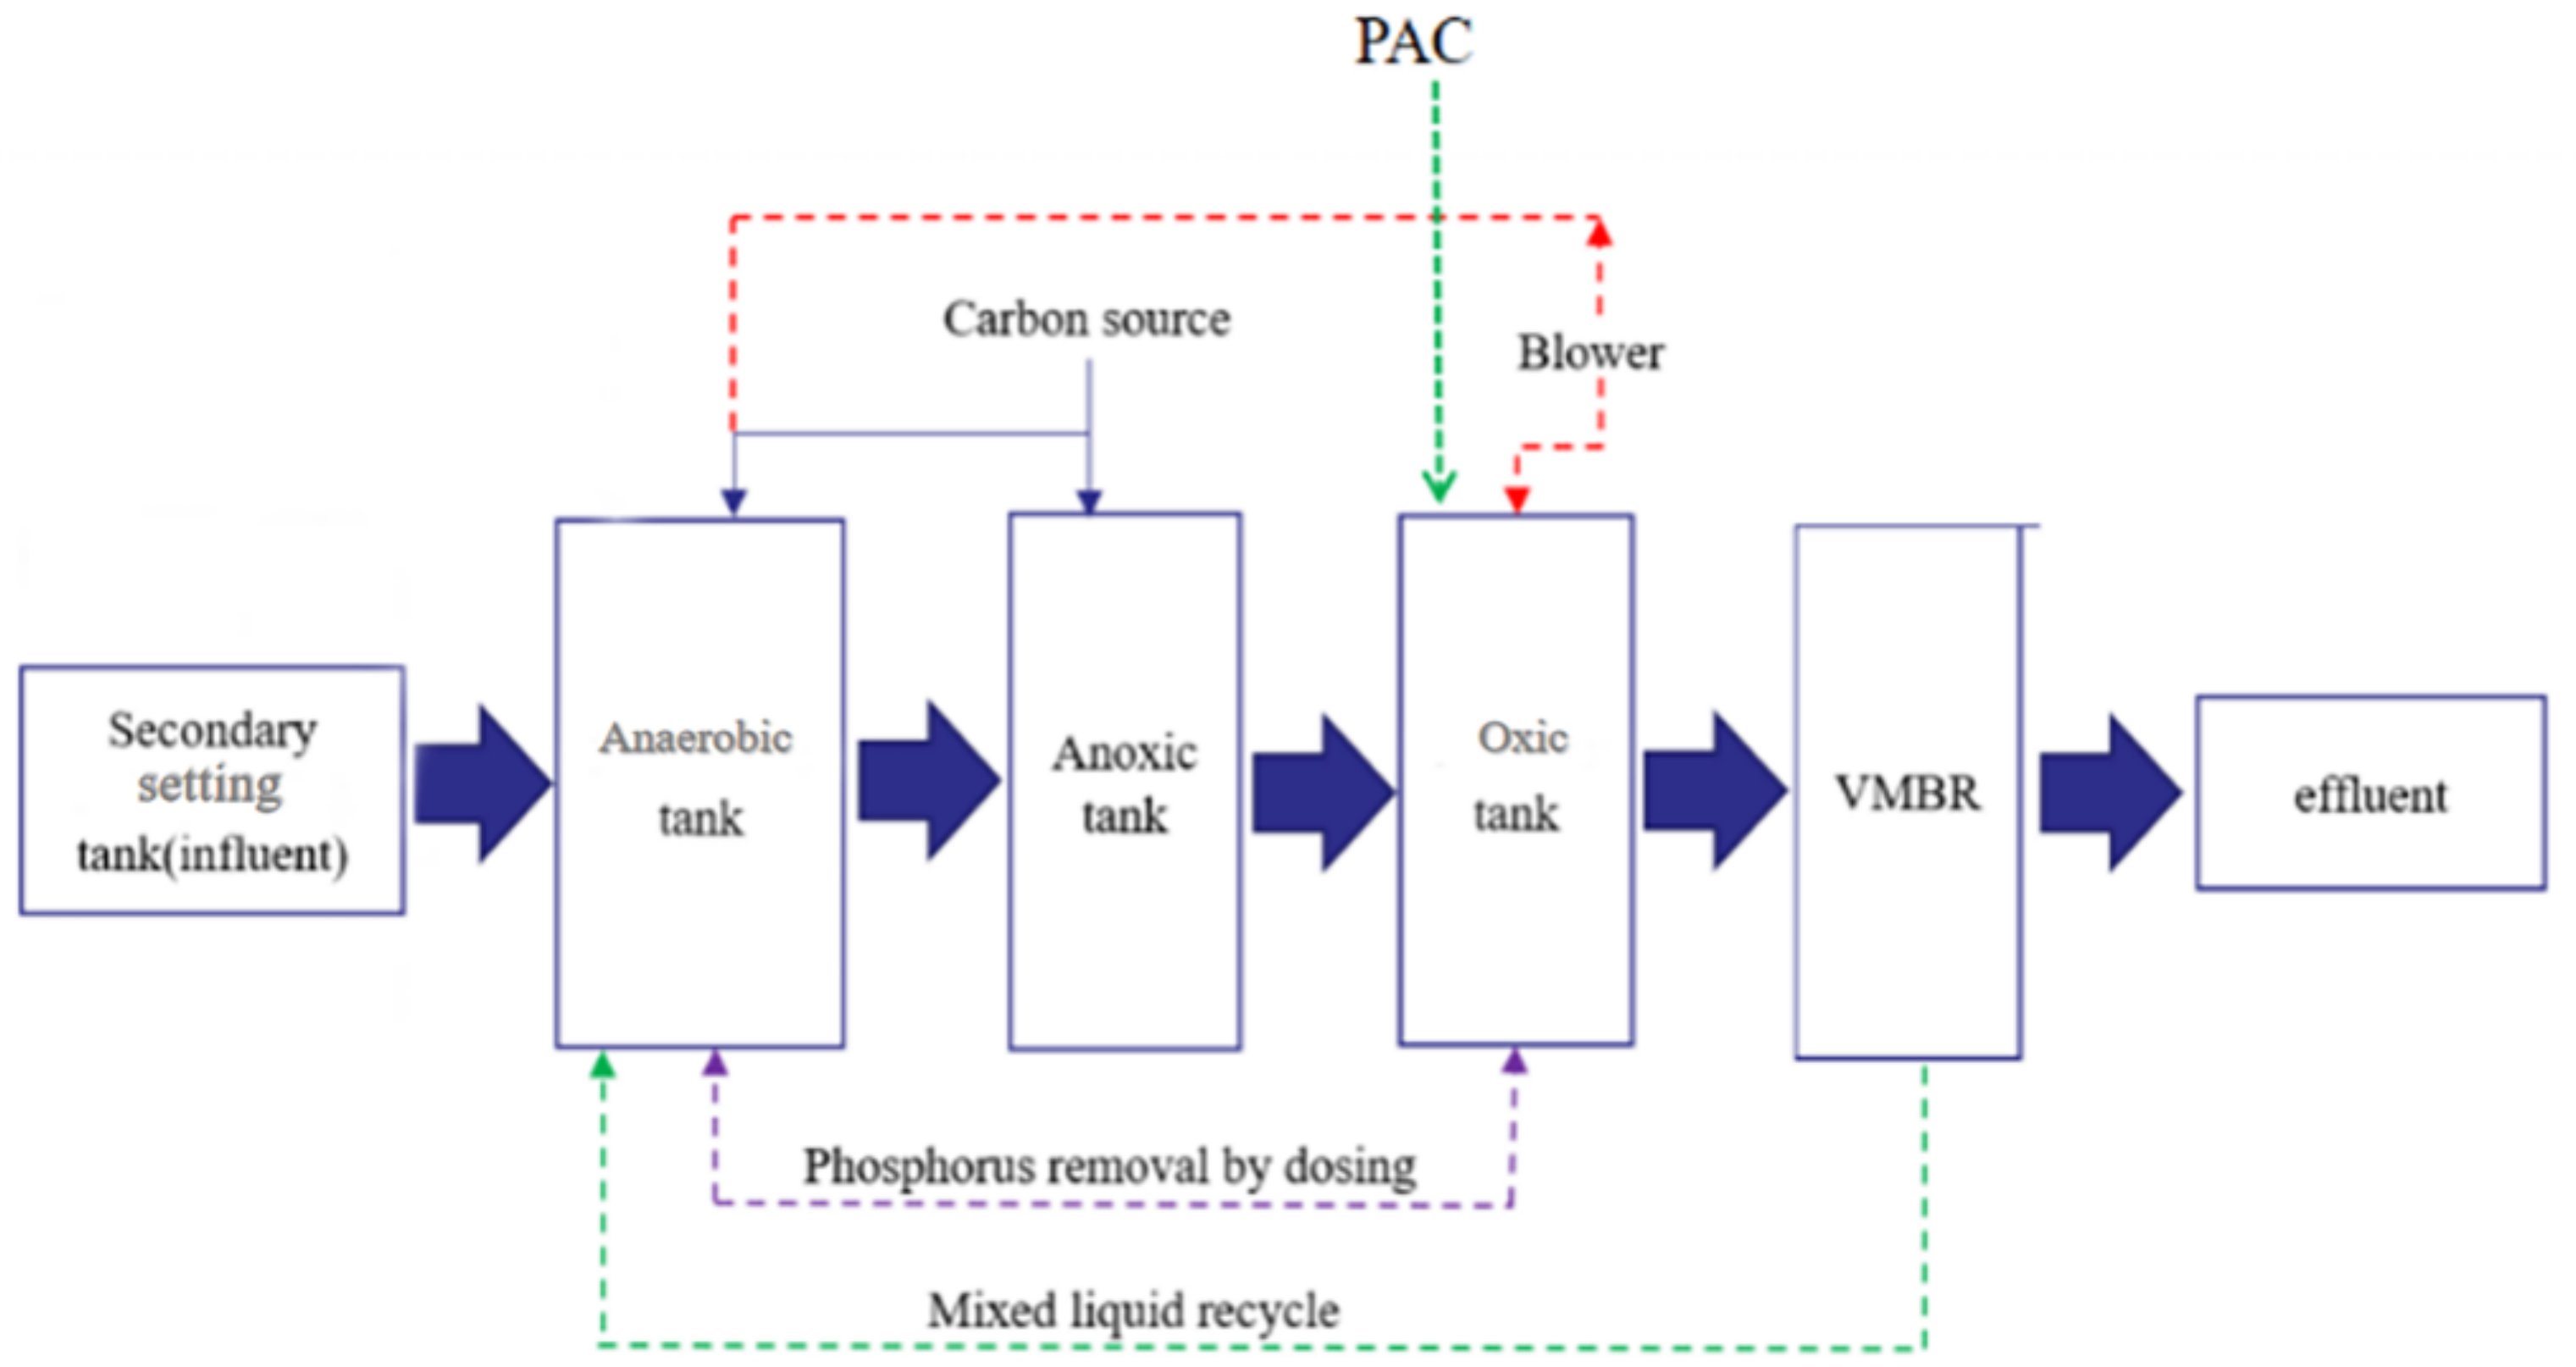
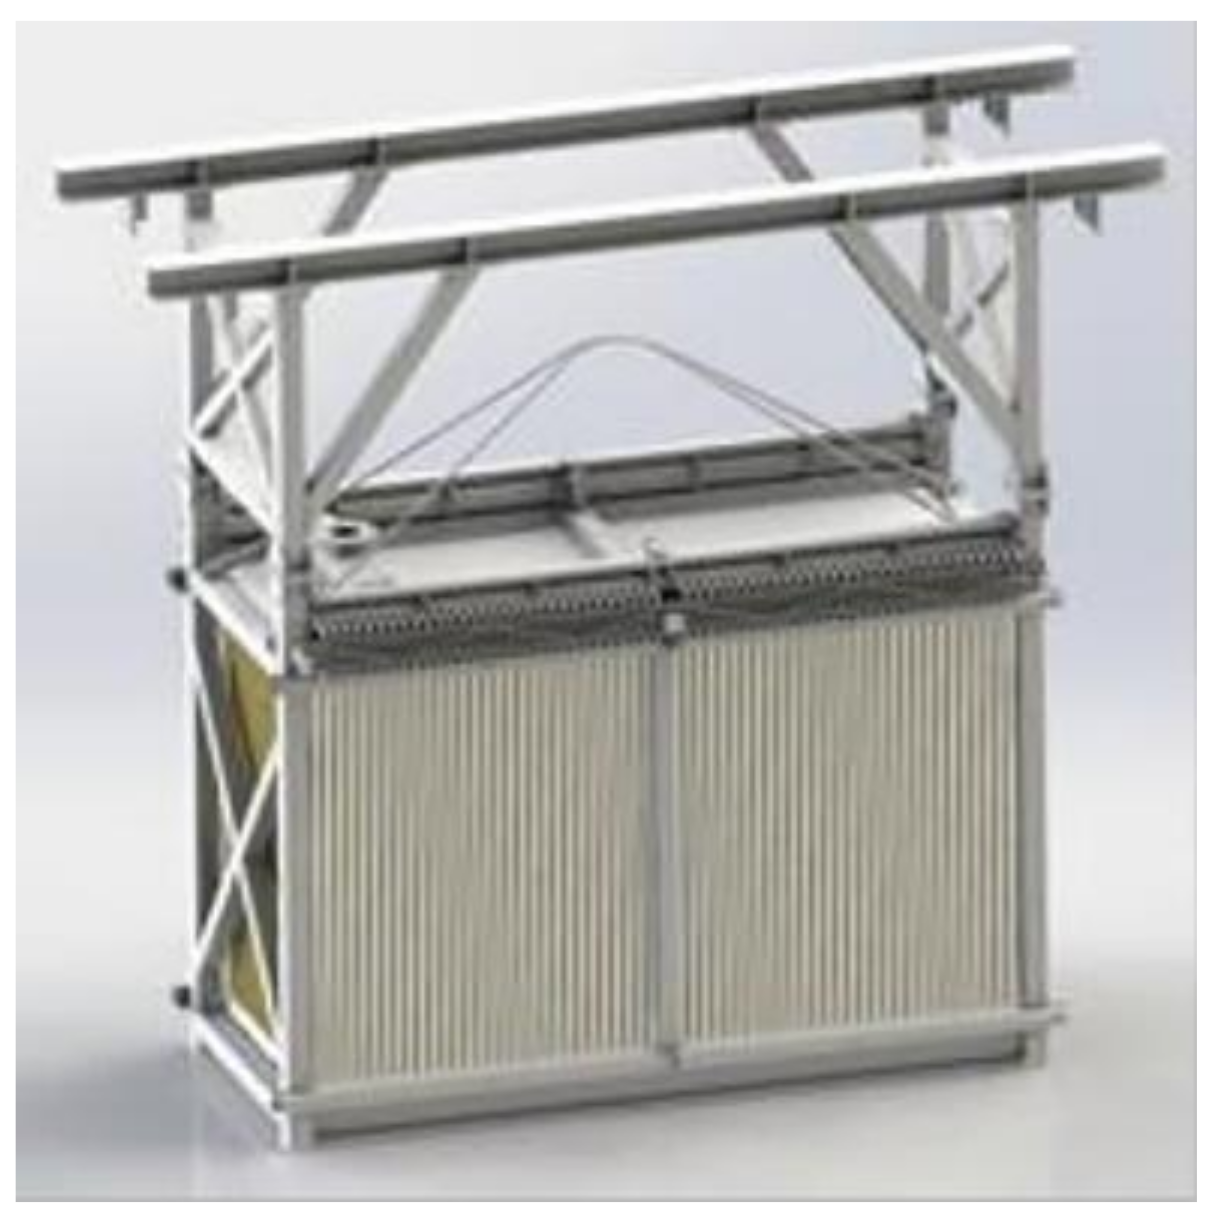
During the first stage, the pilot-scale technical process was made up of VMBR units with a treatment capacity of 100 m3/d. Figure 2 illustrates the process route, which combines the A2/O and VMBR processes, with a treatment scale of 100 t/d for the biochemical unit. The anaerobic, anoxic, and oxic tanks’ hydraulic retention times (HRT) were 2 h, 5 h, and 1 h, respectively, with a mixed liquor suspended solids (MLSS) concentration range of 7–12 g/L, and an available water depth of 2.2 m. Figure 3 depicts the new technology process design, which has a scale of 200,000 m3/d, and a minimum inlet water temperature of 12 °C. The MLSS in the membrane tank was 12 g/L, while in the anaerobic, pre-anoxic, oxic, post-anoxic and post-oxic tanks it was 8 g/L. The nitrification reflux ratio was 400%, and the overall HRT was 16.1 h (the anaerobic tank’s HRT was 1.5 h, the anoxic pool’s HRT was 2.5 h, the oxic pool’s HRT was 6 h, the post-anoxic pool’s HRT was 4.6 h, the post-oxic pool’s HRT was 0.5 h, and the membrane pool’s HRT was 1 h). The nitrification rate was 0.017 kgNH3-N/(kgMLSS·d), the anoxic pool’s denitrification rate was 0.016 kgNO3-N/(kgMLSS·d), and the post-anoxic pool’s denitrification rate was 0.007 kgNO3-N/(kgMLSS·d). The typical membrane flow range was 18~20 L/m2h (LMH), and there was 1738.4 kg/d of leftover sediment present. The membrane module of the VMBR is depicted in Figure 4.
The VMBR unit utilized a PVDF hollow-fiber curtain membrane module with a transmission power of 0.75–1.1 kW. The inner and outer diameters of the membrane filament were 1 mm and 2 mm, respectively, with an average pore diameter of 0.1 m and a fracture stress exceeding 200 N. The water production had a turbidity of 1 NTU and was produced with a vibration frequency of 0.5–0.8 Hz and an amplitude of 40~60 mm. The average design flux was 18~22 LMH, while the suggested sludge concentration was 8~12 g/L. The recommended working temperature was 10~35 °C, and the recommended working pH range was 6~9. The highest transmembrane pressure differential was 45 kPa, and the limit was 80 kPa. Chemical cleansing was perfomed weekly using 1000 mg/L sodium chloride. The pilot-scale equipment operated from early July 2021 to 31 December 2021 and was controlled by a PLC electrical equipment control system. Data was collected and recorded at 4 p.m. under stable conditions while operating the WWTPs and the experimental setup.
2.2. Analytical Methods
The influent was continuously drawn from the secondary settling tank at a fixed flow rate of 5 m3/h and a carbon supply to water ratio of 1:5. Daily monitoring of COD, TP, TN, and NH3-N concentrations was conducted in each tank (influent, anaerobic tank, anoxic tank, oxic tank, VMBR, and effluent), and collected samples were tested for TN, BOD5, COD, TP, and temperature (T) using the standard methods of the National Environmental Bureau (2002). The dissolved oxygen (DO) was also quantified using a polarographic DO probe (Lei ci, China). On December 24, three duplicate samples were collected from each tank, and they were stored in polyethylene plastic bottles and insulated foam boxes with dry ice before being sent to Paisenore Biotechnology Company for analysis. The sequencing category employed was composition spectrum analysis, using the V4-V5 regions of bacterial 16S Rrna genes, amplified with primers (F:ACTCCTACGGGAGGCAGCA and R:TCGGACTACHVGGGTWTCTAAT). The original sequence data was then generated and low-quality sequences were homogenized to facilitate evaluation and comparison at the same sequencing depth. Quantitative insights into microbial ecology (QIIME) software was employed to analyze the sequences, and the Usearch algorithm was used to separate the operational categorization units (OTUs) with a 97% similarity. Each sample’s alpha diversity, including the Shannon diversity index, rarefaction curves, Chao1 species richness estimate, and diversity coverage, was calculated in MOTHUR. The Silva_132 database was used to annotate the specific OTU species, and the diversity and community composition of the taxonomic information was analyzed using the divisive amplicon denoising algorithm 2 (DADA2) method.
3. Results
3.1. Removal Performance and Mechanism of the A2/O-VMBR
3.1.1. COD Removal Performance and Mechanism
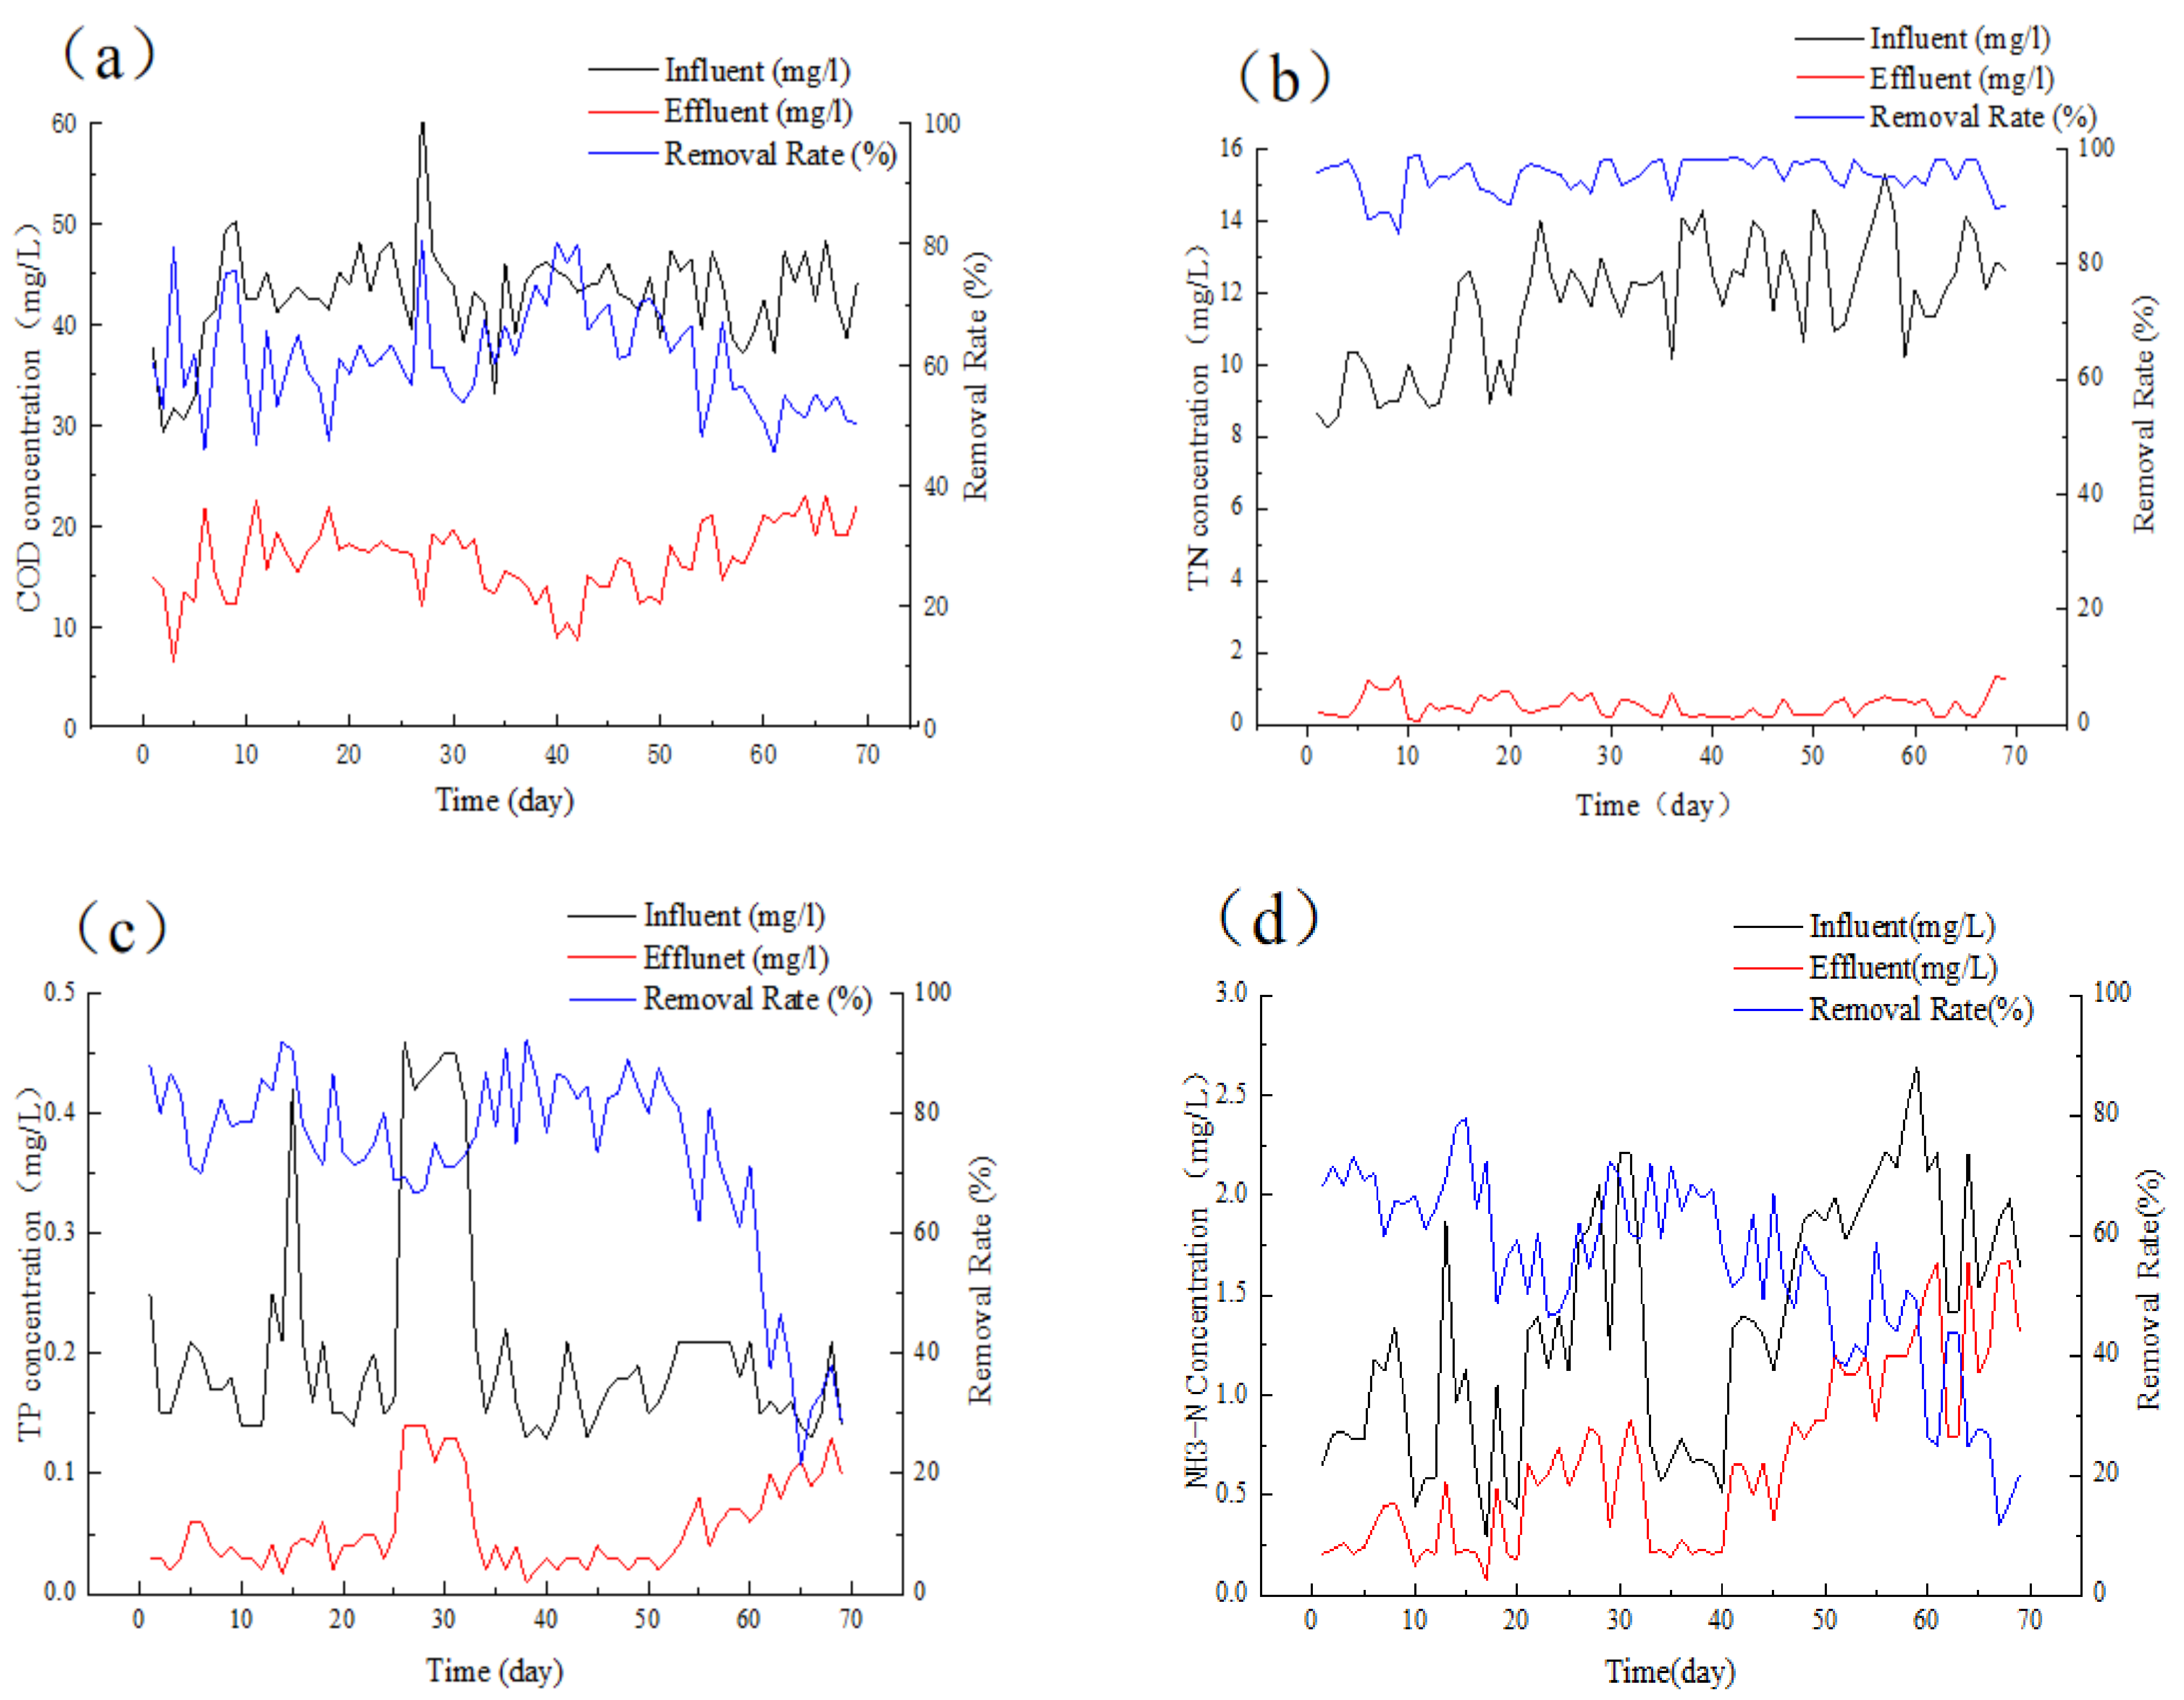
Table 1 depicts the removal of COD, TN, TP, NH3-N, BOD, and DO, and removal rate of every tank. Figure 5 depicts the superior COD elimination performance of the A2/O-VMBR system. The COD concentration of the effluent remained consistently below 25 mg/L, conforming to Grade IV surface water (GB3838-2002) [28] standards. The influent COD concentration ranged from 29.34 to 61.63 mg/L, and the COD removal rate exhibited significant variations, especially when the water temperature approached 16 °C during the final 10 days of operation. During this period, the removal rate declined from 60% to around 45%. However, the reactor maintained a high COD concentration removal efficiency throughout its operation, with rates of 16.3%, 23.13%, 18.9%, and 23.35% in the anaerobic tank, anoxic tank, oxic tank, and VMBR, respectively. The observed differences were not significant, with a fluctuation range of approximately 5%. These results suggest that the effluent water quality of the system remained stable during its operation, indicating a stable bacterial community within the reactor [29,30].
3.1.2. Total Nitrogen Removal Performance and Mechanism
Figure 5 depicts the TN elimination performance of the A2/O-VMBR system. Throughout the typical operation period, the effluent’s TN content was generally below 1.5 mg/L (the Grade IV level of GB3838-2002) [28], with influent ranging between 8.24 and 15.32 mg/L (Figure 5). The elimination efficiency of TN ranged from 85.28% to 99.02% in most cases, and further discussion of TN removal is provided in Section 3.3.2.
Anoxic and oxic tanks had little impact on TN removal. This was likely due to the low COD concentration of the effluent, and the competition between denitrifying bacteria in the biofilm for a restricted carbon supply [31,32,33]. Denitrifying bacteria’s growth was relatively sluggish due to the restricted carbon source content, and the denitrification effect was also relatively gradual. The anoxic phase resulted from the reflux of nitrification liquid, which inhibited denitrifying microorganisms to some extent and influenced denitrification [34,35]. The oxic tank, on the other hand, did not contribute to TN removal since only the existing form of nitrogen was transformed during the nitrification reaction in the oxic stage. During the second stage, bacteria assimilation was primarily responsible for TN removal, and the removal effect was poor.
The removal of TN varied substantially during the first 10 days of system operation, indicating that the bacterial population of the system was not stable, while the removal rate was rather stable after 10 days. However, the removal rate of TN decreased in the final 5 days of system operation when the temperature decreased to 16 °C. Thus, a low temperature can be assumed to have affected the removal of TN in the system [36,37,38,39]. Nonetheless, the effluent’s TN concentration remained below 1.5 mg/L, confirming the device’s strong nitrogen removal capability.
3.1.3. Total Phosphorous Removal Performance and Mechanism
Figure 5 indicates the effective removal of TP using the A2/O method. During normal operation, the TP concentration of the effluent varied by around 0.05 mg/L under influent conditions of 0.13–0.43 mg/L, which was below the Grade IV surface water of 0.1 mg/L (GB3838-2002) [28]. The system’s TP removal efficiency was 72%, slightly lower than the anticipated 80%. As demonstrated in the figure, the A2/O-VMBR system’s impact on phosphorus removal was significant 10 days after operation, with The TP concentration in the effluent exceeding the Grade IV standard by 0.1 mg/L. TP removal mainly occurred via phosphorus compound adsorption by sludge particles, viscous substances such as EPS, and microbial absorption [40]. To aid in TP and phosphorus removal, polyaluminum chloride (PAC) was added to the aerobic tank by dosing.
The average TP concentrations of the effluent, anaerobic tank, anoxic tank, oxic tank, and VMBR were 0.2, 0.26, 0.224, 0.23, and 0.05, respectively. Thus, A2/O had essentially minimal influence on TP removal, and TP removal was primarily handled by the VMBR.
3.1.4. Removal Performance and Mechanism of NH3-N
The A2/O-VMBR system was also efficient in removing NH3-N (Figure 5). The influent water had a concentration of 0.29 to 2.64 mg/L during normal operation, while the effluent NH3-N concentration was typically less than 1 mg/L. However, after 20 days of operation, the NH3-N content in the effluent increased to 1.5 mg/L or higher.
Based on the large difference in NH3-N concentration between the VMBR supernatant and effluent shown in Figure 5, it can be inferred that NH3-N removal primarily occurred in the VMBR. The membrane’s role was to retain nitrifying bacteria, which have a lengthy growth cycle, in the bioreactor, thereby improving nitrification removal efficiency. Unfortunately, the nitrifying bacteria were unable to absorb or transform ammonia nitrogen at a water temperature of 16 °C after 20 days of operation. Nitrifying bacteria have stringent growth needs and a long growth cycle; hence, a decrease in their numbers may impede the rate of ammonia nitrogen removal [41,42,43,44].
3.1.5. Removal Performance and Mechanism of BOD
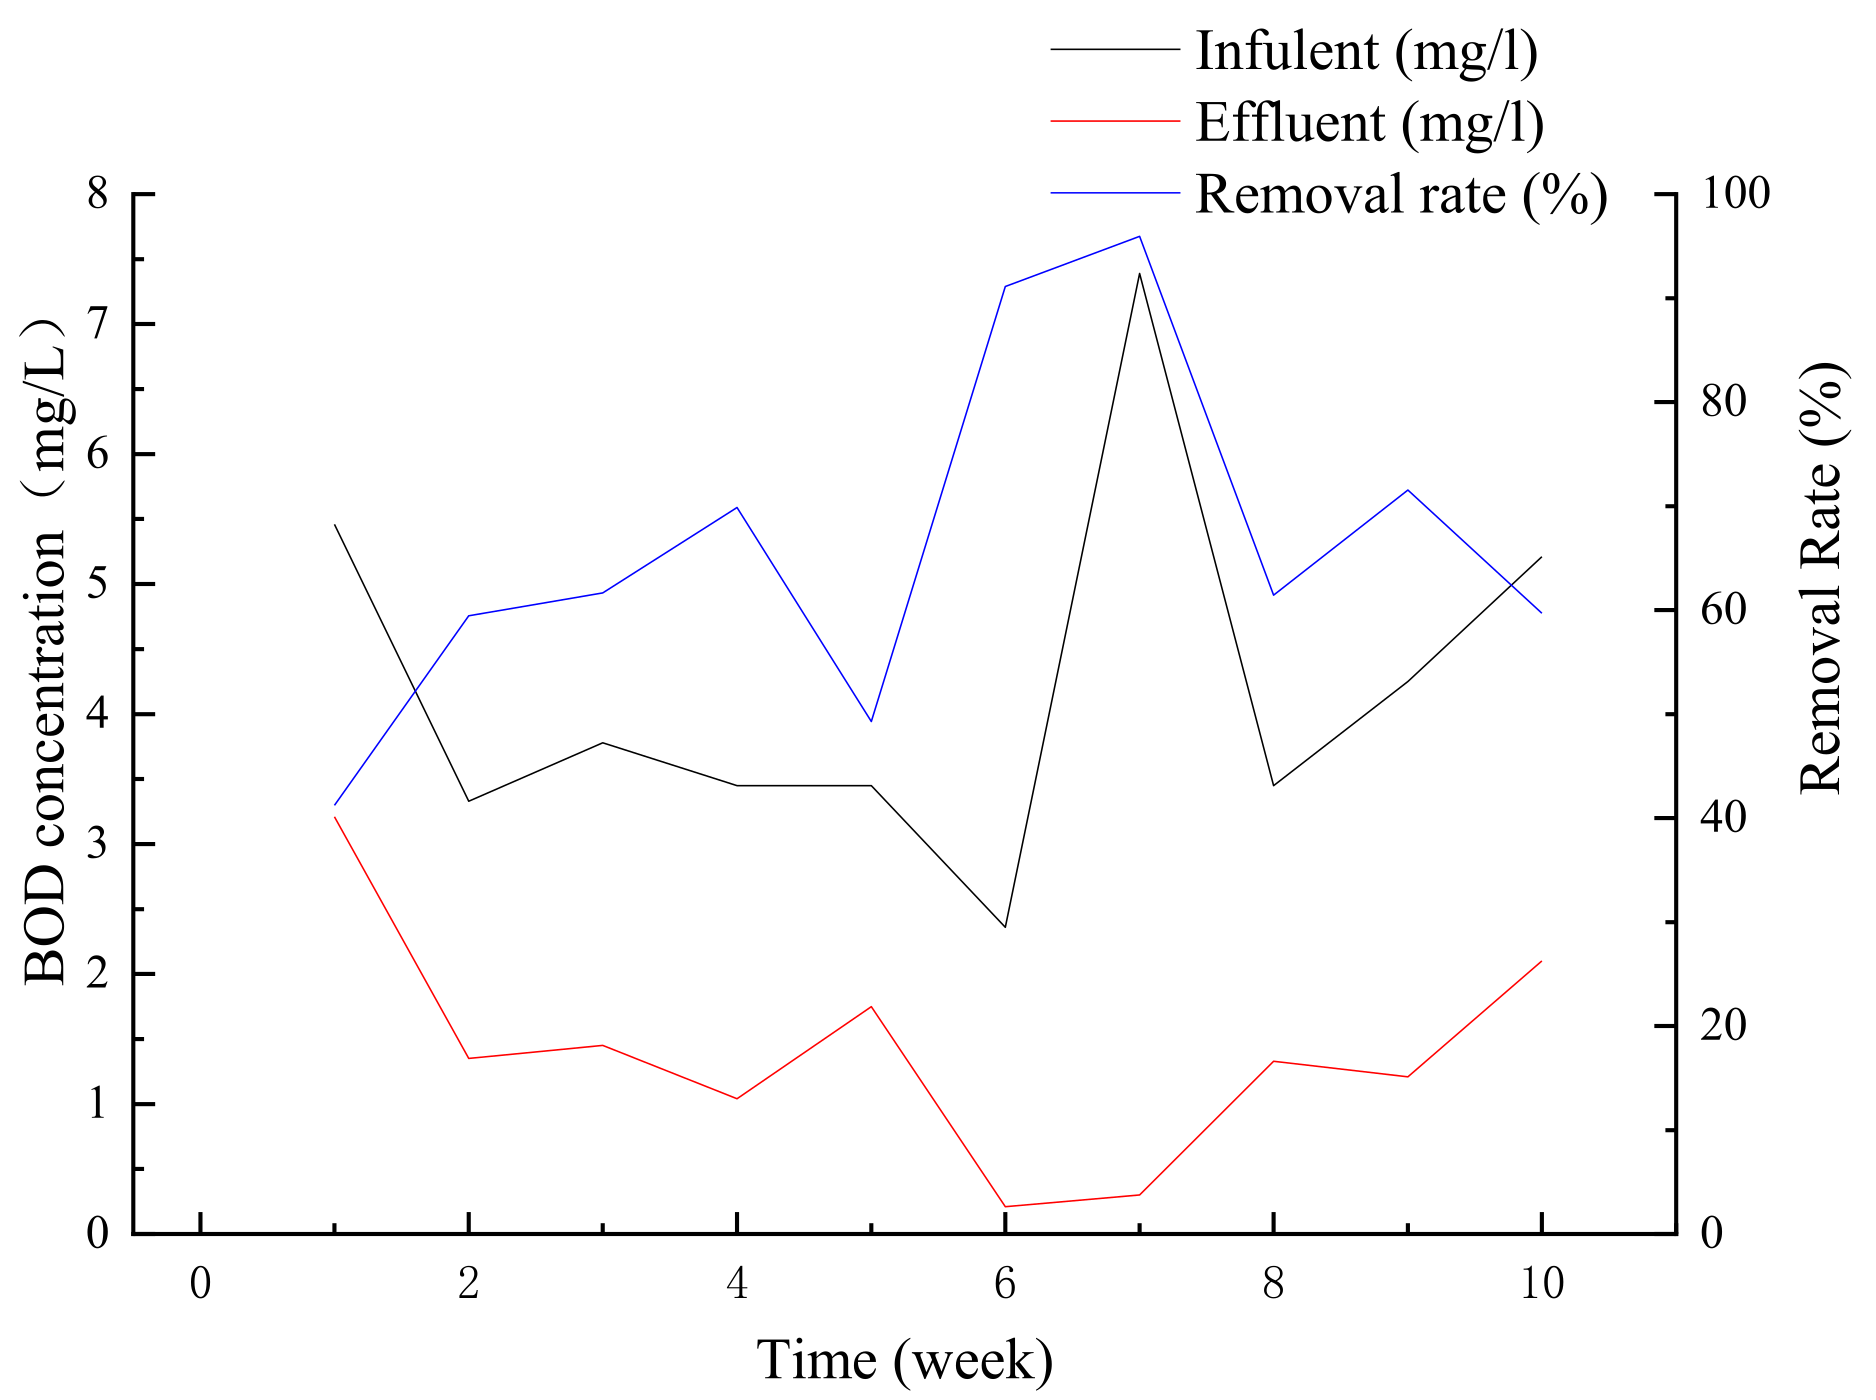
Figure 6 illustrates the BOD removal efficiency of the A2/O-VMBR system. The influent water BOD value ranged between 2.36 and 7.39 mg/L, meeting the I-A standard (GB3838-2002) [28], while the effluent BOD concentration ranged between 0.21 and 3.21 mg/L. As evident from the data, the system exhibited commendable BOD removal performance. The water feed to the system was tailwater, having beentreated in the secondary clarifier.
The bacterial community in the activated sludge of the A2/O biological nitrifying phosphorus removal system was mostly composed of nitrifying bacteria and phosphorus-accumulating bacteria [45]. During the aerobic stage of biological nitrification, nitrifying bacteria transformed nitrogen and ammonia nitrogen into nitrate. In the anaerobic phase, phosphorus-accumulating bacteria released phosphorus and consumed easily degradable organic matter, such as low-grade fatty acids. On the other hand, these bacteria over-absorbed phosphorus in the aerobic stage and eliminated it by discharging excessive sludge. Both types of bacteria contributed to BOD removal. Upon entering the A2/O-VMBR system, the BOD concentration steadily dropped due to the adsorption of phosphorus-accumulating bacteria and bio-decomposition of aerobic segments.
3.2. Removal Performance and Mechanism of the New Technology
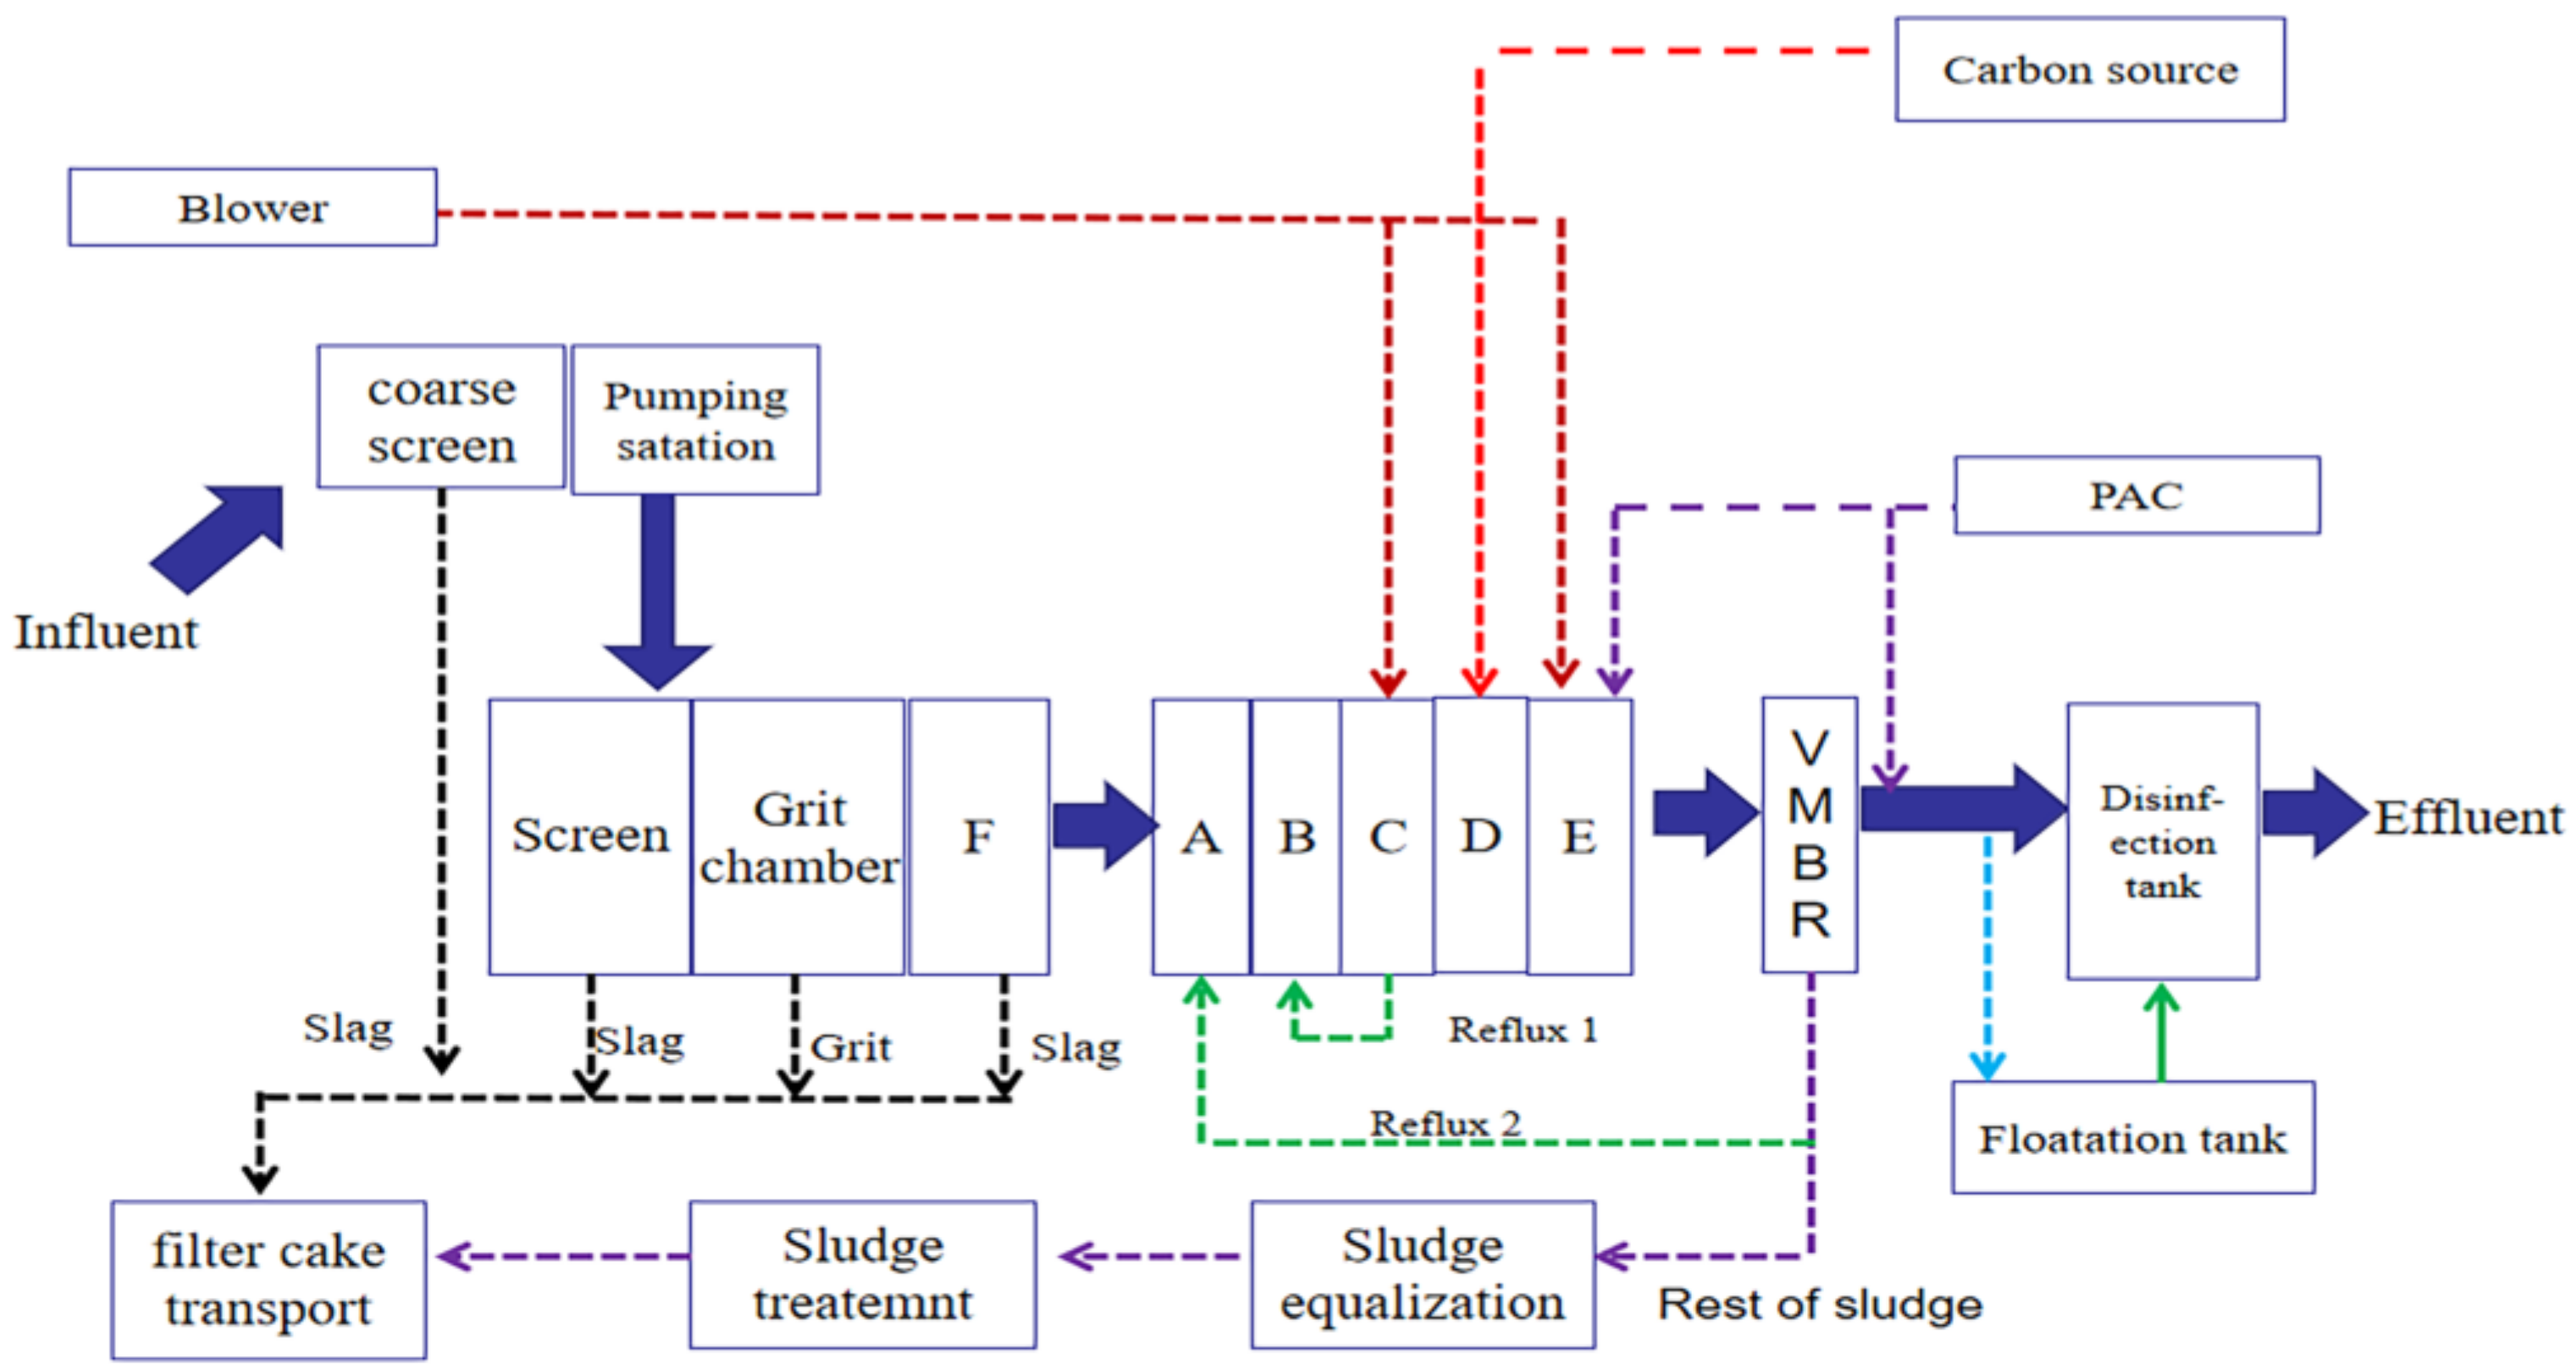
The A2/O-VMBR system demonstrated remarkable pollutant removal performance, as described in Section 3.1, which makes it a viable option for tailwater treatment. To further validate its efficacy, the system underwent stage II testing, which involved the direct treatment of raw municipal sewage that had not undergone any preliminary treatment and was classified as domestic sewage. Figure 3 depicts the modified process flow chart, while Figure 7 and Table 2 present the pollutant removal efficiency (COD, TN, TP, and NH3-N).
The influent was municipal water that underwent screening and pumping before the removal of slag and grit, which was filtered and transported as filter cake. The water then passed through anaerobic, pre-anoxic, oxic, post-anoxic, and post-oxic tanks. Blowers were used in the oxic tank, while carbon sources were added to the post-anoxic, and PAC was added to post-oxic and disinfection tanks. The remaining sludge from the VMBR tank was transferred to the sludge equalization and treatment tanks, where it was converted into filter cake for transportation.
From Figure 7 and Table 2, it can be observed that the municipal water (influent) was effectively treated by the new technology, resulting in effluent quality that was rated under Grade IV, with a removal efficiency exceeding 91%. To enhance TP removal, PAC was added to the post-oxic and VMBR tanks, while carbon sources were added to the post-anoxic tank to increase the system’s biological activity. Reflux 1 was from the oxic to the pre-anoxic tanks, and Reflux 2 was from the VMBR to the anaerobic tank to ensure the complete pollutant removal. The water from the VMBR was treated in the flotation tank and subsequently in the disinfection tank.
3.3. Analysis of the Advantages of VMBR Technology
3.3.1. Analysis of Nitrogen Removal
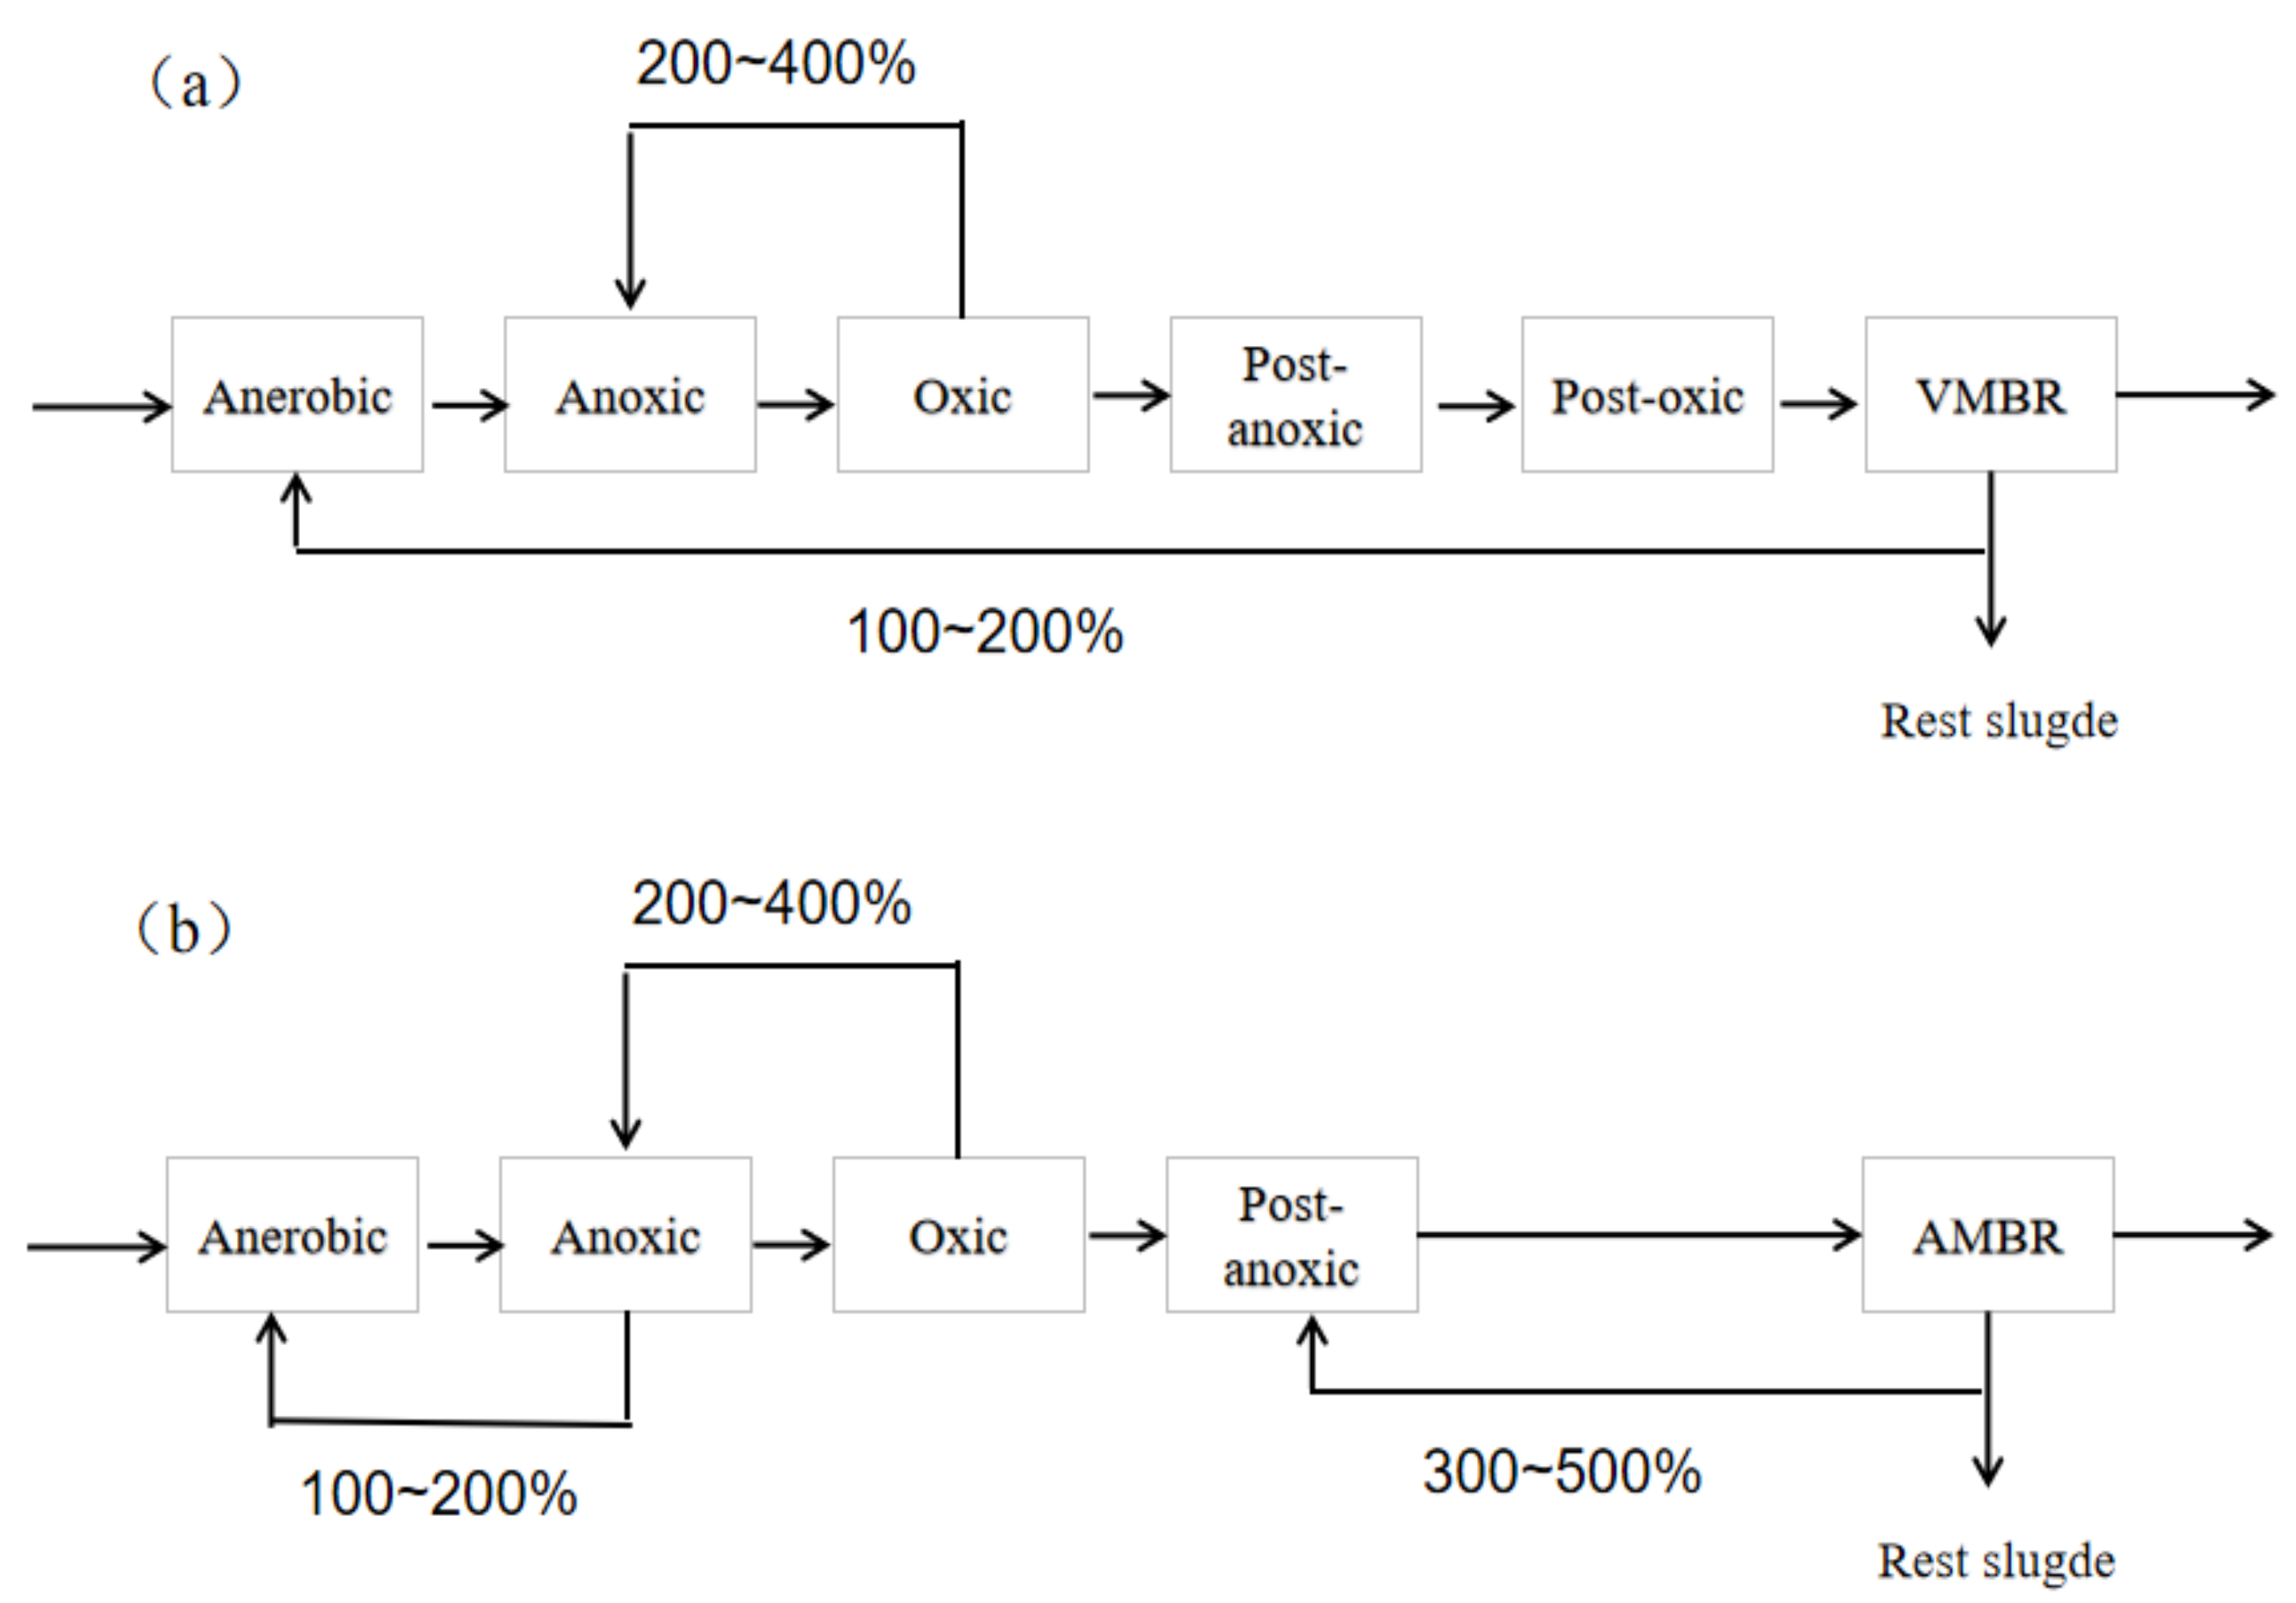
Water samples were collected from each unit during the VMBR and AMBR processes to identify sludge concentration, and the findings are shown in Figure 8. The total scale of Doudian Sewage Treatment Plant in the Fangshan District of Beijing was 15,000 m3/d, of which 7500 m3/d dedicated to the VMBR demonstration project and the other 7500 m3/d dedicated to AMBR. The project was expected to be completed in the second half of 2020 [46].
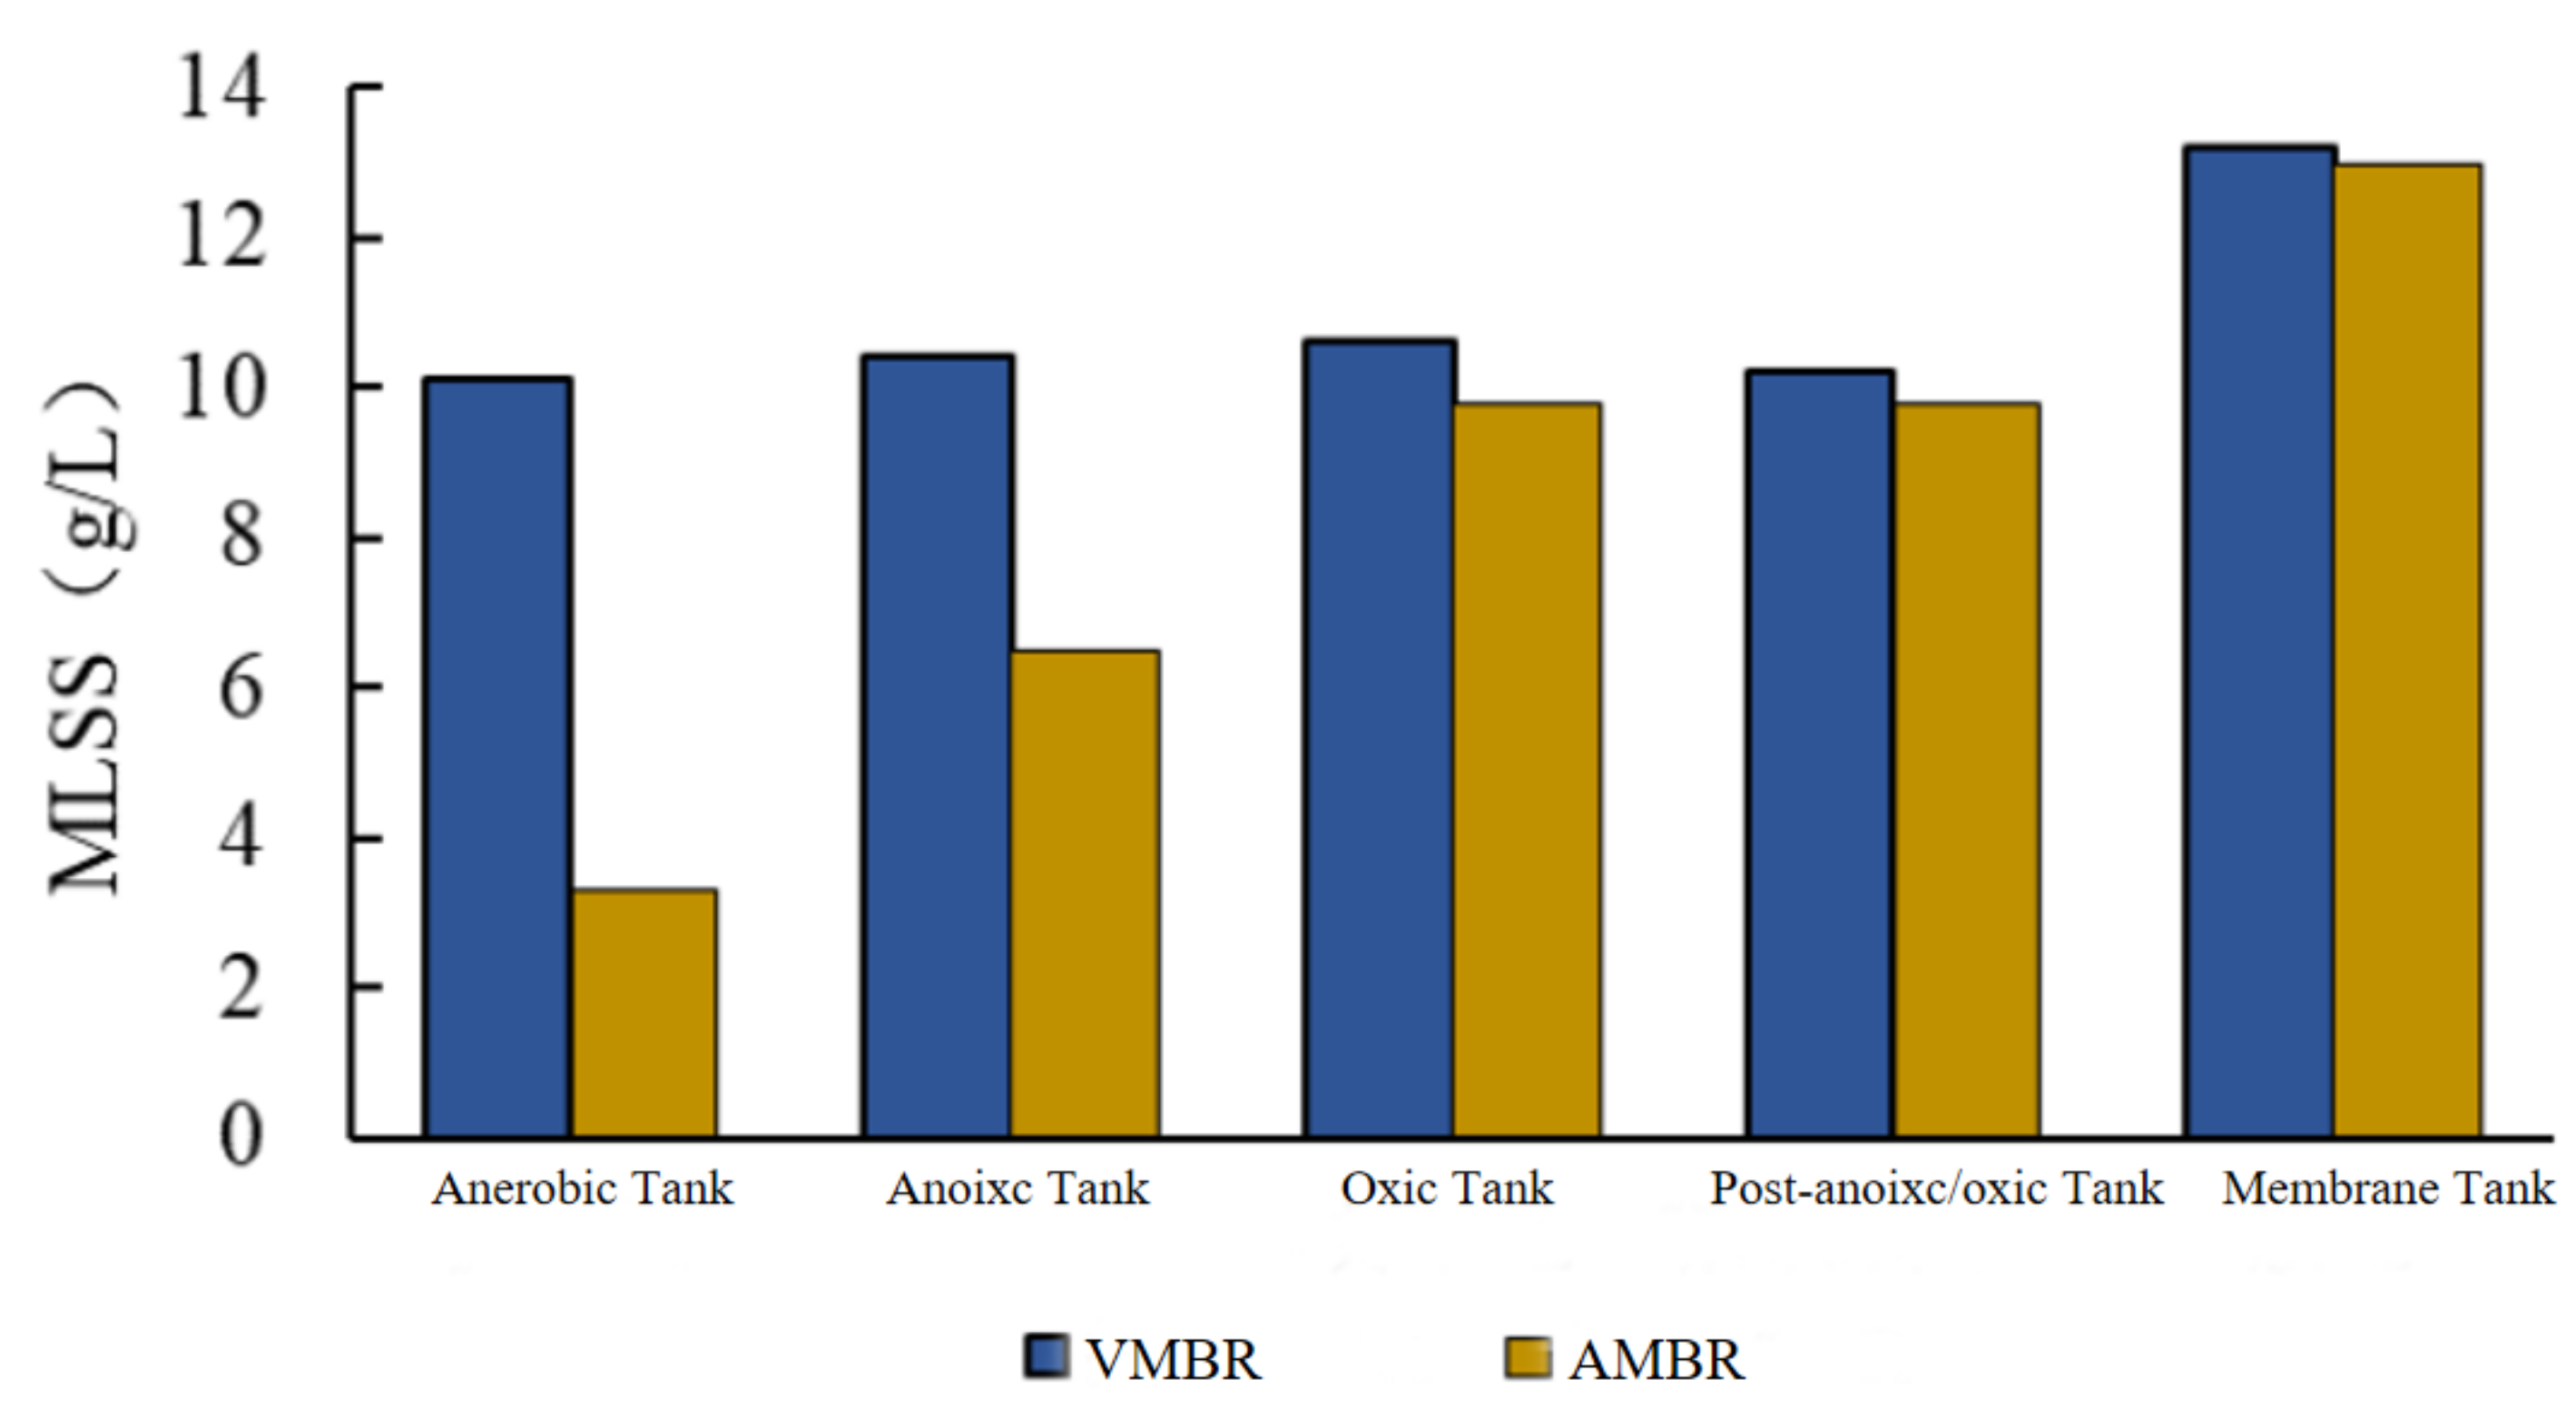
Figure 9 shows the MLSS of VMBR and AMBR. The sludge in the VMBR anaerobic tank was directly from the membrane tank’s backflow, whereas the sludge in the aerated MBR anaerobic tank was from the sequential backflow of the membrane tank, the aerobic tank, and the pre-anoxic tank. As a result, the sludge concentration distribution of the two processes was considerably different, with the sludge concentration in the vibrating MBR process’s front anoxic tank and pre-anoxic tank significantly greater than that in the aerated MBR process.
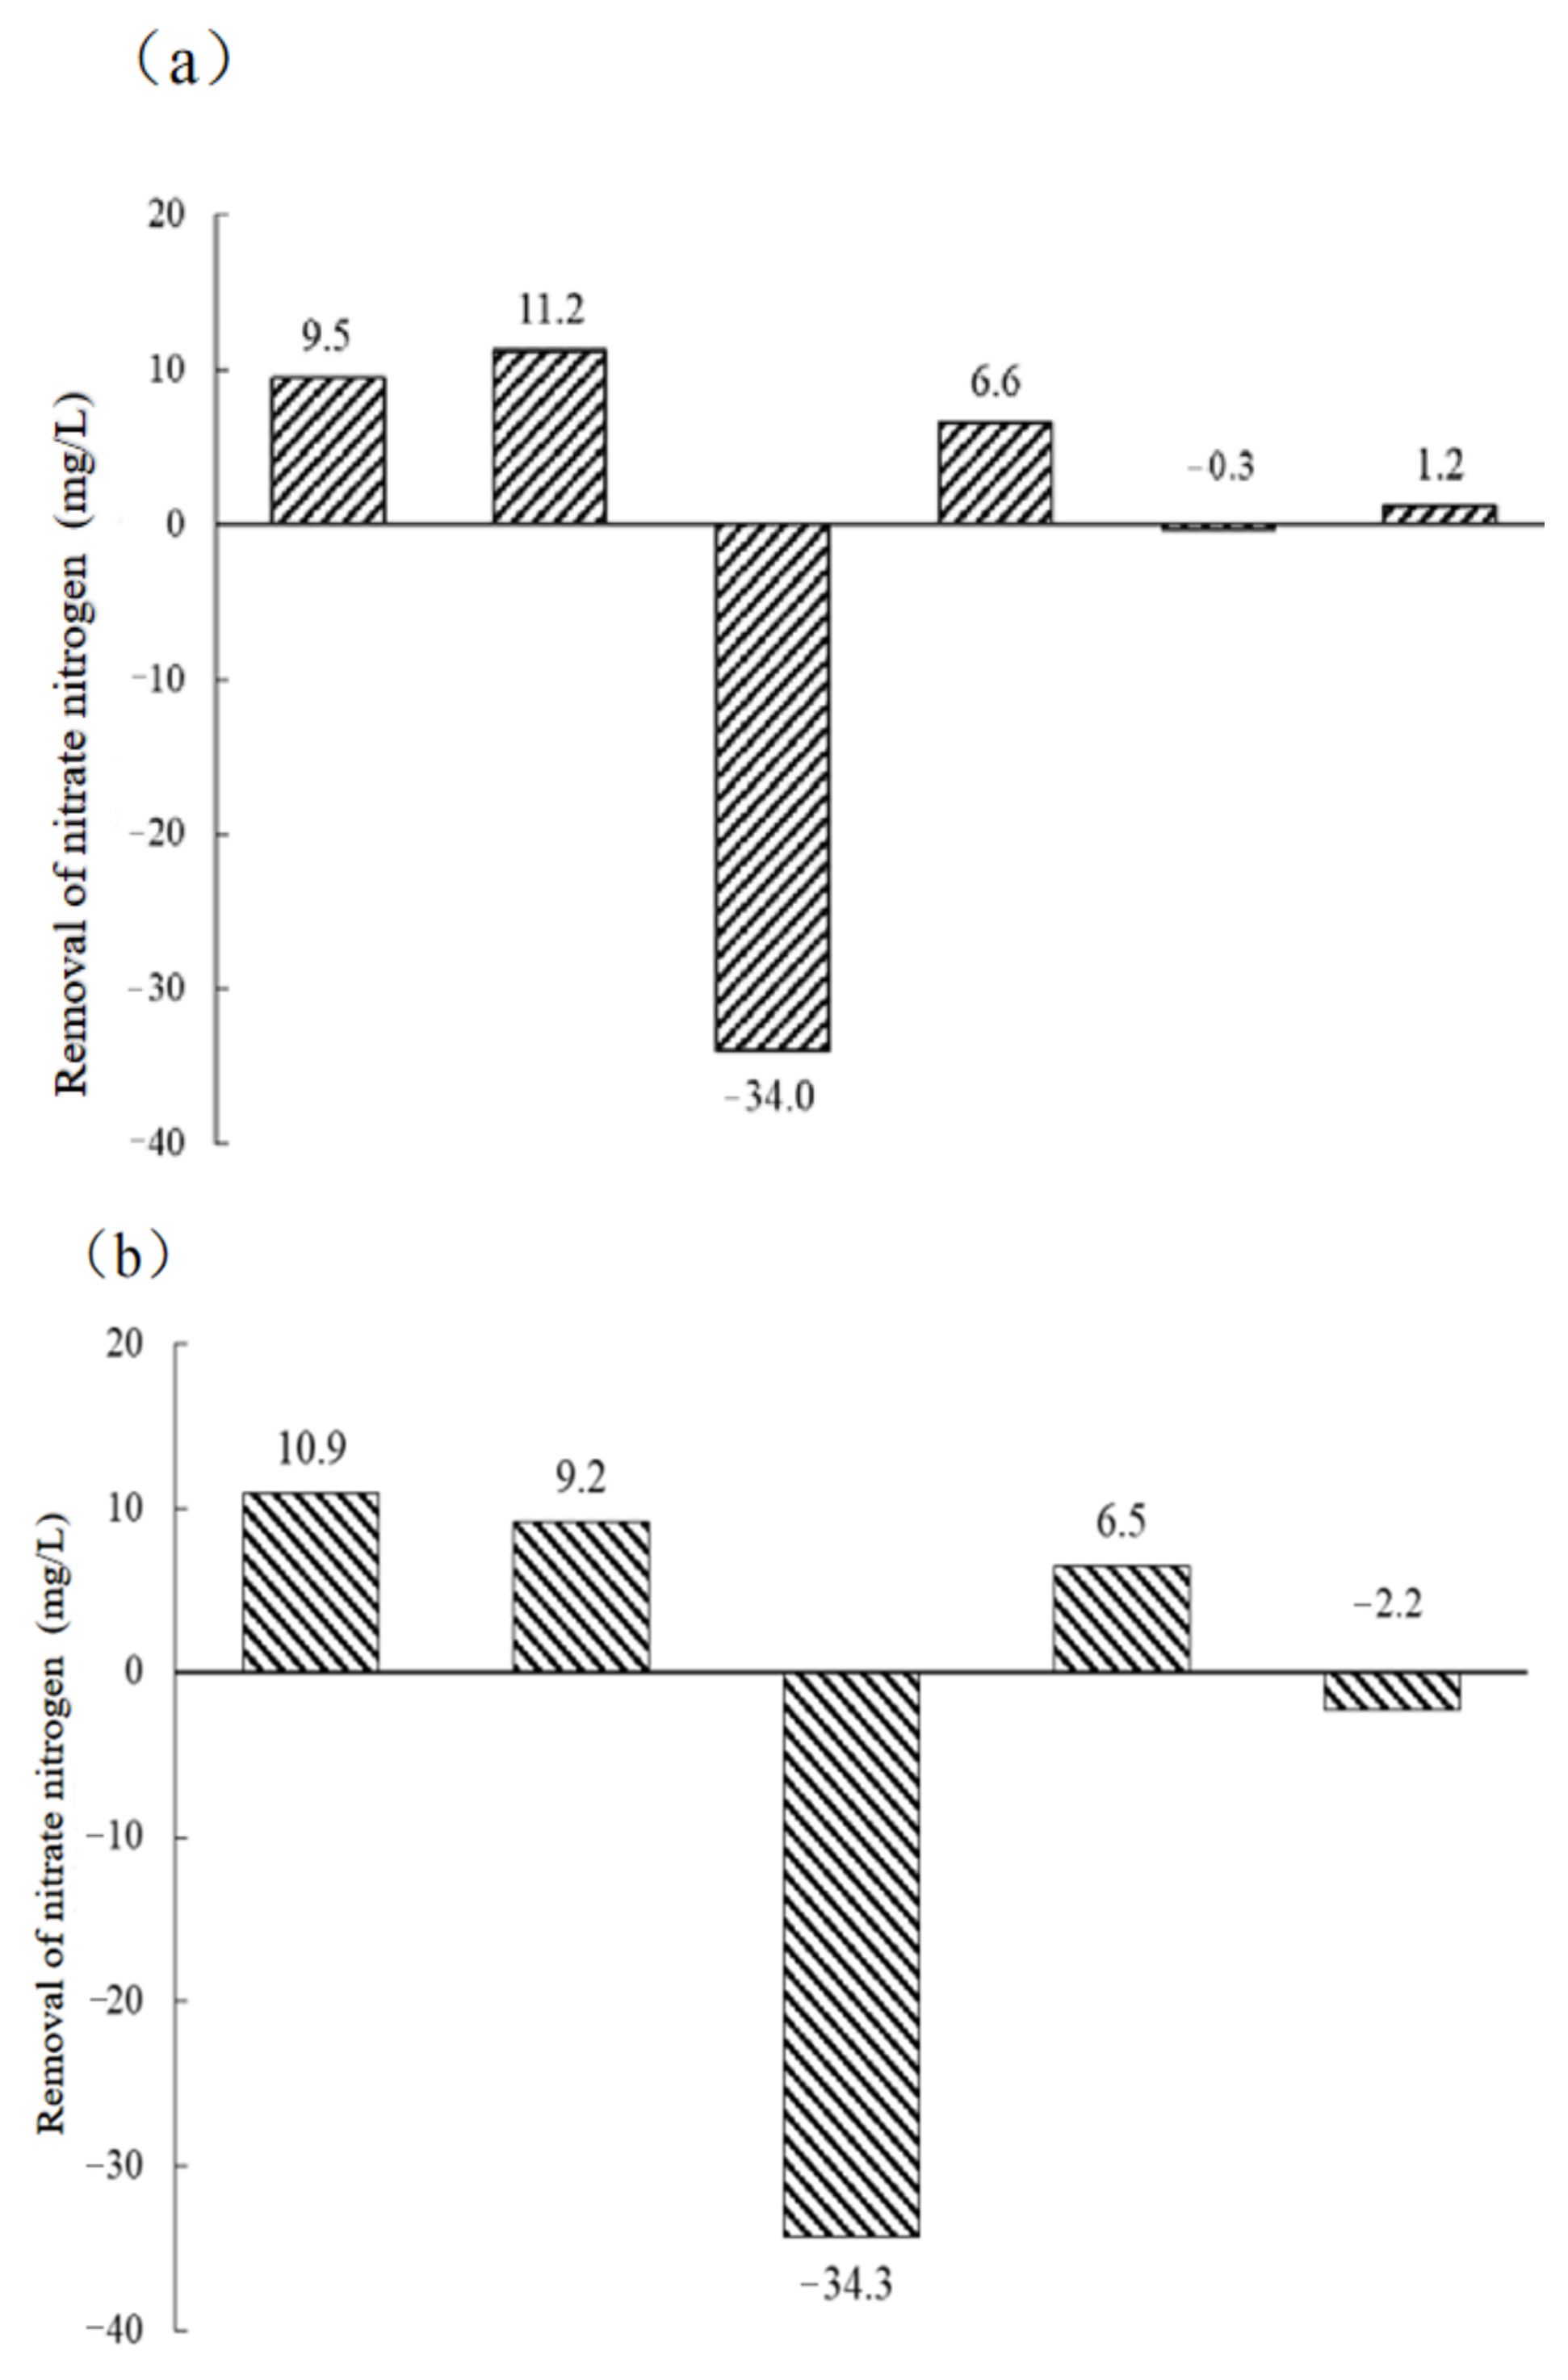
Water samples were collected from each unit during the VMBR and AMBR processes to identify the nitrate nitrogen content. Using a system material balance based on the water intake and return water, the nitrate nitrogen variation in each unit was determined. The impact of return water volume was examined, and all samples were transformed into nitrate nitrogen concentrations based on water intake. A positive number indicates the eliminated nitrate nitrogen concentration, while a negative number indicates nitrification or endogenous release oxidation, which increases the concentration of nitrate nitrogen (Figure 10).
The following nitrogen removal components were contrasted and evaluated in the VMBR and AMBR processes:
- Anerobic tank + anoxic tank: as both tanks use sewage carbon sources for denitrification and nitrogen elimination, the two tanks are considered together. The results showed that the vibrating MBR had a denitrification capacity of 20.7 mg/L, which was 0.6 mg/L higher than that of the aerated MBR (statistical data from various experimental experiments and projects are dispersed in 0.5 mg/L). This was attributed to the high waste content at the front end of the vibrating MBR process, which led to higher volume effectiveness of the biochemical reaction. Furthermore, the lack of aeration in the membrane pool and dissolved oxygen in the reflux prevented the waste of wastewater carbon source oxidation, thus improving the denitrification efficiency.
- Post-anoxic tank: in the post-anoxic tank, endogenous denitrification occurs when denitrifying bacteria employ endogenous respiration to release chemicals and extracellular polymers to denitrify. The nitrogen removal capability of the VMBR and AMBR in this tank was found to be comparable, with values of 6.6 mg/L and 6.5 mg/L, respectively.
- Membrane Tank: The VMBR membrane tank, similar to the post-anoxic tank, lacks aeration and DO, resulting in endogenous denitrification and nitrogen removal. The nitrogen release in the AMBR membrane tank was 2.2 mg/L, while the nitrogen removal in the VMBR membrane tank was 1.2 mg/L, highlighting that the nitrogen removal in the VMBR membrane tank was 3.4 mg/L greater.
Overall, the VMBR process demonstrated a 3–5 mg/L higher nitrogen removal capability than the AMBR process, with denitrification and prevention of nitrogen release accounting for 80–90% of the vibrating membrane pool’s contribution. The remaining 10–20% was attributed to denitrification enhancement in the anaerobic and pre-anoxic tanks with higher sludge concentrations.
3.3.2. Analysis of Energy Consumption
Figure 11 depicts the aeration purge mode in the AMBR process, which is employed to mitigate membrane fouling. In the membrane tank, the sludge undergoes intense motion and mixing, referred to as the “moving water” membrane pollution control mode, to ensure that the membrane surface receives sufficient hydraulic erosion and shear action. The VMBR operates differently, using vibrating membrane equipment to induce reciprocating parallel motion of membrane filaments and generating local shear stress on the membrane surface. This method manages membrane fouling effectively while causing minimal disruption to the sludge mixture in the membrane tank, resulting in high energy efficiency. This technique is termed the “moving membrane” pollution control mode.
Moreover, the aeration purging technique used in the AMBR process can result in the buildup of hair fibers on top of the membrane, leading to winding pollution and reducing shaking of the film filament, resulting in increased film pollution. This issue is entirely circumvented in the VMBR process since the diaphragm is more resistant to pollution and the membrane flow is more stable, with no entanglement or buildup of hair fibers, requiring less energy consumption and daily maintenance work.
Furthermore, the AMBR process’s entire backflow ratio consists of three parts of backflow (Figure 8), reaching 6 to 11 times, while the VMBR process’s total backflow ratio comprises two backflow sections (Figure 8), reaching three to six times. Consequently, the VMBR process may reduce its backflow water consumption by around 50% while also using less energy, making it an attractive option for membrane pollution management.
3.4. Energy Consumption
MBRs face significant challenges regarding energy consumption and membrane fouling. The specific energy consumption (defined as the energy consumed per volume of treated effluent) for VMBR was found to be less than 0.03 kWh/m3, a stark contrast to the average specific energy demand for membrane aeration from nine full-scale plant operation data sets, which was 0.29 kWh/m3 [22]. The term kWh/m3 denotes the power consumption per ton of water, and it is calculated by recording electricity consumption in real time. Furthermore, the use of a membrane reciprocating system can save more than 89% of energy compared to a traditional air washing system. On average, MBR plants consume between 0.75 and 2.2 kWh/m3 for treated effluent compared with an average consumption of 0.4 kWh/m3 in conventional plants [44]. Therefore, the VMBR can save more than 96–98% of energy compared to traditional MBRs and air-sparging MBRs. This is mainly due to three factors. Firstly, MBR plants require energy-intensive membrane aeration to limit cake-layer formation and maintain a stable hydraulic flow through the membranes. Secondly, the need to account for rainy weather flows necessitates redundant energy-intensive equipment and may lead to the sub-optimal use of the equipment during low influent flows. Finally, the lack of knowledge in optimizing MBR operation to suit influent flow also contributes to higher energy consumption. In contrast, the membrane vibration and reciprocating motion used in VMBR are more energy-efficient techniques for MBR systems. Additionally, integrated equipment with a canopy does not need to account for rainy weather flows as rainwater cannot enter the integrated equipment. VMBR effectively solves these problems, making it a highly efficient and energy-saving MBR technology.
3.5. Stability of Membrane Operation
Membrane fouling is a significant challenge in water treatment processes, resulting from the deposition and accumulation of microorganisms, colloids, solutes, and cell debris inside or on the membrane surface [45,46,47,48,49]. Fouling can increase the TMP and decrease the permeate flux, leading to reduced efficiency and increased operational costs. Dealing with wastewater containing high levels of contaminants can cause membrane clogging, which is influenced by membrane properties, biomass concentration, and operating conditions.
In this study, the VMBR was operated under constant SRT and HRT conditions, with a constant flux. Changes in membrane fouling control were monitored by recording variations in TMP and flux rate. Throughout the operation, the maximum transmembrane pressure recorded was 45 kPa, and the extremity transmembrane pressure was 80 kPa (Figure 12). Sludge bulking did not occur, and the actual operational flux of the VMBR was 15.52 LMH, with an average TMP of 5.4 Kpa. In comparison, a full-scale A2/O unit followed by a submerged MBR operating under a constant flux of 16 LMH, and with a treatment capacity of 2000 m3/day, recorded TMP variations narrowly between 12 and 22 KPa over a 9-month duration [50]. Therefore, the VMBR demonstrated lower TMP compared to traditional aerated MBR.
3.6. Bacterial Community Diversity
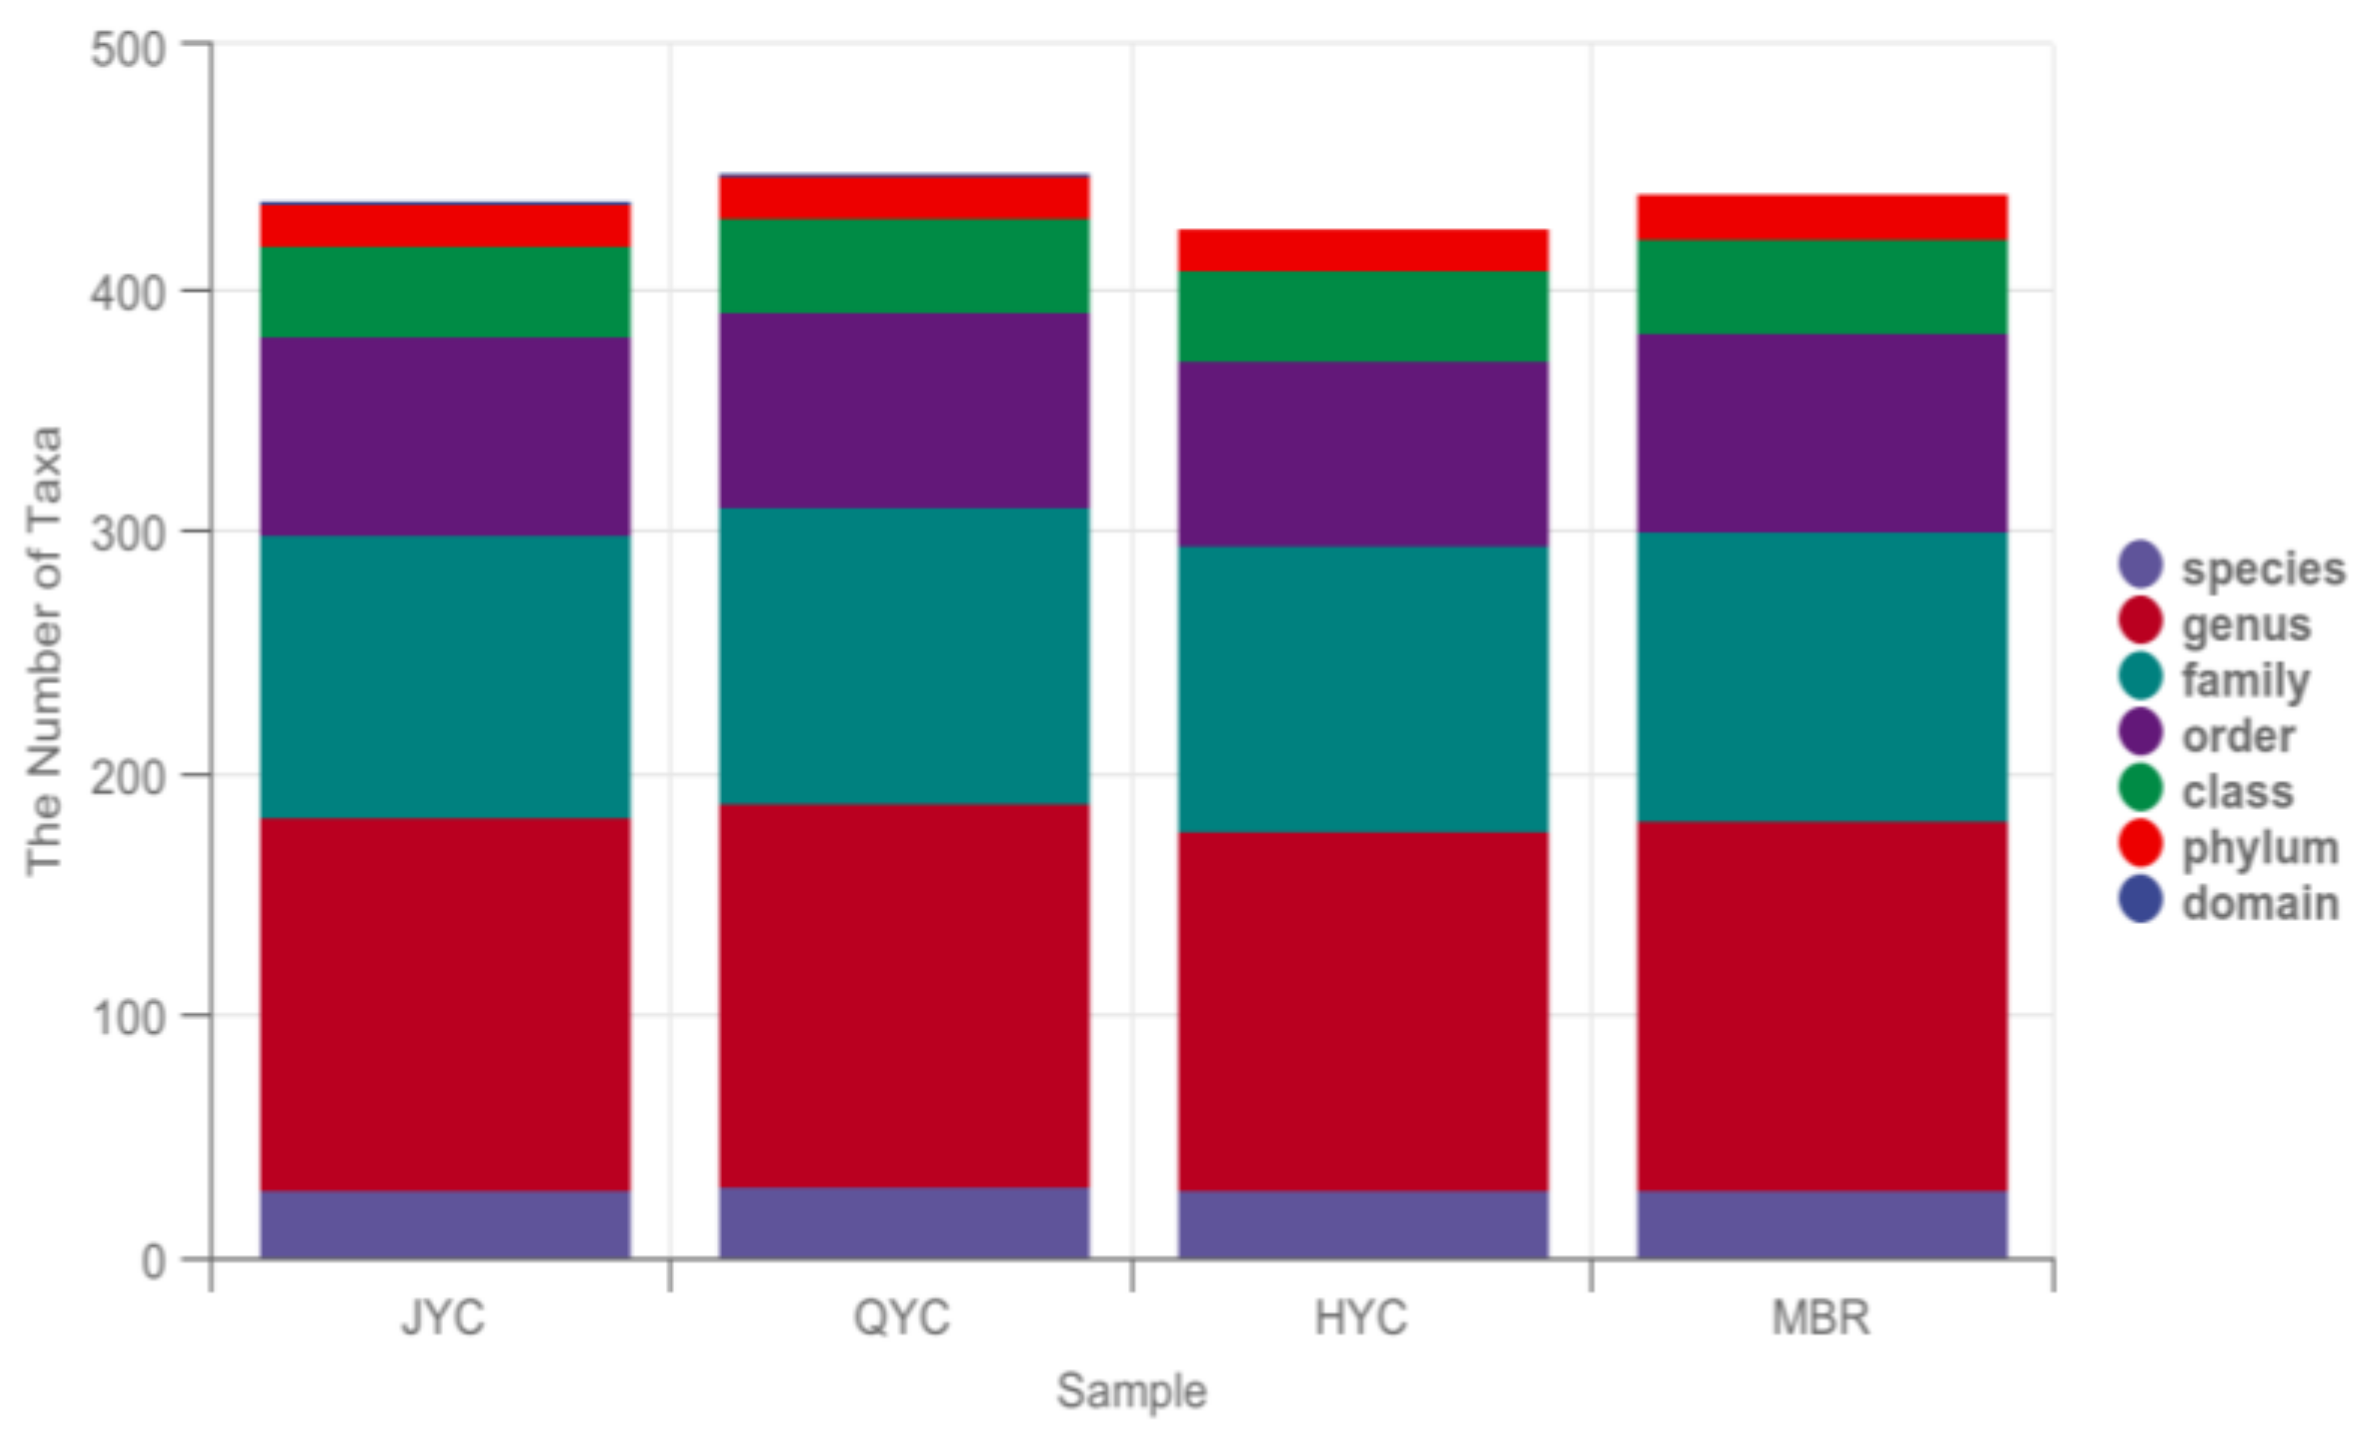
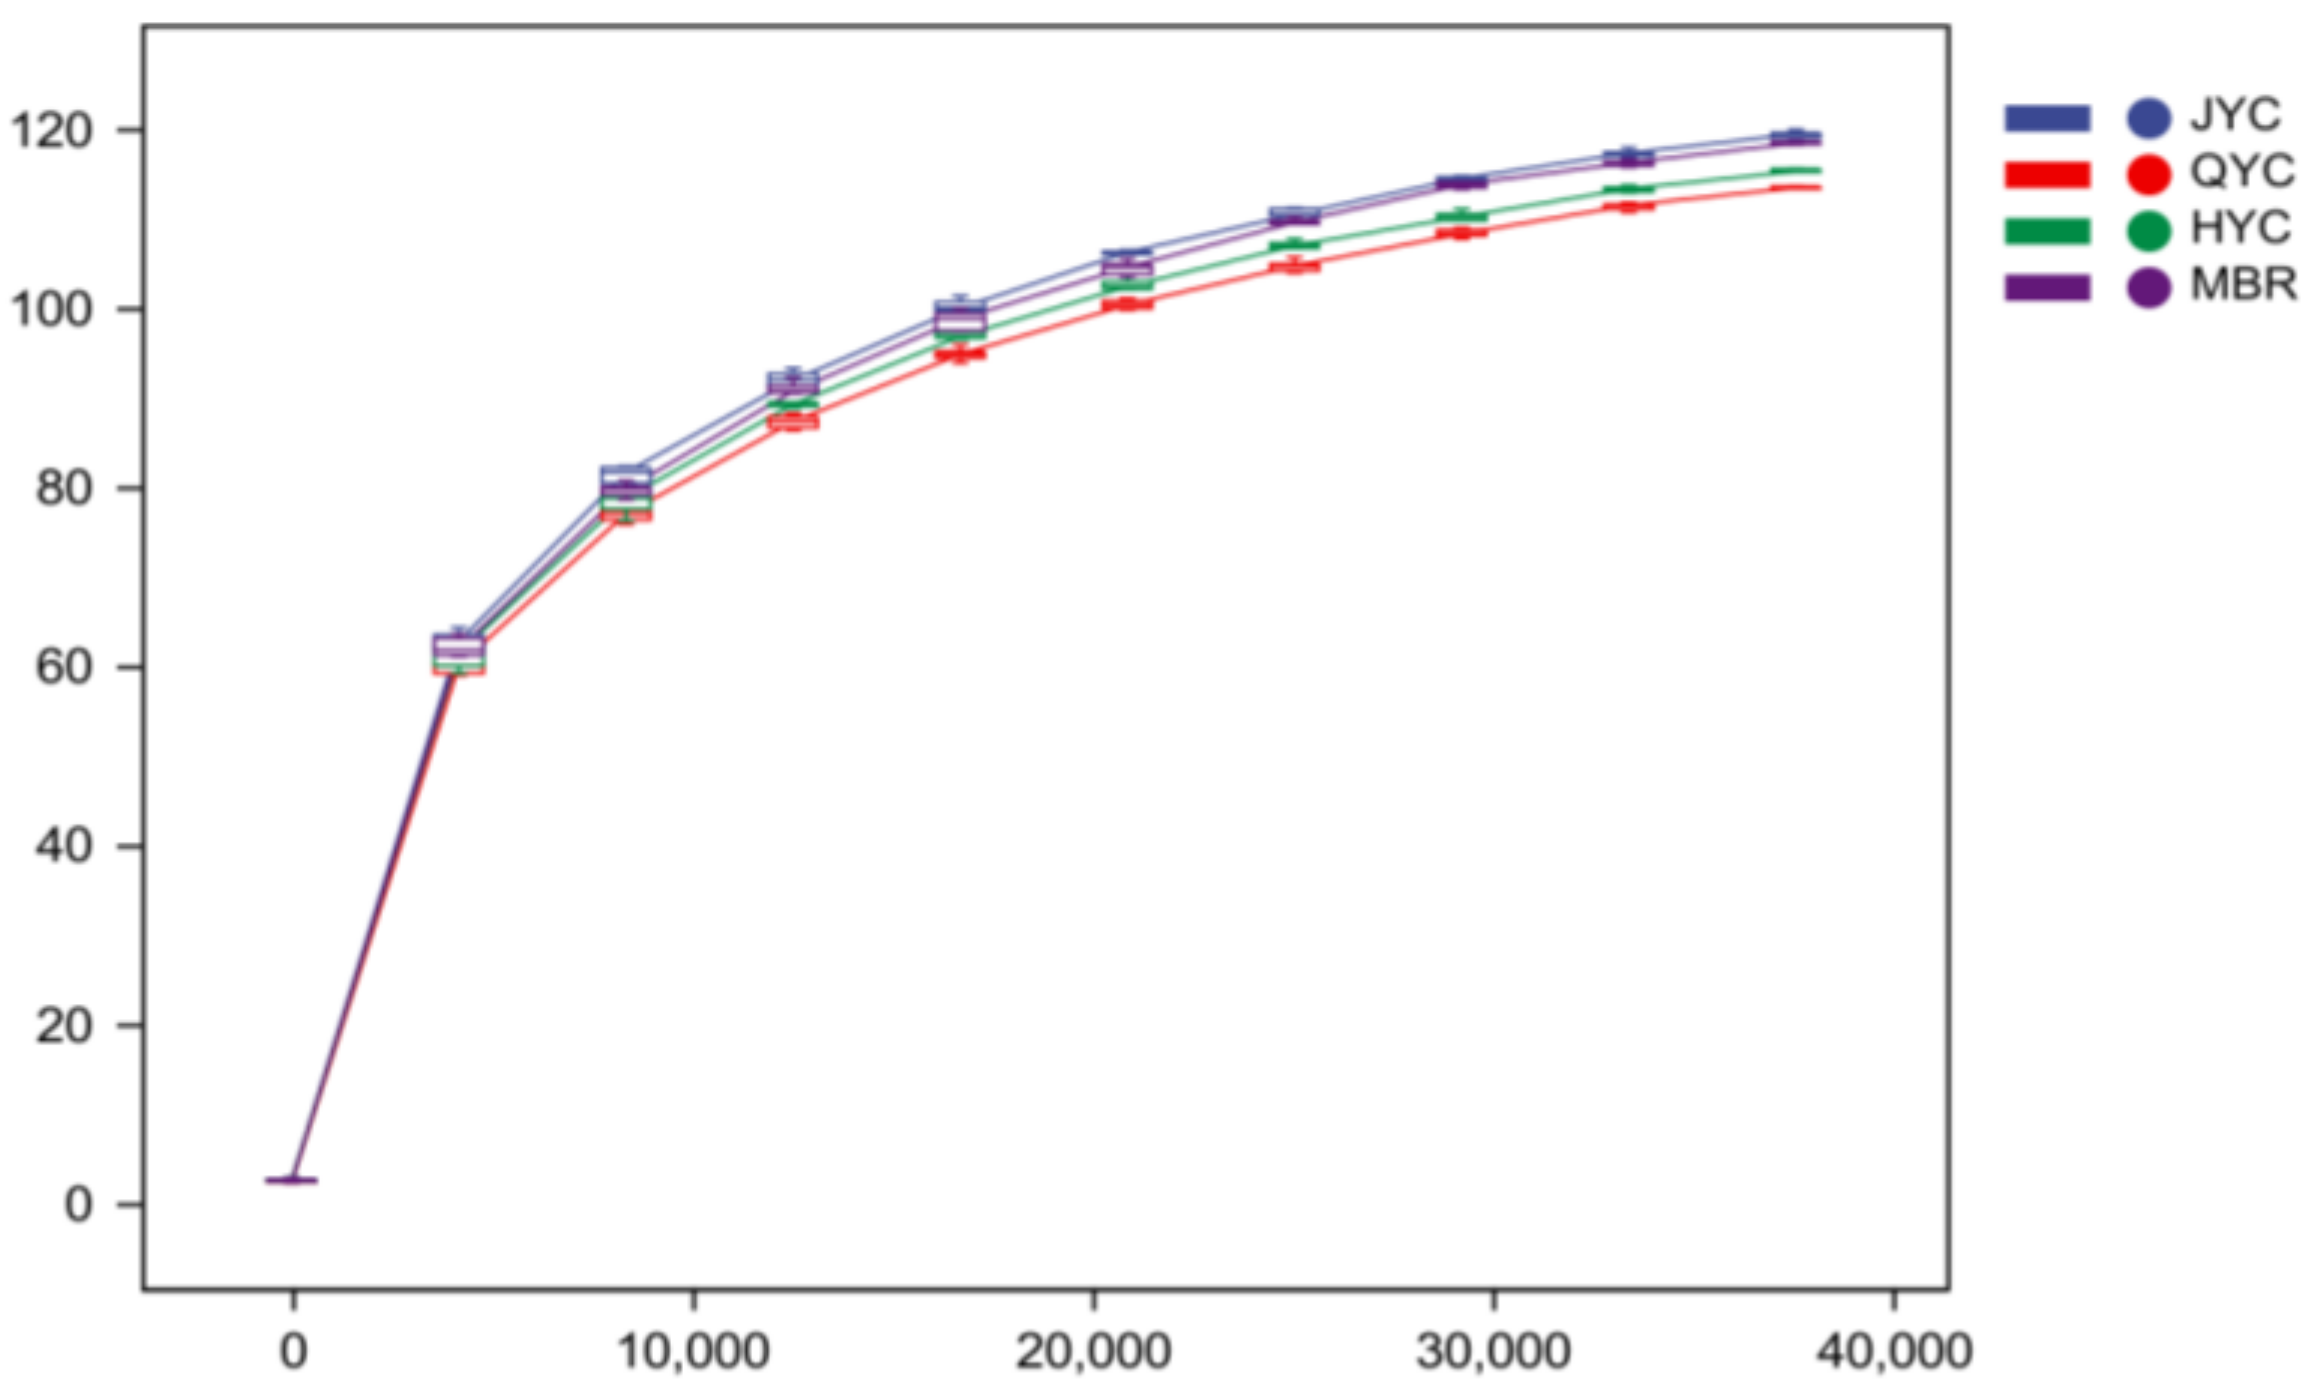
High-throughput sequencing using the Illumina MiSeq platform was used to analyze microbial community diversity and phylogenetic structure of the WWTPs [48,49]. The number of ASVs/OTUs (species level) was determined after eliminating low-quality sequences and chimeras (Figure 13). The saturation plateau was reached by all rarefaction curves (Figure 14), indicating that sufficient data were gathered from individual samples. Moreover, all samples had an average coverage of 96.6% (means and s.d. ranging from 96.89% to 97.05%) (Table 3), indicating that the sequencing depth was adequate for community analysis. Furthermore, the number of observed species varied across the four samples (Table 3), with samples JYC (anaerobic tank) and MBR having 3527.27 and 3489.83 species, respectively. Sample JYC demonstrated high species richness, while sample HYC exhibited low species richness. The Chao1 index variations, which were from large to small (JYC > MBR > HYC (oxic tank) > QYC (anoxic tank)) (Table 3) corresponded to the total number of ASVs/OTUs (Figure 13), confirming the prior findings.
In samples JYC and MBR, the Shannon index, which represents the richness component of diversity, was 8.87 and 8.85, respectively. In samples QYC and HYC, it was 8.83 and 8.79, respectively (Table 3). This shows that the richness component of diversity in samples JYC and MBR was high, while it was low in samples QYC and HYC. Sample QYC exhibited the highest Simpson index (0.983642), while sample MBR had the lowest (0.982671). Sample JYC and sample HYC had values of 0.983126 and 0.983087, respectively (Table 3). The evenness component of variety was high in samples JYC and MBR but low in samples QYC and HYC.
4. Discussion
China’s freshwater water quality management has been in accordance with the existing Environmental Quality Standards for Surface Water (GB18918-2002, China [51]).
While the sewage treatment system in Wuhan meets the level I-A requirement specified in the standards, the resulting effluent is not suitable for use in urban lakes and must be discharged directly into the Yangtze River. This practice has raised concerns over the ecological conservation and sewage resource exploitation of the river. To address this issue, the A2/O-VMBR technique has been identified as a suitable solution since it can meet the new water policy. Compared to the traditional AMBR process, VMBR has a higher nitrogen removal rate and lower running energy usage, making it an attractive option for treating tailwater instead of raw sewage.
In light of several factors, we have opted to implement the A2/O-VMBR technique for treating tailwater instead of raw sewage:
- First and foremost, effluent from tailwater treated with this technology can reach Grade IV surface water standard.
- Secondly, the municipal sewage treatment facility, which covers an area of 51 square kilometers and serves a population of approximately 514,000 people, processes 40,000 m3/d of water. Its significant treatment capacity is particularly notable, given its location in Wuhan’s metropolitan region.
- Finally, the owner of the sewage treatment plant was concerned about the high renovation cost of utilizing the new method to treat the old sewage, as well as the failure to guarantee the first-class A treatment level, which could adversely impact urban growth and its inhabitants’ lives. As such, the existing procedure will continue to be used for raw sewage treatment, while the A2/O-VMBR technique will be reserved for tailwater treatment.
The A2/O-VMBR process was tested from October 2021 to December 2021, and the findings demonstrated that this technique successfully enhanced the tailwater from I-A standard to Grade IV surface water standards. With the approval of the plant owner (on the condition that the plant’s treatment procedure remains unchanged), the enhanced A2/O-VMBR was employed to treat raw sewage on 29 May 2022, which continued for 59 days until 26 July 2022 (raw water enters through a conduit from the municipal sewage intake). The findings indicated that the technique may separate municipal sewage into four types of surface water.
The BOD/COD ratio of the system was very small and had a value of 0.03. Therefore, to maintain the biodegradability of the system, carbon sources were periodically introduced to anaerobic and anoxic tanks, ensuring the continuous and efficient operation of the system. In addition, PAC was introduced to these tanks on a regular and quantitative basis to guarantee that TP was eliminated. In fact, phosphorus removal via the A2/O process is very difficult, and while VMBR has a superior nitrogen removal efficiency than AMBR, the effect of phosphorus removal is not visible. Hence, the addition of PAC proved to be straightforward and appropriate for effective phosphorus removal.
According to the water demands in the South Lake (Wuhan, China), the discharge standard of municipal wastewater treatment plants requires improving the effluent quality to satisfy the first grade A criteria (GB18918-2002) [51] and comply with Grade IV surface water (GB3838-2002) [28] in China. The results of this study were promising, as the effluent quality met the strict discharge standards for Grade IV surface water in China, with COD, TP, TN, BOD, and NH3-N levels below the standard (Table 4).
5. Conclusions
The A2/O-VMBR technique is a highly effective method for treating municipal wastewater to meet Grade IV surface water standards (GB3838-2002) [28] with a high TN removal rate. Water quality indicators, including COD, TN, TP, NH3-N, and BOD, were continuously tested and recorded throughout the treatment process. The dominant phyla in the four activated sludge samples collected during the treatment were Proteobacteria, Bacteroidetes, and Chloroflexi. Furthermore, the nitrifying bacterial community structure in the system was constrained, resulting in minimal diversity. The energy consumption of VMBR was only 0.03 kWh/m, making it more than 70% more efficient than traditional MBR plants. The flux of VMBR and AMBR were 15.52 LMH and 13.2 LMH, which means that VMBR had higher water production efficiency. In conclusion, this technique proved highly effective in removing pollutants, especially the difficult-to-treat TN, and successfully met the original goal of achieving Grade IV surface water standards. Furthermore, with its low energy consumption, the A2/O-VMBR represents an ideal option for newly constructed sewage purification facilities seeking to achieve efficient and cost-effective wastewater treatment.
Author Contributions
Investigation, F.H. and F.L.; writing—original draft preparation, Q.M.; funding acquisition, X.Y. All authors have read and agreed to the published version of the manuscript.
Funding
This research received no external funding.
Data Availability Statement
All data generated or analyzed during this study are included in this published article.
Conflicts of Interest
The authors declare no conflict of interest.
References
- Wang, S.; Zou, L.; Li, H.; Zheng, K.; Wang, Y.; Zheng, G.; Li, J. Full-scale membrane bioreactor process WWTPs in East Taihu basin: Wastewater characteristics, energy consumption and sustainability. Sci. Total Environ. 2020, 723, 137983. [Google Scholar] [CrossRef] [PubMed]
- Guo, R.X.; Chen, J.Q. Application of alga-activated sludge combined system (AASCS) as a novel treatment to remove cephalosporins. Chem. Eng. J. 2015, 260, 550–556. [Google Scholar] [CrossRef]
- Wang, S.; Qian, K.; Zhu, Y.; Yi, X.; Zhang, G.; Du, G.; Tay, J.H.; Li, J. Reactivation and pilot-scale application of long-term storage denitrification biofilm based on flow cytometry. Water Res. 2019, 148, 368–377. [Google Scholar] [CrossRef] [PubMed]
- Rojas, M.H.; Van Kaam, R.; Schetrite, S.; Albasi, C. Role and variations of supernatant compounds in submerged membrane bioreactor fouling. Desalination 2005, 179, 95–107. [Google Scholar] [CrossRef]
- De Sotto, R.; Ho, J.; Lee, W.; Bae, S. Discriminating activated sludge flocs from biofilm microbial communities in a novel pilot-scale reciprocation MBR using high-throughput 16S rRNA gene sequencing. J. Environ. Manag. 2018, 217, 268–277. [Google Scholar] [CrossRef]
- Judd, S.J. The status of industrial and municipal effluent treatment with membrane bioreactor technology. Chem. Eng. J. 2016, 305, 37–45. [Google Scholar] [CrossRef]
- Udomkittayachai, N.; Xue, W.; Xiao, K.; Visvanathan, C.; Tabucanon, A.S. Electroconductive moving bed membrane bioreactor (EcMB-MBR) for single-step decentralized wastewater treatment: Performance, mechanisms, and cost. Water Res. 2021, 188, 116547. [Google Scholar] [CrossRef]
- Kim, H.G.; Jang, H.N.; Kim, H.M.; Lee, D.S.; Chung, T.H. Effect of an electro phosphorous removal process on phosphorous removal membrane permeability in a pilot-scale, M.B.R. Desalination 2010, 250, 629–633. [Google Scholar] [CrossRef]
- Li, Y.Z.; He, Y.L.; Ohandja, D.G.; Ji, J.; Li, J.F.; Zhou, T. Simultaneous nitrification–denitrification achieved by an innovative internal-loop airlift MBR: Comparative study. Bioresour. Technol. 2008, 99, 5867–5872. [Google Scholar] [CrossRef]
- Subtil, E.L.; Mierzwa, J.C.; Hespanhol, I. Comparison between a conventional membrane bioreactor (C-MBR) and a biofilm membrane bioreactor (BF-MBR) for domestic wastwater treatment. Braz. J. Chem. Eng. 2014, 31, 683–691. [Google Scholar] [CrossRef]
- Xiao, K.; Liang, S.; Wang, X.; Chen, C.; Huang, X. Current state and challenges of full-scale membrane bioreactor applications: A critical review. Bioresour. Technol. 2019, 271, 473–481. [Google Scholar] [CrossRef]
- Bagheri, M.; Mirbagheri, S.A. Critical review of fouling mitigation strategies in membrane bioreactors treating water and wastewater. Bioresour. Technol. 2018, 258, 318–334. [Google Scholar] [CrossRef]
- Du, X.; Shi, Y.; Jegatheesan, V.; Haq, I.U. A Review on the Mechanism, Impacts and Control Methods of Membrane Fouling in MBR System. Membranes 2020, 10, 24. [Google Scholar] [CrossRef]
- Hamedi, H.; Ehteshami, M.; Mirbagheri, S.A.; Rasouli, S.A.; Zendehboudi, S. Current Status and Future Prospects of Membrane Bioreactors (MBRs) and Fouling Phenomena: A Systematic Review. Can. J. Chem. Eng. 2019, 97, 32–58. [Google Scholar] [CrossRef]
- Wang, C.; Ng, T.C.A.; Ding, M.; Ng, H.Y. Insights on fouling development and characteristics during different fouling stages between a novel vibrating MBR and an air-sparging MBR for domestic wastewater treatment. Water Res. 2022, 212, 118098. [Google Scholar] [CrossRef]
- New separation system extends the use of membranes. Filtr. Sep. 1992, 29, 376–378. [CrossRef]
- Chew, J.W.; Kilduff, J.; Belfort, G. The behavior of suspensions and macromolecular solutions in crossflow microfiltration: An update. J. Membr. Sci. 2020, 601, 117865. [Google Scholar] [CrossRef]
- Jönsson, A.-S. Influence of shear rate on the flux during ultrafiltration of colloidal substances. J. Membr. Sci. 1993, 79, 93–99. [Google Scholar] [CrossRef]
- Kennedy, T.J.; Merson, R.L.; Mccoy, B.J. Improving permeation flux by pulsed reverse osmosis. Chem. Eng. Sci. 1974, 29, 1927–1931. [Google Scholar] [CrossRef]
- Low, S.C.; Han, H.J.; Jin, W.X. Characteristics of a vibration membrane in water recovery from a fine carbon loaded wastewater. Desalination 2003, 156, 403. [Google Scholar] [CrossRef]
- Wang, C.S.; Ng, T.C.A.; Ng, H.Y. Comparison between novel vibrating ceramic MBR and conventional air-sparging MBR for domestic wastewater treatment: Performance, fouling control and energy consumption. Water Res. 2021, 203, 117521. [Google Scholar] [CrossRef] [PubMed]
- Ho, J.; Smith, S.; Roh, H.K. Alternative energy efficient membrane bioreactor using reciprocating submerged membrane. Water Sci. Technol. 2014, 70, 1998–2003. [Google Scholar] [CrossRef]
- Abzazou, T.; Salvadó, H.; Cárdenas-Youngs, Y.; Becerril-Rodríguez, A.; Cebirán, E.M.C.; Huguet, A.; Araujo, R.M. Characterization of nutrient-removing microbial communities in two full-scale WWTP systems using a new qPCR approach. Sci. Total Environ. 2018, 618, 858–865. [Google Scholar] [CrossRef] [PubMed]
- Zhang, B.; Yu, Q.; Yan, G.; Zhu, H.; Xu, X.Y.; Zhu, L. Seasonal bacterial community succession in four typical wastewater treatment plants: Correlations between core microbes and process performance. Sci. Rep. 2018, 8, 4566. [Google Scholar] [CrossRef] [PubMed]
- Baeza, J.A.; Gabriel, D.; Lafuente, J. Effect of internal recycle on the nitrogen removal efficiency of an anaerobic/anoxic/oxic (A2/O) wastewater treatment plant (WWTP). Process Biochem. 2004, 39, 1615–1624. [Google Scholar] [CrossRef]
- Yao, Y.; Zhao, J.; Miao, L.; Hou, J. Effects of sediment physicochemical factors and heavy metals on the diversity, structure, and functions of bacterial and fungal communities from a eutrophic river. Environ. Pollut. 2022, 303, 119129. [Google Scholar] [CrossRef]
- Zhang, S.; Huang, Z.; Lu, S.; Zheng, J.; Zhang, X. Nutrients removal and bacterial community structure for low C/N municipal wastewater using a modified anaerobic/anoxic/oxic (mA2/O) process in North China. Bioresour. Technol. 2017, 243, 975–985. [Google Scholar] [CrossRef]
- Liu, M.; Li, Z.; Duan, M.; Su, Y.; Lin, X.; Han, H.; Sun, K. Research and demonstration on reclaimation of chemical industrial wastewater with high salinity and hardness and purification of reverse osmosis concentrates. Desalination 2023, 551, 116437. [Google Scholar] [CrossRef]
- Meng, J.; Li, J.; Li, J.; Antwi, P.; Deng, K.; Nan, J.; Xu, P. Enhanced nitrogen removal from piggery wastewater with high NH4+ and low COD/TN ratio in a novel upflow microaerobic biofilm reactor. Bioresour. Technol. 2018, 249, 935–942. [Google Scholar] [CrossRef]
- Pan, Z.; Zhou, J.; Lin, Z.; Wang, Y.; Zhao, P.; Zhou, J.; Liu, S.; He, X. Effects of COD/TN ratio on nitrogen removal efficiency, microbial community for high saline wastewater treatment based on heterotrophic nitrification-aerobic denitrification process. Bioresour. Technol. 2020, 301, 122726. [Google Scholar] [CrossRef]
- Zhang, X.; Zhao, B.; Meng, J.; Zhou, A.; Yue, X.; Niu, Y.; Cui, Y. Efficiency, granulation, and bacterial populations related to pollutant removal in an upflow microaerobic sludge reactor treating wastewater with low COD/TN ratio. Bioresour. Technol. 2018, 270, 147–155. [Google Scholar] [CrossRef]
- Jin, P.; Chen, Y.; Xu, T.; Cui, Z.; Zheng, Z. Efficient nitrogen removal by simultaneous heterotrophic nitrifying-aerobic denitrifying bacterium in a purification tank bioreactor amended with two-stage dissolved oxygen control. Bioresour. Technol. 2019, 281, 392–400. [Google Scholar] [CrossRef]
- Shu, H.; Sun, H.M.; Huang, W. Nitrogen removal characteristics and potential application of the heterotrophic nitrifying-aerobic denitrifying bacteria Pseudomonas mendocina S16 and Enterobacter cloacae DS’5 isolated from aquaculture wastewater ponds. Bioresour. Technol. 2022, 345, 126541. [Google Scholar] [CrossRef]
- Fang, Y.K.; Wang, H.C.; Han, J.L.; Li, Z.L.; Wang, A.J. Enhanced nitrogen removal of constructed wetlands by coupling with the bioelectrochemical system under low temperature: Performance and mechanism. J. Clean. Prod. 2022, 350, 131365. [Google Scholar] [CrossRef]
- Li, C.; Liu, S.; Ma, T.; Zheng, M.; Ni, J. Simultaneous nitrification, denitrification and phosphorus removal in a sequencing batch reactor (SBR) under low temperature. Chemosphere 2019, 229, 132–141. [Google Scholar] [CrossRef]
- Wang, T.; Xiao, L.; Lu, H.; Lu, S.; Li, J.; Guo, X.; Zhao, X. Nitrogen removal from summer to winter in a field pilot-scale multistage constructed wetland-pond system. J. Environ. Sci. 2022, 111, 249–262. [Google Scholar] [CrossRef]
- Zhou, D.; Tabassum, S.; Li, J. Effect of exogenous K+ addition on the denitrification efficiency of high salinity wastewater treatment by anammox process at medium and low temperature: In-depth study. Clean. Eng. Technol. 2021, 5, 100296. [Google Scholar] [CrossRef]
- Zhang, C.C.; Guisasola, A.; Baeza, J.A. A review on the integration of mainstream P-recovery strategies with enhanced biological phosphorus removal. Water Res. 2022, 212, 118102. [Google Scholar] [CrossRef]
- Gonzalez-Camejo, J.; Montero, P.; Aparicio, S.; Ruano, M.V.; Borrás, L.; Seco, A.; Barat, R. Nitrite inhibition of microalgae induced by the competition between microalgae and nitrifying bacteria. Water Res. 2020, 172, 115499. [Google Scholar] [CrossRef]
- Guo, C.Z.; Fu, W.; Chen, X.M.; Peng, D.C.; Jin, P.K. Nitrogen-removal performance and community structure of nitrifying bacteria under different aeration modes in an oxidation ditch. Water Res. 2013, 47, 3845–3853. [Google Scholar] [CrossRef]
- Siripong, S.; Rittmann, B.E. Diversity study of nitrifying bacteria in full-scale municipal wastewater treatment plants. Water Res. 2007, 41, 1110–1120. [Google Scholar] [CrossRef] [PubMed]
- Lewandowski, G.A.; Armenante, P.M.; Pak, D. Reactor design for hazardous waste treatment using a white rot fungus. Water Res. 1990, 24, 75–82. [Google Scholar] [CrossRef]
- Veltmann, K.; Palmowski, L.M.; Pinnekamp, J. Modular operation of membrane bioreactors for higher hydraulic capacity utilisation. Water Sci. Technol. 2011, 63, 1241–1246. [Google Scholar] [CrossRef] [PubMed]
- Yuan, L.; Zheng, D.; Wang, H.; Yang, Y.; Li, T.; Xue, T.; Yu, K. Development and Application of Vibrating Membrane Bioreactor Device and Process. In Proceedings of the 2021 Science and Technology Annual Conference of the Chinese Society for Environmental Sciences—Environmental Engineering Technology Innovation and Application Sub-Venue, Tianjin, China, 20 October 2021; pp. 87–90. [Google Scholar] [CrossRef]
- Meng, F.; Chae, S.R.; Drews, A.; Kraume, M.; Shin, H.S.; Yang, F. Recent advances in membrane bioreactors (MBRs): Membrane fouling and membrane material. Water Res. 2009, 43, 1489–1512. [Google Scholar] [CrossRef] [PubMed]
- Meng, F.; Zhang, S.; Oh, Y.; Zhou, Z.; Shin, H.S.; Chae, S.R. Fouling in membrane bioreactors: An updated review. Water Res. 2017, 114, 151–180. [Google Scholar] [CrossRef]
- Aslam, M.; Charfi, A.; Lesage, G.; Heran, M.; Kim, J. Membrane bioreactors for wastewater treatment: A review of mechanical cleaning by scouring agents to control membrane fouling. Chem. Eng. J. 2017, 307, 897–913. [Google Scholar] [CrossRef]
- Hu, Y.; Wang, X.C.; Zhang, Y.; Li, Y.; Chen, H.; Jin, P. Characteristics of an A2O–MBR system for reclaimed water production under constant flux at low, T.M.P. J. Membr. Sci. 2013, 431, 156–162. [Google Scholar] [CrossRef]
- Hasyimah Mohd Amin, I.N.; Mohammad, A.W.; Hilal, N. Description of membrane fouling characteristics during ultrafiltration of organic foulants contained in sweetwater solutions. J. Environ. Chem. Eng. 2014, 2, 1243–1251. [Google Scholar] [CrossRef]
- Zhang, L.; Shen, Z.; Fang, W.; Gao, G. Composition of bacterial communities in municipal wastewater treatment plant. Sci. Total Environ. 2019, 689, 1181–1191. [Google Scholar] [CrossRef]
- Wei, Y.; Jin, Y.; Zhang, W. Domestic Sewage Treatment Using a One-Stage ANAMMOX Process. Int. J. Environ. Res. Public Health 2020, 17, 3284. [Google Scholar] [CrossRef]
Figure 1.
Integrated sewage treatment equipment.

Figure 2.
Illustration of the integrated A2/O-VMBR process. (PAC means Polyaluminum chloride.).

Figure 3.
Technology process for municipal treatment. (A, B, C, D, E, and F represent anaerobic, pre-anoxic, oxic, post-anoxic, and post-oxic tanks, and membrane screen, respectively.).
Figure 3.
Technology process for municipal treatment. (A, B, C, D, E, and F represent anaerobic, pre-anoxic, oxic, post-anoxic, and post-oxic tanks, and membrane screen, respectively.).

Figure 4.
The membrane module of the VMBR.

Figure 5.
Influent and effluent concentration and removal efficiency of (a) COD, (b) TN, (c) TP, and (d) NH3-N.
Figure 5.
Influent and effluent concentration and removal efficiency of (a) COD, (b) TN, (c) TP, and (d) NH3-N.

Figure 6.
Influent and effluent concentration and removal efficiency of BOD.

Figure 7.
Removal of (a) COD, (b) TN, (c) TP, and (d) NH3-N of stage Ⅱ.

Figure 8.
Technology process of (a) VMBR and (b) AMBR.

Figure 9.
The MLSS of VMBR and AMBR.

Figure 10.
Removal of nitrate nitrogen in (a) VMBR and (b) AMBR.

Figure 11.
Membrane fouling control mode of (A) VMBR and (B) AMBR.

Figure 12.
The TMP and membrane flux of A2/O-VMBR and AMBR during daily operation.

Figure 13.
The number of ASVs/OTUs in samples JYC, QYC, HYC, and MBR.

Figure 14.
Rarefaction curves of OTUs clustered at 97% sequence identity across the four samples.


Table 1.
The average of COD, TN, TP, NH3-N, BOD, and DO, and removal rate of every tank.
| Operating Parameters | Influent | Anaerobic Tank | Anoxic Tank | Oxic Tank | VMBR | Effluent | Removal Rate |
|---|---|---|---|---|---|---|---|
| COD | 42.87 | 35.87 | 29.13 | 24.5 | 20.39 | 16.53 | 61.10% |
| TN | 11.65 | 2.79 | 2.14 | 1.54 | 1.8 | 0.7 | 93.77% |
| TP | 0.2 | 0.25 | 0.24 | 0.22 | 0.23 | 0.05 | 72.86% |
| NH3-N | 1.36 | 1.43 | 1.50 | 1.27 | 1.41 | 0.68 | 54.75% |
| BOD | 4.21 | 1.58 | 2.74 | 1.46 | 0.93 | 1.39 | 66.89% |
| DO | 5.08 | 1.75 | 0.26 | 1.64 | 1.19 | 7.3 | - |
Table 2.
The average of COD, TN, TP, and NH3-N, and removal rate of every tank.
| Operating Parameters | Influent | Anaerobic Tank | Pre-Anoxic Tank | Oxic Tank | Post-Anoxic Tank | VMBR | Floatation Tank | Effluent | Removal Rate |
|---|---|---|---|---|---|---|---|---|---|
| COD | 193.22 | 32.03 | 20.32 | 19.66 | 17.10 | 16.58 | 16.58 | 16.48 | 91.01% |
| TN | 22.6 | 7.65 | 3.31 | 2.99 | 1.57 | 1.21 | 0.92 | 1.07 | 94.91% |
| TP | 1.93 | 2.21 | 0.97 | 0.59 | 0.66 | 0.66 | 0.043 | 0.043 | 97.59% |
| NH3-N | 18.41 | 5.3 | 1.71 | 0.62 | 0.63 | 0.67 | 0.72 | 0.72 | 95.58% |
Table 3.
The alpha diversity index of samples JYC, QYC, HYC, and MBR.
| Samples | Chao 1 | Faith_pd | Goods_Coverage | Observed Species | Pielou_e | Shannon | Simpson |
|---|---|---|---|---|---|---|---|
| JYC | 4348.82 | 119.40 | 0.97 | 3527.27 | 0.75 | 8.87 | 0.98 |
| QYC | 4176.74 | 113.26 | 0.97 | 3395.43 | 0.75 | 8.83 | 0.98 |
| HYC | 4224.08 | 115.22 | 0.97 | 3370.13 | 0.75 | 8.79 | 0.98 |
| MBR | 4319.41 | 118.37 | 0.97 | 3489.83 | 0.75 | 8.85 | 0.98 |
Table 4.
The water quality of influent and the standard of water (I-A standard and Grade IV).
| Index | COD (mg/L) | TN (mg/L) | NH3-N (mg/L) | TP (mg/L) | BOD (mg/L) |
|---|---|---|---|---|---|
| Range | 29.34–61.63 | 8.24–15.32 | 0.29–2.64 | 0.13–0.46 | 2.36–7.39 |
| Average value | 42.87 | 11.75 | 1.36 | 0.204 | 4.21 |
| I-A standard (GB18918-2002) [51] | ≤50 | ≤15 | ≤5 (8) | ≤0.5 | ≤10 |
| Grade IV surface water (GB3838-2002) [28] | ≤30 | ≤1.5 | ≤1.5 | ≤0.1 | ≤6 |
Disclaimer/Publisher’s Note: The statements, opinions and data contained in all publications are solely those of the individual author(s) and contributor(s) and not of MDPI and/or the editor(s). MDPI and/or the editor(s) disclaim responsibility for any injury to people or property resulting from any ideas, methods, instructions or products referred to in the content. |
© 2023 by the authors. Licensee MDPI, Basel, Switzerland. This article is an open access article distributed under the terms and conditions of the Creative Commons Attribution (CC BY) license (https://creativecommons.org/licenses/by/4.0/).
Share and Cite
MDPI and ACS Style
Ma, Q.; Han, F.; Lyu, F.; Yang, X. Municipal Sewage Treatment Technology: A2/O-VMBR Integrated Technology for Municipal Treatment and Improved Pollutant Removal. Water 2023, 15, 1574. https://doi.org/10.3390/w15081574
AMA Style
Ma Q, Han F, Lyu F, Yang X. Municipal Sewage Treatment Technology: A2/O-VMBR Integrated Technology for Municipal Treatment and Improved Pollutant Removal. Water. 2023; 15(8):1574. https://doi.org/10.3390/w15081574
Chicago/Turabian StyleMa, Qian, Fengze Han, Feng Lyu, and Xiaojun Yang. 2023. "Municipal Sewage Treatment Technology: A2/O-VMBR Integrated Technology for Municipal Treatment and Improved Pollutant Removal" Water 15, no. 8: 1574. https://doi.org/10.3390/w15081574
Note that from the first issue of 2016, this journal uses article numbers instead of page numbers. See further details here.