Article

Sustainability Analysis of the Water Environment Carrying Capacity of Harbin City Based on an Optimized Set Pair Analysis Posture-Deviation Coefficient Method Evaluation Model

1
Key Laboratory of Efficient Use of Agricultural Water Resources, Ministry of Agriculture and Rural Affairs of the People’s Republic of China, Northeast Agricultural University, Harbin 150030, China
2
College of Water and Civil Engineering, Northeast Agricultural University, No. 600 Changjiang Road, Harbin 150030, China
3
Heilongjiang Academy of Environmental Sciences, Harbin 150030, China
4
School of Geography, Earth and Environmental Sciences, University of Birmingham, Edgbaston, Birmingham B152TT, UK
*
Author to whom correspondence should be addressed.
Water 2023, 15(8), 1575; https://doi.org/10.3390/w15081575
Submission received: 30 March 2023 / Revised: 10 April 2023 / Accepted: 13 April 2023 / Published: 18 April 2023

Abstract

:
To scientifically measure the water environment carrying capacity of Harbin City and its change trend, based on analysis of the implications of the sustainability of the urban water environment’s carrying capacity, an evaluation index system for the sustainability of the water environment carrying capacity of Harbin City was constructed. Most existing evaluation methods rely on static data to construct correlation functions between research objects and rank criteria, while the dynamic nature of the information is not considered enough. In this paper, we use hierarchical analysis (analytic hierarchy process, AHP) to determine the weights of each index of the system and then apply the projection tracing method (projection pursuit, PP) to optimize the determined weights. Combining the set pair analysis posture evaluation method and bias coefficients method to explore the dynamic balance mechanism between different index factor levels, a sustainability evaluation model for water environment carrying capacity integrating informational evolution is constructed. Finally, the applicability of the optimization model is tested by comparing the confidence criterion judging method. The model realizes quantitative evaluation of the carrying capacity of the urban water environment. It provides a new and effective means for accurate and reasonable determination of the coefficient of variance and the number of links and dynamic analysis of the water environment carrying capacity system and judgment of its sustainable development trend. The results show that the weight for water resource quality is 0.55, which is the subsystem with the greatest overall impact on the carrying capacity of the water environment in Harbin. The evaluation level of the set-to-potential eigenvalue for 2010–2017 is biased positive 2, and the rest of the years are quasi 2. The reduced value of the coefficient of oppositeness corresponding to the years 2010–2017 is more significant. The maximum value of the dynamic evolution of the load-carrying capacity level is nearly −0.35. From the vertical comparison of different levels, it is found that the water environment carrying capacity of Harbin City gradually recovered to the normal loadable level over time. This overall shows an improving trend.

1. Introduction

The carrying capacity of the urban water environment is a comprehensive reflection of the interaction between the water environment and the social economy and environment and is an important indicator for evaluating water security. When the carrying capacity of the water environment exceeds a certain threshold, it will seriously restrict economic and social development, while affecting food and ecological security [1]. This urban water environment carrying capacity study is based on urban environmental assessment and is a comprehensive study, with a reasonable configuration of the water environment as the premise, water environment capacity potential and developmental prospects as the core, systems analysis and dynamic analysis as the means, and coordinated development of population, economy, and the environment as the goal of its integrated nature [2]. Therefore, it is important to make an accurate evaluation and diagnosis of the carrying capacity of the urban water environment to ensure water security and rational use of the water environment in the context of economic and social development.
Current methods of evaluating the carrying capacity of urban water environments mainly include the comprehensive index method, projection tracing method, fuzzy comprehensive evaluation method, and principal components analysis [3]. In addition, the system dynamics method and multi-objective model analysis method are mostly used for water environment carrying capacity evaluation under different urban development patterns [4]. The background analysis method and dynamic simulation recursive algorithm are mostly used to seek the limit value of urban water environment carrying capacity [5]. However, study of the carrying capacity of the water environment is related to regional environment, population, and economic development level and prospects for sustainable development, which represent an important issue involving a wide range of content and complexity [6].
At present, research on regional water environment carrying capacity evaluation and diagnosis is still incomplete, lacking an effective theoretical framework and quantitative calculation methods. The identification of load-bearing vulnerability factors and the quantitative study of load-bearing state changes are less well studied, and both have certain shortcomings in their applications. The inexact fuzzy multi-objective planning model (IFMOP) [7] requires a large amount of data to determine its parameter distribution and cannot apply uncertain information to the optimization results. The ecological footprint method (TEF) [8] is difficult to use to determine the conversion between indicators in the calculation of the carrying capacity of multiple indicators. The traditional DPSIR model [9] uses AHP to determine the weights, focusing on non-environmental factors and ignoring ecological factors. To better seek a connection between evaluation indicators and evaluation criteria, the set pair analysis method is introduced into the evaluation of water environment carrying status. The set pair evaluation method [10] takes into account the fuzziness of the boundary of the hierarchical criteria, avoids the differential uncertainty coefficient in the direct determination of the linkage degree, and evaluates water environment carrying status in different years and different regions; a subsequent study by Wang et al. [11] also integrates static and dynamic evaluation systems, expands research on the evaluation of water environment carrying capacity indicators, and takes Heilongjiang province as an example to analyze in depth the water environment. The development trend in water environment carrying capacity was analyzed in depth by taking Heilongjiang province as an example. There are four specific problems, as follows. (1) Lack of a systematic and scientific urban water environment carrying capacity sustainability evaluation index system and corresponding grade standards [12,13,14]. (2) The index weights cannot be determined reasonably accurately [15,16,17,18]. (3) Lack of quantitative evaluation models with high applicability [19,20,21]. (4) It is difficult to accurately determine the indicators of water environment carrying capacity disadvantages [22,23]. In summary, the index weights determined based on AHP are weighted using the projection pursuit–analytic hierarchy process (PP-AHP) optimization method. Then, we explore the dynamic equilibrium mechanism between different classes using a combination of the optimized set pair analysis posture evaluation method and bias coefficients method and construct a water environment carrying capacity sustainability evaluation model integrating informational evolution. The innovative advantage of this model over other researchers’ models is its ability to further optimize the indicator weights determined by the AHP method. Exploiting the uncertainty in the information of the AHP legal weighting results, it better combines the advantages of subjective weighting by the AHP method and objective weighting by the PP method and realizes revised optimization of the number of links and comprehensive dynamic determination of the coefficient of variability. This method is highly applicable and can accurately determine the inferiority index of water environment carrying capacity, and the evaluation results are accurate and reliable.
This paper takes into account the variability of the degree of influence of ternary linkage components on the discussed set of system dynamics [24,25,26]. Further, it enriches dynamic evaluation and analysis methods for multi-level problems in complex systems. The optimized set pair potential-bias coefficient method is applied to sustainability analysis of the water environment carrying capacity of Harbin City. Twenty evaluation indicators were selected from the economic, social, resource, environmental, technical, and management fields involved in the carrying capacity of the water environment. An indicator system with a three-level progressive hierarchy was constructed. Combined with the weights determined by the AHP method, the PP method is used to further explore the characteristics of the data itself and optimize the AHP weights. The PP-AHP method is combined with the set-to-potential theory to construct the water environment carrying capacity evaluation model based on the PP-AHP method to determine the weights [27,28,29,30]. The validity of this model was verified by taking Harbin City water environment carrying capacity evaluation as an example. The study shows that the applied model has good applicability to dynamic water environment carrying capacity evaluation containing multiple indicators and factors. Systematic and scientific confirmation and planning of the urban water environment carrying capacity sustainability evaluation index system and corresponding ranking criteria were achieved. An accurate diagnosis of the inferiority indexes affecting water environment carrying capacity was carried out. The model achieves a reasonable and accurate determination of index weights and is a quantitative evaluation model with high applicability.

2. Materials and Methods

2.1. Study Area

Harbin (125°42′–130°10′ E, 44°04′–46°40′ N) is located in the northeast of China, southwest of Heilongjiang Province, and is the capital of Heilongjiang Province. Harbin is the largest city in China in terms of area (53,100 square kilometers) and the second largest mega-city in terms of population (9,432,000 people) and is also a city with key national industrial bases. Harbin City’s per-capita water resources for many years occupy 950 m3, with a national per-capita level of 55%. Harbin City’s per-capita water resource possession is only 230 m3, and the city’s water area has been recovering year by year. Up until now, there have been four municipal nature reserves, with an area of 57,000 hectares. The forest coverage rate reaches 45.88%, ranking third among sub-provincial cities in China. The total area of the wetlands is 300,200 hectares, accounting for 5.8% of the city’s total land area, including eight national-level wetlands and four provincial-level wetlands. The proportion of ecological demonstration areas has reached 80%, and the city’s per-capita park green space has reached 10.1 square meters. By the end of 2020, the water area of Harbin City only accounted for 0.08% of the total land area. Over the past 10 years, 100% of the city’s centralized drinking water has met standards. The city’s 25 surface water national examination sections meet the standard rate of 88%, including an excellent rate of 72%. The centralized urban sewage treatment rate reached 88%, an increase of 2.5 percentage points, and the water quality of the main Songhua River steadily rose to the national three-class standard. The municipal domestic waste treatment rate reached 75.09%, an increase of 0.3 percentage points. The industrial solid waste disposal utilization rate reached 100%. At present, Harbin City has become an aging society; the mobile population has become the main driving force of population growth in Harbin City. From the perspective of economic structure, the proportion of tertiary industry has reached over 50% and is expected to expand further in the future. From the perspective of water allocation, the structure of water consumption is extremely uncoordinated with the structure of the economy. With the future expansion of industry, there will be a tendency for this to continue to worsen.

2.2. Data Sources

Statistical data for 20 subsystems in the Harbin water environment carrying capacity index system are taken from the Harbin Statistical Yearbook (2006–2020), Heilongjiang Provincial Yearbook (2006–2020), Heilongjiang Statistical Yearbook (2006–2020), Harbin Environmental Quality Bulletin (2006–2020), and Harbin National Economic and Social Development Statistical Bulletin (2006–2020).

2.3. Methods

We established a corresponding index system for the carrying capacity of the urban water environment under different periods and different strategies, which reflect the scale and quality of sustainable development of the “socio-economic environment” system [31]. Based on research results from the existing sustainable development index system, we used frequency statistics, theoretical analysis, and expert consultation to select from the index systems of ecological provinces, cities, and counties. Since the water environment on earth is a complex system affected by many factors, such as soil, geography, meteorology, rivers, and vegetation, it is impossible to consider comprehensively when calculating its carrying capacity [32,33]. To scientifically standardize and guide the construction of ecological provinces, Harbin City has previously carried out the construction of ecological cities per national requirements and has comprehensive, scientific, and accurate statistics for these indicators, which can meet the requirements of the model for data. To further improve the comprehensiveness and representativeness of the index system, this paper selects relevant indexes such as per-capita GDP, industrial water repetition rate, urban domestic sewage centralized treatment rate, etc. In addition to the characteristics of the water resources, it also selects important indexes, such as urbanization level, industrial realized added value, etc. Finally, 20 kinds of items with the greatest effects on the water environment are selected as the impact indexes for the carrying capacity calculation. A system of indicators with three progressive levels is constructed. Thus, the indicators in this paper are more comprehensive, systematic, and scientific. The structure of the index system of the carrying capacity of the water environment in Harbin is detailed in Figure 1. Based on the 20 evaluation indicators, the ternary evaluation coefficients were calculated for each study object. The objective weights of the indicators were determined using the optimized PP-AHP method. A unified quantitative characterization of the positive and negative postures and levels in which the system is located was performed. Then, we analyzed the evolutionary law between the adjacent components of the ternary linkage number and used the sum of the first-order evolution values of each component adjacent to a certain component based on the first-order partial linkage number method to portray the support degree of the linkage number to each rank. In turn, we determined the ranks of the objects of study, achieved a preliminary evaluation of these, and explored the depth of evolution between the same and opposite components. The details of the evaluation level criteria used for constructing this paper are shown in Table 1. The model was then further extended using second-order partial linkage to compare with the study. The above methods were combined to evaluate and analyze the sustainability of the carrying capacity of the water environment.
Firstly, as the capital of Heilongjiang province, Harbin City has attached great importance to water environmental protection work in recent years, and constantly increases its protection and construction efforts, which have achieved positive results, making the water environment carrying capacity evaluation model applied to Harbin City representative; on the other hand, the water environment situation in Harbin City is serious, and requires a more accurate model for evaluation in order to find the inferiority indexes and to strictly control and manage them. In summary, the structure of the index system of the water environment carrying capacity of Harbin City is constructed as detailed in Figure 1, and the evaluation level criteria of this paper are constructed as detailed in Table 1. The data are real and reliable, with clear practicality, extensiveness, comparability, dynamism, typicality, and comparability [34,35,36,37,38].

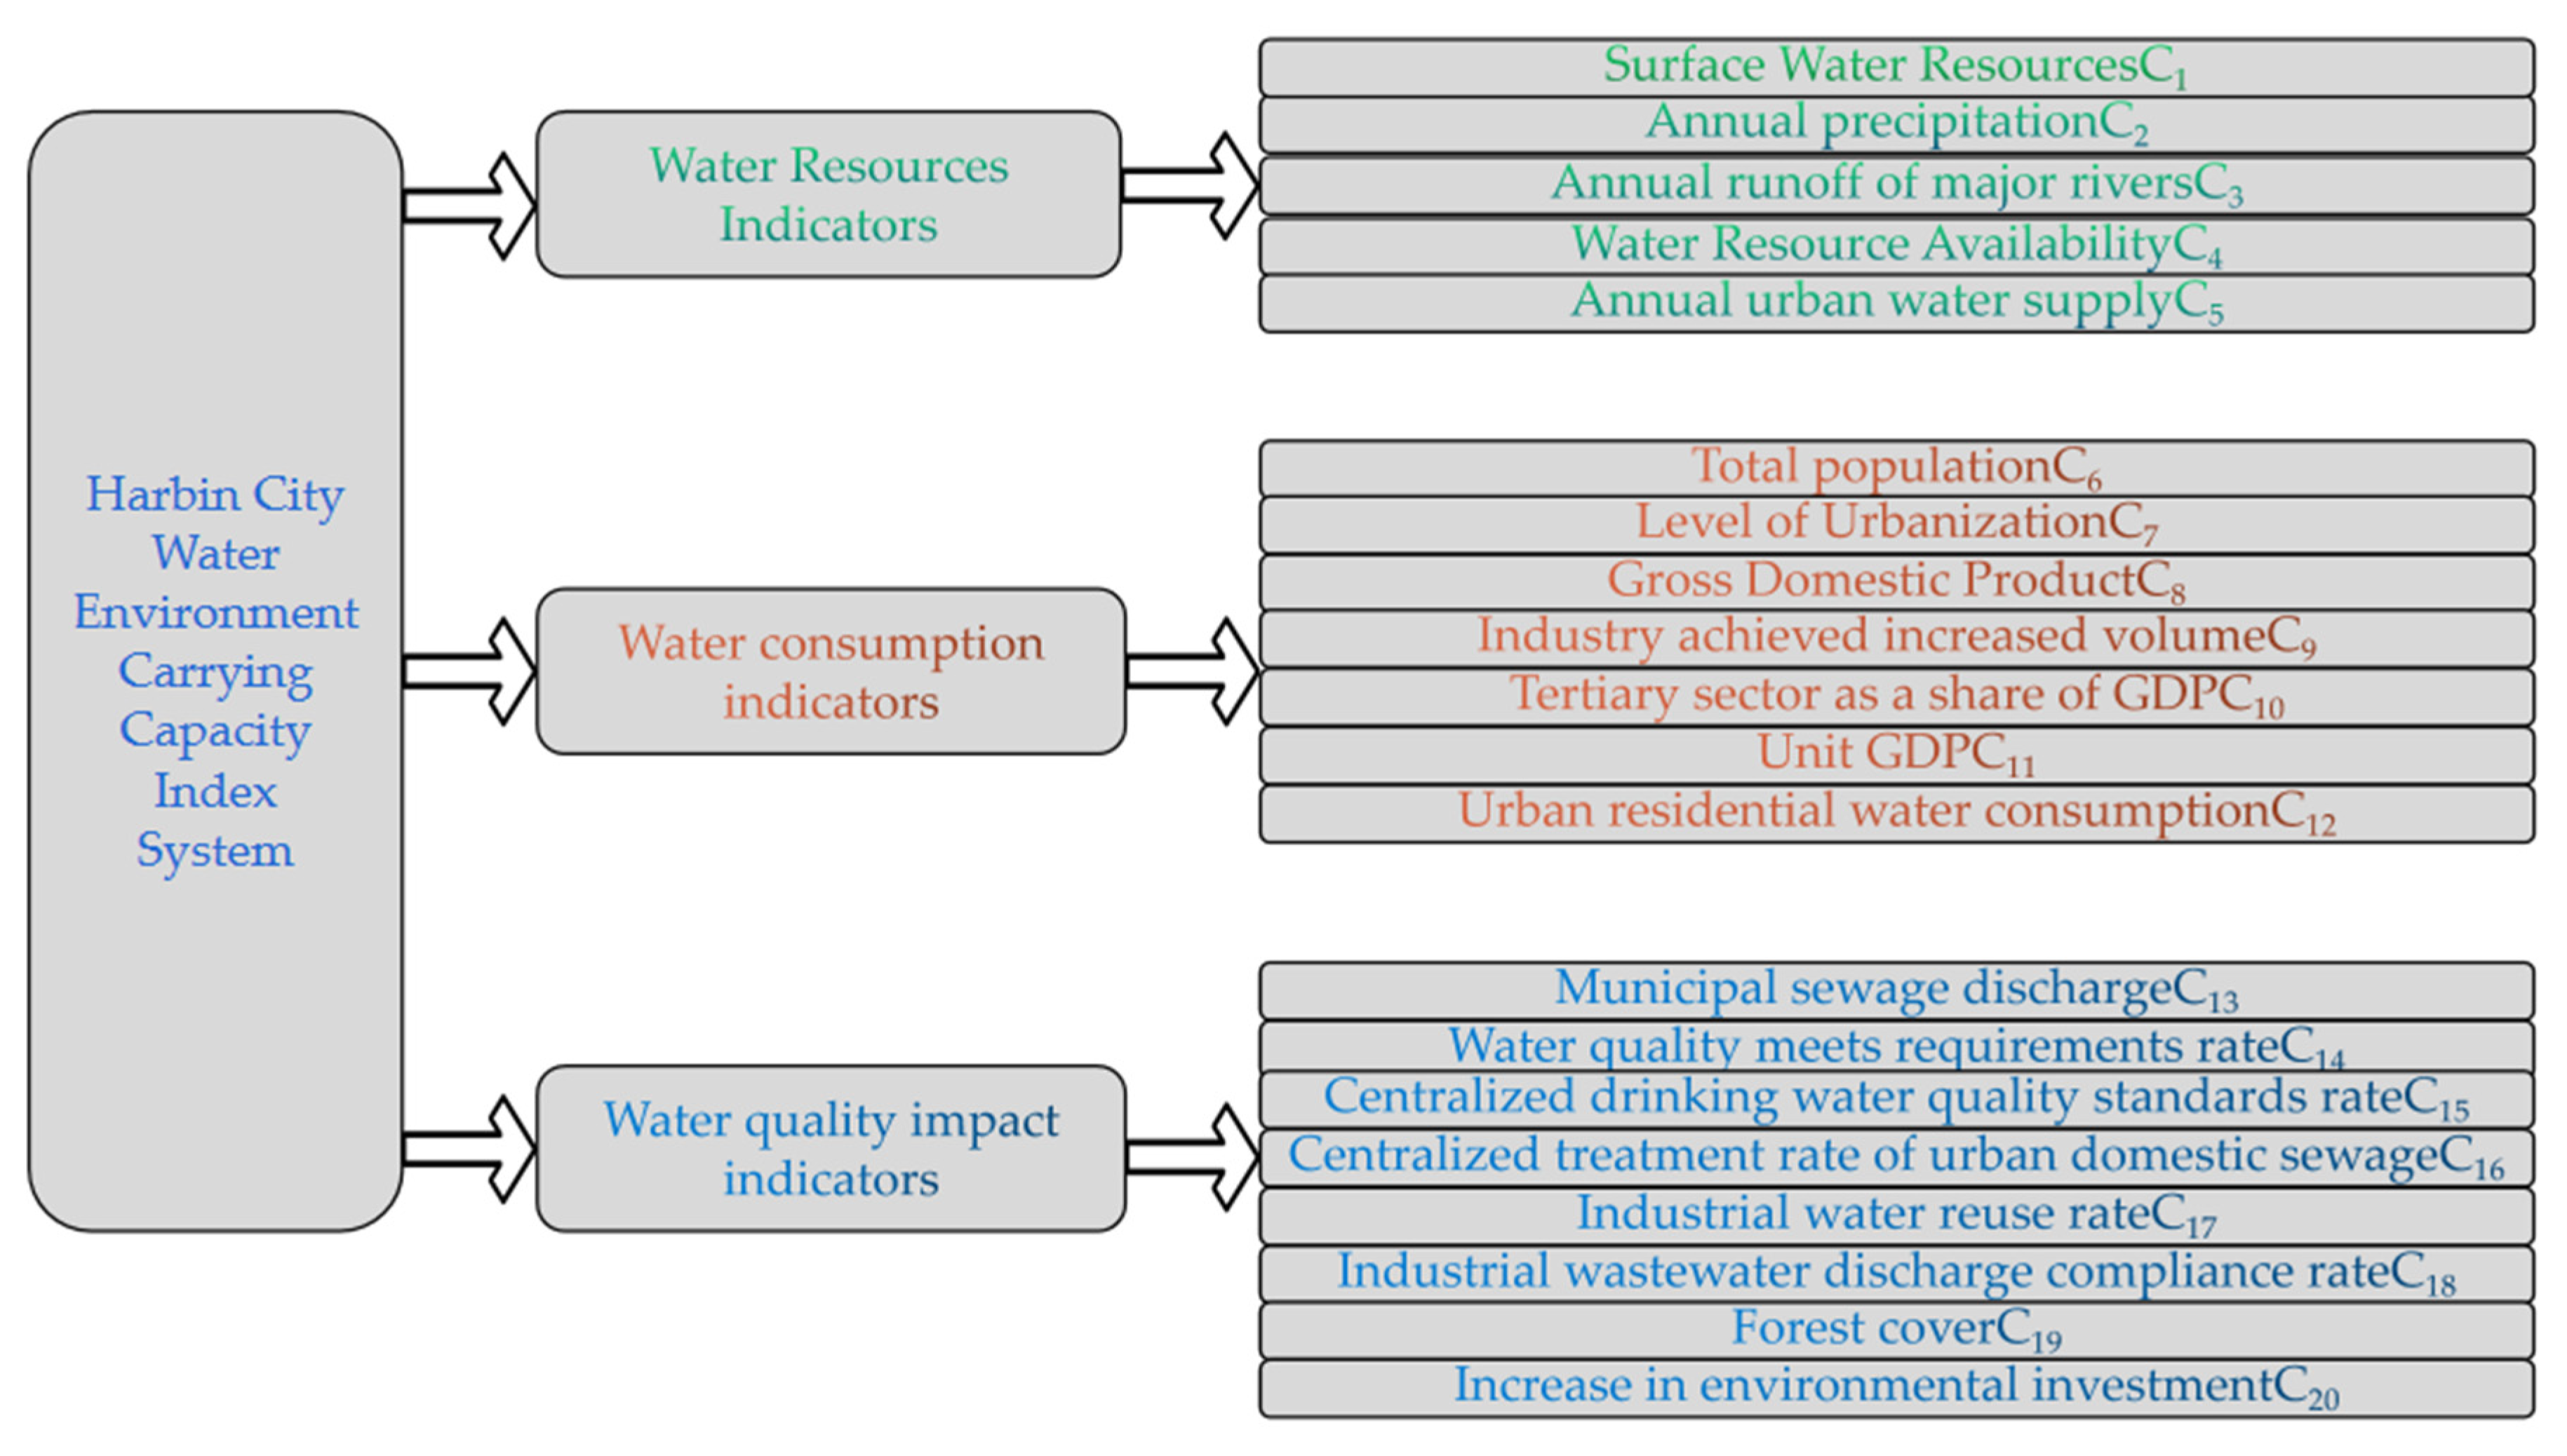
2.3.1. Relationship between System Methods

The set-potential analysis method is commonly used to deal with uncertainty in systems. The qualitative and quantitative analysis of uncertainty in problems can make the evaluation’s results more objective by establishing the number of links with rules or levels to evaluate the system under study. The general expression of the linkage number is
u = a + bI + cJ
where a, b, and c represent the degrees of identity, difference, and opposition, respectively; I and J represent the coefficients of difference and opposition, respectively.
For a specimen, there are N evaluation indicators, if S of them are better than the standard, P exceed the standard, and F is not measured or lacks comparisons. Let a = S/N, b = F/N, and c = P/N; then, a, b, and c are homogeneity, variance uncertainty, and opposition, respectively. Under the aforementioned definition, a, b, and c satisfy the normalization condition; that is, a + b + c = 1. According to the theory of set pair analysis, the degrees of homogeneity and opposition are relatively certain, while the degree of difference is relatively uncertain; at the same time, since a, b, and c are comprehensive portrayals of different aspects of the same problem, there are interconnections, constraints, and transformation relationships among them.
Set pair potential is used to reflect the degree of association between two sets with the same or different inverses, according to the correspondence between the set pair potential eigenvalues and rank, which effectively reflect the situation of the system and the range of rank. In the evaluation of the carrying capacity of the water environment in this paper, Level 1 corresponds to a bearable state, indicating that the city’s water environment has sufficient carrying capacity, Level 2 corresponds to a critical state, indicating that the degree of water environment utilization has reached a critical level; and Level 3 is an overload state, indicating that the carrying capacity of the water environment is close to saturation, and if this state is maintained for a long time, water shortage will occur. The bias coefficient method reveals the dynamic evolution law of the homogeneous inverse component, which can analyze the system’s state trend. The posture and degree of the system are studied according to the set pair analysis and posture analysis methods [39,40]. The support for evaluation Levels 1, 2, and 3 is inscribed using the partial coefficient of support method. The ranks are then determined according to the principle of maximum support [41].
The PP method can solve the problems of high dimensionality and nonlinearity of data to a certain extent, and also can fully exploit the characteristics of the data itself [42,43]. However, there is sometimes a clear inconsistency between the determined objective weights and subjective perceptions. The hierarchical analysis method starts from the evaluator’s understanding of the nature and elements of the evaluation problem. The thinking process in decision-making is mathematized using less quantitative information. This is more about qualitative analysis and judgment than general quantitative methods [44]. Previous subjective weighting methods, such as hierarchical analysis based on expert judgment (AHP), have been studied to produce a certain subjective arbitrariness, leading to the problem of uncertainty in evaluation of the results on urban water environment carrying capacity [45]. The optimized set pair potential-bias coefficient evaluation model determines the index weights based on the PP-AHP optimization method, based on the original two-method evaluation model. The PP method can further optimize the index weights determined by the AHP method and tap into the uncertainty information of the AHP legal weighting results. The PP-AHP method can further optimize the index weights determined by the AHP method. The uncertainty information for the weighting results of the AHP method is used to better combine the subjective weights of the AHP method with the objective weights of the PP method. The PP-AHP method can further optimize the index weights determined by the AHP method, explore the uncertainty information of the AHP legal weighting results, and better combine the advantages of the subjective weighting of the AHP method and objective weighting of the PP method to reduce the risk of unreasonable evaluation results caused by the uncertainty of index weights. At the same time, considering the evolution between the two neighborhood levels of “same-different” and “different-trans”, a deep second-order evolution is added, and its evolution rate also plays a certain guiding role in determining the evaluation results. Finally, using the confidence criterion judgment method for the set pair analysis coefficients, multiple confidence values are selected for rank judgment, then compared with the above data results. Evaluation of the state and development trends of the urban water environment carrying capacity system was carried out by considering the weights of the selected indicators, the development trend of the system and its degree, and the ranking determined by the bias coefficient method [46].

2.3.2. Calculating Optimization Index Weights

The water environment carrying capacity evaluation index system and evaluation level criteria were constructed (Table 1). The standard sample values are obtained by linear interpolation m times in three-grade intervals and are dimensionless. Let the generated standard sample bearing capacity empirical grades and index values be
y i ( i = 1 , 2 , , m + 2 ) x i j * ( i = 1 , 2 , , m + 2 ; j = 1 , 2 , , n )
where n is the number of indicators of the evaluation system and m is the number of linear interpolations. xij is the standard sample value. x*ij is the dimensionless standard sample value.
According to Table 1, the highest experience level is set to 3, the lowest experience level is set to 1, and the experience level increases with a decrease in the bearing level [47].
Z i = j = 1 n c j x i j *
max Q ( c ) = | R |
where the multidimensional data {x*ij} is projected in the direction of vector c to obtain the one-dimensional projection value Zi. To explore the correlation between the evaluation level and the bearing capacity evaluation index, the projection index function is constructed so that the absolute value of the correlation coefficient |R| between the projection value Zi and the experience level yi is as large as possible.
The AHP establishes a step hierarchy model based on objective layer O, criterion layer C, and solution layer P. This hierarchy reflects the relationship among the influencing factors, but each influencing factor in the criterion layer does not necessarily have the same importance to the user. They each have different weights in the users’ minds, so it is necessary to determine the weights of each influence factor by constructing judgment matrices for the criterion layer and the solution layer.
A is a consistent matrix when the maximum characteristic root λ = n of the nth-order positive and negative reciprocal matrix A. In general, the judgment matrix we obtain is usually not a consistent array, but we can use the weights derived from the hierarchical single ranking as long as the consistency of the judgment matrix is within an acceptable range. After that, the synthesis of weights under a single criterion is to be performed.
ω j = j = 1 n a j c i j
where aj is the corresponding weight of the element in the criterion layer B. cj is the corresponding weight of the element in the scheme layer P. ωj is the combination weight.
Although the weights under every single criterion are consistent, the combined weights are subject to consistency testing because the inconsistencies may accumulate as the weights under the single criterion are accumulated. When CR < 0.10, the consistency of the hierarchical total ranking results is acceptable.
C R = j = 1 n C I ( J ) a j j = 1 n R I ( j ) a j
where CR is the consistency ratio. RI is the total rank-averaged random consistency index. CI is the single-criterion consistency index.
For the sake of simplicity and without loss of generality in mining the uncertainty information of the weights of the AHP method, the AHP weights are further optimized by the PP method. The weights of the required solution in this paper are limited to a reasonable range according to the relationship between the weights and the projection direction. This optimization problem is solved by a genetic algorithm to obtain the optimal projection direction (the direction of vector c). Based on c, cj is obtained, and the weight of indicator j is taken as c2j. Based on the mathematical properties of the projection values and the requirements of the weight solution of this paper, the constraints of the projection indicator function are set.
i = 1 n c i 2 = 1 0.2 c 1 , c 2 , c 3 , c 4 , c 5 0.2 0.1 c 6 , c 7 , c 8 0.1 0.05 c 9 , c 10 , c 11 , c 12 0.05 0.1 c 13 , c 14 , c 15 , c 16 , c 17 , c 18 , c 19 , c 20 0.1

2.3.3. Calculating Evaluation Linkage

The number of ternary links of sample values is calculated based on the main mathematical tools in the theory of set pair analysis [48]. Based on the evaluation level criteria, the ternary linkage of the negative indicators of the sample values is calculated using Equations (8)–(10), where s1j to s3j are the critical values of the evaluation criteria from Levels 1 to 3, respectively. s0j is another, more distant critical value in the evaluation criteria interval; i = 1, 2,…, j = 1, 2,…, n. For positive indicators, it is sufficient to reverse the interval number on the right side of Equations (8)–(10).
u i j 1   = 1 , x i j s 1 j ; 1 2 x i j s 1 j s 2 j s 1 j ; 1 , x i j > s 2 j , s 1 j < x i j s 2 j ;
u i j 2   = 1 2 s 1 j x i j s 1 j s 0 j , x i j s 1 j ; 1 , s 1 j < x i j s 2 j ; 1 2 x i j s 2 j s 3 j s 2 j , s 2 j < x i j s 3 j ; 1 , x i j > s 3 j
u i j 3   = 1 , x i j s 1 j ; 1 2 s 2 j x i j s 2 j s 1 j 1 , x i j > s 2 j , s 1 j < x i j s 2 j ;
The affiliation degree and the number of single-indicator value links for ranks k = 1, 2, and 3 were calculated using Equations (11) and (12). From Equations (13) and (14), the number of evaluation index value linkages for sample i is calculated (i = 1, 2,…, m).
v i j k * = 0.5 + 0.5 u i j k
v i j k = v i j k * / k = 1 3 v i j k *
u i j = v i j 1 + v i j 2 I + v i j 3 J
u i = v i 1 + v i 2 I + v i 3 J = j = 1 n ω j v i j 1 + j = 1 n ω j v i j 2 I + j = 1 n ω j v i j 3 J
where ωj is the weight of the jth evaluation index.

2.3.4. Calculating Set-to-Potential Eigenvalues

The traditional set-to-potential calculation method is a/c. The calculation result will divide the two sides into the same-potential area and the anti-potential area with 1 as the dividing point. The range of the potential values is limited to [0, +∞), and it is not easy to establish mutual correspondence with the evaluation level values. Based on this, the ternary subtraction set-to-potential method is used. The value interval is transformed to [−1, 1], which improves the problem of ambiguous correspondence between the grade values and effectively enhances the application effect. In the water environment carrying capacity evaluation system, the numerical value of the grade is generally expressed by the numbers 1, 2, and 3. The actual correspondence is established by combining the available research results and evaluation questions, as shown in Table 2. The eigenvalues 1, 2, and 3 of the rank values 1, 2, and 3, respectively, correspond to the set pair potential-eigenvalue (SE) of the contact number, defined as
SE = a + 2b + 3c
where the set pair potential eigenvalues of the ternary linkage number are taken in the closed interval [1,3], which can effectively reflect the situation and rank range of the system’s posture.

2.3.5. Determination of Rank by the Partial Coefficient Method

The motion of the linkage component in the principle of partial linkage number determines the evolutionary trend of the structure of its system at the micro level. This evolutionary trend may be the same, may be different, or may be opposite to the evolutionary dynamics of the contact component at the macro level. Taking Level 1 as an example, if only the first-order evolution of the information component is considered, component a plays an absolute support role for Level 1, and the support is recorded as 1. There is an evolution of component b to level a, so the support role of component b for Level 1 needs to be considered. ∂+a reflects the rate of evolution of level b to level a, i.e., the support of component b to Level 1. Component c plays an absolute antagonistic role to Level 1, and the support rate is recorded as 0. The number of ternary evaluation links is noted as vector U = (a, b, c), its first-order support rate matrix for each level, and the first-order support degree vector S′ for the levels.
R   = 1 b 0 + a 1 c 0 + b 1
S′ = U·R′ = (S1′, S2′, S3′)
The magnitudes S1′, S2′, and S2′ are compared and the rank is determined according to the principle of maximum support. Second-order biased positive correlations 2+a indicate the evolution rate of the opposite component to the positive component and reflect the support of the opposite component to “Rank 1” in the evaluation process. In contrast, the second-order negative correlation c indicates the evolution rate of the positive component to the negative component and reflects the support of the same component to “Rank 3” in the evaluation process. Based on this, Equation (16) is extended to obtain the second-order support matrix for rank determination and the second-order support vector S″ for each rank. The magnitudes of S1″, S2″, and S3″ are compared, and the rank is determined again according to the principle of maximum support.
R = 1 a 2 c + a 1 c 2 + a + b 1
S″ = U·R″ = (S1″, S2″, S3″)

2.3.6. Comparative Test of Applicability by the Confidence Criterion Judging Method

Application of the confidence criterion judging method can assist in decision-making in the problems of the fuzzy comprehensive judging method and can correct the problems where the principle of maximum subordination is not applicable. The confidence criterion is defined as letting (C1, C2,…, Ck) be an ordered partition class (i.e., the set of evaluation levels) of the rubric space F, If C1 > C2 > … > Ck (i.e., “good > good > fair > poor > poor”).
g ( i ) = min k * k * k = 1 k * v i k > λ
where the formula λ is the confidence level, which is generally taken within [0.50, 0.70].
In summary, the steps of constructing the model can be summarized as follows. (1) Clarify the object of research and evaluation, and determine the index system and its ranking criteria. (2) Calculate the optimized index weights. (3) Calculate the evaluation coefficients by combining the data. (4) Calculate the set of potential characteristic values and determine the ranking range. (5) Determine the ranking by combining the partial coefficients method. (6) Test the applicability by comparing the confidence criterion evaluation method. (7) Evaluate and analyze the urban water environment carrying capacity by integrating the data results.

3. Results and Discussion

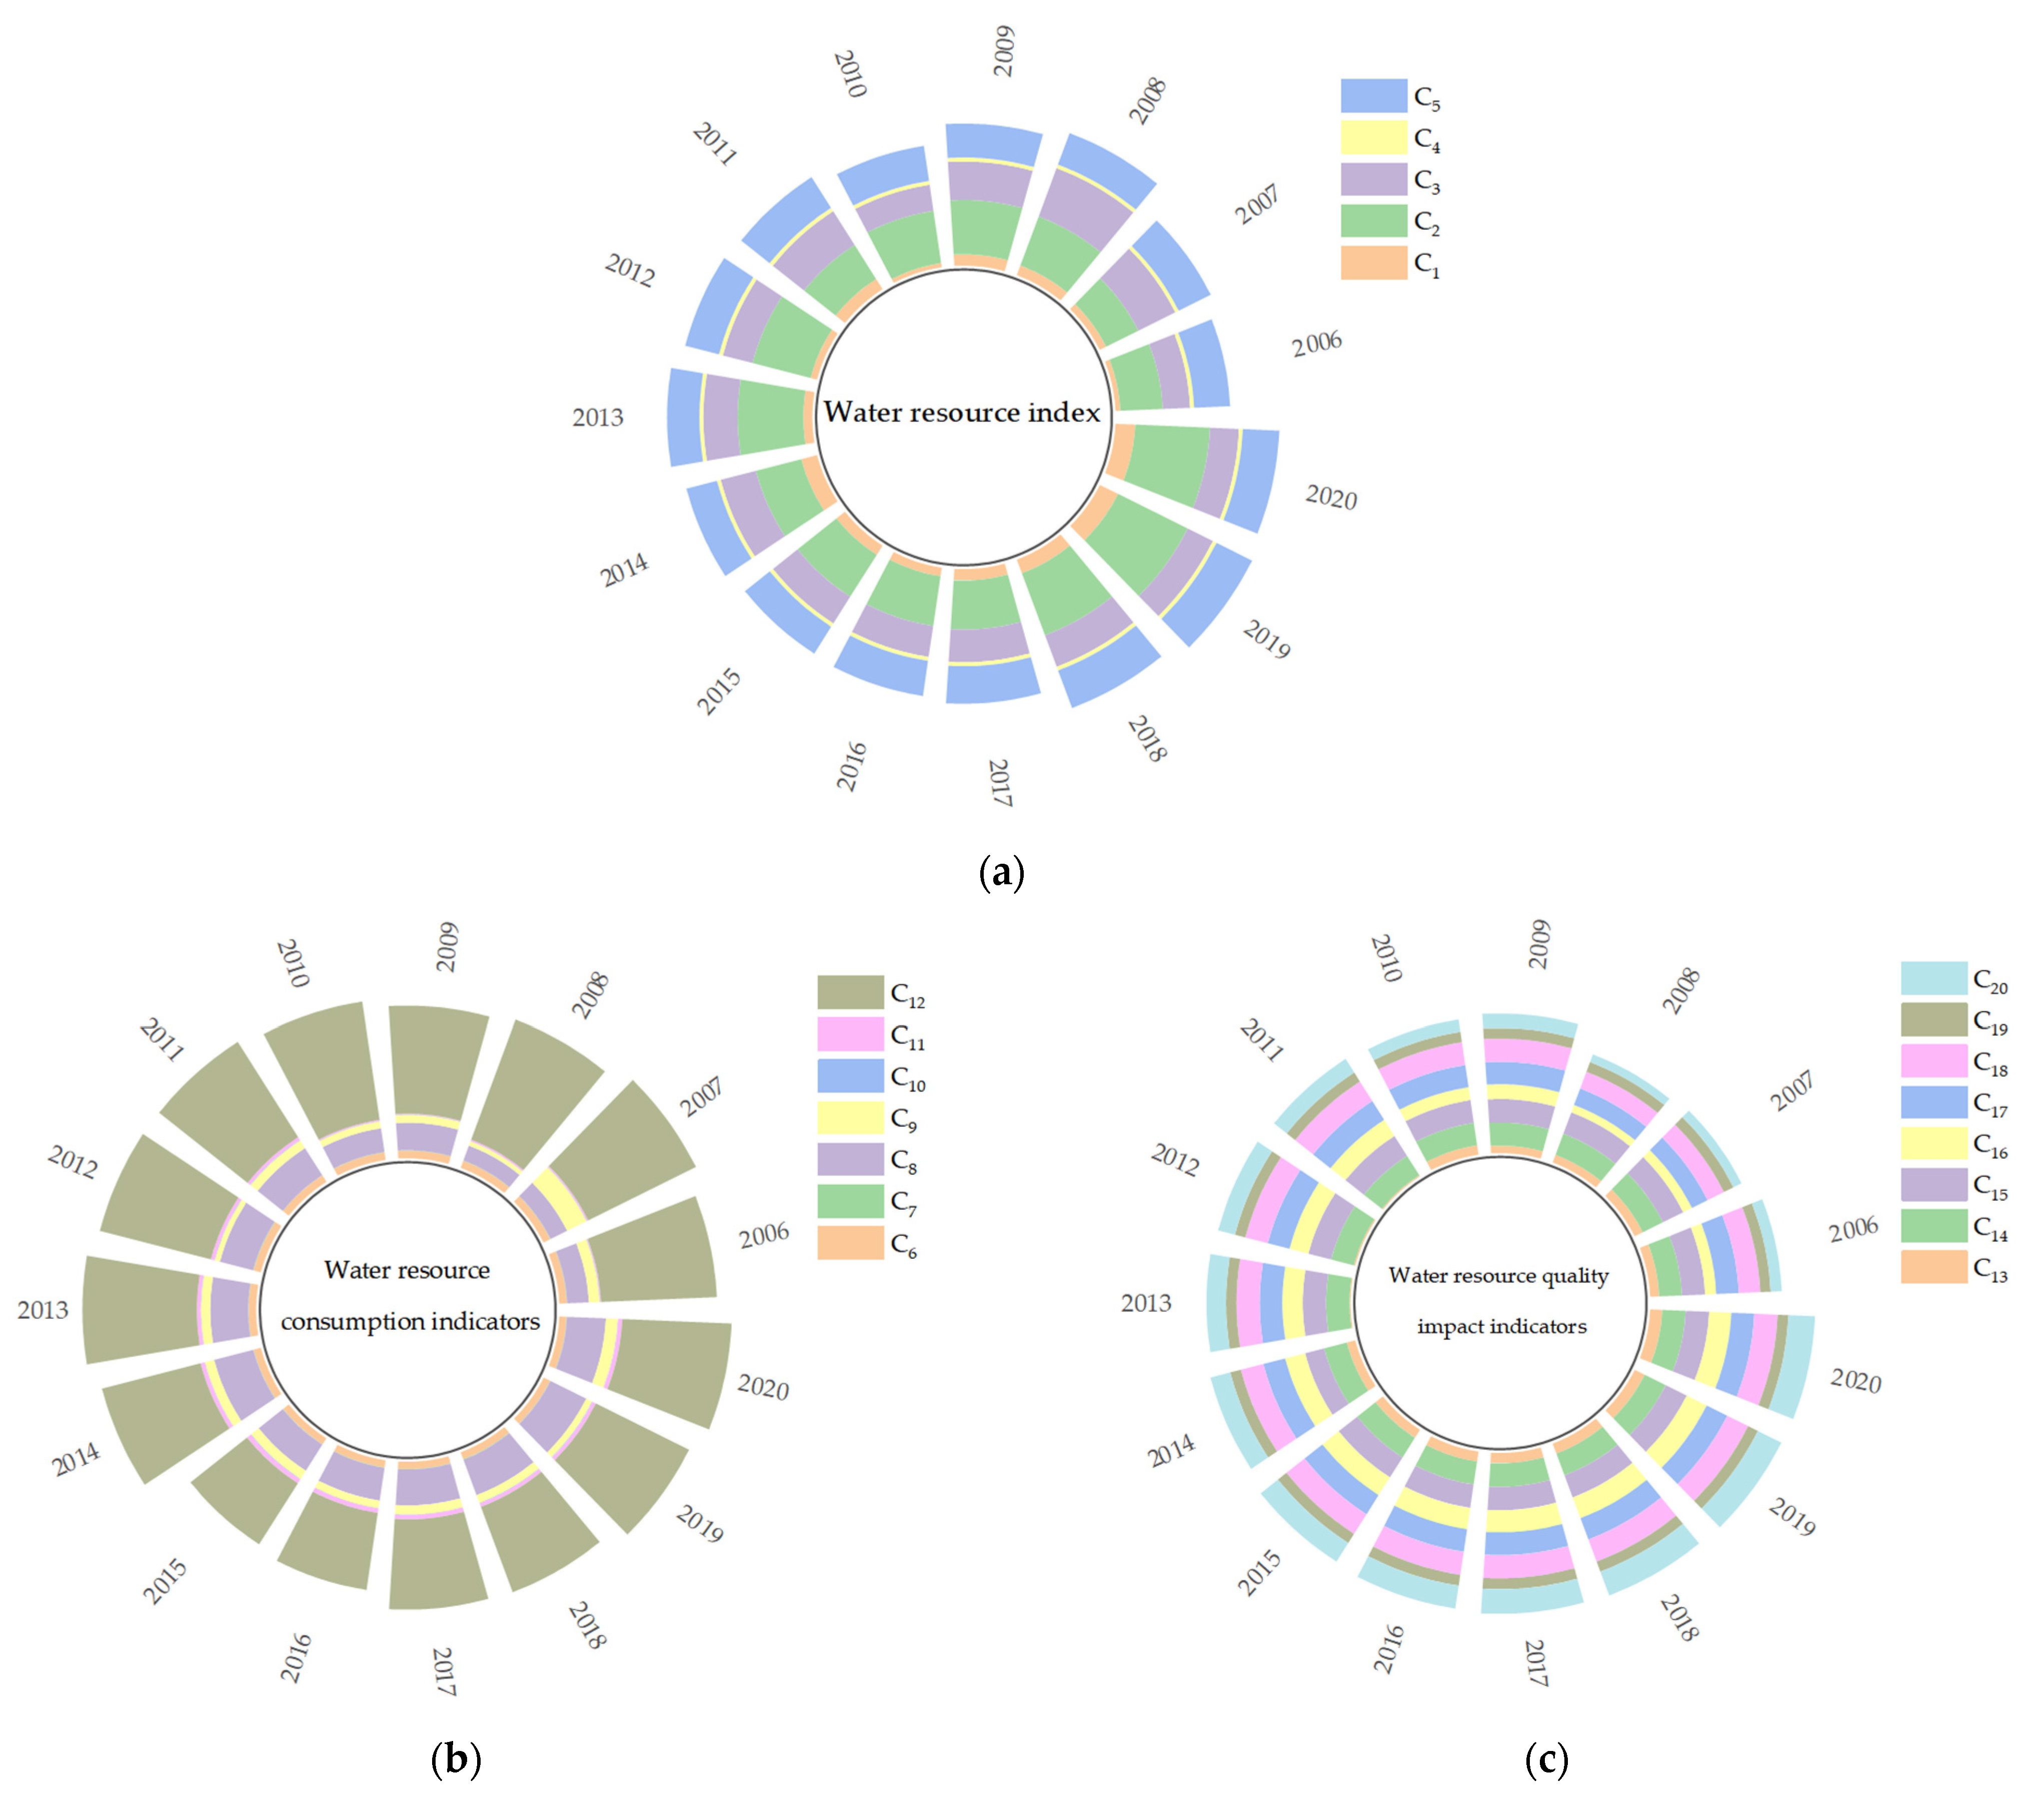
3.1. Load Factor Values and Evaluation Index Weights

Figure 2 is a radial stacked bar chart of the specific values of the factors influencing the carrying capacity of the water environment in Harbin from 2006 to 2020. Wang et al. composed the index system for a comprehensive evaluation of the water environment carrying capacity of Daqing City based on nine main factors. We selected 20 evaluation indicators from the economic, social, resource, environmental, technical, and management fields involved in water environment carrying capacity, which makes the factors in water environment carrying capacity more complete [49].
From Table 3 and the related calculation results, it can be seen that AHP weights are more influenced by subjective judgment uncertainty due to some indicators, such as C6 and C7; C1 and C10; and C14, C15, C16, and C18 having the same weight values, which indicates that the AHP weights are relatively rough in reflecting the complex situations of multi-objective, multi-level, and multi-criteria real systems. Xu et al. used the AHP method and entropy weighting method to calculate the weights of each indicator, ignoring the importance of the indicators themselves, and sometimes the determined indicator weights can be far from the expected results [50]. The PP-AHP method can further optimize the index weights, and the PP-AHP weight-solving method closely combines the AHP experts’ empirical weighting with the objective weighting of the PP method. This is not only close to the actual situation but also avoids excessive human intervention. According to the PP-AHP weighting results, the five indicators with the greatest impact on the carrying capacity of the water environment in Harbin are C7, C15, C18, C17, and C14. The corresponding weight for the water quantity indicator system is 0.157; the corresponding weight for the water consumption indicator system is 0.297; and the corresponding weight for the water quality indicator system is 0.55. The quality impact indicator system represents the largest proportion of the evaluation of the carrying capacity of the water environment in Harbin from 2006 to 2020 and is the subsystem with the largest impact on the carrying capacity of the water environment in Harbin.

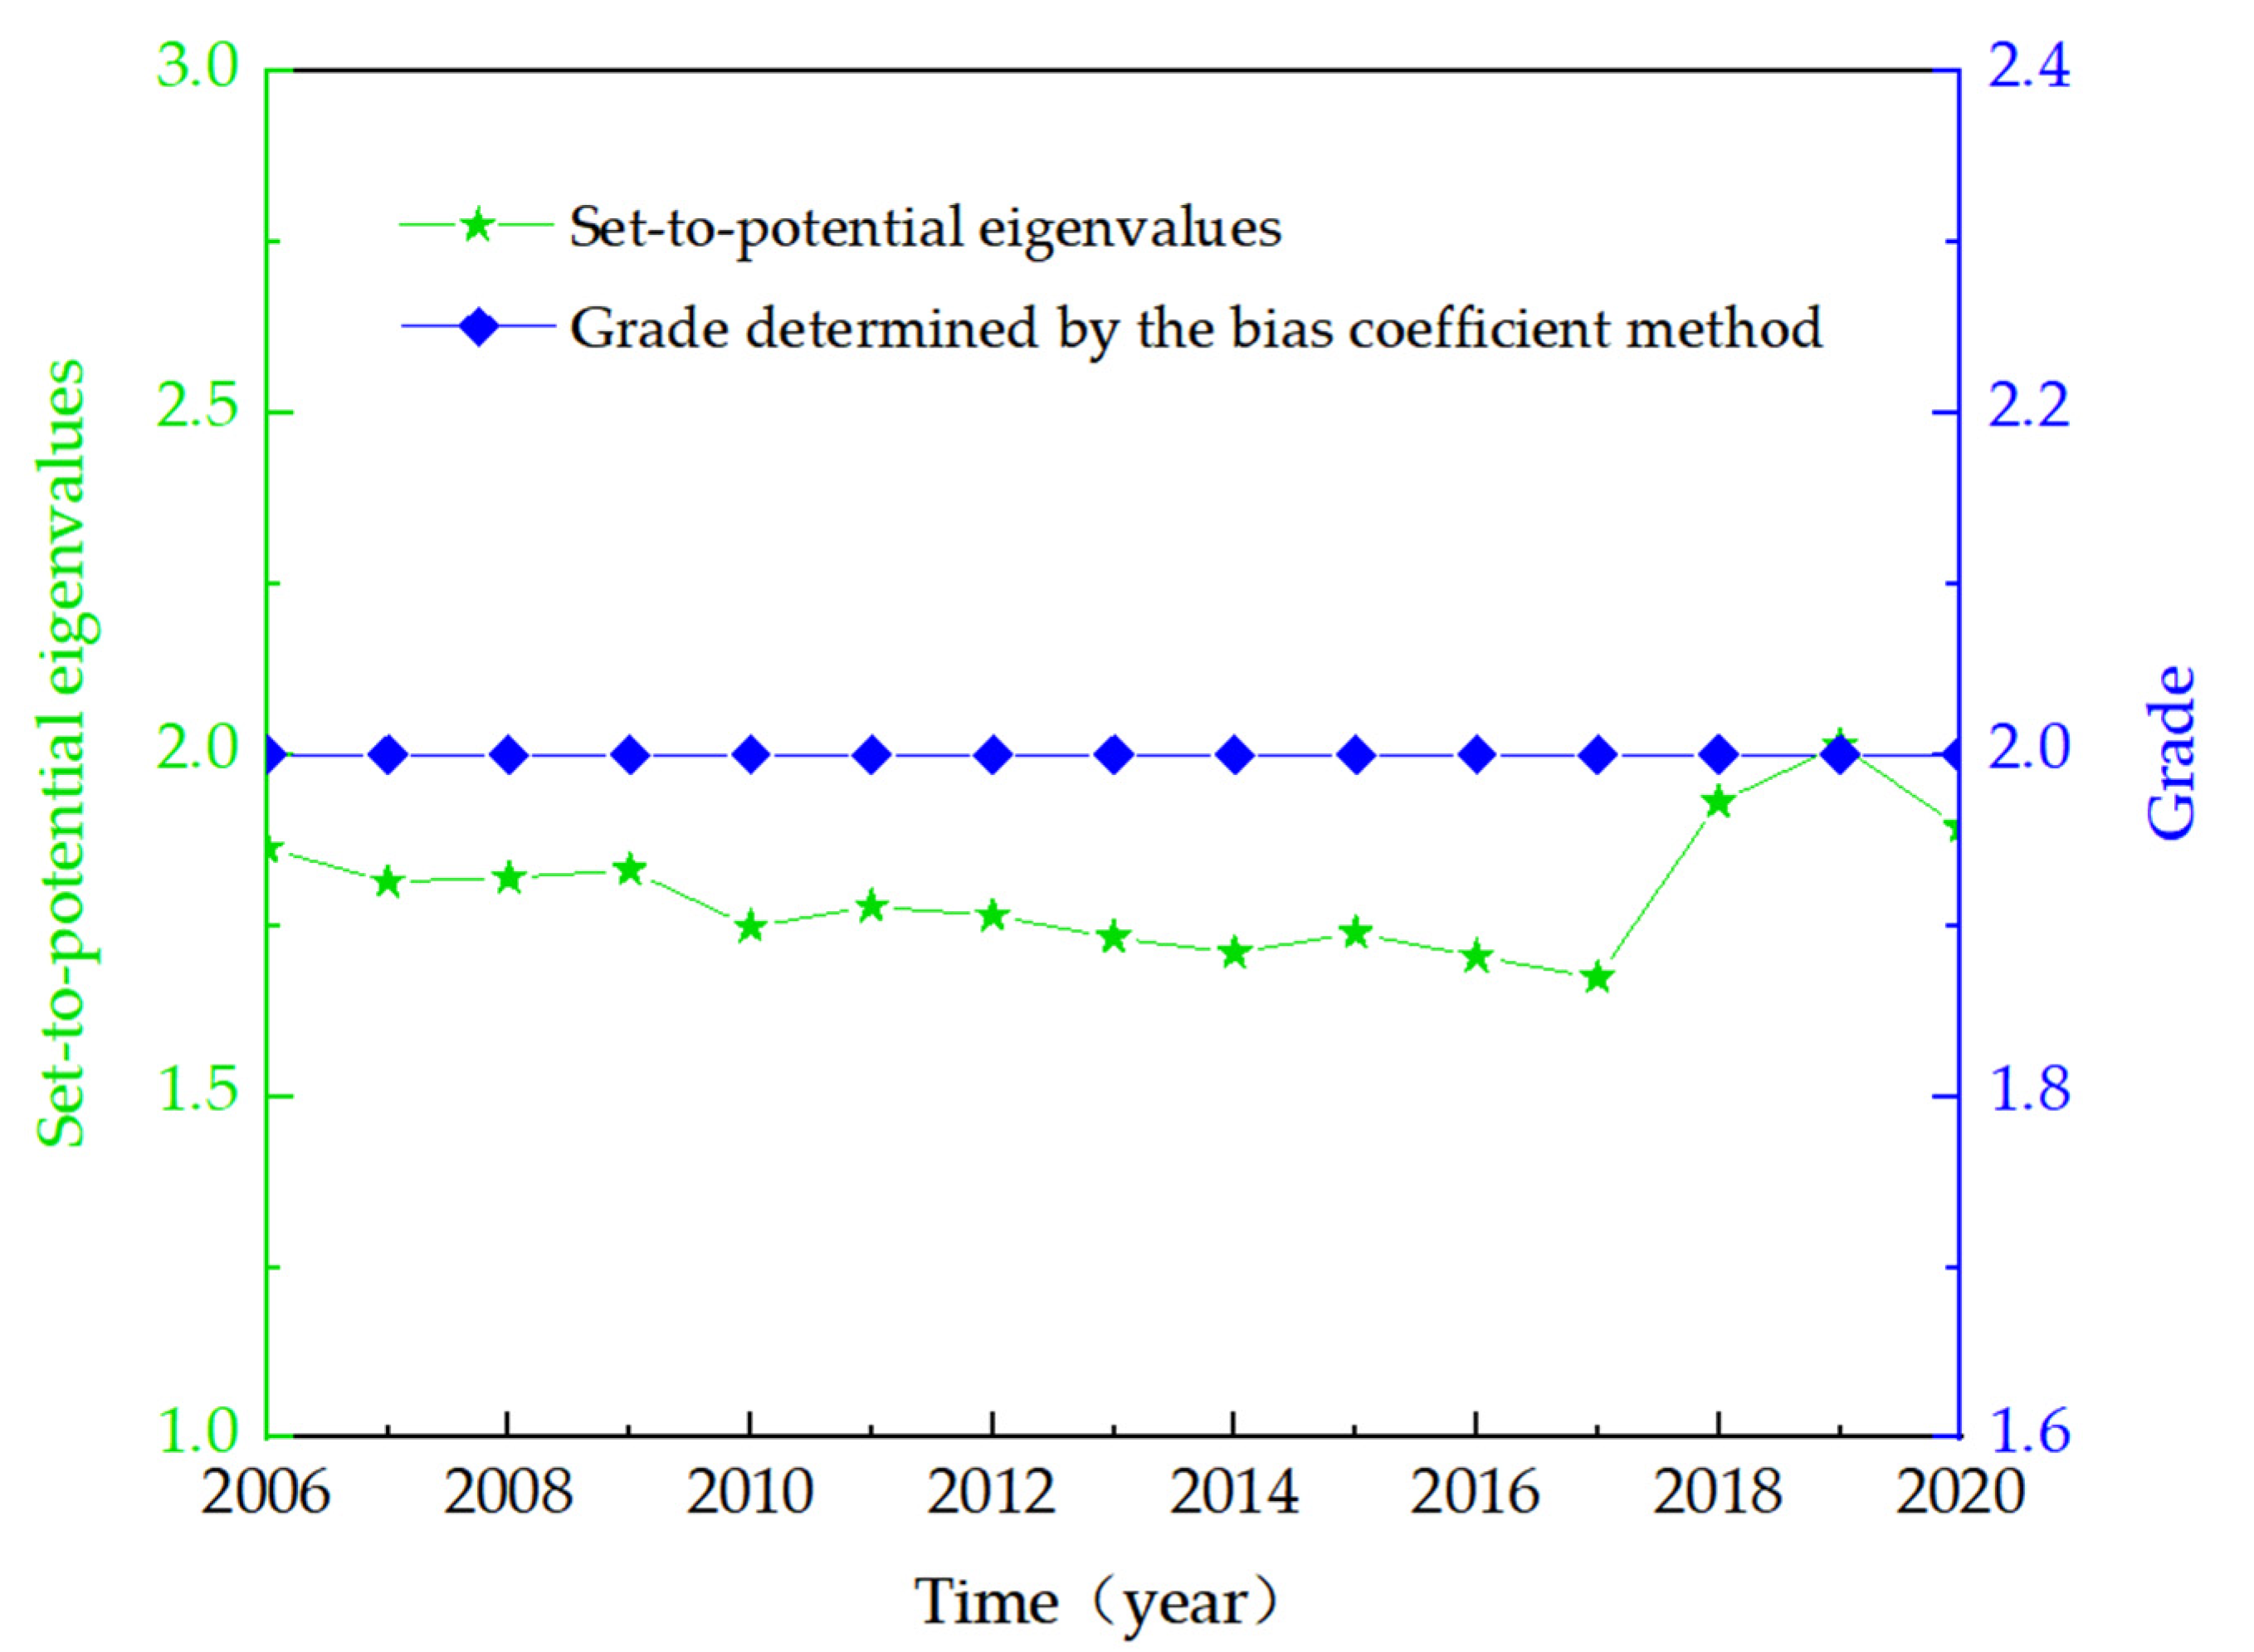
3.2. Eigenvalue and Evaluation Result Level

Among these, the characteristic values of the linkage set pair potential can reflect the situation of the water environment carrying capacity system in Harbin City, and, at the same time, can effectively reflect the grade range. This solves the problems of the order-of-magnitude change in a and c in the original linkage of the generalized set pair potential and the single method in dealing with the multi-grade problem of the set pair system more precisely and effectively. The physical interpretation of the set pair potential formula is enhanced at a deeper level [51]. The values of different degree coefficients and opposition degree coefficients from the linkage number are shown. Table 4 shows the set pair potential eigenvalues and the corresponding grade.
The results in Table 5 are calculated from the definition of the number of partial associations, and the level of support is determined based on the maximum of the three degrees of support [52]. Considering the role of the two classes’ partial correlation numbers, the roles of the first-order information’s “same-different” and “different-inverse” informational evolution and the second-order’s deeper informational evolution are integrated. The evaluation results showed that the support levels for the three different grades in the first-order partial connection number, from the largest to the smallest, were Level 2 (0.928), Level 1 (0.512), and Level 3 (0.200). The support levels for the three different levels in the second-order part number were Level 2 (0.928), Level 1 (0.548), and Level 3 (0.258). The corresponding support level is Level 2, which is significantly better than the other two levels, and the correction and updating of the contact number and the dynamic determination of the difference coefficient are realized. The method has been applied to the same area as the study of Li et al. The results for the water environment carrying capacity class values obtained by calculating the number of indicator linkages, the number of indicator value linkages, and the geometric mean linkages of the two, and those obtained by the level eigenvalue method, are in good agreement [53]. This paper refers to the conceptual implications of partial numbers and the adjoint function of the number of connections [54]. The partial connection number correlation method was applied to characterize the mutual migration movement between the connection number components in the Harbin water environment bearing capacity sustainability evaluation sample. Then, the modified contact number component was obtained, which further enhances the rationality and accuracy of the water environment carrying capacity evaluation [55].

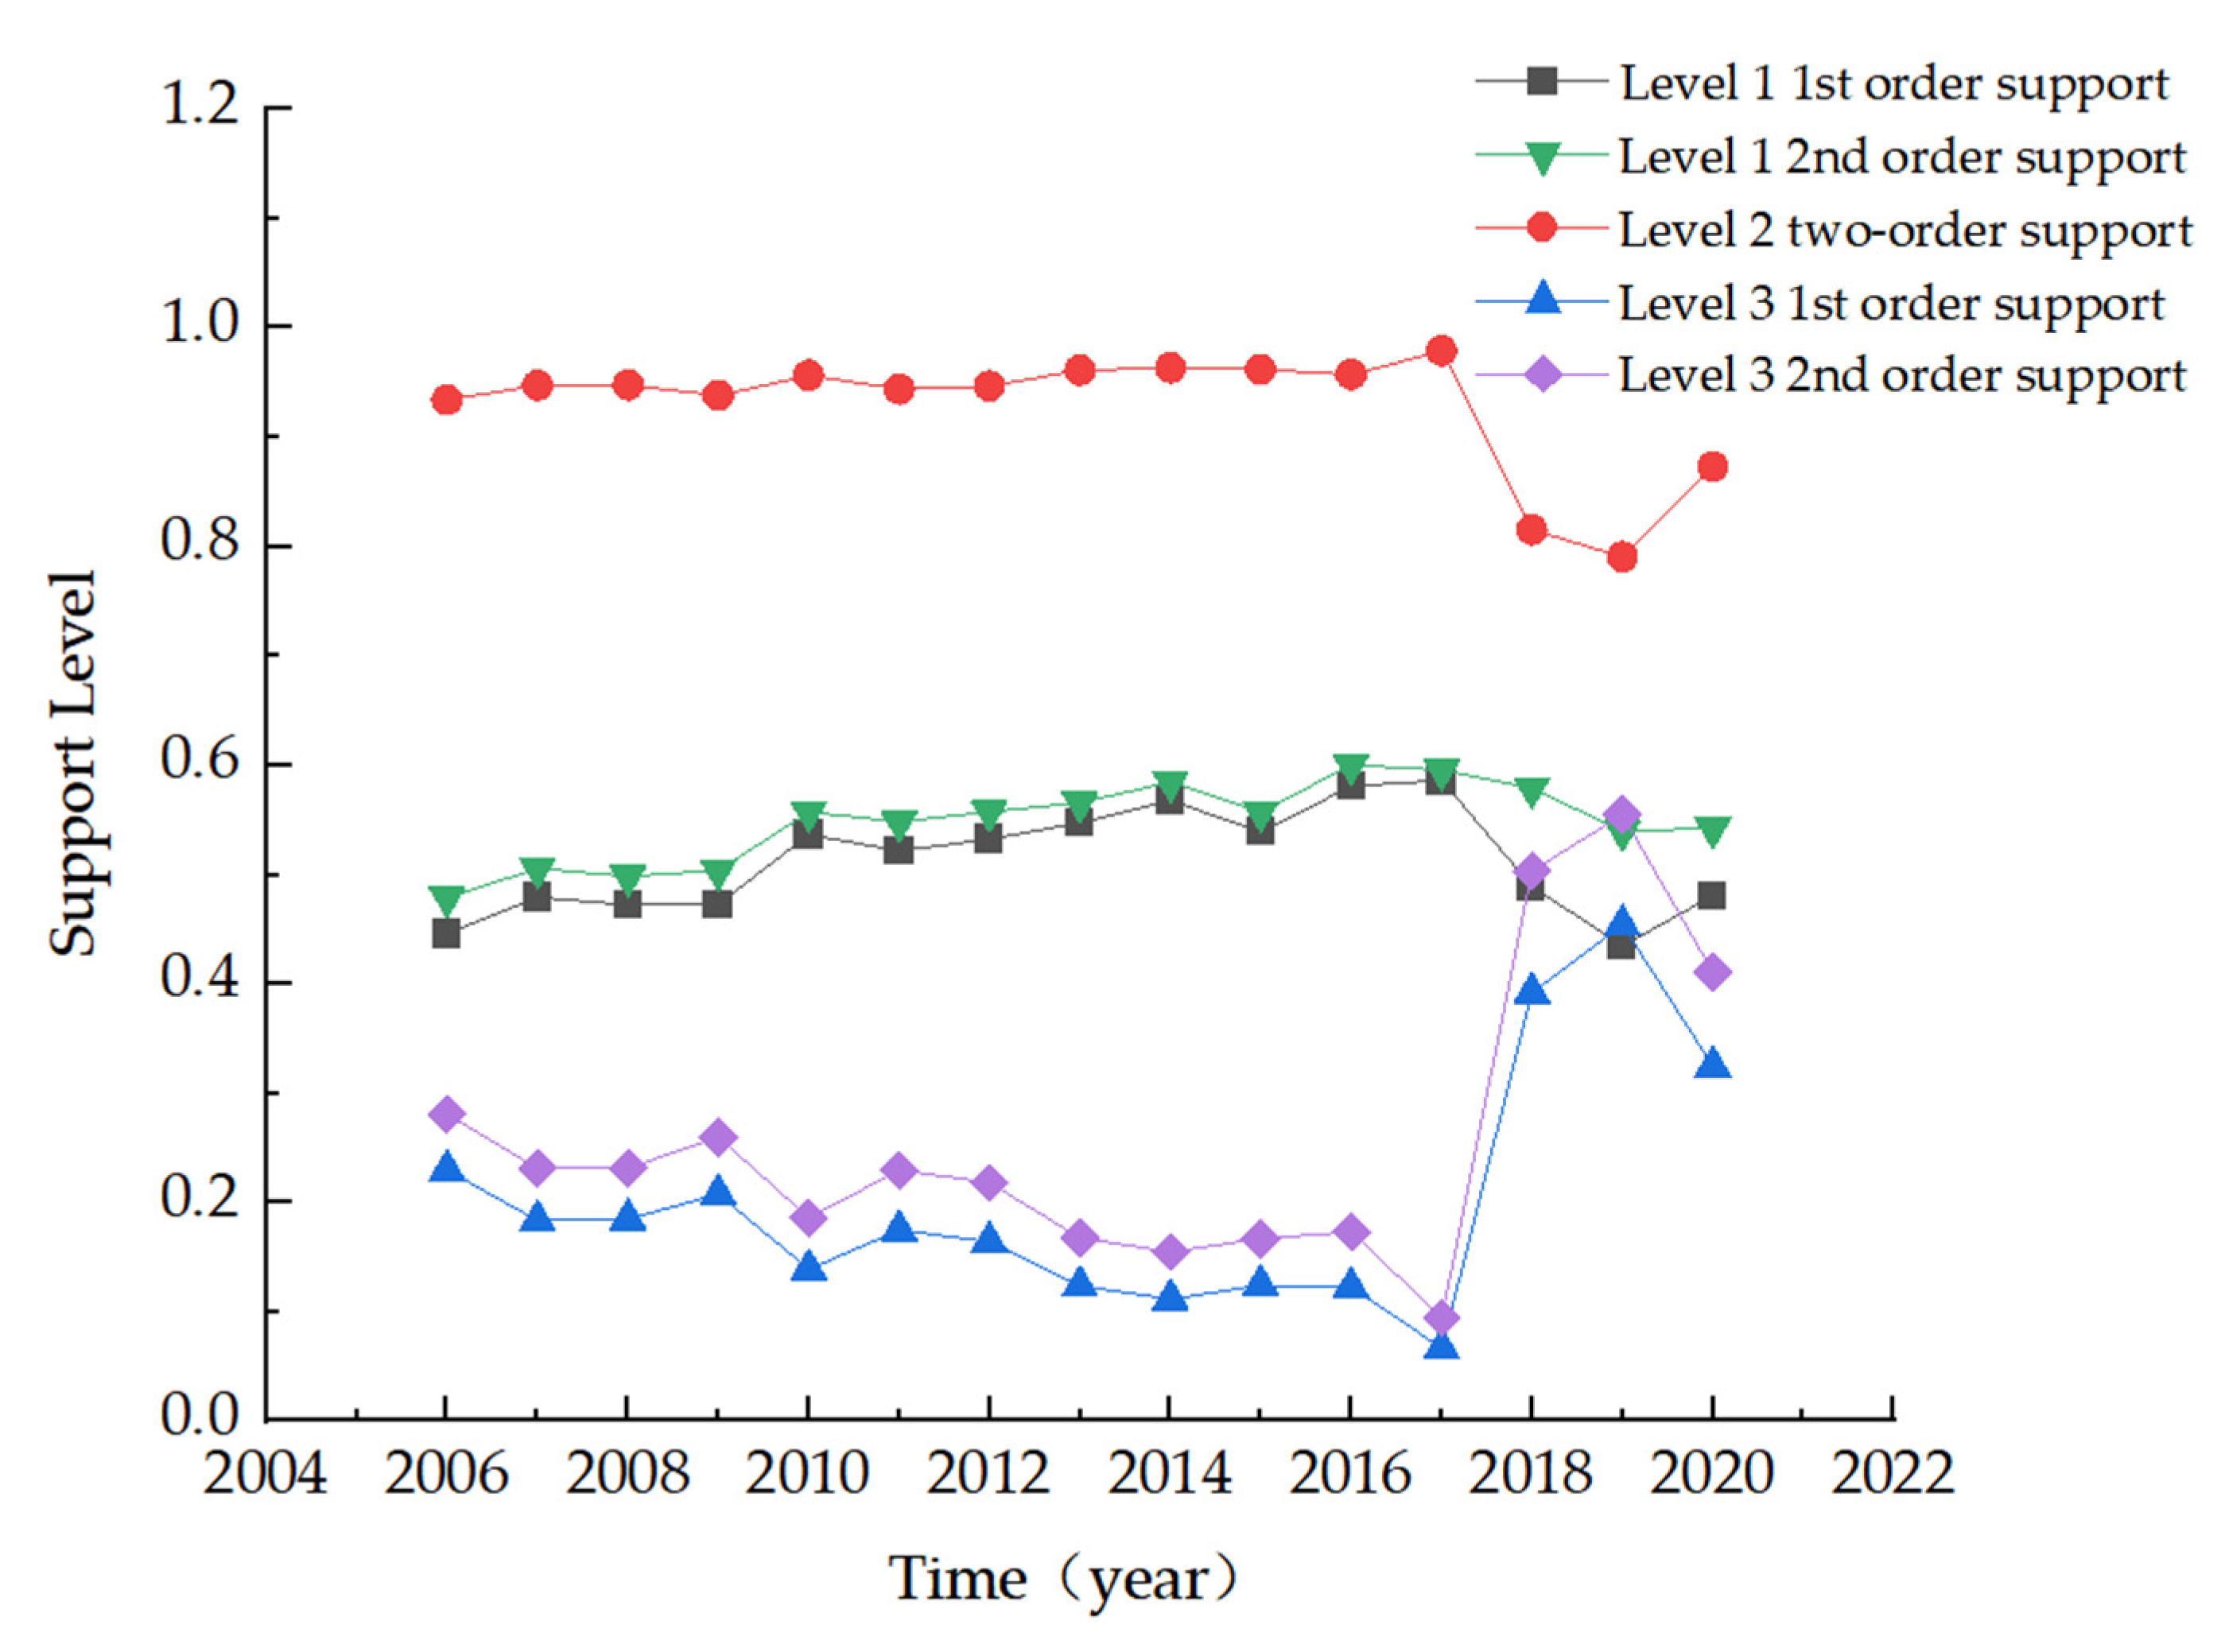
3.3. Support and Judgment Level

Through the above model method and the results of the data analysis, the grade support degree evolution curves and the set pair potential eigenvalues, using the bias coefficient method to determine the grade, were plotted (Figure 3). The risk levels were classified as Level 1 (loadable), Level 2 (critical), and Level 3 (overload) [56]. Figure 2 shows that the second-order support degree of Level 2 in the region has been the highest for 15 years. This indicates that the risk to water environment carrying capacity in the region is not very serious and has been at a critical level. Meanwhile, comparison between the support curves for different grades shows that the trend for Grade 2 always has the same trend as the two support curves for Grade 1. The trend for Grade 3 is always the opposite of those for Grade 1 and Grade 2. For example, support for Rank 1 and Rank 2 reached maximum values in 2017, while support for Rank 3 was at a lower value. Later, in 2018, support for Rank 1 and Rank 2 suddenly decreased while support for Rank 3 showed an increase, and the same pattern also appeared in other years.
Figure 4 shows that the carrying capacity of the water environment in the region has been maintained between Levels 1.5 and 2 from 2006 to 2020, which is in the critical state for loadability. Demand on the water environment in the region is greater than reasonable supply, and the water environment is facing the problem of transitional use. The results for the set of potential characteristic values show that the region has been hovering between a positive 2 level and a quasi-2 level, with a positive 2 level reached from a quasi-2 level in 2010. This indicates that the water environment in the region transitioned from a critical to a loadable state in these two years. The water environment evaluation sets for the years 2010 to 2017 were all judged to be at a positive 2 level. Compared with the quasi-2 level, the positive-2 level is at the edge of super-critical and loadable, and the risk of water environment development and utilization is reduced [57]. Figure 4 shows that the set of potential characteristic values, when still at partial positive Level 2, showed a decline in the years after 2017, indicating that the carrying capacity of the water environment faces increased risk in recent years. Combined with the analysis of natural conditions and water use policies, water management strategies, and other aspects of adjustment and control in Harbin City in the past three years, the water environment carrying capacity has achieved a stable and rising trend. On one hand, greater rainfall and a significant increase in per-capita water in the environment in Harbin in recent years have led to an increase in the support capacity of the water environment system for load-bearing purposes. On the other hand, the rate of industrial water use has increased repeatedly year after year, the proportion of industrial water use has decreased year after year, and the amount of ecological and environmental replenishment has gradually been focused on. The restructuring of various water uses has eased the carrying pressure on Harbin’s water environment system. The results of Yang et al. using the same method showed that evaluation results using the partial logarithm method for Hefei City for 2009–2018 were also at Level 2. The set of pairwise potential characteristic values also shows different levels of dynamics when significant changes in the water environment occur in the region. This shows that the method has a good dynamic effect and that the evaluation results are more accurate [58].
As shown in the image of the dynamic evolution of the values of the bearing capacity level in Figure 5, the PP-AHP method reported a maximum value of evolution of −0.326 and the traditional AHP method reported a maximum value of evolution of −0.285 in the three years 2016, 2017, and 2018 in this region. It can also be seen from the results in Table 4 that these three years happen to be the years of transition from partial positive Level 2 to quasi-Level 2. Apart from this, the changes between the other years are smaller than the magnitudes for these three years. The traditional AHP method shows, approximately, the same numerical trend compared with the PP-AHP method, but the evolutionary values do not float as well as the PP-AHP method optimization results. On the time axis, from 2009, the dynamic evolution of the value of the bearing capacity level showed a decreasing trend and a uniform decrease, and, in 2017, the value showed a sudden increase and was higher than the maximum value for the previous 10 years. After that, the dynamic evolution of the value for the horizontal bearing capacity fluctuates around −0.05 and gradually changes to the normal level. The bearing capacity level shows a rapid turning trend. The sudden change in water-carrying capacity from 2017 to 2019 is due to the “Heilongjiang Province Water Pollution Prevention and Control Work Program” issued by Heilongjiang Province in 2016, which was implemented by Harbin City with an emphasis on vigorously addressing water quality issues, coordinating the control of sewage discharge and sewage treatment, and increasing environmental protection input costs. The results of the optimized weights also show that C14, C15, C17, and C18, which have a larger weight in water quality impact indicators, have been significantly improved.

3.4. Confidence Method for the Comparison Test Optimization Model

Using the confidence criterion judging method for set pair analysis of the number of links, the ranking was performed at set confidence levels: λ = 0.5, λ = 0.6, and λ = 0.7, respectively. Applicability was checked by comparing the confidence criterion judging methods, and the results of comparing the AHP with the PP-AHP method are as follows. The confidence level criterion evaluation method was used for the confidence levels λ = 0.5, λ = 0.6, and λ = 0.7, all of which were quasi-2. The set-to-potential eigenvalues obtained by the AHP method ranged from 1.71 to 1.93, and those obtained by the PP-AHP method ranged from 1.70 to 2.01, according to the comparative radar images in Figure 6. The results of the confidence criterion method and the PP-AHP optimization method are more relevant. These results show that the optimized set pair potential-bias coefficient evaluation model has been tested and is suitable for modeling the sustainability of the carrying capacity of the water environment in Harbin. The PP-AHP optimization method was used to determine the water environment’s carrying capacity level in more detail and more quantitatively than the traditional AHP method.

3.5. Sustainability Analysis

The simulation results for the water environment carrying capacity of Harbin city, based on the optimized set pair potential–partial coefficient evaluation model, show that the water environment of Harbin City can still support the future socio-economic development of Harbin City, but there are still some risk factors that threaten the sustainability of its carrying capacity. The results of Ye et al. show that population density is the dominant factor causing the weak water environment carrying pressure in Hefei City, and the indicator farm irrigation quota and urbanization rate are auxiliary factors causing the weak water environment carrying pressure in Hefei City. Harbin City has the most serious overload in terms of industrial water resources, followed by the second-most serious overload in terms of the ratio of tertiary industry to GDP. The vertical comparison between the different classes in the above chart shows that the first-order and second-order support degrees of Rank 3 have an overall decreasing trend, with slight fluctuations over time, and have decreased significantly in the past three years. At the same time, the support degrees of Rank 1 and Rank 2 in the region showed an overall increasing trend under stable fluctuation, and Rank 1 increased the most. This indicates that the carrying capacity of the water environment in this region has gradually transitioned from a critical level to a critical and loadable level in recent years, and the risk is decreasing. From the relationship between the set pair potential characteristic value and the level determined by the bias coefficient method, it can be seen that the set pair potential characteristic value as a whole presents a yearly decrease when it is still at the level of bias positive 2. This indicates that the carrying capacity of the water environment is gradually recovering to the normal critical and loadable level and shows an improvement trend. From analysis of the dynamic evolution of the value of the carrying capacity level, the overall is in a decreasing trend from the timeline, and the horizontal carrying capacity is gradually changing to the normal level.

4. Conclusions

The water environment carrying capacity of Harbin City is gradually recovering to the normal loadable level with an improving trend, which is consistent with previous studies. The optimized set potential–partial coefficient evaluation model better overcomes the problems of insufficient informational evolution and strong subjectivity and applies to objective evaluation of the multi-factor complex water environment carrying capacity system of Harbin City. It is of broad practical significance.
The PP-AHP optimized set pair potential–partial linkage method can realize the revision and update of the linkage and the dynamic determination of the difference coefficient; the method has a strong physical interpretation and accurate and reliable evaluation results, and quantitative evaluation of the water environment carrying capacity of Harbin City is realized by the confidence method test. This provides a new, effective means for accurate and reasonable determination of the differential coefficient and the linkage and dynamic analysis of the water environment carrying capacity and judgment of its development trends.
Harbin City has a sustainable water environment carrying capacity; the region’s water environment carrying capacity in recent years has gradually transitioned from the critical level to the loadable level, and the risk trend is gradually reducing. The overall situation has been a gradually improving trend, but also indicates that the “Eleventh Five-Year” period should focus on regulation to strengthen the effectiveness of emission-reduction work for these indicators on average. For example, it is recommended that, through the adjustment of industrial structures, the promotion of water-saving facilities can promote the sustainable use of the water environment. For future water environment management in Harbin City, research tasks can be further developed by combining the evolution of the carrying capacity level and factoring in values. (1) The water environment’s availability has been growing slowly over the past 15 years, and needs to be strengthened. (2) The total population is gradually decreasing, the level of urbanization is rapidly increasing, the amount of water used by urban residents for domestic purposes is also gradually recovering, and the balance of water consumption between these three should be coordinated. (3) Control of urban sewage discharge, which can continue to strengthen the centralized treatment of urban domestic sewage, and environmental protection investments. Future aspects of the model can (1) be extended to make the water environment carrying capacity model applicable to multiple cities, (2) add more optimization treatment methods and apply them to more situations, and (3) increase the analysis of other water resource indicators, such as climate and temperature, to correct the calculated results for water environment carrying capacity.

Author Contributions

This study was designed by Q.F., N.S. and Z.Y. designed the first draft; Y.X. edited the program; T.W. collected the data; J.Y. embellished the language; and X.L. collated, revised, and, finally, edited the manuscript. All authors have read and agreed to the published version of the manuscript.

Funding

This study was financially supported by the Open Project of the Key Laboratory of the Efficient Use of Agricultural Water Resources, Ministry of Agriculture and Rural Affairs of the People’s Republic of China in Cold Regions (No. AWR2021003).

Data Availability Statement

Data is not publicly available due to data privacy reasons.

Conflicts of Interest

The authors declare no conflict of interest.

References

  1. Duan, C.; Liu, C.; Chen, X.; Liu, W.; Zheng, H. Discussion on the Concept and Research Methods of Regional Water Resources Carrying Capacity. Acta Geogr. Sin. 2010, 65, 82–90. [Google Scholar]
  2. Wang, S.; Zou, L.X.; Li, H.B.; Zheng, K.K.; Wang, Y.; Zheng, G.C.; Li, J. Full-scale membrane bioreactor process WWTPs in East Taihu basin: Wastewater characteristics, energy consumption and sustainability. Sci. Total Environ. 2020, 723, 137983. [Google Scholar] [CrossRef]
  3. Yang, Q.C.; Wang, H.; Mu, H.K.; Luo, J.N.; Bao, X.H.; Bian, J.M.; Martin, J.D. Risk assessment of water resources and environmental carrying capacity in Yinchuan city. Hum. Ecol. Risk Assess. 2019, 25, 120–131. [Google Scholar] [CrossRef]
  4. Zhu, L.J.; Li, X.C.; Bai, Y.R.; Yi, T.L.; Yao, L.Q. Evaluation of water resources carrying capacity and its obstruction factor Analysis: A case study of hubei province, China. Water 2019, 11, 2573. [Google Scholar] [CrossRef]
  5. Bian, D.H.; Yang, X.H.; Wu, F.F.; Babuna, P.; Luo, Y.K.; Wang, B.; Chen, Y.J. A three-stage hybrid model investigating regional evaluation, pattern analysis and obstruction factor analysis for water resource spatial equilibrium in China. J. Clean. Prod. 2022, 331, 129940. [Google Scholar] [CrossRef]
  6. Chi, M.B.; Zhang, D.S.; Fan, G.W.; Zhang, W.; Liu, H.L. Prediction of water resource carrying capacity by the analytic hierarchy process-fuzzy discrimination method in a mining area. Ecol. Indic. 2019, 96, 647–655. [Google Scholar] [CrossRef]
  7. Wang, W.; Zeng, W. Optimizing the Regional Industrial Structure Based on the Environmental Carrying Capacity: An Inexact fuzzy Multi-Objective Programming Model. Sustainability 2013, 5, 5391. [Google Scholar] [CrossRef]
  8. Chen, H.S. The Establishment and Application of Environment Sustainability Evaluation Indicators for Ecotourism Environments. Sustainability 2015, 7, 727. [Google Scholar] [CrossRef]
  9. Wang, W.; Sun, Y.; Wu, J. Environmental Warning System Based on the DPSIR Model: A Practical and Concise Method for Environmental Assessment. Sustainability 2018, 10, 1728. [Google Scholar] [CrossRef]
  10. Wang, H.R.; Gong, S.X.; Deng, C.Y.; Yang, B.; Zuo, P. Research on water resources carrying capacity based on five-element connection number. J. Northwest Univ. 2019, 49, 211–218. [Google Scholar]
  11. Ye, F.; Jin, J.L.; Fang, G.H. Evaluation of water resources carrying capacity of Hefei City based on set pair analysis connection number. J. Water Resour. Eng. 2020, 31, 85–90. [Google Scholar]
  12. Liu, Y.H.; Li, Y.B.; Liang, X.Y.; Ran, C.H. Study on water resource carrying capacity evaluation and change in China. Resour. Environ. Yangtze Basin 2019, 28, 1080–1091. [Google Scholar]
  13. Davies, E.G.R.; Simonovic, S.P. Global water resources modeling with an integrated model of the social–economic–environmental system. Adv. Water Resour. 2011, 34, 684–700. [Google Scholar] [CrossRef]
  14. Paredes-Arquiola, J.; Andreu-Alvarez, J.; Martin-Monerris, M.; Solera, A. Water quantity and quality models applied to the Jucar River basin, Spain. Water Resour. Manag. 2010, 24, 2759–2779. [Google Scholar] [CrossRef]
  15. Langsdale, S.; Beall, A.; Carmichael, J.; Cohen, S.; Forster, C. An exploration of water resources futures under climate change using system dynamics modeling. Integr. Assess. 2007, 7, 51–79. [Google Scholar]
  16. Almendinger, J.E.; Ulrich, J.S. Use of SWAT to Estimate Spatial Scaling of Phosphorus Export Coefficients and Load Reductions Due to Agricultural BMPS. J. Am. Water Resour. Assoc. 2017, 53, 547–561. [Google Scholar] [CrossRef]
  17. Dai, M.; Wang, L.; Wei, X. Spatial differentiation of water resources carrying capacity in Guangxi based on entropy weight fuzzy comprehensive evaluation model. Soil Water Conserv. Res. 2016, 23, 193–199. [Google Scholar]
  18. Gao, J. The evaluation of water resources carrying capacity in Hohhot based on fuzzy analysis method. Inner Mong. Water Conserv. 2020, 4, 13–15. [Google Scholar]
  19. Guo, Y.; Wang, R.; Tong, Z.J.; Liu, X.P.; Zhang, J.Q. Dynamic evaluation and regionalization of maize drought vulnerability in the midwest of Jilin Province. Sustainability 2019, 11, 4234. [Google Scholar] [CrossRef]
  20. Jago-on, K.A.B.; Kaneko, S.; Fujikura, R.; Fujiwara, A.; Imai, T.; Matsumoto, T.; Zhang, J.Y.; Tanikawa, H.; Tanaka, K.; Lee, B.; et al. Urbanization and subsurface environmental issues: An attempt at DPSIR model application in Asian cities. Sci. Total Environ. 2009, 407, 3089–3104. [Google Scholar] [CrossRef] [PubMed]
  21. Wang, Z.; Zhou, J.Q.; Loaiciga, H.; Guo, H.C.; Hong, S. A DPSIR model for ecological security assessment through indicator screening: A case study at Dianchi Lake in China. PLoS ONE 2015, 10, e0131732. [Google Scholar] [CrossRef]
  22. Beltaos, S. Threshold between mechanical and thermal breakup of river ice cover. Cold Reg. Sci. Technol. 2003, 37, 1–13. [Google Scholar] [CrossRef]
  23. Yang, H.M.; Zhao, K.Q. The calculation and application of partial connection numbers. CAAI Trans. Intell. Syst. 2019, 14, 865–876. [Google Scholar]
  24. Wang, T.Y.; Du, C.; Nie, T.Z.; Sun, Z.Y.; Zhu, S.J.; Feng, C.X.; Dai, C.L.; Chu, L.L.; Liu, Y.; Liang, Q.Z. Spatiotemporal Analysis of Maize Water Requirement in the Heilongjiang Province of China during 1960–2015. Water 2020, 12, 2472. [Google Scholar] [CrossRef]
  25. Zhang, J.; Zhang, C.L.; Shi, W.L.; Fu, Y.C. Quantitative evaluation and optimized utilization of water resources-water environment carrying capacity based on naturebased solutions. J. Hydrol. 2019, 568, 96–107. [Google Scholar] [CrossRef]
  26. Zhu, Y.H.; Drake, S.; Lü, H.S.; Xia, J. Analysis of Temporal and Spatial Differences in Eco-environmental Carrying Capacity Related to Water in the Haihe River Basins, China. Water Resour. Manag. 2010, 24, 1089–1105. [Google Scholar] [CrossRef]
  27. Miao, H.C.; Li, D.L.; Zuo, Q.T.; Yu, L.; Fei, X.X.; Hao, L.G. A scenario-based optimization model for planning sustainable water-resources process management under uncertainty. Processes 2019, 7, 312. [Google Scholar] [CrossRef]
  28. Beltaos, S. Hydro-climatic impacts on the ice cover of the lower Peace River. Hydrol. Process. 2008, 22, 3252–3263. [Google Scholar] [CrossRef]
  29. Song, X.M.; Kong, F.Z.; Zhan, C.S. Assessment of Water Resources Carrying Capacity in Tianjin City of China. Water Resour. Manag. 2011, 25, 857–873. [Google Scholar] [CrossRef]
  30. Klavins, M.; Briede, A.; Rodinov, V. Long term changes in ice and discharge regime of rivers in the Baltic region in relation to climatic variability. Clim. Chang. 2009, 95, 485–498. [Google Scholar] [CrossRef]
  31. Sagin, J.; Van Der Sanden, J.J.; Evans, E.; McKay, H.; Das, A.; Lindenschmidt, K.-E. Monitoring the freeze-up and ice cover progression of the Slave River. Can. J. Civ. Eng. 2015, 42, 609–621. [Google Scholar]
  32. Yang, J.F.; Lei, K.; Khu, S.; Meng, W. Assessment of Water Resources Carrying Capacity for Sustainable Development Based on A System Dynamics Model: A Case Study of Tieling City, China. Water Resour. Manag. 2014, 29, 885–899. [Google Scholar] [CrossRef]
  33. Zhang, Q.; Liu, B.; Zhang, W.G.; Jin, G.; Li, Z.H. Assessing the Regional Spatio-temporal Pattern of Water Stress: A Case Study in Zhangye City of China. Phys. Chem. Earth 2015, 1, 2–9. [Google Scholar] [CrossRef]
  34. Li, Z.L.; Shao, Q.X.; Xu, Z.X.; Cai, X.T. Analysis of Parameter Uncertainty in Semi-distributed Hydrological Models Using Bootstrap Method: A Case Study of Swat Model Applied to Yingluoxia Watershed in Northwest China. J. Hydrol. 2010, 385, 76–83. [Google Scholar] [CrossRef]
  35. Yang, J.F.; Lei, K.; Khu, S.; Meng, W.; Qiao, F. Assessment of water environmental carrying capacity for sustainable development using a coupled system dynamics approach applied to the Tieling of the Liao River Basin, China. Environ. Earth Sci. 2015, 73, 5173–5183. [Google Scholar] [CrossRef]
  36. Park, H.; Yoshikawa, Y.; Oshima, K.; Kim, Y.; Ngo-Duc, T.; Kimball, J.S.; Yang, D. Quantification of Warming Climate-Induced Changes in Terrestrial Arctic River Ice Thickness and Phenology. J. Clim. 2016, 29, 1733–1754. [Google Scholar] [CrossRef]
  37. Zhang, Z.; Lu, W.X.; Zhao, Y.; Song, W.B. Development tendency analysis and evaluation of the water ecological carrying capacity in the Siping area of Jilin Province in China based on system dynamics and analytic hierarchy process. Ecol. Modell. 2014, 275, 9–21. [Google Scholar] [CrossRef]
  38. Wang, Q.; Li, S.Q.; Li, R.R. Evaluating water resource sustainability in Beijing, China: Combining PSR model and matter-element extension method. J. Clean. Prod. 2019, 206, 171–179. [Google Scholar] [CrossRef]
  39. Zhang, S.H.; Xiang, M.S.; Yang, J.S.; Fan, W.W.; Yi, Y.J. Distributed hierarchical evaluation and carrying capacity models for water resources based on optimal water cycle theory. Ecol. Indic. 2019, 101, 432–443. [Google Scholar] [CrossRef]
  40. Gu, H.M.; Jia, L.; Jiang, X.H.; Xu, J.X.; Dong, G.T. Evaluation of water resources bearing capacity based on entropy-weight and matter-element assessment methods in midstream of Heihe River. J. Irrig. Drain Eng. 2016, 35, 87–92. [Google Scholar]
  41. Mashaly, A.F.; Fernald, A.G. Identifying Capabilities and Potentials of System Dynamics in Hydrology and Water Resources as a Promising Modeling Approach for Water Management. Water 2020, 12, 1432. [Google Scholar] [CrossRef]
  42. Barati, A.A.; Azadi, H.; Scheffran, J. A system dynamics model of smart groundwater governance. Agric. Water Manag. 2019, 221, 502–518. [Google Scholar] [CrossRef]
  43. Vieira, E.D.; Sandoval-Solis, S. Water resources sustainability index for a water-stressed basin in Brazil. J. Hydrol. Reg. Stud. 2018, 19, 97–109. [Google Scholar] [CrossRef]
  44. Zhao, Z.Y.; Li, W.C.; Wang, X.; Cui, T.T.; Cheng, Z.H.; Wang, S. Study on Water Resources Carrying Capacity in Ningxia Based on Principal Component Analysis and Factor Analysis. J. Hydrol. 2017, 37, 64–72. [Google Scholar]
  45. Panno, A.; Carrus, G.; Lafortezza, R.; Mariani, L.; Sanesi, G. Nature-based solutions to promote human resilience and wellbeing in cities during increasingly hot summers. Environ. Res. 2017, 159, 249–256. [Google Scholar] [CrossRef] [PubMed]
  46. Morris, R.L.; Konlechner, T.M.; Ghisalberti, M.; Swearer, S.E. From grey to green: Efficacy of eco-engineering solutions for nature-based coastal defence. Glob. Chang. Biol. 2018, 24, 1827–1842. [Google Scholar] [CrossRef] [PubMed]
  47. Lorenz, S.; Pusch, M.T. Estimating the recreational carrying capacity of a lowland river section. Water Sci. Technol. 2012, 66, 2033–2039. [Google Scholar] [CrossRef]
  48. Lin, L.; Liu, Y.; Chen, J.N.; Zhang, T.Z.; Zeng, S.Y. Comparative analysis of environmental carrying capacity of the Bohai Sea Rim area in China. J. Environ. Monit. 2011, 13, 3178–3184. [Google Scholar] [CrossRef] [PubMed]
  49. Zhang, H.; Bian, J.M.; Wan, H.L. Hydrochemical appraisal of groundwater quality and pollution source analysis of oil field area: A case study in Daqing City, China. Environ. Sci. Pollut. Res. 2021, 28, 18667–18685. [Google Scholar] [CrossRef] [PubMed]
  50. Xu, S.B.; Xu, D.S.; Liu, L.L. Construction of Regional Informatization Ecological Environment Based on the Entropy Weight Modified AHP Hierarchy Model. Sustain. Comput. Inform. Syst. 2019, 18, 2210–5379. [Google Scholar] [CrossRef]
  51. Dai, D.; Sun, M.D.; Xu, X.Q.; Lei, K. Assessment of the water resource carrying capacity based on the ecological footprint: A case study in zhangjiakou city, North China. Environ. Sci. Pollut. Res. 2019, 26, 11000–11011. [Google Scholar] [CrossRef] [PubMed]
  52. Huang, L.; Zhou, M.; Lv, J.; Chen, K. Trends in global research in forest carbon sequestration: A bibliometric analysis. J. Clean. Prod. 2020, 252, 119908. [Google Scholar] [CrossRef]
  53. Li, Z.; Jin, J.L.; Cui, Y.; Zhou, R.X.; Ning, S.W.; Zhou, Y.L.; Zhou, L.G. Evaluation method of regional water resources carrying capacity based on semipartial connection number and dynamic subtraction set pair potential. J. Lake Sci. 2022, 34, 1656–1669. [Google Scholar]
  54. Jin, J.L.; Chen, P.F.; Chen, M.L.; Li, J.Q.; Xu, X.Y.; Chang, T. Bibliometric analysis of research progress on water resources carrying capacity based on knowledge map. Water Resour. Prot. 2019, 35, 14. [Google Scholar]
  55. Li, C.; Li, H.J.; Feng, S.D.; Liu, X.Y.; Guo, S. A study on the spatiotemporal characteristics and change trend of the atmospheric environmental carrying capacity in the Jing-Jin-Ji region, China. J. Clean. Prod. 2019, 211, 27–35. [Google Scholar] [CrossRef]
  56. Meng, C.; Wang, X.; Li, Y. An optimization model for water management based on water resources and environmental carrying capacities: A case study of the yinma river basin, northeast China. Water 2018, 10, 565. [Google Scholar] [CrossRef]
  57. Secinaro, S.; Brescia, V.; Calandra, D.; Biancone, P. Employing bibliometric analysis to identify suitable business models for electric cars. J. Clean. Prod. 2020, 264, 121503. [Google Scholar] [CrossRef]
  58. Yang, Y.F.; Wang, H.R.; Zhou, J.W.; Yan, J.W. Evaluation Model of Water Resources Carrying Capacity Based on Set Pair Potential and Partial Connection Number. Adv. Eng. Sci. 2021, 53, 99–105. [Google Scholar]
Figure 1. Index system for Harbin water environmental carrying capacity.
Water 15 01575 g001
Figure 2. Factors affecting the water environment carrying capacity of Harbin City: (a) is a numerical plot of water quality indicators, (b) is a numerical plot of water consumption indicators, and (c) is a numerical plot of water quality impact indicators.
Water 15 01575 g002
Figure 3. Grade support evolution curve.
Water 15 01575 g003
Figure 4. Set pair potential eigenvalues and grade determined by the partial coefficient method.
Water 15 01575 g004
Figure 5. Dynamic evolution of the value of the bearing capacity level.
Water 15 01575 g005
Figure 6. A comparison of the AHP method, PP-AHP method, and confidence level judging method; (ac) are radar plots of the results of the confidence level judging method, compared with the results of the two weighting methods, when the confidence levels are taken to be λ = 0.5, λ = 0.6 and λ = 0.7.
Water 15 01575 g006
Table 1. Evaluation index grading standards.
Evaluation IndicatorsC1C2C3C4C5C6C7C8C9C10
Loadable≥100≥600≥200≥40≤45,000≤800≤50≤8000≤1000≥50
Criticality[70, 100)[300, 600)[100, 200)[20, 40)(45,000, 60,000](800, 1000](50, 80](8000, 20,000](1000, 1400][20, 50)
Overloading<70<300<100<20>60,000>1000>80>20,000>1400<20
Evaluation IndicatorsC11C12C13C14C15C16C17C18C19C20
Loadable≤66≤10,000≤5000≥80≥90≥80≥80≥95≥40≥80
Criticality(66, 248](10,000, 40,000](5000, 7500][60, 80)[70, 90)[50, 90)[50, 80)[90, 95)[25, 40)[50, 80)
Overloading>248>40,000>7500<60<70<50<50<90<25<50
Table 2. Corresponding relation between set pair potential and levels.
PostureSEGrade
Same posture[1.0, 1.4]Positive Level 1
Favoring the same dynamics(1.4, 1.8]Bias positive Level 2
Parity posture(1.8, 2.2]Positive Level 2
Favoring the opposite dynamics(2.2, 2.6]Bias negative Level 2
Opposite posture(2.6, 3.0]Positive Level 3
Table 3. Weights of evaluation indicators for water environment carrying capacity in Harbin.
Evaluation IndicatorsC1C2C3C4C5C6C7C8C9C10
AHP weights0.070.0730.060.0830.0930.0630.0630.030.0370.07
PP-AHP weights0.0260.0260.0240.0260.0550.020.1030.040.0490.017
Evaluation IndicatorsC11C12C13C14C15C16C17C18C19C20
AHP weights0.0170.030.020.0570.0570.0570.0370.0570.030.02
PP-AHP weights0.0490.0190.0270.0640.1030.0590.0990.10.0610.037
Table 4. Set pair potential eigenvalues.
YearNumber of ContactsSEGrade
20060.262 + 0.612I + 0.126J1.863503737Positive Level 2
20070.284 + 0.617I + 0.099J1.814117478Positive Level 2
20080.28 + 0.621I + 0.099J1.819802604Positive Level 2
20090.281 + 0.606I + 0.113J1.83159522Positive Level 2
20100.325 + 0.60I + 0.074J1.748237038Bias Positive Level 2
20110.316 + 0.59I + 0.094J1.77808089Bias Positive Level 2
20120.323 + 0.589I + 0.088J1.764297458Bias Positive Level 2
20130.333 + 0.602I + 0.065J1.732201156Bias Positive Level 2
20140.348 + 0.593I + 0.059J1.710318666Bias Positive Level 2
20150.327 + 0.608I + 0.065J1.738912508Bias Positive Level 2
20160.36 + 0.576I + 0.064J1.704757847Bias Positive Level 2
20170.36 + 0.606I + 0.034J1.674201471Bias Positive Level 2
20180.306 + 0.457I + 0.236J1.930387368Positive Level 2
20190.267 + 0.453I + 0.281J2.013888289Positive Level 2
20200.293 + 0.52I + 0.187J1.893646336Positive Level 2
Table 5. Evaluation results of the partial coefficient method.
MethodYearSupport LevelGrade
Level 1Level 2Level 3
First order20060.4456909660.9339655530.229896352
20070.4791821830.9472102960.1836127382
20080.4722784720.9477838320.184934212
20090.4730931160.9383086660.2076536182
20100.5365157220.956429260.1392628562
20110.5214950120.9438210350.1748186092
20120.5322625320.9466313280.1641816442
20130.5472535680.9611648420.123838432
20140.5676722160.9634453890.1118665092
20150.5389779570.9619069580.1245349782
20160.5811146540.9572894820.1224485822
20170.585935830.9788489920.0667875712
20180.489462410.8151129850.3923557182
20190.4345859010.7904957270.4538680442
20200.4808365520.8729085380.3244892812
Second order20060.4790413940.9339655530.2811775252
20070.5056028750.9472102960.2312925062
20080.4985637310.9477838320.2314921372
20090.5038517960.9383086660.2600845472
20100.5573457630.956429260.1861418782
20110.5484919210.9438210350.229729982
20120.5576784750.9466313280.2183356742
20130.5656712950.9611648420.1676456032
20140.584596160.9634453890.1553310832
20150.5572395450.9619069580.1669711382
20160.6004233850.9572894820.1730206162
20170.5956349640.9788489920.0951561172
20180.5788828990.8151129850.5033301982
20190.5399064870.7904957270.5547600732
20200.5423791230.8729085380.4103669932
Disclaimer/Publisher’s Note: The statements, opinions and data contained in all publications are solely those of the individual author(s) and contributor(s) and not of MDPI and/or the editor(s). MDPI and/or the editor(s) disclaim responsibility for any injury to people or property resulting from any ideas, methods, instructions or products referred to in the content.

