Article

Water Retention Evaluation of Slab Trench on Rocky Desertification Slope in a Karst Area of Southwest China

1
State Key Laboratory of Hydraulics and Mountain River Engineering, College of Water Resource and Hydropower Engineering, Sichuan University, Chengdu 610017, China
2
Guangxi New Development Transportation Group Co., Ltd., Nanning 530000, China
3
Nanjing Hydraulic Research Institute, Nanjing 210098, China
4
Guangxi Communications Design Group Co., Ltd., Nanning 530000, China
5
Guangxi Road and Bridge Engineering Group Co., Ltd., Nanning 530000, China
*
Author to whom correspondence should be addressed.
The first author in common and contributed equally to this work.
Water 2023, 15(8), 1576; https://doi.org/10.3390/w15081576
Submission received: 17 March 2023 / Revised: 7 April 2023 / Accepted: 13 April 2023 / Published: 18 April 2023
(This article belongs to the Special Issue Karst Dynamic System and Its Water Resources Environmental Effects)

Abstract

:
Soil erosion and water loss are serious problems on the rocky desertification slopes in the karst dynamic system of southwest China. The lack of soil and shortage of water restrict the ecological restoration of the regional slopes and utility of water resources. Therefore, a new slab trench capable of storing soil and water in layers on rocky desertification slopes is introduced in this paper to promote vegetation restoration. To explore the water-storing and -holding capacity of the new type of vegetated slab trench, five groups of model experiments were carried out on the vegetated slab trench under different rainfall intensities and different numbers of plants. Under rainfall and then following dry conditions, the effects of rainfall intensity and the number of plants on the water-storing and -holding capacity of vegetated slab trench models were compared and analyzed. Water-storing and -holding capacity was further explored in three groups of models with single planting or combinations of plants including water stored only in succulent root plant, only in succulent stem plant, or in mixed plants. The test results show that the new type of vegetated slab trench can effectively help to store and hold water. In the rainfall period, due to the runoff of the rainfall not being considered, the greater the rainfall intensity, the higher the water storage efficiency; the more vegetation implanted, the greater the blocking effect of the plant canopy during falling rainwater, and the more reduction is induced on the water storage efficiency of the vegetated slab trench. In the following dry period, both the succulent root plant and succulent stem plant have strong water storage capacity, but the succulent root plant has a stronger capacity for water storage. The growth status of the mixed plants was better than that of single planting, which may be due to the water complementarities between the succulent root plant and succulent stem plant in a mixed planting manner. This study is important for solving the problem of soil erosion and water loss in rocky desertification slopes, and it helps to restore the ecological environment of the area.

1. Introduction

The karst areas have a thin soil layer and shallow exposure of bedrock. When encountering heavy rainfall erosion combined with vegetation destruction, it is easy to induce soil erosion and karst rocky desertification [1]. Rocky desertification has characteristics of low soil fertility, serious soil erosion and fragile ecosystems [2,3], and it occurs widely in various regions, such as southwest China, Guatemala and Mexico, as well as East and South East Asia [4,5,6]. The increasingly severe issue of karst rocky desertification is incompatible with achieving the United Nations’ Sustainable Development Goals [7]. In recent years, water storage and vegetation restoration has become a popular area of research in karst rocky desertification areas [8], and people are searching for sustainable solutions to enable vegetation to grow [9]. Building sustainable and healthy ecological industries, conserving water resources, and reducing soil erosion can promote ecological recovery and economic growth in the areas affected by karst rocky desertification [10].
The special geological structure in rocky desertification areas leads to the rapid hydrological change process, and the water storage capacity in surface soil is limited [11]. Rainwater penetrates into well-developed karst fissures through rock and rock–soil interfaces [12], resulting in serious surface and underground soil erosion [13,14]. Leakage and loss of soil and water becomes the main limiting factor of vegetation restoration on rocky desertification slopes [15,16]. Therefore, it is urgent to solve the problem of soil and water erosion for the purpose of vegetation restoration. Soil and water conservation methods have been proposed, such as changing slopes to the terraces [17,18], which effectively reduces the runoff rate [19,20] and improves the utilization rate of soil moisture [21,22,23]. However, due to lack of the effective capability of water storage, soil moisture in the surface soil evaporates rapidly, and water loss is serious in the dry season. Some methods of surface water storage, such as by means of the reservoir, were proposed to collect rainwater, to assist the water conveyance with open channels, and to improve the efficiency of rainwater utilization [24]. However, in the dry season, transpiration is serious, and rainwater utilization efficiency is low by means of surface water storage methods.
Currently, the common methods of vegetation restoration in rocky desertification areas include: vegetation cover technology [25], spray sowing technology [26], drilling and planting technology [27], etc. However, the plant survival rate is low since these methods are affected by plant species, soil moisture content, thickness of soil layer, etc. Many more effective vegetation restoration methods have been proposed. For example, Wang et al. proposed the method of planting plants by artificial slope drilling, which saved soil and water on rock slopes for plant growth [28]. Qin developed a rock slope greening device with functions of soil fixation, water absorption, irrigation and water storage to realize the adaptive ecological restoration of slopes [29]. These methods are trying to improve the capacity of soil and water storage on the slopes, and correspondingly the survival ability of plants.
The primary objective of this study is to investigate the water-storing and -holding mechanism of our newly developed vegetated slab trench, which may provide a feasible method for solving the problem of soil erosion and water loss and obtaining sustainable development in rocky desertification slopes worldwide. To achieve this objective, in this study, focus will be put on the water-storing and -holding mechanism of the slab trench system, and its potential effectiveness in supporting plant growth in arid environments will be evaluated. The work to be carried out in this study includes the following: (1) a model test is to be carried out to analyze the influence of rainfall intensity and the number of plants on the capacity of rain water collection and storage in the water storage chamber of the slab trench; (2) because the water absorption belt is the key issue in the slab trench, the effect of the length of the water absorption belt exposed to air on its absorbent efficiency is to be investigated; (3) in order to study the effect of the mixed planting manner of succulent root plants and succulent stem plants on the water-retaining behavior of the slab trench, three additional model tests are to be conducted, respectively, with water stored only in succulent root plants, only in succulent stem plants, or in a combination of both. The test results will be analyzed and compared, finally resulting in many useful conclusions.

2. Materials and Methods

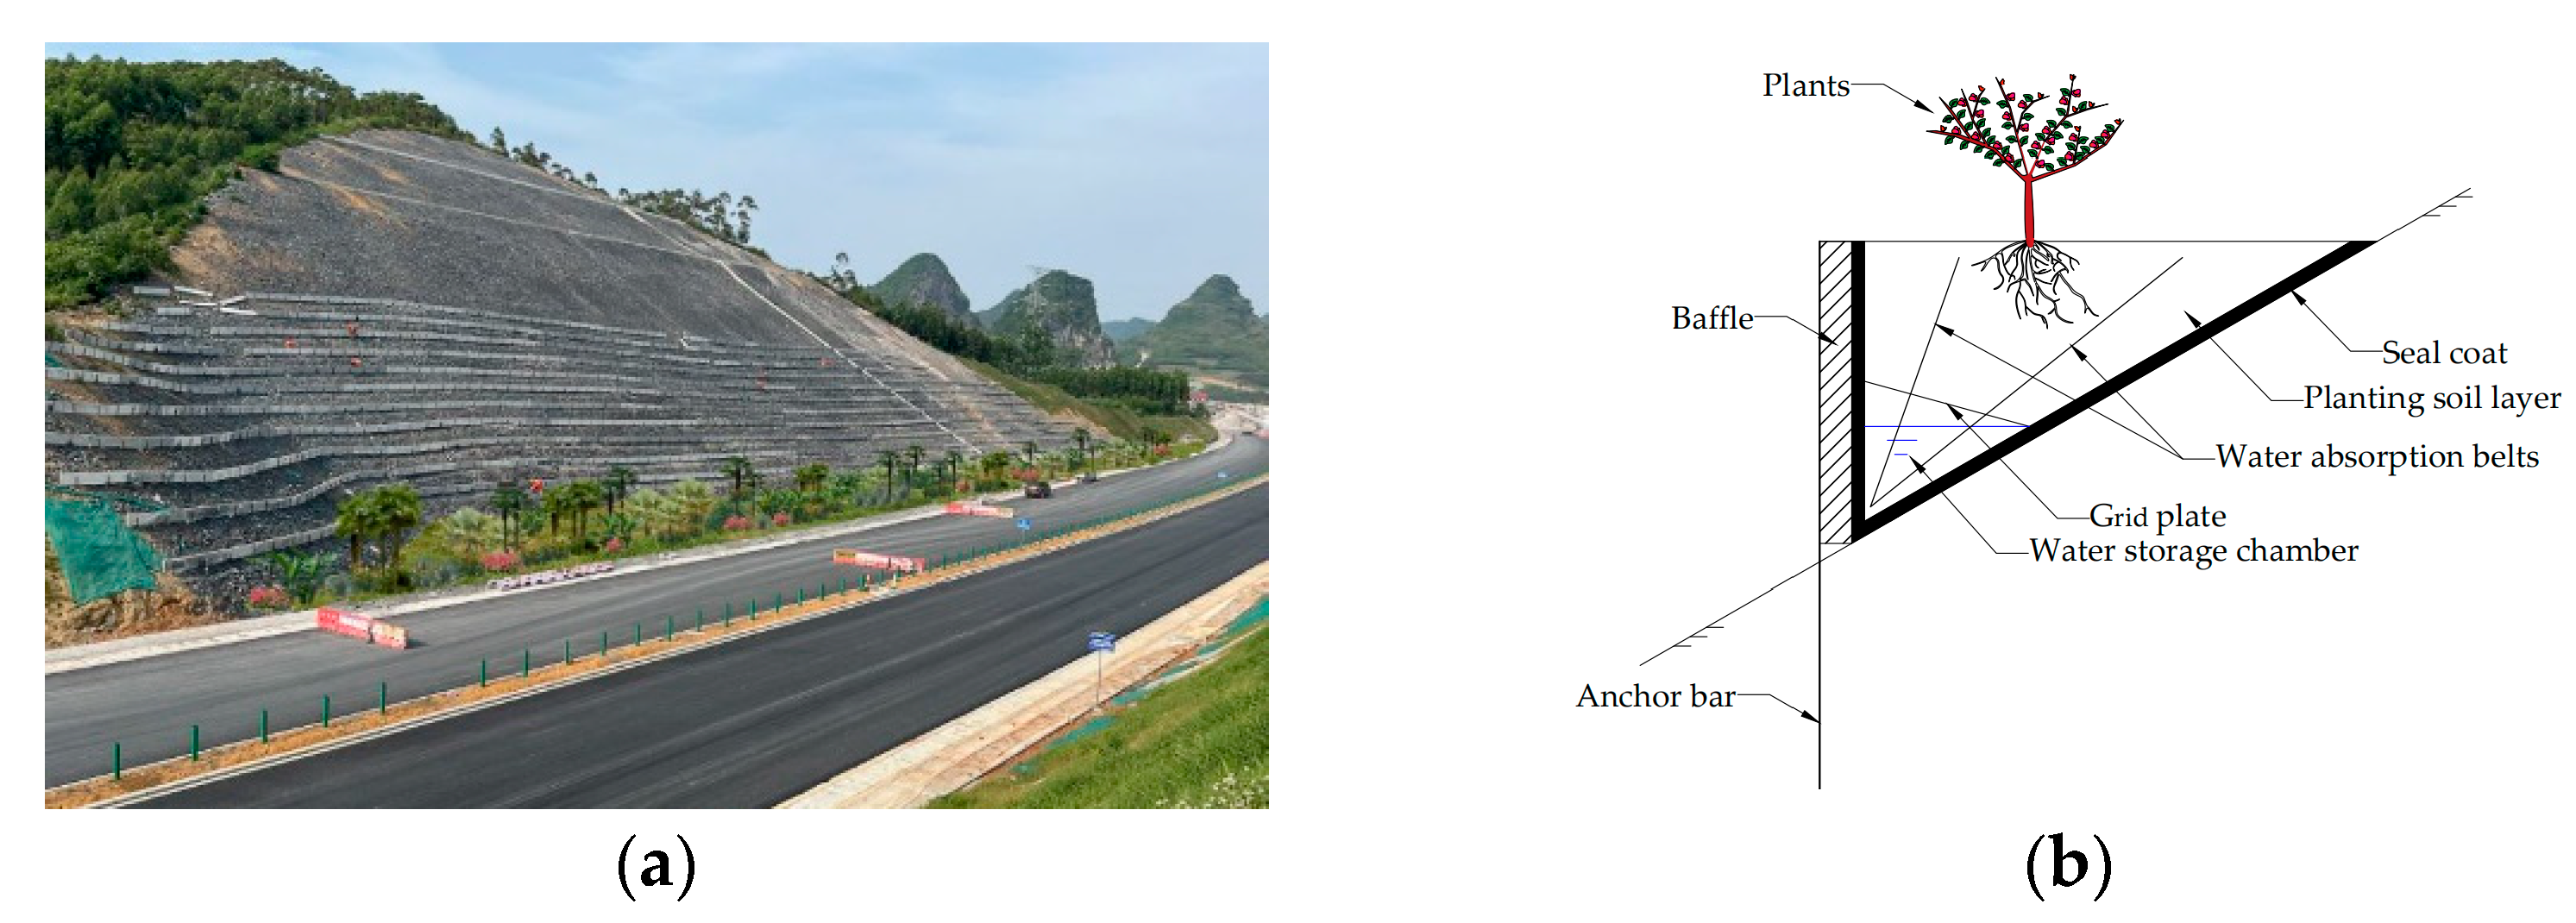
2.1. Background of the In Situ Rock Desertification Slope

The highway passed this site in the rocky desertification area of Guangxi, China. At the site of the project, the surface and underground water is mainly recharged by atmospheric precipitation, and the water content is influenced by season. The gravel on the hill surface is a medium–strong permeable layer, and the water in the gravel layer is poor and has dynamic instability. No stable underground water level was revealed.
The slope on the left side of the highway was cut off in three sections from the top to the bottom. The slope rate is about 1:1.75 for the first and second sections, and the slope rate is 1:2.58 for the third section.
The rocky desertification slope to be vegetated by a new type of stepped slab trench was taken as an in situ engineering example for this study. The construction of the stepped slab trench on the rocky desertification slope and the structures profile of the slab trench are shown in Figure 1. Model tests were to be conducted to investigate the water-storing and -retaining capacity in the slab trench structure for purpose of vegetation restoration. Slab trench model with a slope ratio of 1:1.75 was built for testing in this study.
The construction of the stepped slab trench on the rocky desertification slope is as follows: (1) at the location of each line of slab trenches on the rocky desertification slope, anchors are vertically installed on the slope in a desired longitudinal spacing, and a part of the anchor is exposed on the slope to support the slab trench; (2) a triangle space is developed between the concrete slab and the slope surface for filling soil and water in layers; (3) a waterproof layer is laid at the bottom of the slab trench, and a grid plate is erected towards the slab and the slope surface to divide the slab trench into upper and lower parts for soil and water filling in layers separately; (4) the soil produced by slope cutting or excavation is filled on the grid board for vegetation planting; (5) water absorption belts are laid vertically through the upper soil layer and the grid plate into the water layer below.
When it rains, water seeps into the soil and flows into the water storage chamber at the bottom of the slab trench. When there is drought, the soil is in a state of water shortage, and water absorption belts in the soil layer will absorb water from the water storage chamber below. This process can help the soil around the plant roots to maintain enough water content for a long time, and it can ensure the normal growth of vegetation on rocky desertification slopes that lack soil and water.

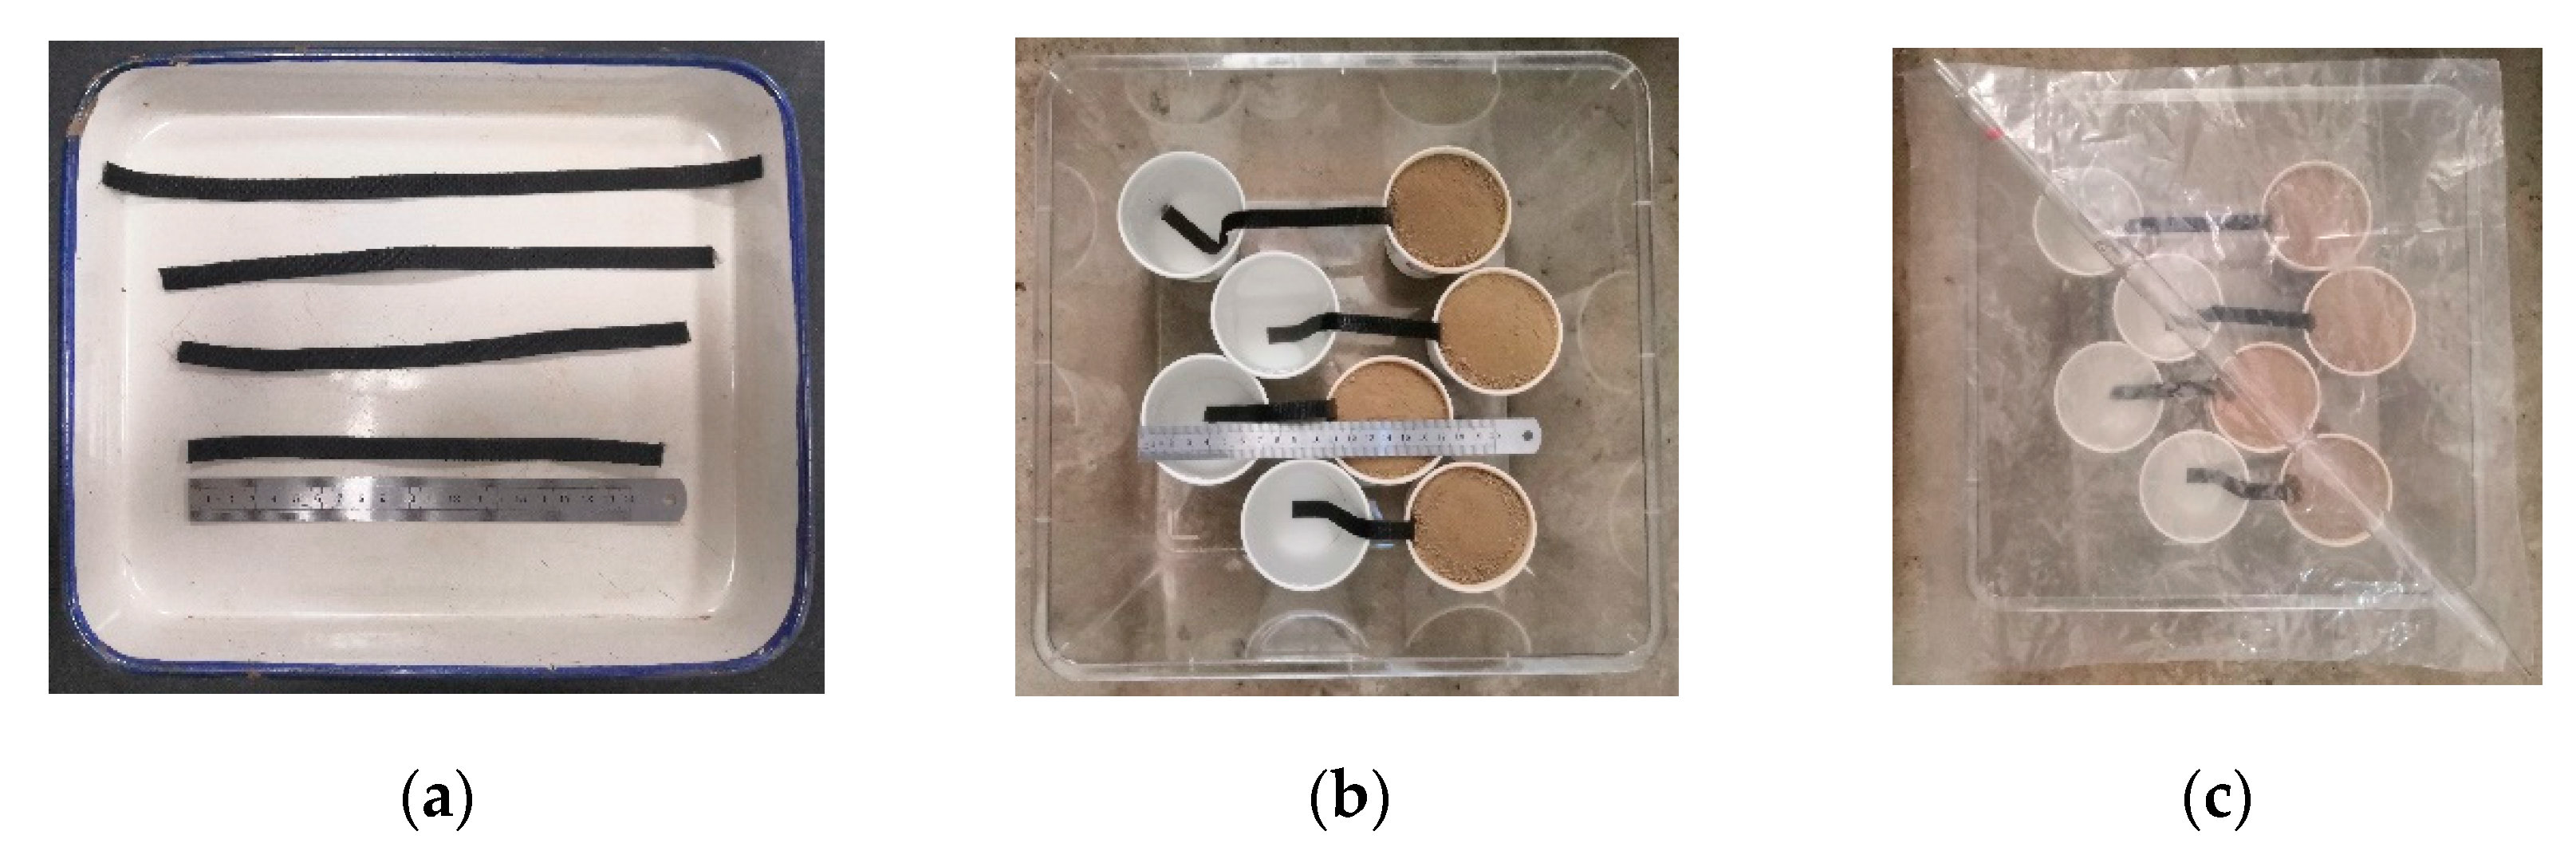
2.2. Soil, Stone, Water Absorption Belt and Vegetation for Testing

In order to better reflect the correlation between the experimental results and in situ engineering, the test soil was derived from in situ slope cutting, and it is one type of mixed soil. The particle size composition and basic physical properties of the test soil are shown in Table 1 and Table 2. The compacted dry density of the soil is 1.45 g/cm3, the maximum dry density is 1.75 g/cm3, and the degree of compaction is 83.0%. The initial moisture content was 8% during filling, and the saturated moisture content of the soil was about 29.86%. The existence of gravel in the soil had an important impact on the efficiency of water utility of plants [30], water-retaining capacity of the soil [31], infiltration [32], evaporation [33] and other characteristics. The white stone with a particle size of 3~5 cm was used for purpose of modeling rocky desertification condition and easy observation. It occupied 10% volume content of the soil in the test.
The water absorption belt is made of dense nylon braided belt, which is flat, about 1 cm wide and 0.13 cm thick. The material has strong water absorption and water-holding capacity due to high capillary forces, has the characteristics of high-temperature resistance, is not easy to age, and can resist general acid and alkali erosion due to stable chemical properties.
As a succulent stem plant for water retention, Begonia semperflorens has a strong ability to tolerate long-term drought of soil; therefore, it was selected as the experimental plant to explore the water-retaining behavior of the slab trench in the model test with different rainfall intensity and plant number. Succulent root plant and stem plants with high water storage capacity separately were selected in the mixed planting combination test. For succulent root plants, Chlorophytum comosum was chosen; for succulent stem plants, Begonia semperflorens was chosen. For purpose of similarity, healthy plants with a height of about 20 cm and a crown size of 25 cm were used in the experiment.

2.3. Experimental Design

The model test was conducted to explore the influence of rainfall intensity and plant number on the water-storing and -retaining process of the vegetated slab trench. The test was designed to study the following contents: (1) Under rainfall conditions, the water migration at different positions of the slab trench was observed, and the rainfall overflow of the slab trench and the water storage capacity of the water storage chamber were collected. (2) Under the following drying conditions, the changes in water storage depth in the water storage chamber were recorded, and the fissure development characteristics of the soil surface and the growth state of vegetation were observed. (3) The changes in volumetric water content at different positions in the soil layer were monitored in real time during the whole rainfall-drying process.
The number of plants used in the test was 0, 1 and 3, respectively. The rocky desertification area in southwest China often experiences heavy rainstorms in summer and strong rainfall in stages [34]. The water catchment in the slab trench is composed of two parts including surface runoff and atmospheric rainfall, so the amount of surface runoff catching into the slab trench cannot be neglected. Since the model test is small and not capable of reflecting the runoff effect of the in situ slope, increasing the rainfall intensity is the best choice to assess the runoff effect. The rainfall intensities used in the model tests were 98.0, 148, and 222 mm/h, respectively, based on the in situ experience. Test groups MT1 (98.0 mm/h, 1 plant) and MT2 (148 mm/h, 1 plant) had the same rainfall time as MT3 (222 mm/h, 1 plant). The water storage depths of the water storage chamber in the three experimental groups at the end of the rainfall were compared to investigate the effect of rainfall intensity on the water storage efficiency of the vegetated slab trench. They were also provided as the initial conditions for studying the effect of water storage depth in the water storage chamber on the water-holding capacity of the slab trench during the following drying stage. Test groups MT3 (1 plant), MT4 (0 plants) and MT5 (3 plants) had the same rainfall ephemeris (222 mm/h), and the maximum storage depth (15 cm) was reached in 225 min. By means of the three groups of tests, the effect of the number of plants on the water storage efficiency of the vegetated slab trench was investigated. A detailed test plan is shown in Table 3.
To further explore the water storage capacity of succulent root plant (Chlorophytum comosum) and succulent stem plant (Begonia semperflorens) and the phenomenon of water complementarity under drying conditions, three groups of experiments were additionally set up. In test group 1, only succulent root plants were planted; in test group 2, only succulent stem plants were planted; in test group 3, four succulent root plants around a single succulent stem plant were planted in a mixed manner. The water storage capacity of the soil with different plant combinations was to be compared through tests.

2.4. Experimental Procedure

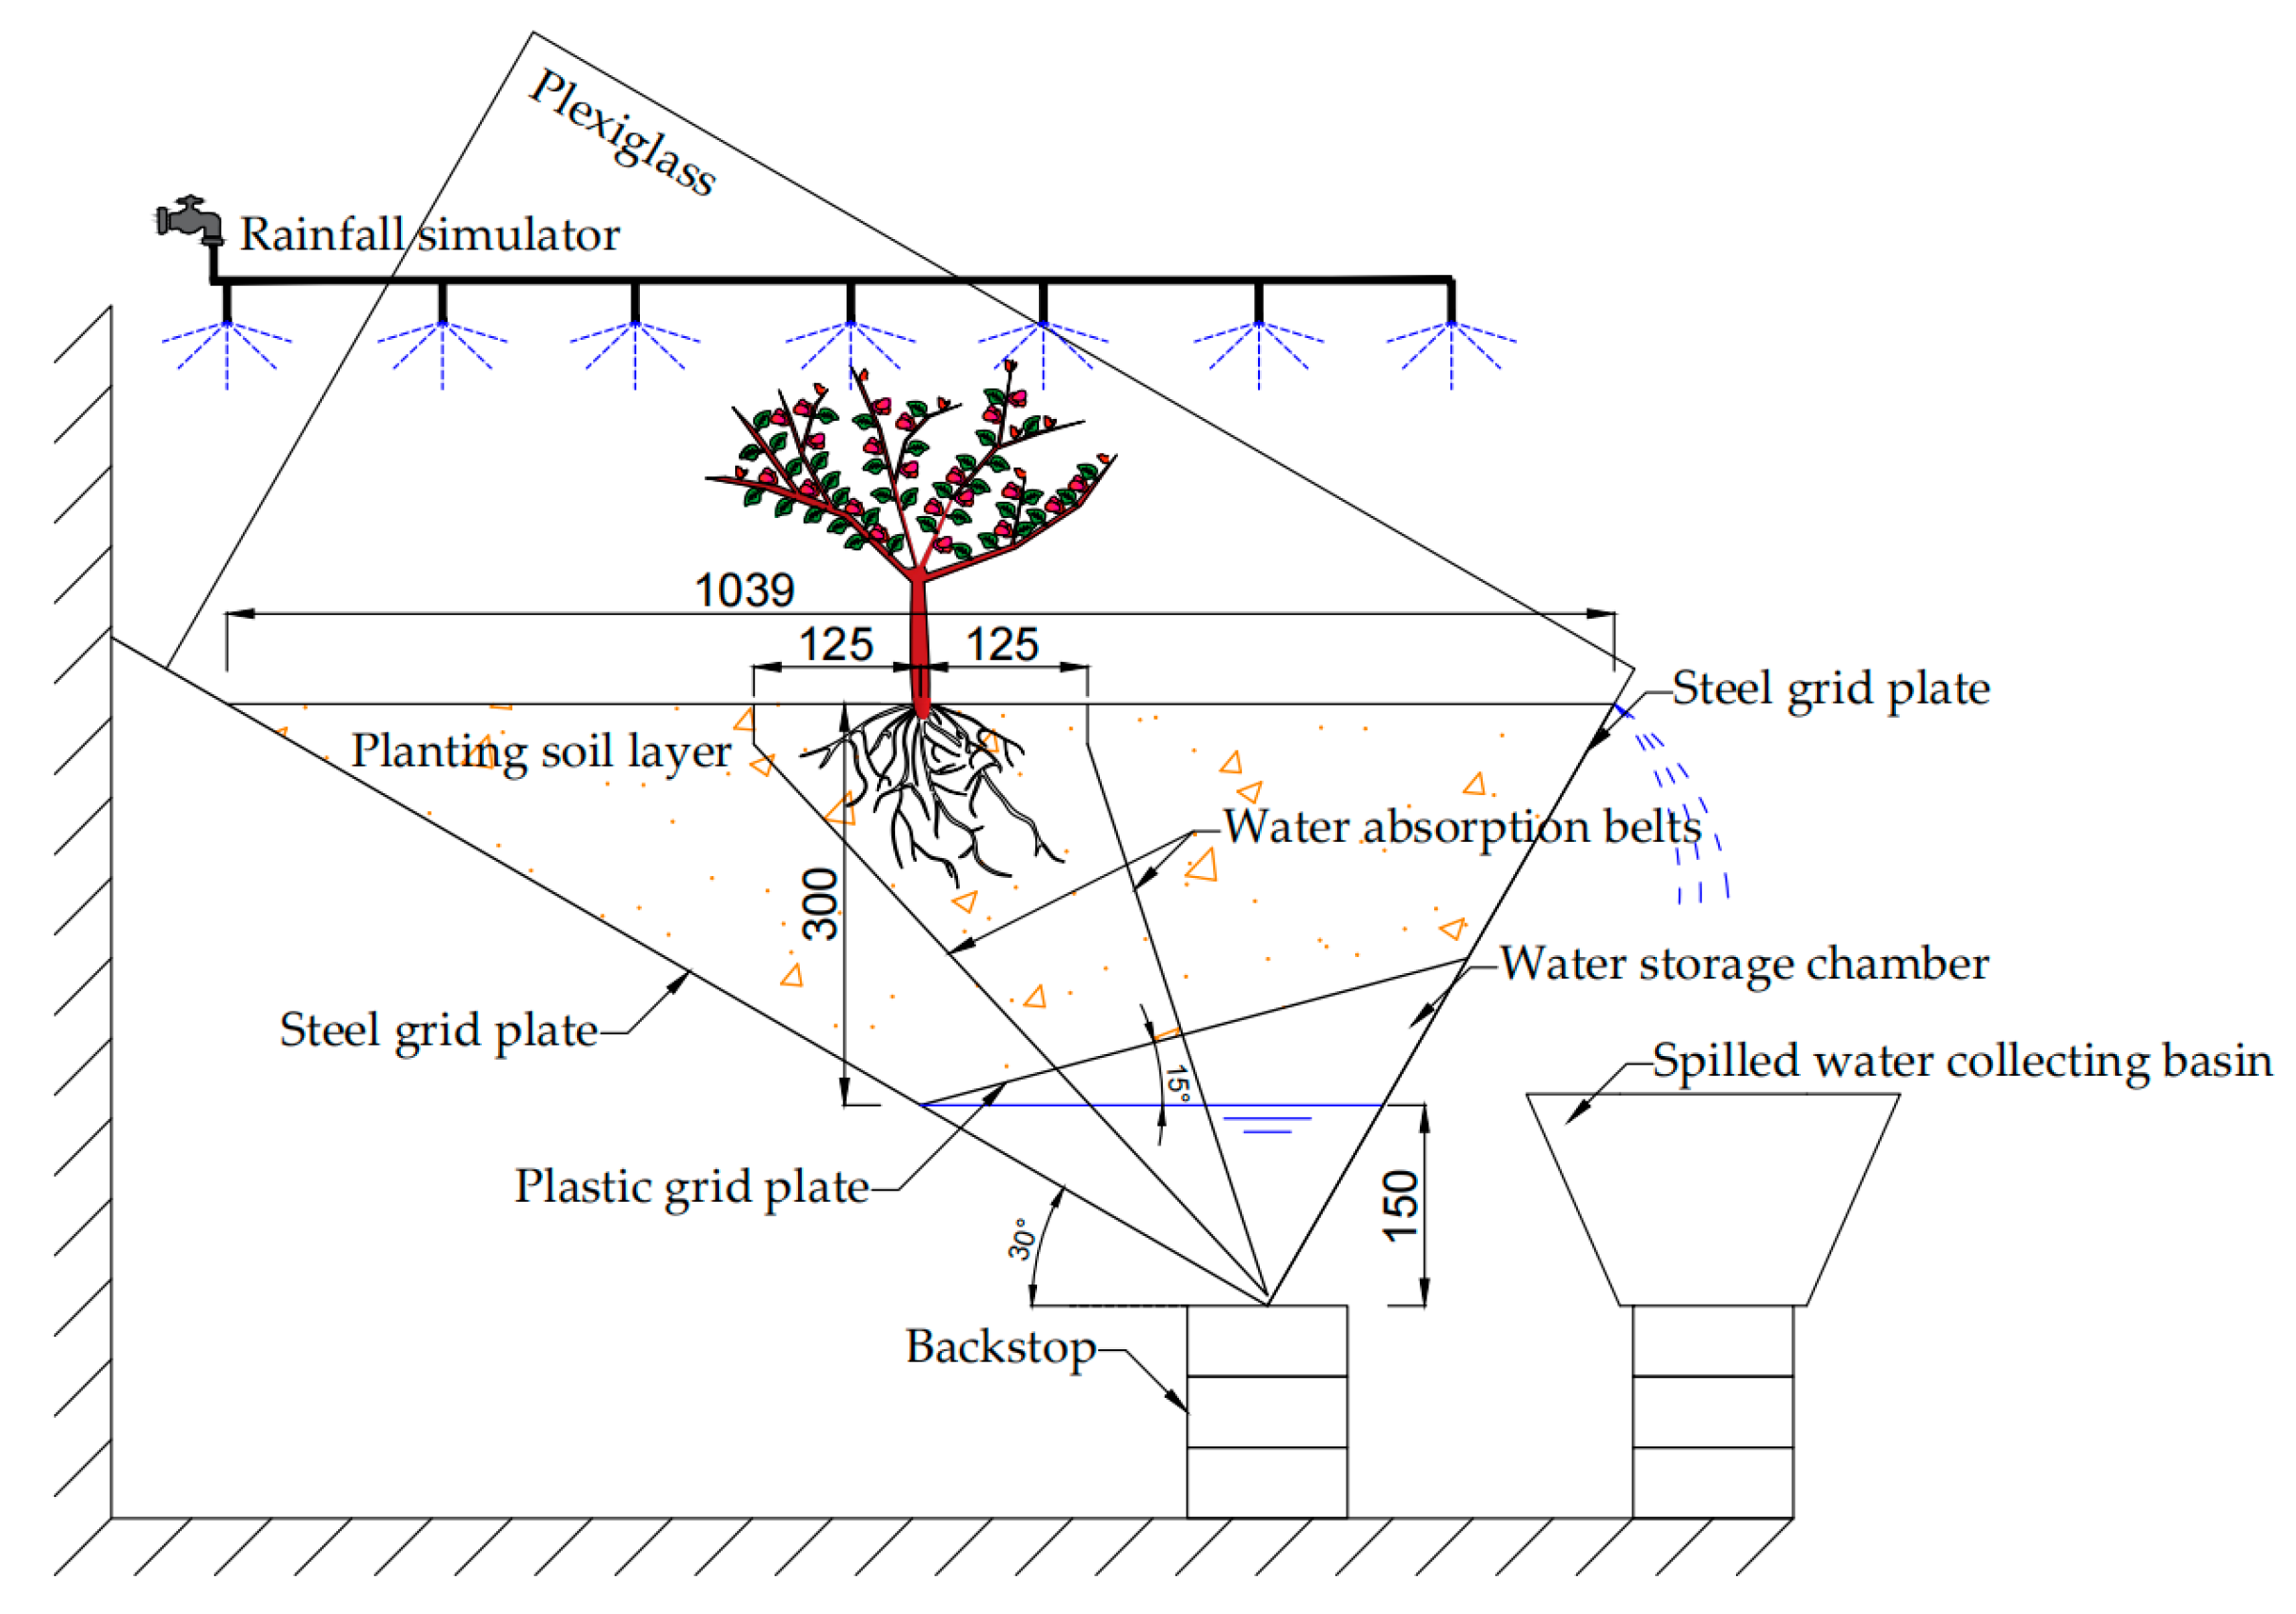
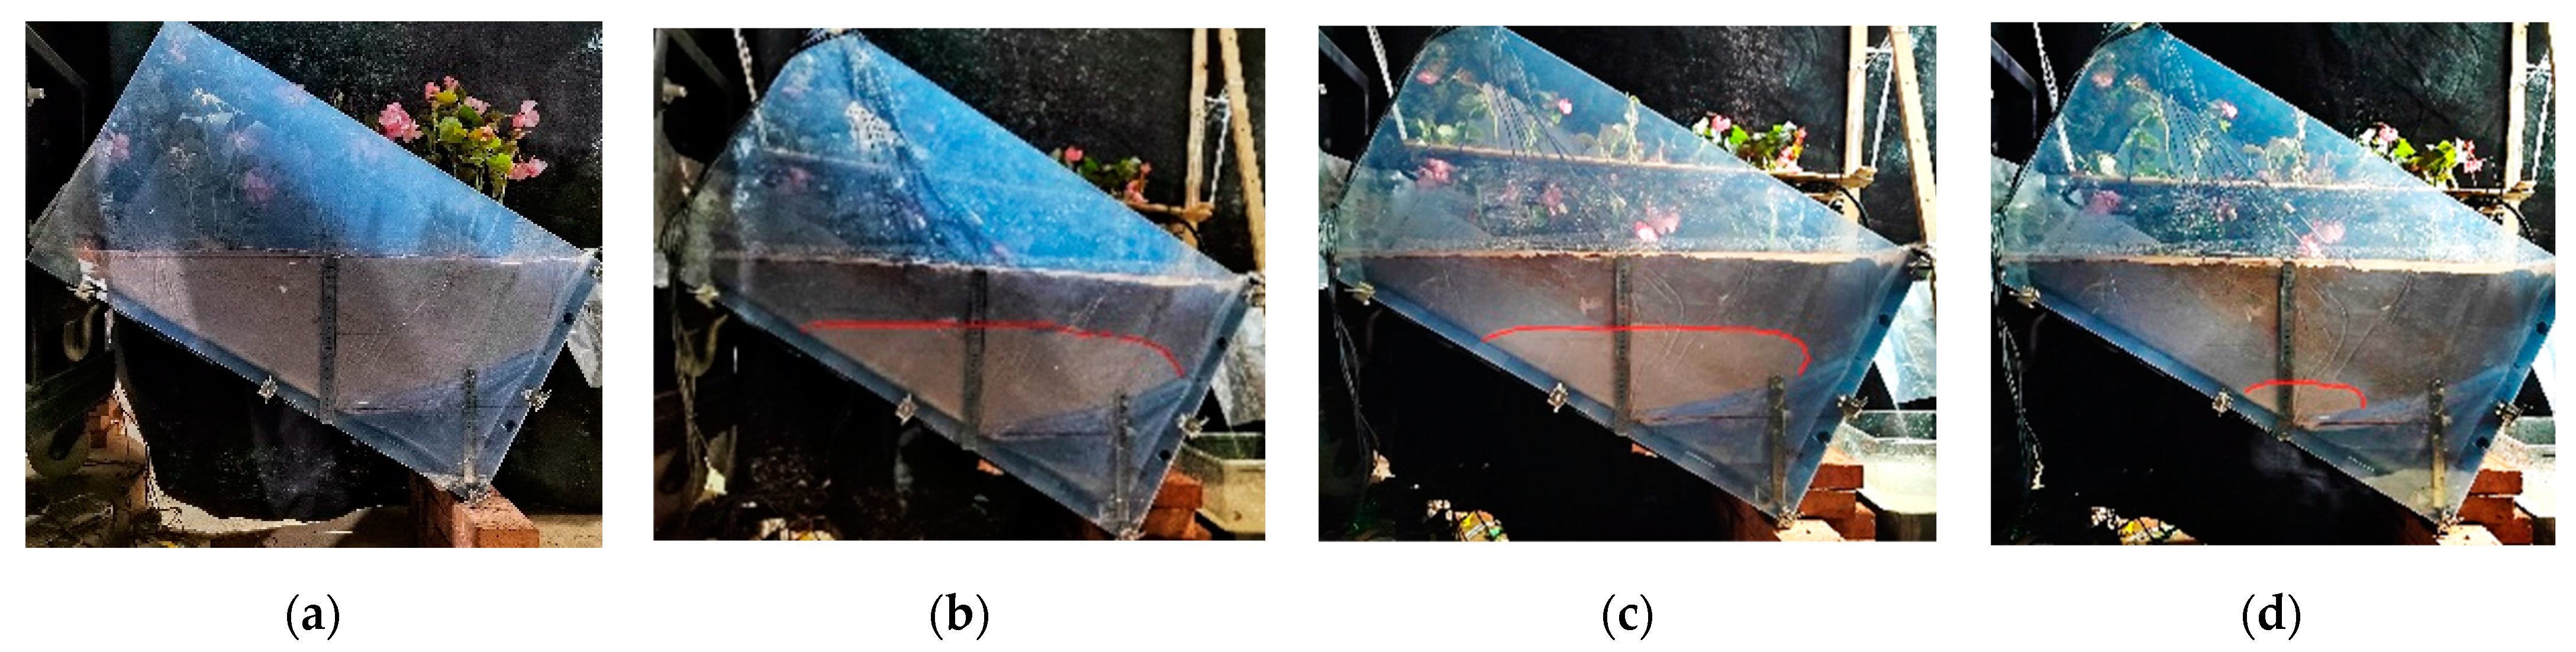
2.4.1. Model Designing and Setting Up

The model was designed and set up according to the patent technology of the research group of the corresponding author, so as to simulate water-retaining characteristics of earth-filled and water-stored slab trench.
(1) Manufacture of the Slab Trench
Two steel grid plates (300 × 1000 × 30 mm3, 300 × 550 × 30 mm3) and two plexiglass plates (550 × 1000 × 10 mm3) were connected with clips to form a test trench of size 550 × 1000 × 300mm3. The longer grid plate was the bottom plate of the trench. The slab trench was erected to form a slope angle of 30° between the bottom plate of the slab trench and the horizontal ground to simulate the rocky desertification slope.
(2) Internal Structure of the Slab Trench
The plastic grid plate was laid on the bottom plates to separate the space of the slab trench into soil filling layer and the water-storing layer below. A geotextile filter layer was laid on the plastic grid plate. The angle between the grid plate and the horizontal plane was 15°, and the maximum water storage depth of the water storage chamber was 15 cm. Two water absorption belts of different lengths were folded in pairs and stretched into the bottom of the reservoir and the soil. The water absorption belts were distributed in a “V” shape in the middle of the slab trench in a centrally symmetrical manner. The top of the water absorption belts was unexposed 3 cm from the soil surface to avoid contact with air.
(3) The Planting Soil Layer
Water and dry soil were weighed and mixed well with a volume ratio of 1:9. After 24 h, the moisture was distributed evenly in the soil. Then, the mixed soil was filled in three layers to form a 30 cm thickness of planting soil layer in the slab trench model.
(4) Implanting of the Vegetation
A hole with a diameter of 8 cm and a depth of 10 cm was dug at the maximum thickness of the soil layer. The Four Seasons Begonia with good growth and similar growth status was selected and implanted into the hole, and then the soil was backfilled. In test MT5 (3 plants), the same planting holes were excavated at a 25 cm distance from the center of the model.
Finally, the vegetated slab trench model with a width of 103.9 cm, a depth of 45 cm and a thickness of 30 cm was formed, as shown in Figure 2.

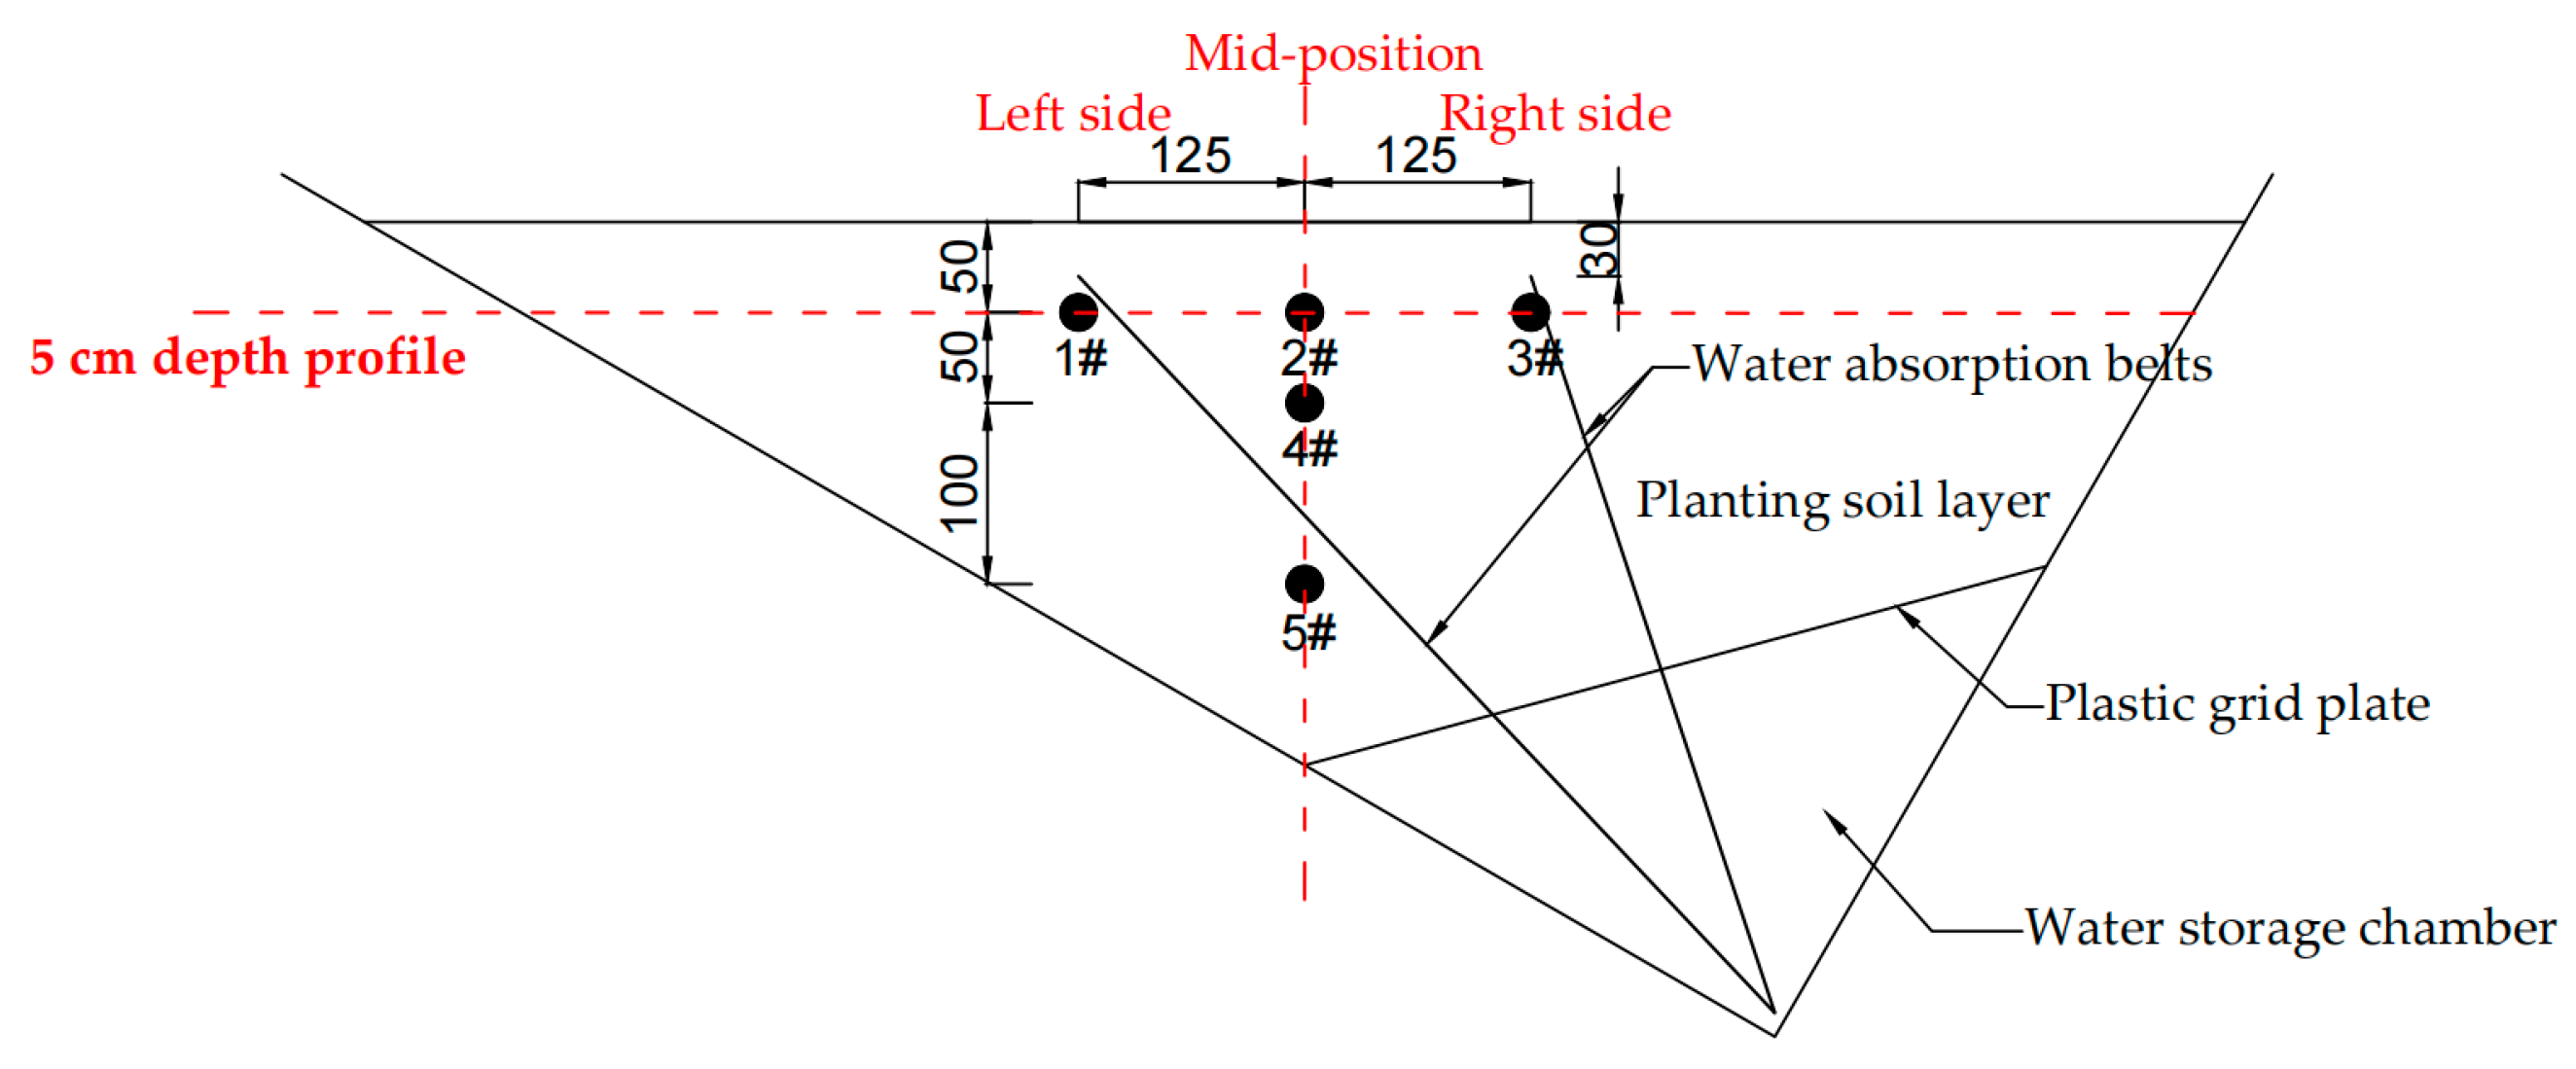
2.4.2. Installation of the Sensors

The sensors were installed while the soil is being filled. At the thickest part of the soil layer, where a virtual and vertical line was drawn, it is named as the middle position. The left and right side, with a 12.5 cm distance from the vertical line, were named the left position and the right position, respectively. The data of the sensors were measured, where 1#, 2# and 3# were in the dense root area, 4# was in the root tip area, and 5# was in the area without root. In addition, sensors 2#, 4# and 5# were located on the vertical line, respectively, at 5 cm, 10 cm and 20 cm distance from the soil surface. The sensor placement is shown in Figure 3.
In addition, sensors for water content measurement were also installed in the water storage test with single or mixed plants. The experiment was carried out in a model box with a side length of 30 cm and a depth of 15 cm (to model the upper soil layer in the slab trench model). Two measuring points were set up in each test group, which were located 5 cm and 10 cm below the soil surface, respectively, corresponding to the dense root area and root tip area. The specific placement of the sensor is shown in Figure 4.

2.4.3. Experiments

The test was divided into rainfall infiltration and evaporative drying periods to investigate the effect of rainfall intensity and plant number on the slab trench.
(1) Rainfall Infiltration Period
Rainfall was provided by an indoor artificial rainfall apparatus on the model at a height of 15 cm. The rain intensity was identified through an lzs-15 float flowmeter. Firstly, different intensities of rainfall were applied at the same period of 225 min. After the rainfall, different depths of water accumulation were formed in the water storage chamber of the slab trench. The water storage depths of the water storage chamber were measured as 8.2 cm, 11.3 cm and 15.0 cm, respectively, corresponding to 98.0 mm/h, 148 mm/h and 222 mm/h rainfall intensity conditions.
(2) The Following Evaporation Drying Period
After the rainfall period, the soil was dried for 30 days under natural conditions, the same as in summer. The temperature was recorded in real time. In addition, the water content fluctuation in the model soil layer, the variation in water storage depth in the water storage chamber, the development of fissures, and the growth of plants were monitored.
Additionally, four additional groups of water absorption tests were designed to explore how the water absorption efficiency would be affected in the drying process, when the water level of the water storage chamber decreased and the length of the absorbent belt exposed to air increased. The initially exposed lengths of the water absorption belts between the two cups in the four test groups were 2, 4, 6 and 8 cm, respectively. The cups with 7 cm diameter were filled with water or dry soil, respectively. The ends of each water absorption belt were buried in the soil or soaked in the water at the same position at the bottom of the cups. The water absorption belts used in the test, the arrangement of each test group, and the test process are shown in Figure 5.
In the water storage and retention test with single or mixed planting, at the beginning of the model test, the water head infiltration method was used to make the saturation of the soil reach 85%. The water head height was a constant 2 cm. At the same time, the model was weighed daily to quantify the transpiration and evaporation of each test group.

3. Results

3.1. Test Results of Vegetated Slab Trench in Rainfall and Drying periods

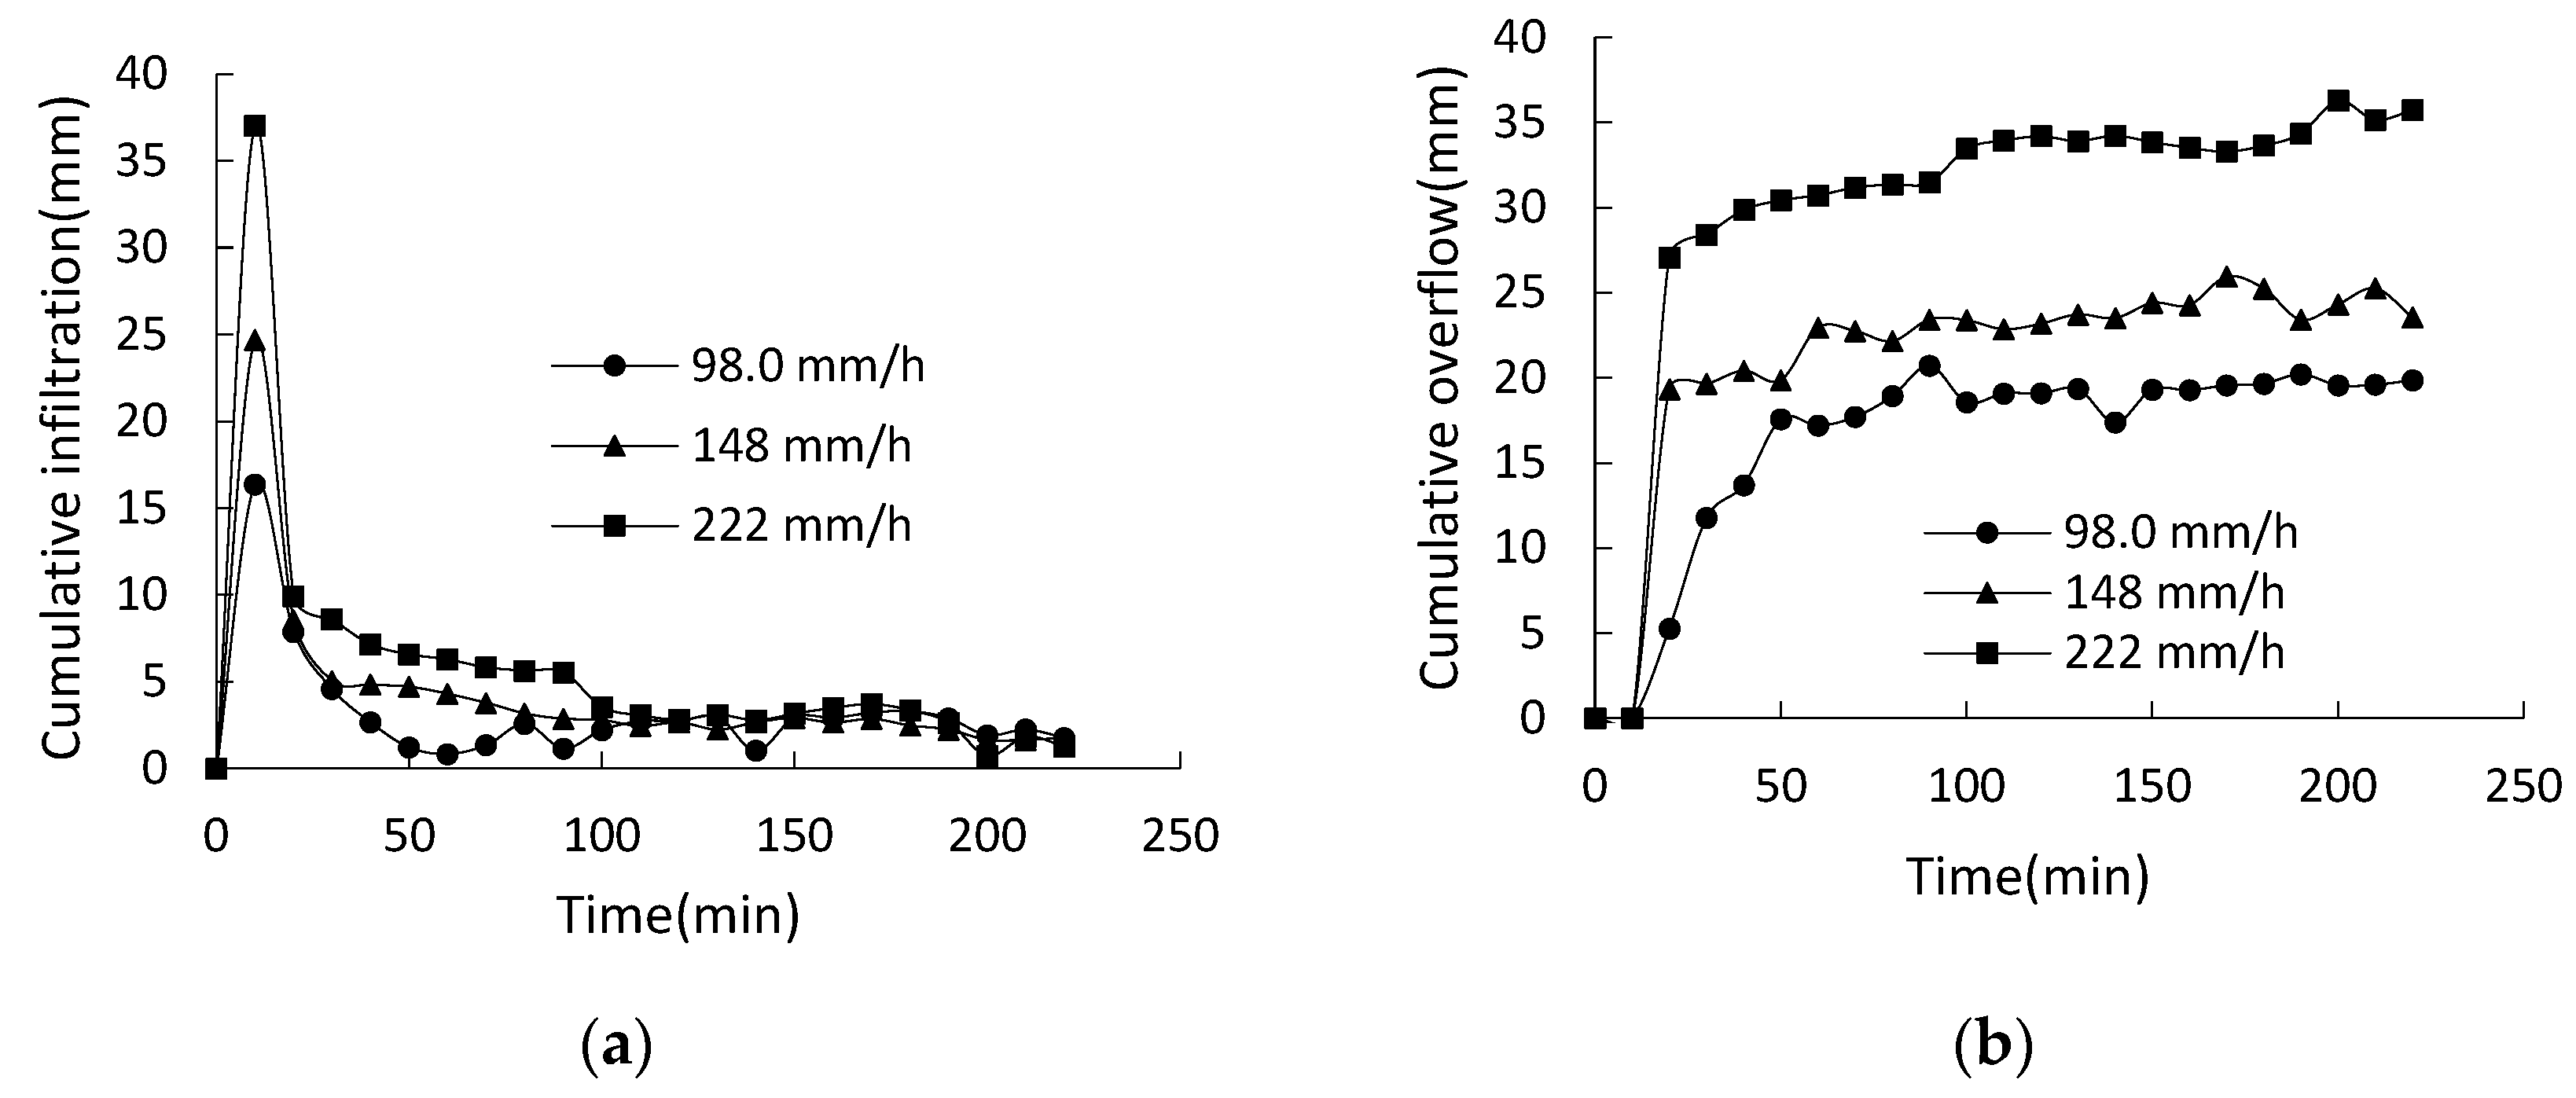
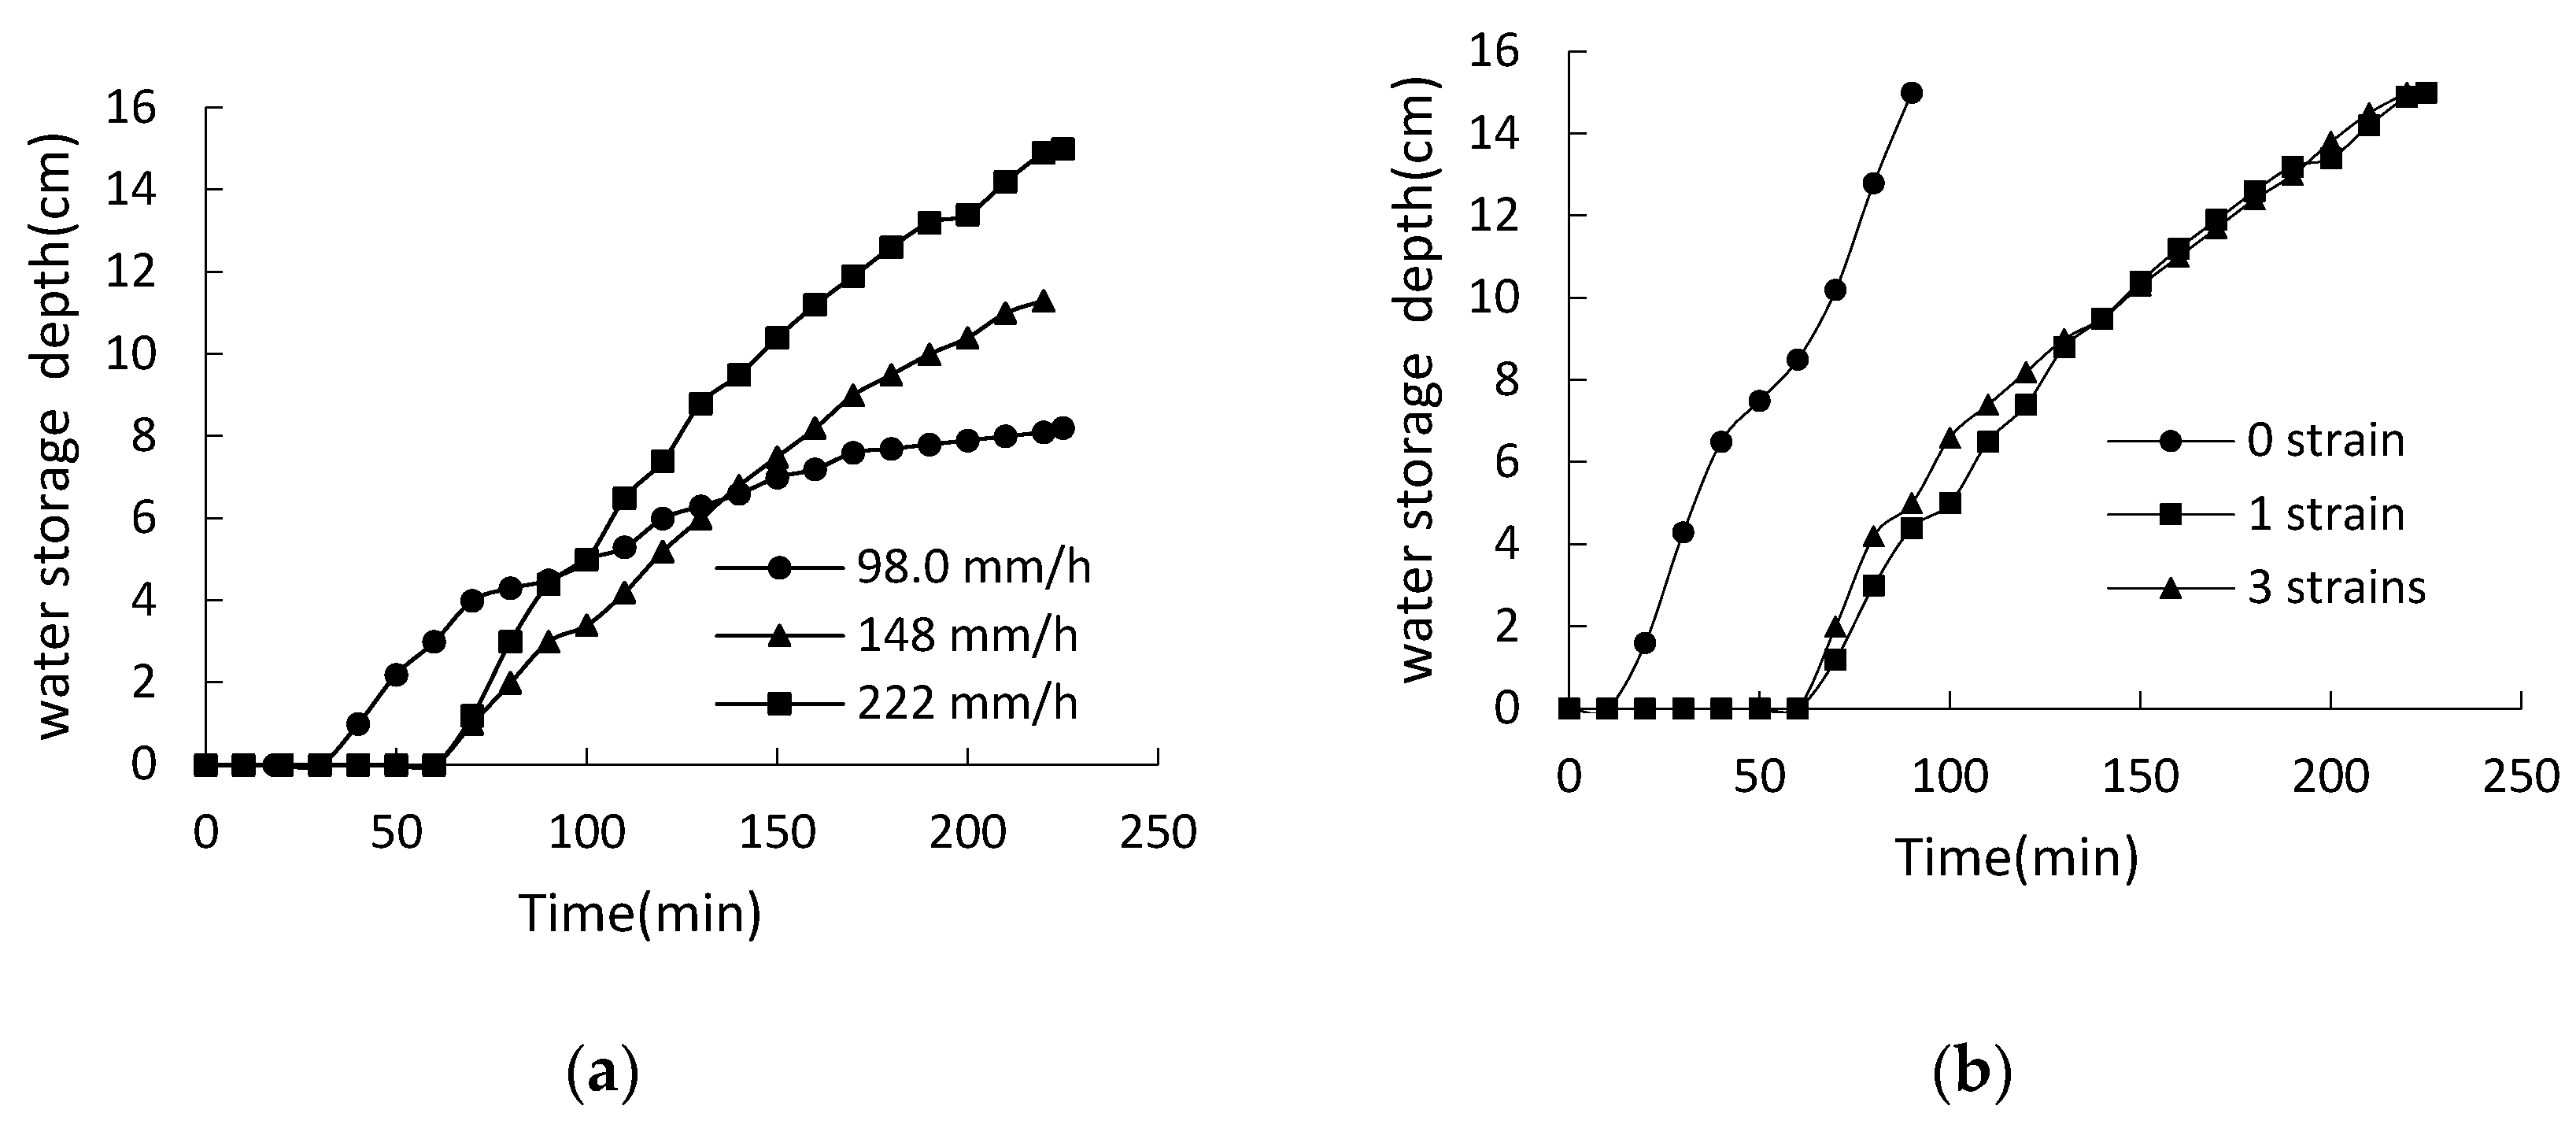
3.1.1. Results in Rainfall Period

(1) Wetting Front Curve and Cumulative Infiltration
Migration process of the wetting front curves of each test group was similar, and only the migration speed was different. Therefore, only the MT5 test group was taken as an example to analyze migration of the wetting front curves during rainfall infiltration. The rainfall intensity was 222 mm/h, and the number of plants was three. The experimental phenomenon is shown in Figure 6.
As infiltration progresses, the wetting front curve gradually resembles the shape of a “fishing rod”. This phenomenon is mainly due to the different soil thicknesses in the slab trench model and bottom boundary conditions at different locations. To facilitate the analysis, the planting soil layer is divided into three positions: left, middle and right. The rainwater falls to the soil surface to form a water pressure head, and the thickness of the soil in the middle is the largest, which mostly hinders rainwater infiltration. The thickness of the left and right sides of the soil is smaller than the soil at the middle position, and the hindrance to rainwater also decreases accordingly. Most importantly, for the soil on the right side, the thickness of the soil is the smallest, and the bottom is a plastic grid plate as a free drainage boundary; therefore, it is conducive to rainwater infiltration, and the shape of the wetting front curve becomes more obviously like a fishing rod.
The rainfall infiltration and water overflow of each vegetated slab trench model are similar. Test groups MT1, MT2 and MT3 are selected for comparative analysis. The amount of rainfall water is calculated by multiplying the rainfall intensity with time. The overflow water was collected, and the weight was obtained. The weight of the overflow water was subtracted from the total weight of rainfall water to obtain the weight of infiltration water. The water weight was divided by the rainfall area and density of water to obtain the cumulative infiltration and cumulative overflow in millimeters. The time-history curves of rainfall infiltration and overflow amount under different rainfall intensities in the slab trench model with one strain of plant are shown in Figure 7. The rainfall duration was 225 min when the water storage depth of the water storage chamber of the test group MT3 (222 mm/h) reached the maximum value.
It can be seen from Figure 7 that with the advance of the rainfall, the time-history curves of infiltration and overflow amount of each test group can obviously be divided into two stages. In addition, at the beginning of the rainfall, the greater the rainfall intensity, the greater the rainfall infiltration and overflow. The greater the rainfall intensity, the greater the rainfall that falls to the soil surface at the same time, and the greater the infiltration that occurs. However, because the rainfall intensity in this experiment corresponds to torrential rain, downpour and heavy downpour conditions, the rainfall intensity is much greater than the saturation infiltration coefficient of the soil, and most of the rainwater cannot infiltrate into the soil and begins to overflow. The rainwater infiltration gradually decreases until a stable infiltration stage is exhibited. At this time, the infiltration and overflow of each test group fluctuate near a constant value versus time.
The time-history curves of infiltration and overflow with rainfall duration of slab trench with different numbers of plants are shown in Figure 8. When the water storage depth of each test group reached the maximum (15.0 cm), the rainfall ended.
As can be seen from Figure 8, the infiltration and overflow volumes of each test group also show a clear two-stage curve as the rainfall process proceeds. In the early stage of rainfall, rainwater is completely infiltrated into the soil, and the infiltration amount is large. With the formation of the water head on the soil surface, the infiltration process gradually becomes slow and stable. In addition, in each test group with different numbers of plants, the smaller the plant number, the faster the infiltration, and the stronger the water storage capacity. This is due to the blocking effect of the plant canopy on rainfall and the soil compaction near the plant roots.
(2) Results of Water Storage Depth in the Water Storage Chamber
As the key structure of the water storage system, the water storage efficiency of the water storage chamber directly reflects the water storage capacity of the slab trench. Figure 9 shows the variation curves of water storage depth in the water storage chamber versus rainfall duration under different rainfall intensities and different numbers of plants.
It can be seen from Figure 9a that the water storage chamber of test group MT1 (98.0 mm/h, 1 strain), with a smaller rainfall intensity, begins to store water first, about 30 min earlier than the other two test groups. However, the water storage depth is the smallest, about 8.2 cm. Under the rainfall with different intensities, the water storage depths of MT3 (222 mm/h), MT2 (148 mm/h) and MT1 (98.0 mm/h) are 15.0 cm (the maximum depth of the water storage chamber), 11.3 cm and 8.2 cm, respectively, at the same rainfall duration (225 min).
The effect of the number of plants on the water storage process of the slab trench is mainly reflected by the plant canopy to intercept rainwater. It can be seen from Figure 9b that at a rainfall intensity of 222 mm/h, the variation in water storage depth versus rainfall duration is almost the same for the models with one and three plants due to the small number of leaves. The test group MT4 with 0 plants starts to store water in the water storage chamber about 50 min earlier than the other test groups, and the time to reach the maximum depth of 15.0 cm in the water storage chamber is 150 min earlier than the other test groups.
The effect of plant number on the water storage process in the slab trench is mainly reflected by the interception effect of the plant canopy on rainwater. The ecological restoration process will inevitably lead to increasing vegetation cover in the slab trench. In practical engineering, the rainfall directly falling into the slab trench is limited. After the rock desertification slopes are ecologically treated to become a runoff surface, most of the water catchment in the slab trench comes from slope surface runoff, and the interception effect of the vegetation canopy on the rainfall infiltration and storage into the slab trench may be smaller.
(3) Change in Volumetric Water Content during Rainfall Period
It is known that rainfall infiltration is a dynamic process, which changes with time and space. Soil thickness at different locations in the slab trench, and the plastic grid plate below the soil layer as a free drainage boundary, have an impact on the test. The test results of moisture content in the depth and width direction of the model are analyzed, respectively.
When the rainfall intensity is 222 mm/h, and with different numbers of plants, the distribution of volumetric water content in the depth direction along the virtual and vertical line in Figure 3 is shown in Figure 10.
It can be seen from Figure 10 that the higher the number of plants, the slower the water migration rate and the smaller the saturated volumetric water content. This phenomenon is mainly due to the interception of the plant canopy to weaken the intensity of rainfall to the ground as well as infiltration into the soil.
The distribution of the volumetric water content of the slab trench in test group MT1, in the depth direction along the virtual and vertical line in Figure 3, is shown in Figure 11.
It can be seen from Figure 11 that the initial response time of sensors 2#, 4# and 5# is 7 min, 26.5 min and 58.5 min, respectively, and the time to reach saturation is 38 min, 102.5 min and 104 min, respectively. When the rainwater moves from the position of sensor 2# to 4# (a distance of about 5 cm), it took 19.5 min. From points 4# to 5# (a distance of about 10 cm), the rainfall duration was 32 min. The rainwater migration process is more uniform. Comparing the values of saturated water content at each position indicates 4# > 2# > 5#. This phenomenon is due to the fact that the root zone is close to the water absorption belts, and the water content is higher due to the water-holding effect of the water absorption belts. The zone almost without root is closer to the bottom grid plate as it is an air-touching surface, resulting in a lower water content.
In the slab trench, the distribution of volumetric water content along the virtual and horizontal line in Figure 3 is shown in Figure 12. In the width direction, the sensors are installed under a depth of 5 cm from the soil surface.
It can be seen from Figure 12 that the values of saturated water content along the virtual and horizontal line in the slab trench are 2# > 3# > 1#. This phenomenon is mainly due to the different soil thicknesses caused by the bottom inclined grid plate as an air-touching surface in the slab trench. The thickness of the soil layer in the middle position is the largest, which is far from the boundary on both sides and less affected by the boundary conditions. The water absorption belt is mainly arranged on both sides of the plant in the middle position of the slab trench; therefore, it is beneficial for water retention and the water-holding capacity. In practical engineering, vegetation is mainly planted in the middle position with a maximum soil thickness. It can not only meet the requirements of root elongation on soil thickness but also provide sufficient water for plant growth.
When the rainfall intensity is 222 mm/h, the distribution of volumetric water content in the width direction of the slab trench with different numbers of plants is shown in Figure 13. As can be seen from Figure 13, the values of saturated water content along the virtual and horizontal line in the slab trench are 2# > 3# > 1#, the same as shown in Figure 12. It indicates that the rainfall intensity plays a larger role than the plant numbers.

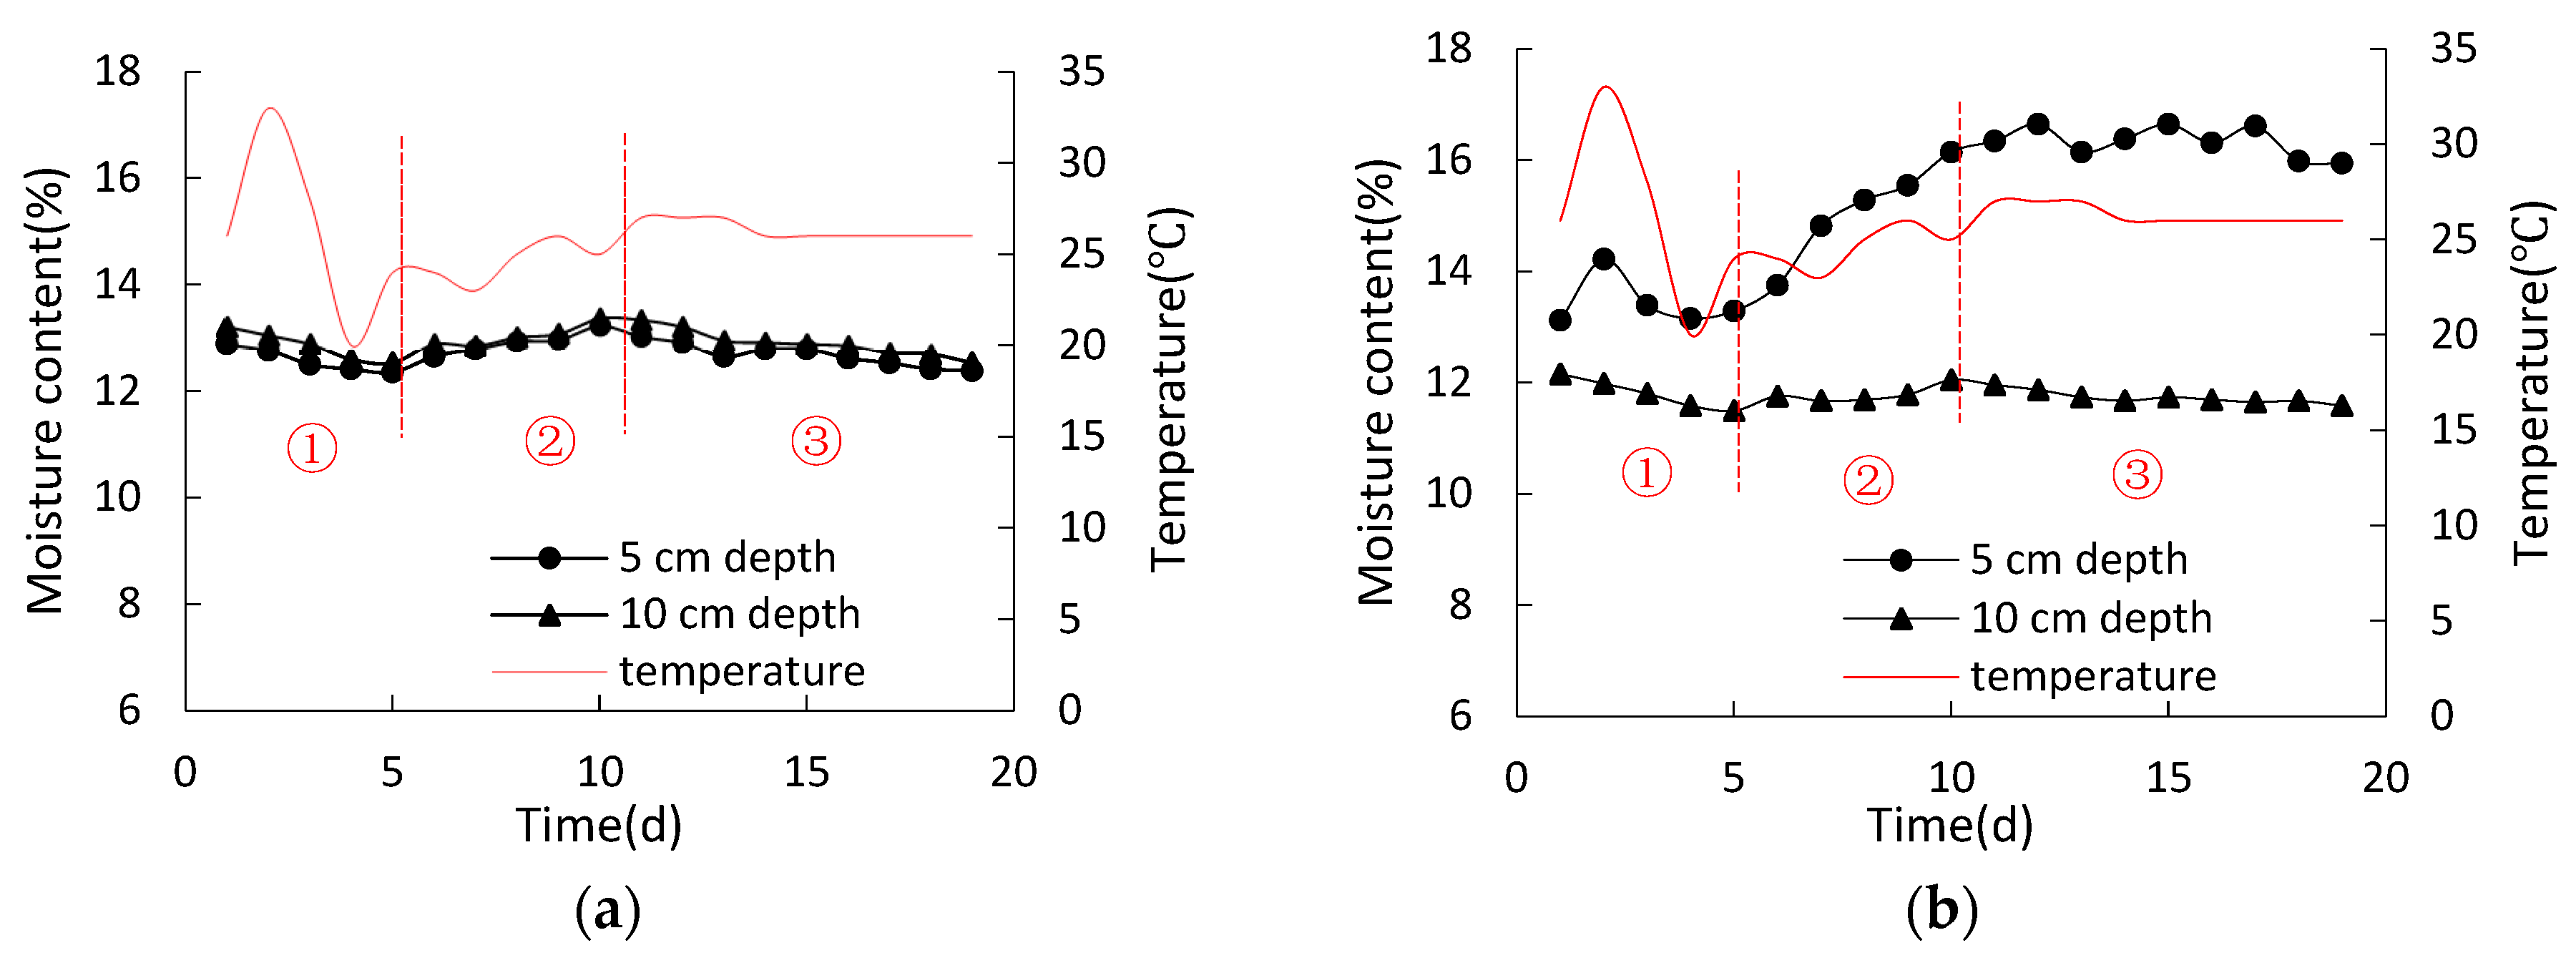
3.1.2. Results in Drying Period

(1) Cracks Development in the Soil
Because the test in drying process was carried out in autumn, the ambient temperature was low. The water absorption of plant roots was weak, and after the rainfall period, the water storage depth of the chamber of each test group was not reduced to 0 after 30 days of drying. Therefore, light heating is applied around the model. In the whole drying process, water was continuously transported from the chamber to the soil and plants.
The crack development process of each test group is similar, as shown in Figure 14. After the rainfall period, the soil collapsible settlement first appears, inducing cracks at the edge of the model. It increases the water loss channel in the soil, as shown in Figure 14a. As the drying stage proceeds, firstly, tiny cracks are generated at the outlet of the sensor wire at the edge of the model, as shown in Figure 14b. Drying promotes the further development of cracks, as shown in Figure 14c. The cracks on the edge of the model gradually increase, as shown in Figure 14d. Then, the edge cracks of the model develop and gradually extend to the middle of the model, and they finally become a crack net, as shown in Figure 14e. There were no cracks around the rhizome of the plants in each test group. Only a few cracks appeared between the two plants in the test group with three plants at the end of drying, as shown in Figure 14f.
(2) Change in Volumetric Water Content during Drying Period
As presented above, artificial rainfall with different intensities and the same duration was performed first, and then the drying stage followed. After the rainfall was over, water accumulated in the water storage chamber of the slab trench with different depths. The water storage capacity is characterized by the water storage depth. Under 98.0 mm/h, 148 mm/h and 222 mm/h rainfall intensity conditions, the measured water storage depth in the chamber is 15.0 cm, 11.3 cm and 8.2 cm, respectively. As the initial condition with the three water storage depths, the drying test is performed within 30d.
The different numbers of plants show different intensities of water up-taking capability by the root system. With different numbers of plants, the volumetric water content from the sensors 2#, 4# and 5# in the slab trench along the virtual and vertical line in Figure 3 is shown in Figure 15.
It can be seen from Figure 15 that under dry conditions, the test group MT5 with the largest number of roots has a better water-holding effect, and the maximum change in volumetric water content is only 2.72%. The reason for this may be the higher number of plants in test group MT5, which can hold more water in the roots and the soil.
Under the condition of different initial water storage depths, the volumetric water content measured from the sensors 2# and 4# in the slab trench along the virtual and vertical line in Figure 3 is shown in Figure 16.
It can be seen from Figure 16 that in test groups MT1 (water storage depth of 8.2 cm) and MT3 (water storage depth of 15.0 cm), the water-holding capacity in dense root areas where sensor 2# was installed is hardly different. However, it is quite different in the root tip area where sensor 4# was installed. This is mainly due to the fact that the root tip area is the main water-absorbing part of the plant, and it is more susceptible to the effect of water absorption by water absorption belts. In the early drying period, the moisture content of test group MT1 decreases sharply. This is mainly due to the longer length of the water absorption belts exposed to air in test group MT1. As the length of the water absorption belts exposed to air gradually increases, the rate of water absorption of the belts gradually stabilizes.
Under the condition of different initial water storage depths, the volumetric water content measured from the sensors 1#, 2# and 3# in the slab trench along the virtual and horizontal line in Figure 3 is shown in Figure 17. It can be seen from Figure 17 that the highest volumetric water content is still measured at sensor 2# in the middle position with the largest soil thickness and dense root. After a 30d period of drying, the volumetric water content is still around 30% and enough to retain water for vegetation growth.
(3) Influence of the Exposed Length of Water Absorption Belts to Air during Drying Period
Under the drying conditions, when the water storage chamber in the slab trench is not full of water, the water absorption belt will have an exposed length between the soil above and the water stored below, and this part will be dry. However, in the slab trench model, it is difficult to measure the exposed length of water absorption belts and quantify its influence during the drying period. Therefore, as shown in Figure 5 and Figure 18 and Table 4, the test results will be presented to discuss this aspect.
It can be seen from Table 4 that after the first day, the water diffusion width of the soil surface reaches 7 cm in the test groups with an exposed length of 2 cm and 4 cm. However, until the third day, the water diffusion width has reached 7 cm in the other two test groups with a longer exposed length of the water absorption belt. It is clear that the exposed length of the absorbent belt affects the water absorption rate, and the shorter the initially exposed length, the faster the water absorption rate. When water is absorbed through the belts from the water stored below to the soil above in the slab trench, the water table in the chamber will decrease, and the exposed length of the belts will increase. According to the results from Table 4, the efficiency of the slab trench may decrease unless the chamber hidden in the slab trench is free of wind and heat.
In Figure 18, the drop in water level in the cup represents the amount of water absorbed by the soil in the other cup through the belt, and the daily water change in the soil is quantified by the variation in soil mass per day.
It can be seen from Figure 18a that the water in the cup is quickly infiltrated into the soil through the belt, and the water absorption efficiency of the belt is very high. Within two days, the minimum water absorption of the test groups reaches a depth of 1.8 cm in the cup, accounting for 24.3% of the total water storage. In addition, after three days of drying, the water absorption of each test group fluctuates near a small value and maintains a dynamic balance. This is mainly due to the fact that the large initial water absorption results in an increase in the exposed length of the water absorption belts. On the third day of drying, with the decrease in water level in the cup, the exposed length of the water absorption belts increases from the initial 2 cm, 4 cm, 6 cm and 8 cm to 5.8 cm, 8 cm, 9.2 cm and 10.4 cm, respectively. The water absorption efficiency of each test group is similar. Therefore, it can be concluded that after the exposed length of the water absorption belt reaches a certain value, the water absorption efficiency does not change anymore.
It can be seen from Figure 18b that from the fifth day of drying, the curve shows a negative value; that is, the daily water absorption in the soil began to be less than the evaporation. Corresponding to the initial exposed length of water absorption belts which is 2 cm, 4 cm, 6 cm and 8 cm, negative values appear in the curves, and they are 7 d, 5 d, 5 d and 5 d after drying. It is known, from Figure 18, that the water absorption efficiency of each test group is low and basically remains unchanged from the 3rd day after drying. Therefore, under the condition of drying, a large exposed length of the water absorption belt will lead to insufficient water absorption in the soil to resist evaporation and will weaken the water-holding effect of the slab trench.
From the above analysis, it can be seen that the exposed length of the water absorption belt affects water absorption efficiency. In the drying process, with water level dropping, the exposed length of the water absorption belt gradually increases, the water absorption rate gradually slows down, and the water absorption efficiency gradually decreases. However, when the exposed length of the water absorption belt reaches a certain value, the water absorption efficiency will decrease to a small value and remain stable. Therefore, for rocky desertification slopes, it is important to hide the water storage chamber below the soil layer in the slab trench to be free of wind and heat. It is necessary to ensure sufficient water storage in the water storage chamber by artificial water replenishment during the dry season.

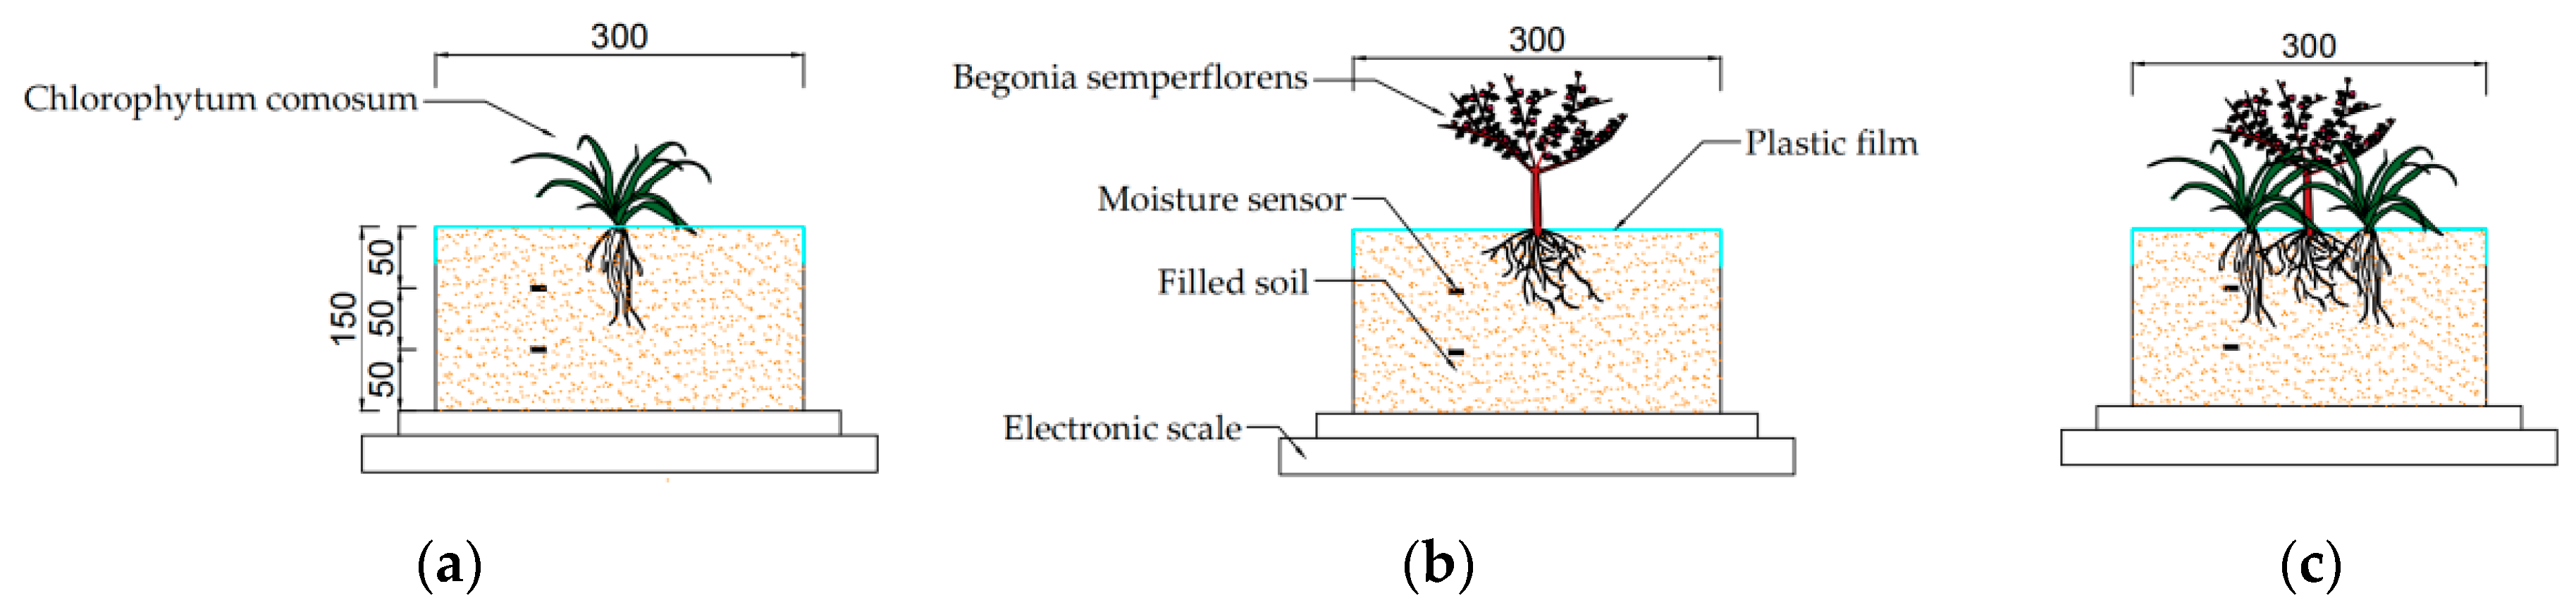
3.2. The Test Results of Mixed Plants in Rainfall Cumulus and the following Drying Period

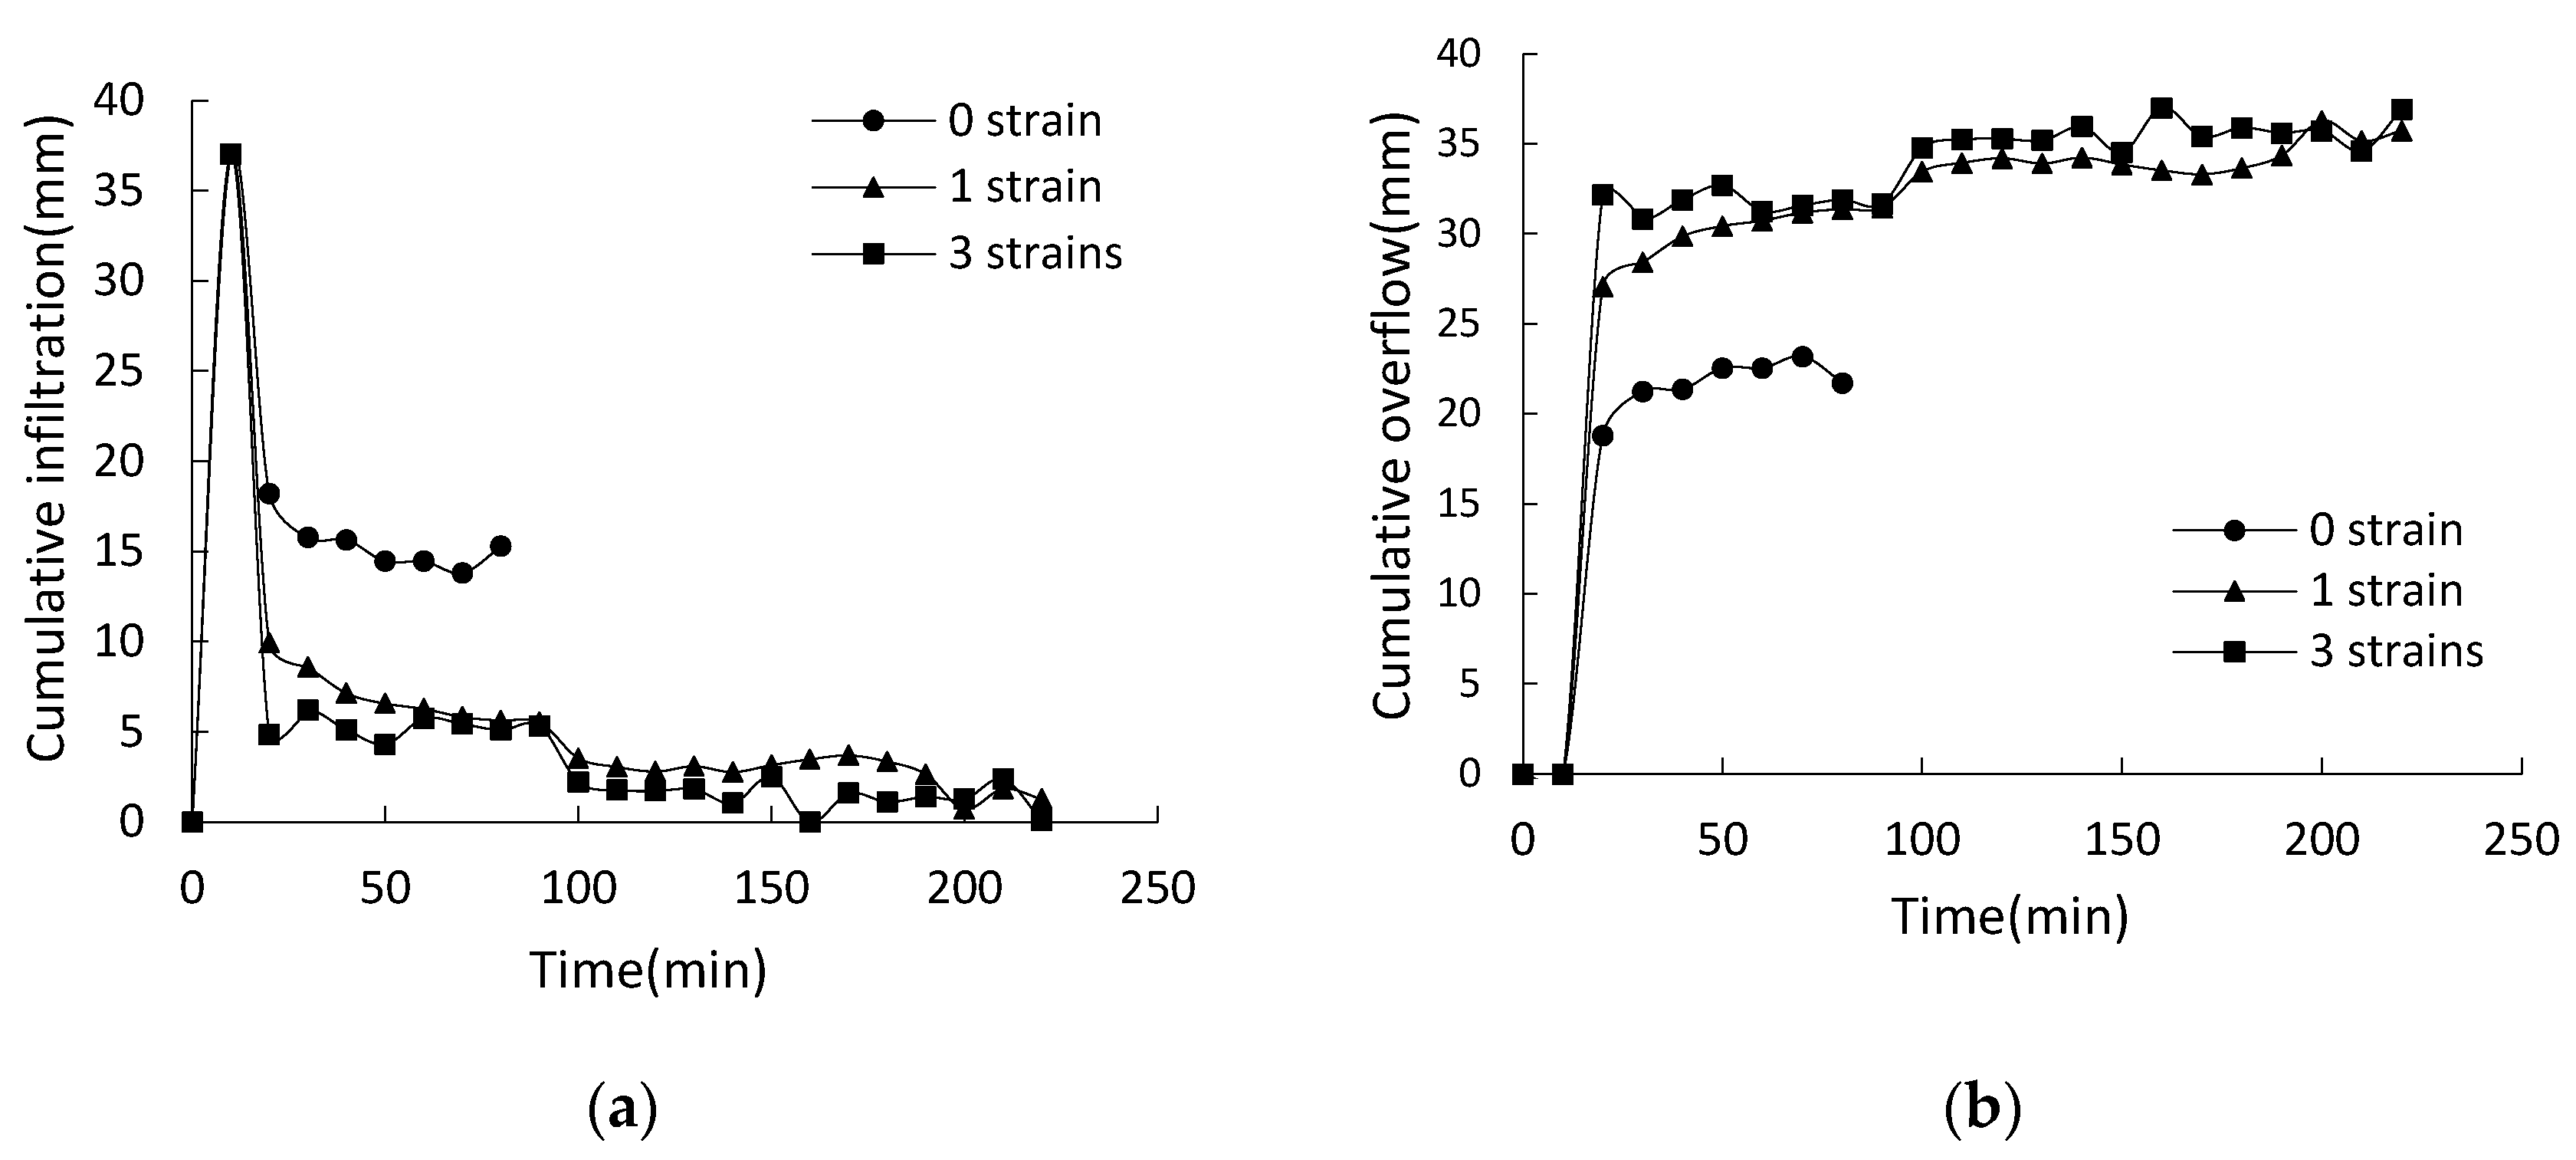
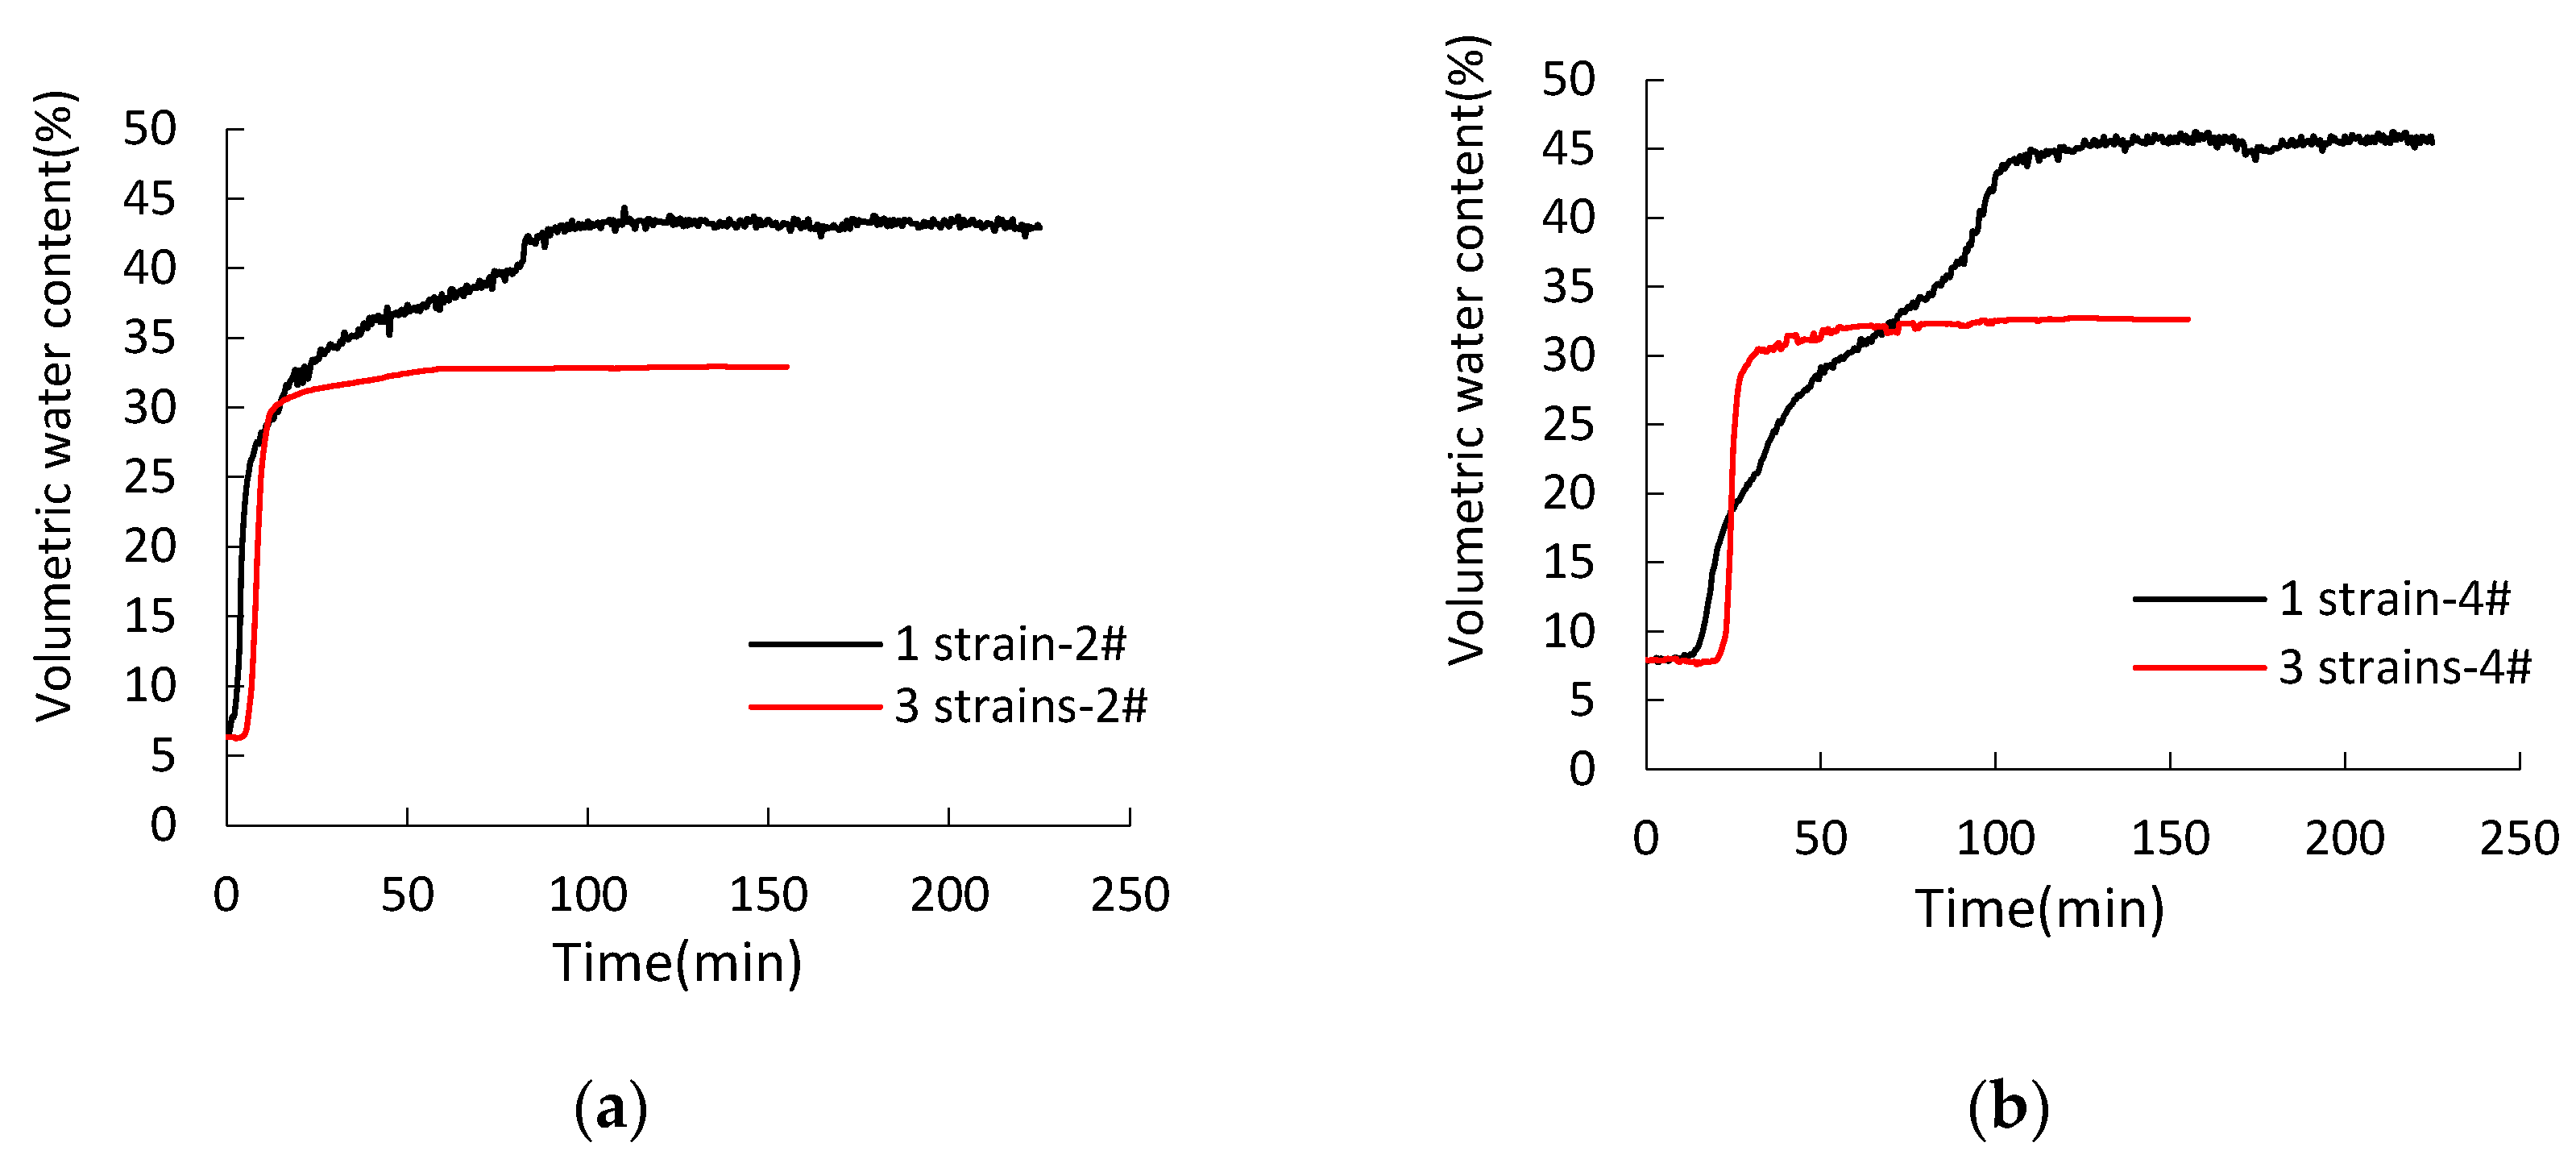
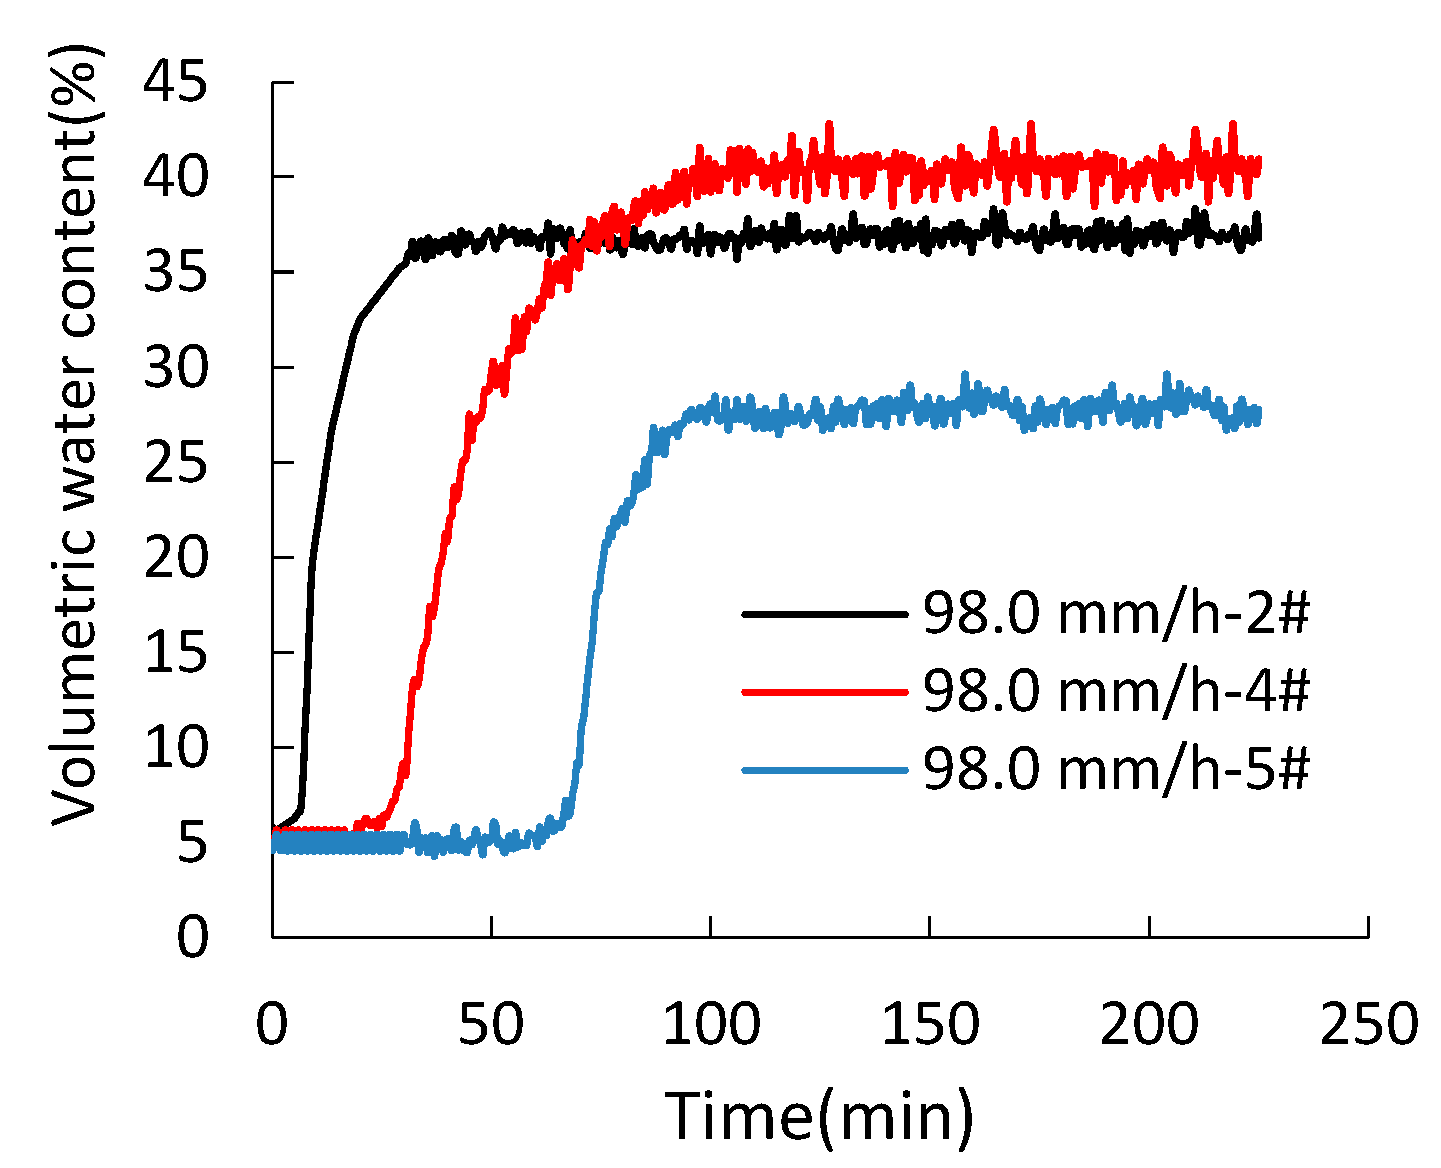
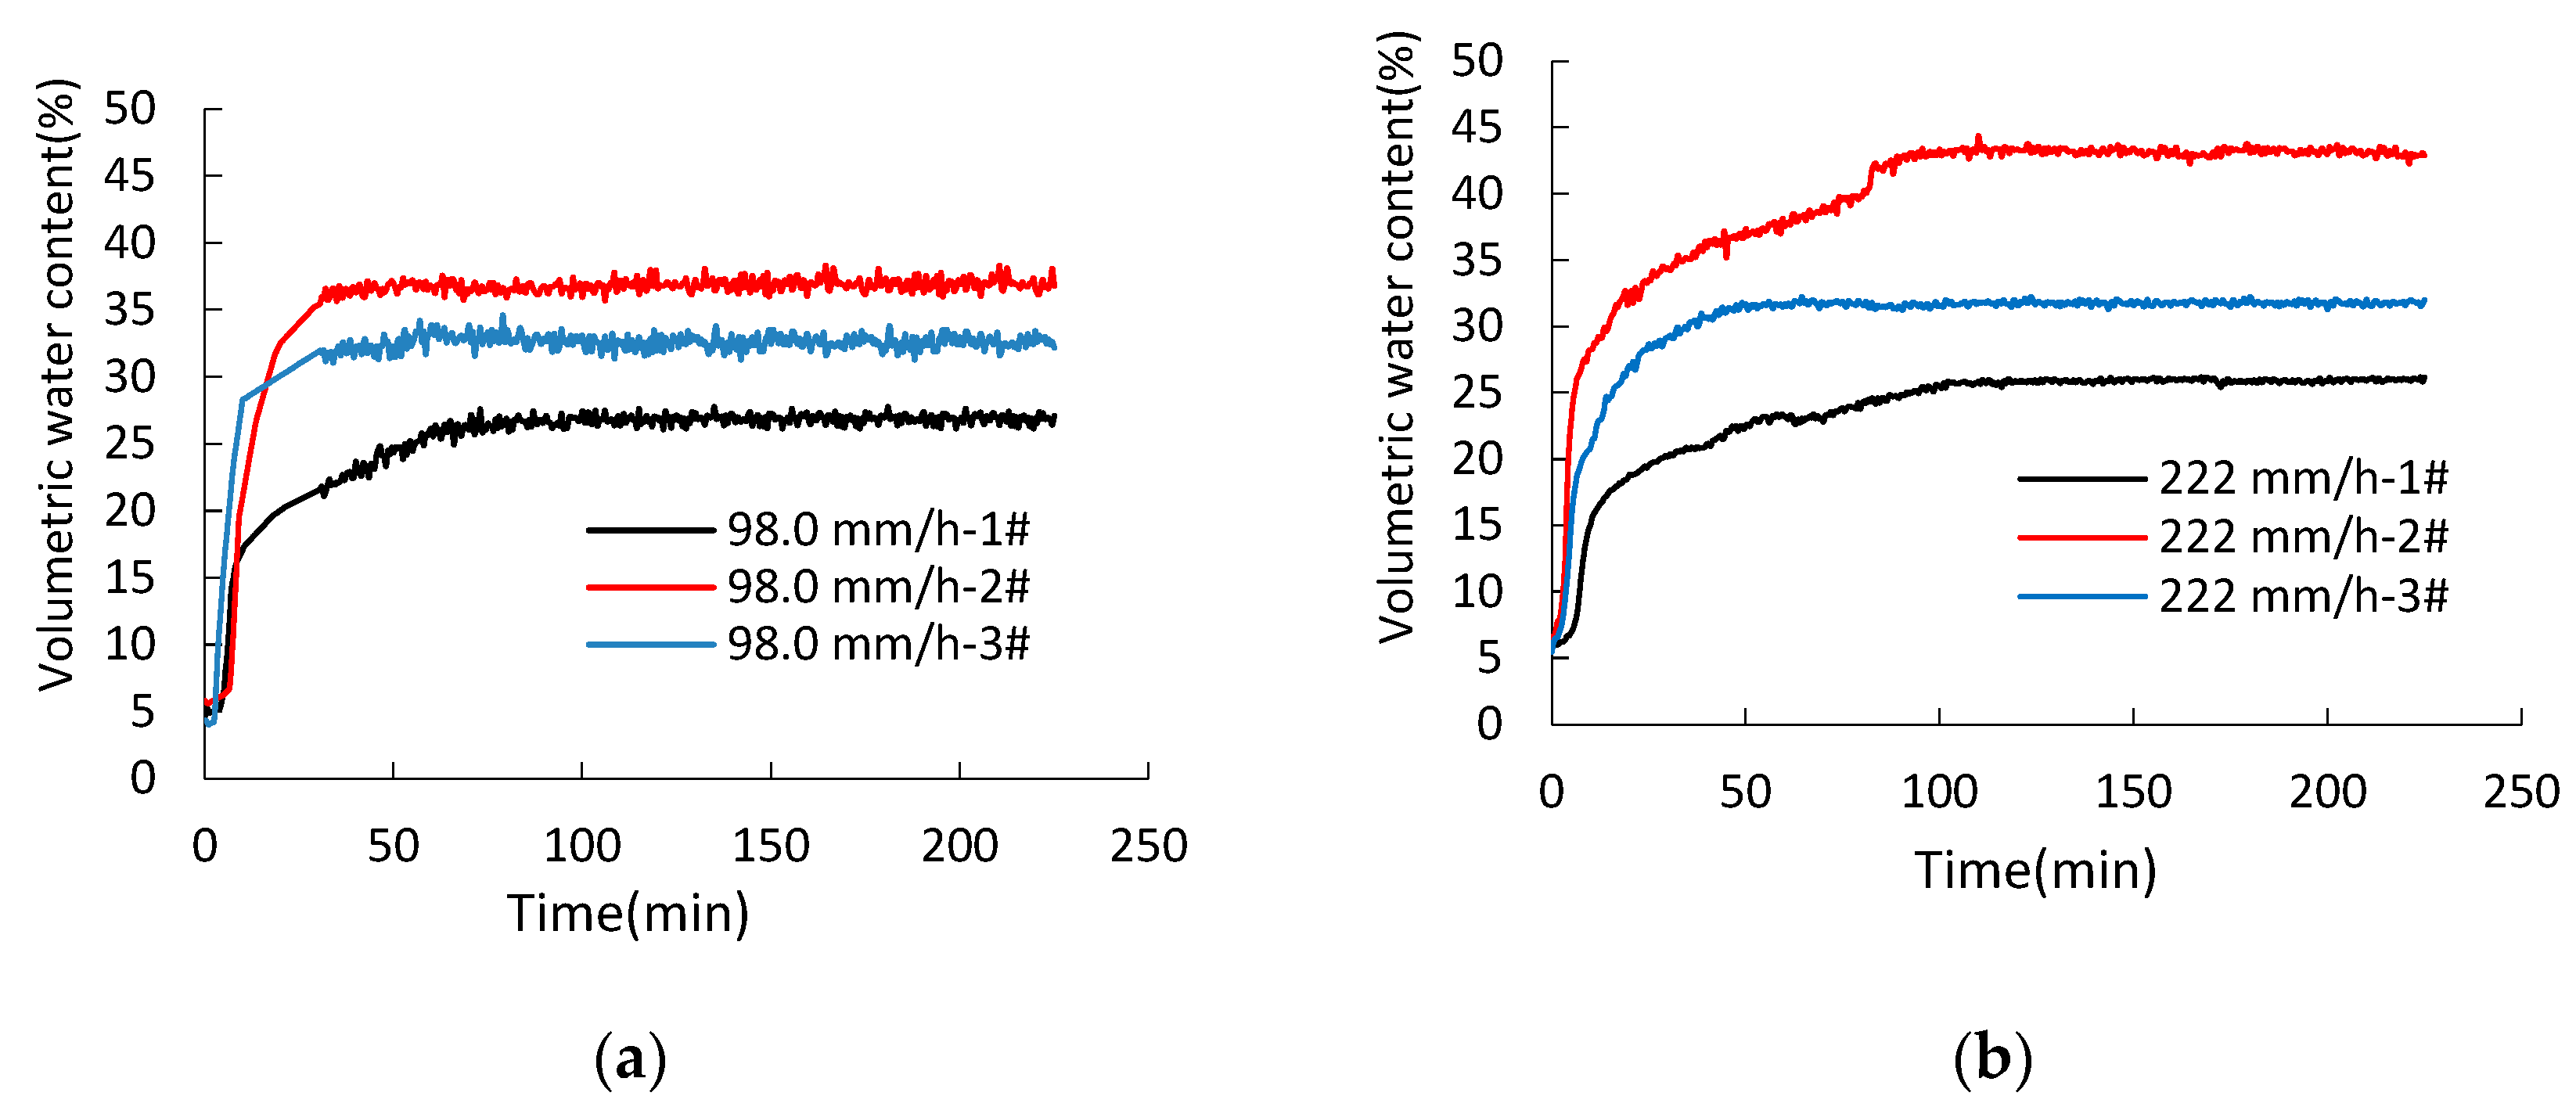
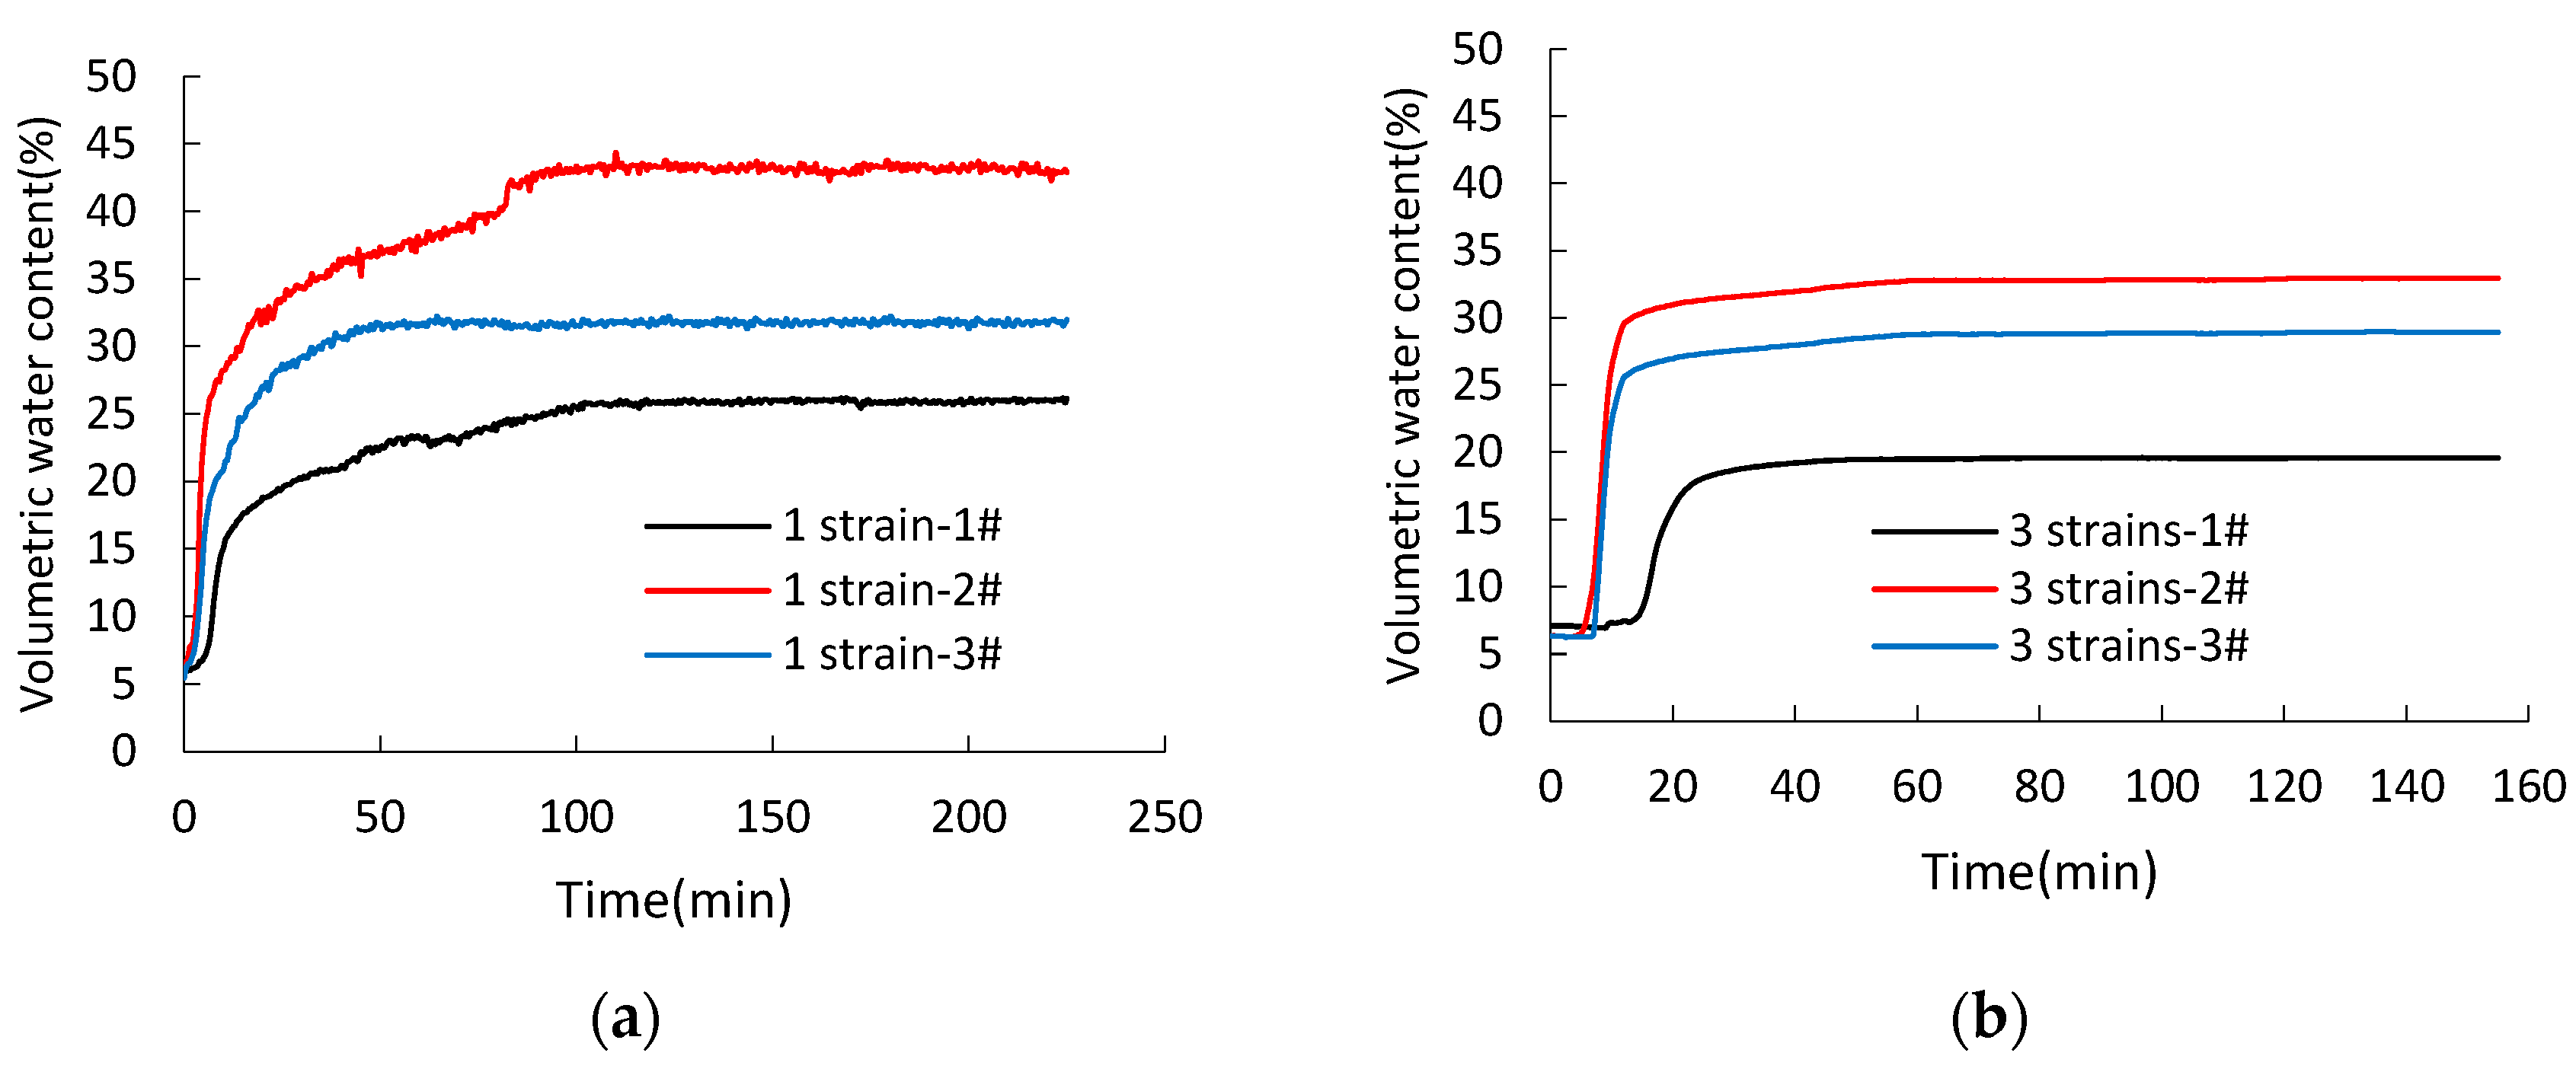
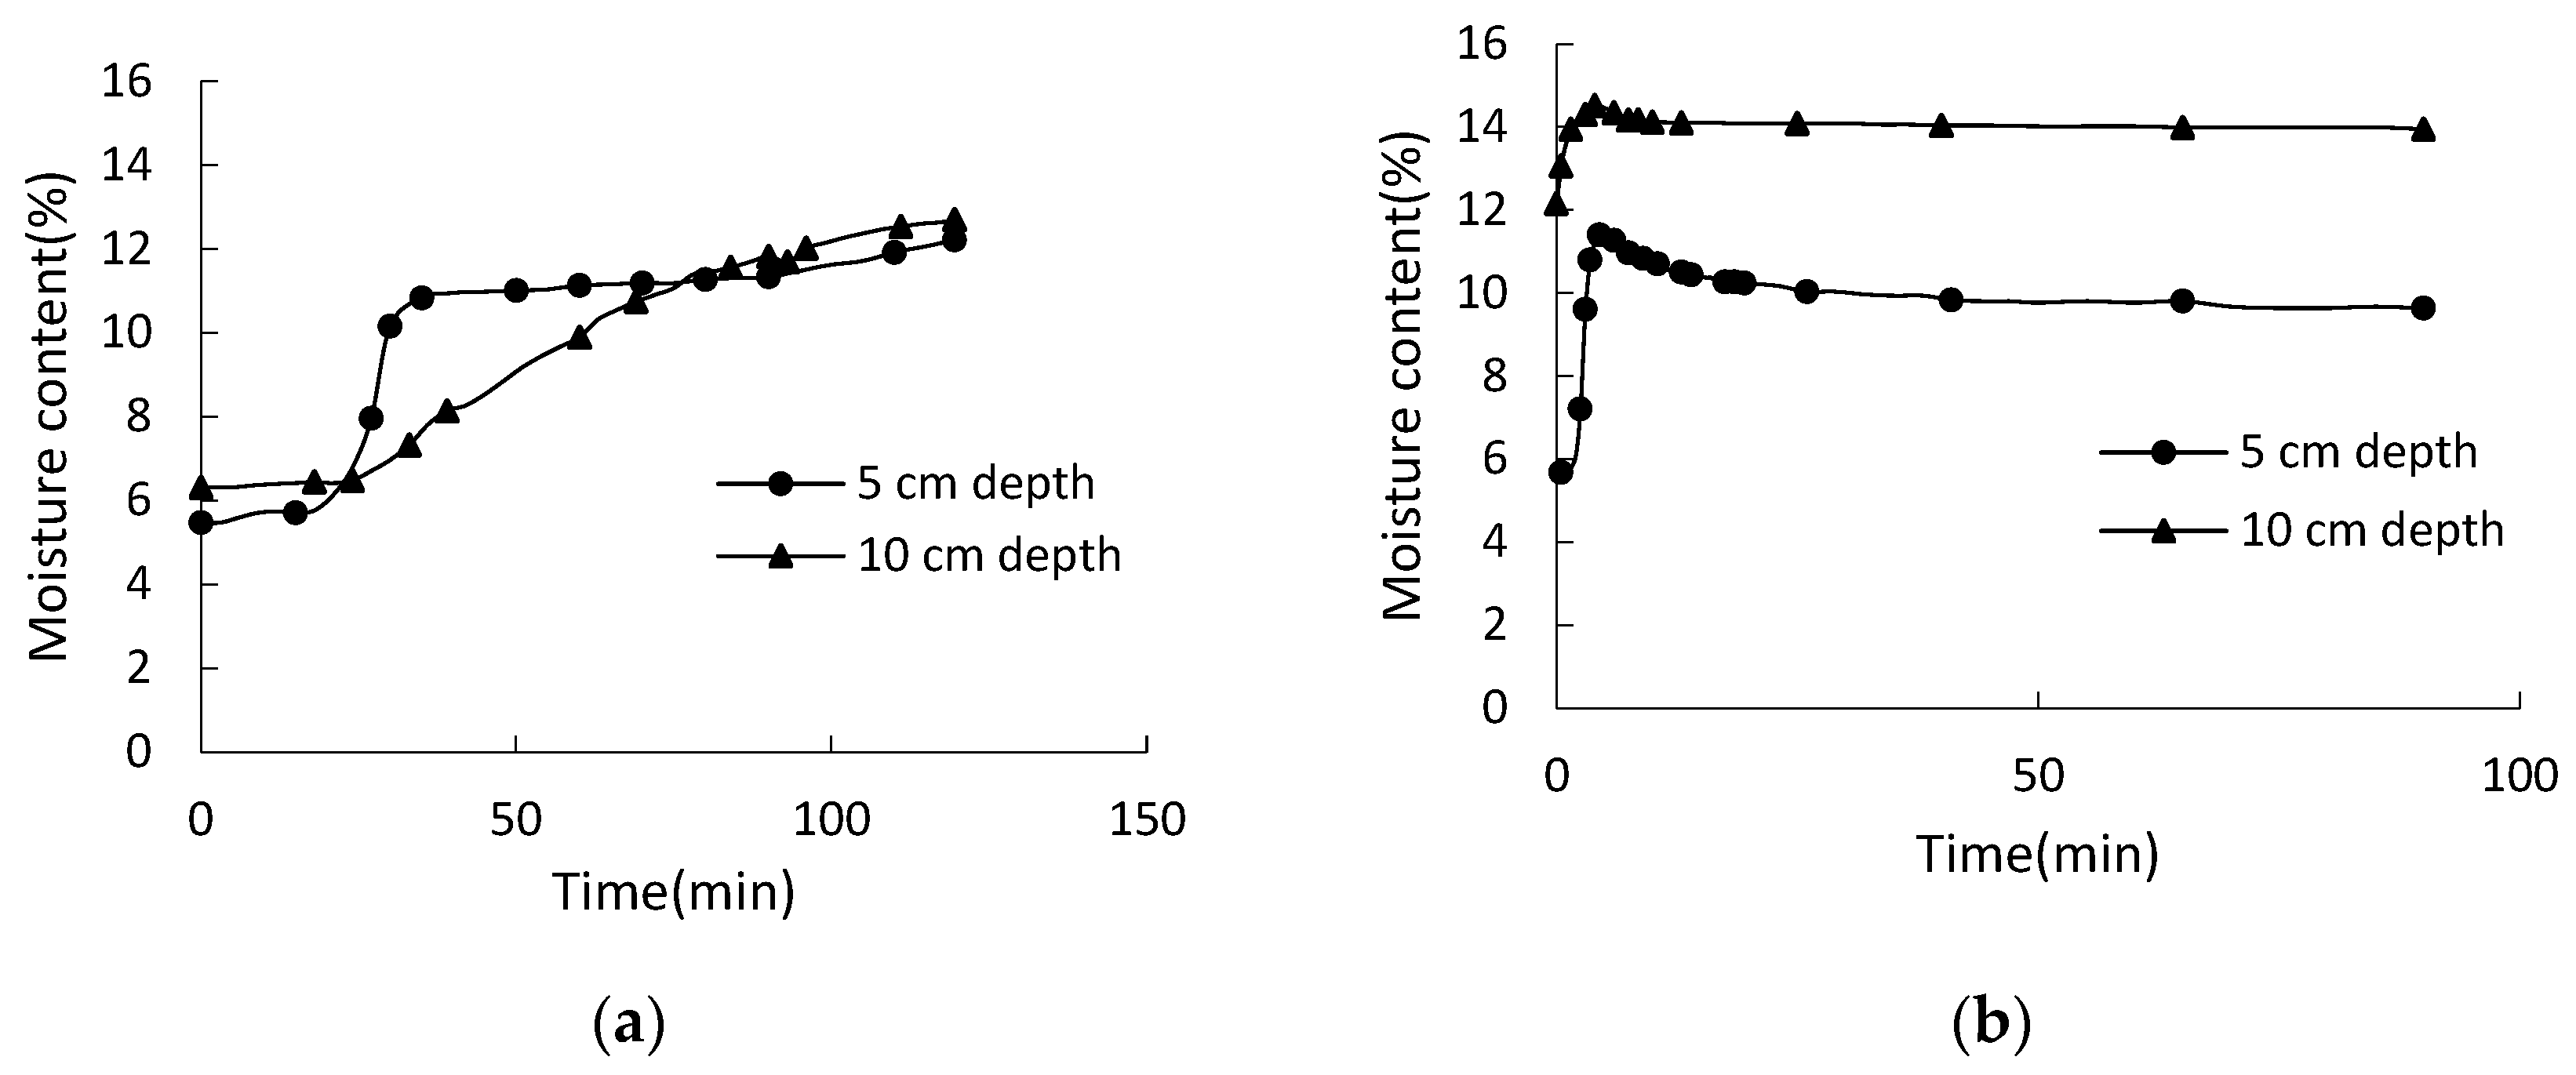
3.2.1. Results in the Rainfall Cumulus Period

To explore the impact of the growth of succulent root plant and succulent stem plant on the moisture content of the surrounding soil during the rainfall cumulus stage, test group 1 (succulent root plant) and test group 2 (succulent stem plant) have been set up, as shown in Figure 4. The measuring points at the dense root area and the root tip area are located 5 cm and 10 cm below the soil surface, respectively. Variations in the recorded moisture content versus time during the stage of rainfall accumulation and infiltration are shown in Figure 19.
It can be seen from Figure 19a that the moisture content at a 5 cm depth in the dense root distribution area is larger at first, and it reaches a stable value faster than that at a 10 cm depth in the root tip area. The moisture content at each depth of test group 1 is basically maintained at about 12%, eventually. However, the results of test group 2 are the opposite. The moisture content at a 5 cm and 10 cm depth both reach a stable peak value almost at the same time, as shown in Figure 19b, and the value of moisture content at a 5 cm depth is smaller than that at a 10 cm depth. The maximum difference value in moisture content between the dense root distribution area and the root tip area in test group 1 and test group 2 was about 0.39% and 4.96%, respectively. It shows that succulent root plants in test group 1 have a greater influence on the moisture content of the surrounding soil.

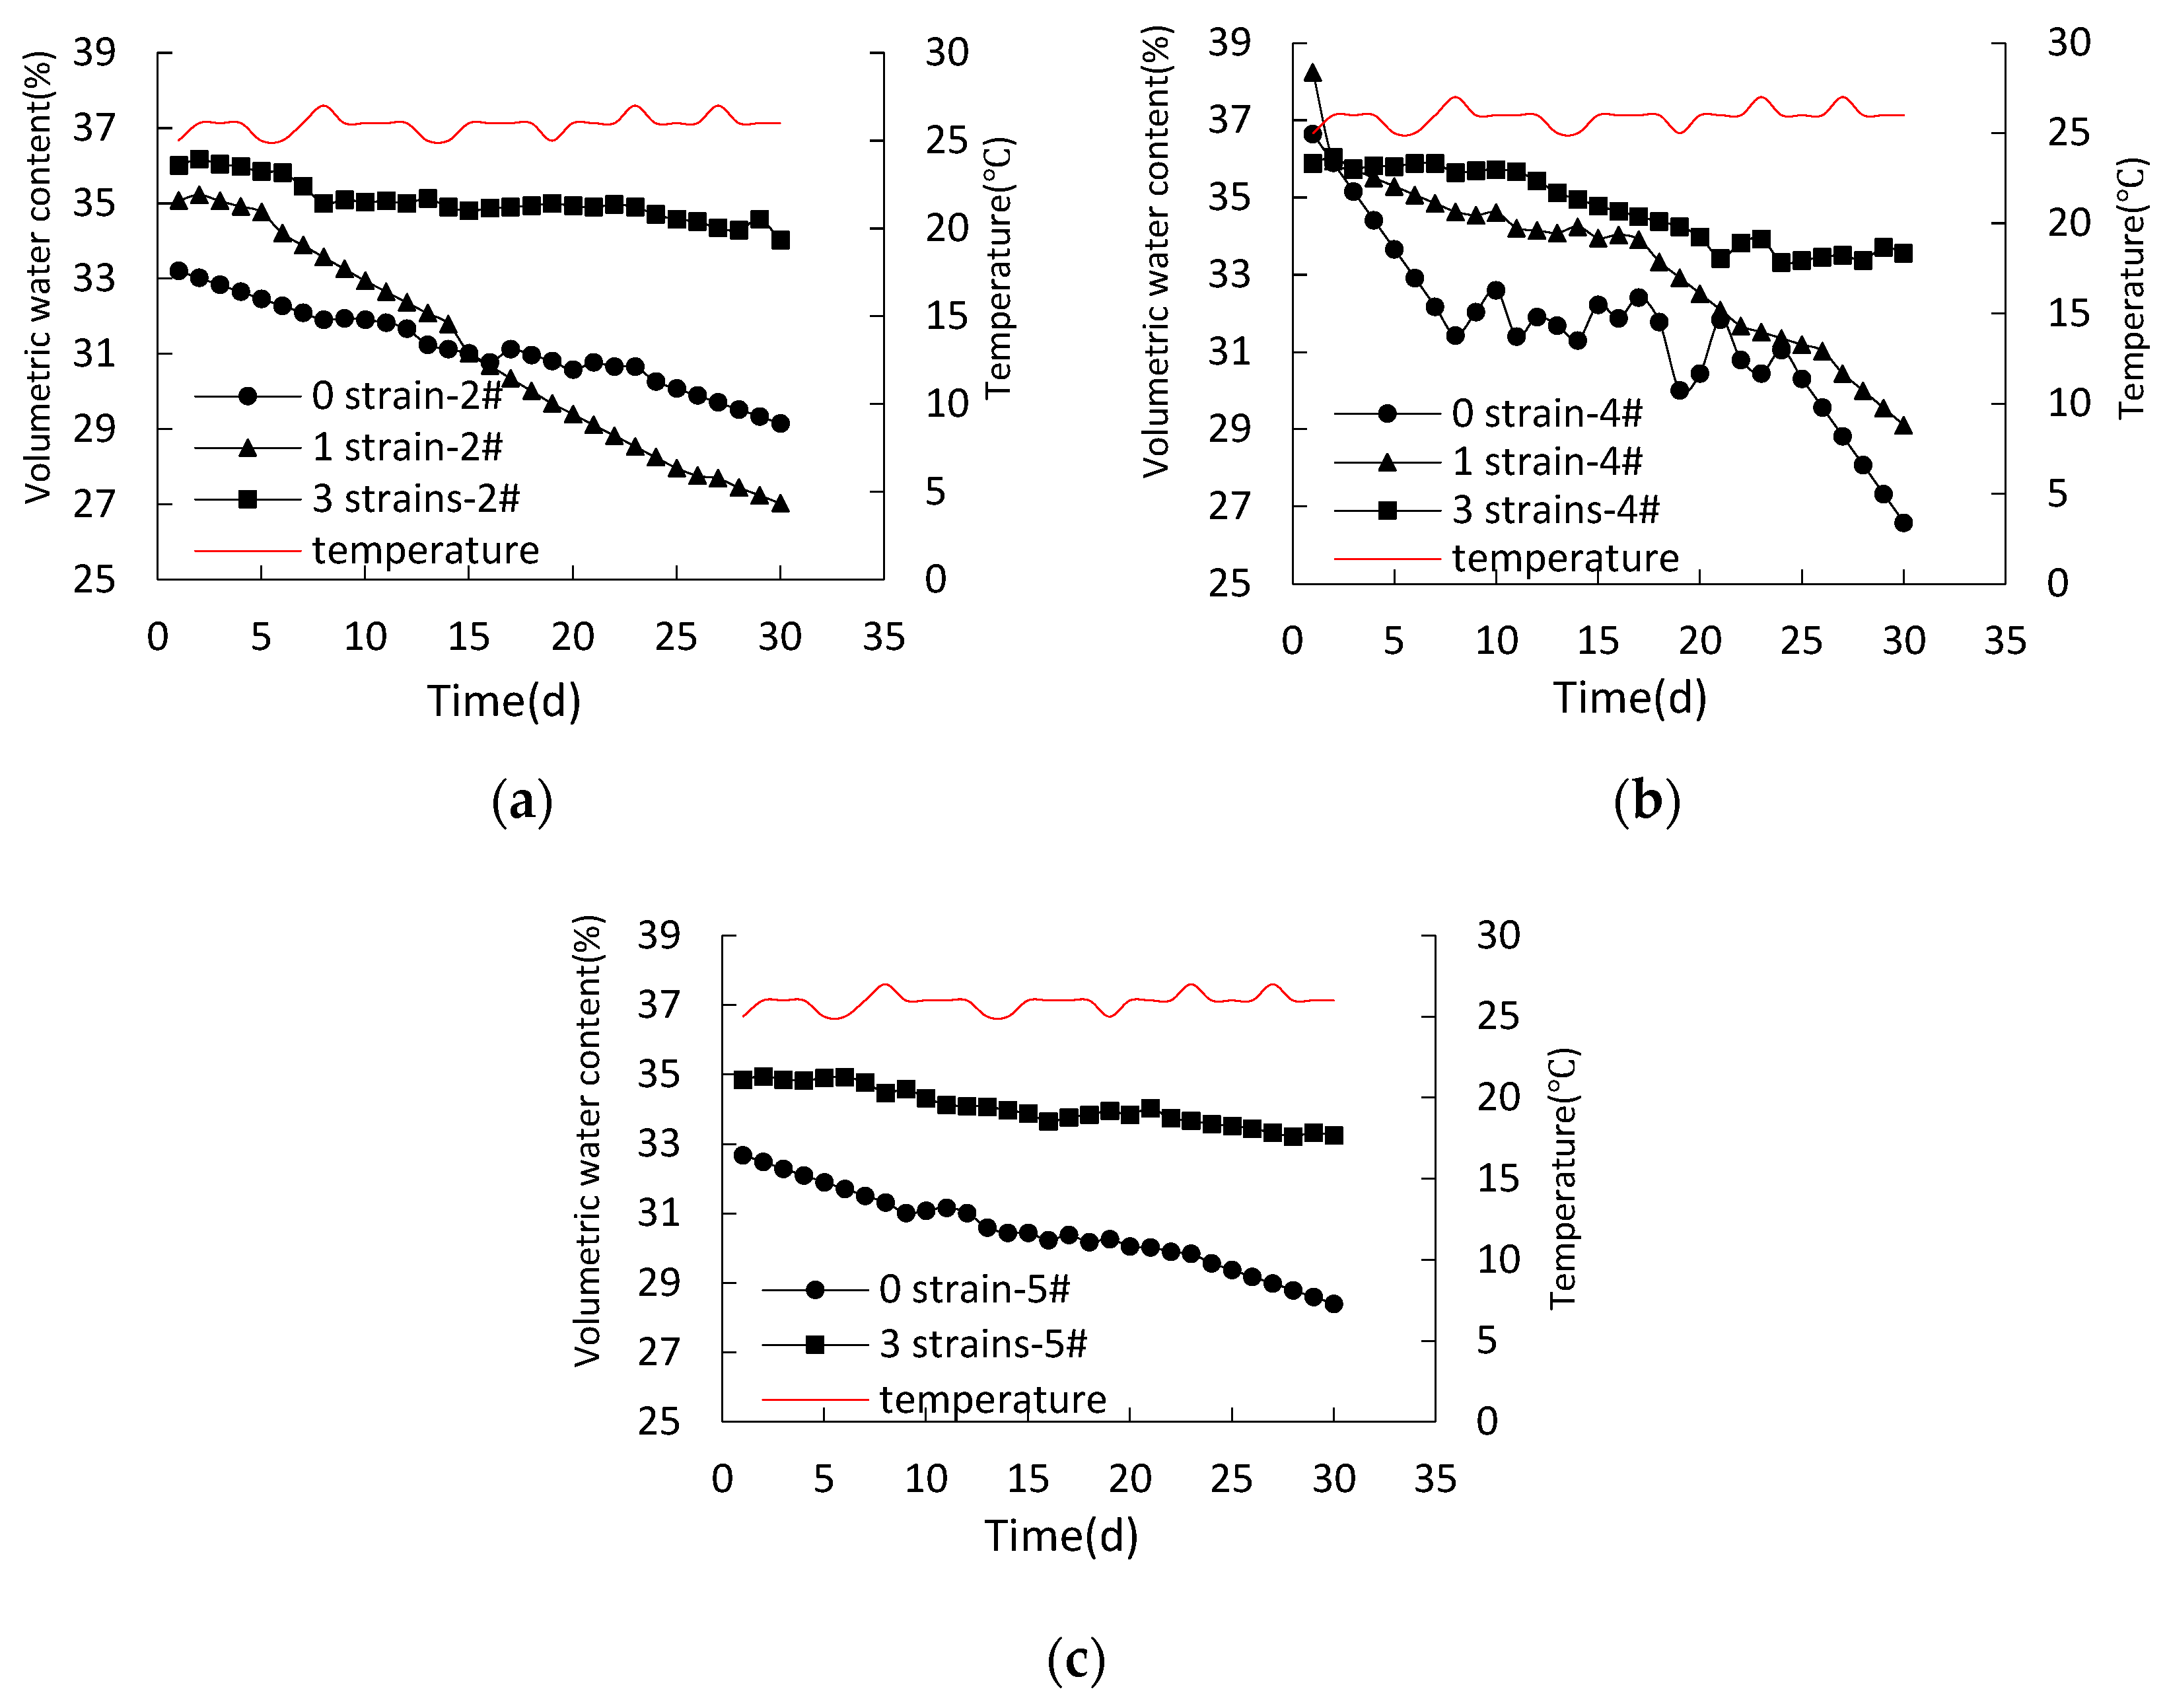
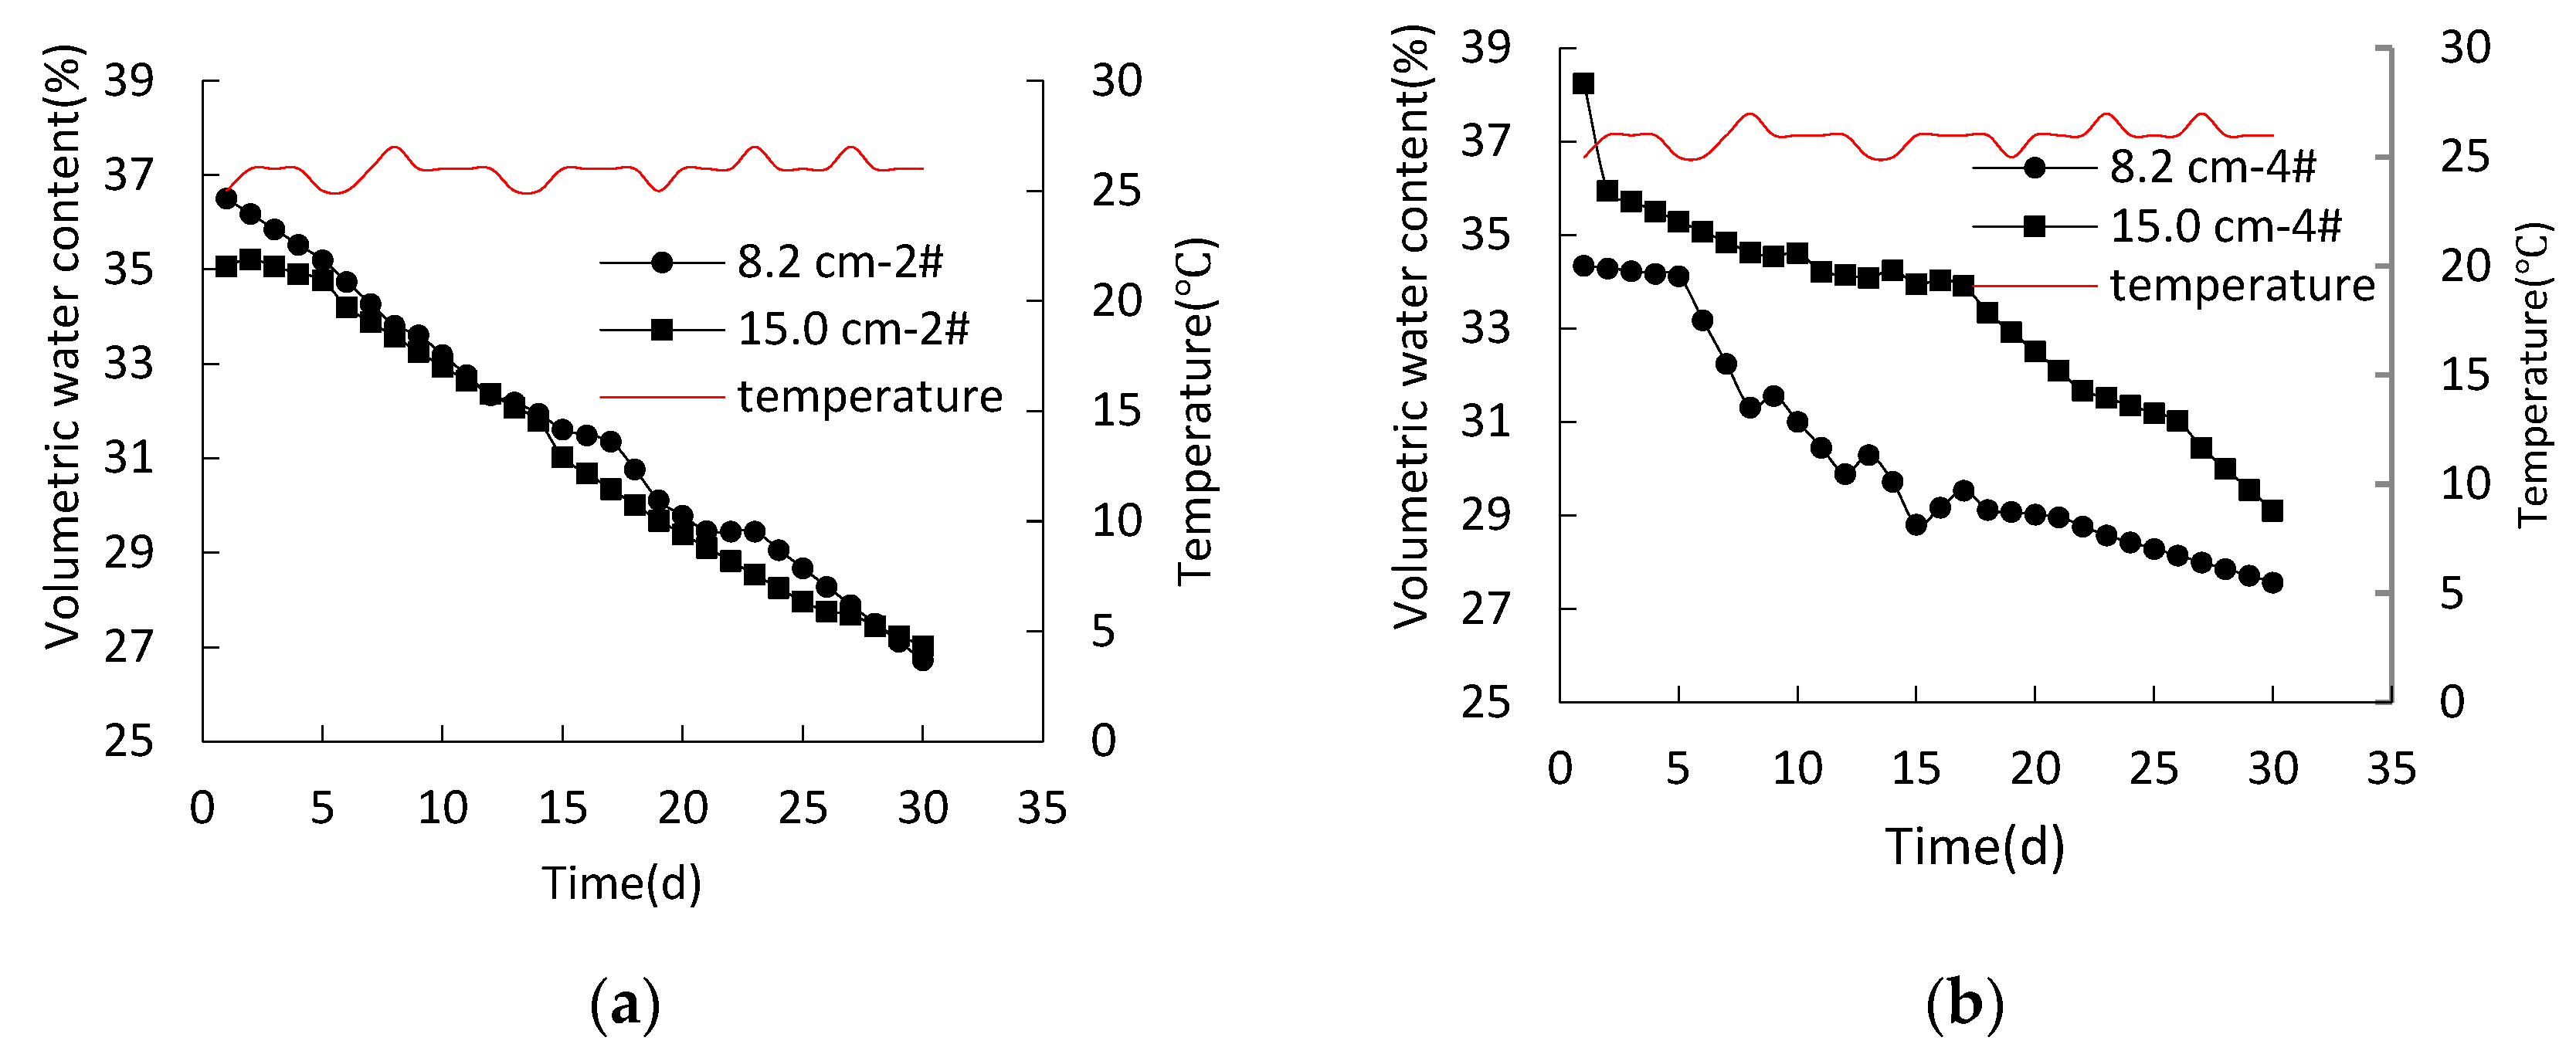
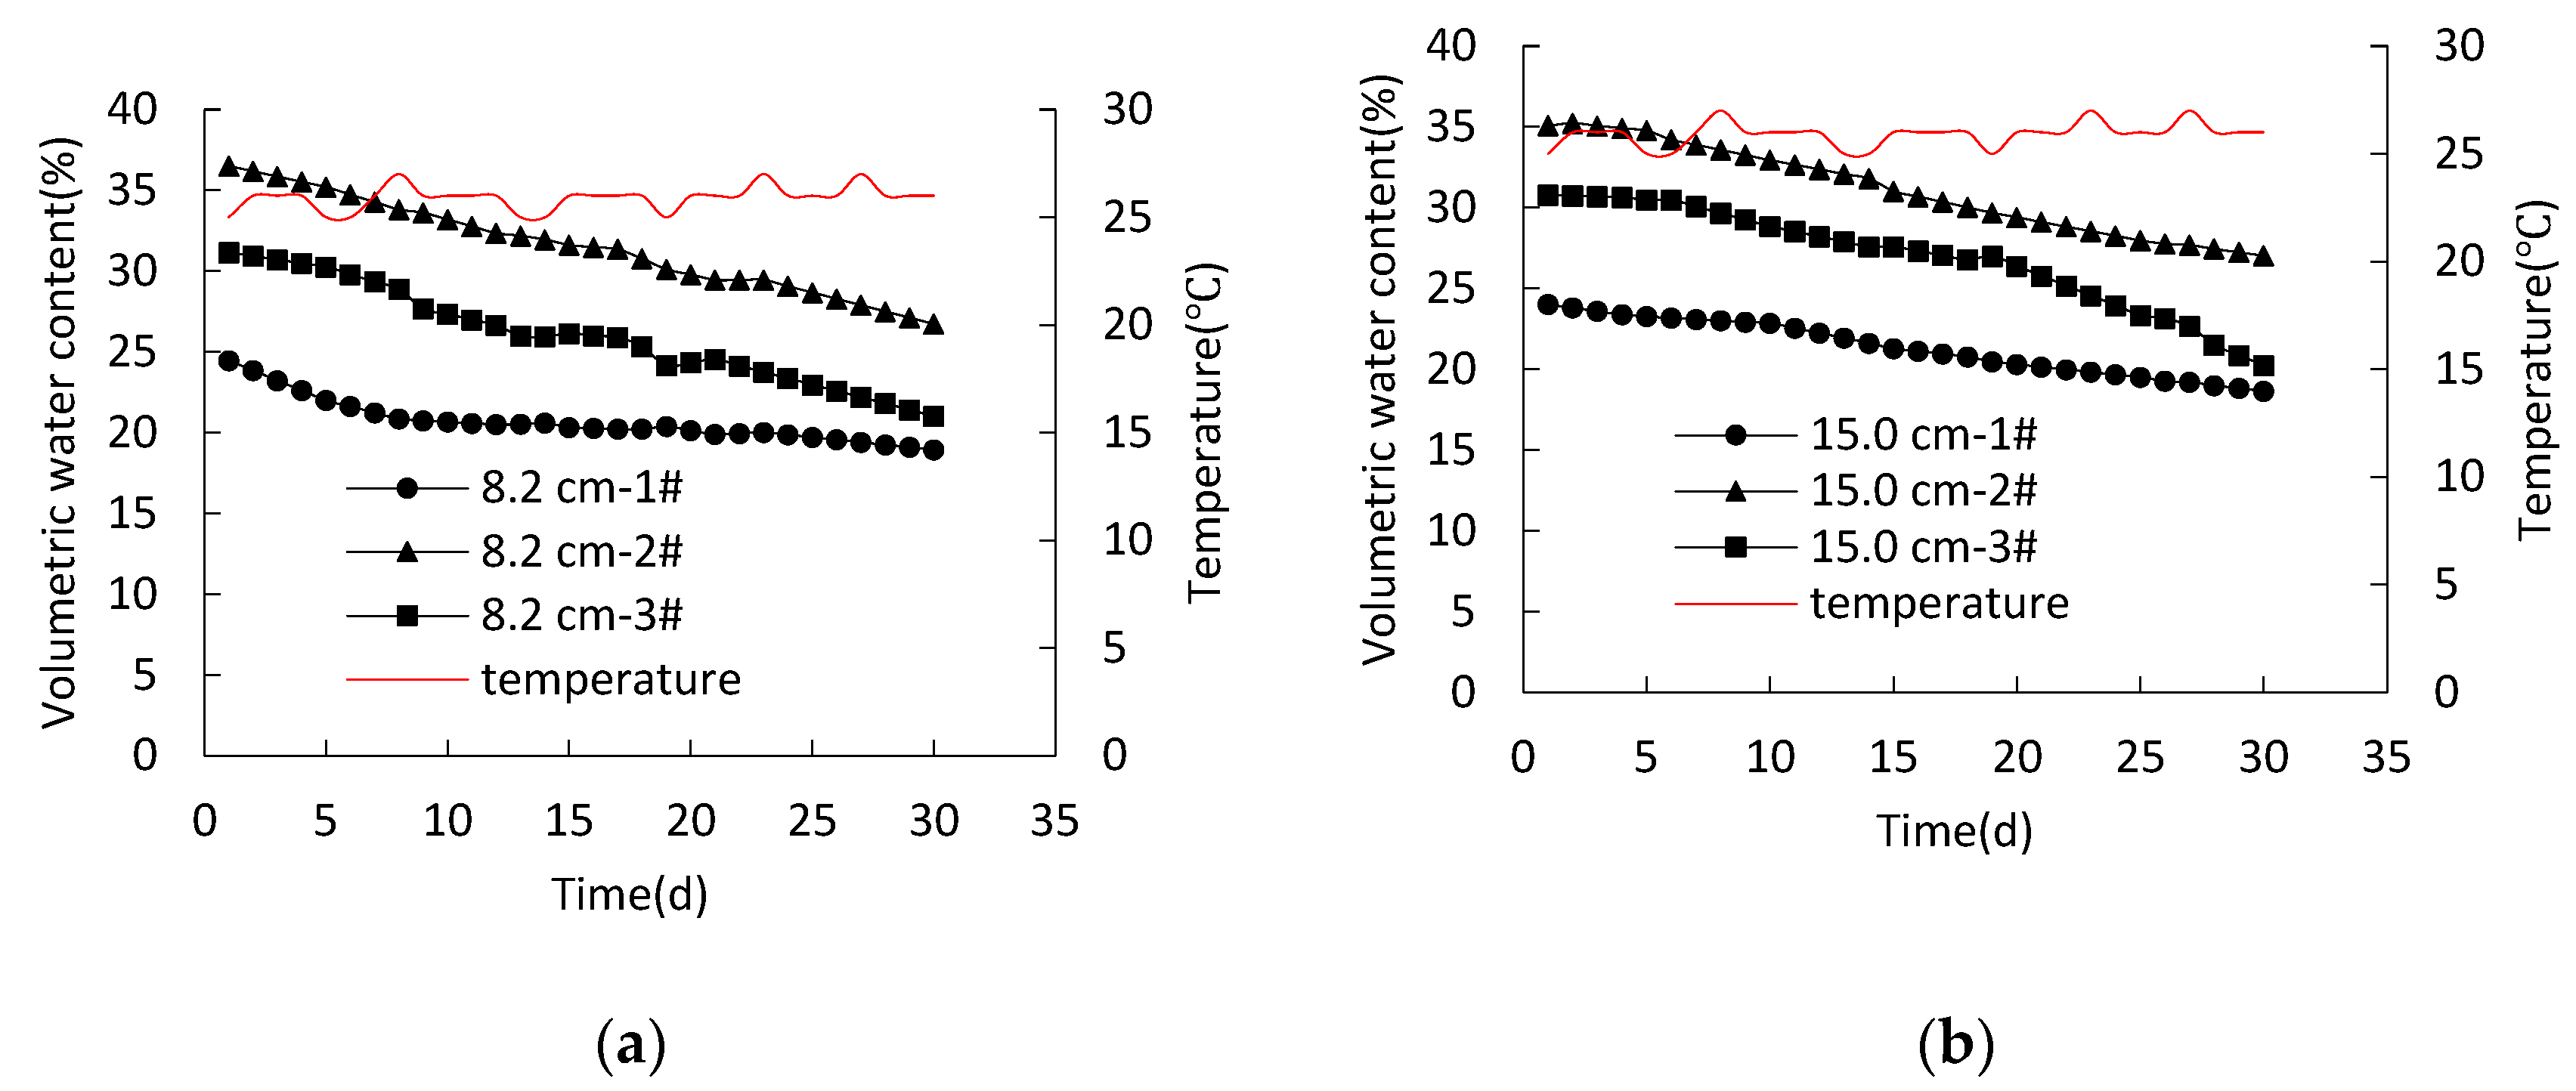
3.2.2. Results in the following Drying Period

(1) Moisture Content
The variation curves of the measured moisture content with time in the drying stage of test group 1 (succulent root plant) and test group 2 (succulent stem plant) are shown in Figure 20. It can be seen from Figure 20 that the curve can be divided into three stages. In stage 1 (1~5d) and stage 2 (6~10d), the moisture content decreases and then increases gradually. In stage 3 (11~18d), the moisture content basically decreases again, and the moisture content of group 2 at a 5 cm depth fluctuates when decreasing. The reason for the increase in moisture content in stage 2 may be that the evaporated water vapor changes into water droplets and is attached by the film, and it then falls into the surface layer of the soil. The moisture content decreases in stage 3 because the surface cracks of the soil further develop and promote the evaporation of water in the drying process.
(2) Evapotranspiration
The daily evapotranspiration change is calculated by means of the reduction in the model mass every day during the dry period. Figure 21 presents the curves of evapotranspiration versus time of test group 1 (succulent root plant) and group 2 (succulent stem plant). In the first five days of drying, the evapotranspiration of test group 1 (succulent root plant) is higher than that of test group 2 (succulent stem plant), and the value of test group 1 is almost 1.5 times that of test group 2. Vice versa, from the 6th to 10th day of drying, the evapotranspiration of test group 2 is almost 1.5 times that of test group 1.
In the drying stage, the result of water storage in the test group planted with both succulent root and succulent stem vegetation in combination is shown in Figure 22. It can be seen from Figure 22 that the variation process of moisture content can also be divided into three stages.
By comparing the data of test group 3 in Figure 22a and groups 1 and 2 in Figure 20a,b, it can be seen that the change in moisture content in stage 1 of test group 3 (succulent root plant + succulent stem plant) is 1.68 times that of test group 1 (succulent root plant) and 4.04 times that of test group 2 (succulent stem plant). It can be seen from Figure 22a,b that the moisture content in dense root area (at a 5 cm depth) of test group 2 (succulent stem plant) and test group 3 (succulent root plant + succulent stem plant) were greater than the moisture content in root tip area (at a 10 cm depth). In Figure 22a, the maximum difference value of the moisture content between dense root area (at a 5 cm depth) and root tip area (at a 10 cm depth) is about 1.23%. The evapotranspiration of test group 3 is the same as that of test group 1 and 1.29 times that of test group 2. In stage 3, the change in moisture content in test group 3 is 1.54 times that in test group 1 and 3.91 times that in test group 2, while the evapotranspiration in test group 3 is the same as that in test group 1 and 1.4 times that in test group 2. Therefore, in stage 1 and stage 3, the water storage capacity of test group 3 is significantly higher than that of test groups 1 and 2. Therefore, it can be suggested that the water storage capacity is the strongest when succulent root plant Chlorophytum comosum and succulent stem plant Begonia semperflorens are planted in combination.

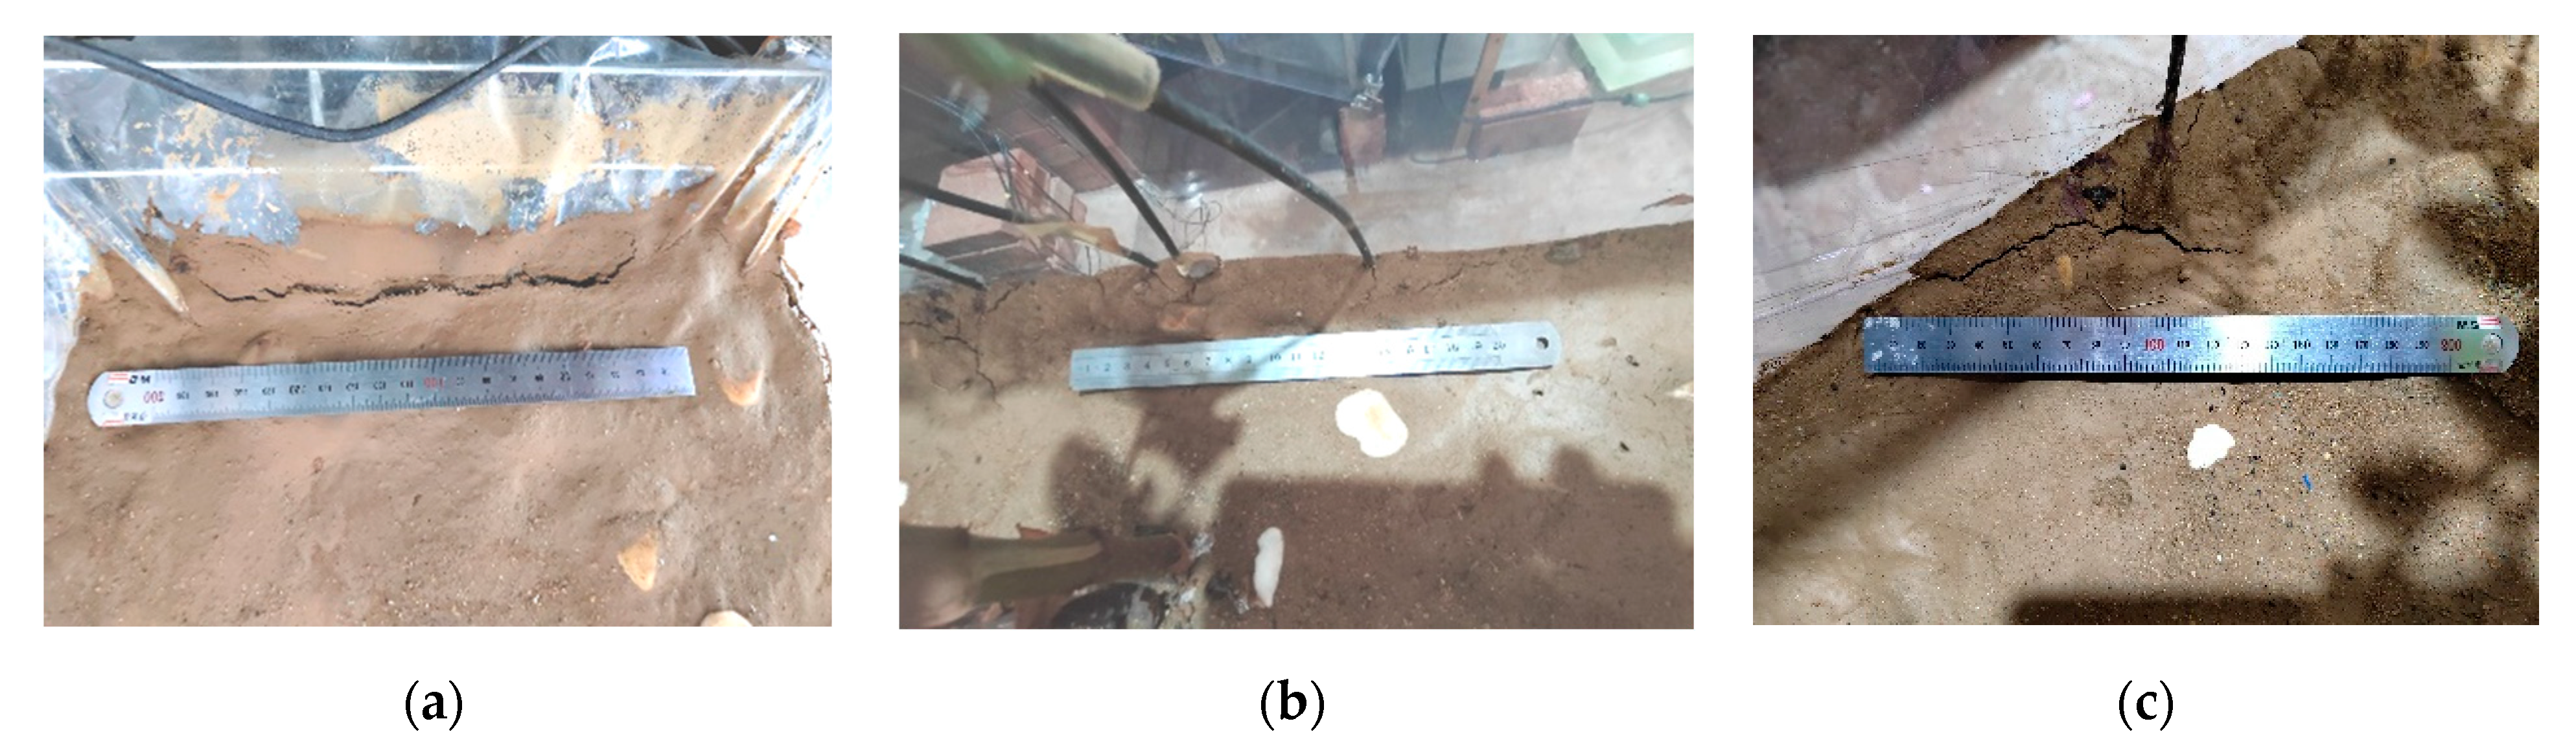
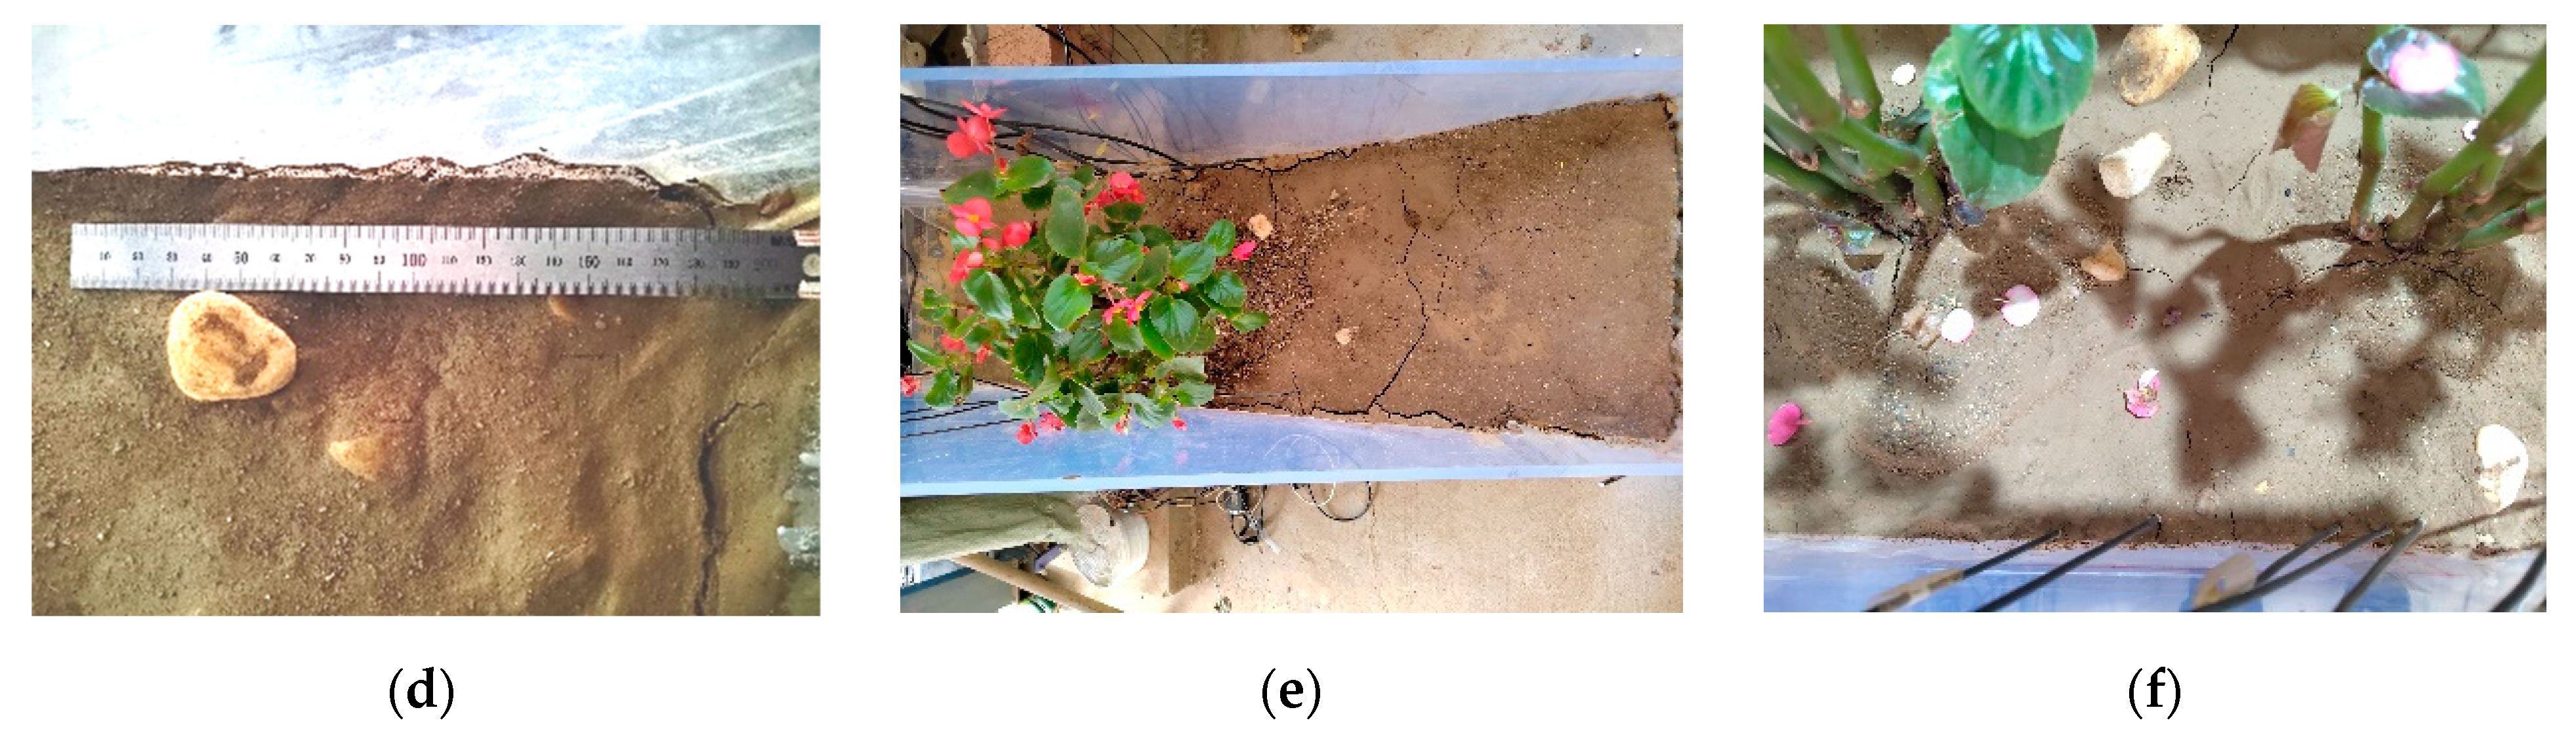
3.2.3. Plant Growth Status of Each Test Group at the End of the Drying Period

After 19 days of drying, the plants’ growth status of each test group under the same initial and dry conditions is shown in Table 5. The plant height of Begonia semperflorens is greater under the mixed planting conditions with succulent root plant Chlorophytum comosum and succulent stem plant Begonia semperflorens than that when it is planted alone. This phenomenon indicates that there may be water complementarities between the succulent root plant Chlorophytum comosum and the succulent stem plant Begonia semperflorens, so that Begonia semperflorens can still obtain a water supply under drying conditions. This result is similar to that in the literature [35], in which Zha et al. performed mixed planting for different vegetation and found that seedlings planted in a mixed manner were better than those planted in a single manner under lower inter-specific competition.

4. Discussion

For rocky desertification slopes with less soil and water, the slab trench is conducive to making full use of rainfall via a method of water storage, and to improving the efficiency of vegetation recovery. However, with the advancement of the drying process, the water level in the water storage chamber below the slab trench decreases, and the length of the water absorption belts exposed to the air gradually increases. This will result in the decrease in the water absorption efficiency. Therefore, in the dry season or in areas with insufficient rainfall, it is necessary to ensure sufficient water storage in the water storage chamber, hidden below in the slab trench, by artificial replenishment.
Only the growth status of Chlorophytum comosum and Begonia semperflorens in the slab trench was studied. In the actual project, based on the requirements of landscape and economic development, it is necessary to plant shrubs and other low plants with more-developed roots and high water-retaining capability. In the future, the species of plants in the slab trench can be enriched, and during its growth process, the effect of water fluctuation and structural changes on the efficiency of slab trench can be studied.
There is only one mixed type of soil in the test which was derived from in situ slope cutting. In order to increase the effectiveness of vegetation restoration on the slope, soils can be selected with different characteristics of fertility, field capacity and permanent wilting point. The water-storing and -holding capacity of the slab trench are only studied by indoor test simulation. To better reflect the correlation between the experimental results and in situ engineering observation, in future engineering applications, it is also possible to perform in situ monitoring of the water content of the soil and plant growth in the slab trench on the slope.

5. Conclusions

In this study, the model tests have been carried out, respectively, with the rainfall firstly and then the drying stage. The influence of different rainfall intensity and plant number has been explored on the rainfall infiltration, water-storing and -holding capacity of the new type of slab trench on rocky desertification slopes. Three additional models have also been conducted, respectively, with water stored only in succulent root plants, only in succulent stem plants, or in a combination of both under drying conditions. The main conclusions that can be drawn are as follows:
(1)
The model test results indicate a good water regulation mechanism of the new type of slab trench, firstly during the rainfall period and then the dry period. It can be believed that it is feasible for the slab trench to fulfill the effective accumulation of rainwater in the rainfall period, and then supply water to plants from the water-storing chamber below by means of the water absorption belts in the drying period.
(2)
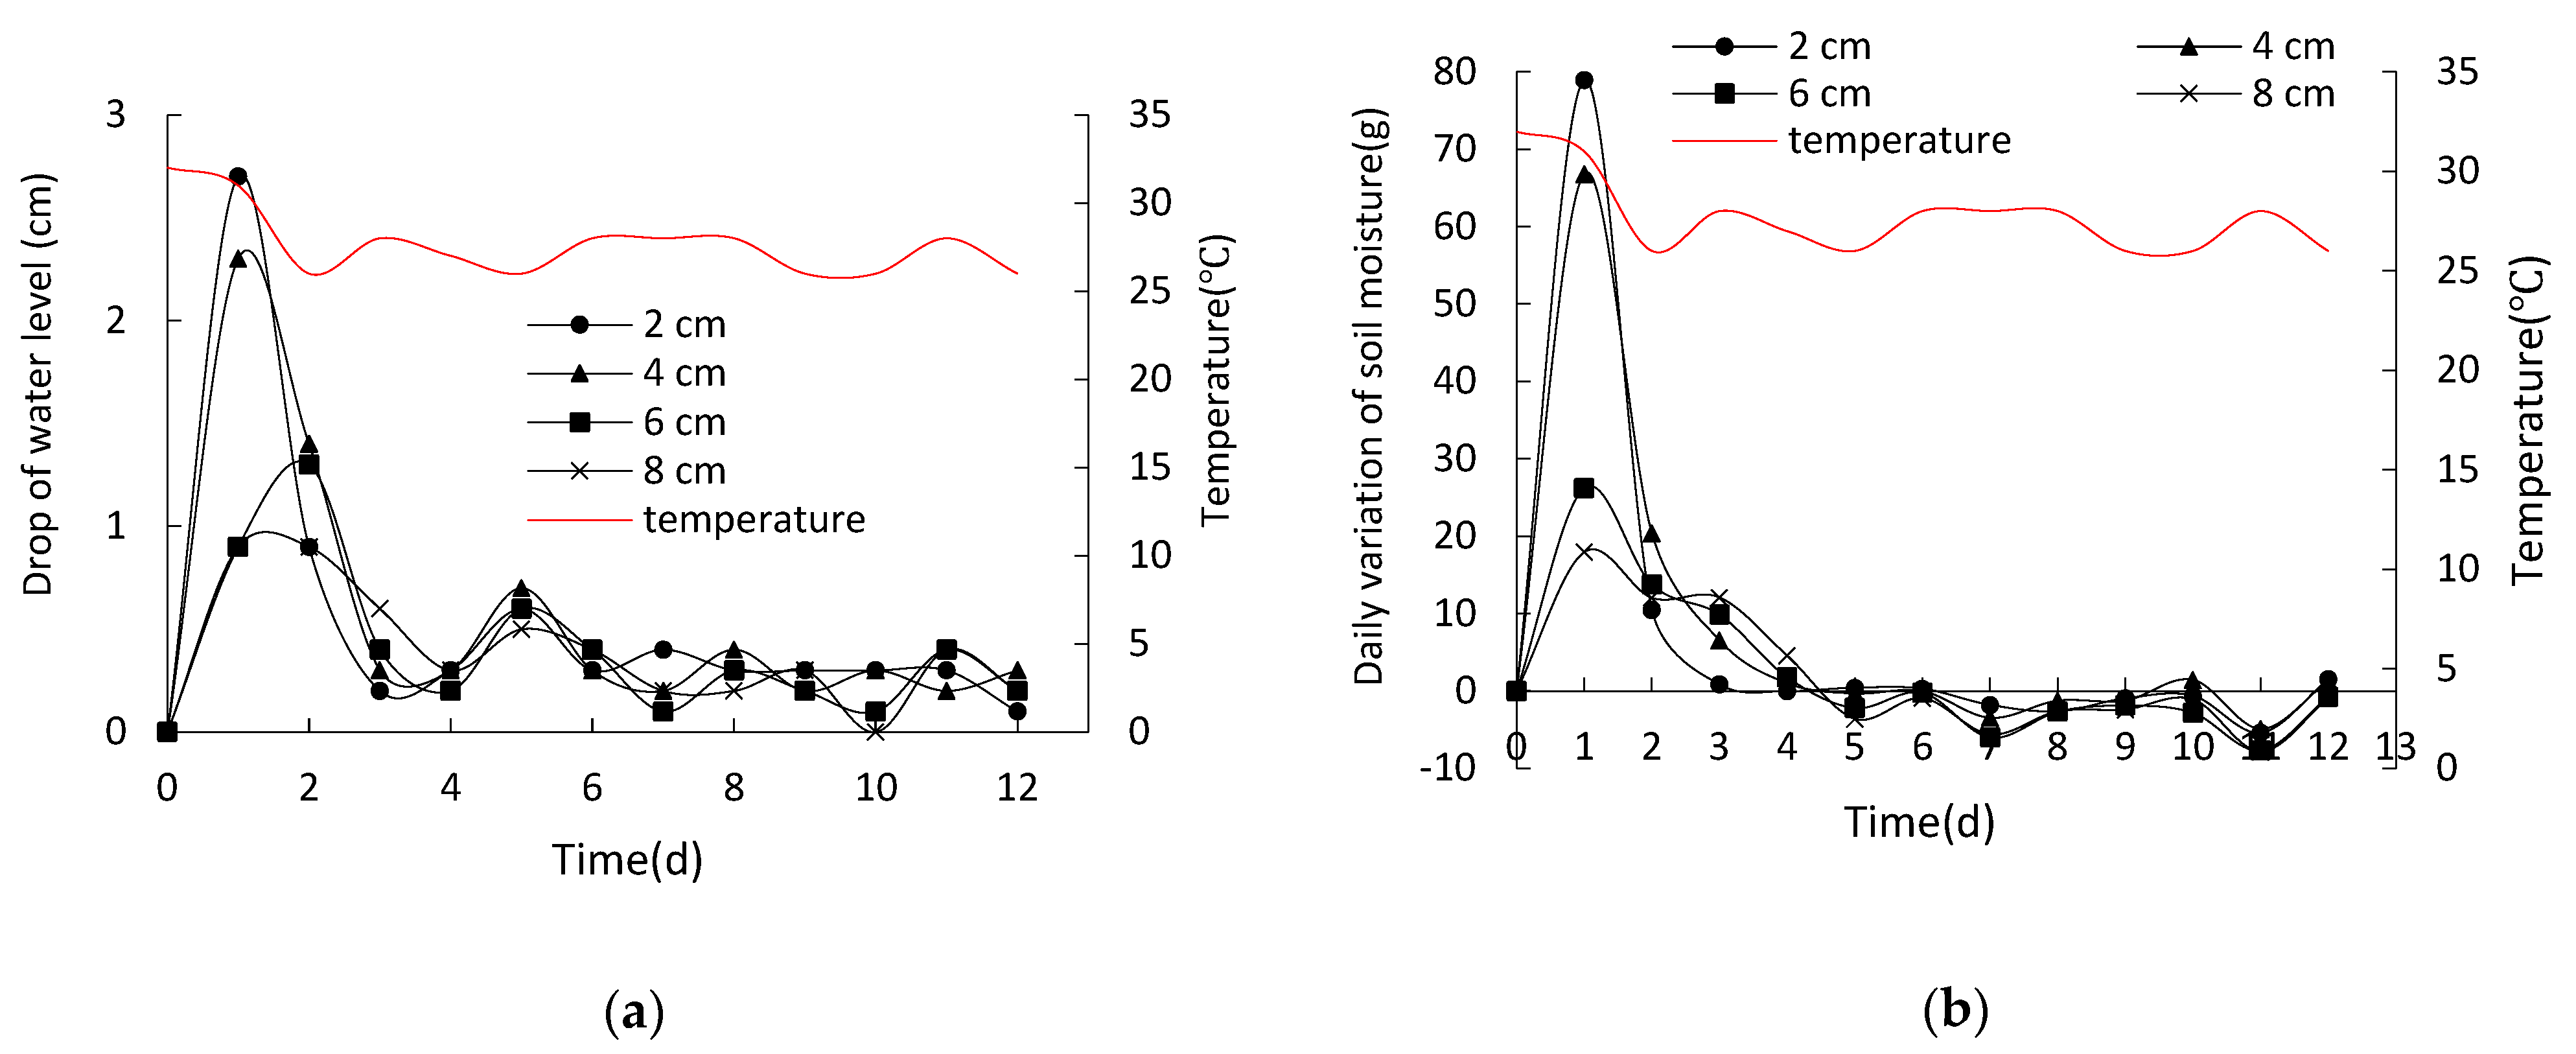
During the rainfall period, without considering rainfall runoff into the slab trench, the more plants that are planted, the more the barrier effect of the plant canopy on rainwater is induced, and the more the water storage efficiency of the slab trench is reduced. The increase in rainfall intensity helps to improve the water storage efficiency of the slab trench. The smaller the rainfall intensity, the smaller the water storage depth. During the drying period, the longer the length of the water absorption belts exposed to air in the water storage chamber, i.e., the lower the water level in the water-storing chamber below the slab trench, the lower the water absorption efficiency, and the weaker the water-holding capacity of the slab trench.
(3)
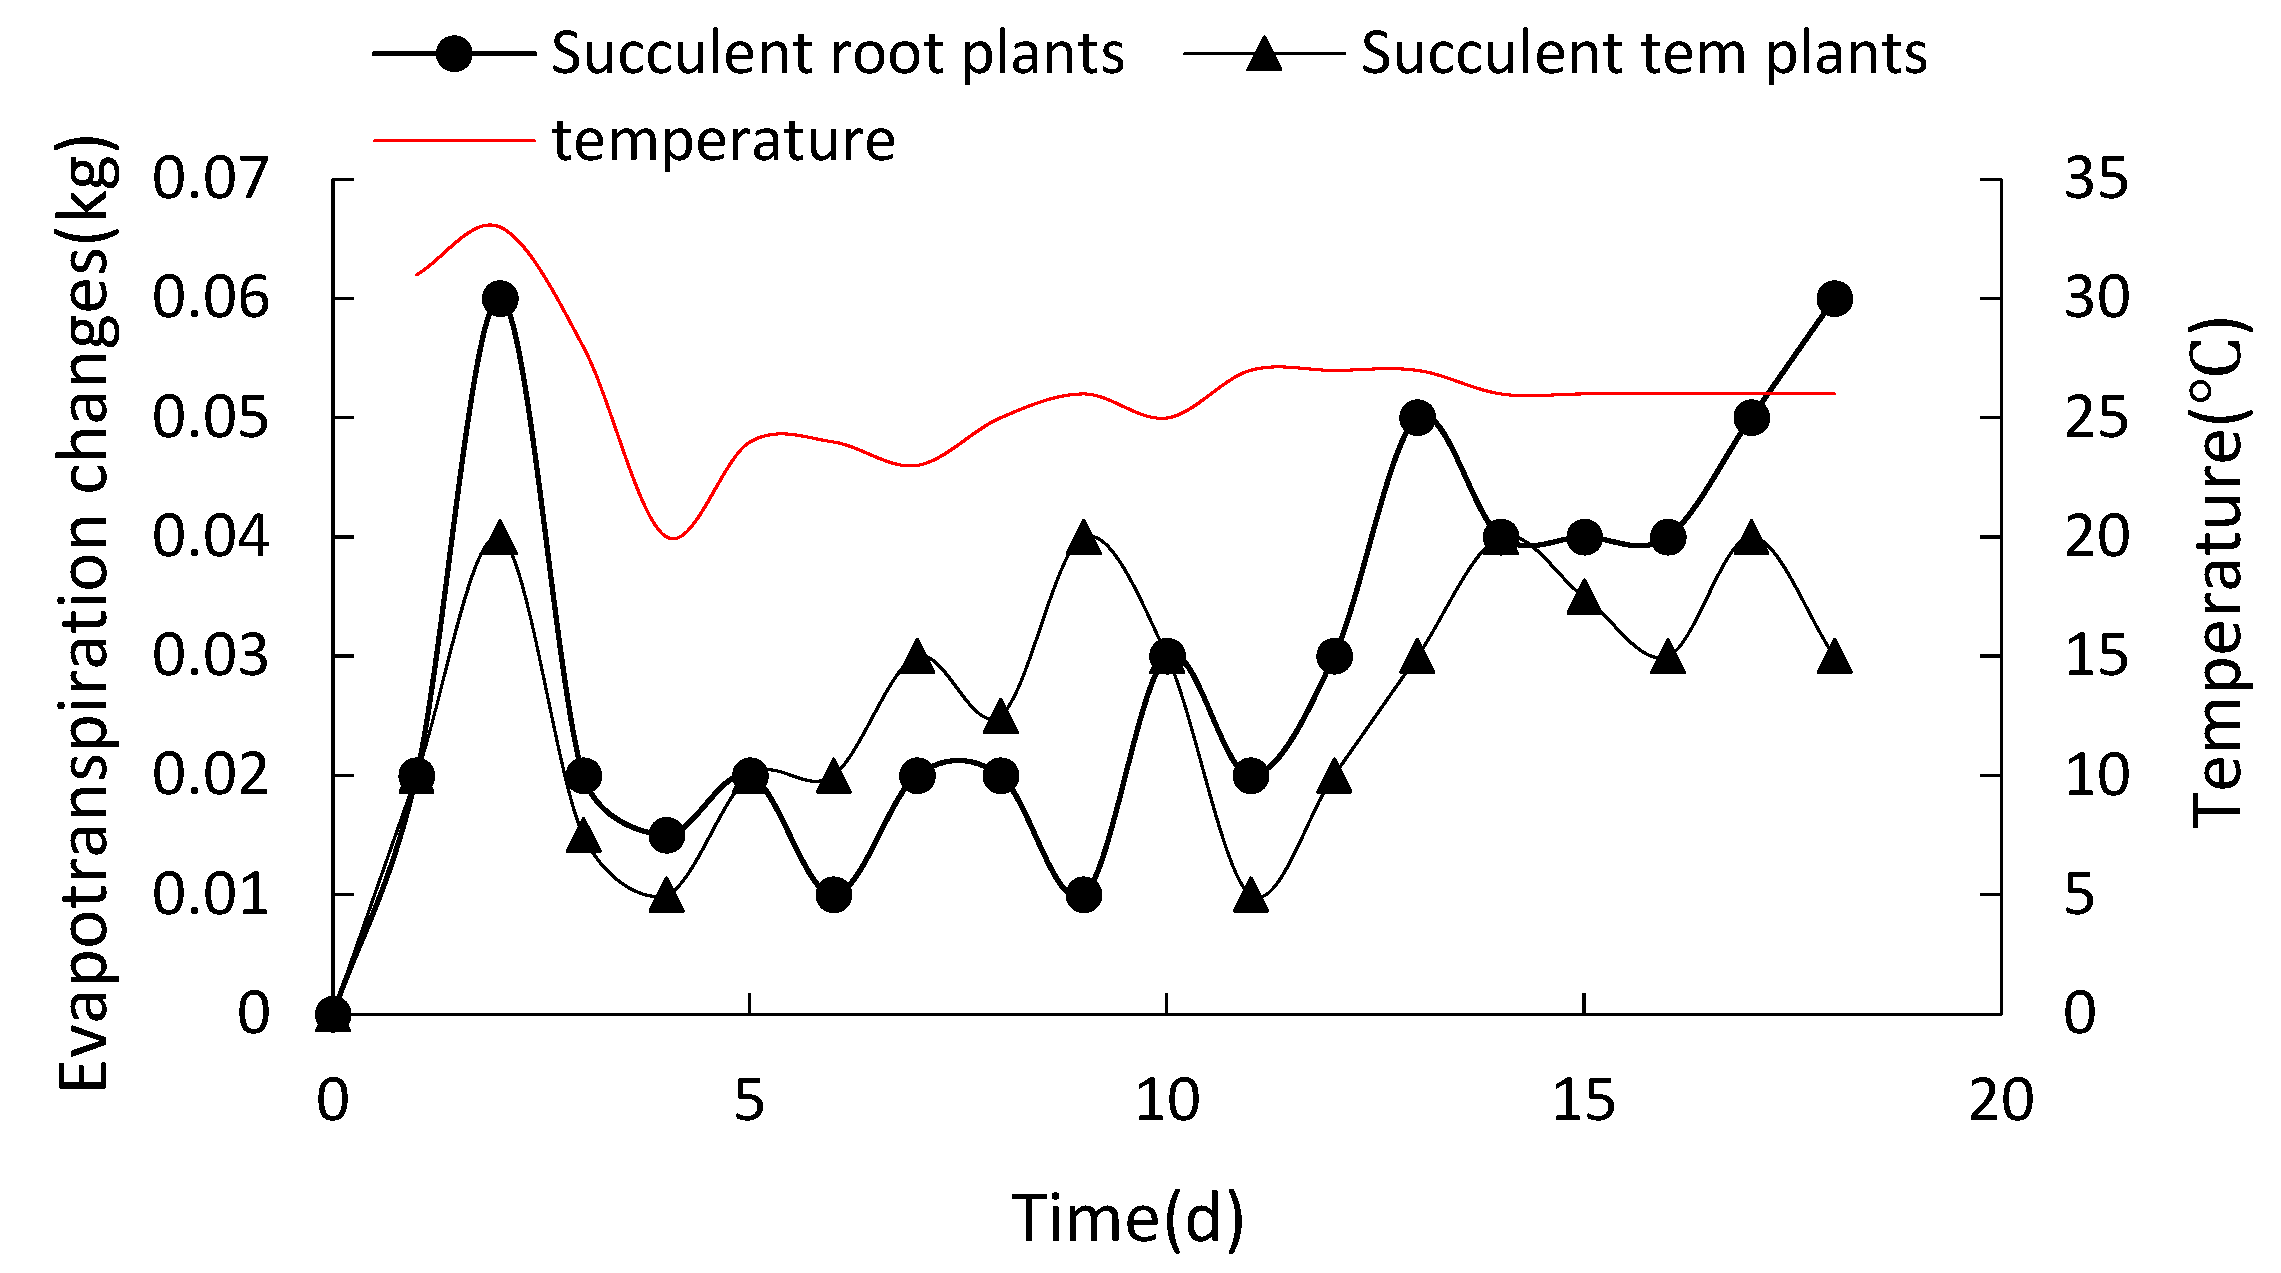
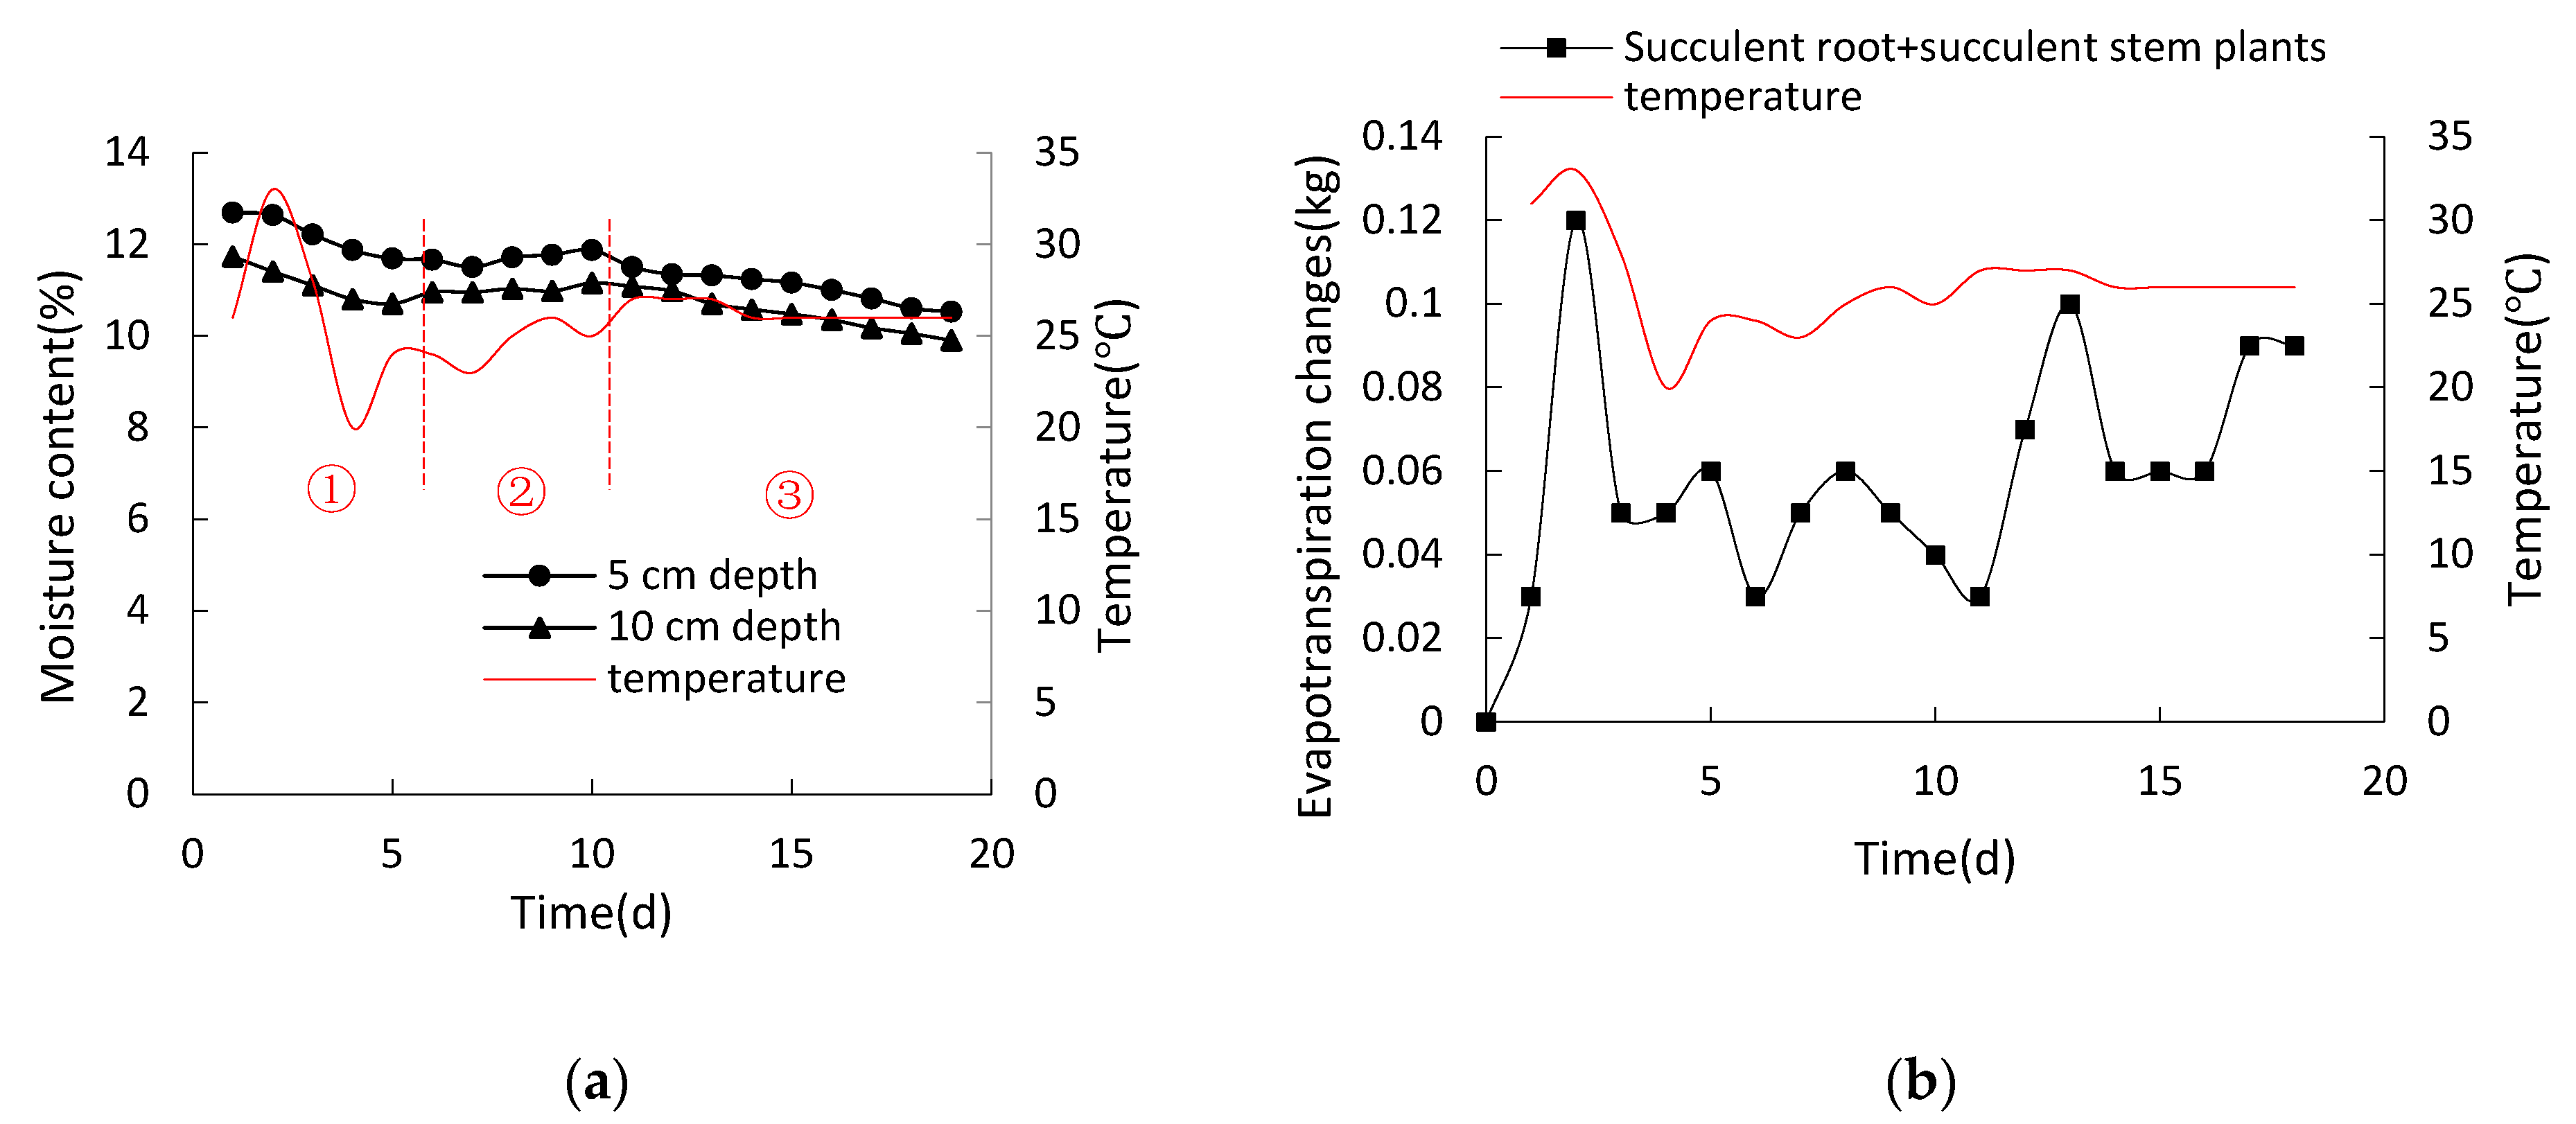
Both the succulent root plant and succulent stem plant have strong water-retaining capacity, but the water-retaining capacity of the succulent root plant is stronger. The growth status of stem plants under mixed planting conditions is better than that under single planting. Therefore, the mixed planting of water-retaining plants in the slab trench helps to improve the efficiency of the slab trench. In the actual project, based on the requirements of landscape and economic development, it is necessary to plant shrubs and other low plants with more-developed roots and high water-retaining capability. In the future, the species of plants in the slab trench can be enriched, and during its growth process, the effect of water fluctuation and structural changes on the efficiency of the slab trench can be studied.
(4)
The efficiency of the slab trench would also be better if the slope were located in a subtropical or tropical area, where there is enough rainfall. For rocky desertification slopes with less soil and water, more rainwater will be collected with assistance of the water storage chamber in the slab trench. If the rainfall runoff on the slope surface can be transferred into the slab trench by means of a good surface cover, the slab trench is conducive to making full use of the rainfall via a method of water storage, and to improving the efficiency of vegetation recovery. During the drought season, the efficiency of the slab trench can be maintained if manual water replenishment could be fulfilled by the water storage chamber.

Author Contributions

L.F., S.L. and C.Z. conceived and designed the experiments; S.L., S.G., L.F. and C.Z. performed the experiments, analyzed the data and prepared the manuscript. S.G., C.Z., Q.Z., Q.L., Q.C., Z.Z. and X.Z. optimized the experiment and revised the manuscript. All authors have read and agreed to the published version of the manuscript.

Funding

This study was supported by the National Natural Science Foundation (NSFC) of China (Grant No. U22A20602 and 41977239); and the 3rd series of Guangxi Transportation Keynote Research Program in 2020 (Grant No. XFZ-KY-LYH-20200112).

Institutional Review Board Statement

Not applicable.

Informed Consent Statement

Not applicable.

Data Availability Statement

Not applicable.

Conflicts of Interest

The authors declare no conflict of interest.

References

  1. Peng, X.; Dai, Q. Drivers of soil erosion and subsurface loss by soil leakage during karst rocky desertifification in SW China. Int. Soil. Water Conserv. Res. 2022, 10, 217–227. [Google Scholar] [CrossRef]
  2. Liu, S.; Wang, T.; Kang, W.; David, M. Several challenges in monitoring and assessing desertification. Environ. Earth. Sci. 2015, 73, 7561–7570. [Google Scholar] [CrossRef]
  3. Zhou, H.Y.; Pan, X.Y.; Zhou, W.Z. Assessing spatial distribution of soil erosion in a karst region in southwestern China: A case study in Jinfo Mountains. In Proceedings of the IOP Conference Series: Earth and Environmental Science; IOP Publishing: Sanya, China, 2016; p. 012047. [Google Scholar]
  4. Zhao, S.; Pereira, P.; Wu, X.; Zhou, J.; Cao, J.; Zhang, W. Global karst vegetation regime and its response to climate change and human activities. Ecol. Indic. 2020, 113, 106208. [Google Scholar] [CrossRef]
  5. Zhao, R.; Zhan, L.; Yao, M.; Yang, L. A geographically weighted regression model augmented by Geodetector analysis and principal component analysis for the spatial distribution of PM2.5. Sustain. Cities Soc. 2020, 56, 102106. [Google Scholar] [CrossRef]
  6. Zhao, S.; Wu, X.; Zhou, J.; Pereira, P. Spatiotemporal tradeoffs and synergies in vegetation vitality and poverty transition in rocky desertification area. Sci. Total. Environ. 2021, 752, 1–13. [Google Scholar] [CrossRef] [PubMed]
  7. Keesstra, S.; Mol, G.; de Leeuw, J.; Okx, J.; de Cleen, M.; Visser, S. Soil-related sustainable development goals: Four concepts to make land degradation neutrality and restoration work. Land 2018, 7, 133. [Google Scholar] [CrossRef]
  8. Tong, X.W.; Brandt, M.; Yue, Y.M.; Horion, S.; Wang, K.L.; Keersmaecker, W.D.; Tian, F.; Schurgers, G.; Xiao, X.M.; Luo, Y.Q.; et al. Increased vegetation growth and carbon stock in China karst via ecological engineering. Nat. Sustain. 2018, 1, 44–50. [Google Scholar] [CrossRef]
  9. Hu, T.H.; Li, K.P.; Xiong, K.N.; Wang, J.; Yang, S.; Wang, Z.F.; Gao, A.J.; Yu, X. Research Progress on Water-Fertilizer Coupling and Crop Quality Improvement and Its Implication for the Karst Rock Desertification Control. Agronomy 2022, 12, 903. [Google Scholar] [CrossRef]
  10. Liu, Z.; Li, K.; Xiong, K.; Li, Y.; Wang, J.; Sun, J.; Cai, L. Effects of Zanthoxylum bungeanum planting on soil hydraulic properties and soil moisture in a karst area. Agric. Water Manag. 2021, 257, 107125. [Google Scholar] [CrossRef]
  11. Cao, J.H.; Yuan, D.X.; Pan, G.X. Some soil features in karst ecosystem. Adv. Earth Sci. 2003, 18, 37–44. [Google Scholar]
  12. Yan, X.; Cai, Y.L. Multi-scale anthropogenic driving forces of karst rocky desertification in Southwest China. Land. Degrad. Dev. 2015, 26, 193–200. [Google Scholar] [CrossRef]
  13. Tang, Y.; Sun, K.; Zhang, X.; Zhou, J.; Yang, Q.; Liu, Q. Microstructure changes of red clay during its loss and leakage in the karst rocky desertification area. Environ. Earth Sci. 2016, 75, 1–12. [Google Scholar] [CrossRef]
  14. Peng, X.; Dai, Q.; Ding, G.; Li, C. Role of underground leakage in soil, water and nutrient loss from a rock mantled slope in the karst rocky desertification area. J. Hydrol. 2019, 578, 124086. [Google Scholar] [CrossRef]
  15. Custovic, H.; Misilo, M.; Markovic, M. Water balance of Mediterranean karst soil in Bosnia and Herzegovina as a water conservation and erosion control factor. Soil. Sci. Plant. Nutr. 2014, 60, 100–107. [Google Scholar] [CrossRef]
  16. Peng, X.; Dai, Q.; Ding, G. The role of soil water retention functions of near surface fissures with different vegetation types in a rocky desertification area. Plant. Soil. 2019, 441, 587–609. [Google Scholar] [CrossRef]
  17. Schuh, C.; Frampton, A.; Christiansen, H.H. Soil moisture redistribution and its effect on inter-annual active layer temperature and thickness variations in a dry loess terrace in Adventdalen. Svalbard. Cryosphere 2017, 11, 635–651. [Google Scholar] [CrossRef]
  18. Xu, G.; Ren, Z.P.; Li, P.; Li, Z.B.; Yuan, S.L.; Zhang, H.; Wang, D.; Zhang, Z.Y. Temporal persistence and stability of soil water storage after rainfall on terrace land. Environ. Earth Sci. 2016, 75, 11. [Google Scholar] [CrossRef]
  19. Rashid, M.; Rehman, O.U.; Alvi, S.; Kausar, R.; Akram, M.I. The effectiveness of soil and water conservation terrace structures for improvement of crops and soil productivity in rainfed terraced system. Pak. J. Agric. Sci. 2016, 53, 241–248. [Google Scholar]
  20. Chen, D.; Wei, W.; Chen, L. How can terracing impact on soil moisture variation in China? A meta-analysis. Agric. Water Manag. 2020, 227, 105849. [Google Scholar] [CrossRef]
  21. Damene, S.; Tamene, L.; Vlek, P.L.G. Performance of farmland terraces in maintaining soil fertility: A case of Lake Maybar Watershed in Wello, Northern Highlands of Ethiopia. J. Life Sci. 2012, 6, 1251–1261. [Google Scholar]
  22. Wolka, K.; Mulder, J.; Biazin, B. Effects of soil and water conservation techniques on crop yield, runoff and soil loss in Sub-Saharan Africa: A review. Agric. Water Manag. 2018, 207, 67–79. [Google Scholar] [CrossRef]
  23. Zhang, J.H.; Wang, Y.; Li, F.C. Soil organic carbon and nitrogen losses due to soil erosion and cropping in a sloping terrace landscape. Soil. Res. 2015, 53, 87–96. [Google Scholar] [CrossRef]
  24. Jiang, G.; Guo, F.; Lo, K.F.A.; Liu, F.; Guo, Y.; Wu, W.; Polk, J.S. Utilization status of rainwater harvesting and its improvement techniques in bare karst areas for domestic use and ecological restoration. Carbonates Evaporites 2019, 34, 1381–1390. [Google Scholar] [CrossRef]
  25. Yue, H.; Yang, J. Evaluation on Water Retention Benefit of Side Slope Vegetation Carpet. J. Sichuan Agric. Univ. 2014, 32, 23–27. [Google Scholar]
  26. Zhou, Y.; Cao, Y.; Liao, X. Planting on the rocky slope of freeway by spraying combined materials. Rock. Mech. 2001, 22, 353–356. [Google Scholar]
  27. Ma, Y.; Cheng, X. Greening through the Planting Holes on Earthy Side Slope along Expressway in the Northern of Shaanxi. Shaanxi For. Sci. Technol. 2013, 5, 51–53. [Google Scholar]
  28. Wang, Z.; Wu, L.; Liu, T. Revegetation of steep rocky slopes: Planting climbing vegetation species in artificially drilled holes. Ecol. Eng. 2009, 35, 1079–1084. [Google Scholar] [CrossRef]
  29. Qin, X. Research on fast ecological restoration technology of high and steep rocky slope of highway. AIP Conf. Proc. 2017, 1864, 020127. [Google Scholar]
  30. Isabelle, C.; Bernard, N.; Caroline, C. Influence of rock fragments on the water retention and water percolation in a calcareous soil. Catena 2003, 53, 97–114. [Google Scholar]
  31. Ingelmo, F.; Cuadrado, S.; Ibanez, A. Hydric properties of some Spanish soils in relation to their rock fragment content: Implications for runoff and vegetation. Catena 1994, 23, 73–95. [Google Scholar] [CrossRef]
  32. Valentin, C. Surface sealing as affected by various rock fragments covers in West Africa. Catena 1994, 23, 87–97. [Google Scholar] [CrossRef]
  33. Kemper, W.D.; Nick, A.D.; Corey, A.T. Accumulation of water in soils under gravel and sand mulches. Soil. Sci. Soc. Am. J. 1994, 58, 56–63. [Google Scholar] [CrossRef]
  34. Wu, D.; Chen, X.; Lv, F.; Brenner, M.; Curtis, J.; Zhou, A.; Chen, J.; Abbott, M.; Yu, J.; Chen, F. Decoupled early Holocene summer temperature and monsoon precipitation in Southwest China. Quat. Sci. Rev. 2018, 193, 54–67. [Google Scholar] [CrossRef]
  35. Zha, M.; Han, Y.; Cheng, X. Mixing planting proportions in a plantation affects functional traits and biomass allocation of Cunninghamia lanceolata and Phoebe bournei seedlings. J. For. Res. 2022, 33, 1793–1805. [Google Scholar] [CrossRef]
Figure 1. Slab trench arrangement and detailed structure: (a) In situ construction of stepped slab trench on the rocky desertification slope; (b) Profile of the slab trench.
Water 15 01576 g001
Figure 2. Model design diagram of the slab trench (unit: mm).
Water 15 01576 g002
Figure 3. The water content measuring points in the slab trench model with water absorption belts (unit: mm).
Water 15 01576 g003
Figure 4. Side view of the models with different kinds of plants in drought state: (a) Succulent root plant; (b) Succulent stem plant; (c) Succulent root and stem plant in a mixed manner (unit: mm).
Water 15 01576 g004
Figure 5. Water absorption model test of the absorption belts: (a) Water absorption belts used in the test; (b) Cups full of dry soil or water connected by absorption belts with different initial lengths exposed to air; (c) Model test on water absorption through belts.
Water 15 01576 g005
Figure 6. The wetting front observed at different moment in the model with rainfall intensity of 222 mm/h and 3 strains of plants: (a) 0 min; (b) 30.0 min; (c) 50.0 min; (d) 90.0 min.
Water 15 01576 g006
Figure 7. Time-history curves of rainfall infiltration and overflow amount under different rainfall intensities in the model: (a) Relationship curve of cumulative infiltration amount versus time; (b) Relationship curve of cumulative water overflow versus time.
Water 15 01576 g007
Figure 8. Time-history curves of rainfall infiltration and overflow amount under rainfall intensity of 222 mm/h in the models with different numbers of plants: (a) Relationship curve of cumulative infiltration amount versus time; (b) Relationship curve of cumulative water overflow versus time.
Water 15 01576 g008
Figure 9. Variation curves of water storage depth versus time in the models with different rainfall intensity or different strains of plants in rainfall stage: (a) Relationship curve of water storage depth versus time with 1 strain of plant; (b) Relationship curve of water storage depth versus time under rainfall intensity of 222 mm/h.
Water 15 01576 g009
Figure 10. Response of volumetric water content along the depth of the middle axis in the model with different strains of plants under rainfall intensity of 222 mm/h: (a) Relationship curve of volumetric water content versus time measured by sensor 2# near the dense root area; (b) Relationship curve of volumetric water content versus time measured by sensor 4# near the root tip area.
Water 15 01576 g010
Figure 11. Response of volumetric water content along the depth of the middle axis in the models (2#, 4#, 5#) with one strain of plant under rainfall intensity of 98.0 mm/h.
Water 15 01576 g011
Figure 12. Response of volumetric water content at 5 cm sub-surface along the width direction in the models (1#, 2#, 3#) with one strain of plant under different rainfall intensity: (a) Relationship curve of volumetric water content versus time under rainfall intensity of 98.0 mm/h; (b) Relationship curve of volumetric water content versus time under rainfall intensity of 222 mm/h.
Water 15 01576 g012
Figure 13. Response of volumetric water content at 5 cm sub-surface along the width direction in the models (1#, 2#, 3#) with different strains of plants under rainfall intensity of 222 mm/h: (a) Relationship curve of volumetric water content versus time with one strain of plant; (b) Relationship curve of volumetric water content versus time with three strains of plant.
Water 15 01576 g013
Figure 14. Crack development on the surface of soil: (a) Surface crack due to wetting collapse after rainfall; (b) Drying tiny cracks at the edge; (c) tiny cracks after further drying; (d) Shrinkage cracks at the edge; (e) Cracks in the middle; (f) Tiny cracks between plants.
Water 15 01576 g014aWater 15 01576 g014b
Figure 15. Response of volumetric water content along the depth of the middle axis in the models (2#, 4#, 5#) with different number of plants during drying period after rainfall with intensity of 222 mm/h: (a) Relationship curve of volumetric water content versus time measured by sensor 2# near the dense root area; (b) Relationship curve of volumetric water content versus time measured by sensor 4# near the root tip area; (c) Relationship curve of volumetric water content versus time measured by sensor 5# near the area without root.
Water 15 01576 g015
Figure 16. Response of volumetric water content along the depth of the middle axis in test groups MT1 and MT3 with one strain of plant during drying period after rainfall, which formed different initial water storage depths of 8.2 cm or 15.0 cm: (a) Relationship curve of volumetric water content versus time measured by sensor 2# near the dense root area; (b) Relationship curve of volumetric water content versus time measured by sensor 4# near the root tip area.
Water 15 01576 g016
Figure 17. Response of volumetric water content at 5 cm sub-surface along the width direction in the models (1#, 2#, 3#) with one strain of plant during drying period after rainfall, which formed different initial water storage depths: (a) Relationship curve of volumetric water content versus time with initial water storage depth of 8.2 cm; (b) Relationship curve of volumetric water content versus time with initial water storage depth of 15.0cm.
Water 15 01576 g017
Figure 18. Results of water absorption test with different initial air-exposed lengths of absorption belts: (a) Relationship curve of water level drop in the cup and temperature change versus time; (b) Relationship curve of daily variation in soil moisture and temperature change versus time.
Water 15 01576 g018
Figure 19. Response of moisture content at 5 cm and 10cm sub-surface with time in rainfall stage with water stored in different plants: (a) Relationship curve of moisture content versus time in group 1 with water stored in succulent root plant; (b) Relationship curve of moisture content versus time in group 2 with water stored in succulent STEM plant.
Water 15 01576 g019
Figure 20. Response of moisture content at 5 cm and 10 cm sub-surface with time and temperature in drying stage with water stored in different plants: (a) Relationship curve of moisture content and temperature versus time in group 1 with water stored in succulent root plant; (b) Relationship curve of moisture content versus time in group 2 with water stored in succulent STEM plant.
Water 15 01576 g020
Figure 21. Daily evapotranspiration changes with time and temperature in drying stage for the tests with water stored only in succulent root plants or only in succulent stem plants.
Water 15 01576 g021
Figure 22. Response of water change with time and temperature in group 3 with water stored in both succulent root and succulent stem plants in drying stage: (a) Relationship curve of moisture content and temperature versus time at 5 cm and 10 cm sub-surface; (b) Relationship curve of evapotranspiration change and temperature versus time.
Water 15 01576 g022
Table 1. Composition of particle size of the soil in the test.
Grain size (mm)GravelSandSiltClay
>22~0.0750.075~0.005<0.005
Cumulative amount %21.0112.3041.9324.76
Table 2. The major physical properties of the soil in the test.
Gs
Relative Density of the Particle
wL (%)
Liquid Limit
wp (%)
Plastic Limit
Ip
Plasticity Index
wop (%)
Optimum Moisture Content
k (cm/s)
Hydraulic Conductivity
ρdmax (g/cm3)
Maximum Dry Unit Weight
γ (kN/m3)
Volumetric Weight
e
Porosity Ratio
2.66133.72013.717.06.94 × 10−51.7518.70.80
Table 3. Model test scheme of the slab trench on rocky desertification slope under rainfall.
Test IDRainfall Intensity (mm/h)Number of PlantsRainfall Duration (min)
MT198.01.0225
MT21481.0225
MT32221.0225
MT42220.0090.0
MT52223.0225
Table 4. Variation in the maximum water diffusion width (cm) in the soil with time for different initially exposed lengths of water absorption belts between two cups full of dry soil or water.
Drying Time (d)The Initially Exposed Length
2 cm4 cm6 cm8 cm
17.07.05.04.0
27.07.06.85.0
37.07.07.07.0
Note: The diameter and height of the cup are 7 cm and 10 cm, respectively.
Table 5. Plant growth in each test group.
Plants CombinationGrowth Height of Plants (cm)Test Period (Day)
Succulent root plant alone2.020
Succulent stem plant alone1.520
Succulent root plant plus succulent stem plants2.320
Disclaimer/Publisher’s Note: The statements, opinions and data contained in all publications are solely those of the individual author(s) and contributor(s) and not of MDPI and/or the editor(s). MDPI and/or the editor(s) disclaim responsibility for any injury to people or property resulting from any ideas, methods, instructions or products referred to in the content.

