Article

Seasonal and Spatial Variations in the Optical Characteristics of Dissolved Organic Matter in the Huma River Basin, China

1
School of Water Resources and Environment, China University of Geosciences (Beijing), Beijing 100083, China
2
Research Center of Environmental Pollution Control Technology, Chinese Research Academy of Environmental Sciences, Beijing 100012, China
3
China National Environmental Monitoring Centre, Beijing 100012, China
*
Author to whom correspondence should be addressed.
Water 2023, 15(8), 1579; https://doi.org/10.3390/w15081579
Submission received: 24 March 2023 / Revised: 11 April 2023 / Accepted: 15 April 2023 / Published: 18 April 2023

Abstract

:
Dissolved organic matter (DOM) plays a central role in the global carbon cycle. The Huma River Basin (HRB) in China is affected by humic substances in its forests with high background values. DOM in the HRB was studied using spectroscopic techniques combined with statistical analysis in order to better understand its characteristics in natural waters affected by humic substances in forests. UV-visible parameters showed that the DOM predominantly consisted of aromatic and high-molecular-weight natural organic matter. Fluorescence excitation-emission matrix (EEM) spectroscopy-parallel factor analysis (PARAFAC) recognized four characteristic components, representing humic-like substances (C1, C2, and C3) and protein-like substances (C4). Fluorescence parameters showed that the allochthonous terrestrially-derived DOM had a humic character. Fourier transform infrared (FT-IR) spectra characterized the structure of DOM, containing aromatic, aliphatic, carbohydrate, and protein compounds. Principal component analysis (PCA) revealed that humic-like components explained approximately 86.7% of the total variance, suggesting that terrestrial humic-like substances were dominant in the HRB. Correlation coefficient matrix analysis indicated that CODMn and DOC were mainly derived from humic-like substances. The results demonstrated that the background value in the HRB was mainly attributed to terrestrial humic-like substances. Such knowledge could assist in monitoring and managing rivers with high background values.

1. Introduction

Dissolved organic matter (DOM) is a complex and heterogeneous mixture, including fulvic acid, humic acid, carbohydrate and amino acid [1,2]. As an important component of river ecosystems, it plays a key role in the global carbon balance [3]. The characterization and sources of DOM in natural waters are closely related to seasonal and spatial variations [4,5].
In recent years, optical measurements have been widely used to study DOM characterization and sources in aquatic ecosystems. DOM optical properties are predominantly studied using UV-visible absorption spectroscopy, fluorescence spectroscopy, Fourier transform infrared (FT-IR) spectroscopy, nuclear magnetic resonance (NMR) spectroscopy, and Fourier transform ion cyclotron resonance mass spectrometry (FT-ICR-MS) [6,7,8,9]. The first three optical techniques are the most common methods, owing to their advantages in cost and efficiency. UV-visible absorption and fluorescence spectroscopy can reveal the amount, source and composition of DOM [10], and FT-IR spectroscopy can provide abundant molecular-level information [11]. In particular, fluorescence excitation-emission matrix (EEM) spectroscopy is a highly sensitive, simple, and reliable spectroscopy technology. In addition, parallel factor analysis (PARAFAC) is used to deconvolute complex EEM into dominant fluorescent DOM components, which can perform semiquantitative analysis of different components [12]. In addition to optical measurements, statistical methods such as principal component analysis (PCA) and correlation coefficient matrix analysis have been widely utilized to evaluate DOM sources and mutual relationships among multiple parameters. PCA is a multivariate statistical tool using eigenvector decomposition of the correlation matrix [13].
Although a number of studies have analyzed DOM characterization and sources in rivers [14,15,16], few have analyzed the optical characteristics of DOM in rivers affected by humic substances in forests [17,18,19]. Large amounts of natural organic matter in forests flow into rivers through rainfall and runoff, which has a major impact on water quality. Thus, a background value is formed, which reflects the chemical structure, community composition, and content in natural waters. Specifically, the background value means water color and dissolved organic carbon (DOC) concentration in natural waters. DOC is the primary component of DOM. Previous studies have shown that DOM can absorb light in the ultraviolet and short visible-light wavelengths, which gives a yellow-brown color to DOM-rich waters [20]. Moreover, water browning or brownification refers to increasing water color, often related to increasing DOM or DOC content in freshwaters [21].
The Huma River Basin (HRB) is located in northeast China and is a tributary of the Heilongjiang River. The forest coverage of the HRB is 62%. The forest vegetation is mainly coniferous forest, with a small amount of broad-leaved forest. There are abundant humic substances in forests. Thus, the HRB is significantly affected by the background value, which represents the natural properties of water bodies without anthropogenic and human activities. The area affected by the background value is called the background area in this study. As a consequence, understanding the source, amount, and composition of DOM in the background area is critical for understanding how exported DOM may impact downstream ecosystems.
In this study we analyzed seasonal and spatial variations in the optical characteristics of DOM in the HRB using UV-visible absorption spectroscopy, EEM-PARAFAC, FT-IR spectroscopy and statistical analysis. The objectives of this study were to (1) investigate the optical characteristics of DOM in the HRB during the dry and wet seasons using optical techniques; and (2) analyze DOM sources based on PCA and correlation coefficient matrix analysis. This study could provide a reference from the perspective of DOM to manage rivers with high background values.

2. Materials and Methods

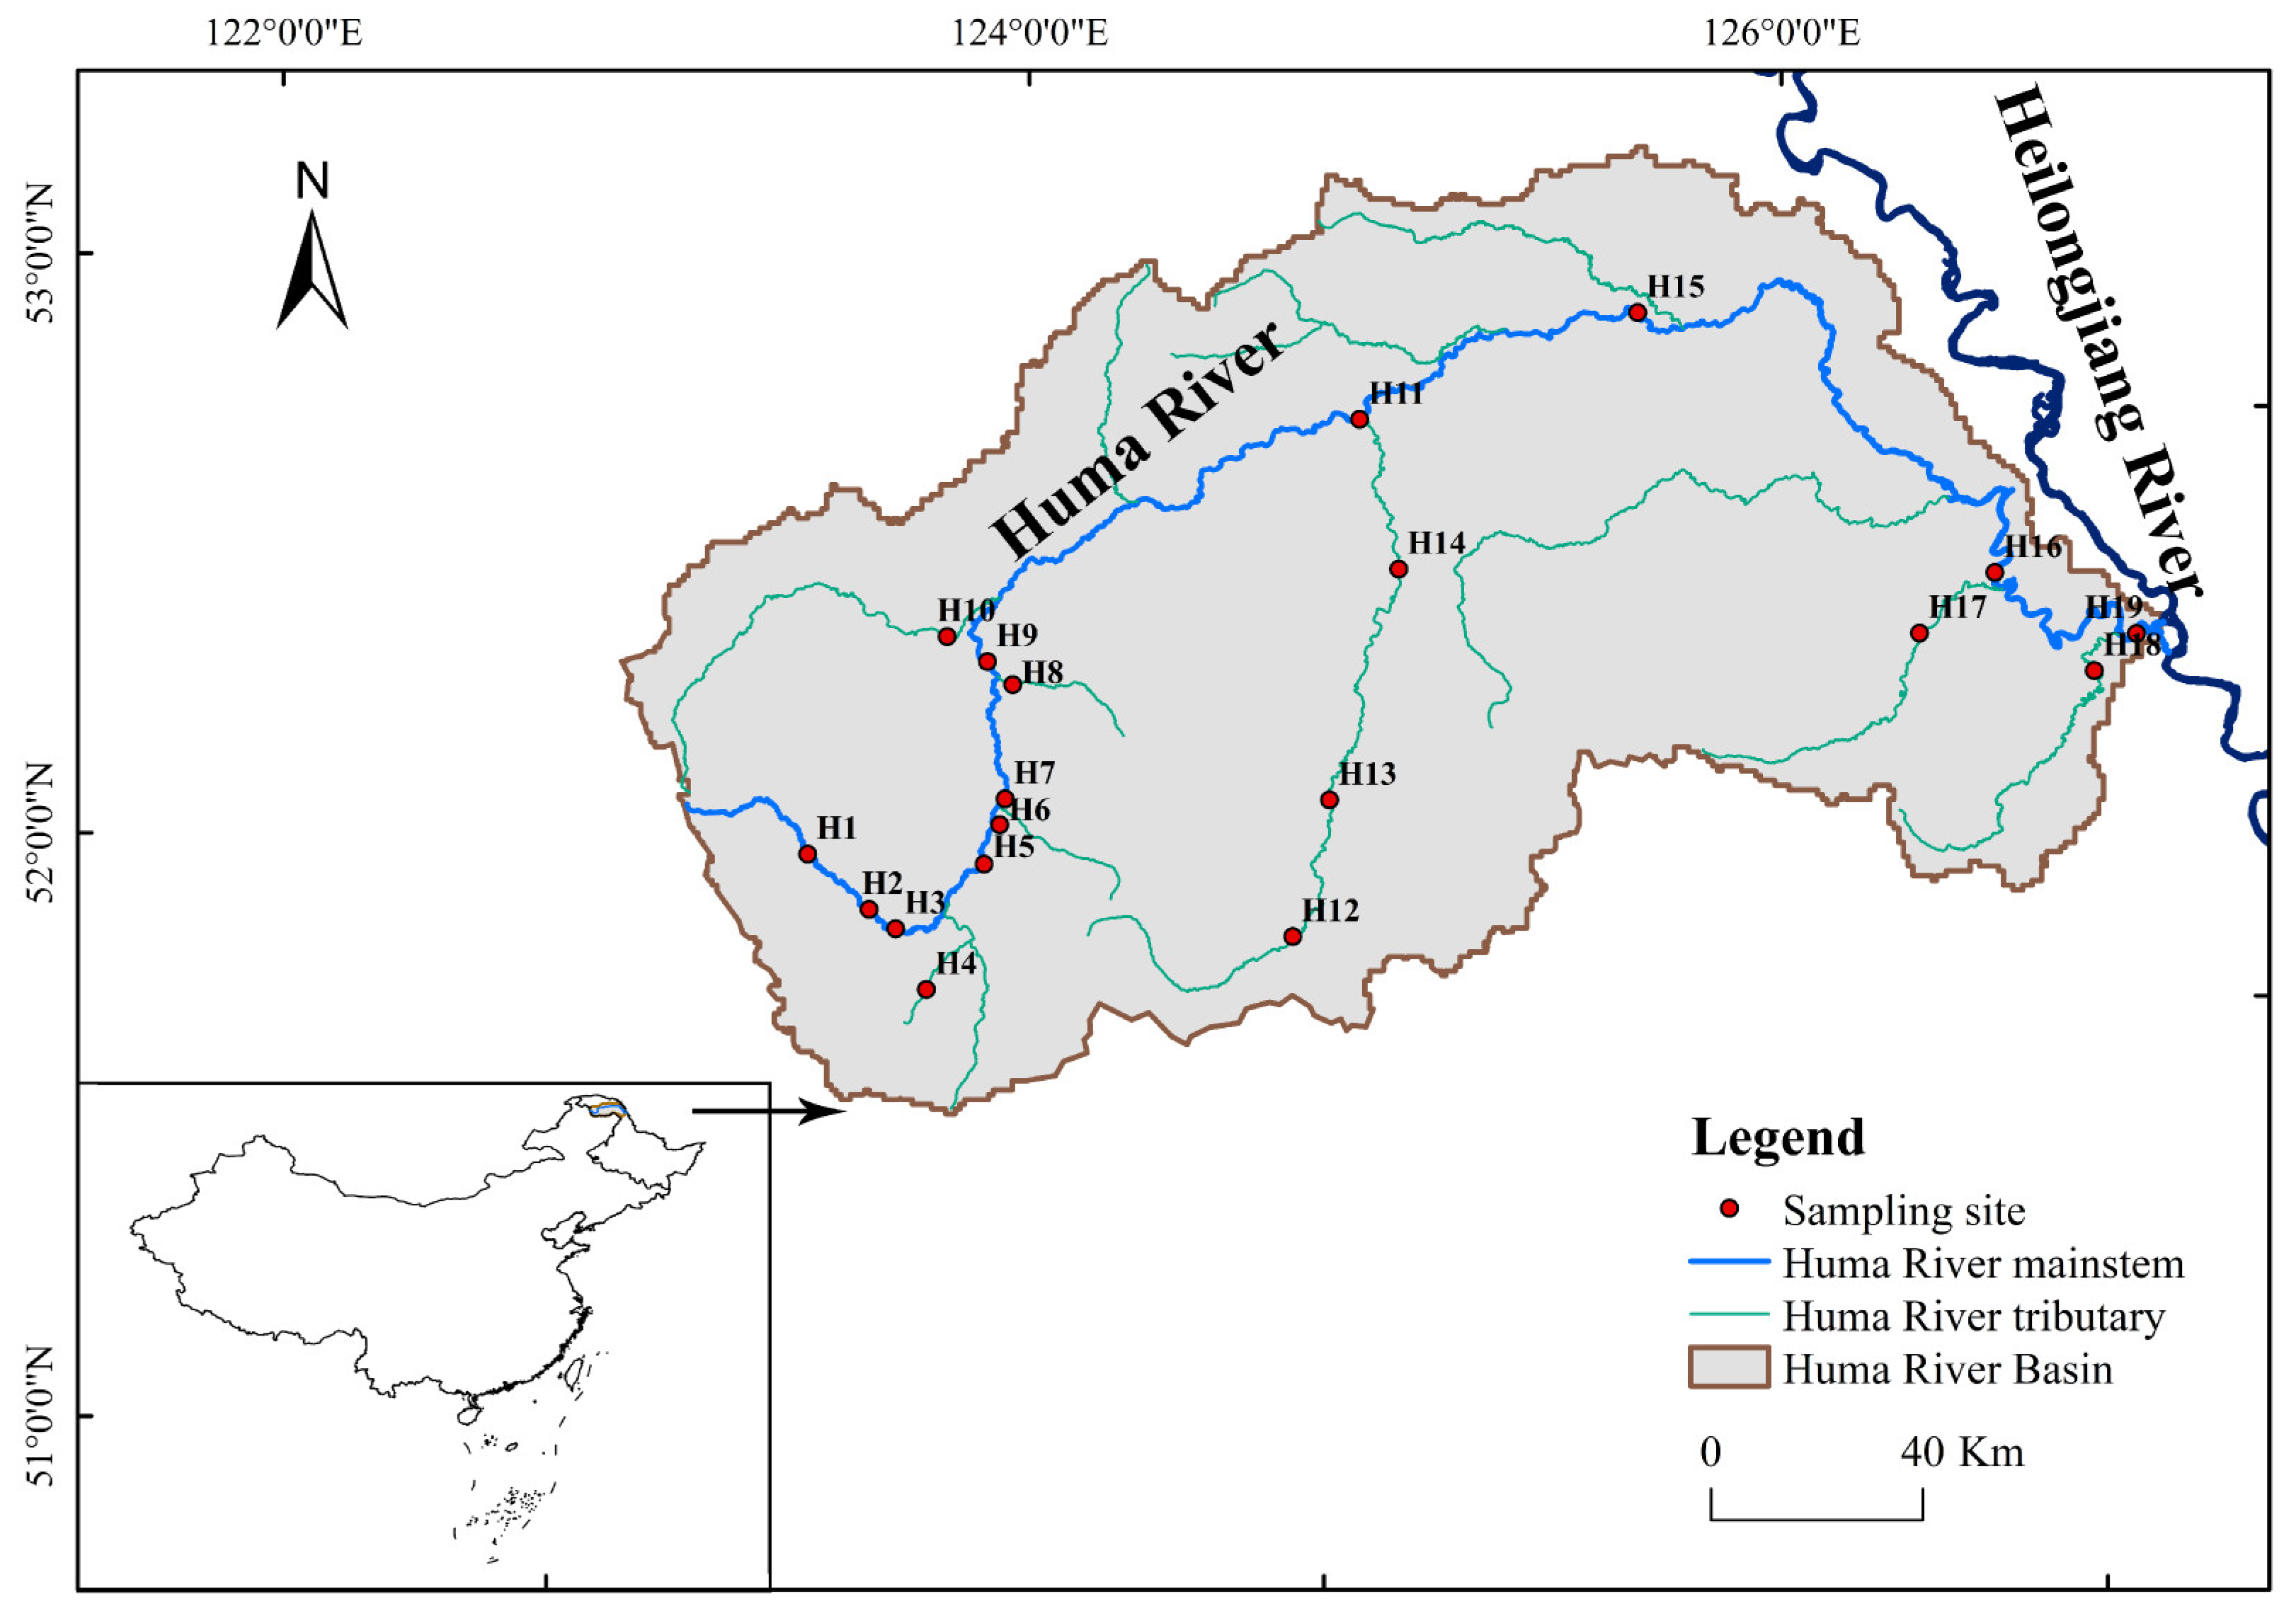
2.1. Study Area and Sample Collection

The Huma River is a tributary of the Heilongjiang River, and it is also one of 26 headwater protection areas in Heilongjiang Province, China (Figure 1). It is 542 km in length, with a drainage area of 30,853 km2. The HRB (51°15′–52°45′ N, 122°03′–126°43′ E) is located in a cold-temperate region, characterized by a continental monsoon climate with distinct dry and wet seasons. Headwaters of the Huma River originate from the Greater Khingan Mountains. Heilongjiang Huzhong National Nature Reserve is located in the Greater Khingan Mountains, within the range of 51°17′42″–51°56′31″ N, 122°42′14″–123°18′05″ E. The reserve covers an area of 1672.13 km2. The forest coverage of the reserve is as high as 96.2%. As the reserve is at the headstream of the Huma River, with fewer anthropogenic activities, it could be used as the background area. Nineteen water samples were collected from the upper, middle, and lower HRB in March 2022 (the dry season) and August 2022 (the wet season), respectively (Figure 1). Specifically, sampling sites H1–H3 were all located in Huzhong National Nature Reserve. As the road to the reserve was blocked during the dry season, the data of sites H1–H3 were missing.
Surface water samples (depth = 0.5 m) were collected using acid-cleaned high-density polyethylene (HDPE) bottles and stored in a cooler box at 4 °C while in the field. Simultaneously, a portable water quality meter (YSI Professional Plus, Yellow Springs, OH, USA) was used in situ to determine environmental parameters, including water temperature (T), pH, electrical conductivity (EC), and dissolved oxygen (DO). The collected water samples were transported back to the laboratory as soon as possible. Water samples for general water quality parameters were stored in a refrigerator at −20 °C. Water samples for DOC concentrations and DOM spectroscopic properties were filtered through pre-combusted GF/F filters (Whatman 25 mm diameter, 0.7 µm nominal pore size), and filtrates were collected. The filtrated water samples for DOC concentrations and DOM spectroscopic properties were stored in a refrigerator at −20 °C and 4 °C, respectively.

2.2. Measurements of Water Quality Parameters

The water samples were measured for general water quality parameters, including potassium permanganate index (CODMn), five-day biochemical oxygen demand (BOD5), ammonia nitrogen (NH3-N), and total phosphorus (TP) concentrations. In addition, the parameters were classified according to the China Environmental Quality Standards for Surface Water (GB 3838-2002, http://www.sac.gov.cn/ (accessed on 24 March 2023)).
DOC concentrations were analyzed by a TOC/TN analyzer (TOC-L CPH, Shimadzu, Japan), and were closely related to DOM contents [22].

2.3. UV-Visible Absorption Spectroscopy

UV-visible spectral analysis was conducted using a UV-visible spectrophotometer (UV-1700, Shimadzu, Japan) from 200 to 700 nm with 0.5 nm intervals. The spectral parameters were used to investigate DOM characteristics. The specific UV absorbance at 254 nm (SUVA254) was defined as the UV absorbance coefficient (m−1) at 254 nm divided by the DOC concentration (mg/L) [23]. Oh and Choi [24] found that SUVA254 was high when high-molecular-weight natural organic matter flowed into rivers through rainfall and runoff. The spectral slopes for the wavelength intervals of 275–295 nm (S275–295) and 350–400 nm (S350–400) were obtained using linear regression of the natural log-transformed absorption spectra [25]. Then, the slope ratio (SR) was obtained as the ratio of S275–295 to S350–400, being used as a proxy of the relative molecular weight and source of DOM [26].

2.4. EEM-PARAFAC Analysis

Fluorescence spectra were scanned on a fluorescence spectrophotometer (F-7000, Hitachi, Japan), following the procedure described by Lu et al. [27]. Excitation (Ex) and emission (Em) wavelength ranges were set from 200 to 500 nm and from 250 to 600 nm, respectively. Ex and Em increments were adjusted to 5 nm. Scan speed was set at 2400 nm/min. In addition, Raman scatters and Rayleigh scatters were removed from the sample EEM before PARAFAC.
The EEM data from the HRB were analyzed by PARAFAC, using MATLAB R2017b software with the DOMFluor toolbox [28]. The obtained fluorescence intensities were expressed in Raman units (R.U.) [29]. In addition, the absolute Fmax value was used to calculate the proportion of each fluorescent component.

2.5. Calculations of DOM Fluorescence Parameters

Fluorescence parameters are complementary tools to determine DOM origin. The fluorescence index (FI) was calculated using the ratio of the Em intensity at 450 nm to that at 500 nm, with Ex at 370 nm [30]. FI can estimate the relative contribution of terrestrial versus microbial sources [31]. The humification index (HIX), as an indicator of the humification degree of source material, was defined using the 435–480 nm to 300–345 nm ratio of the spectral region areas of the Em spectra at Ex 254 nm [32]. Generally speaking, the allochthonous high-molecular-weight organic matter had higher HIX values than the autochthonous low-molecular-weight organic matter [33]. The biological index (BIX) was calculated by the ratio of the Em intensity at 380 nm to that at 430 nm at Ex 310 nm [34]. BIX can represent freshly produced autochthonous DOM.

2.6. FT-IR Spectroscopy

FT-IR spectral analysis of each freeze-dried sample was conducted on an FT-IR spectrometer (Nicolet iS 50, Thermo Scientific, Waltham, MA, USA) from 4000 cm−1 to 400 cm−1 with a 4 cm−1 resolution. The samples were analyzed by the potassium bromide (KBr) disc method. Each freeze-dried sample was mixed with pre-dried KBr at a mass ratio of about 1:100 [35]. Moreover, the mixture was ground into powder with an agate mortar and pestle to reduce light scattering during scanning. Then, the homogeneously mixed powder was pressed on a mold to form a KBr disc. Before the freeze-dried samples were analyzed, a background blank was corrected using a pure KBr disc. Baseline shifts and smoothing were performed for each FT-IR spectrum using OriginPro 2022b (OriginLab).

2.7. Statistical Analysis

As large amounts of natural organic matter forests flowed into rivers through rainfall and runoff during the wet season, we took this season as an example. Before performing PCA, Kaiser–Meyer–Olkin (KMO) measurement and Bartlett’s test of sphericity (P) were carried out to evaluate the feasibility of PCA using IBM SPSS Statistics 22.0 software. For this study, the KMO value was 0.714 (>0.5), and the p value was less than 0.05, suggesting that the PARAFAC components data were suitable for PCA. PCA was performed using the Principal Component Analysis (v1.50) in-app program of OriginPro 2022b (OriginLab) to trace the variations of fluorescent components and identify dominated substances. In addition, correlation coefficient matrix analysis was performed using the Correlation Plot (v1.30) in-app program of OriginPro 2022b (OriginLab) to explore the intrinsic relationships between environmental factors and DOM optical characteristics.

3. Results and Discussion

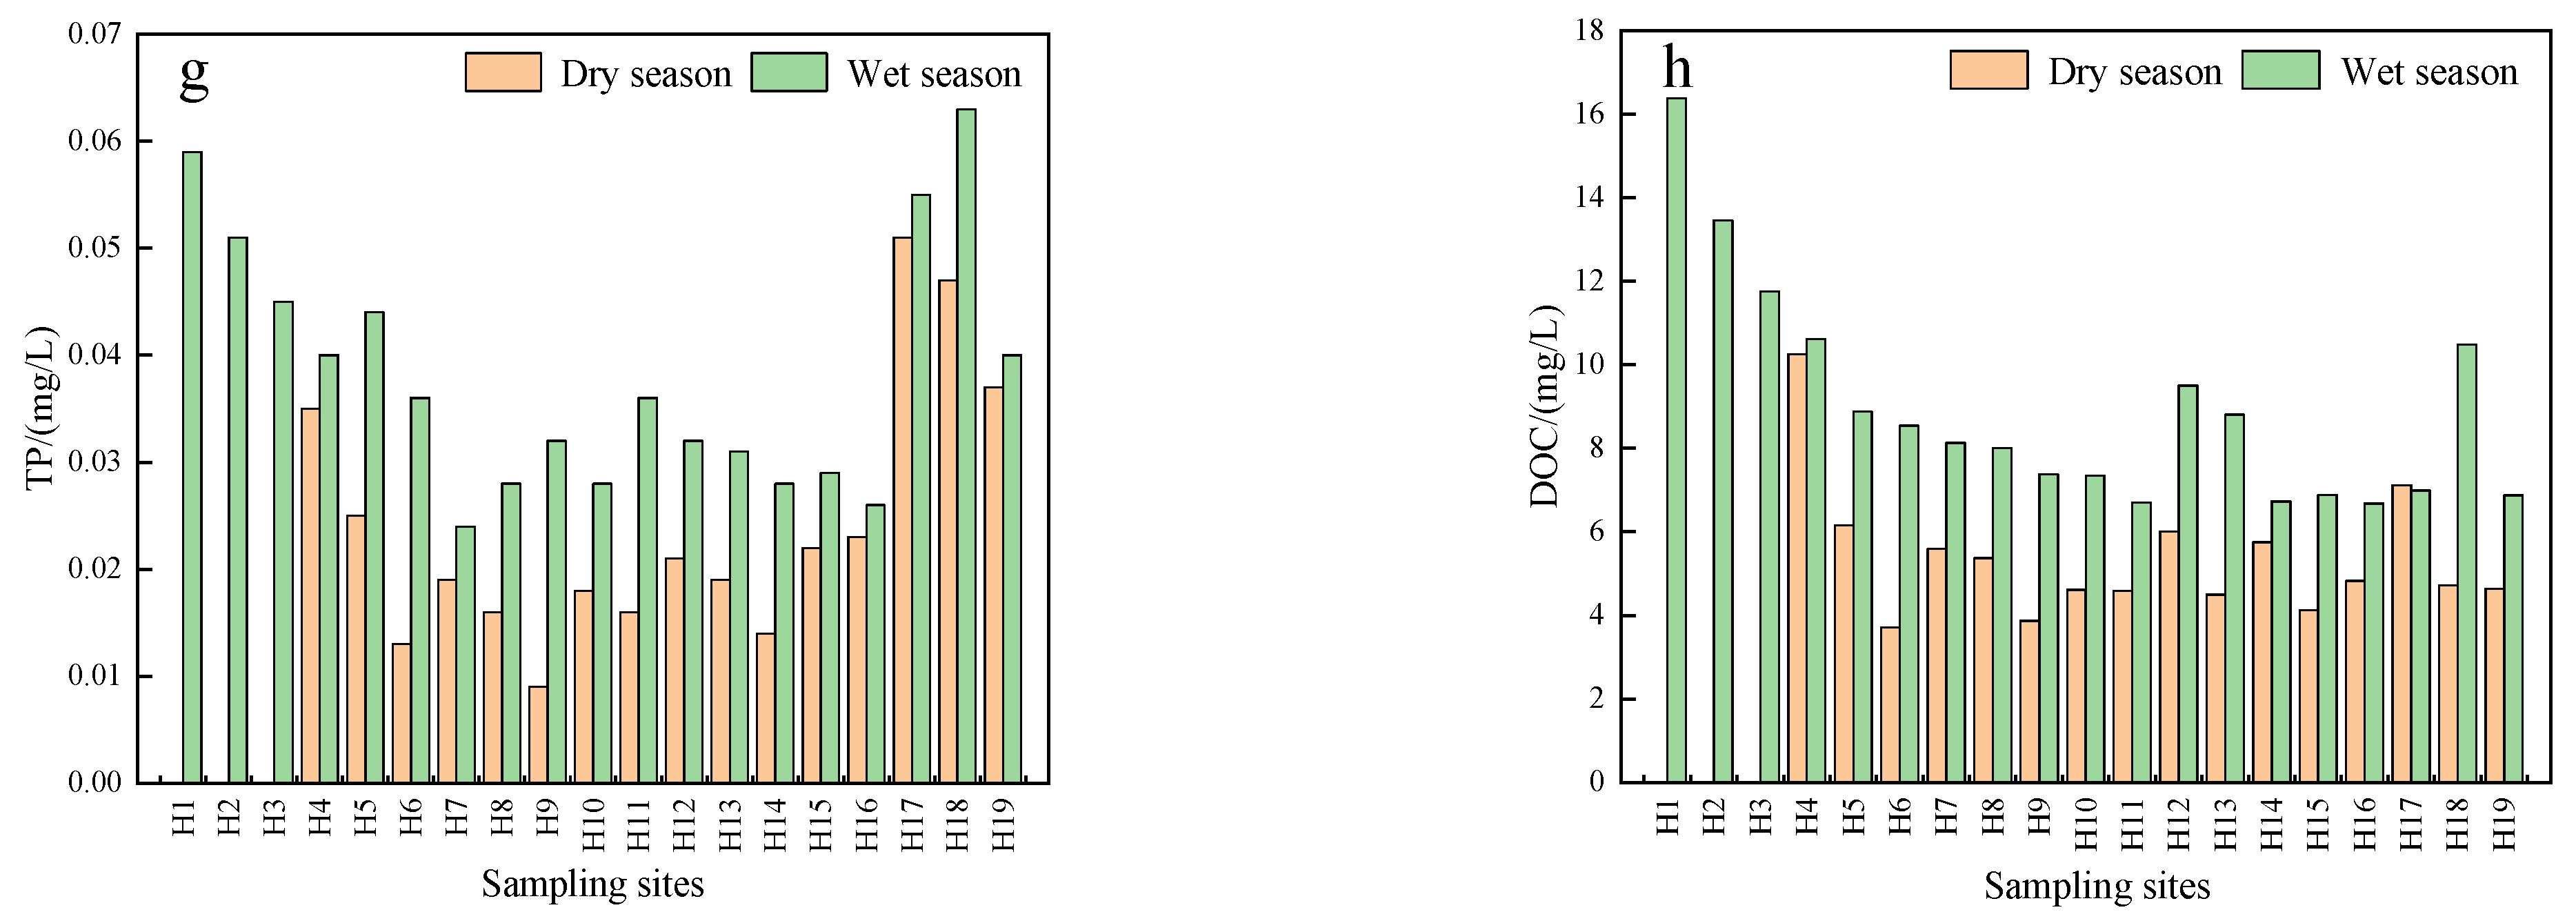
3.1. Seasonal and Spatial Variations in Water Quality

Seasonal and spatial variations in water quality parameters in the HRB are shown in Figure 2. Based on the data, the classifications of the parameters were evaluated. Overall, DO and BOD5 concentrations as well as pH values during the dry and wet seasons met the level Ⅰ water standard; both NH3-N and TP concentrations during the dry and wet seasons met the level Ⅱ water standard; and CODMn concentrations during the dry and wet seasons met the level Ⅲ and Ⅳ water standards, respectively. Notably, CODMn concentrations during the wet season were unnaturally high and did not satisfy the level Ⅲ water standard for potable water.
On the whole, the pH values during the dry and wet seasons were around 7.0. EC and DO concentrations during the dry season were higher than those during the wet season, while CODMn, BOD5, NH3-N, TP, and DOC concentrations during the dry season were lower than those during the wet season. The results showed that water quality parameters in the HRB displayed distinct seasonal variations. In addition, CODMn, BOD5, NH3-N, and DOC concentrations exhibited a fluctuating decreasing trend from the upstream to the downstream, indicating that headwaters in the HRB presented a higher background value. The leaching of humic substances (e.g., fresh plant litter and soils) in forests could be an important allochthonous source of nutrients and DOC in river ecosystems [36,37]. Significantly, CODMn, BOD5, NH3-N, DOC, and TP concentrations in the downstream increased compared with those in the midstream, particularly the concentration of TP (Figure 2g). Furthermore, EC exhibited an increasing trend from the upstream to the downstream (Figure 2b). This could be attributed to agricultural activities in the lower HRB. The upper and middle reaches are mountainous, whereas the lower reaches are low, hilly areas with a small amount of cultivated land. DOM in agricultural soils can be transported into the HRB through the leaching process.

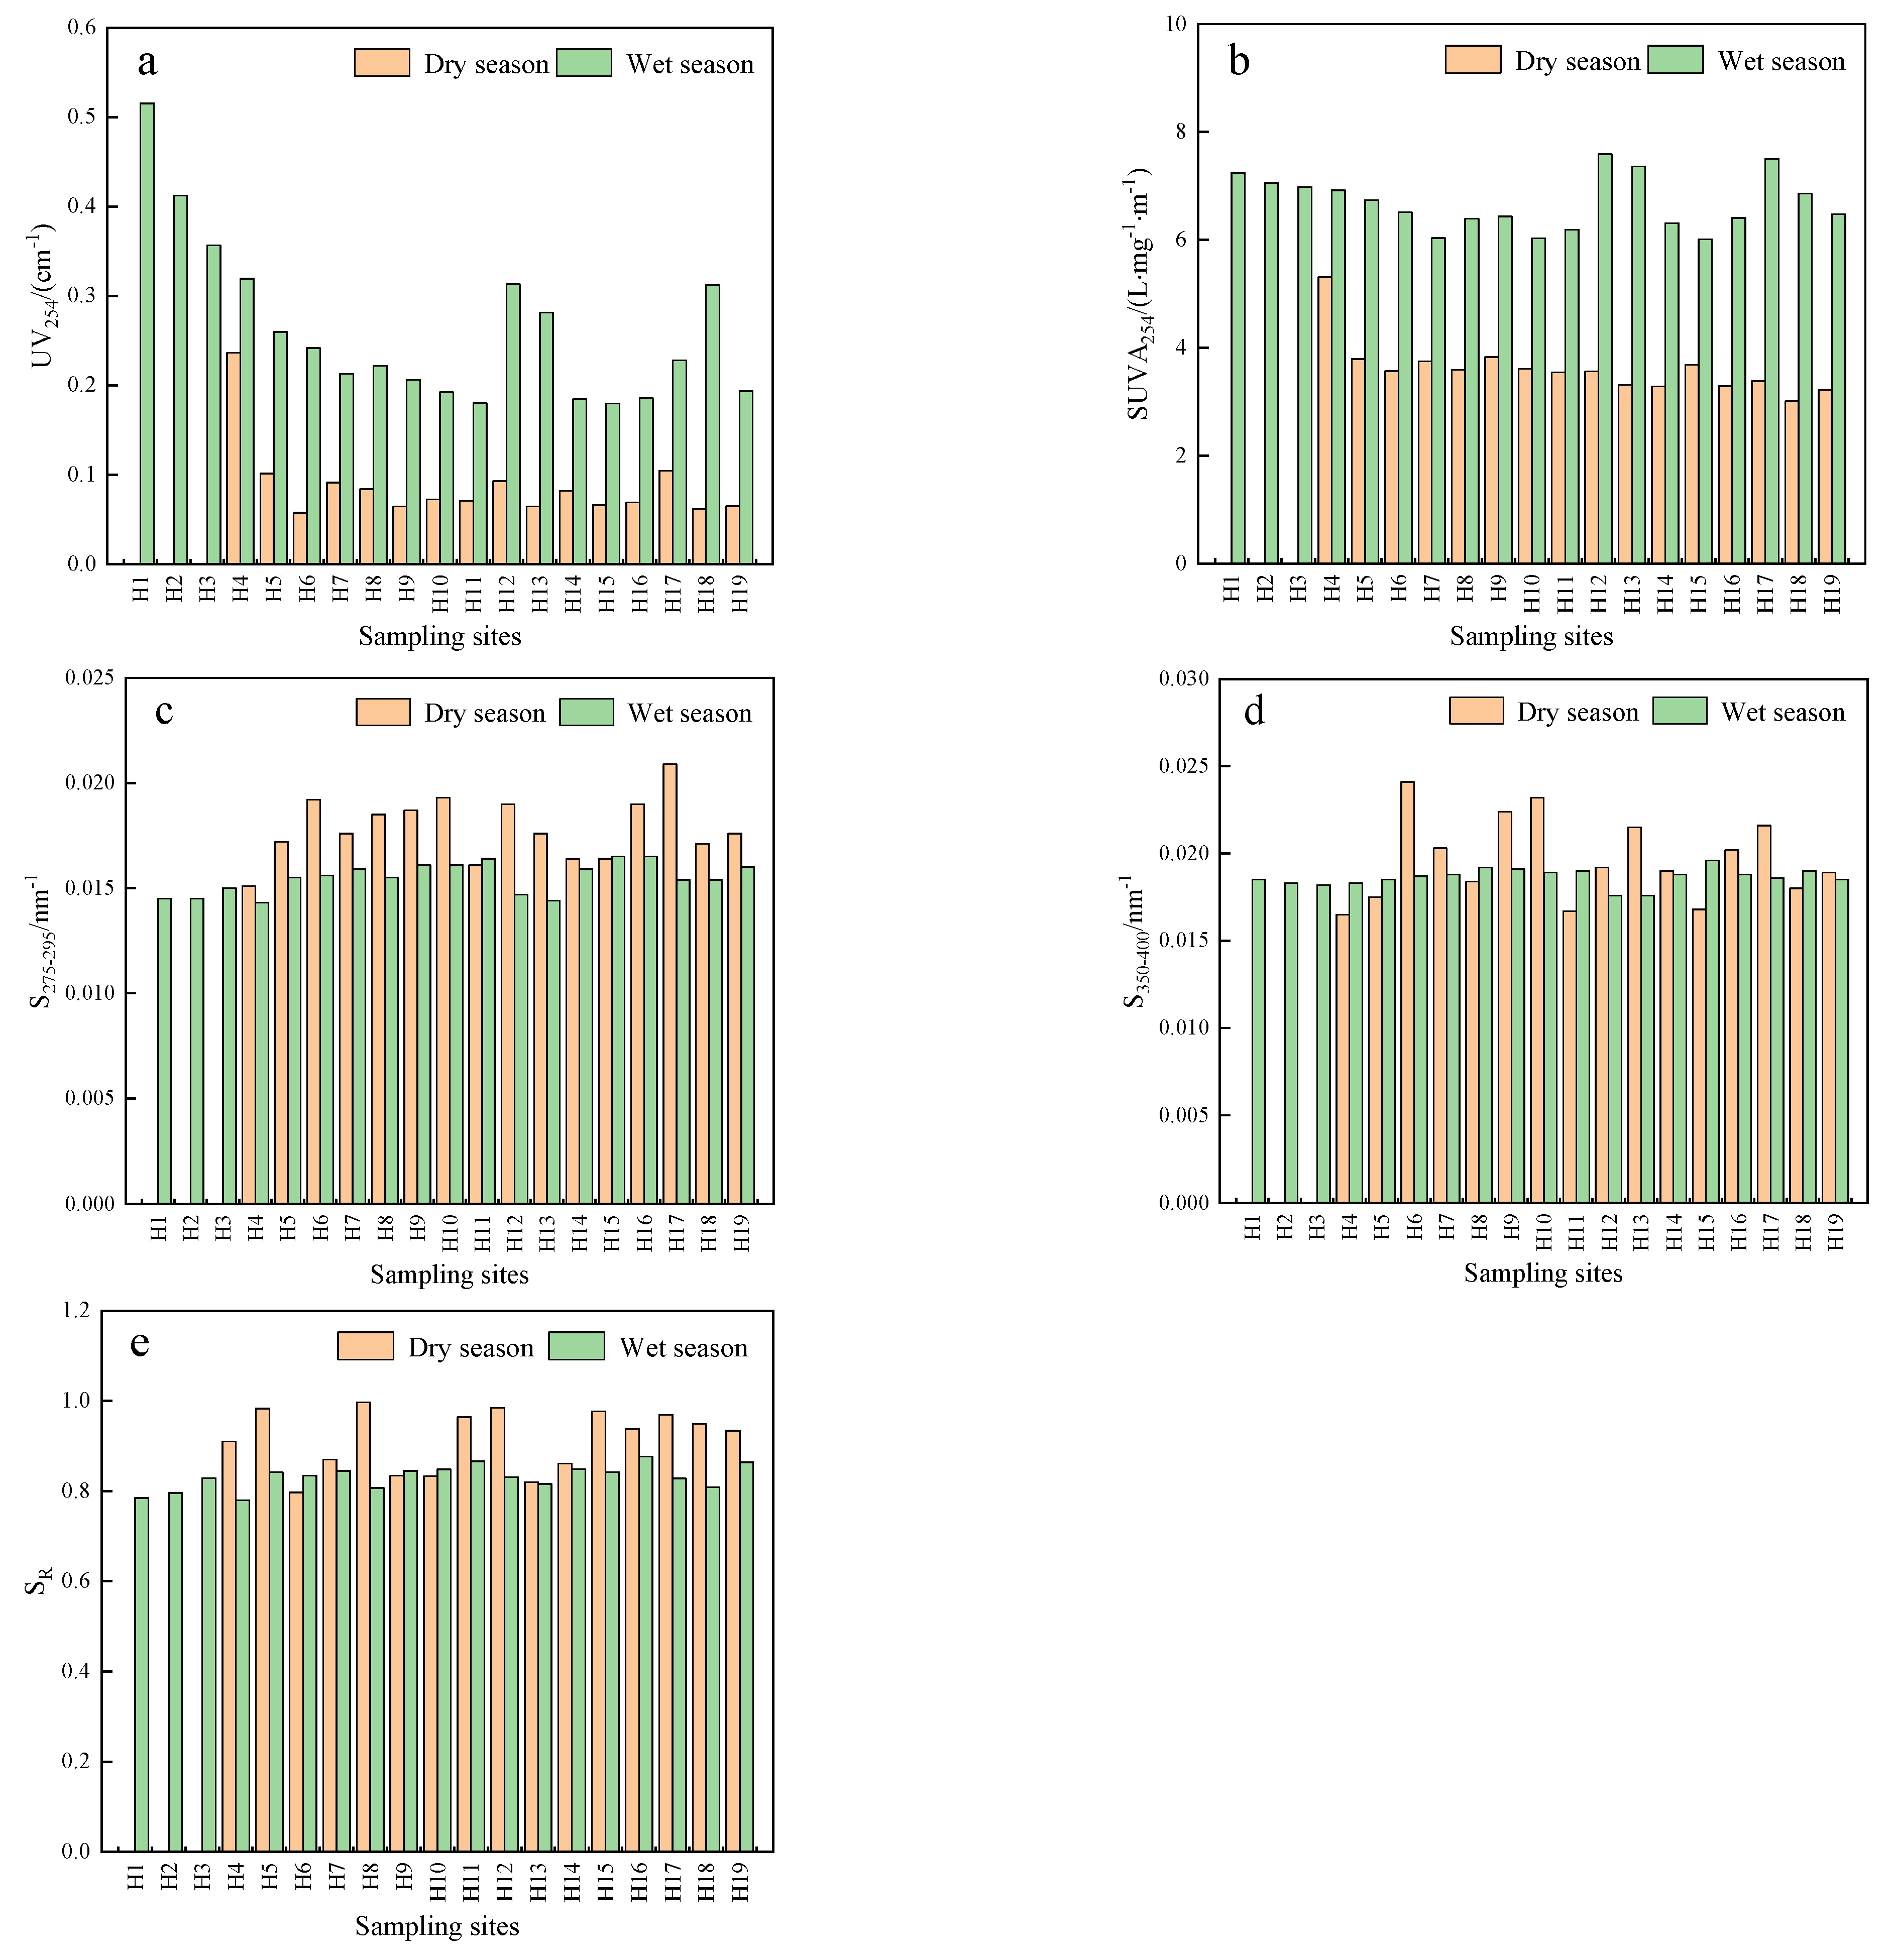
3.2. UV-Visible Spectra

Figure 3 shows several UV-visible spectral parameters variations from the upstream to the downstream. UV254 indicates the relative content of natural humic-like macromolecular organic matter and aromatic organic matter containing C=C and C=O [38]. UV254 values during the wet season were higher than those during the dry season, which suggests that the content of natural macromolecular organic matter during the wet season was higher than that during the dry season. Moreover, UV254 values exhibited a decreasing trend from the upstream to the downstream, indicating that headwaters contained more natural macromolecular organic matter. SUVA254 was positively correlated with the aromatic carbon content in DOM [23]. The SUVA254 values during the dry and wet seasons were above 3 L·mg·m−1, indicating that DOM in the HRB predominantly consisted of aromatic and high-molecular-weight natural organic matter [39]. Significantly, the SUVA254 values during the wet season were much higher than those during the dry season, which showed that DOM during the wet season contained more aromatic and high-molecular-weight natural organic matter. We observed that S275–295 < S350–400 at each site in this study, suggesting that DOM in the HRB was dominated by terrestrially derived substances. Helms et al. [25] illustrated that lower SR values were indicative of a growth in DOM molecular weight. The SR values during the dry season were higher than those during the wet season, indicating that the DOM during the wet season had a higher molecular weight than that during the dry season. The results were mainly attributed to the introduction of natural organic matter into the HRB through rainfall and runoff during the wet season.

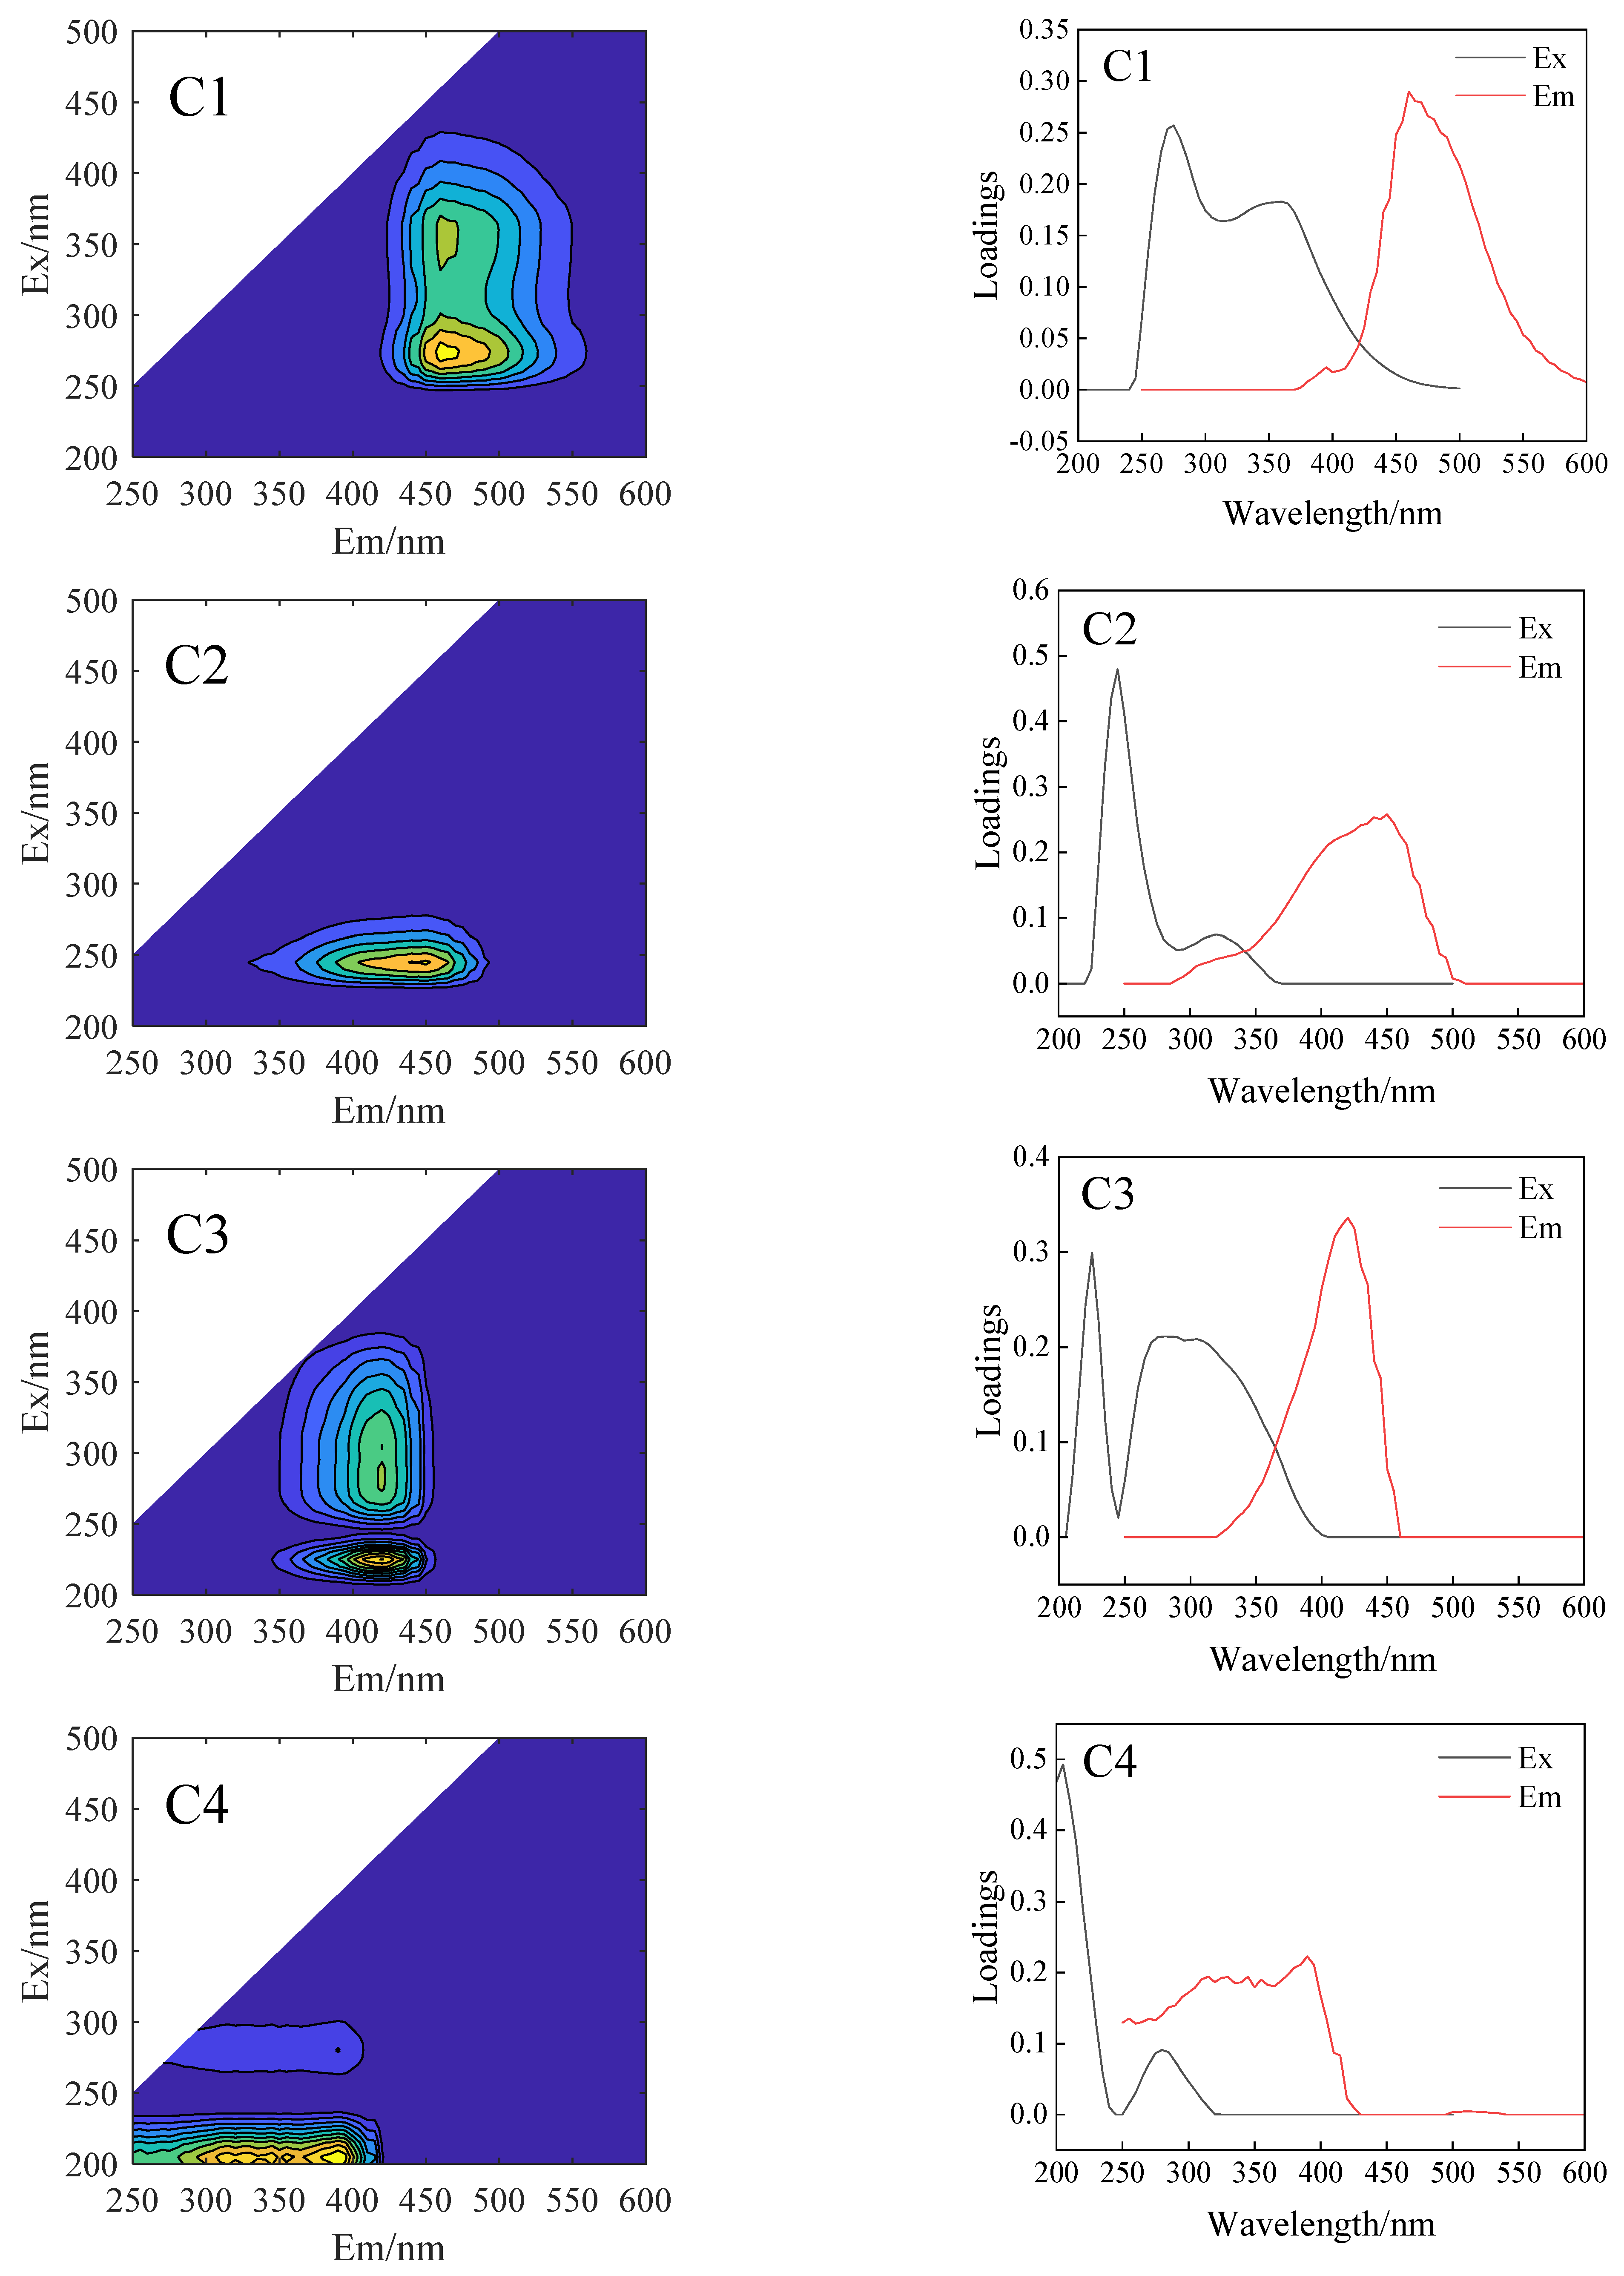
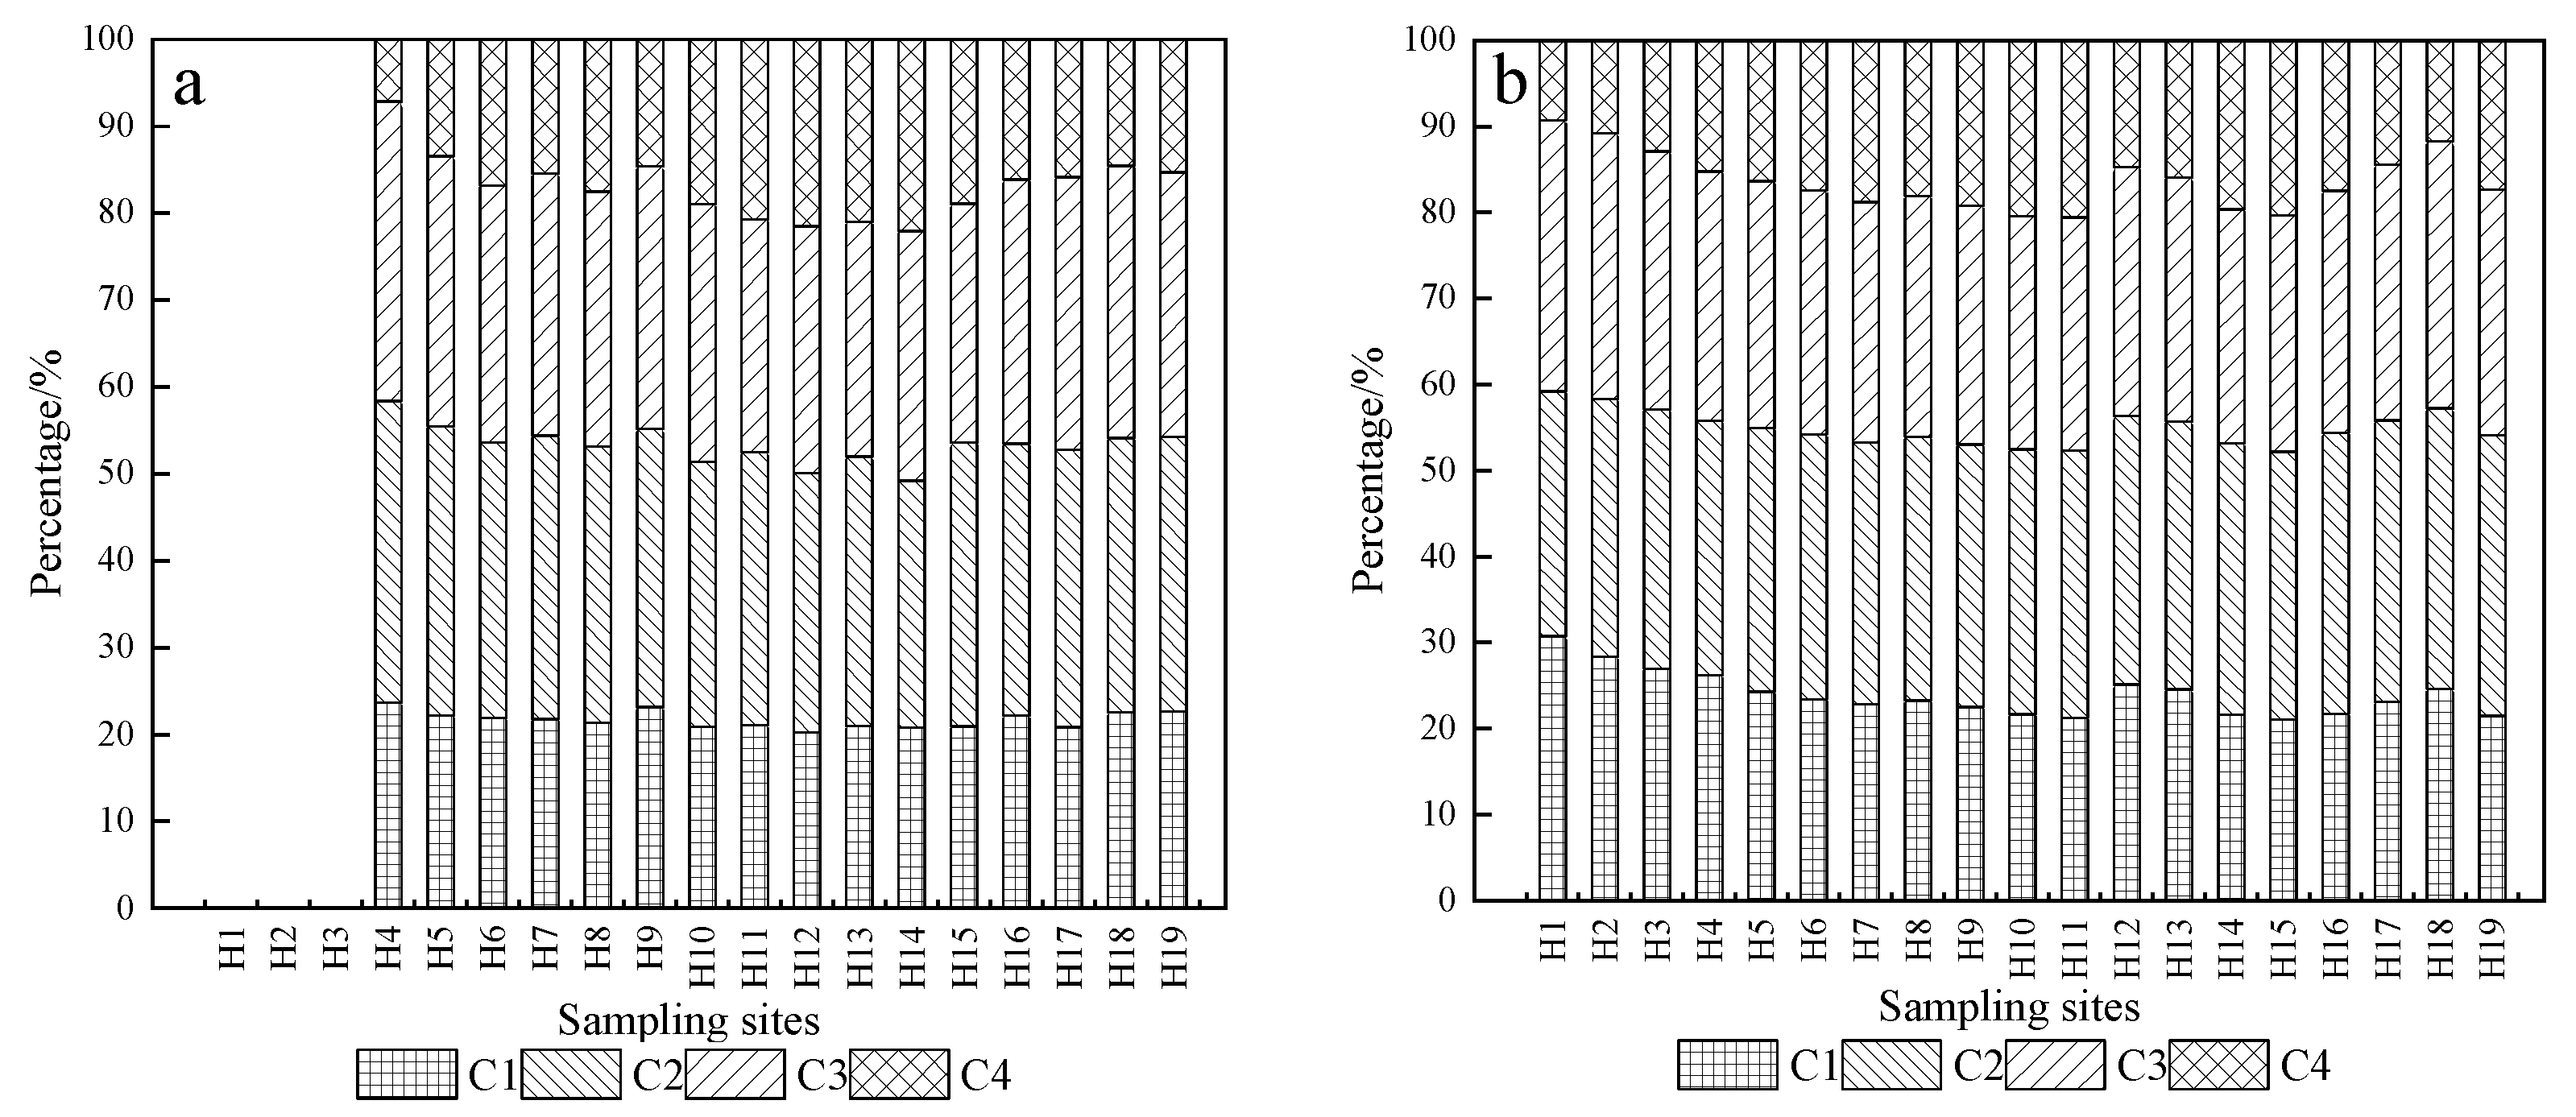
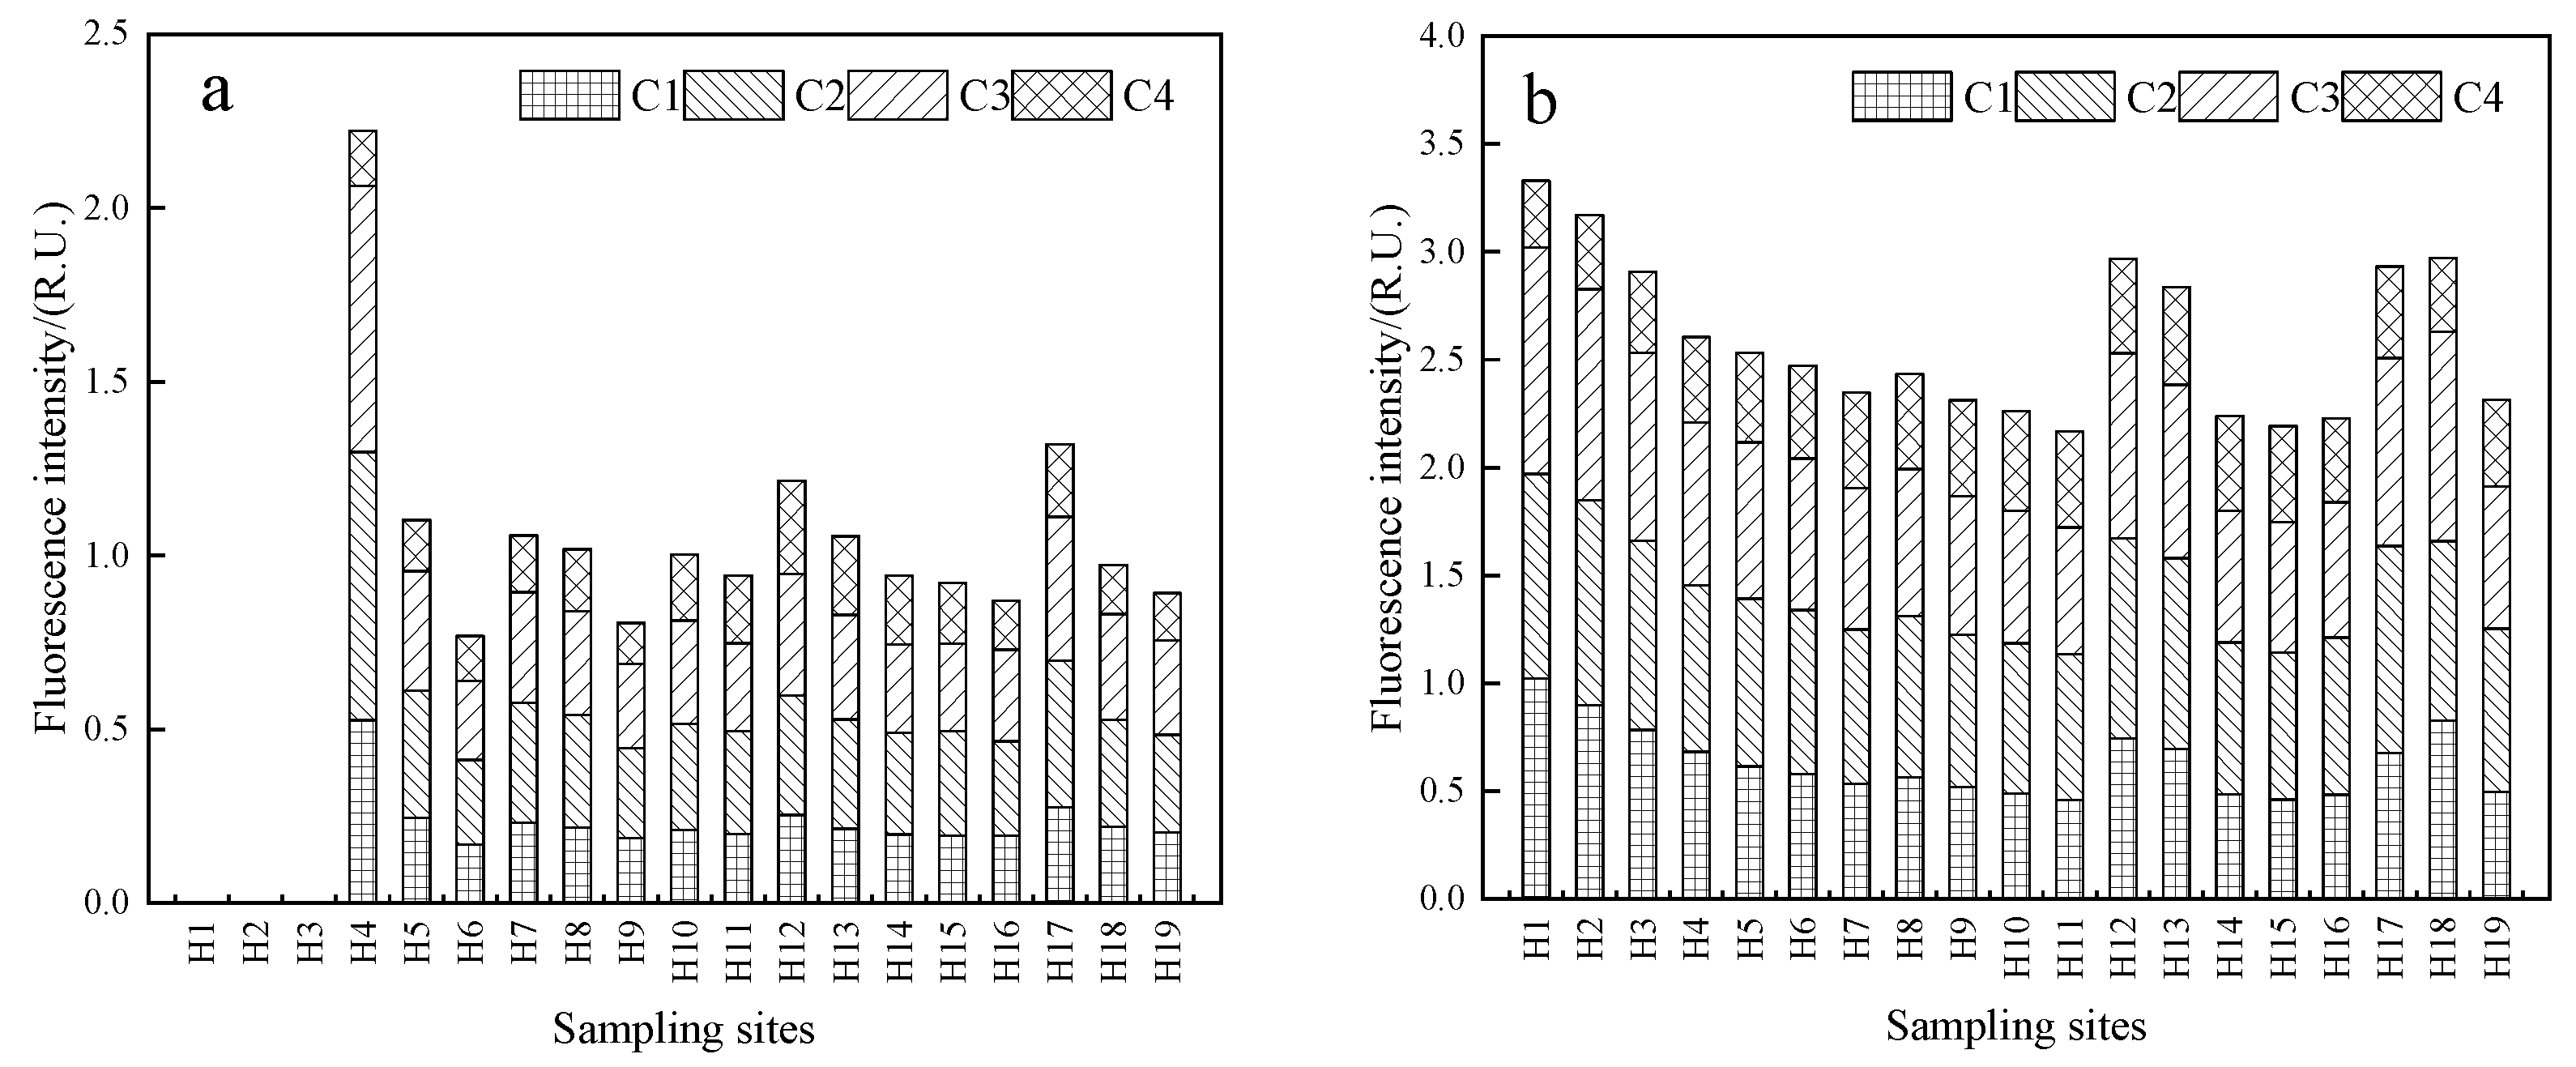
3.3. Characteristics of EEM-PARAFAC Components

Four fluorescent components (C1–C4) in the HRB during the dry and wet seasons were recognized using EEM-PARAFAC (Table 1), taking the wet season as an example (Figure 4). Based on previous studies, a lot of peaks matching the selected fluorescent components were also found. C1 corresponded to UVC-humic-like substances with high molecular weights [40]. Prior studies showed that C1 is usually abundant in the allochthonous terrestrially derived DOM [41]. While C2 resembled UVA-humic-like substances with low molecular weight [42]. Furthermore, C3 resembled marine humic-like substances. The fluorescence maxima of C3 were shifted towards lower excitation wavelengths (blue shift) relative to the peak M. Parlanti et al. [43] demonstrated that biological activity was closely related to the blue-shifted fluorescence phenomenon. Finally, C4 was similar to the tryptophan-like fluorophore. Zhao et al. [44] found that C4 originating from autochthonous sources is closely associated with microbial activities and autochthonous DOM production. In summary, C1, C2, and C3 were assigned as allochthonous humic-like substances, whereas C4 was characterized as autochthonous protein-like substances.
To better research the variation in DOM in the HRB from the upstream to the downstream, percentages and fluorescence intensities of four fluorescent components in our samples were evaluated. As shown in Figure 5, C1, C2, C3, and C4 during the dry season accounted for 21.8%, 31.7%, 30.1%, and 16.4%, respectively. Whereas C1, C2, C3, and C4 during the wet season accounted for 24.1%, 31.9%, 28.7%, and 15.3%, respectively. In particular, the percentages of humic-like substances during the dry and wet seasons were 83.6% and 84.7%, respectively. The results showed that DOM in the HRB was dominated by terrestrially derived humic-like substances, which was consistent with other studies on DOM characteristics affected by humic substances in forests. Liu et al. [46] studied the sources and characteristics of DOM in a drinking water reservoir located in a cold-temperate forest, which showed that terrestrial-sourced humic-like substances were the dominant DOM in the studied reservoir and inflowing rivers. Therefore, humic substances in forests had an important impact on natural waters.
The total fluorescence intensities of the four components (C1–C4) displayed a decreasing trend from the upstream to the downstream (Figure 6). The total fluorescence intensity at each site during the wet season was significantly stronger than that during the dry season. In addition, sites H1–H3 in the background area during the wet season had stronger fluorescence intensities. This could be attributed to large amounts of humic substances in forests being transported into the HRB during the wet season, especially in the headwaters.

3.4. Fluorescence Parameters
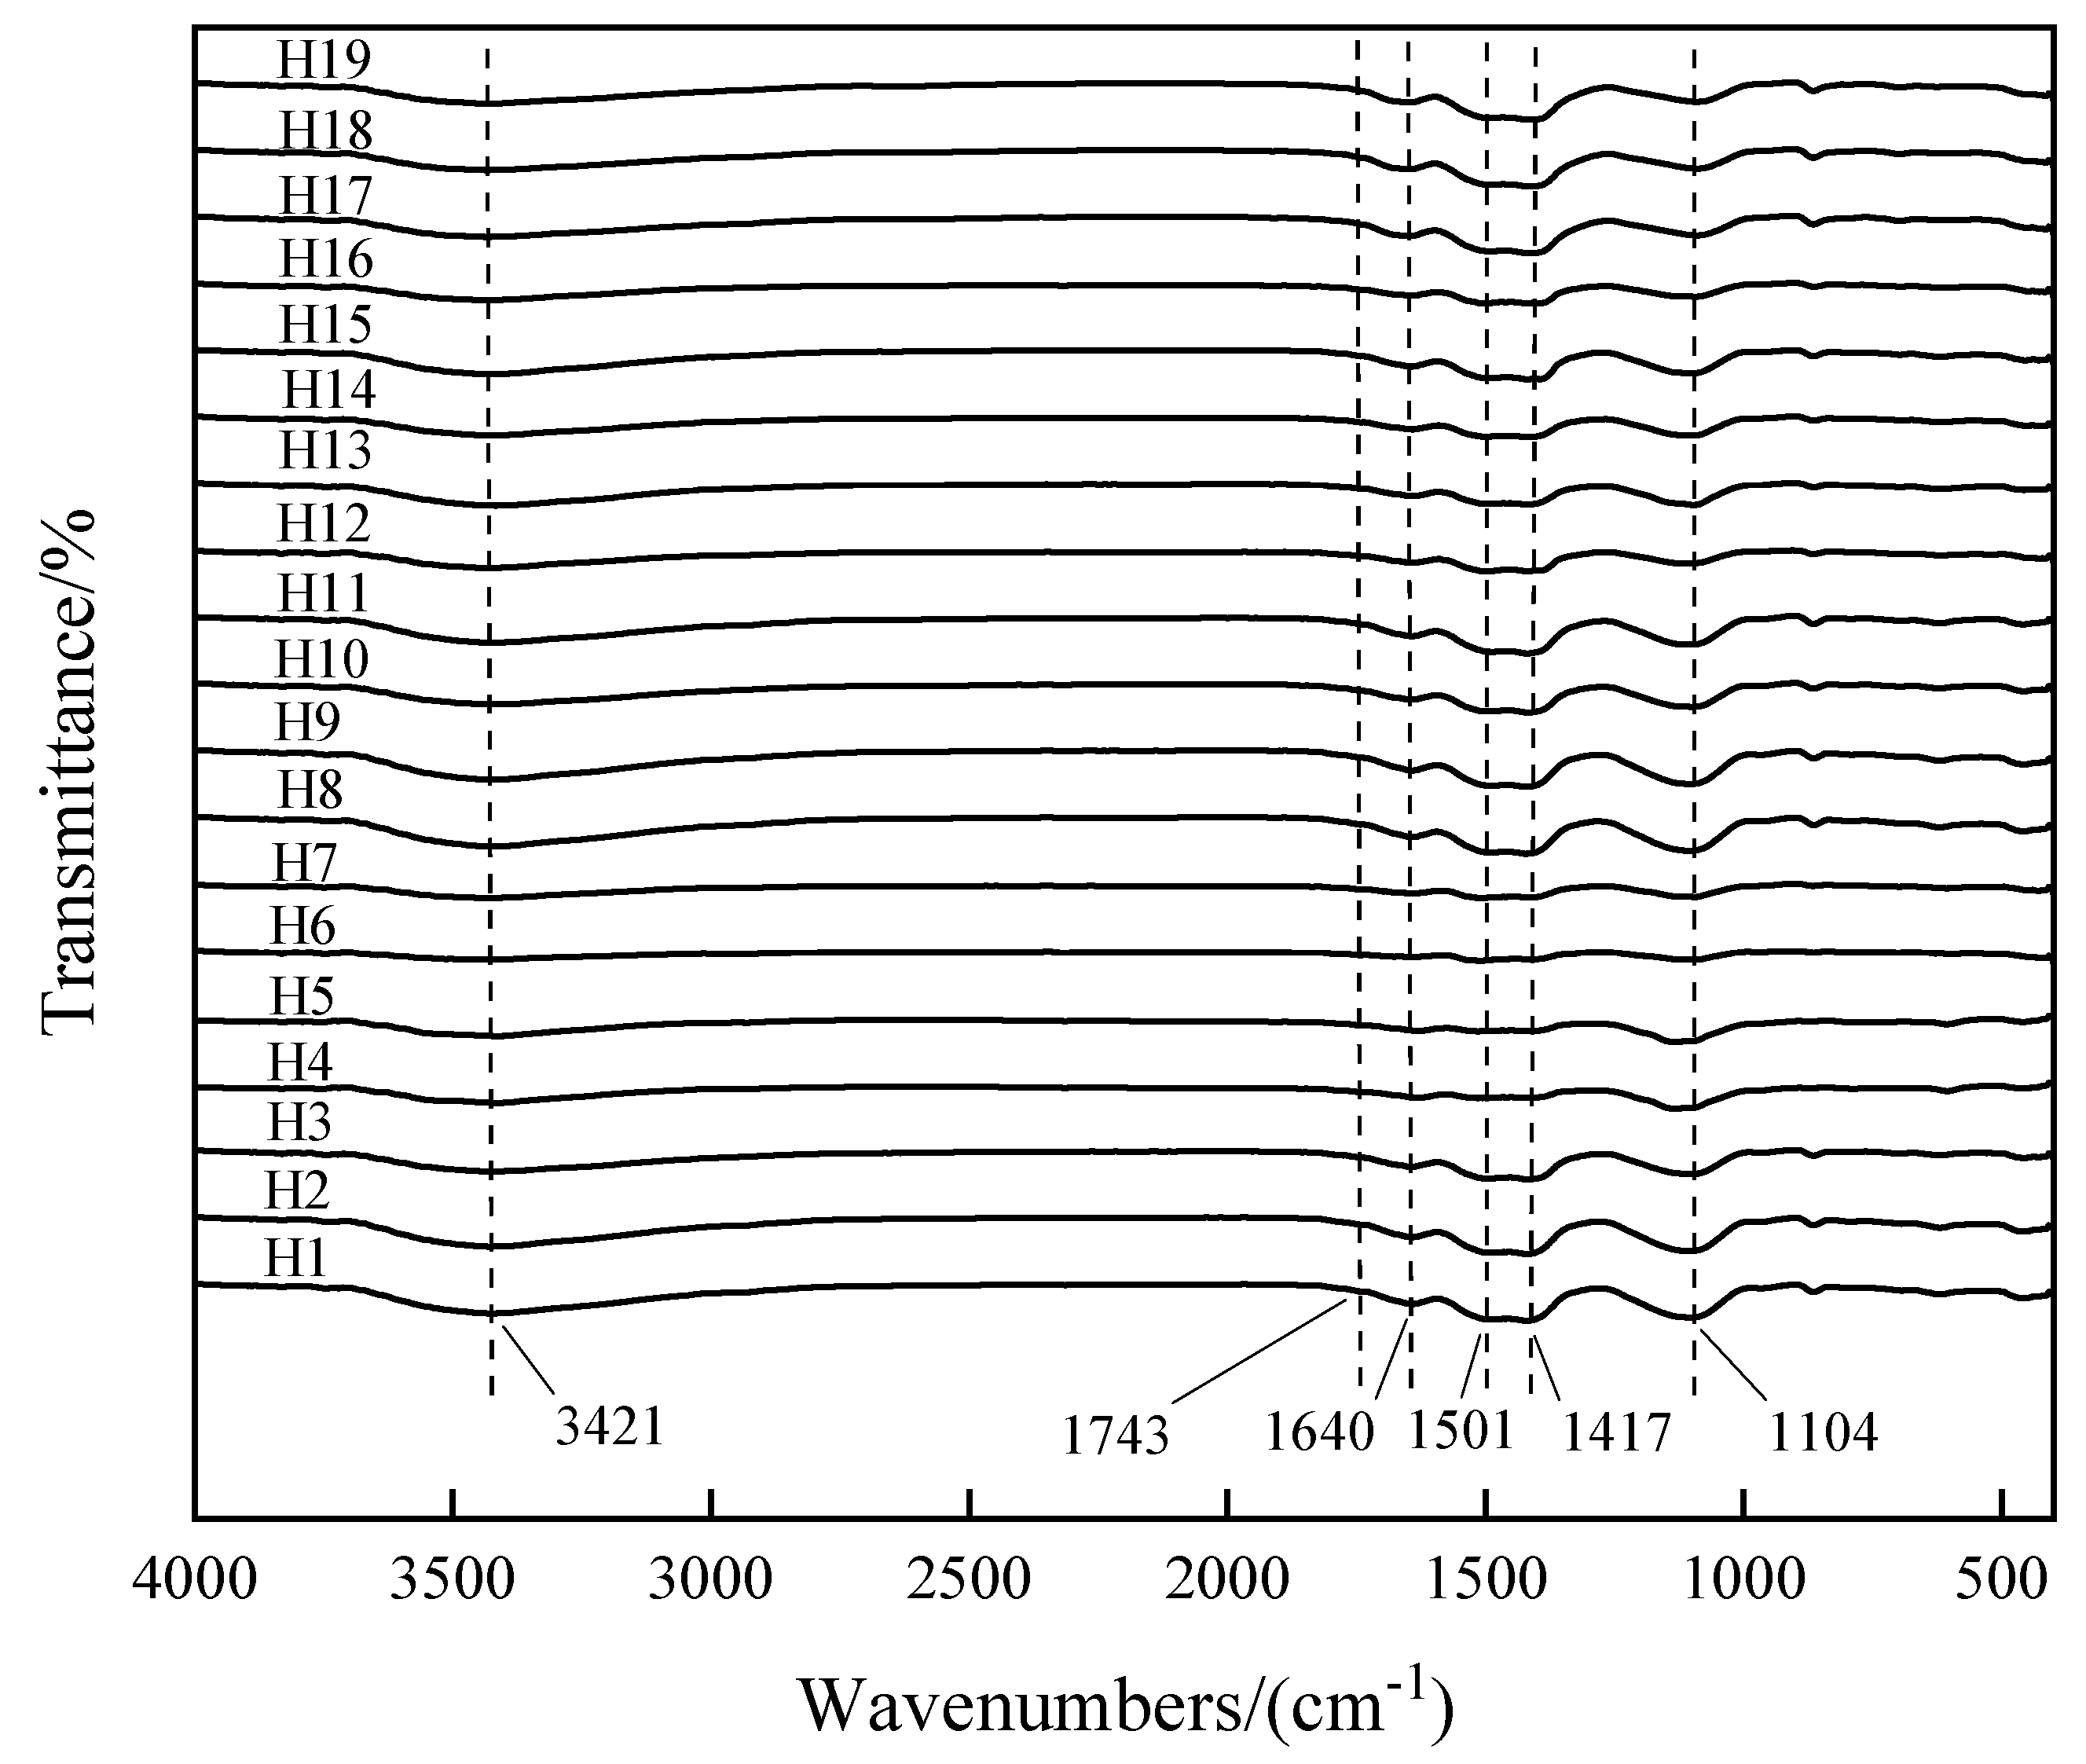
Table 2 presents the fluorescence parameters of DOM during the dry and wet seasons. FI values were between 1.4 and 1.9, which implies that the DOM originated from terrestrial and microbial sources [30]. HIX values were above 4, indicating that DOM in the HRB displayed a humic character [34]. HIX values during the wet season were significantly higher than those during the dry season, indicating that the humification degree of DOM during the wet season was significantly higher than that during the dry season. Overall, HIX values displayed a decreasing trend from the upstream to the downstream, suggesting that the headwaters had a higher humification degree. The HIX values in the Huma River mainstem were higher than those in the Huma River tributary. Thus, the humification degree of DOM in the Huma River mainstem was higher than that in the Huma River tributary. Moreover, BIX values were less than 1. This revealed that DOM in the HRB had fewer authigenic components [34].

3.5. FT-IR Spectra

The structure of DOM was characterized by comparing the absorption peaks of FT-IR spectra. Due to the complexity of DOM, there will be an overlap among the absorption bands. FT-IR spectra of samples during the dry and wet seasons showed a similar trend, taking the wet season as an example (Figure 7). The strong absorption band around 3421 cm−1 could originate from the overlap of O-H stretching of alcohol, phenol, carbohydrate, and carboxylic acid compounds [35]. The result showed that DOM contained lots of hydroxyl and carboxyl groups. The band around 1743 cm−1 because of C=O stretching was a weak peak or a shoulder peak [47]. The band around 1640 cm−1 originated from the stretching of C=C and C=O in the amide Ⅰ band, while the band near 1417 cm−1 was associated with N-H bending and C-N stretching of the amide Ⅱ band [48]. The result indicated that DOM in the HRB had protein-like substances. In addition, the band around 1501 cm−1 represented bonds with C-H bending in aliphatic alkane structures [49]. There was a strong absorption band around 1104 cm−1, which could result from the vibrational coupling of C-O stretching of carbohydrate, ether and ester compounds. Hence, the functional groups showed that DOM in the HRB contained aromatic, aliphatic, carbohydrate, and protein compounds.

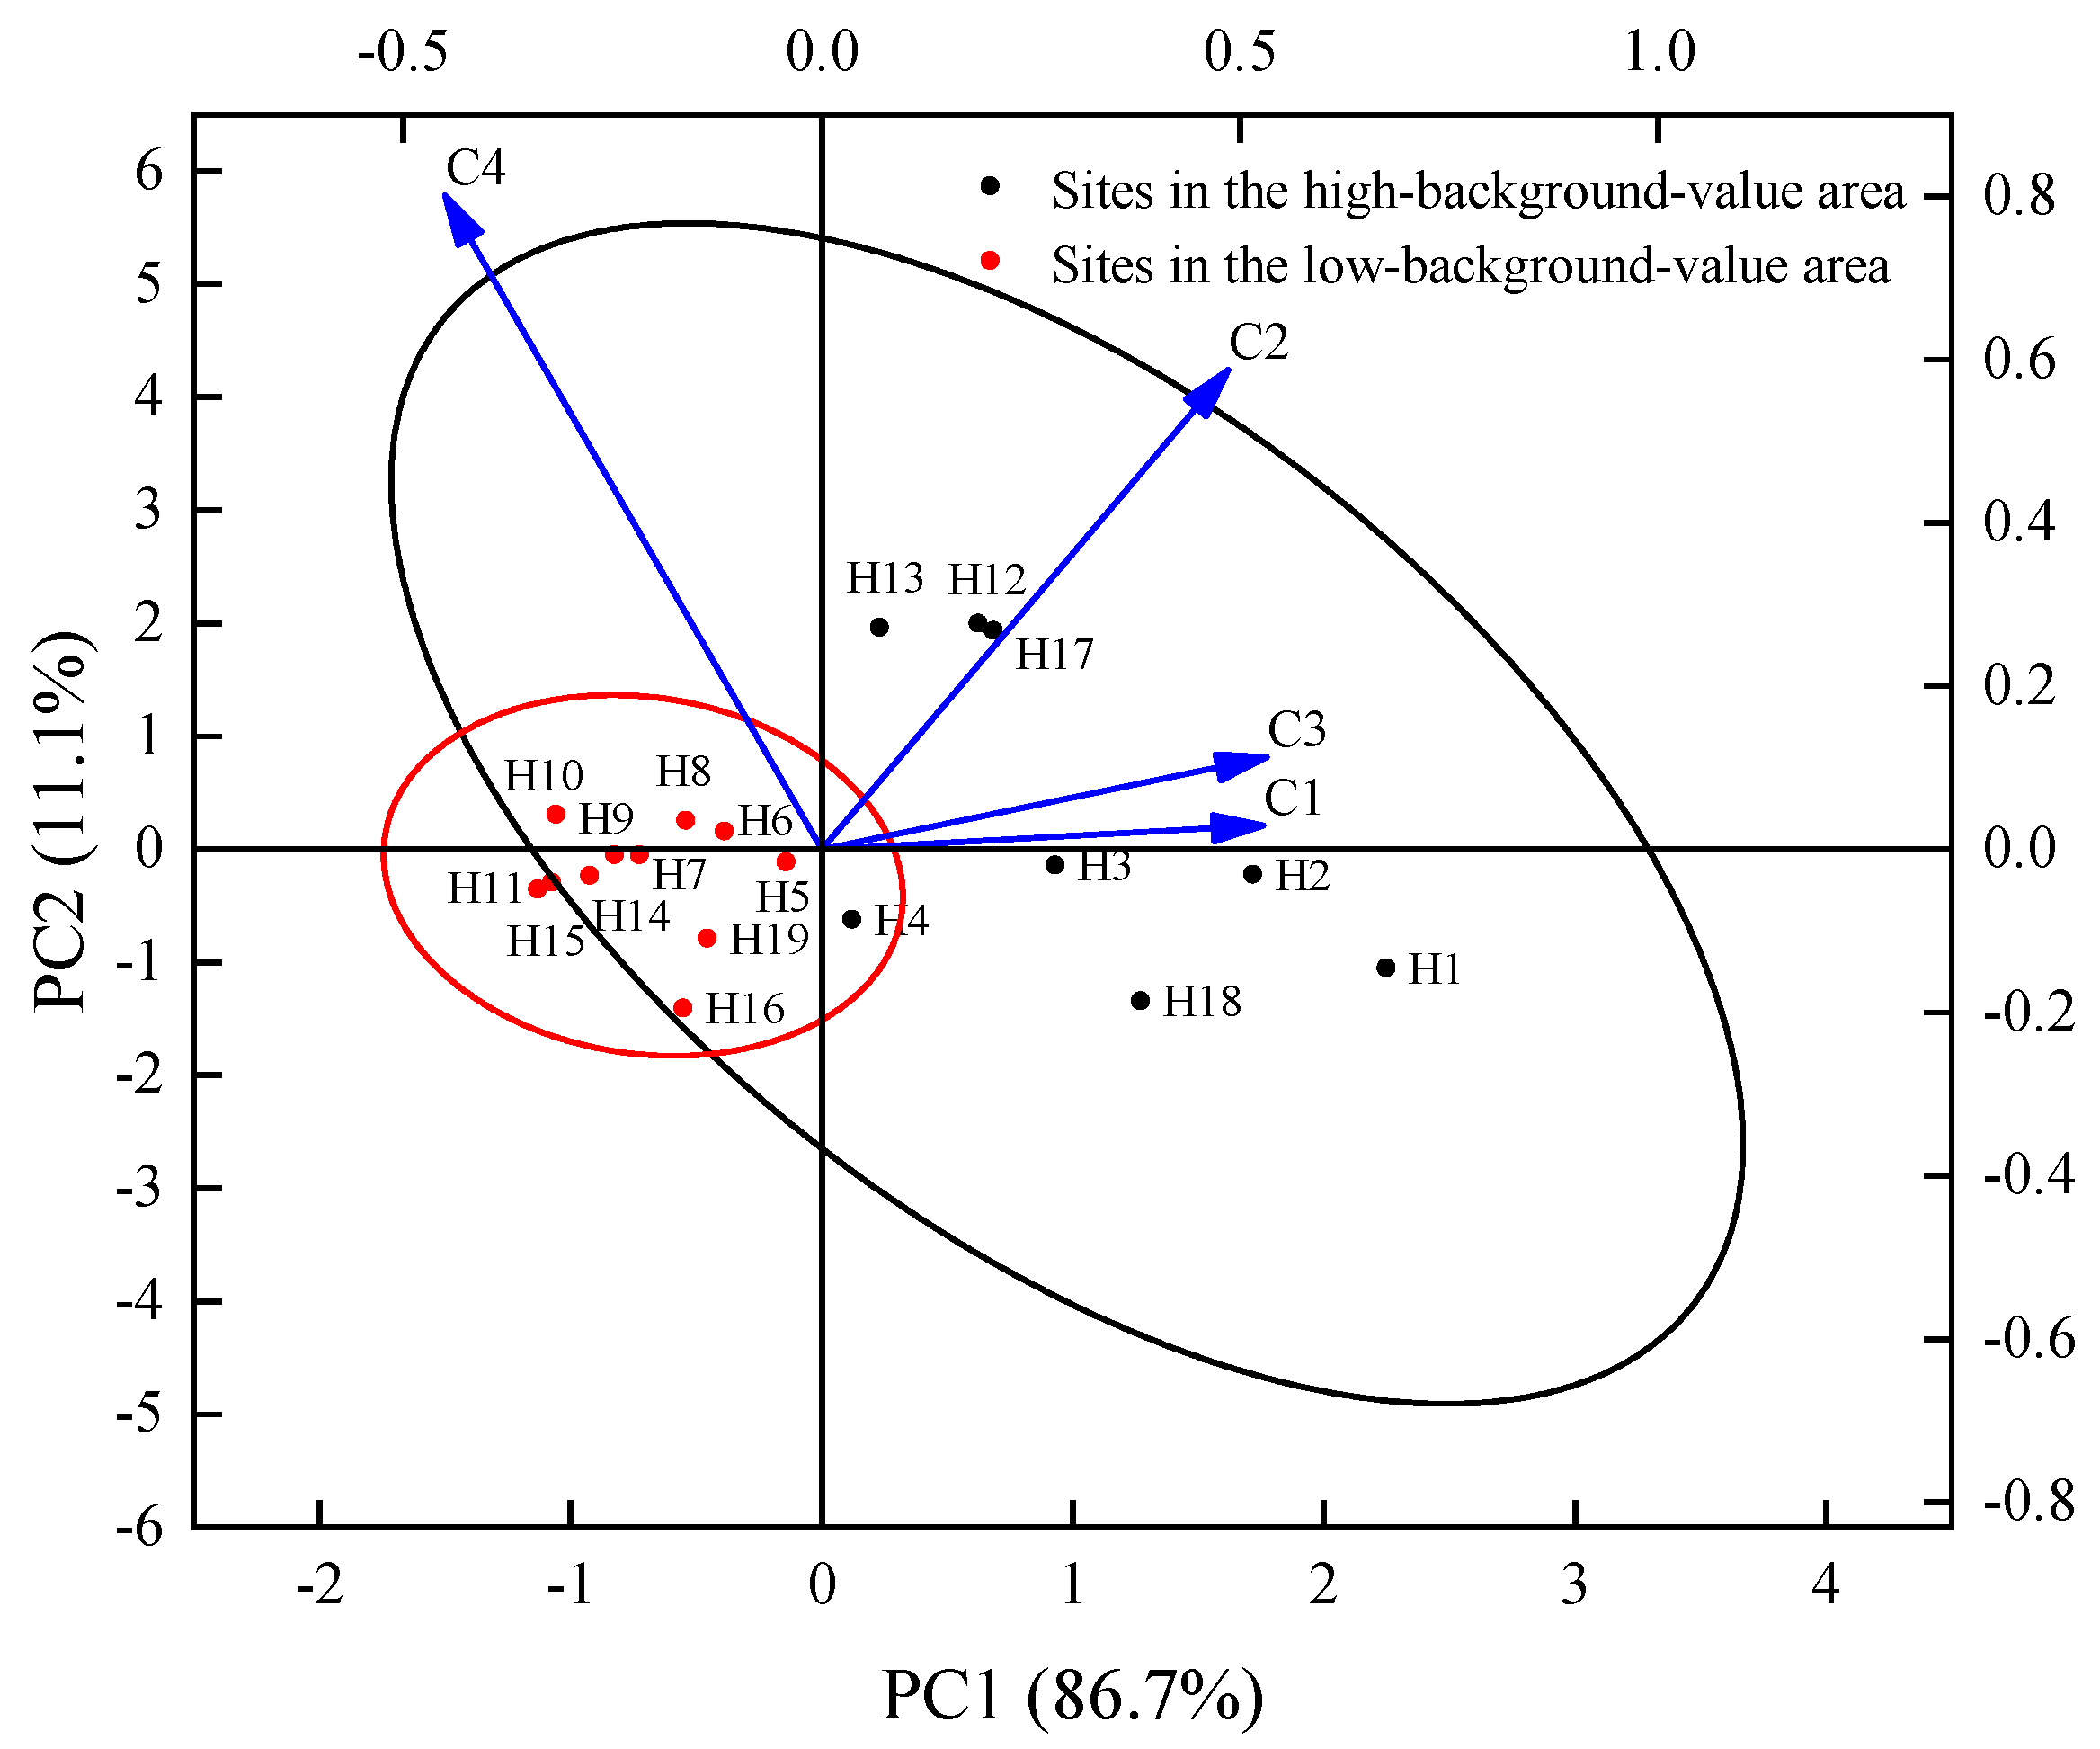
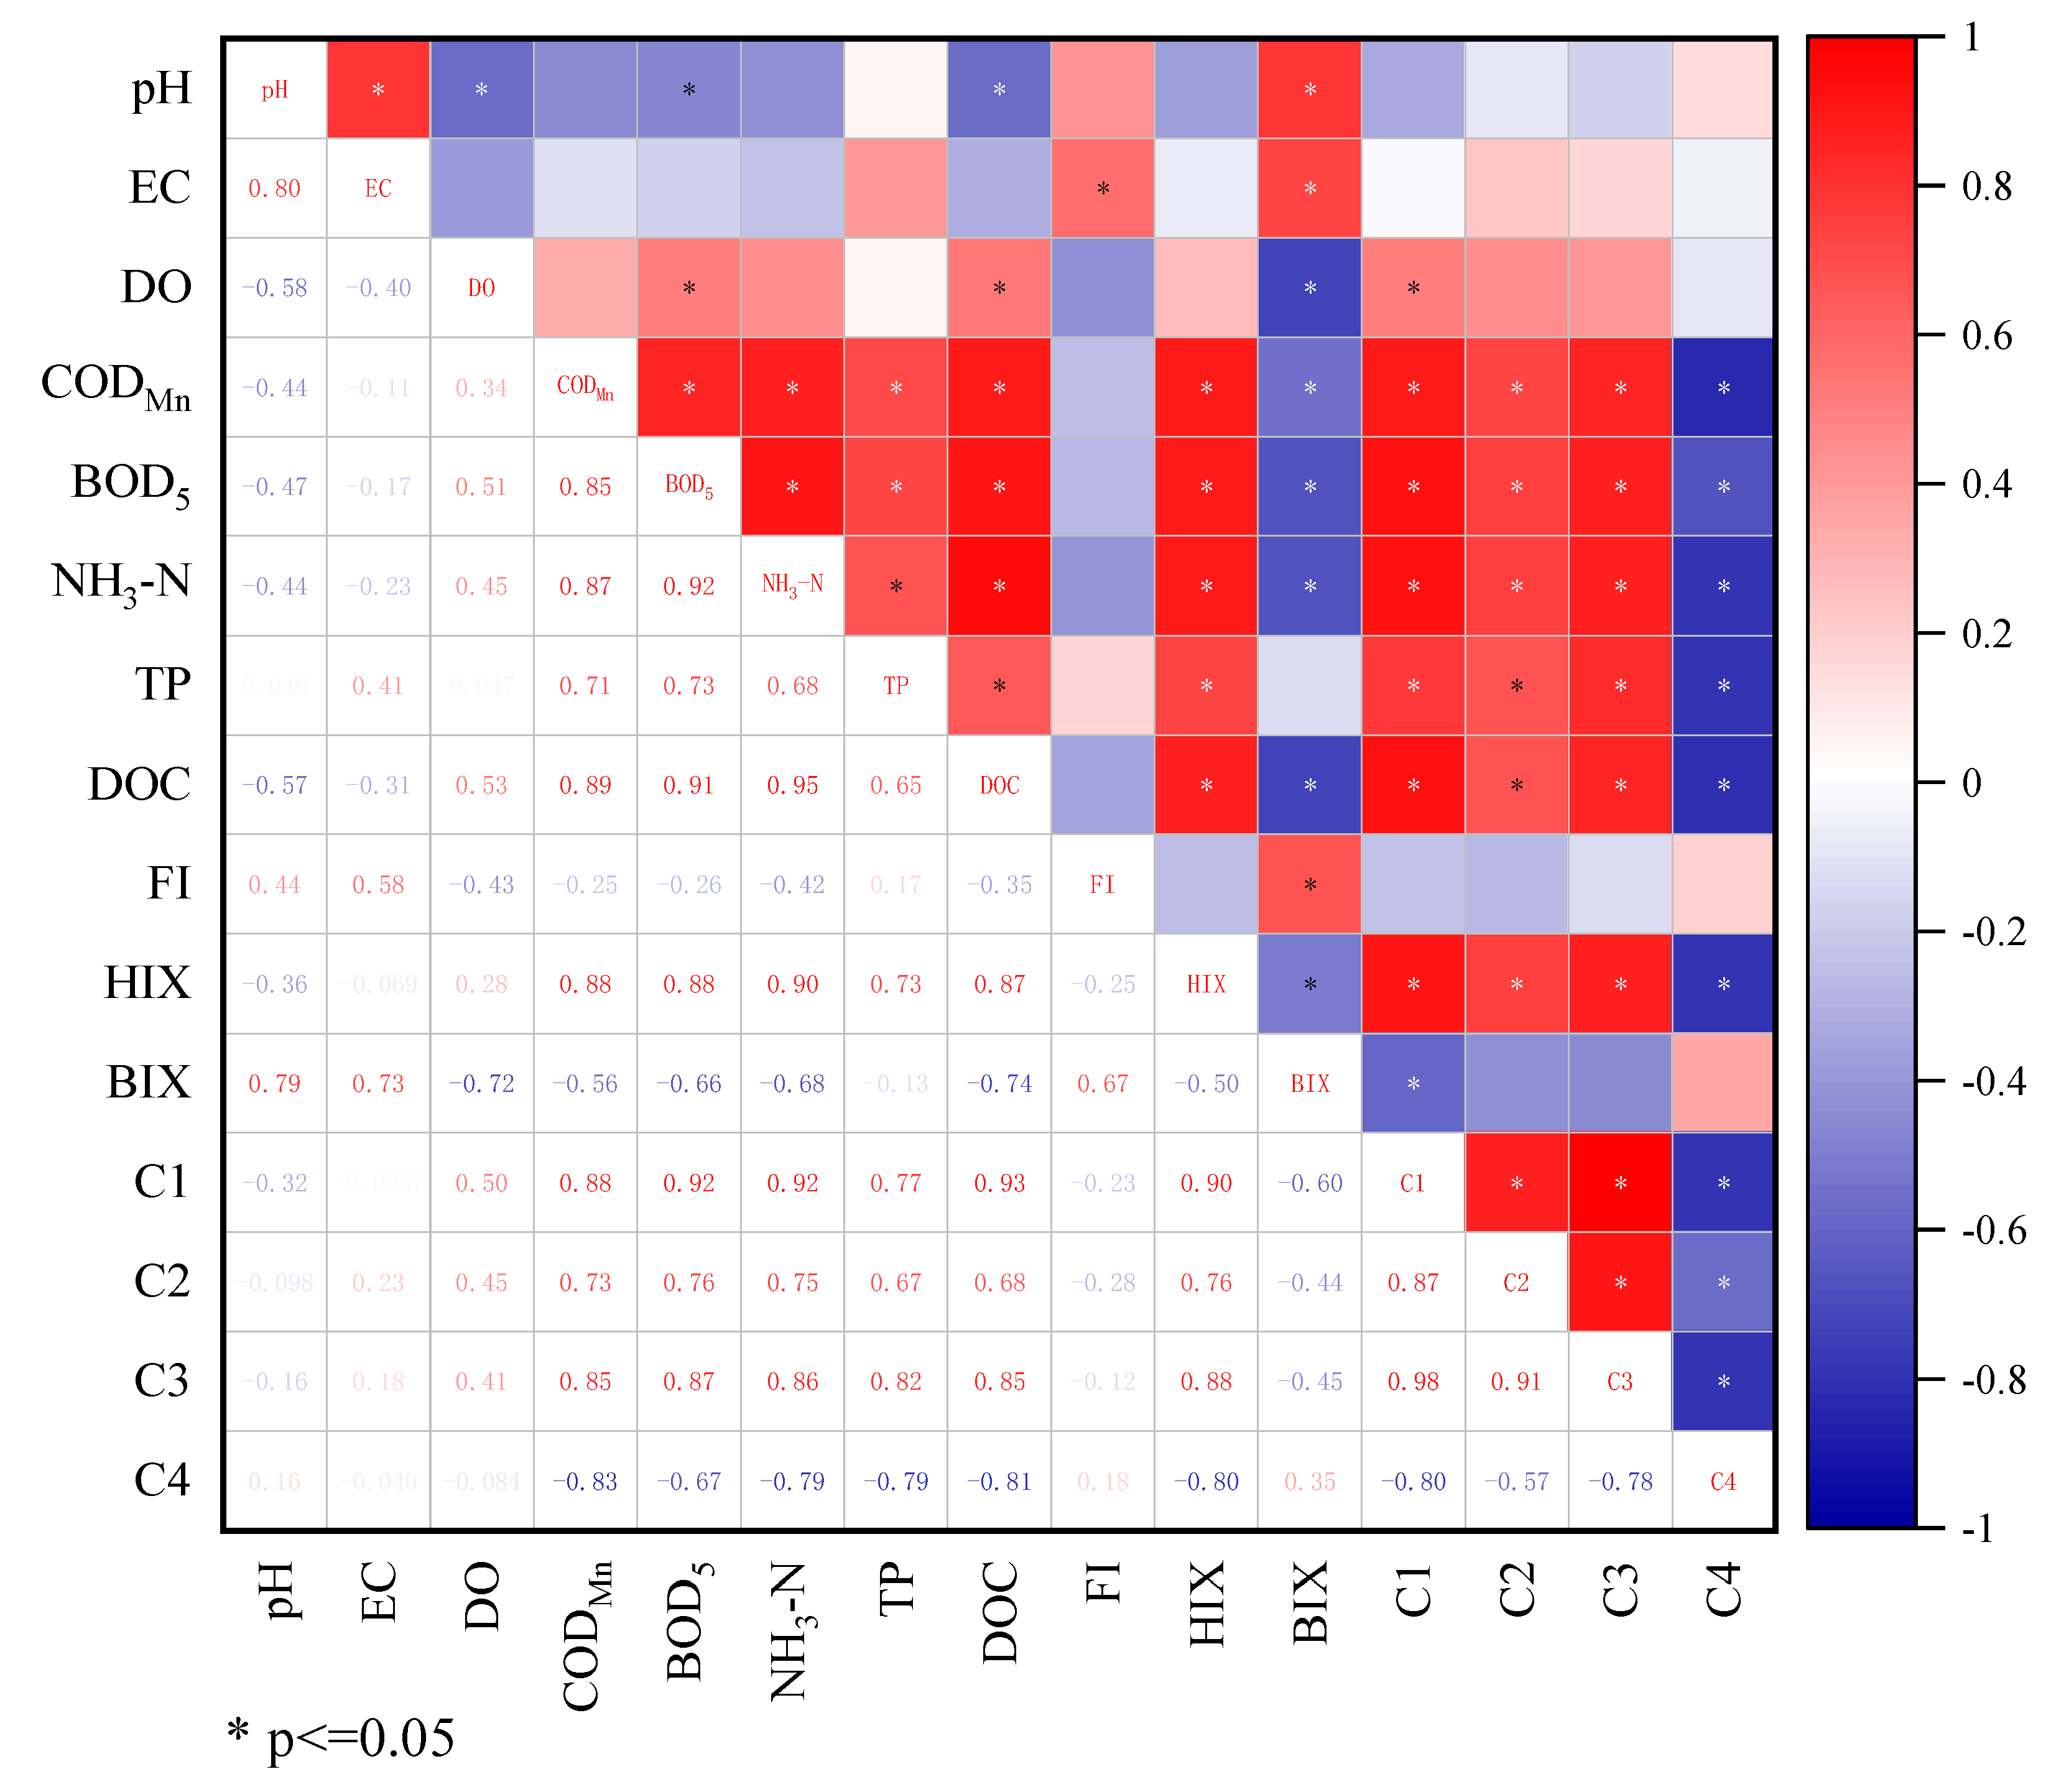
3.6. PCA and Correlation Coefficient Matrix Analysis

Statistical analysis was performed to further study DOM characteristics. The data matrix constructed in PCA was based on four PARAFAC components (C1–C4) from all 19 sampling sites during the wet season. According to our sampling design and fluorescence intensities of 19 sampling sites (Figure 6b), the sampling sites were divided into two groups in this study. Specifically, group A was the high-background-value area, and group B was the low-background-value area. The first two principal components explained 97.8% of the total variance. In detail, the first principal component (PC1) and the second principal component (PC2) were 86.7% and 11.1%, respectively. The biplot, including loading values and scores, is presented in Figure 8. The three humic-like components (C1–C3) had higher PC1 loading values, while the protein-like component (C4) had higher PC2 loading value. Notably, C1, C2, and C3 were clustered in the right quadrant, which had positive PC1 loadings and PC2 loadings. However, C4 was alone in the left quadrant, with negative PC1 loadings and positive PC2 loadings. Previous studies found that the loading values of principal components could clearly distinguish samples originating from allochthonous and autochthonous sources [50]. Hence, it was concluded that the DOM was mainly derived from terrestrial humic-like substances represented by PC1, followed by autogenic protein-like substances represented by PC2. Additionally, PC1 and PC2 scores from 19 sampling sites displayed the spatial variations in the HRB. In the high-background-value area, except for the H12, H13, and H17 sites, the PC1 scores of the others were greater than their PC2 scores. On the contrary, in the low-background-value area, except for the H16 and H19 sites, the PC1 scores of the others were lower than their PC2 scores. The distribution of the PC1 and PC2 scores showed that the content of humic-like components in the high-background-value area was greater than that in the low-background-value area, but the content of the protein-like component exhibited an opposite phenomenon. Significantly, PC2 was only responsible for an 11.1% variance. Thus, PC2 may be less valuable than PC1 with respect to assessing their contributions. Consequently, PC1 distributions revealed that humic-like components were dominant in the HRB.
The Pearson correlation coefficients (r) among selected parameters are presented in Figure 9. There were clear positive relationships among the fluorescence intensities of C1, C2, and C3 (r > 0.87, p < 0.05), suggesting that they might have a common source and a similar transport process [51]. Meanwhile, the first three fluorescence intensities exhibited strongly positive relationships with CODMn and DOC concentrations (r > 0.68, p < 0.05), which suggested that CODMn and DOC were mainly derived from humic-like substances. The result revealed the reason why CODMn concentrations during the wet season were unnaturally high, particularly in the headwaters of the HRB. Moreover, the first three fluorescence intensities were positively correlated with HIX values but negatively related to BIX values. HIX values were also negatively related to BIX values (r = −0.50, p < 0.05). Therefore, the humification degree was higher than the biodegradation degree in the HRB.

4. Conclusions

We studied seasonal and spatial variations in the optical characteristics of DOM in the HRB affected by humic substances in forests using spectroscopic techniques combined with statistical analysis. DOM in the HRB displayed obvious characteristics during the dry and wet seasons. Water quality parameters analysis showed that CODMn concentrations during the wet season were unnaturally high, particularly in the headwaters of the HRB. UV-visible parameters showed that DOM during the wet season had higher molecular weight than that during the dry season. EEM-PARAFAC recognized four characteristic components, representing humic-like substances (C1, C2, and C3) and protein-like substances (C4). Terrestrially derived DOM mainly flowed into the HRB via rainfall and runoff during the wet season. FT-IR spectra showed that DOM in the HRB contained aromatic, aliphatic, carbohydrate, and protein compounds. PCA results revealed that humic-like components explained approximately 86.7% of the total variance. Correlation coefficient matrix analysis indicated that CODMn and DOC were mainly derived from humic-like substances. Thus, the background value in the HRB was mainly attributed to terrestrial humic-like substances. Our results can help establish a scientific water quality evaluation standard for rivers with high background values.

Author Contributions

D.Z.: concept, sample collection, data collection, statistical analysis, and manuscript preparation. F.M. and Y.W.: guidance and manuscript corrections. L.Z.: manuscript preparation. H.X., Z.L. and J.Z.: sample collection and investigation. All authors have read and agreed to the published version of the manuscript.

Funding

This work was supported by National Major Science and Technology Program for Water Pollution Control and Treatment of China, grant number (2015ZX07201-008, 2017ZX07302-002) and Heilongjiang Province Environmental Protection Commonweal Trade Scientific Research ([2020]4513).

Data Availability Statement

All data generated or analyzed during this study are included in this published article.

Acknowledgments

We would like to thank Chinese Research Academy of Environmental Sciences, China National Environmental Monitoring Centre, and the Greater Khingan Ecological Environmental Monitoring Center in Heilongjiang Province, China.

Conflicts of Interest

The authors declare no conflict of interest.

References

  1. Chen, W.; Westerhoff, P.; Leenheer, J.A.; Booksh, K. Fluorescence excitation—Emission matrix regional integration to quantify spectra for dissolved organic matter. Environ. Sci. Technol. 2003, 37, 5701–5710. [Google Scholar] [CrossRef] [PubMed]
  2. Cilenti, A.; Provenzano, M.R.; Senesi, N. Characterization of dissolved organic matter from saline soils by fluorescence spectroscopy. Environ. Chem. Lett. 2005, 3, 53–56. [Google Scholar] [CrossRef]
  3. Jiang, F.H.; Yang, B.J.; Lee, F.S.C.; Wang, X.R.; Cao, X. Multivariate analysis of fluorescence and source identification of dissolved organic matter in Jiaozhou Bay, China. Acta Oceanol. Sin. 2009, 28, 60–72. [Google Scholar]
  4. Spencer, R.G.M.; Aiken, G.R.; Wickland, K.P.; Striegl, R.G.; Hernes, P.J. Seasonal and spatial variability in dissolved organic matter quantity and composition from the Yukon River basin, Alaska. Glob. Biogeochem. Cycle 2008, 22, GB4002. [Google Scholar] [CrossRef]
  5. Cui, H.; Wang, J.X.; Liu, T.; Qu, X.L. Spatial and seasonal patterns of dissolved organic matter hydrophobicity in Lake Taihu revealed by the aqueous two-phase system. Sci. Total Environ. 2021, 776, 145892. [Google Scholar] [CrossRef]
  6. Fan, C.H.; Chang, M.; Zhang, Y.C. Spectral Characteristics of Dissolved Organic Matter (DOM) Derived from Water and Sediment in Normal Flow Period of the Intersection Zone of Jing River and Wei River. Spectrosc. Spectr. Anal. 2016, 36, 2863–2869. [Google Scholar] [CrossRef]
  7. Liu, S.S.; Zhu, Y.R.; Liu, L.Z.; He, Z.Q.; Giesy, J.P.; Bai, Y.C.; Sun, F.H.; Wu, F.C. Cation-induced coagulation of aquatic plant-derived dissolved organic matter: Investigation by EEM-PARAFAC and FT-IR spectroscopy. Environ. Pollut. 2018, 234, 726–734. [Google Scholar] [CrossRef]
  8. Liu, S.S.; Zhu, Y.R.; Wu, F.C.; Meng, W.; He, Z.Q.; Giesy, J.P. Characterization of plant-derived carbon and phosphorus in lakes by sequential fractionation and NMR spectroscopy. Sci. Total Environ. 2016, 566, 1398–1409. [Google Scholar] [CrossRef]
  9. Liu, S.S.; He, Z.Q.; Tang, Z.; Liu, L.Z.; Hou, J.W.; Li, T.T.; Zhang, Y.H.; Shi, Q.; Giesy, J.P.; Wu, F.C. Linking the molecular composition of autochthonous dissolved organic matter to source identification for freshwater lake ecosystems by combination of optical spectroscopy and FT-ICR-MS analysis. Sci. Total Environ. 2020, 703, 134764. [Google Scholar] [CrossRef]
  10. Hansen, A.M.; Kraus, T.E.C.; Pellerin, B.A.; Fleck, J.A.; Downing, B.D.; Bergamaschi, B.A. Optical properties of dissolved organic matter (DOM): Effects of biological and photolytic degradation. Limnol. Oceanogr. 2016, 61, 1015–1032. [Google Scholar] [CrossRef]
  11. Bernier, M.H.; Levy, G.J.; Fine, P.; Borisover, M. Organic matter composition in soils irrigated with treated wastewater: FT-IR spectroscopic analysis of bulk soil samples. Geoderma 2013, 209, 233–240. [Google Scholar] [CrossRef]
  12. Peng, N.; Wang, K.F.; Tu, N.Y.; Liu, Y.; Li, Z.L. Fluorescence regional integration combined with parallel factor analysis to quantify fluorescencent spectra for dissolved organic matter released from manure biochars. RSC Adv. 2020, 10, 31502–31510. [Google Scholar] [CrossRef] [PubMed]
  13. Nguyen, H.V.M.; Shin, J.K.; Hur, J. Multivariate analysis for spatial distribution of dissolved organic matters in a large river-type dam reservoir. Environ. Monit. Assess. 2011, 183, 425–436. [Google Scholar] [CrossRef] [PubMed]
  14. Yu, H.B.; Song, Y.H.; Du, E.D.; Yang, N.; Peng, J.F.; Liu, R.X. Comparison of PARAFAC components of fluorescent dissolved and particular organic matter from two urbanized rivers. Environ. Sci. Pollut. Res. 2016, 23, 10644–10655. [Google Scholar] [CrossRef] [PubMed]
  15. Wang, X.N.; Wu, Y.; Bao, H.Y.; Gan, S.C.; Zhang, J. Sources, Transport, and Transformation of Dissolved Organic Matter in a Large River System: Illustrated by the Changjiang River, China. J. Geophys. Res.-Biogeosci. 2019, 124, 3881–3901. [Google Scholar] [CrossRef]
  16. Chen, S.; Lu, Y.; Dash, P.; Das, P.; Li, J.; Capps, K.; Majidzadeh, H.; Elliott, M. Hurricane pulses: Small watershed exports of dissolved nutrients and organic matter during large storms in the Southeastern USA. Sci. Total Environ. 2019, 689, 232–244. [Google Scholar] [CrossRef]
  17. Li, S.Y.; Luo, J.C.; Xu, Y.J.; Zhang, L.Q.; Ye, C. Hydrological seasonality and nutrient stoichiometry control dissolved organic matter characterization in a headwater stream. Sci. Total Environ. 2022, 807, 150843. [Google Scholar] [CrossRef]
  18. Hawkes, J.A.; Radoman, N.; Bergquist, J.; Wallin, M.B.; Tranvik, L.J.; Lofgren, S. Regional diversity of complex dissolved organic matter across forested hemiboreal headwater streams. Sci. Rep. 2018, 8, 16060. [Google Scholar] [CrossRef]
  19. Huang, W.; McDowell, W.H.; Zou, X.M.; Ruan, H.H.; Wang, J.S.; Ma, Z.L. Qualitative differences in headwater stream dissolved organic matter and riparian water-extractable soil organic matter under four different vegetation types along an altitudinal gradient in the Wuyi Mountains of China. Appl. Geochem. 2015, 52, 67–75. [Google Scholar] [CrossRef]
  20. Evans, C.D.; Monteith, D.T.; Cooper, D.M. Long-term increases in surface water dissolved organic carbon: Observations, possible causes and environmental impacts. Environ. Pollut. 2005, 137, 55–71. [Google Scholar] [CrossRef]
  21. Blanchet, C.C.; Arzel, C.; Davranche, A.; Kahilainen, K.K.; Secondi, J.; Taipale, S.; Lindberg, H.; Loehr, J.; Manninen-Johansen, S.; Sundell, J.; et al. Ecology and extent of freshwater browning-What we know and what should be studied next in the context of global change. Sci. Total Environ. 2022, 812, 152420. [Google Scholar] [CrossRef] [PubMed]
  22. Specchiulli, A.; Cilenti, L.; D’Adamo, R.; Fabbrocini, A.; Guo, W.; Huang, L.; Luglie, A.; Padedda, B.M.; Scirocco, T.; Magni, P. Dissolved organic matter dynamics in Mediterranean lagoons: The relationship between DOC and CDOM. Mar. Chem. 2018, 202, 37–48. [Google Scholar] [CrossRef]
  23. Weishaar, J.L.; Aiken, G.R.; Bergamaschi, B.A.; Fram, M.S.; Fujii, R.; Mopper, K. Evaluation of specific ultraviolet absorbance as an indicator of the chemical composition and reactivity of dissolved organic carbon. Environ. Sci. Technol. 2003, 37, 4702–4708. [Google Scholar] [CrossRef] [PubMed]
  24. Oh, H.; Choi, J.H. Changes in the Dissolved Organic Matter Characteristics Released from Sediment According to Precipitation in the Namhan River with Weirs: A Laboratory Experiment. Int. J. Environ. Res. Public Health 2022, 19, 4958. [Google Scholar] [CrossRef] [PubMed]
  25. Helms, J.R.; Stubbins, A.; Ritchie, J.D.; Minor, E.C.; Kieber, D.J.; Mopper, K. Absorption spectral slopes and slope ratios as indicators of molecular weight, source, and photobleaching of chromophoric dissolved organic matter. Limnol. Oceanogr. 2008, 53, 955–969. [Google Scholar] [CrossRef]
  26. Carr, N.; Davis, C.E.; Blackbird, S.; Daniels, L.R.; Preece, C.; Woodward, M.; Mahaffey, C. Seasonal and spatial variability in the optical characterstics of DOM in a temperate shelf sea. Prog. Oceanogr. 2019, 177, 101929. [Google Scholar] [CrossRef]
  27. Lu, Y.H.; Edmonds, J.W.; Yamashita, Y.; Zhou, B.; Jaegge, A.; Baxley, M. Spatial variation in the origin and reactivity of dissolved organic matter in Oregon-Washington coastal waters. Ocean Dyn. 2015, 65, 17–32. [Google Scholar] [CrossRef]
  28. Stedmon, C.A.; Bro, R. Characterizing dissolved organic matter fluorescence with parallel factor analysis: A tutorial. Limnol. Oceanogr. Meth. 2008, 6, 572–579. [Google Scholar] [CrossRef]
  29. Lawaetz, A.J.; Stedmon, C.A. Fluorescence Intensity Calibration Using the Raman Scatter Peak of Water. Appl. Spectrosc. 2009, 63, 936–940. [Google Scholar] [CrossRef]
  30. McKnight, D.M.; Boyer, E.W.; Westerhoff, P.K.; Doran, P.T.; Kulbe, T.; Andersen, D.T. Spectrofluorometric characterization of dissolved organic matter for indication of precursor organic material and aromaticity. Limnol. Oceanogr. 2001, 46, 38–48. [Google Scholar] [CrossRef]
  31. Cory, R.M.; McKnight, D.M. Fluorescence spectroscopy reveals ubiquitous presence of oxidized and reduced quinones in dissolved organic matter. Environ. Sci. Technol. 2005, 39, 8142–8149. [Google Scholar] [CrossRef] [PubMed]
  32. Zsolnay, A.; Baigar, E.; Jimenez, M.; Steinweg, B.; Saccomandi, F. Differentiating with fluorescence spectroscopy the sources of dissolved organic matter in soils subjected to drying. Chemosphere 1999, 38, 45–50. [Google Scholar] [CrossRef] [PubMed]
  33. Chen, H.; Zheng, B.; Song, Y.; Qin, Y. Correlation between molecular absorption spectral slope ratios and fluorescence humification indices in characterizing CDOM. Aquat. Sci. 2011, 73, 103–112. [Google Scholar] [CrossRef]
  34. Huguet, A.; Vacher, L.; Relexans, S.; Saubusse, S.; Froidefond, J.M.; Parlanti, E. Properties of fluorescent dissolved organic matter in the Gironde Estuary. Org. Geochem. 2009, 40, 706–719. [Google Scholar] [CrossRef]
  35. Abdulla, H.A.N.; Minor, E.C.; Dias, R.F.; Hatcher, P.G. Changes in the compound classes of dissolved organic matter along an estuarine transect: A study using FTIR and C-13 NMR. Geochim. Cosmochim. Acta 2010, 74, 3815–3838. [Google Scholar] [CrossRef]
  36. Hensgens, G.; Laudon, H.; Peichl, M.; Gil, I.A.; Zhou, Q.; Berggren, M. The role of the understory in litter DOC and nutrient leaching in boreal forests. Biogeochemistry 2020, 149, 87–103. [Google Scholar] [CrossRef]
  37. Franklin, H.M.; Carroll, A.R.; Chen, C.R.; Maxwell, P.; Burford, M.A. Plant source and soil interact to determine characteristics of dissolved organic matter leached into waterways from riparian leaf litter. Sci. Total Environ. 2020, 703, 134530. [Google Scholar] [CrossRef]
  38. Zheng, L.C.; Song, Z.F.; Meng, P.P.; Fang, Z.Q. Seasonal characterization and identification of dissolved organic matter (DOM) in the Pearl River, China. Environ. Sci. Pollut. Res. 2016, 23, 7462–7469. [Google Scholar] [CrossRef]
  39. Ates, N.; Kitis, M.; Yetis, U. Formation of chlorination by-products. in waters with low SUVA-correlations with SUVA and differential UV spectroscopy. Water Res. 2007, 41, 4139–4148. [Google Scholar] [CrossRef]
  40. Gao, J.K.; Liang, C.L.; Shen, G.Z.; Lv, J.; Wu, H.M. Spectral characteristics of dissolved organic matter in various agricultural soils throughout China. Chemosphere 2017, 176, 108–116. [Google Scholar] [CrossRef]
  41. Stedmon, C.A.; Markager, S.; Bro, R. Tracing dissolved organic matter in aquatic environments using a new approach to fluorescence spectroscopy. Mar. Chem. 2003, 82, 239–254. [Google Scholar] [CrossRef]
  42. Harun, S.; Baker, A.; Bradley, C.; Pinay, G. Spatial and seasonal variations in the composition of dissolved organic matter in a tropical catchment: The Lower Kinabatangan River, Sabah, Malaysia. Environ. Sci.-Process Impacts 2016, 18, 137–150. [Google Scholar] [CrossRef] [PubMed]
  43. Parlanti, E.; Worz, K.; Geoffroy, L.; Lamotte, M. Dissolved organic matter fluorescence spectroscopy as a tool to estimate biological activity in a coastal zone submitted to anthropogenic inputs. Org. Geochem. 2000, 31, 1765–1781. [Google Scholar] [CrossRef]
  44. Zhao, Z.; Gonsior, M.; Luek, J.; Timko, S.; Ianiri, H.; Hertkorn, N.; Schmitt-Kopplin, P.; Fang, X.T.; Zeng, Q.L.; Jiao, N.Z.; et al. Picocyanobacteria and deep-ocean fluorescent dissolved organic matter share similar optical properties. Nat. Commun. 2017, 8, 15284. [Google Scholar] [CrossRef] [PubMed]
  45. Coble, P.G. Characterization of marine and terrestrial DOM in seawater using excitation emission matrix spectroscopy. Mar. Chem. 1996, 51, 325–346. [Google Scholar] [CrossRef]
  46. Liu, F.; Zhao, Q.; Ding, J.; Li, L.; Wang, K.; Zhou, H.; Jiang, M.; Wei, J. Sources, characteristics, and in situ degradation of dissolved organic matters: A case study of a drinking water reservoir located in a cold-temperate forest. Environ. Res. 2023, 217, 114857. [Google Scholar] [CrossRef] [PubMed]
  47. Yang, L.; Han, D.H.; Lee, B.M.; Hur, J. Characterizing treated wastewaters of different industries using clustered fluorescence EEM-PARAFAC and FT-IR spectroscopy: Implications for downstream impact and source identification. Chemosphere 2015, 127, 222–228. [Google Scholar] [CrossRef]
  48. Wang, Y.F.; Zhang, X.Y.; Zhang, X.; Meng, Q.J.; Gao, F.J.; Zhang, Y. Characterization of spectral responses of dissolved organic matter (DOM) for atrazine binding during the sorption process onto black soil. Chemosphere 2017, 180, 531–539. [Google Scholar] [CrossRef]
  49. Lin, H.; Xu, H.C.; Cai, Y.H.; Belzile, C.; Macdonald, R.W.; Guo, L.D. Dynamic changes in size-fractionated dissolved organic matter composition in a seasonally ice-covered Arctic River. Limnol. Oceanogr. 2021, 66, 3085–3099. [Google Scholar] [CrossRef]
  50. Yamashita, Y.; Boyer, J.N.; Jaffe, R. Evaluating the distribution of terrestrial dissolved organic matter in a complex coastal ecosystem using fluorescence spectroscopy. Cont. Shelf Res. 2013, 66, 136–144. [Google Scholar] [CrossRef]
  51. Wu, Y.W.; Li, Y.J.; Lv, J.J.; Xi, B.D.; Zhang, L.Y.; Yang, T.X.; Li, G.W.; Li, C.L.; Liu, H.L. Influence of sediment DOM on environmental factors in shallow eutrophic lakes in the middle reaches of the Yangtze River in China. Environ. Earth Sci. 2017, 76, 142. [Google Scholar] [CrossRef]
Figure 1. Study area with sampling sites in the Huma River Basin, China.
Water 15 01579 g001
Figure 2. Seasonal and spatial variations in water quality parameters. (a) pH; (b) EC; (c) DO; (d) CODMn; (e) BOD5; (f) NH3-N; (g) TP; (h) DOC.
Water 15 01579 g002aWater 15 01579 g002b
Figure 3. Seasonal and spatial variations of UV-visible spectral parameters. (a) UV254; (b) SUVA254; (c) S275–295; (d) S350–400; (e) SR.
Water 15 01579 g003
Figure 4. Spectral characteristics of four PARAFAC components during the wet season. Two lines in the excitation and emission (right panels) show the results of split-half validation.
Water 15 01579 g004
Figure 5. Percentages of four fluorescent components: (a) Dry season; (b) Wet season.
Water 15 01579 g005
Figure 6. Fluorescence intensities of four fluorescent components: (a) Dry season; (b) Wet season.
Water 15 01579 g006
Figure 7. FT-IR spectra of freeze-dried DOM samples during the wet season.
Water 15 01579 g007
Figure 8. Biplot for four PARAFAC components and each sample as first two principal components.
Water 15 01579 g008
Figure 9. Correlation coefficient matrix between selected parameters.
Water 15 01579 g009
Table 1. Spectral characteristics of excitation and emission maxima of four fluorescent components identified by EEM-PARAFAC.
Component No.TypeTradition Peak [45]Peak Max Position Ex/EmSeason
C1UVC humic-likePeak A: 260/380–460
Peak C: 350/420–480
275 nm/490 nmDry season
265 nm (360 nm)/460 nmWet season
C2UVA humic-likePeak A: 260/380–460240 nm (345 nm)/450 nmDry season
245 nm/450 nmWet season
C3Marine humic-likePeak M: 312/380–420230 nm/415 nmDry season
225 nm (280 nm)/420 nmWet season
C4Tryptophan-likePeak T: 275/340210 nm (275 nm)/385 nmDry season
205 nm (280 nm)/390 nmWet season
Table 2. Fluorescence indices of DOM during the dry and wet seasons.
Sampling SitesDry SeasonWet Season
FIHIXBIXFIHIXBIX
H1---1.4411.220.52
H2---1.459.740.52
H3---1.459.40.55
H41.516.780.561.457.960.55
H51.525.590.641.487.60.56
H61.554.940.661.517.560.57
H71.554.780.651.517.370.61
H81.605.080.631.487.310.59
H91.595.710.721.527.130.59
H101.524.310.681.524.310.59
H111.535.200.701.476.750.61
H121.514.570.691.448.650.56
H131.614.270.691.456.940.54
H141.544.190.731.475.220.59
H151.555.030.671.526.060.61
H161.675.350.741.446.380.61
H171.686.530.711.537.730.65
H181.666.110.781.588.990.63
H191.645.820.751.486.750.62
Disclaimer/Publisher’s Note: The statements, opinions and data contained in all publications are solely those of the individual author(s) and contributor(s) and not of MDPI and/or the editor(s). MDPI and/or the editor(s) disclaim responsibility for any injury to people or property resulting from any ideas, methods, instructions or products referred to in the content.

