
Egg Production Rate of the Copepod Paracalanus parvus s. l. in Busan Harbor, Korea
Ocean Climate Response & Ecosystem Research Department, Korea Institute of Ocean Science and Technology, Busan 49111, Republic of Korea
*
Author to whom correspondence should be addressed.
Water 2023, 15(8), 1581; https://doi.org/10.3390/w15081581
Submission received: 13 March 2023
/
Revised: 10 April 2023
/
Accepted: 17 April 2023
/
Published: 18 April 2023
(This article belongs to the Special Issue Marine Zooplankton Ecology and Biodiversity)
Abstract
:We measured the monthly egg production rate (EPR) of Paracalanus parvus s. l. (P. parvus) at a fixed station in Busan Harbor from January 2020 to December 2021 to elucidate the seasonal variation in the EPR and the factors involved. Over the 2 years, the monthly EPR ranged from 0.5 to 47.0 eggs female−1 d−1 (average 13.3 eggs female−1 d−1). The seasonal mean EPR was high in spring (April to June) and summer (July to September) and low in autumn (October to December) in both years. Egg hatching success was high (average 94%). Monthly nauplii production in the P. parvus population ranged from 9 to 37,123 ind. m−3 d−1 (average 4605 ind. m−3 d−1), with a peak in March and May in 2020 and in April in 2021. The monthly EPR of P. parvus was more dependent on chlorophyll-a concentration than on water temperature. Nauplii production was dependent on the abundance of adult females, while the chlorophyll-a concentration had a positive effect on nauplii production. In this study, while there was no clear seasonal variation in the abundance of adult females, the EPR showed a clear pattern of seasonal variation. These results imply that for monitoring potential environmental changes in Busan Harbor, measuring the EPR of copepods may be a better indicator than copepod abundance.
1. Introduction
Small planktonic copepods (e.g., <1 mm in length) are the most abundant metazoans worldwide and play an important role in the marine food web [1,2,3]. One such planktonic copepod, Paracalanus parvus s. l. (hereinafter P. parvus), is a neritic calanoid species. Paracalanus parvus is a dominant copepod species in terms of abundance and biomass in various waters, including the Yellow Sea [4], the Korean coast [5,6,7], northern East China Sea [8], Inland Sea of Japan [9], and the California Current off the Oregon coast [10]. For example, P. parvus in the southeastern coast of Korea accounted for 26.8% of mesozooplankton over the four years [6].
The egg production rate (EPR) of copepods is used not only as a proxy for secondary production, but also as an indicator of environmental change [11,12,13,14,15,16,17,18]. Studies on the EPR of P. parvus have been conducted in different waters around the world: Skagerrak in the North Atlantic [19], off Newport, Oregon, USA [12], Bahía Magdalena, Mexico [20], Fukuyama Harbor, Japan [9], and Jiaozhou Bay in the Yellow Sea, China [21]. Domestic studies on the EPR of P. parvus in Korea include the Yeongsan River and Seomjin River Estuary [22,23], Jangmok Bay in the southern coastal waters of Korea [24], and the coastal waters of Busan [17]. However, intensive studies on the EPR of P. parvus have been conducted only over 1 year or during a specific season [9,19,21,24]. To elucidate the average seasonal variation in copepod EPRs, studies longer than 1 year are required [11,18] as the quantitative variability in zooplankton is high in shallow waters, such as at Busan Harbor [25,26].
Many factors affect the EPR of copepods, including diet (i.e., phytoplankton and microzooplankton), water temperature, body length, past feeding history, and gonad maturity [15,27,28,29,30,31,32,33,34,35], of which water temperature and diet are generally considered the important environmental factors [18,27,29,34]. The importance of water temperature and diet in the EPR of P. parvus varies from region to region [20,21,22,24,36,37].
The coastal environment adjacent to Busan Harbor, an international trade port, is expected to change rapidly due to the development of adjacent cities and the increase in harbor facilities. However, relevant ecological research in Busan Harbor is still limited [26,38,39,40]. The ecological research has recently begun in Busan Harbor and adjacent coasts in order to understand the change in the coastal ecosystem [39]. DNA metabarcoding of mixed fish eggs detected 35 fish species in Busan Harbor (S. Kim personal communication), suggesting Busan Harbor is an important coastal ecosystem.
As part of a research project to monitor the environmental changes in Busan Harbor, this study sought to clarify the seasonal variability in the monthly EPR of P. parvus—a small copepod that is predominant in Busan Harbor—over 2 years, to verify whether seasonal changes in the EPR of P. parvus are dependent on water temperature or diet, especially phytoplankton.
2. Materials and Methods
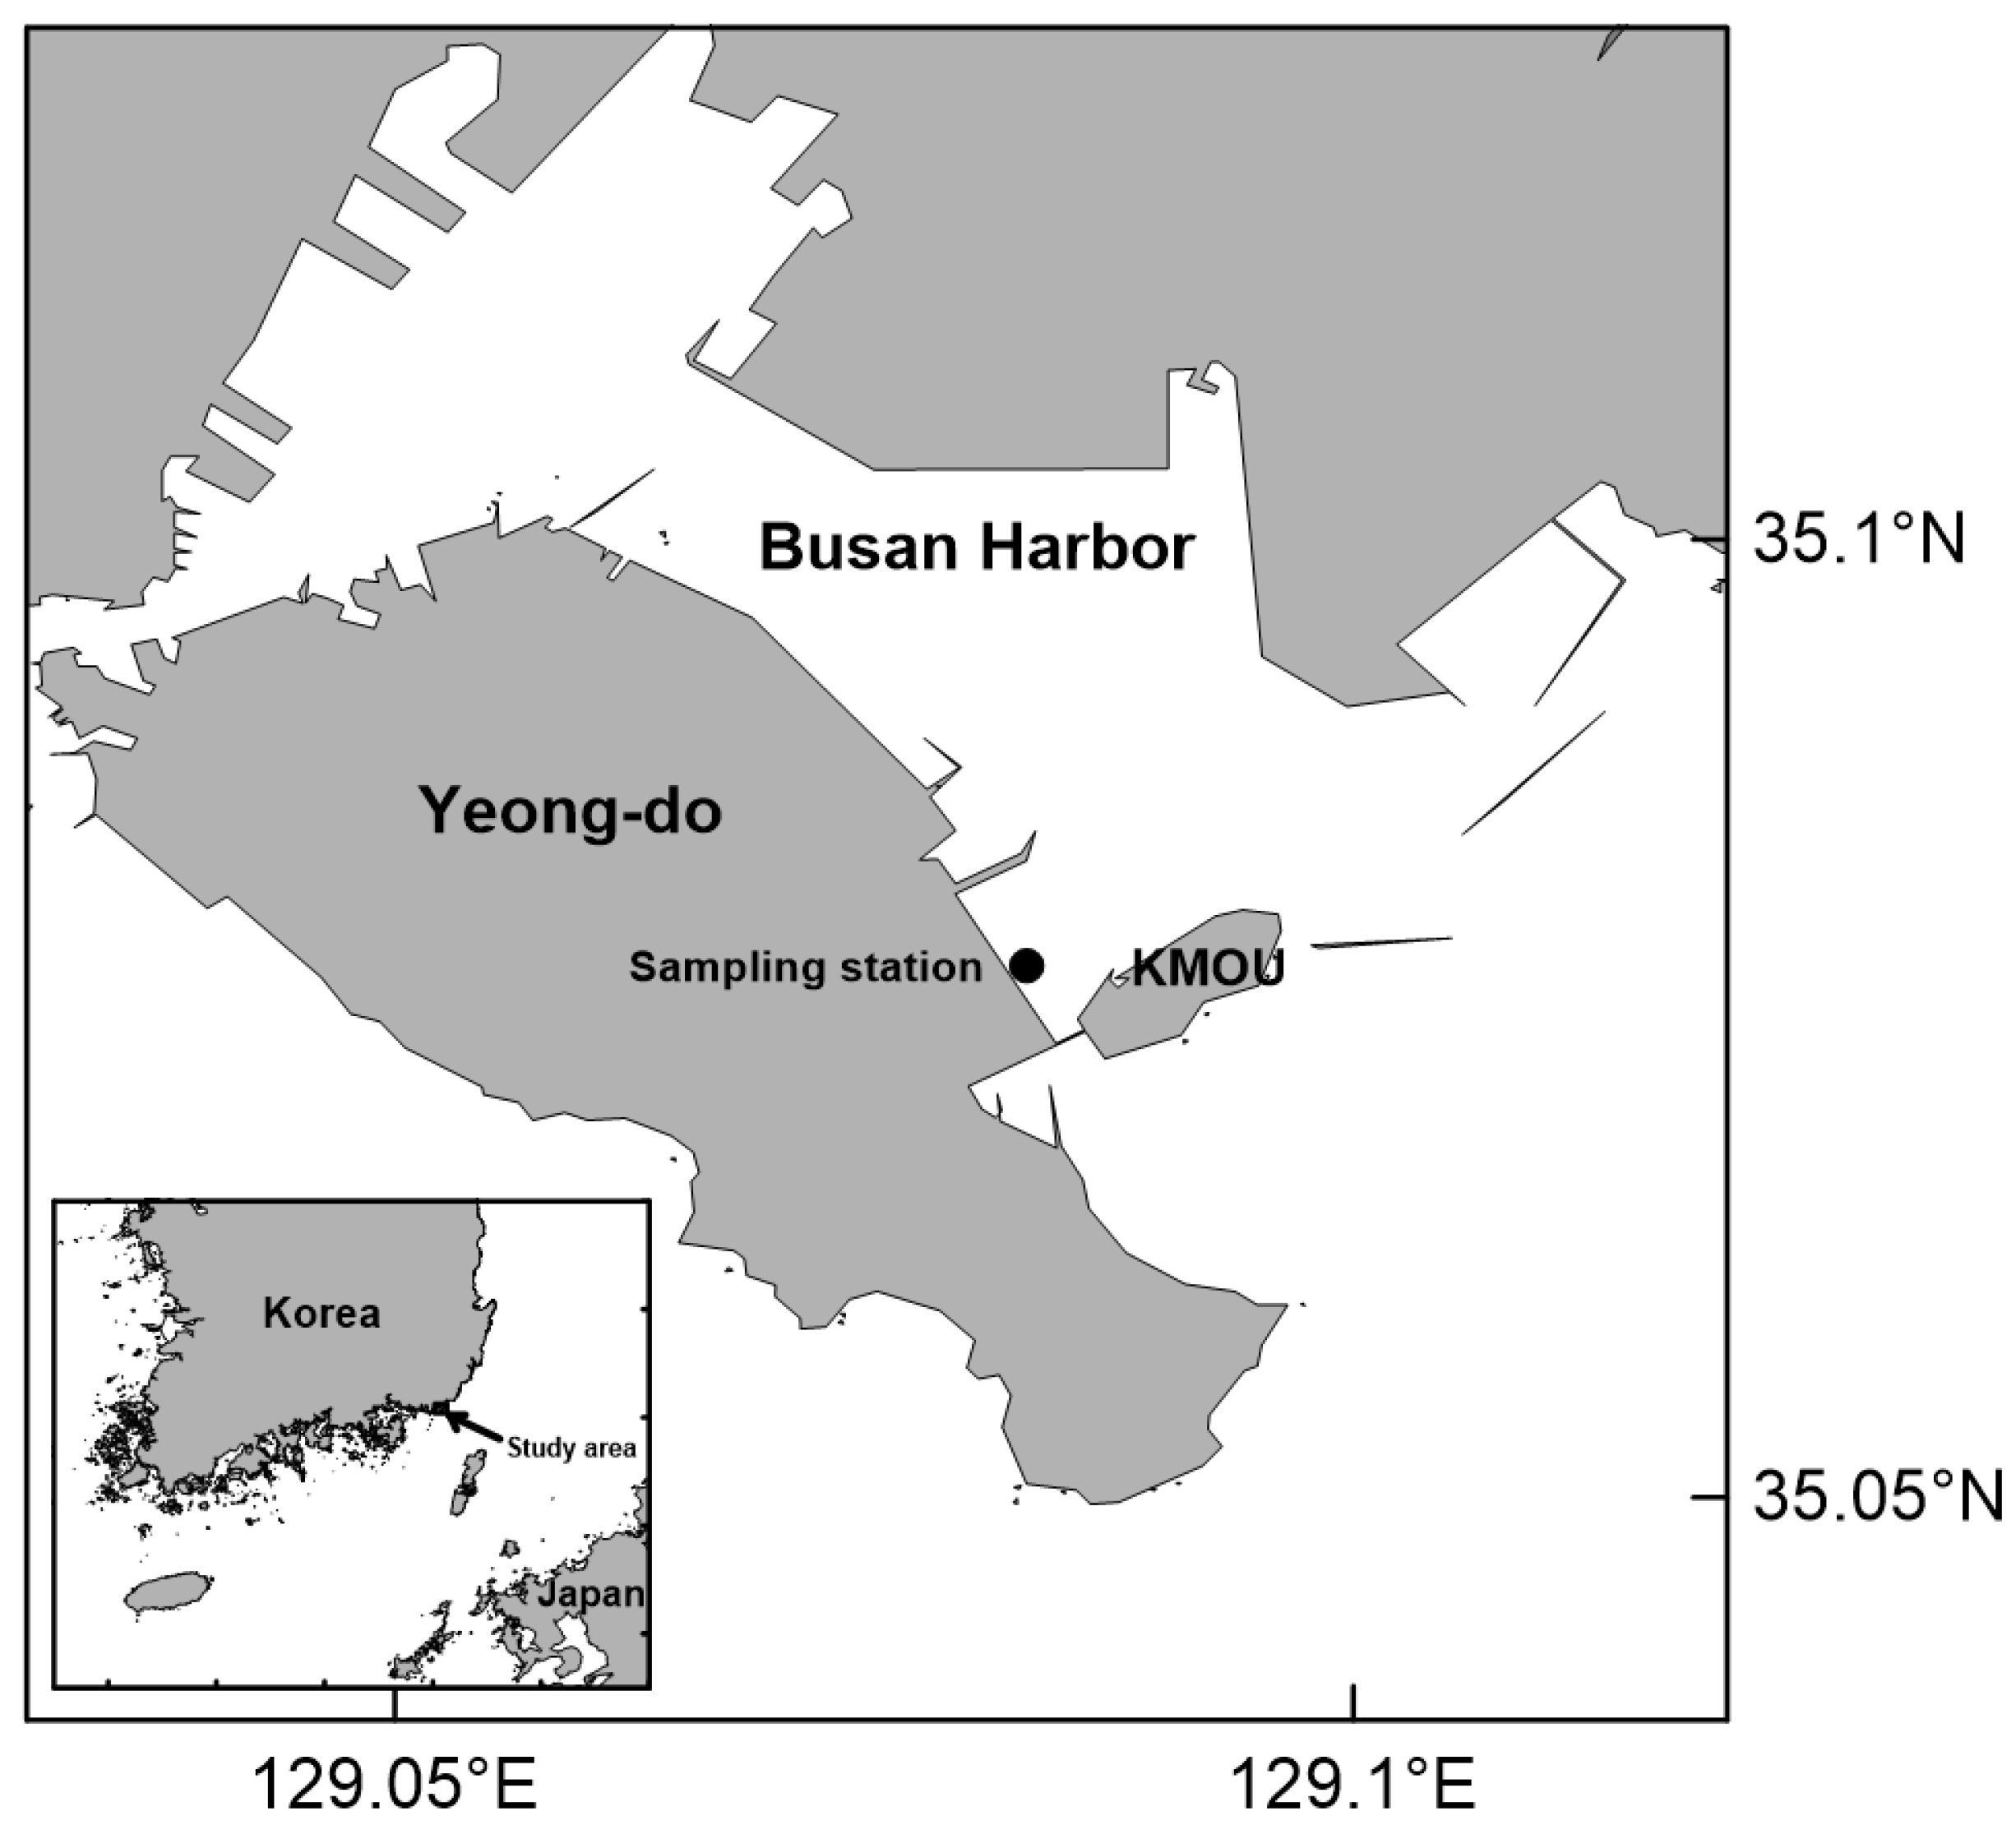
This study was conducted at a fixed station on the coast of Yeongdo in Busan Harbor, approximately 450 m away from the pier of the Korea Maritime and Ocean University and ~1.5 km away from the entrance of Busan Harbor (Figure 1). The water depth at the station is ~3–4 m, and there is active vertical mixing without stratification in the summer [26,39].
2.1. Egg Production Rate
A monthly survey was conducted for 2 years from January 2020 to December 2021 at the fixed station. Water temperature and salinity were measured at a depth of ~1 m using a CTD (Sea-Bird 19Plus, Sea-Bird Scientific, Bellevue, WA, USA). Seawater at a depth of 1 m was sampled using a 5-L Niskin water sampler to measure the chlorophyll-a (Chl-a) concentration. In the laboratory, 0.5 L seawater was filtered through GF/F filters (47 mm diameter, Whatman, Buckinghamshire, UK) and extracted using 95% acetone for 24 h. Chl-a concentrations were determined using a 10 AU fluorometer (Turner Designs, San Jose, CA, USA) [41].
A conical net (200 µm mesh, 50 cm net diameter) was obliquely towed from the bottom to the surface to collect mesozooplankton at the fixed station. The water volume filtered by the net was calculated using a flowmeter (Hydro-bios, Altenholz, Germany). The samples were preserved in 5% seawater formalin for final concentration. In the laboratory, P. parvus were identified and counted under a stereomicroscope (Stemi 2000-C, Zeiss, Jena, Germany) and an optical microscope (Axioskop, Zeiss, Jena, Germany). The number of P. parvus was converted into the number of individuals per cubic meter.
Live zooplankton were collected by oblique sampling using a conical net (200 µm mesh, 50 cm net diameter). The cod-end of the conical net had no window and a volume of ~1 L. The collected samples were transported to the laboratory within 15 min, where actively moving adult P. parvus females were selected. One adult female was placed in a glass bowl (total volume 70 mL) containing 20 mL of seawater filtered through a 64 µm sieve. The monthly EPR experiments were replicated 5–12 times. To prevent the adult female from being trapped on the surface of the cultured seawater in the glass bowl, parafilm was placed on the surface of the cultured seawater. The glass bowls were placed in an incubator and incubated for 24 h in the dark under field water temperature. Since only one female was placed in the glass bowl, it was assumed that there was no egg cannibalism by the adult female. After 24 h, the death of the adult female was confirmed, and the adult female was removed from the glass bowl and fixed with 5% formalin. The glass bowl containing the spawned eggs was further incubated at the same temperature for 24 h. After incubation, unhatched eggs or hatched nauplii were counted under a stereomicroscope (Stemi 2000-C, Zeiss, Jena, Germany), while seawater from the glass bowl was removed with a pipette. The EPR was expressed as the average number of eggs laid per female per day. The weight-specific egg production rate (WSEPR, d−1) as the female growth rate was calculated by dividing the total egg carbon content of the eggs laid by an adult female by the body carbon content of the adult female. Nauplii production in the adult female population was calculated by multiplying the EPR per female by the egg hatching success and then by the abundance of adult females.
2.2. Carbon Contents of an Adult Female and Egg
The prosome length (PL, µm) of adult females after the EPR experiment was measured using a stereomicroscope (Stemi 2000-C, Zeiss, Jena, Germany) and an image-analysis program (CellSens version 1.13, Olympus, Tokyo, Japan). The body carbon content (Wc, µg C) of adult females was estimated from prosome length (PL, µm) using the following equation: Wc = PL3.128 × 10−8.451 [9]. The egg diameter was 71 µm (M.C. Jang personal communication). The carbon content of an egg was converted using the carbon to volume content of 0.14 × 10⁻⁶ µg C µm−3 [40]. Therefore, the carbon content of an egg of P. parvus was 0.026 μg C in this study. It was assumed that this egg carbon content was the same regardless of the season [42].
2.3. Data Analysis
Spearman’s analyses were performed to test for correlations of the EPR, WSEPR, prosome length, and abundance of adult females with environmental factors, including water temperature, salinity, and Chl-a concentration due to the lack of a normal distribution of the data [43]. When variables have a normal distribution, the relationship between the variables was expressed using a simple linear regression equation. Sigma Plot 14.0 (Systat Software Inc., San Jose, CA, USA) was used for the correlation analysis and normality test. The Mann–Whitney U test was also performed to test for differences between years. Systat 13.0 (Systat Software Inc., San Jose, CA, USA) was used to analyze the difference between years.
3. Results
3.1. Water Temperature, Salinity, and Chl-a Concentration
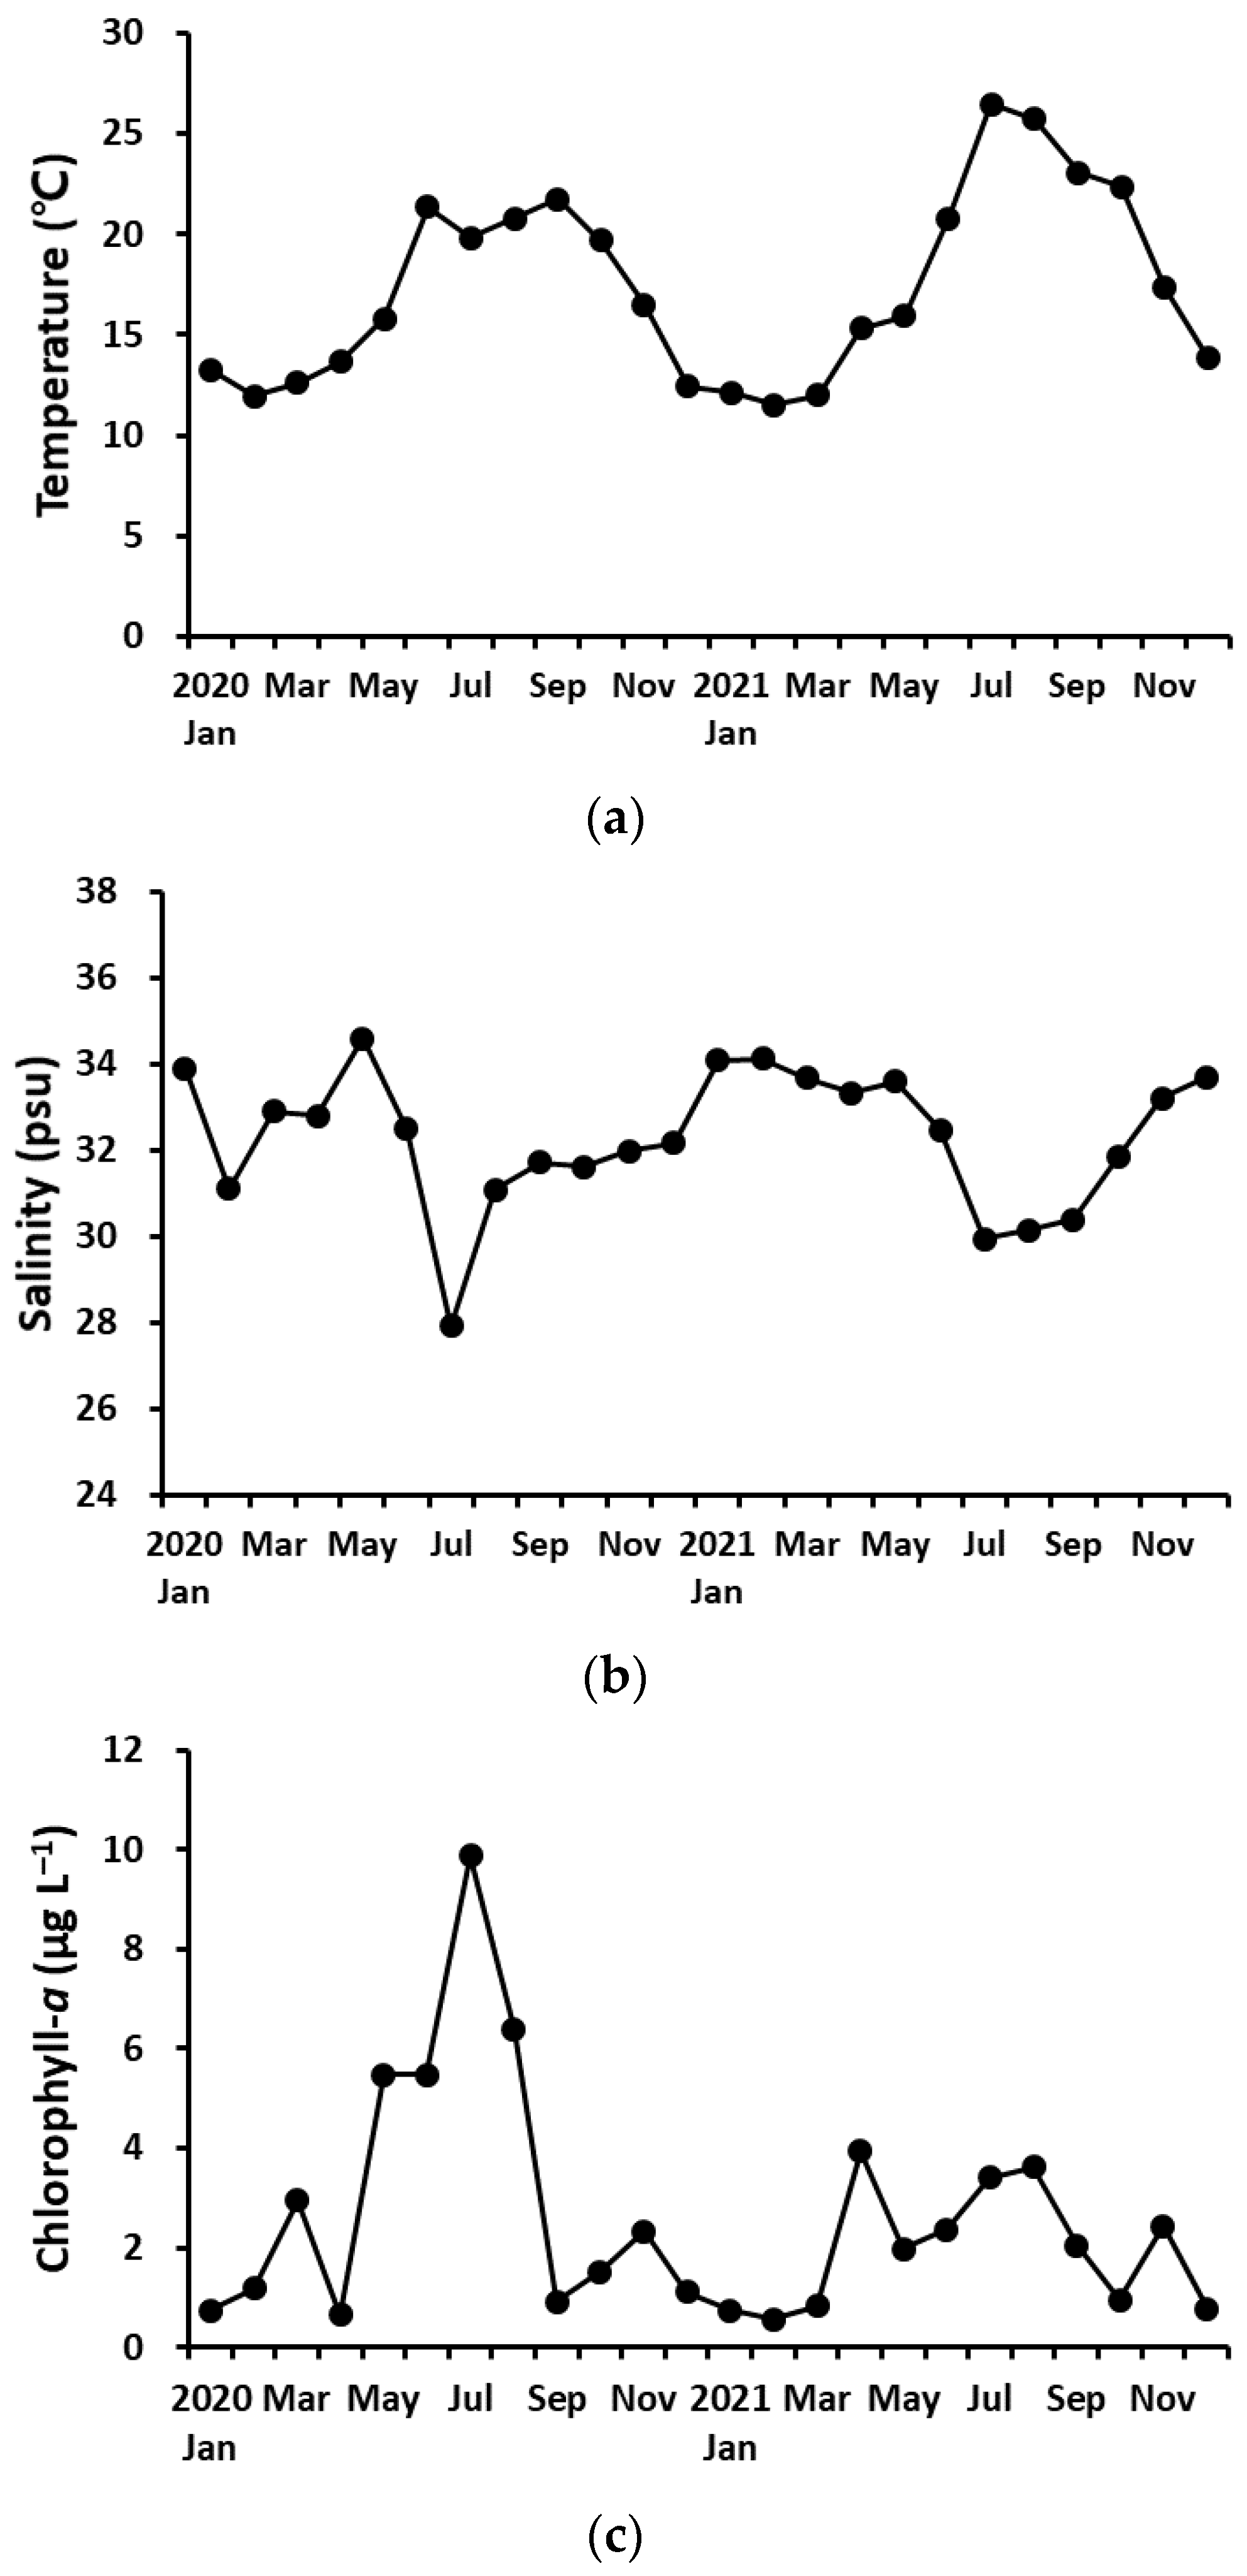
Water temperature ranged from 11.5 °C to 26.5 °C with similar seasonal changes during both years (Figure 2a). Salinity ranged from 27.9 to 34.6 psu and showed different seasonal changes between the years (Figure 2b). The salinity was low in summer due to seasonal rainfall. Chl-a concentrations ranged from 0.57 to 9.89 µg L−1 (average 2.60 µg L−1) and was relatively high in summer (Figure 2c). The annual Chl-a concentration was higher in 2020 (3.2 ± 2.9 µg L−1) than in 2021 (average ± standard deviation; 2.0 ± 1.2 µg L−1), but there was no significant difference between the 2 years (Mann–Whitney U test, p > 0.05).
3.2. Abundance of Adult Females
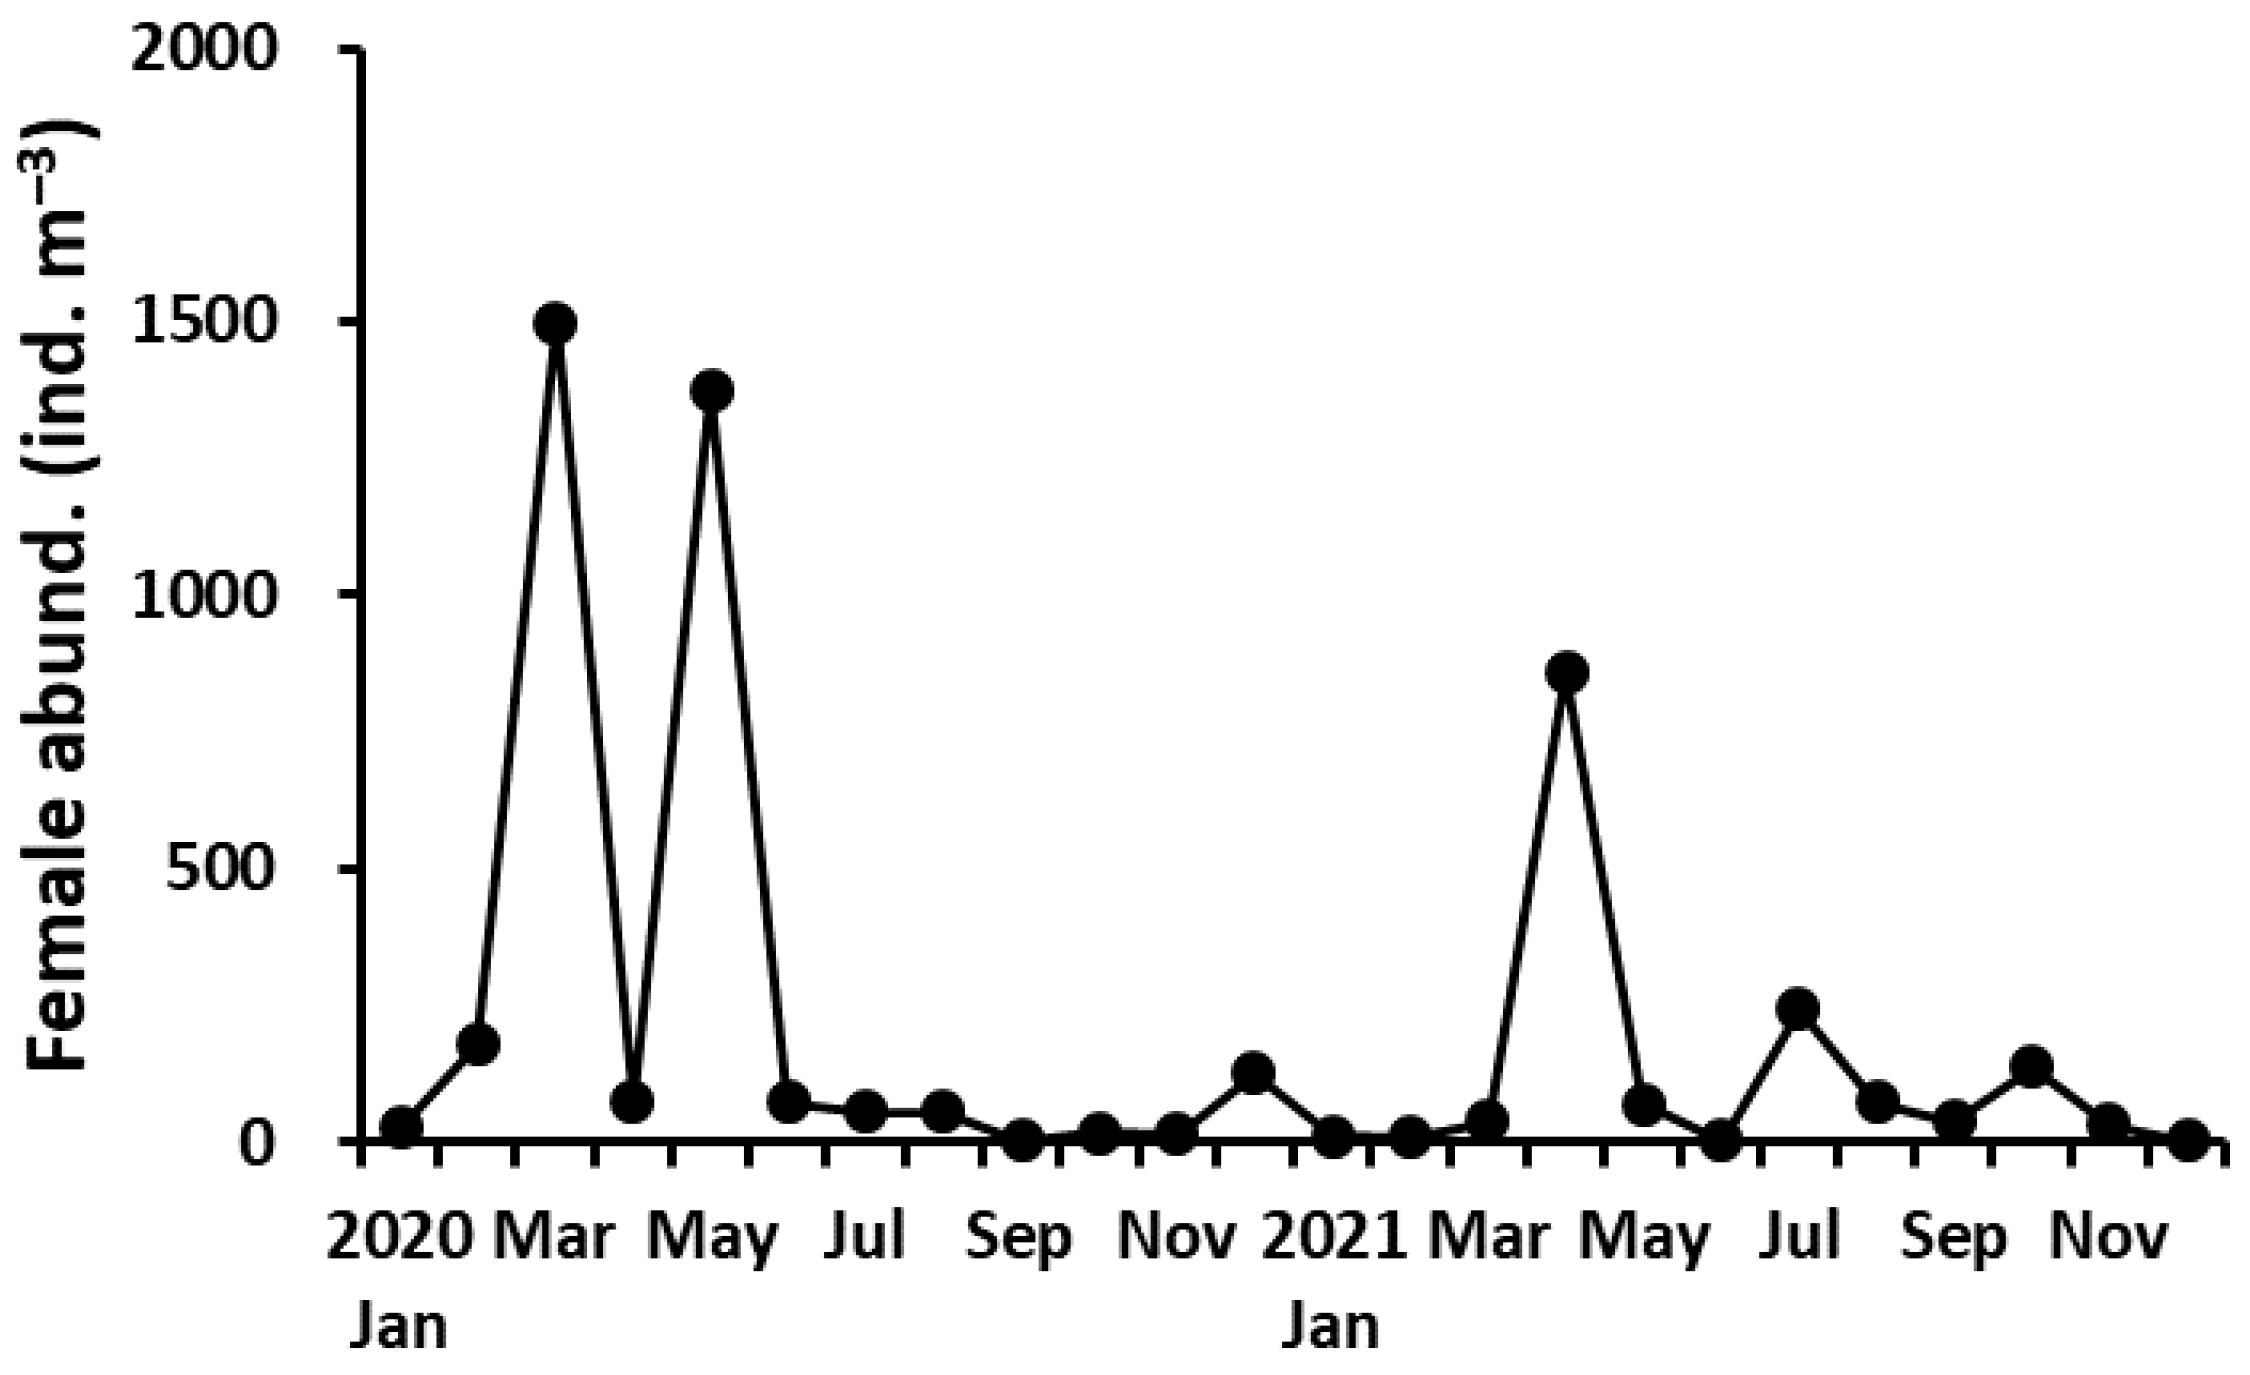
The abundance of P. parvus adults (females + males) ranged from 5.5 to 1697 ind. m−3 (average 244 ind. m−3). The abundance of adult females ranged from 2.5 to 1500 ind. m−3 (average 210 ind. m−3) and peaked in March and May in 2020 and April in 2021 (Figure 3). The mean abundance of adult females was higher in 2020 (292 ± 538 ind. m−3) than in 2021 (127 ± 240 ind. m−3), but there was no significant difference between the 2 years (Mann–Whitney U test, p > 0.05). The abundance of adult females showed a positive correlation with Chl-a concentration (r = 0.453, p < 0.05) but no correlation with water temperature (r = 0.025, p > 0.05) or salinity (r = −0.150, p > 0.05).
3.3. Sex Ratio
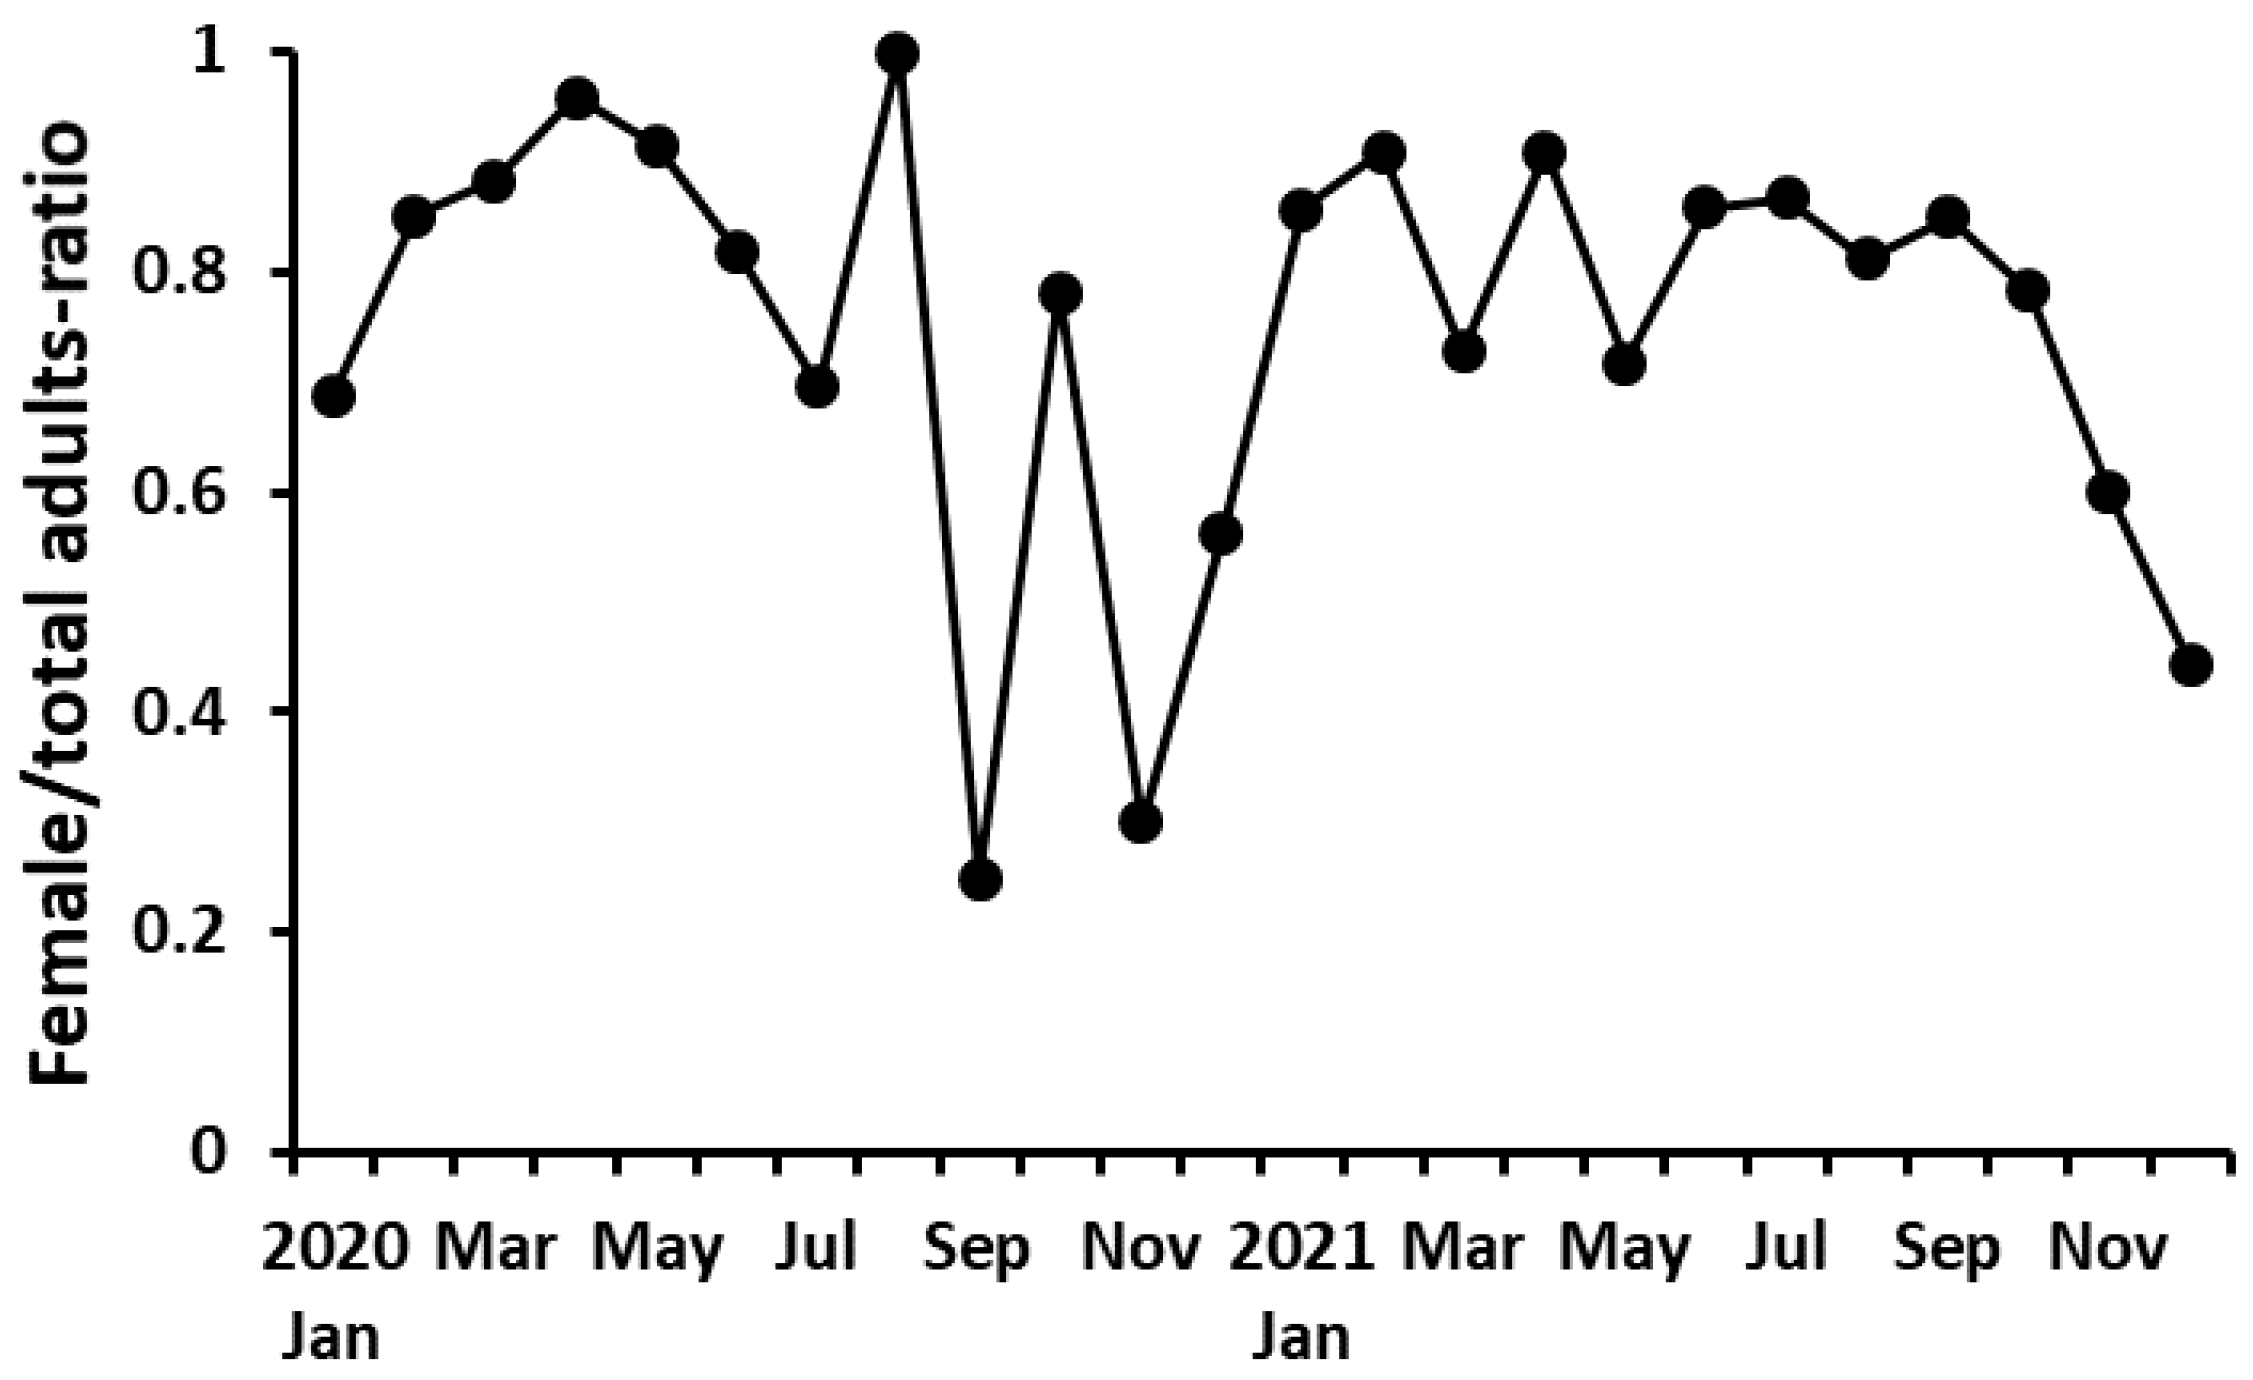
The proportion of females (i.e., the abundance of adult females divided by the abundance of adult males and females) of P. parvus was 0.25–0.99 (average 0.78) (Figure 4). Therefore, the sex ratio was biased toward the female. However, the ratio was temporarily < 0.5 during September–November in 2020 and December in 2021. When the abundance of adult females was low during autumn, the female proportion tended to be lower compared with the other seasons. There was a significant correlation of the female proportion with the abundance of adult females (r = 0.460, p < 0.05) but not with Chl-a concentration (r = 0.232, p > 0.05).
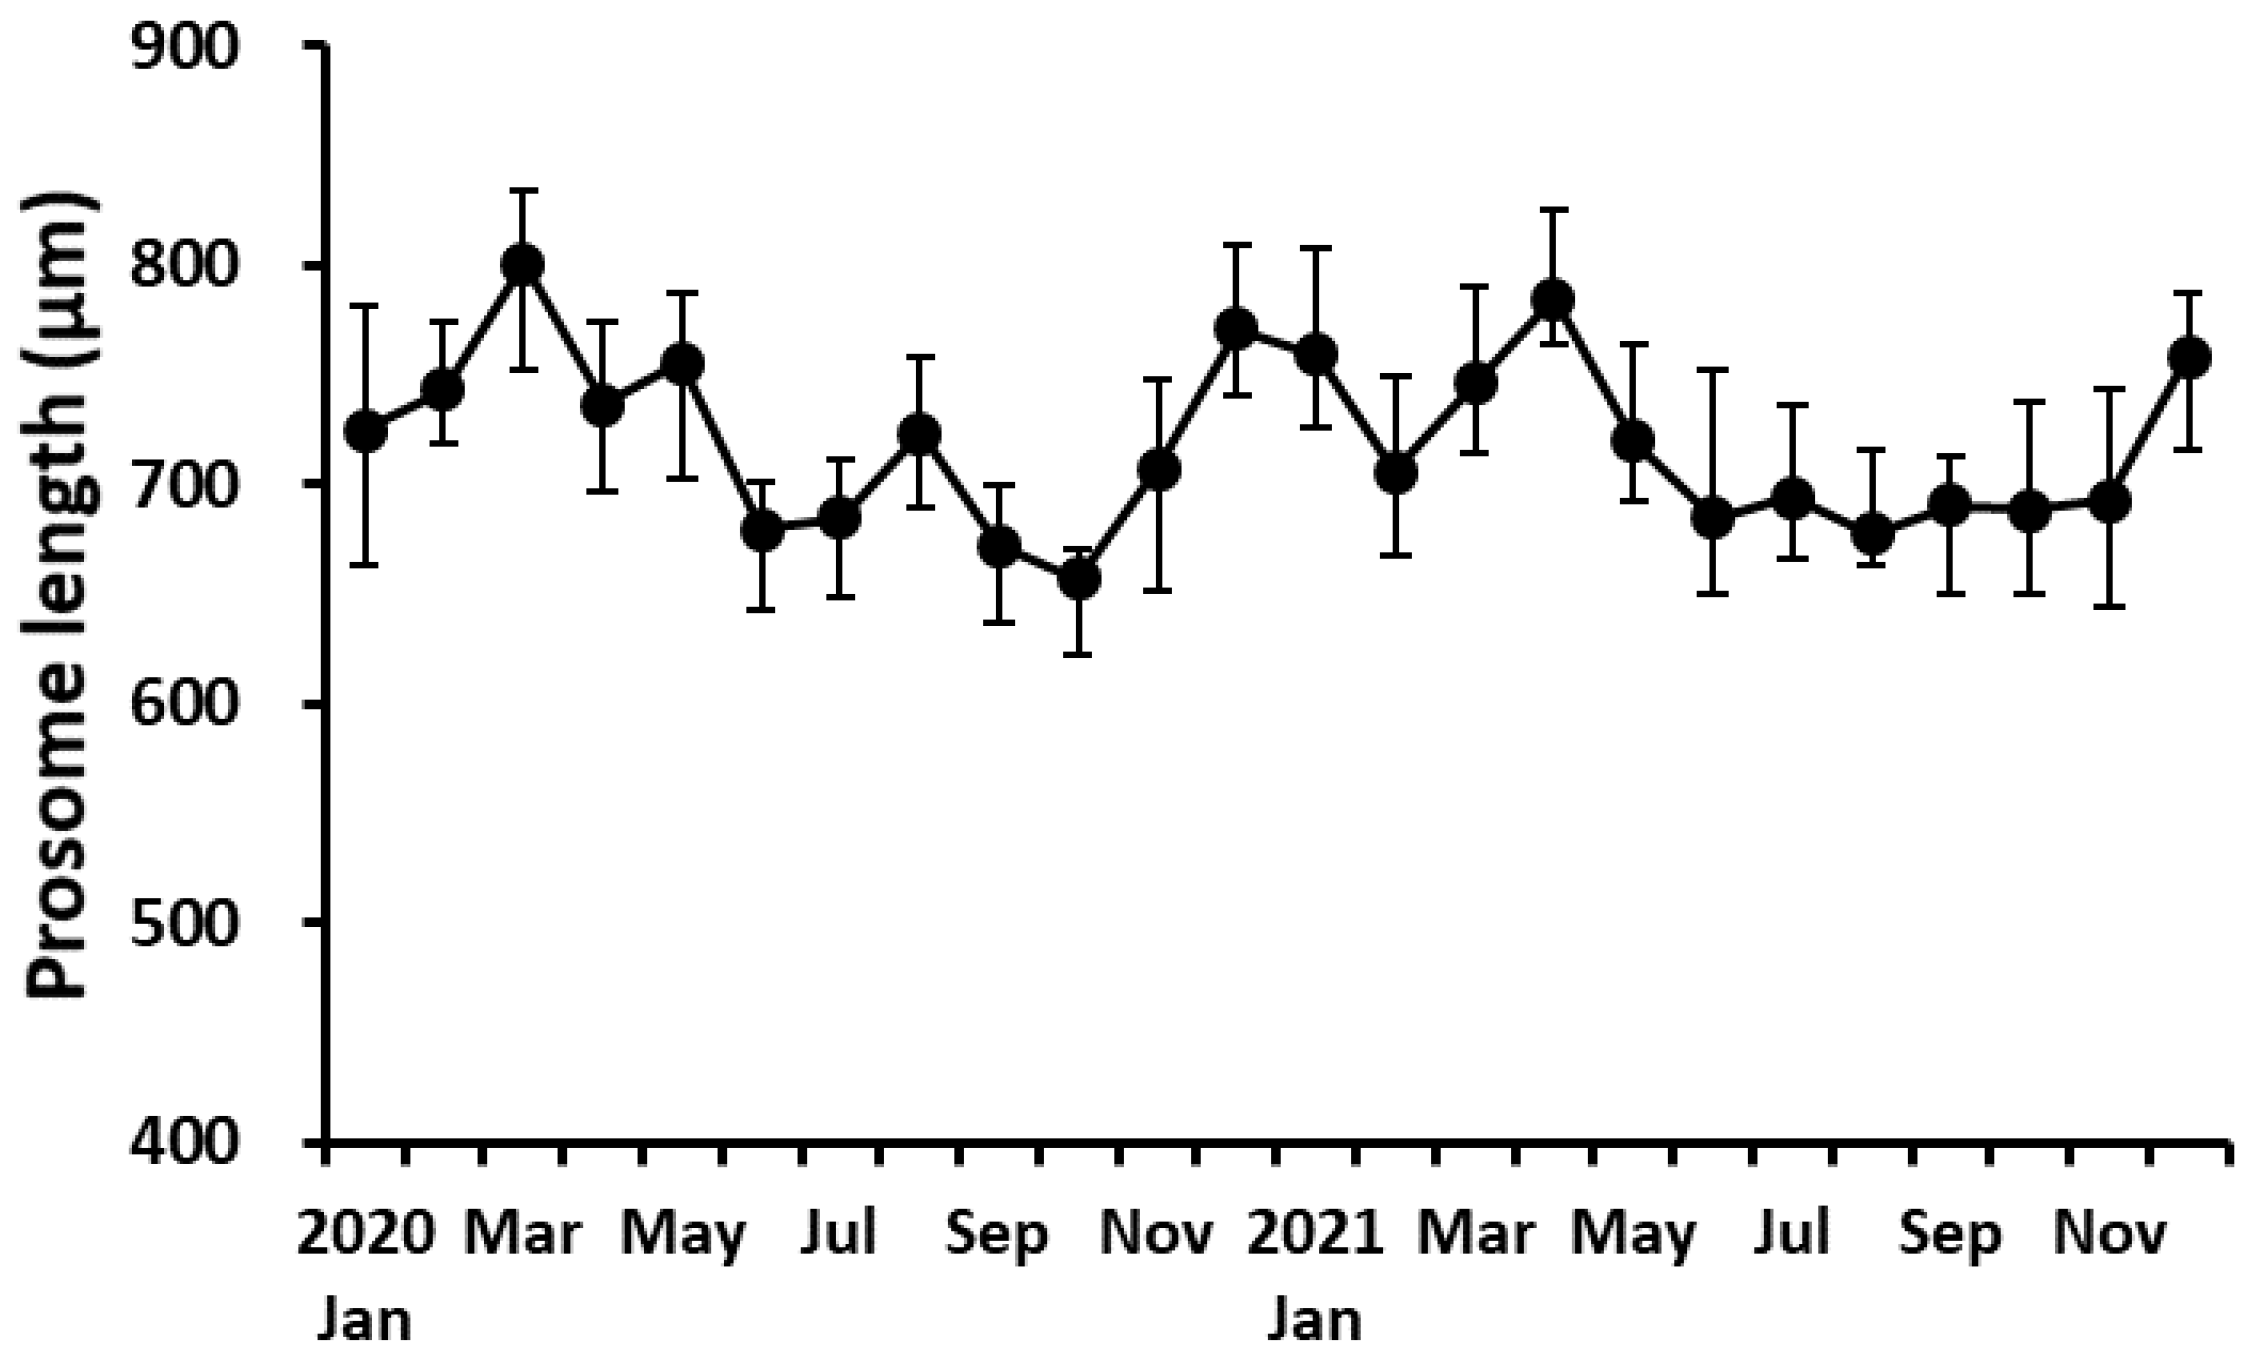
3.4. Prosome Length of Adult Females
3.5. EPR and Egg Hatching Success
Adult females of P. parvus spawned throughout both years. The monthly EPR of P. parvus ranged from 0.5 to 47.0 eggs female−1 d−1 (average 13.3 eggs female−1 d−1). The EPR was high during March and May–July in 2020 and during April–May and July in 2021. The EPR was low during January and October in 2020 and during September and November in 2021 (Figure 7a). Comparing the seasonal mean EPR between 2020 and 2021, the EPR was higher in 2020 during all four seasons (Table 1), but there was no significant difference between each season (Mann–Whitney U test, p > 0.05). The annual mean EPR was higher in 2020 (18.0 eggs female−1 d−1) than 2021 (8.5 eggs female−1 d−1), but the difference was not significant (Mann–Whitney U test, p > 0.05). Egg hatching success ranged from 67% to 100% (average 94%) and remained above 80% except during February (67%) and June (75%) in 2021 (Figure 7b).
3.6. EPR and WSEPR in Relation to Water Temperature, Salinity, and Chl-a Concentration
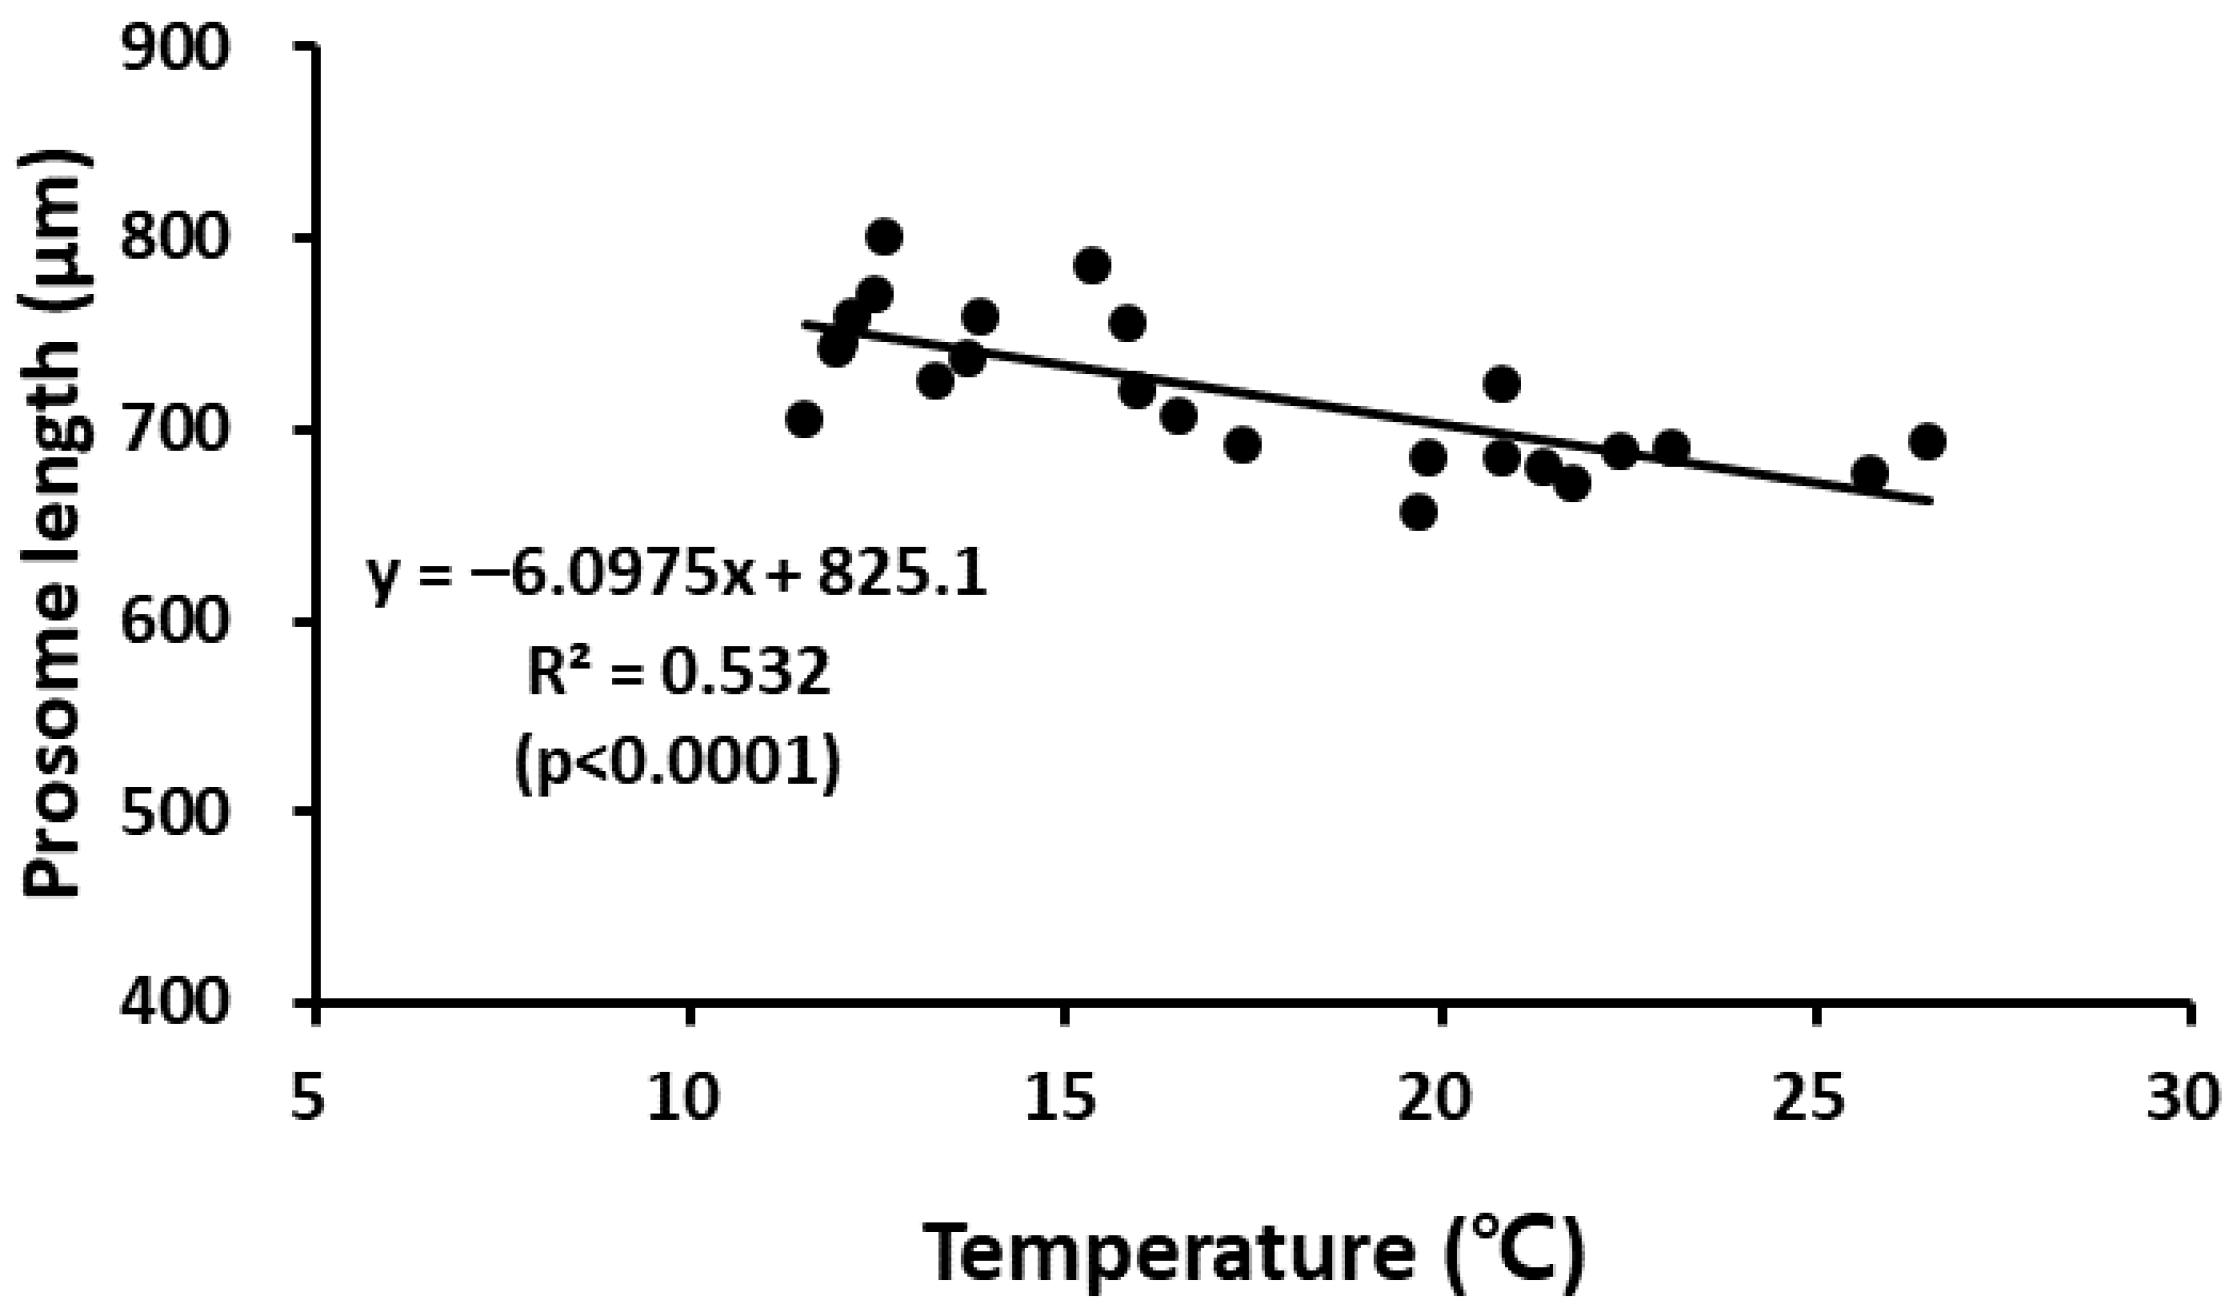
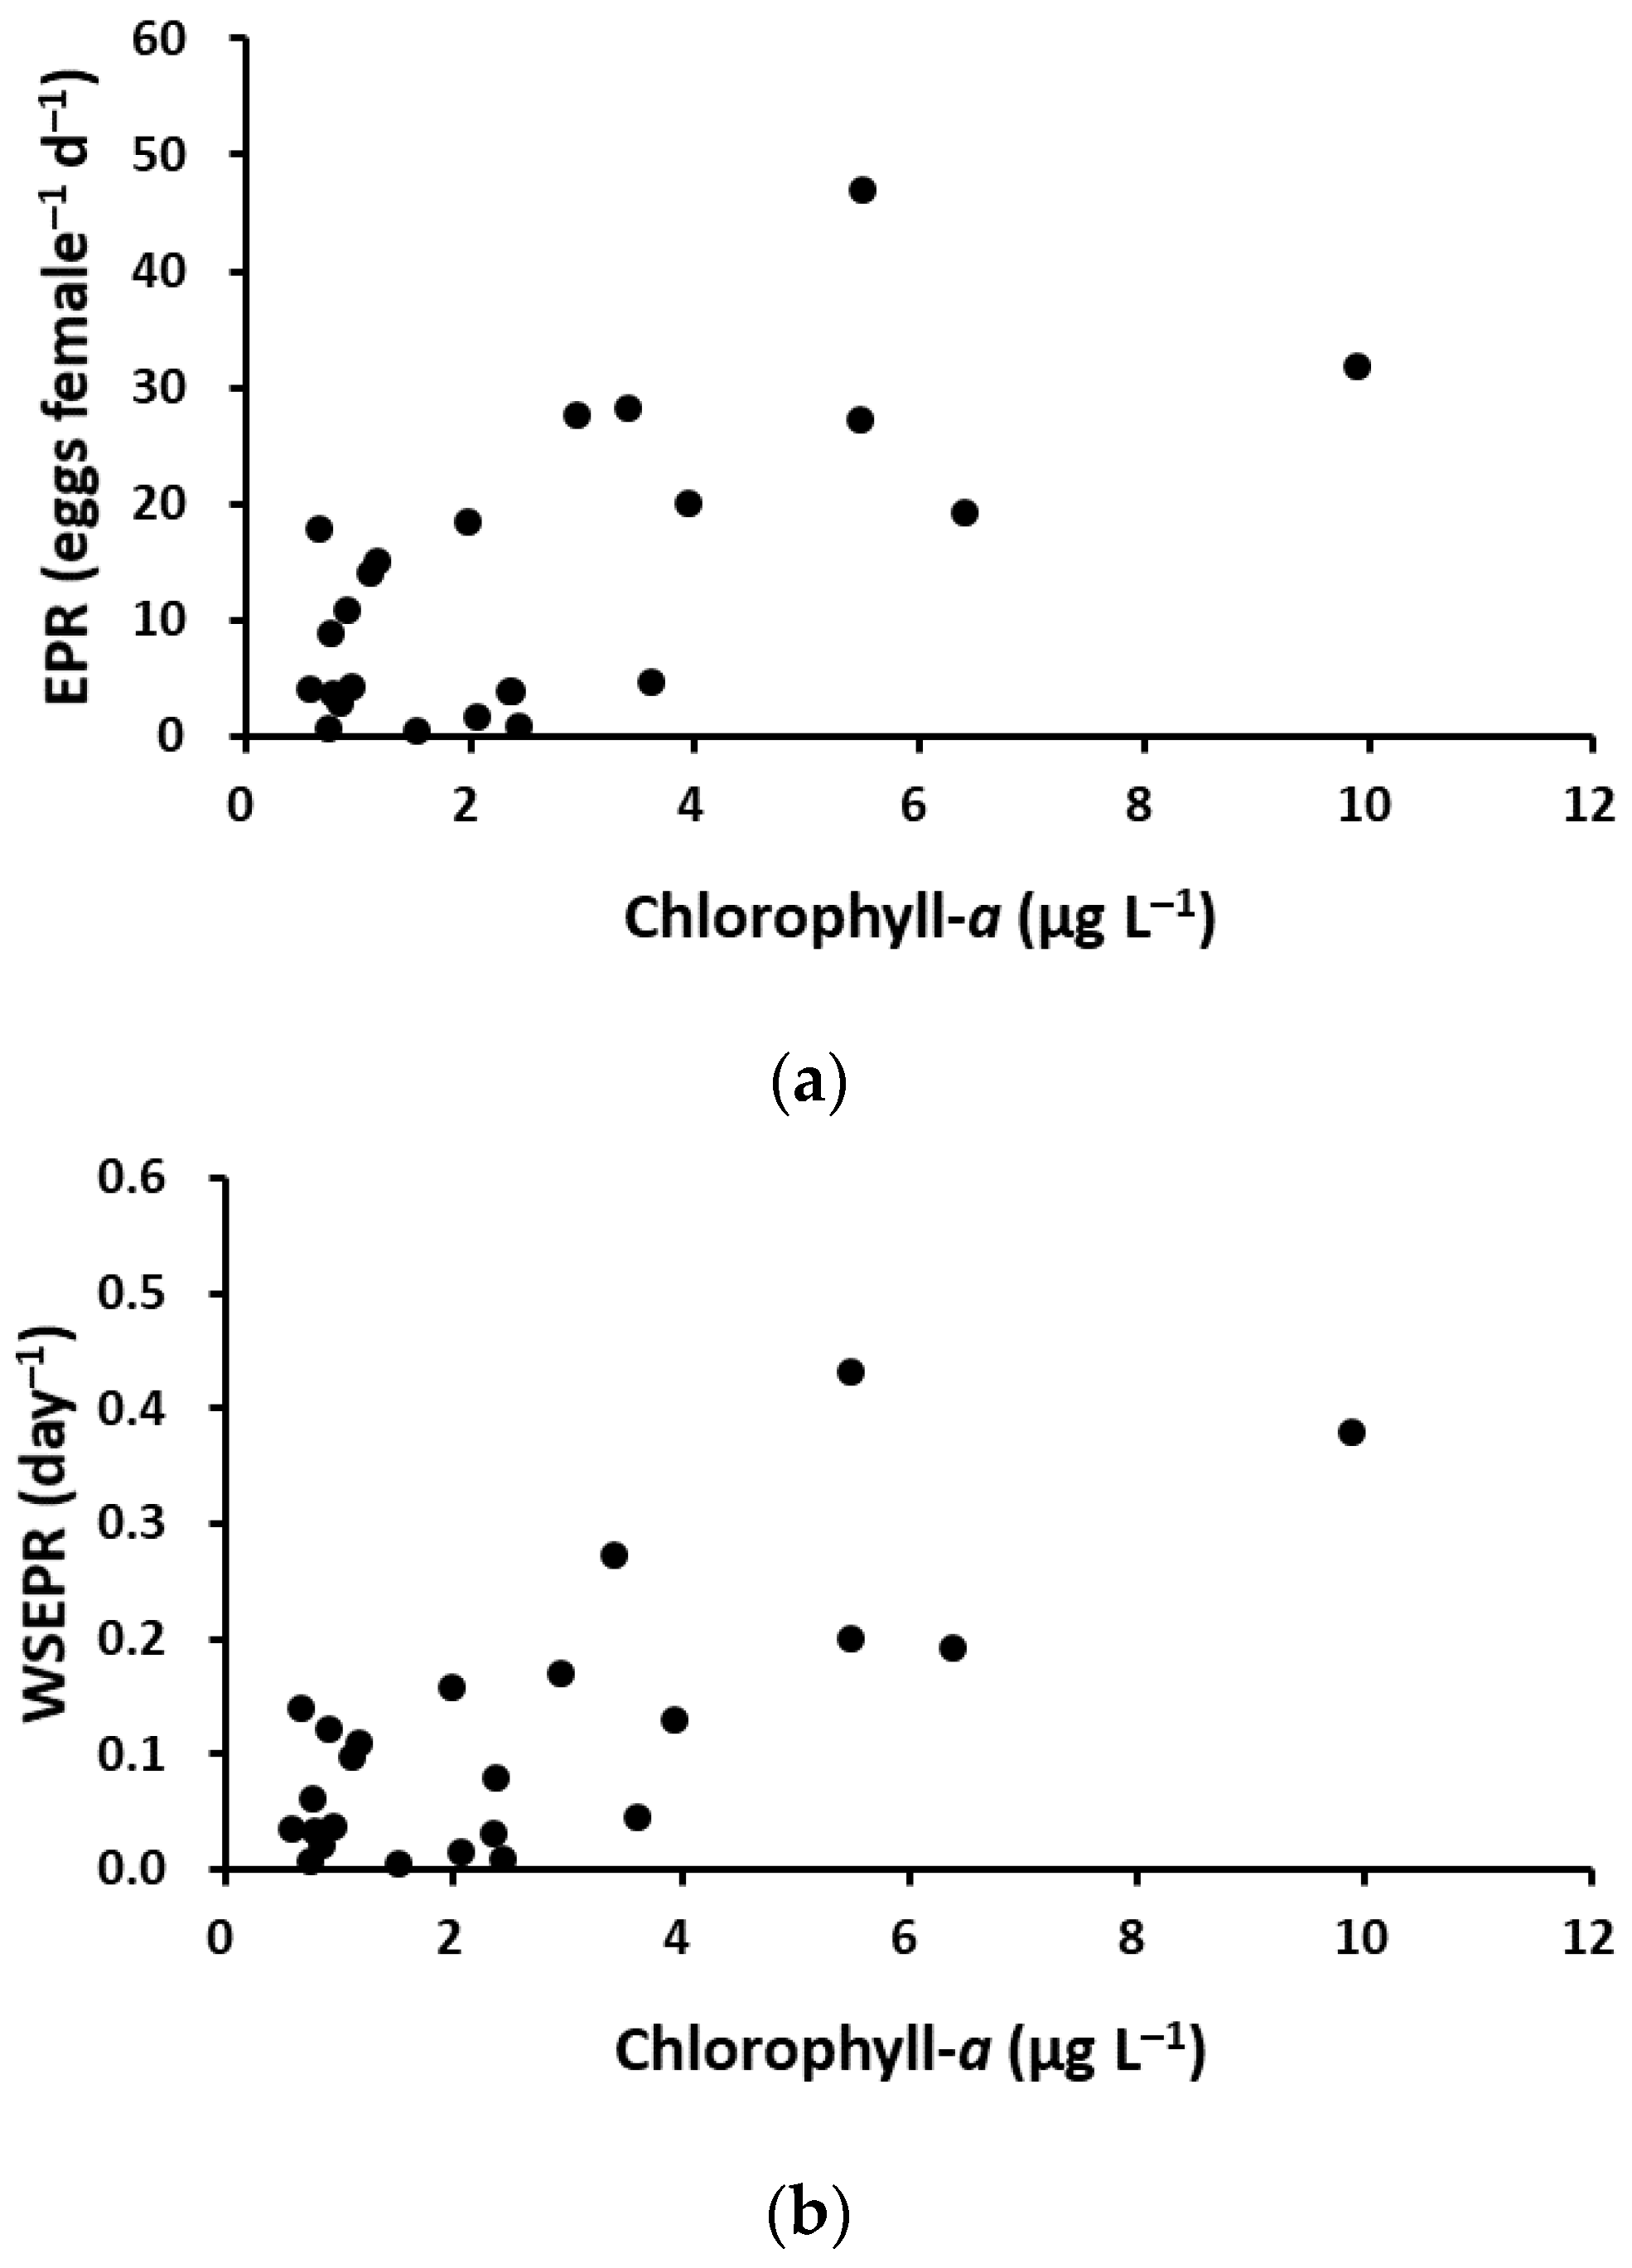
The monthly EPR of P. parvus was significantly correlated with Chl-a concentration, increasing as Chl-a concentration increased (r = 0.555, p < 0.01, n = 24, Figure 8a). However, there was no correlation between the monthly EPR and water temperature (r = 0.109, p > 0.05), salinity (r = −0.173, p > 0.05), or prosome length (r = 0.189, p > 0.05). In 2020, the monthly EPR increased significantly as Chl-a concentration increased (r = 0.648, p < 0.05, n = 12), but there was no correlation between the monthly EPR and Chl-a concentration in 2021 (r = 0.273, p > 0.05, n = 12).
The WSEPR ranged from 0.005 to 0.431 d−1 (average 0.106 d−1), and this fluctuation was generally similar to the seasonal pattern of the monthly EPR. The WSEPR increased significantly as Chl-a concentration increased (r = 0.557, p < 0.01, n = 24, Figure 8b) but was not correlated with female body weight (r = 0.109, p > 0.05), water temperature (r = 0.176, p > 0.05), and salinity (r = −0.184, p > 0.05). In 2020, the WSEPR increased significantly as Chl-a concentration increased (r = 0.658, p < 0.05, n = 12), but there was no correlation between the WSEPR and Chl-a concentration in 2021 (r = 0.308, p > 0.05, n = 12). The annual mean WSEPR was higher in 2020 (average 0.157 ± 0.134) than in 2021 (average 0.075 ± 0.077).
3.7. Nauplii Production
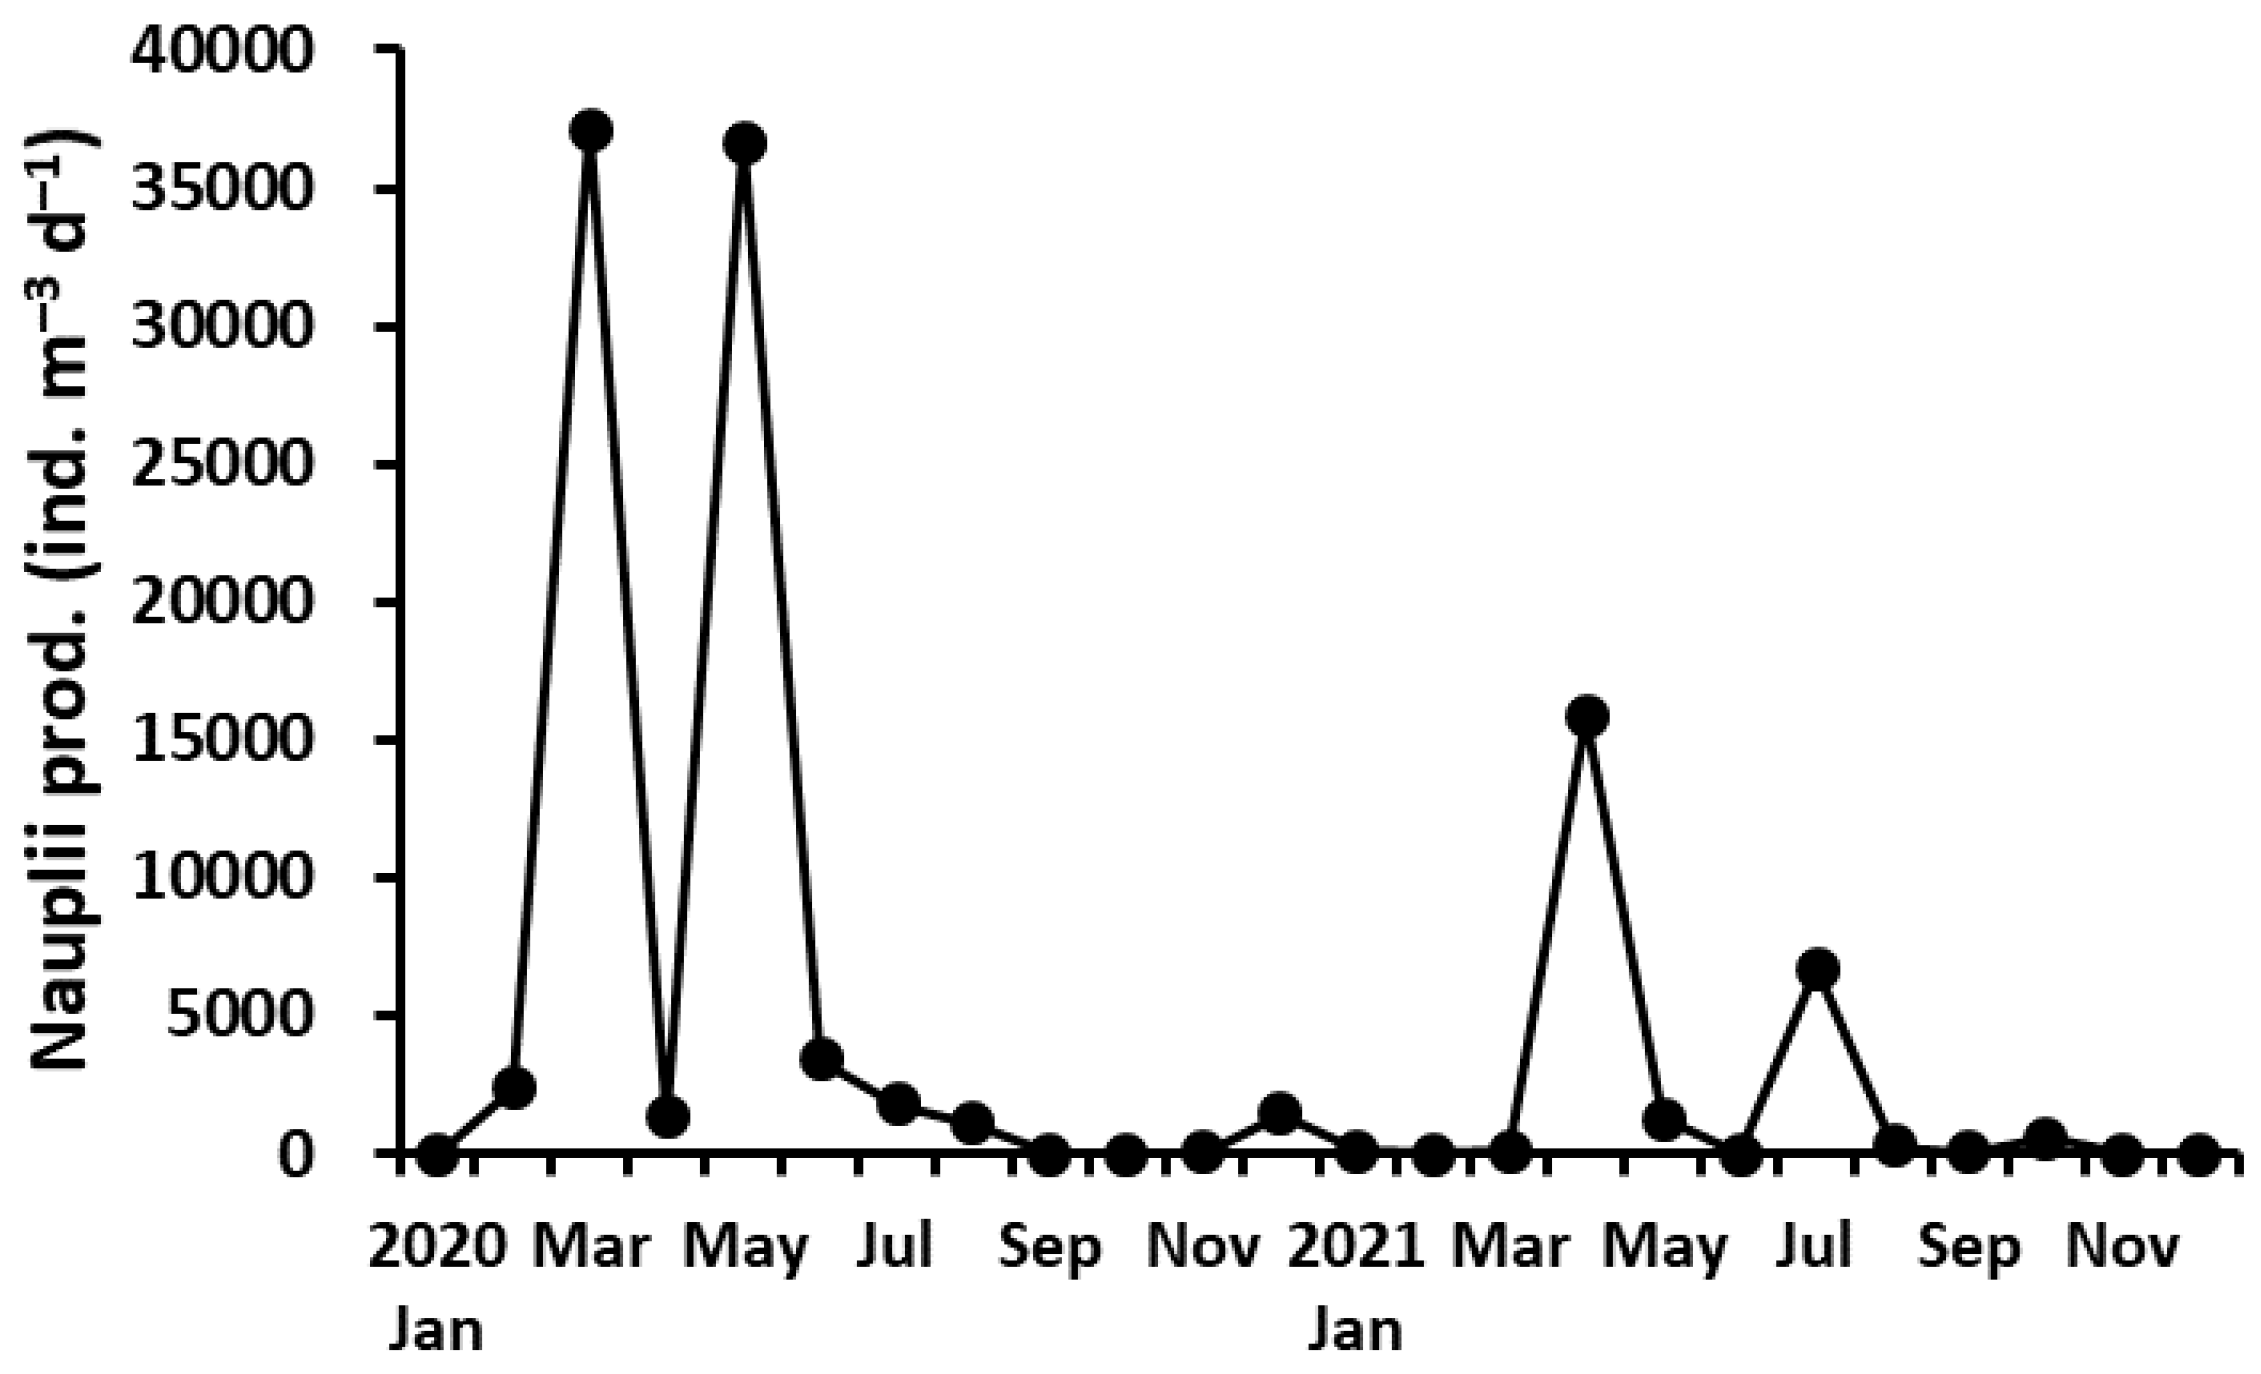
Nauplii of the P. parvus population were produced throughout both years. The monthly nauplii production ranged from 9 to 37,123 ind. m−3 d−1 (average 4605 m−3 d−1), with a peak in March and May in 2020 and in April in 2021, similar to the seasonal variation in the abundance of adult females (Figure 9). The annual mean nauplii production was higher in 2020 (7116 ind. m−3 d−1) than in 2021 (2095 ind. m−3 d−1), but there was no significant difference between the years (Mann–Whitney U-test, p > 0.05). There was a significant positive correlation of monthly nauplii production with Chl-a concentration (r = 0.528, p < 0.01), but no correlation with water temperature (r = –0.033, p > 0.05).
4. Discussion
4.1. Comparison of EPR and Seasonal Variation
EPRs of P. parvus vary by region (Table 2). The EPR in the mouth or outside of Jiaozhou Bay, China [21], which has a similar Chl-a concentration to that in Busan Harbor, was similar to that in this study. The EPR in Fukuyama Harbor, Japan [9], which has a higher Chl-a concentration than that in Busan Harbor, was higher than that in this study. In some cases, the EPR in Jangmok Bay, Korea [24], which has a higher Chl-a concentration than that in Busan Harbor, was lower than that in this study. In general, the EPRs in coastal and offshore waters with lower Chl-a concentrations have tended to be lower than in this study [20,21,36]. However, even in open waters such as off southern California, USA, in February–March [36], the EPR of P. parvus was higher than that in this study.
Seasonal patterns of the P. parvus EPR differ slightly depending on the study area. The EPR in Jangmok Bay was the highest in August and lowest in December–January [24]. The EPR in Fukuyama Harbor, a eutrophic region in Japan, was high in June and September–October and lowest in January–February [9]. The EPR at the mouth of Jiaozhou Bay was highest in May and July and lowest in January and March [21]. In this study, the EPR was high in June and July (Figure 7a), similar to that at the mouth of Jiaozhou Bay [21], but was lowest in autumn (October–December), which was different from Jiaozhou Bay. These differences in seasonal patterns imply that the factors controlling the P. parvus EPR may differ depending on the study area.
4.2. Environmental Factors for EPR
The effects of water temperature and Chl-a concentration on the EPR of P. parvus differ depending on the study area. The EPR of P. parvus in Jangmok Bay was positively correlated with water temperature (76% explanation), but was weakly correlated with Chl-a concentration (43% explanation) [24]. The EPR and growth rate of Paracalanus sp. in Fukuyama Harbor increased as water temperature increased [37]. The EPR of P. parvus off southern California, USA, in February–March and August–September was positively correlated with Chl-a concentration in the field, but negatively correlated with water temperature [36]. In this study, the EPR was not correlated with water temperature but was positively correlated with Chl-a concentration (Figure 8a). Therefore, the effects of water temperature and Chl-a concentration on EPR vary in magnitude depending on the study area.
In eutrophic waters [44] such as Jangmok Bay and Fukuyama Harbor, with high concentrations of phytoplankton (Table 2), the EPR of P. parvus seems to be affected mainly by water temperature rather than Chl-a concentration. In mesotrophic waters [44] such as off southern California and Busan Harbor in this study (Table 2), the EPR of P. parvus seems to be affected mainly by Chl-a concentration rather than water temperature. However, the mouth and outside of Jiaozhou Bay are mesotrophic waters (Chl-a concentration < 2.03 µg L−1) [44], but the EPR of P. parvus showed positive correlations with both water temperature and Chl-a concentration [21]. In addition, in the mesotrophic waters of Bahía Magdalena, Mexico (Chl-a concentration 0–5.8 µg L−1), the EPR of P. parvus was related to neither water temperature nor Chl-a concentration [20].
Small calanoid copepods, including P. parvus in Jangmok Bay, eat mainly phytoplankton > 20 µm in size and picophytoplankton < 3 µm in size [24]. Large phytoplankton > 3 µm in size, including diatoms in summer and cryptophyceae in autumn and winter, accounted for 80% of the total Chl-a concentration in Busan Harbor near this study area [39]. Therefore, it is likely that P. parvus ate the diatoms and cryptophyceae as phytoplankton food sources in this study. Meanwhile, diatoms can inhibit the EPR and/or egg hatching success of copepods [45,46]. However, most of the eggs laid in this study hatched successfully (e.g., average 94%), and no diatom inhibition was observed. Relatively low concentrations of diatoms [47], as in this study area, seem to have no deleterious effects on the EPR and/or egg hatching success of P. parvus. On the other hand, P. parvus can also eat animal foods in addition to phytoplankton. During the summer in the Seto Inland Sea of Japan, Paracalanus sp. ate heterotrophic dinoflagellates and ciliates, with more heterotrophic dinoflagellates than ciliates [48]. Protozoa are a higher quality food than phytoplankton [49]. Protozoa may explain some part of the seasonal variation in the EPR of P. parvus, whereas water temperature and Chl-a concentration did not [21]. Further research on the effect of protozoan diets on the EPR of P. parvus is needed.
4.3. Environmental Factors for WSEPR
In general, the WSEPR of broadcasters in copepods shows a negative correlation with body weight and positive correlations with water temperature and Chl-a concentration [34]. In this study, the WSEPR of P. parvus showed a positive correlation with Chl-a concentration, consistent with the results of Hirst and Bunker for broadcasters in copepods [34], but no correlation with water temperature or body weight.
The positive correlation of water temperature with the WSEPR of P. parvus is observed mainly in eutrophic waters. For example, the WSEPR of P. parvus in Jangmok Bay under eutrophic conditions showed a strong positive correlation with water temperature, but a weak correlation with Chl-a concentration [24]. The growth rate of P. parvus in Seomjin River estuary in Korea was mostly dependent on water temperature [22]. However, the growth rate of P. parvus in Yeongsan River estuary in Korea was inhibited at high water temperature (25 °C) despite the high food concentration in summer [23]. Therefore, the effect of water temperature on the WSEPR of P. parvus may differ even among eutrophic waters.
Some studies have reported that the WSEPR of certain copepods has no or a weak correlation with Chl-a concentration because bulk food indices, such as Chl-a concentration, are not good parameters for the WSEPR [16,50,51]. However, the reason that the WSEPR of P. parvus showed a positive correlation with Chl-a concentration rather than with water temperature in this study seems to have been due to the mesotrophic waters in the study region. The seasonal variation in the WSEPR was similar to that in EPR, and the EPR was positively correlated with Chl-a concentration rather than with water temperature (Figure 8a). In addition to Chl-a concentration, the WSEPR was likely not related to body weight in this study because the seasonal variation in the WSEPR (or EPR) was large, but the variation in body weight or body length (i.e., prosome length) was not large. For example, the coefficient of variation (CV) of the EPR in this study was 93%, and the CV of the WSEPR was 99%, whereas the CVs of body weight and body length were low at 17% and 5%, respectively. The results for broadcaster copepods from Hirst and Bunker [34] included copepods of various sizes. Therefore, it seems that the general rule of Hirst and Bunker [34] does not work well for P. parvus by itself.
4.4. Nauplii Production
Adult females of P. parvus appeared throughout the year in this study, but the seasonal variations were not clear (Figure 3). However, the EPR of P. parvus clearly showed seasonal changes, with a high in spring and summer and a low in autumn (Figure 7a). The seasonal variation of nauplii production in the P. parvus population was similar to that in the adult female population and showed a significant positive correlation with the abundance of adult females (r = 0.908, p < 0.0001). Therefore, nauplii production in the P. parvus population in Busan Harbor was influenced by the abundance of adult females rather than the EPR of individual adult females. Since environmental changes are severe in coastal waters unlike offshore waters, the distribution and community structure of various zooplankton are strongly affected by various environmental factors. For example, the copepod communities of Jinhae Bay and its adjacent waters, the southern coastal waters, Busan Harbor, and Gamak Bay in Korea, are affected by seasonal warm currents [25,26,52,53]. Additionally, changes in tidal cycle greatly affected fluctuations in the zooplankton population in Gwangyang Bay, Korea [54]. The water depth of the sampling station in this study is shallow, and vertical mixing is active without stratification, even in summer [26,39]. In addition, the seasonal variability in the abundance of adult females is likely to be large since it can be affected by the tidal cycle, inflow of warm currents, and wind-induced seawater disturbance. In fact, the CV for the adult female population was 198%, around twice that of the EPR (93%). These results imply that to monitor potential environmental changes in shallow coastal waters such as Busan Harbor, measuring the physiological response (e.g., EPR and WSEPR) of individuals may be more effective than measuring the change in copepod abundance.
4.5. Sex Ratio
The proportion of females in this study was 0.25–0.99 (average 0.78), similar to that in paracalanids (0.55–0.99, average 0.8) [55]. Additionally, the female proportion in Jangmok Bay was 0.64–0.99 [24], similar to that in this study. Therefore, the sex ratio of P. parvus in Busan Harbor tended to be biased toward females, similar to other regions [24,56]. At the population level, copepods have been reported to produce many males and to promote mating with females when the food concentration in the environment is high [55,56]. However, the food concentration in this study did not have any relationship with the proportion of females, and these results were similar to that for P. parvus in Jangmok Bay [24]. The sex ratio of copepods also changes seasonally. When the number of females or the abundance of the population is low, the proportion of males tends to be high [57]. The proportion of females in this study was lower during autumn than during the other seasons (e.g., <0.5; Figure 4), and there was a significant positive correlation between female abundance and the proportion of females. Therefore, when the abundance of the female population is low, the proportion of females is relatively low, similar to the general trend.
5. Conclusions
The EPR of P. parvus in this study clearly showed a greater seasonal change compared with the abundance of the female population. The EPR of P. parvus in mesotrophic waters was dependent on the amount of phytoplankton rather than on water temperature. Nauplii production in the P. parvus population was mainly dependent on the abundance of adult females. Fluctuations in adult female abundance in Busan Harbor are more likely to be affected by factors other than water temperature or Chl-a concentration.
Author Contributions
Conceptualization, H.-K.K. and G.K.; investigation, G.K.; data analysis, H.-K.K.; writing—original draft preparation, H.-K.K.; writing—review and editing, H.-K.K. All authors have read and agreed to the published version of the manuscript.
Funding
This research was supported by the research projects of the Korea Institute of Ocean Science and Technology (KIOST; PEA0012, PEA0111).
Data Availability Statement
All data presented in this study are available from the corresponding author upon request.
Acknowledgments
We thank J.H. Noh for supplying the chlorophyll-a data. We also appreciate anonymous reviewers for their valuable comments that helped improve the manuscript.
Conflicts of Interest
The authors declare no conflict of interest.
References
- Turner, J.T. The importance of small planktonic copepods and their roles in pelagic marine food webs. Zool. Stud. 2004, 43, 255–266. [Google Scholar]
- Zervoudaki, S.; Christou, E.; Nielsen, T.G.; Siokou-Frangou, I.; Assimakopoulou, G.; Giannakourou, A.; Maar, M.; Pagou, K.; Krasakopoulou, E.; Christaki, U. The importance of small-sized copepods in a frontal area of the Aegean Sea. J. Plankton Res. 2007, 29, 317–338. [Google Scholar] [CrossRef]
- Calbet, A.; Garrido, S.; Saiz, E.; Alcaraz, M.; Duarte, C.M. Annual zooplankton succession in coastal NW Mediterranean waters: The importance of the smaller size fractions. J. Plankton Res. 2001, 23, 319–331. [Google Scholar] [CrossRef]
- Kim, G.; Kang, H.-K. Mesozooplankton community structure in the Yellow Sea in spring. Ocean Polar Res. 2020, 42, 271–281. [Google Scholar]
- Moon, S.Y.; Oh, H.-J.; Soh, H.Y. Seasonal variation of zooplankton communities in the southern coastal waters of Korea. Ocean Polar Res. 2010, 32, 411–426. [Google Scholar] [CrossRef]
- Kim, G.; Kang, H.-K.; Myoung, J.-G. Seasonal and interannual variation in mesozooplankton community structure off Tongyeong, southeastern coast of Korea, from 2011 to 2014. Ocean Sci. J. 2017, 52, 113–125. [Google Scholar] [CrossRef]
- Seo, M.H.; Choi, S.Y.; Park, E.-O.; Jeong, D.; Soh, H.Y. Species diversity of planktonic copepods and distribution characteristics of its major species in coastal waters of Korea. Korean J. Environ. Biol. 2018, 36, 525–537. [Google Scholar] [CrossRef]
- Choi, K.-H.; Lee, C.-R.; Kang, H.-K.; Kang, K.-A. Characteristics and variation of size-fractionated zooplankton biomass in the northern East China Sea. Ocean Polar Res. 2011, 33, 135–147. [Google Scholar] [CrossRef]
- Liang, D.; Uye, S. Population dynamics and production of the planktonic copepods in a eutrophic inlet of the Inland Sea of Japan. III. Paracalanus sp. Mar. Biol. 1996, 127, 219–227. [Google Scholar] [CrossRef]
- Peterson, W.; Gómez-Gutiérrez, J.; Morgan, C.A. Cross-shelf variation in calanoid copepod production during summer 1996 off the Oregon coast, USA. Mar. Biol. 2002, 141, 353–365. [Google Scholar]
- Laabir, M.; Poulet, S.; Harris, R.; Pond, D.; Cueff, A.; Head, R.; Ianora, A. Comparative study of the reproduction of Calanus helgolandicus in well-mixed and seasonally stratified coastal waters of the western English Channel. J. Plankton Res. 1998, 20, 407–421. [Google Scholar] [CrossRef]
- Gómez-Gutiérrez, J.; Peterson, W.T. Egg production rates of eight calanoid copepod species during summer 1997 off Newport, Oregon, USA. J. Plankton Res. 1999, 21, 637–657. [Google Scholar] [CrossRef]
- Runge, J.A.; Roff, J.C. The measurement of growth and reproductive rates. In ICES Zooplankton Methodology Manual; Harris, R., Wiebe, P., Lenz, J., Skjoldal, H.R., Huntley, M., Eds.; Academic Press: London, UK, 2000. [Google Scholar]
- Kimmerer, W.J.; Ferm, N.; Nicolini, M.H.; Peñalva, C. Chronic food limitation of egg production in populations of copepods of the genus Acartia in the San Francisco Estuary. Estuaries 2005, 28, 541–550. [Google Scholar] [CrossRef]
- Wang, S.; Li, C.; Sun, S.; Ning, X.; Zhang, W. Spring and autumn reproduction of Calanus sinicus in the Yellow Sea. Mar. Ecol. Prog. Ser. 2009, 379, 123–133. [Google Scholar] [CrossRef]
- Kang, H.-K.; Lee, C.-R.; Choi, K.-H. Egg production rate of the copepod Calanus sinicus off the Korean coast of the Yellow Sea during spring. Ocean Sci. J. 2011, 46, 133. [Google Scholar] [CrossRef]
- Kang, H.-K. Effects of suspended sediments on reproductive responses of Paracalanus sp. (Copepoda: Calanoida) in the laboratory. J. Plankton Res. 2012, 34, 626–635. [Google Scholar] [CrossRef]
- Peterson, W.T.; Du, X. Egg production rates of the copepod Calanus marshallae in relation to seasonal and interannual variations in microplankton biomass and species composition in the coastal upwelling zone off Oregon, USA. Prog. Oceanogr. 2015, 138, 32–44. [Google Scholar] [CrossRef]
- Peterson, W.T.; Tiselius, P.; Kiørboe, T. Copepod egg production, moulting and growth rates, and secondary production, in the Skagerrak in August 1988. J. Plankton Res. 1991, 13, 131–154. [Google Scholar] [CrossRef]
- Gómez-Gutiérrez, J.; Palomares-García, R.; De Silva-Dávila, R.; Carballido-Carranza, M.A.; Martínez-López, A. Copepod daily egg production and growth rates in Bahía Magdalena, México. J. Plankton Res. 1999, 21, 2227–2244. [Google Scholar] [CrossRef]
- Sun, X.H.; Sun, S.; Li, C.L.; Zhang, G.T. Seasonal and spatial variation in abundance and egg production of Paracalanus parvus (Copepoda: Calanoida) in/out Jiaozhou Bay, China. Estuar. Coast. Shelf Sci. 2008, 79, 637–643. [Google Scholar] [CrossRef]
- Youn, S.-H.; Oh, G.-S.; Chung, M.-H. Zooplankton community structure and copepod production in the Seomjin River estuary. J. Korean Soc. Mar. Environ. Saf. 2010, 16, 369–379. [Google Scholar]
- Youn, S.H.; Kim, M.J.; Suh, Y.S. Distribution pattern of zooplankton and growth rate of Paracalanus parvus s. l. in the Yongsan River estuary. Korean J. Nat. Conserv. 2012, 6, 33–41. [Google Scholar]
- Jang, M.-C.; Shin, K.; Hyun, B.; Lee, T.; Choi, K.-H. Temperature-regulated egg production rate, and seasonal and interannual variations in Paracalanus parvus. J. Plankton Res. 2013, 35, 1035–1045. [Google Scholar] [CrossRef]
- Park, J.S.; Lee, S.S. Distribution and composition of chaetognaths and copepods and their characteristics as biological indicators to assess environmental pollution levels in the south coast of Korea. Bull. Fish. Res. Dev. Agency 1982, 28, 89–126. [Google Scholar]
- Hong, S.Y.; Ma, C.W.; Kang, Y.S. Distribution of copepod indicator species and zooplankton communities in Pusan Harbor, Korea. J. Korean Soc. Oceanogr. 1994, 29, 132–144. [Google Scholar]
- Uye, S.-i.; Murase, A. Relationship of egg production rates of the planktonic copepod Calanus sinicus to phytoplankton availability in the Inland Sea of Japan. Plankton Biol. Ecol. 1997, 44, 3–11. [Google Scholar]
- Runge, J.; Plourde, S.; Joly, P.; Niehoff, B.; Durbin, E. Characteristics of egg production of the planktonic copepod, Calanus finmarchicus, on Georges Bank: 1994–1999. Deep Sea Res. Part II Top. Stud. Oceanogr. 2006, 53, 2618–2631. [Google Scholar] [CrossRef]
- Calbet, A.; Saiz, E. The ciliate-copepod link in marine ecosystems. Aquat. Microb. Ecol. 2005, 38, 157–167. [Google Scholar] [CrossRef]
- Hirche, H.-J.; Meyer, U.; Niehoff, B. Egg production of Calanus finmarchicus: Effect of temperature, food and season. Mar. Biol. 1997, 127, 609–620. [Google Scholar] [CrossRef]
- Rey, C.; Carlotti, F.; Tande, K.; Hygum, B.H. Egg and faecal pellet production of Calanus finmarchicus females from controlled mesocosms and in situ populations: Influence of age and feeding history. Mar. Ecol. Prog. Ser. 1999, 188, 133–148. [Google Scholar] [CrossRef]
- Campbell, R.W.; Head, E.J.H. Egg production rates of Calanus finmarchicus in the western North Atlantic: Effect of gonad maturity, female size, chlorophyll concentration, and temperature. Can. J. Fish. Aquat. Sci. 2000, 57, 518–529. [Google Scholar] [CrossRef]
- Rey-Rassat, C.; Irigoien, X.; Harris, R.; Head, R.; Carlotti, F. Egg production rates of Calanus helgolandicus females reared in the laboratory: Variability due to present and past feeding conditions. Mar. Ecol. Prog. Ser. 2002, 238, 139–151. [Google Scholar] [CrossRef]
- Hirst, A.; Bunker, A. Growth of marine planktonic copepods: Global rates and patterns in relation to chlorophyll a, temperature, and body weight. Limnol. Oceanogr. 2003, 48, 1988–2010. [Google Scholar] [CrossRef]
- Niehoff, B. Life history strategies in zooplankton communities: The significance of female gonad morphology and maturation types for the reproductive biology of marine calanoid copepods. Prog. Oceanogr. 2007, 74, 1–47. [Google Scholar] [CrossRef]
- Checkely, D.M., Jr. Food limitation of egg production by a marine, planktonic copepod in the sea off southern California. Limnol. Oceanogr. 1980, 25, 991–998. [Google Scholar] [CrossRef]
- Uye, S.-i.; Shibuno, N. Reproductive biology of the planktonic copepod Paracalanus sp. in the Inland Sea of Japan. J. Plankton Res. 1992, 14, 343–358. [Google Scholar] [CrossRef]
- Kim, H.-J.; Moon, C.-H.; Cho, H.-J. Spacial-temporal characteristics of dinoflagellate cyst distribution in sediments of Busan Harbor. J. Korean Soc. Oceanogr. 2005, 10, 196–203. [Google Scholar]
- Yang, W.; Choi, D.H.; Won, J.; Kim, J.; Hyun, M.J.; Lee, H.; Lee, Y.; Noh, J.H. Weekly variation of phytoplankton communities in the inner bay of Yeong-do, Busan. J. Korean Soc. Oceanogr. 2021, 26, 356–368. [Google Scholar]
- Seo, M.H.; Shin, K.; Jang, M.-C.; Soh, H.Y. Occurrence patterns of zooplankton present in ports of Korea during summer. Korean J. Environ. Biol. 2013, 31, 448–457. [Google Scholar] [CrossRef]
- Parsons, T.R.; Maita, Y.; Lalli, C.M. A Manual of Chemical and Biological Methods for Seawater Analysis; Pergamon Press: New York, NY, USA, 1984; p. 173. [Google Scholar]
- Huntley, M.E.; Lopez, M.D. Temperature-dependent production of marine copepods: A global synthesis. Am. Nat. 1992, 140, 201–242. [Google Scholar] [CrossRef]
- Zar, J.H. Biostatistical Analysis, 2nd ed.; Prentice-Hall, Inc.: Upper Saddle River, NJ, USA, 1984. [Google Scholar]
- Vollenweider, R.A. Coastal marine eutrophication: Principles and control. In Marine Coastal Eutrophication; Elsevier: Amsterdam, The Netherlands, 1992; pp. 1–20. [Google Scholar]
- Ban, S.; Burns, C.; Castel, J.; Chaudron, Y.; Christou, E.; Escribano, R.; Umani, S.F.; Gasparini, S.; Ruiz, F.G.; Hoffmeyer, M. The paradox of diatom-copepod interactions. Mar. Ecol. Prog. Ser. 1997, 157, 287–293. [Google Scholar] [CrossRef]
- Ianora, A.; Poulet, S.A.; Miralto, A. The effects of diatoms on copepod reproduction: A review. Phycologia 2003, 42, 351–363. [Google Scholar] [CrossRef]
- Kang, H.-K.; Poulet, S.A. Reproductive success in Calanus helgolandicus as a function of diet and egg cannibalism. Mar. Ecol. Prog. Ser. 2000, 201, 241–250. [Google Scholar] [CrossRef]
- Suzuki, K.; Nakamura, Y.; Hiromi, J. Feeding by the small calanoid copepod Paracalanus sp. on heterotrophic dinoflagellates and ciliates. Aquat. Microb. Ecol. 1999, 17, 99–103. [Google Scholar] [CrossRef]
- Sanders, R.W.; Wickham, S.A. Planktonic protozoa and metazoa: Predation, food quality and population control. Mar. Microb. Food Webs 1993, 7, 197–223. [Google Scholar]
- Richardson, A.J.; Verheye, H.M. The relative importance of food and temperature to copepod egg production and somatic growth in the southern Benguela upwelling system. J. Plankton Res. 1998, 20, 2379–2399. [Google Scholar] [CrossRef]
- Yang, E.J.; Choi, J.K.; Hyun, J.-H. Seasonal variation in the community and size structure of nano-and microzooplankton in Gyeonggi Bay, Yellow Sea. Estuar. Coast. Shelf Sci. 2008, 77, 320–330. [Google Scholar] [CrossRef]
- Lee, S.S. Distribution of copepods in Chinhae Bay and its adjacent region. Bull. Fish. Res. Dev. Agency 1972, 9, 7–27. [Google Scholar]
- Soh, H.Y.; Lee, I.-T.; Yoon, Y.H.; Choi, S.D.; Lee, S.N.; Han, M.I.; Kim, B.S.; Kang, Y.H.; Lee, W.B. Species composition and occurrence patterns of zooplankton in Gamag Bay. Korean J. Environ. Biol. 2002, 20, 118–129. [Google Scholar]
- Jang, M.-C.; Jang, P.-G.; Shin, K.; Park, D.-W.; Chang, M. Seasonal variation of zooplankton community in Gwangyang Bay. Korean J. Environ. Biol. 2004, 22, 11–29. [Google Scholar]
- Kiørboe, T. Sex, sex-ratios, and the dynamics of pelagic copepod populations. Oecologia 2006, 148, 40–50. [Google Scholar] [CrossRef] [PubMed]
- Choi, K.-H.; Kimmerer, W. Mating success and its consequences for population growth in an estuarine copepod. Mar. Ecol. Prog. Ser. 2009, 377, 183–191. [Google Scholar] [CrossRef]
- Mauchline, J. The Biology of Calanoid Copepods; Academic Press: London, UK, 1998; p. 710. [Google Scholar]
Figure 1.
Sampling station in Busan Harbor, Korea. KMOU: Korea Maritime and Ocean University.

Figure 2.
Variations of water temperature (a), salinity (b), and chlorophyll-a concentration (c).

Figure 3.
Variation of the abundance of adult females of P. parvus.

Figure 4.
Variation of the proportion of females of P. parvus.

Figure 5.
Variation of the prosome length of adult females of P. parvus. Vertical bars indicate the standard deviation.
Figure 5.
Variation of the prosome length of adult females of P. parvus. Vertical bars indicate the standard deviation.

Figure 6.
Relationship between water temperature and the prosome length of adult female of P. parvus.
Figure 6.
Relationship between water temperature and the prosome length of adult female of P. parvus.

Figure 7.
Variation of the monthly egg production rate (EPR) (a) and egg hatching success (b) of P. parvus. Vertical bars indicate the standard deviation.
Figure 7.
Variation of the monthly egg production rate (EPR) (a) and egg hatching success (b) of P. parvus. Vertical bars indicate the standard deviation.

Figure 8.
Relationships between chlorophyll-a concentration and the egg production rate (EPR) (a) or weight-specific egg production rate (WSEPR) (b) of P. parvus.
Figure 8.
Relationships between chlorophyll-a concentration and the egg production rate (EPR) (a) or weight-specific egg production rate (WSEPR) (b) of P. parvus.

Figure 9.
Variation of the monthly nauplii production of P. parvus.


Table 1.
Summary of the seasonal mean egg production rate (eggs female–1 d–1) of P. parvus in 2020 and 2021. Numbers in the brackets indicate standard deviation.
Table 1.
Summary of the seasonal mean egg production rate (eggs female–1 d–1) of P. parvus in 2020 and 2021. Numbers in the brackets indicate standard deviation.
| Year | Winter (Jan–Mar) | Spring (Apr–Jun) | Summer (Jul–Sep) | Autumn (Oct–Dec) | Mean |
|---|---|---|---|---|---|
| 2020 | 14.4 (13.5) | 30.7 (14.9) | 20.7 (10.5) | 6.2 (7.0) | 18.0 (13.8) |
| 2021 | 5.4 (3.2) | 14.2 (8.9) | 11.5 (14.5) | 3.0 (1.8) | 8.5 (8.8) |
Table 2.
Comparison of egg production rate (EPR) and weight-specific egg production rate (WSEPR) of P. parvus by region. The values in parentheses indicate mean rates.
Table 2.
Comparison of egg production rate (EPR) and weight-specific egg production rate (WSEPR) of P. parvus by region. The values in parentheses indicate mean rates.
| Region | Season | Temp. | Chl-a | EPR | WSEPR | Reference |
|---|---|---|---|---|---|---|
| (°C) | (µg L–1) | (eggs female–1 d–1) | (d–1) | |||
| off southern California, USA | Feb–Mar Aug–Sep | 12.3–15.9 15.0–22.0 | 0.46–6.92 0.09–1.12 | 2.5–83.1 (24.0 a) 2.1–21.2 (8.9 a) | nd | [36] |
| Skagerrak | Aug | 16–17 | 0.38–1.5 | 4.5–31.1 (15.6) | 0.06–0.23 | [19] |
| off Newport, Orgon, USA | Jul–Sep | 15.7–18.1 | <2.0–16.2 | (7.4) | 0.00–0.16 | [12] |
| Bahía Magdalena, Mexico | Feb–Mar | <20–21.1 | 0–5.8 | 4–23 (6.4) | 0–0.20 | [20] |
| Fukuyama Harbor, Japan | One year | 8.9–28.2 | 0.7–322 | 4.5–41 | 0.33 b | [9] |
| Jiaozhou Bay, China (mouth and outer) | One year | 3.5–25.0 | <2.03 | 7.6–11.4 | nd | [21] |
| Jangmok Bay, Korea | One year | 5.3–26.9 | 1.0–15.2 | <1–24 (4.0) | <0.01–0.26 | [24] |
| Seomjin River estuary, Korea | Feb, May Aug, Nov | 5.3–27.1 | 1.8–13.4 | nd | 0.11–0.17 b 0.32 c | [22] |
| Busan Harbor, Korea | Two years | 11.5–26.5 | 0.57–9.89 (2.60) | 0.5–47.0 (13.3) | 0.005–0.43 (0.12) | Present study |
Disclaimer/Publisher’s Note: The statements, opinions and data contained in all publications are solely those of the individual author(s) and contributor(s) and not of MDPI and/or the editor(s). MDPI and/or the editor(s) disclaim responsibility for any injury to people or property resulting from any ideas, methods, instructions or products referred to in the content. |
© 2023 by the authors. Licensee MDPI, Basel, Switzerland. This article is an open access article distributed under the terms and conditions of the Creative Commons Attribution (CC BY) license (https://creativecommons.org/licenses/by/4.0/).
Share and Cite
MDPI and ACS Style
Kang, H.-K.; Kim, G. Egg Production Rate of the Copepod Paracalanus parvus s. l. in Busan Harbor, Korea. Water 2023, 15, 1581. https://doi.org/10.3390/w15081581
AMA Style
Kang H-K, Kim G. Egg Production Rate of the Copepod Paracalanus parvus s. l. in Busan Harbor, Korea. Water. 2023; 15(8):1581. https://doi.org/10.3390/w15081581
Chicago/Turabian StyleKang, Hyung-Ku, and Garam Kim. 2023. "Egg Production Rate of the Copepod Paracalanus parvus s. l. in Busan Harbor, Korea" Water 15, no. 8: 1581. https://doi.org/10.3390/w15081581
Note that from the first issue of 2016, this journal uses article numbers instead of page numbers. See further details here.