Article

Feasibility of Time-Dependent Amplitude in Pulse-Compressed Broadband Acoustic Signals for Determining the Dorsal Orientation of Fish

1
Institute of Hydrobiology, Biology Centre, Czech Academy of Sciences, 370 05 České Budějovice, Czech Republic
2
Institute of Computer Science, Czech Academy of Sciences, 182 00 Prague, Czech Republic
3
Department of Physics, University of Oslo, 0316 Oslo, Norway
4
Faculty of Science, Institute for Environmental Studies, Charles University, 128 01 Prague, Czech Republic
*
Author to whom correspondence should be addressed.
Water 2023, 15(8), 1596; https://doi.org/10.3390/w15081596
Submission received: 13 March 2023 / Revised: 4 April 2023 / Accepted: 18 April 2023 / Published: 20 April 2023
(This article belongs to the Section Biodiversity and Functionality of Aquatic Ecosystems)

Abstract

:
Fish body orientation significantly influences the size obtained with hydroacoustic signals, and thus the estimate of fish size and biomass. For this reason, each characteristic of a target’s echo can be advantageous for developing algorithms to refine acoustic fish estimates. We measured pulse-compressed broadband acoustic signals from tethered fish (common bream Abramis brama) in different dorsal positions. Based on generalized additive mixed models (GAMM), we initially tested the influence of the fish dorsal aspect on the amplitude echo envelope and amplitude echo descriptors (amplitude maximum and amplitude echo length at seven different levels below the maximum) by altering the fish dorsal orientation. Our study confirmed that the dorsal aspect influenced the shapes of the amplitude echo envelopes in both fast- and slow-tapered pulses. Furthermore, we found that echo lengths approximately 15 dB below the amplitude maximum, especially for fast-tapered signals, could provide good characteristics of the echo-envelope shape for determining the fish dorsal aspect and facilitating thus the conversion between acoustic target strength and true fish length.

1. Introduction

Use of underwater acoustics is a common technique for remotely and noninvasively estimating the size and density of marine and freshwater fishes [1]. Unfortunately, acoustic signals from targets are influenced by numerous factors such as the inherent properties of the target, the orientation of the target’s body relative to the sound beam, the environment and the acoustic observational system. In addition, acoustic signals lack unique characteristics for species identification. Therefore, determining the actual size and species of targets without assumptions or biological sampling is of great interest to users of noninvasive monitoring techniques.
The current interest in broadband acoustics as a potential monitoring tool may shed light on the problems of size determination and species identification [2]. Broadband echosounders emit acoustic pulses that contain a continuous, wide range of frequencies, usually extending linearly over an octave (the highest band frequency is twice the lowest band frequency) or more. This frequency range can enable better characterization of observed targets and potentially provide more information about fish characteristics, behavior and species. However, broadband echosounders use long pulses (0.512 ms or longer) to provide sufficient energy for the realization of individual frequencies.
These long pulses reduce the temporal or range resolution between observed targets, which is determined as half the duration of the transmission pulse (0.4 m or longer at a sound speed of 1500 m/s). For this reason, broadband acoustics offers significant advantages when combined with matched-filter processing, also known as pulse-compression processing [3]. This technique was developed to improve the detection of a known signal in the presence of random noise. The received acoustic signal is cross-correlated with a known, noise-free “replica” signal (usually a transmission or calibration signal). After processing a broadband pulse with the matched-filter technique, the resulting acoustic signal has a higher amplitude and shorter duration, which greatly increases the range resolution. Thus, the range resolution is independent of the duration of the transmitted pulse, as it is in narrowband acoustics, and is determined based on the inverse signal bandwidth [4,5]. However, the drawback of this matched-filter technique is that it introduces artificial filter sidelobes into the resulting acoustic signal that are related to the duration of the transmit pulse and the frequency content of the signal. These filter sidelobes can complicate target detection and characterization.
Most studies dealing with broadband signals have been devoted to target characterization in terms of species identification based on the frequency responses of broadband signals (e.g., [6,7,8,9]). However, fish size does not appear to be a major factor in determining frequency responses [10,11]. There are only a few studies that focus on examining broadband signals to obtain fish size and fish body orientation [5,12,13,14]. The most important element in estimating the actual fish size is the strong dependence of the acoustic fish size on the orientation of the body to the emitted sound (e.g., [15]).
Direct determination of the body orientation from an acoustic recording of free-swimming fish requires considerable effort, but is an essential factor in increasing the accuracy of target size determination and thus acoustic density estimation. Determination of the fish orientation in stationary acoustic observations using acoustic tracking is straightforward when the direction of target motion on the acoustic record actually represents the angle of body orientation of the moving target toward a transducer [16,17,18,19]. However, for mobile acoustic surveying, this method is not entirely applicable, as observed fish can consist of only a single or few echoes as a survey vessel passes relatively rapidly over the targets. Additionally, most acoustic surveys are conducted at night, when fish scattered in the open water may be sleeping or resting with their bodies oriented at angles differing from their short fish tracks. Therefore, it would be ideal and advantageous to infer fish orientation from the least data with the fewest assumptions [5].
In narrowband acoustics, the fish body orientation has a pronounced effect on the duration and shape of the echo envelopes of large fish observed in side/lateral view [20]. At (near-)side angles, the echo envelopes are unimodal and symmetric, resembling the echo envelopes of calibration spheres. As the oblique angle increases, the echo shapes become less symmetrical as the number and spacing of peaks increase and the echo duration and amplitude become more variable [20]. To decipher fish orientation from pulse-compressed broadband acoustic signals, the study of Stanton et al. [5] demonstrated that body orientation could be inferred if the fish length is known. Jaffe and Roberts [12] showed that multiview acoustic systems are promising devices for inferring fish orientation, but receiving backscatter at multiple angles can be challenging in practice. The studies by Kubilius et al. [13,14] on artificial fish-like targets and tethered fish showed that broadband acoustic pulses had a realistic potential for determining the true horizontal size of targets using amplitude peaks representing individual target boundaries, but the determination of body orientation was not considered. Kubilius et al. [13] anticipated that if the peaks of the target’s boundaries were not identified, the length of the target’s echo could be used to estimate the target’s size.
The goal of the work presented here was to investigate the potential for determining dorsal fish orientation using the time-dependent amplitude of pulse-compressed broadband acoustic signals from a downward-facing transducer. We present experimentally collected broadband data from a frequency range of 90 to 170 kHz, in which acoustic backscattering was measured as a function of dorsal orientation (tilt angle) for a number of fish with different known sizes using either fast- or slow-tapered pulses. This study had two objectives.
First, we examined the interaction between fish tilt angle from the dorsal aspect and echo amplitude, expressed as acoustic target strength (TS in decibels, dB), in pulse-compressed broadband acoustic signals. We anticipated that an increase in the fish tilt angle would have an effect on the echo amplitude at both fast- and slow-tapered signals.
Second, we examined the effect of the fish tilt angle on amplitude echo descriptors, particularly the amplitude maximum and echo pulse duration, here referred to as echo length, at seven different levels below the amplitude maximum.

2. Materials and Methods

2.1. Experiment with Fish Observed in Dorsal Aspects

2.1.1. Experimental Site

Hydroacoustic experiments with fish at specific dorsal positions were conducted in the open water of the Římov reservoir (16 km south of České Budějovice, Czech Republic). The entire system was mounted in a floating boat garage, which was a suitable working platform and provided weather protection for the equipment and experiments. The water column under the garage was approximately 5 m deep, and its temperature profile was constant during the experimental period in June 2020.

2.1.2. Hydroacoustic Description and Settings

The experimental hydroacoustic data were collected using a compact version of a Simrad EK80 Wide Band Transceiver (WBT Mini) and a Simrad ES120-7C split-beam transducer with a nominal center frequency fnom at 120 kHz. The entire echosounder was operated with Simrad EK80 software (Simrad, Kongsberg Maritime AS, Horten, Norway) and calibrated with a 38.1-mm sphere of tungsten carbide (WC) containing 6% cobalt binder [21]. The system was set to transmit frequency-modulated upsweep pulses over a frequency band from 90 to 170 kHz with a pulse duration of 0.512 ms. The transmitted signals were either fast-tapered (fast ramping: the first two and last two wavelengths were smoothly tapered with a half cosine wave) or slow-tapered (slow ramping: half the pulse duration to reach maximum amplitude and the remaining half to decay [22]). The transducer was placed on the bottom below the working platform and supported by a float to balance the transducer sound beam to aim perpendicular to the water surface (Figure 1).

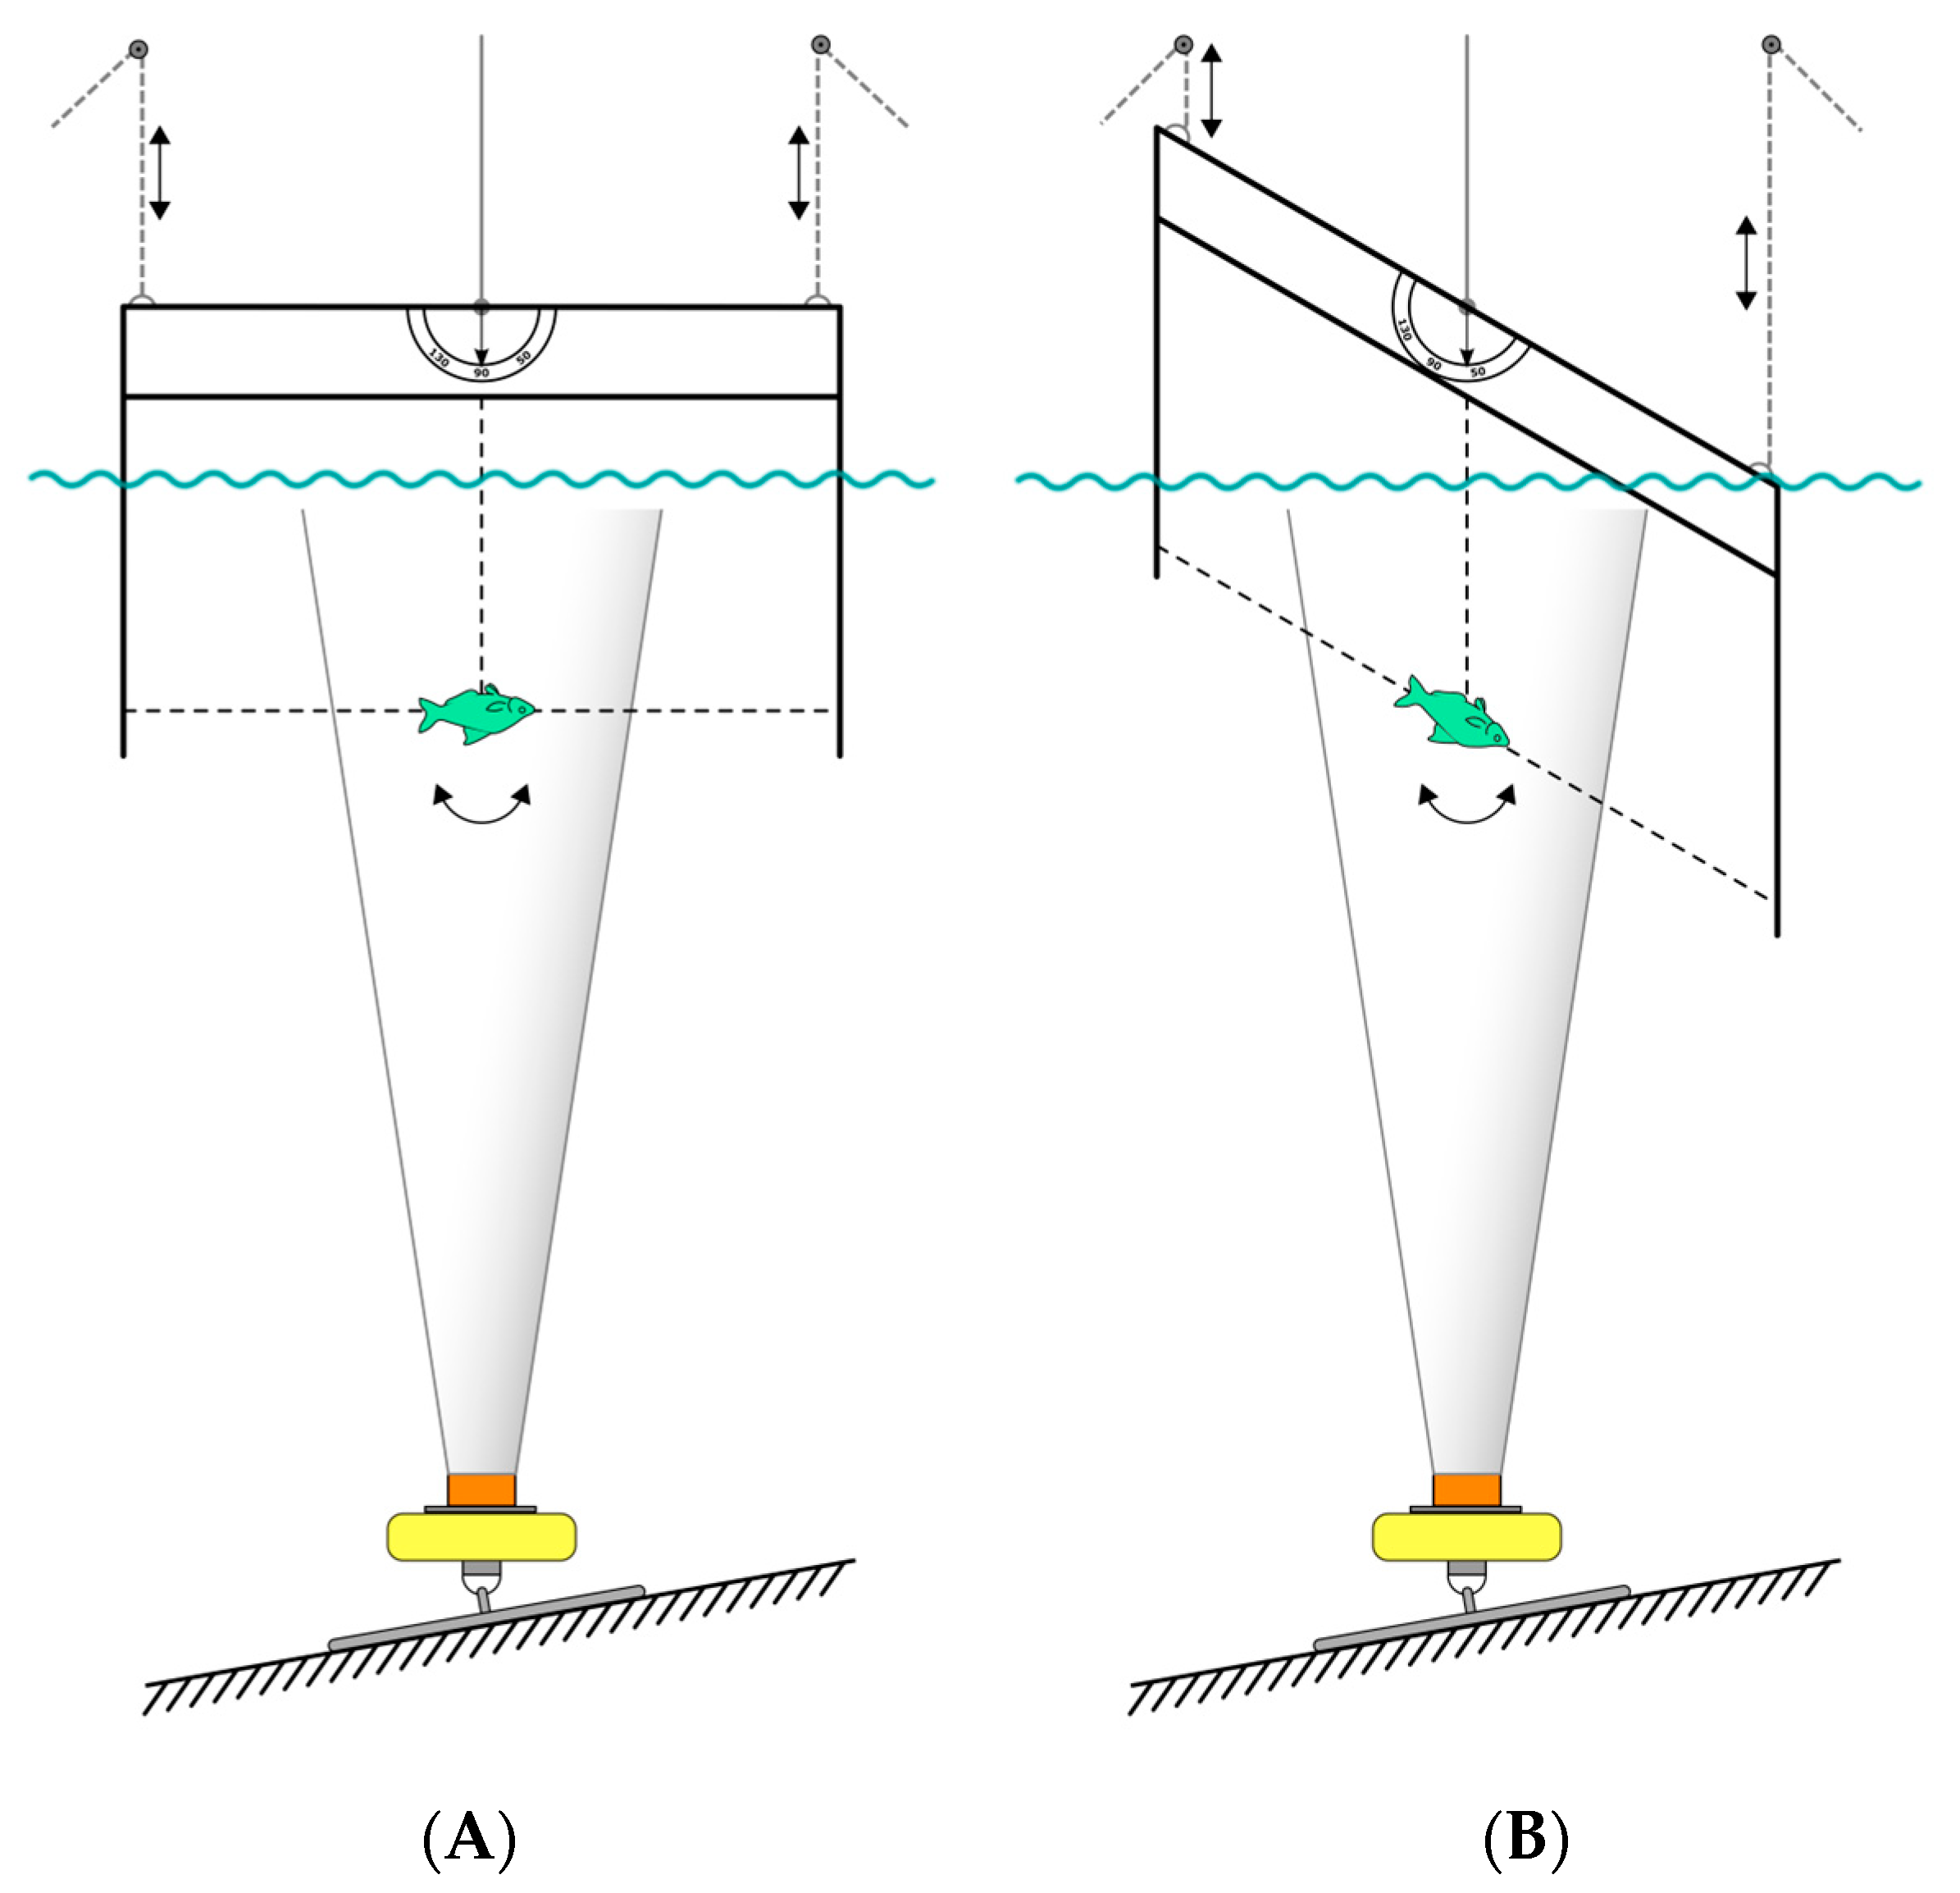
2.1.3. Experimental Procedure

In this study, seven individuals of the common bream Abramis brama (L.) ranging in size from 20.5 to 40 cm were examined (Table 1). Bream is a slender and deep-bodied species with a two-chambered swim bladder and is one of the most common cyprinid species in Central Europe. All subjects were electrofished in a tributary of the reservoir as part of an ongoing biomanipulation (removal of planktivorous fish from the reservoir) and confined in a special enclosure prior to the experiments.
Prior to the experiment, each fish was anesthetized with tricaine mesylate (MS-222) and their standard length, total length, and weight were measured. The anesthetized fish were then carefully tethered upside-down in a frame with 0.3 mm fishing lines (see also [15,23]). Briefly, three fishing lines were sewn into the jaw, tail and abdomen of the fish. The head and tail lines were tightened to the lower ends of the vertical metal bars of the frame, while the abdomen line was attached to the center of the frame’s horizontal rig. The head, tail and abdomen lines were slightly stretched to keep the fish in a straight, upright position in the water. The frame with the tethered fish was then placed over the location where the transducer rested on the bottom and lowered into the water so that the fish was approximately 1 m below the water surface and directly above the transducer (Figure 1). At this depth, acoustic signals from fish have been empirically verified to be unaffected by the water surface. Each tethered fish was recorded at nine discrete dorsal angular positions with a step size of 10 degrees in a span of 80 degrees, with the central angle represented as zero degrees, where the fish was positioned in the true dorsal aspect. We started at an angle of −40 degrees with the fish head tilted toward the transducer (head-up dorsal orientation in the natural position) and with the echosounder emitting fast-tapered acoustic pulses. At each angle, the fish remained stable for two minutes to ensure that the natural variability of the fish’s acoustic signal was captured. The fish was then moved to the subsequent tilt angle position until the tilt angle was +40 degrees, with the fish tail tilted toward the transducer (head-down dorsal orientation in the natural position). Recording was then stopped, the echosounder was reset to slow-tapered pulses, and the entire process was repeated in the reverse order (i.e., from a tilt angle of +40 to −40 degrees).
Due to the ongoing biomanipulation in the reservoir, no captured planktivorous fish were allowed to be returned to the reservoir. Therefore, each fish was placed back into the anesthetic bath after the recording and humanely euthanized.

2.2. Data Processing and Analysis

2.2.1. Extraction of Amplitude Echo Envelopes

All post-processing of hydroacoustic data was performed using Sonar5-Pro software (CageEye AS, Oslo, Norway). The split-beam transducer received returning signals from observed targets in four quadrants to allow beam directivity compensation [1]. Each of the four quadrants (Q) of the transducer provided a column of complex numbers in a matrix, with an increasing row number indicating an increasing range from the transducer. Thus, each row represented one range bin (approximately 0.4 cm each at a sound speed of 1481 m s−1). The matched-filter algorithm was run in Sonar5-Pro on the recorded matrix to generate a new similar matrix of complex numbers. The amplitude (A) for each range bin was obtained by averaging all the values in each range bin as shown below:
A r , c = 1 4 q = 1 4 Q r , q
where c represents a complex number, r represents the range bin, and q represents the column (1–4). For each r, a final amplitude value was then calculated as follows:
A r = A r , R e 2 + A r , I m 2
where Re is the real part and Im is the imaginary part. This amplitude value was modified by the echosounder receiver impedance and the appropriate sonar equations to obtain the actual acoustic size, presented as acoustic target strength (TS) in decibels (dB).
For each fish, fish tilt angle, and signal ramping, we extracted more than 50 random samples (104 ± 18 samples on average ± SD) to capture the variability of signal data. The sample was normalized to 100 percent of the given pulse duration, represented by 203 range bins. Since the target was stable in the acoustic beam, the target produced a horizontal line of echoes in the amplitude echogram. Sampling with Sonar5-Pro was then performed by tracing a line longitudinally across the horizontal recording of the fish; the software automatically took random samples from the recording and centered them according to their highest peak of amplitude backscatter at the sampled locations. Each sample was saved as an individual .txt file.

2.2.2. Extraction of Amplitude Echo Descriptors

To characterize the shape of the amplitude echo envelope, the study focused on the maximum of the amplitude and the echo pulse duration, here referred to as echo length. From each sample, we extracted the maximum value (AMAX) and echo length (EL) at seven specified levels. To set length levels relative to all fish sizes and tilt angles, the length level was determined as a difference from AMAX. AMAX was considered the least influenced value, since the lowest amplitude values might be influenced by ambient noise. We empirically chose length levels at 3, 6, 9, 12, 15, 18 and 24 dB below AMAX, where EL3dB represents the highest level and EL24dB represents the lowest level. To calculate EL at a specified level, the maximum and minimum row values for all amplitude values higher than the specified level were subtracted (i.e., EL equals the number of amplitude range bins at the given level).

2.2.3. Modeling of Amplitude Echo Envelopes and Descriptors

The data were statistically modeled using the generalized additive mixed model (GAMM) approach based on the general formulation of the generalized additive model (GAM, [24,25]) with a full-rank penalty allowing for random effects. The smoothing effects were implemented as complexity-penalized splines [25,26].
In particular, we used two model types: M1 for the raw measurements (the observed amplitude profile measured along time within a pulse) and M2 for derived characteristics from the time profile (AMAX and ELs derived for the profile at each combination of the individual body angle × fish × replication separately). Each model was fitted separately for fast and slow ramping data; specifically, we effectively stratified the ramping type, allowing all effects to potentially interact with ramping type.
The models were formulated after preliminary exploratory data analysis (EDA, [27]) as follows:
Model M1:
Y i t a = μ + b i + s s i z e s i z e i + s a n g l e   p r o f i l e a , t + ε i a t r
where:
  • Y i t a is the response (such as the measured amplitude) for fish i, angle a, time t (within a pulse) and replicate r;
  • μ is the (unknown) intercept parameter;
  • b i ~ N 0 , σ b 2 is the individual-specific random effect (distribution of which depends on unknown variance parameter σ b 2 );
  • s s i z e is an (unknown) smooth component (function of one variable), implemented as a thin-plate spline [28];
  • s a n g l e   p r o f i l e is an (unknown) smooth component (function of two variables), implemented as a factor smooth interactive term (called “factor smooth interactions”, [25]). This term formalizes the interaction between (within-pulse) time and angle. Specifically, it allows for time profile deformation in relation to the body angle. This is a key term with respect to the main purpose of the study;
  • ε i t ~ N 0 , σ 2 is a (theoretical) residual with unknown variance parameter σ 2 .
Model M2:
Y i a = μ + b i + β . s i z e i + s a n g l e a + ε i a r
where:
  • Y i a is the response (AMAX or EL) for fish i, angle a and replicate r;
  • μ is the (unknown) intercept parameter;
  • b i ~ N 0 , σ b 2 is the individual-specific random effect (whose distribution depends on unknown variance parameter σ b 2 );
  • β is an (unknown) parameter (slope);
  • s a n g l e is an (unknown) smooth component (function of one variable), implemented as a thin-plate spline [28]. This is a key term with respect to the main purpose of the study (when focusing on characteristics derived from the profile).
The models were identified as follows: parameters (such as μ , σ b 2 , σ 2 , β ) and smooth components used as “functional parameters” (such as s s i z e , s a n g l e   p r o f i l e , s a n g l e ) were estimated via maximum penalized likelihood [25], and unknown penalty coefficients were estimated via the restricted maximum likelihood (REML) procedure [29] for M1 and via a generalized cross-validation [30] for M2.

2.2.4. Software

All data extracted from the hydroacoustic recordings were manipulated, analyzed and visualized in R software (version 4.2.0; [31]) using the integrated packages, the dplyr package [32], and the ggplot2 package for visualization [33]. Specifically, GAMM modeling was performed with the mgcv package [25]. For model M1, we used the big-data implementation of GAM [34] due to a rather large amount of raw data (more than 1 million rows for each ramping set).

3. Results

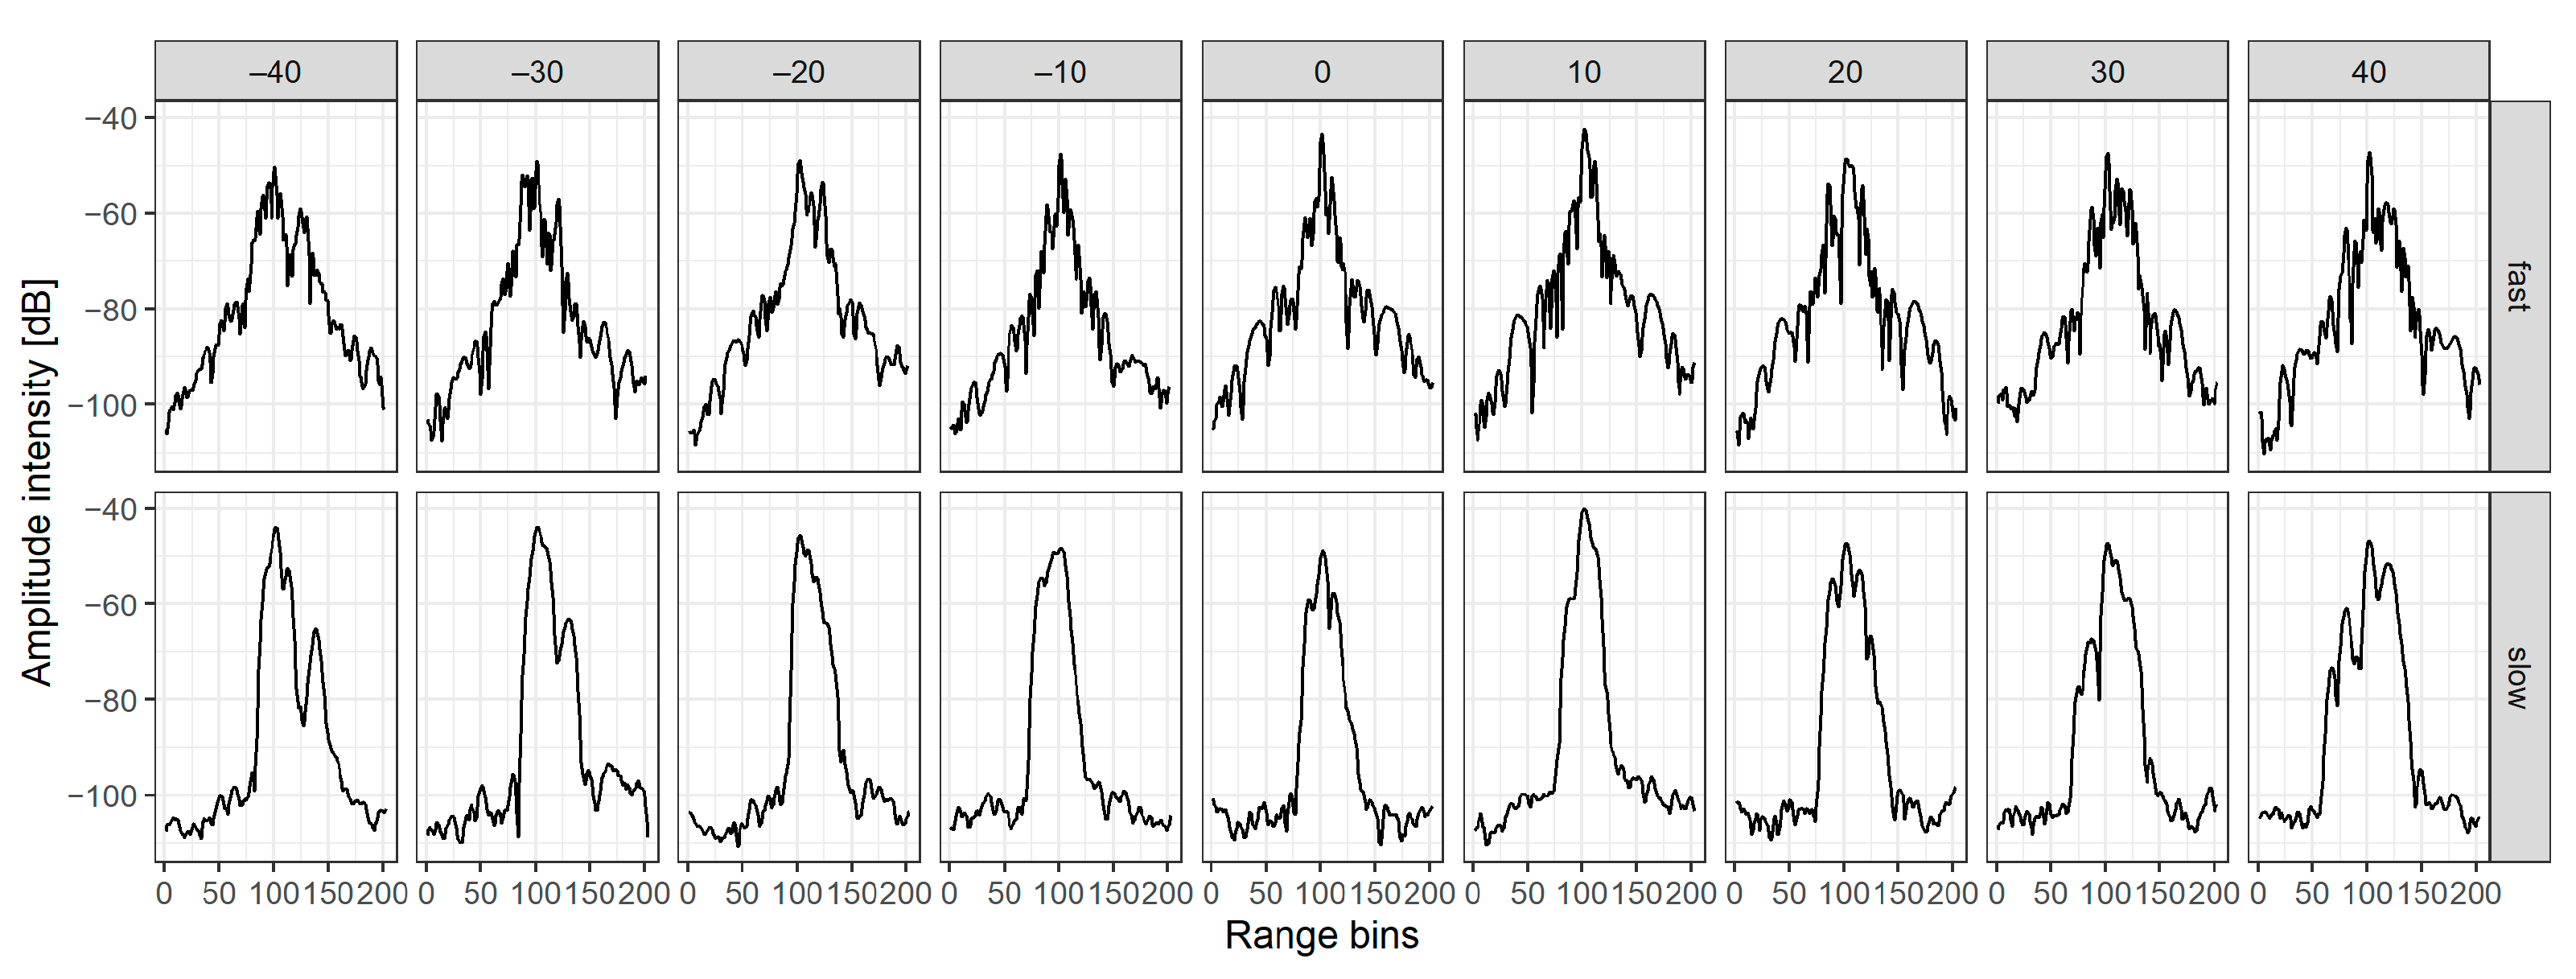
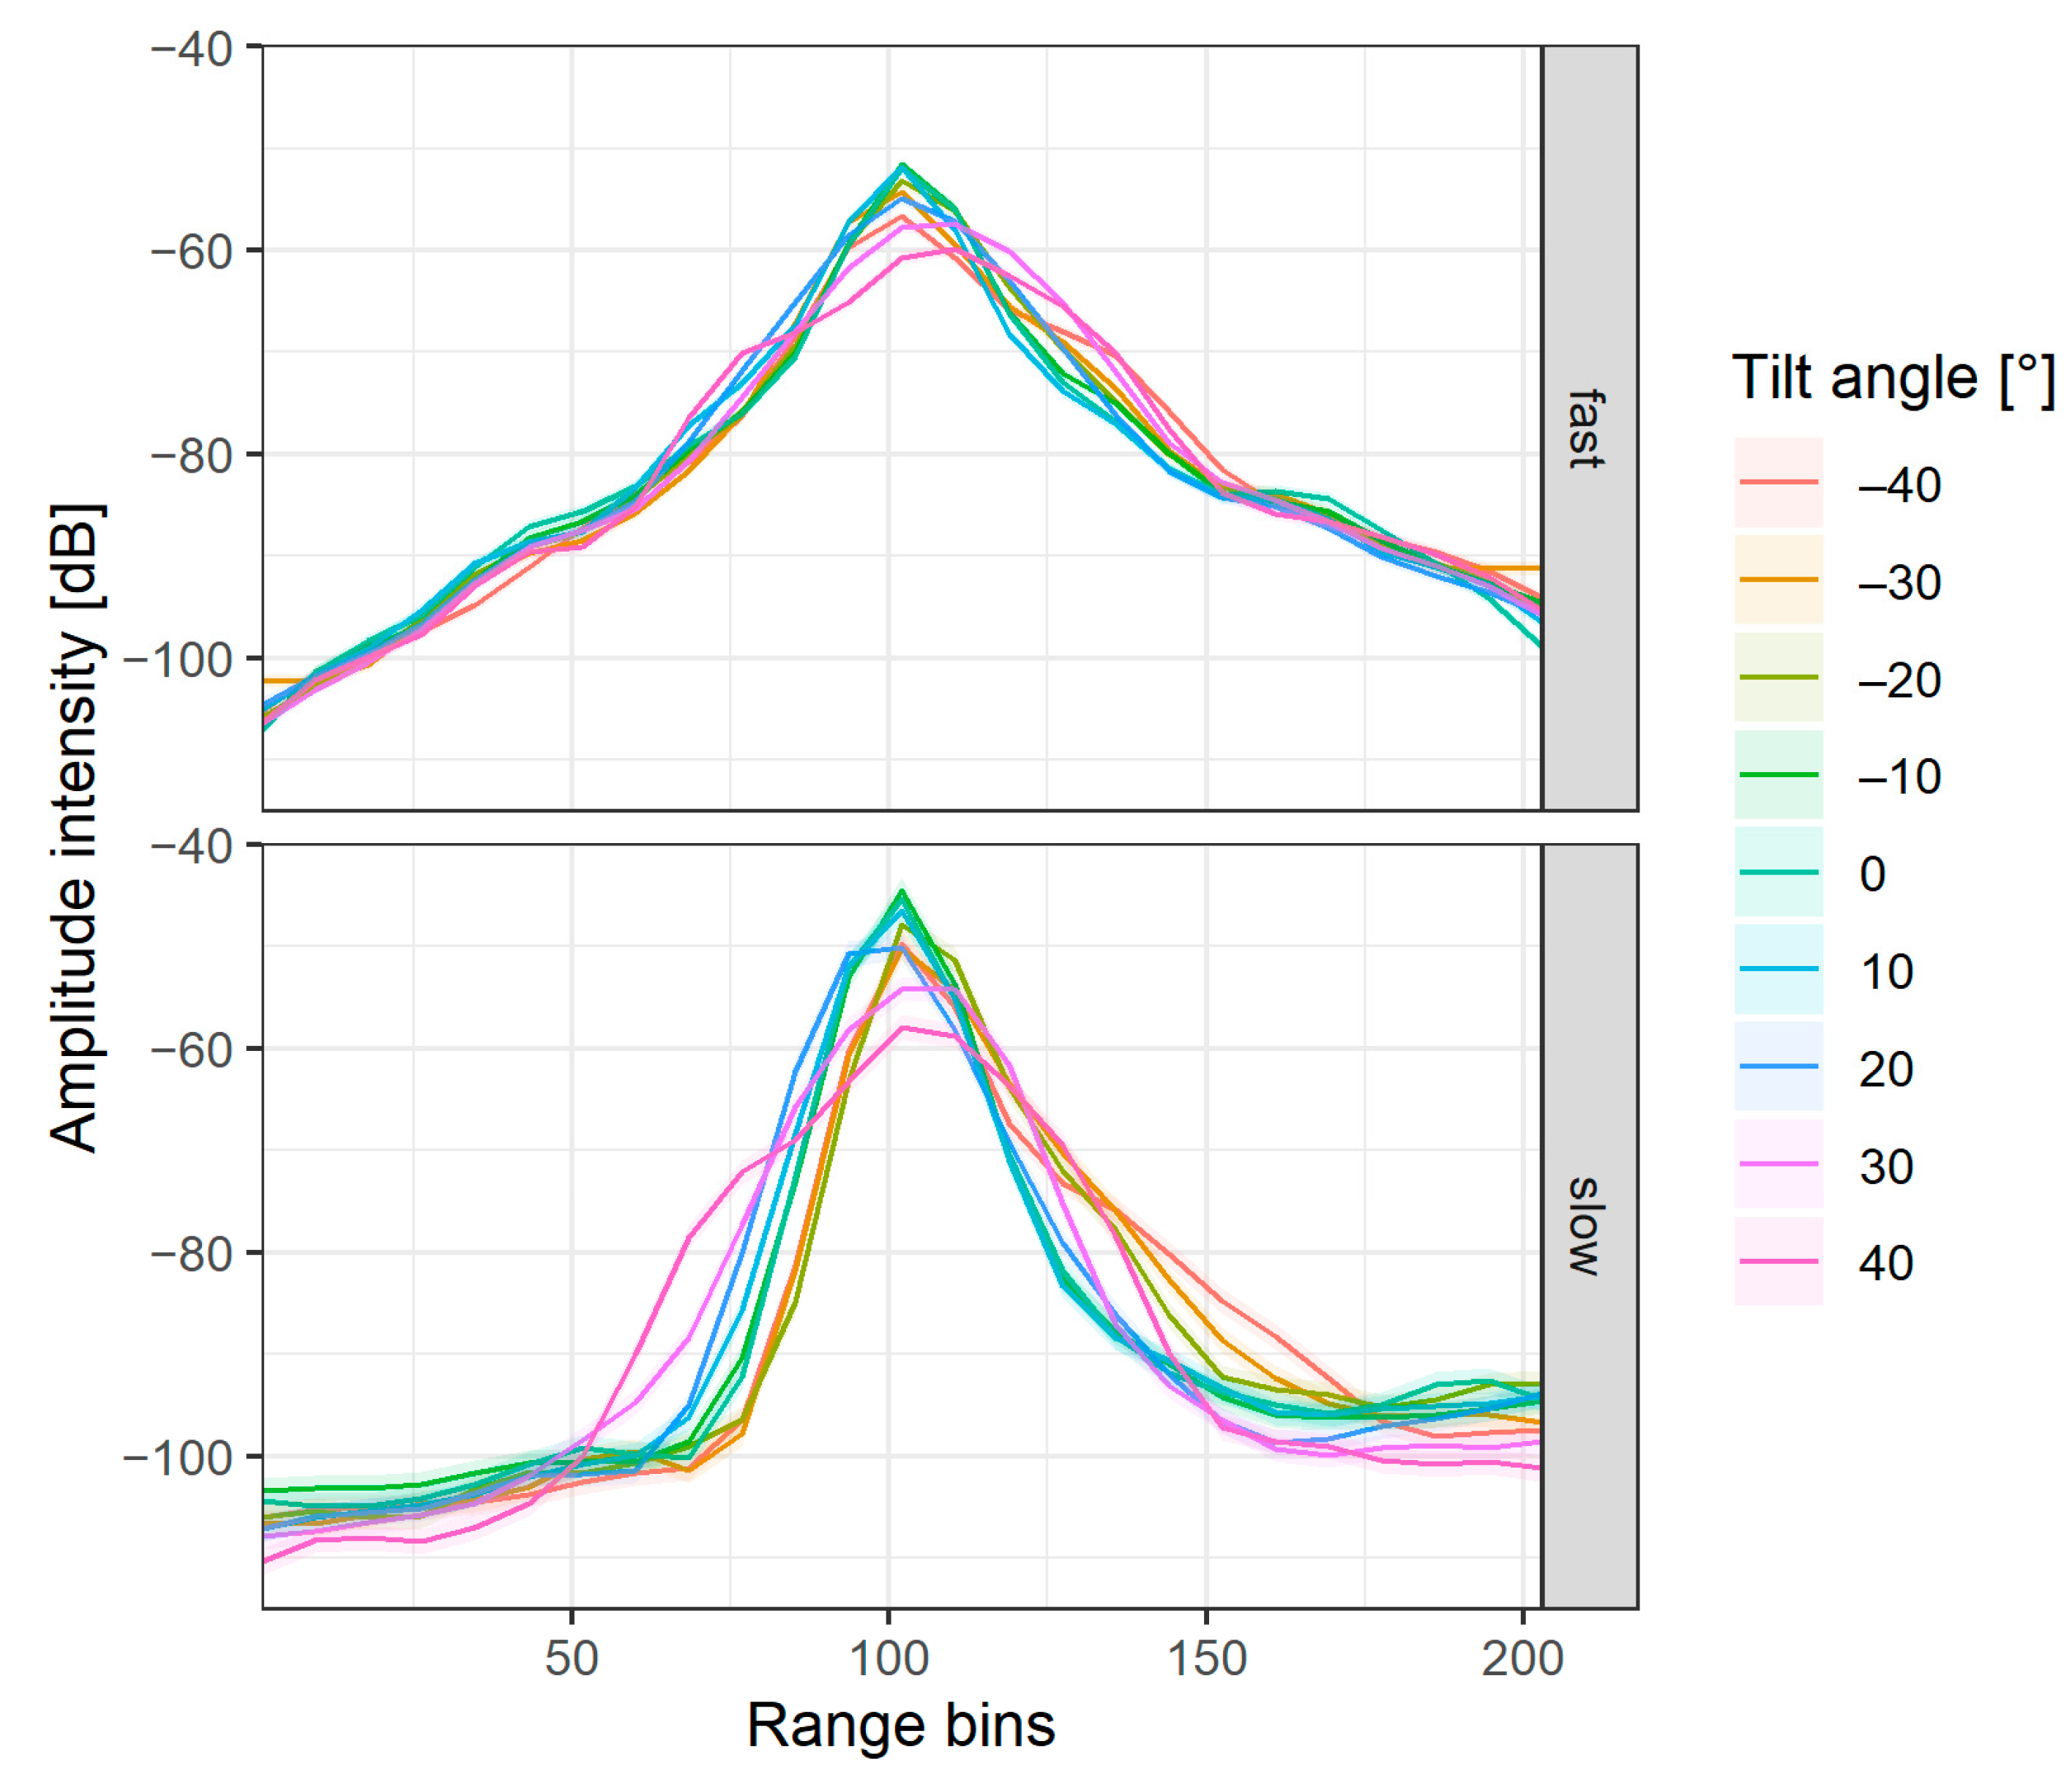
3.1. Interaction between Fish Tilt Angle and Amplitude Echo Envelope

Amplitude echo envelopes of seven differently sized bream were observed in different dorsal orientations using pulse-compressed fast- or slow-tapered broadband pulses (Figure 2).
The collected amplitude echo envelopes were modeled using the GAMM approach, based on more than one million observations for each fast and slow ramping. The shapes of the modeled amplitude echo envelopes gradually changed from the true dorsal angle to oblique tilt angles (Figure 3), which were represented by decreasing and less pointed/tailed curves (i.e., the kurtosis of the curves decreased to the oblique tilt angles). This change was more pronounced for slow-tapered than fast-tapered acoustic pulses (Figure 3).
The GAMM model (M1) for the interaction between fish tilt angle and amplitude echo envelope was able to explain 82.3% and 76.7% of the overall deviance, respectively, and identified all individual observed tilt angles as the most significant explanatory variables for both fast- and slow-tapered signals (Table 2). The effect of the size of the observed fish (20–40 cm) was statistically significant, but explained the least variation in the data within the amplitude profile (Table 2).

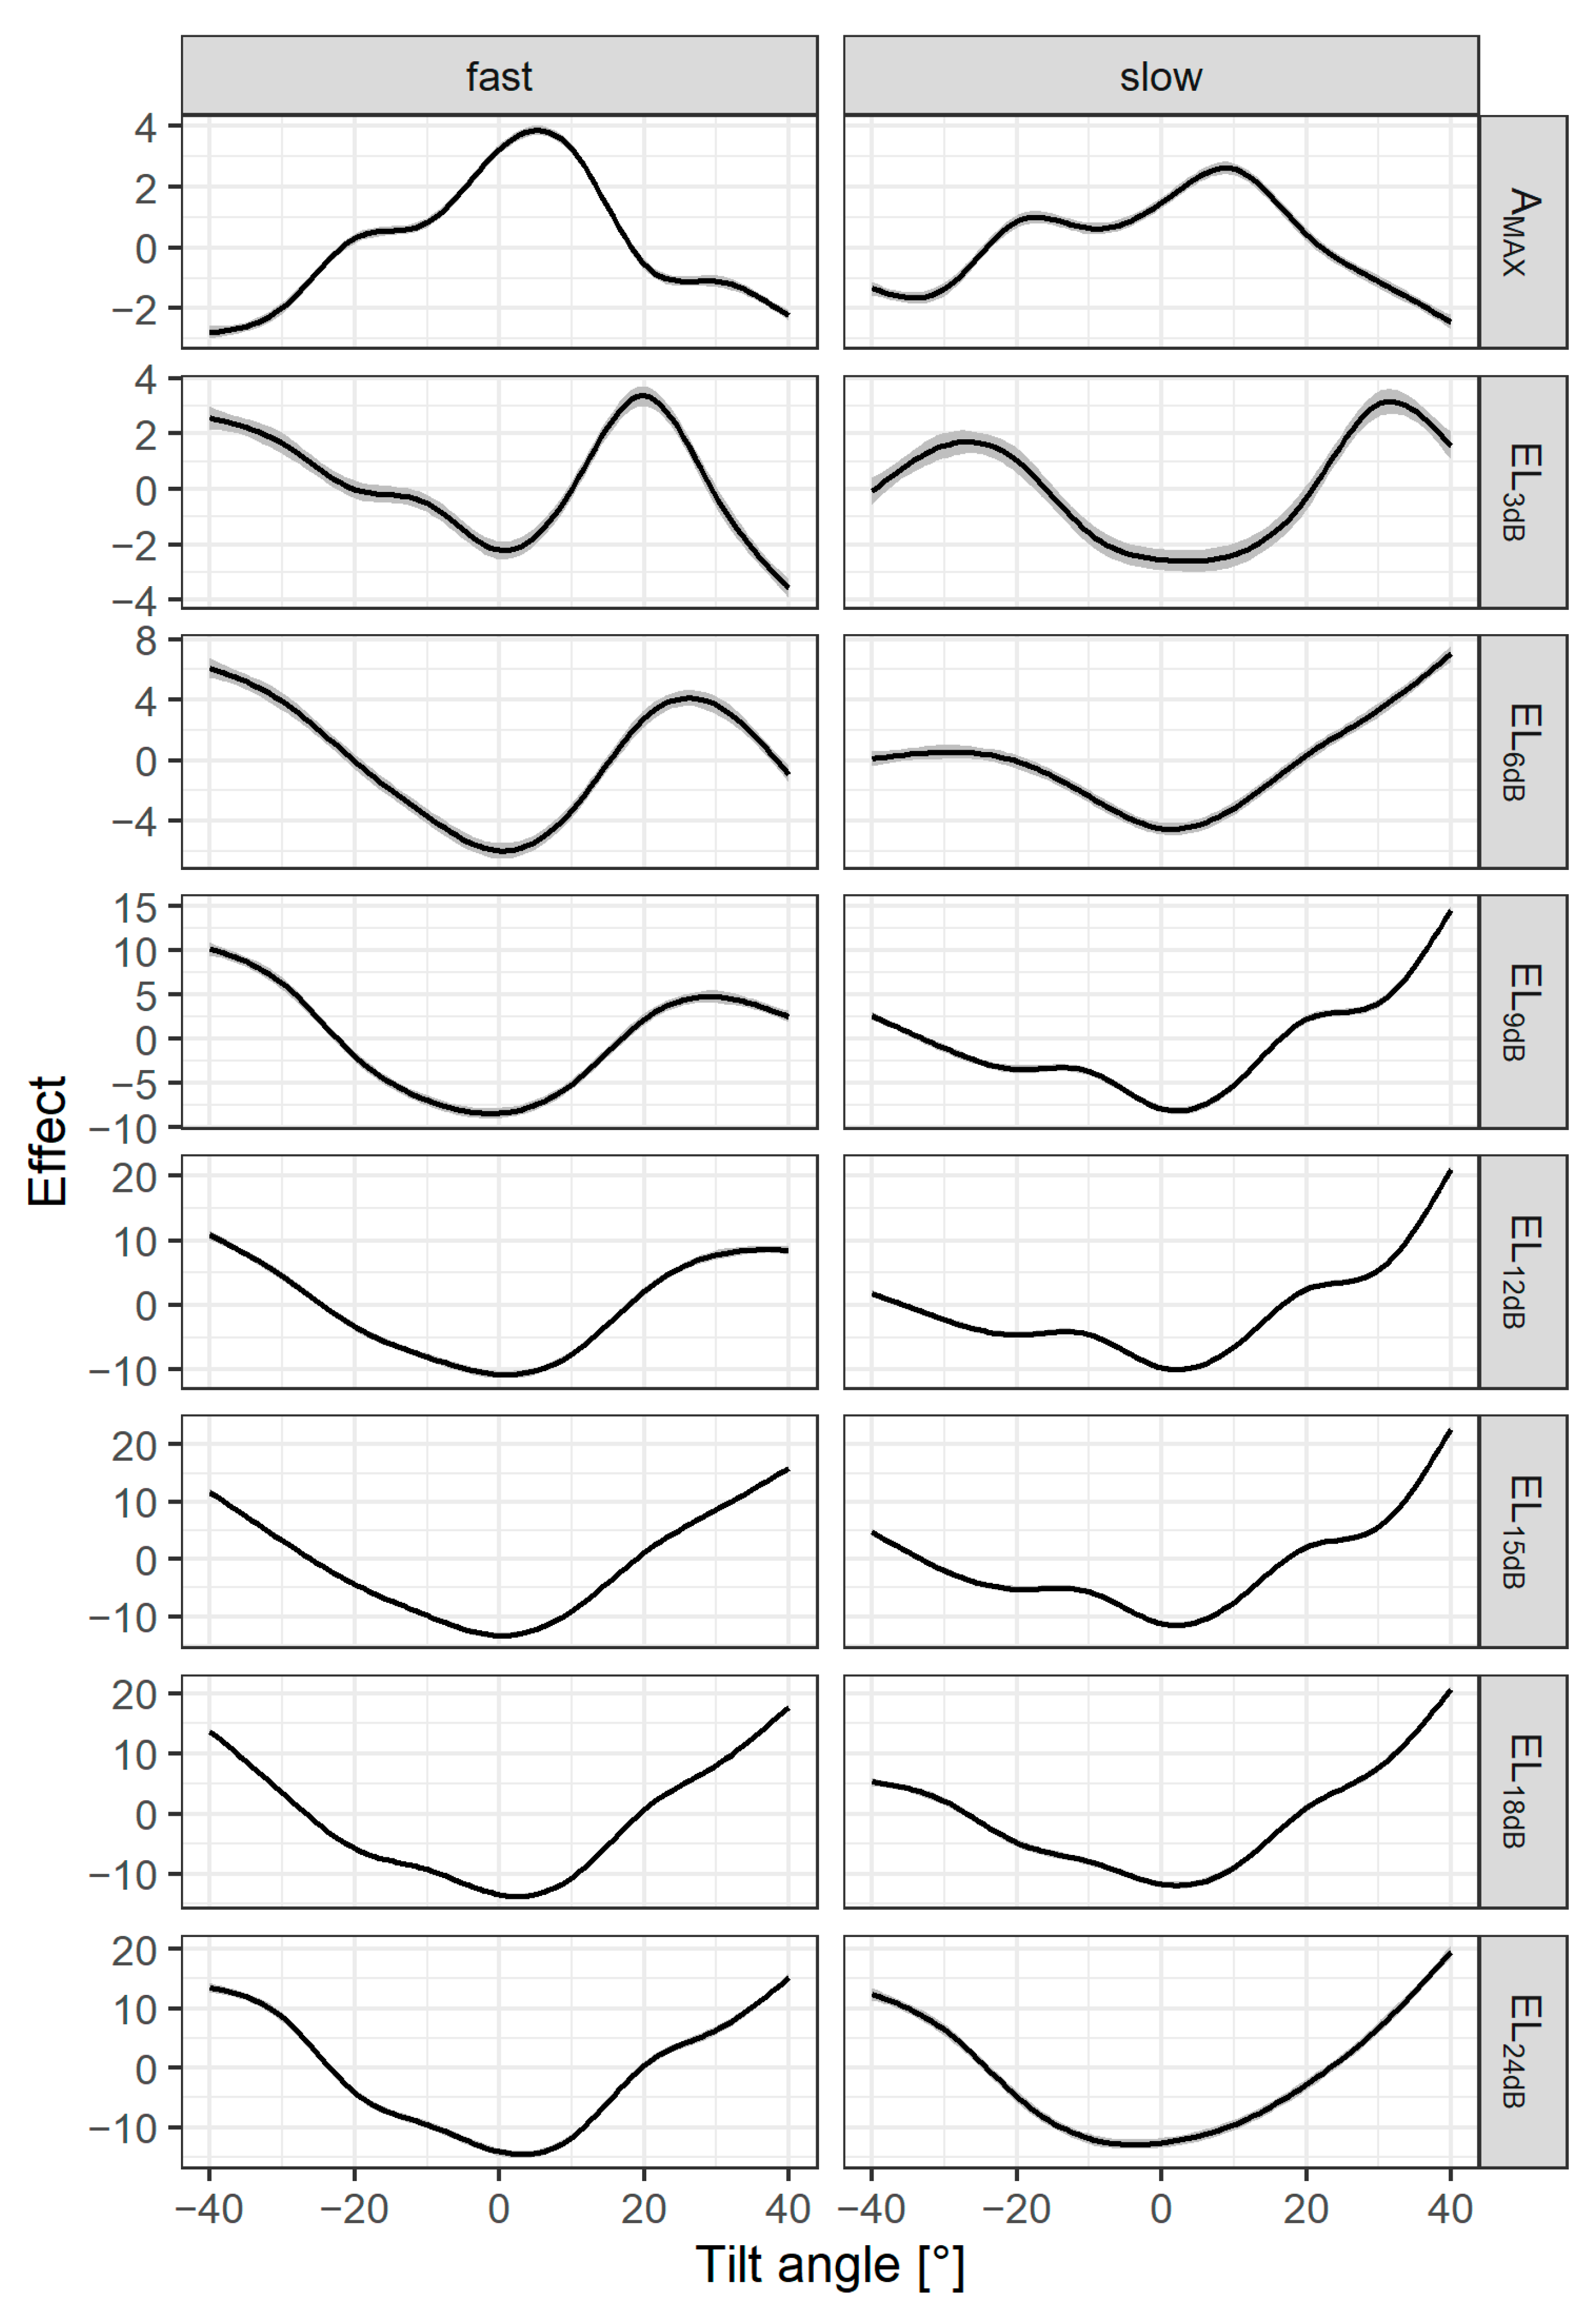
3.2. Interaction between Fish Tilt Angle and Amplitude Echo Descriptors

The results of the GAMM models (M2) for the interaction between the fish tilt angle and individual amplitude echo descriptors at the pulse-compressed broadband acoustic signals are shown in Table 3. Interestingly, the random effect bi was similar between both fast- and slow-tapered acoustic pulses, allowing possible comparison of sangle between two ramping sets. Most importantly, the effect of fish tilt angle sangle showed that the greatest influence was found on AMAX for fast-tapered pulses, while it was not pronounced in slow-tapered pulses. In the general view of EL, there was an increase in the effect of the fish tilt angle on EL from the highest level (EL3dB) to EL18dB and EL15dB for fast- and slow-tapered acoustic signals, respectively. Thereafter, the effect of the fish tilt angle on EL decreased.
Generally, the effect of the fish tilt angle on the given amplitude echo descriptors was not straightforward, and it differed between fast- and slow-tapered acoustic signals and between head-up and head-down dorsal orientations (Figure 4).
The effect of the fish tilt angle on AMAX was relatively low. The maximum of AMAX was shifted to the head-down positions, 5 and 10 degrees off the true dorsal aspect at fast- and slow-tapered signals, respectively. This indicates that the strongest reflection (largest incident area of swim bladder) did not come from the true dorsal position but from the position in which the fish was slightly tilted with its tail closer to the transducer (head-down dorsal orientation). Moreover, the effect of the fish tilt angle on AMAX generally decreased faster for the head-down than for the head-up dorsal orientations.
The effect measures of the fish tilt angles on EL, in general, increased with a decreasing level below AMAX for both fast- and slow-tapered acoustic signals, suggesting that the highest levels would not be appropriate for determining fish tilt angles. In most cases, the effect minimum was slightly shifted to the head-down dorsal orientation and was most noticeable at slow-tapered acoustic signals. The effect measure was dissimilar and changed at different rates toward the oblique tilt angles between the head-up and head-down dorsal orientations. The head-down dorsal orientation showed higher rates for the effect measure. The most stable and symmetrical shapes of the effect of the fish tilt angle on EL between the head-up and head-down dorsal orientations were observed at EL15dB and EL18dB, especially for fast-tapered acoustic signals, indicating that these two levels could be the most appropriate candidates for determining fish tilt angle.

4. Discussion

Fish orientation in both the dorsal and more prominent lateral directions is crucial in obtaining true fish size from acoustic records. To determine the fish dorsal orientation with broadband pulses, we performed an experiment with the fish tethered in the dorsal aspects. We initially anticipated obtaining a relationship of frequency response with other accompanying parameters (amplitude, phase, alongship and athwartship angles). However, in our case, this was not feasible. There were no apparent patterns in the frequency responses that could be linked to the fish orientation. Moreover, the efficacy of the commonly used random decision forest [35] we applied was less than 60% for all parameters included (unpublished data). The only pattern we noticed was distinguishable changes in amplitude echo envelopes with the fish dorsal orientation (Figure 2) in both the fast- and slow-tapered pulses.
The relationships of our primary interest, i.e., how the amplitude echo envelope changes with the fish tilt angle, or how a particular summary of the amplitude echo envelope (indeed, a function we commonly refer to as a “descriptor”) changes with the tilt angle, are complex and inherently nonlinear. On the other hand, the exact mathematical form of these relationships (described by functions) was not known a priori. Therefore, the powerful technique of fitting concrete nonlinear parametric models could not be used. Instead, we fitted a semiparametric model where part of the model was specified nonparametrically. In particular, we used the GAMM approach with complexity-penalized splines (where the penalization coefficient is not specified a priori, but is estimated from the data using generalized cross-validation). In this way, we could use highly flexible but not overly complex (due to the complexity penalty) functional forms derived from real data properties. This is a significant advantage over the a priori choice of a (possibly poor) parametric model. In particular, the semiparametric approach overcomes serious biases introduced by the easy/convenient choice of general parametric models. Each model answers a different question. The drawback of the M1 model is that each measured angle is treated separately, with no continuity between them (we also used an alternative model that allows interpolation between observed angles via a tensor-product spline approach, but we do not present its results here because of the more difficult interpretation). In the case of the M2 model, however, the effect of the tilt angle is estimated for the entire range of the tilt angle, at the cost of working with a summary of the amplitude echo envelope (which we call a “descriptor”) instead of the full time-profile of the amplitude (as in the case of M1).
The changes we observed in the shape of echo amplitude are generally supported by earlier studies for both narrowband [20] and broadband acoustics [5,36]. All the studies, including ours, found that echo length increased with increasing fish angle (Figure 1) and that echo complexity increased with fish angle (as seen in Figure 2). In terms of ramping, slow-tapered signals could have better potential for determining the tilt angle, since more distinct and clearer changes in echo lengths between the measured tilt angles were observed (Figure 3). Similarly, Kubilius et al. [13,14] showed that the target’s peaks were more prominent and clearer in slow-tapered signals. Additionally, Lavery et al. [37] showed that slow-tapered signals had better performance in distinguishing close targets. The reason for this was that slow ramping suppressed the filter sidelobes that were artificially created by the matched-filter processing. Although wider, the slow-tapered signal was clearer and more defined in its shape. In contrast, fast ramping provided a narrow target peak surrounded by the filter sidelobes. We believe that changes in echo length could then be more pronounced and not masked by the filter sidelobes in slow-tapered pulses.
According to model M2 for AMAX, the results confirm that the maximum TS of backscatter from the dorsal aspect is at a slight head-down tilt for most fish (e.g., [36,38]). This corresponds to the position of the swim bladder, which predominantly contributes to the backscatter [39,40]. In common bream, the swim bladder contains two chambers; the second chamber is larger and typically cone-shaped, with a downward-curved end in older fish (e.g., [41]). The deviation of the maximum value from the true dorsal aspect was five and almost ten degrees off the true dorsal aspect for fast- and slow-tapered signals, respectively. This needs to be considered for the future development of algorithms to avoid underestimation of fish size.
With respect to echo length, the study showed that the most promising candidates were EL at levels approximately 15 dB below the maximum, where the effects were most significant and least variable. The situation is especially applicable to fast ramping, where the curve of the given effect was symmetrical, meaning that whether the fish was positioned in either the head-up or head-down angles, the determination of the fish body’s inclination would be the same for both sides. The potential of echo length for determining the fish orientation and size agreed with the anticipation of Kubilius et al. [13]; if the peaks of the boundaries could not be used, as proposed by their study, then the echo length could be useful for determining the true fish size. If fast ramping is preferred due to its higher signal-to-noise ratio or spectral information, the echo length at these levels could be one of the characteristics of the amplitude echo envelope that could help to resolve the orientation, and thus the size, of the fish. However, our dataset was retrieved in conditions with high signal-to-noise ratio; therefore, we realize that the convenient lengths (approximately 15 dB below the main peak) could be masked by the surrounding noise, and consequently problematic for their utilization in a natural environment.

5. Conclusions

The recent spread of broadband systems among fish biologists necessitates studies considering all possible aspects and limitations of this equipment. To date, published studies regarding fish sizing with broadband sonars have been experimental, with objects observed in fixed, straight positions, reducing the natural variability of acoustic signals. The reality of quickly moving fish, or even fish sleeping in various positions and with bodies not in straight lines, increases the variability in the data, making estimation of their true sizes very challenging. Our study showed the potential of echo length at certain levels below the maximum to be a good candidate for the future development of algorithms for determining fish orientation, and thus facilitating the conversion between TS and length. Our experiments should be enhanced by the observation of free-swimming fish to verify the applicability of these echo length descriptors for inferring fish orientation.

Author Contributions

Conceptualization, M.T.; methodology, M.T., J.F. and M.B.; software, H.B.; formal analysis, M.T. and M.B.; investigation, M.T., J.F., V.D. and J.K.; data curation, M.T.; writing—original draft preparation, M.T.; writing—review and editing, J.F., M.B., H.B., V.D. and J.K.; visualization, M.T.; supervision, M.T.; project administration, M.T.; funding acquisition, M.T. and J.K. All authors have read and agreed to the published version of the manuscript.

Funding

The work was supported by: Project No. EHP-BFNU-OVNKM-2-040-2019 of EEA and Norway Grants 2014–2021, Fund for Bilateral Relations, entitled “Size estimation and taxonomical identification of European freshwater fishes using a broadband echosounder;” ERDF/ESF Project No. CZ.02.1.01./0.0/0.0/16025/0007417 of the Ministry of Education, Youth and Sports of the Czech Republic, entitled “Biomanipulation as a tool for improving water quality of dam reservoirs;” and OP RDE Project No. CZ.02.1.01/0.0/0.0/16_013/0001782 of the Ministry of Education, Youth and Sports of the Czech Republic and the European Union, entitled “SoWa Ecosystem Research”.

Data Availability Statement

Data generated or analyzed during this study are available from the corresponding author upon reasonable request.

Acknowledgments

We would like to thank Ievgen Koliada for his help in the field.

Conflicts of Interest

The authors declare that there are no competing interests.

References

  1. Simmonds, J.; MacLennan, D.N. Fisheries Acoustics: Theory and Practice, 2nd ed.; Simmonds, J., MacLennan, D., Eds.; Blackwell Publishing: New York, NY, USA, 2005; ISBN 978-0-470-99529-7. [Google Scholar]
  2. Demer, D.A.; Andersen, L.N.; Bassett, C.; Berger, L.; Chu, D.; Condiotty, J.; Cutter, G.R., Jr.; Hutton, B.; Korneliussen, R.; Bouffant, N.L.; et al. 2016 USA–Norway EK80 Workshop Report: Evaluation of a Wideband Echosounder for Fisheries and Marine Ecosystem Science. ICES Coop. Res. Rep. (CRR) 2017, 336, 79. [Google Scholar] [CrossRef]
  3. Turin, G. An Introduction to Matched Filters. IEEE Trans. Inf. Theory 1960, 6, 311–329. [Google Scholar] [CrossRef]
  4. Ehrenberg, J.E.; Torkelson, T.C. FM Slide (Chirp) Signals: A Technique for Significantly Improving the Signal-to-Noise Performance in Hydroacoustic Assessment Systems. Fish. Res. 2000, 47, 193–199. [Google Scholar] [CrossRef]
  5. Stanton, T.K.; Reeder, D.B.; Jech, J.M. Inferring Fish Orientation from Broadband-Acoustic Echoes. ICES J. Mar. Sci. 2003, 60, 524–531. [Google Scholar] [CrossRef]
  6. Zakharia, M.E.; Magand, F.; Hetroit, F.; Diner, N. Wideband Sounder for Fish Species Identification at Sea. ICES J. Mar. Sci. 1996, 53, 203–208. [Google Scholar] [CrossRef]
  7. Bassett, C.; De Robertis, A.; Wilson, C.D. Broadband Echosounder Measurements of the Frequency Response of Fishes and Euphausiids in the Gulf of Alaska. ICES J. Mar. Sci. 2018, 75, 1131–1142. [Google Scholar] [CrossRef]
  8. Blanluet, A.; Doray, M.; Berger, L.; Romagnan, J.-B.; Bouffant, N.L.; Lehuta, S.; Petitgas, P. Characterization of Sound Scattering Layers in the Bay of Biscay Using Broadband Acoustics, Nets and Video. PLoS ONE 2019, 14, e0223618. [Google Scholar] [CrossRef]
  9. Gugele, S.M.; Widmer, M.; Baer, J.; DeWeber, J.T.; Balk, H.; Brinker, A. Differentiation of Two Swim Bladdered Fish Species Using next Generation Wideband Hydroacoustics. Sci. Rep. 2021, 11, 10520. [Google Scholar] [CrossRef]
  10. Horne, J.; Jech, J.M. Multi-Frequency Estimates of Fish Abundance: Constraints of Rather High Frequencies. ICES J. Mar. Sci. 1999, 56, 184–199. [Google Scholar] [CrossRef]
  11. Fässler, S.M.M.; Santos, R.; García-Núñez, N.; Fernandes, P.G. Multifrequency Backscattering Properties of Atlantic Herring (Clupea harengus) and Norway Pout (Trisopterus esmarkii). Can. J. Fish. Aquat. Sci. 2007, 64, 362–374. [Google Scholar] [CrossRef]
  12. Jaffe, J.S.; Roberts, P.L.D. Estimating Fish Orientation from Broadband, Limited-Angle, Multiview, Acoustic Reflections. J. Acoust. Soc. Am. 2011, 129, 670–680. [Google Scholar] [CrossRef] [PubMed]
  13. Kubilius, R.; Macaulay, G.J.; Ona, E. Remote Sizing of Fish-like Targets Using Broadband Acoustics. Fish. Res. 2020, 228, 105568. [Google Scholar] [CrossRef]
  14. Kubilius, R.; Bergès, B.; Macaulay, G.J. Remote Acoustic Sizing of Tethered Fish Using Broadband Acoustics. Fish. Res. 2023, 260, 106585. [Google Scholar] [CrossRef]
  15. Frouzova, J.; Kubecka, J.; Balk, H.; Frouz, J. Target Strength of Some European Fish Species and Its Dependence on Fish Body Parameters. Fish. Res. 2005, 75, 86–96. [Google Scholar] [CrossRef]
  16. Miyanohana, Y.; Ishii, K.; Furusawa, M. Dorsal Aspect Target Strength Functions of Eight Species of Fish at Four Frequencies. Tech. Rep. Natl. Res. Inst. Fish. Eng. Fish. Boat Instrum. 1990, 189, 317–324. [Google Scholar]
  17. De Robertis, A.; Schell, C.; Jaffe, J.S. Acoustic Observations of the Swimming Behavior of the Euphausiid Euphausia Pacifica Hansen. ICES J. Mar. Sci. 2003, 60, 885–898. [Google Scholar] [CrossRef]
  18. Genin, A.; Jaffe, J.S.; Reef, R.; Richter, C.; Franks, P.J.S. Swimming against the Flow: A Mechanism of Zooplankton Aggregation. Science 2005, 308, 860–862. [Google Scholar] [CrossRef]
  19. Tušer, M.; Kubečka, J.; Frouzová, J.; Jarolím, O. Fish Orientation along the Longitudinal Profile of the Římov Reservoir during Daytime: Consequences for Horizontal Acoustic Surveys. Fish. Res. 2009, 96, 23–29. [Google Scholar] [CrossRef]
  20. Burwen, D.L.; Nealson, P.A.; Fleischman, S.J.; Mulligan, T.J.; Horne, J.K. The Complexity of Narrowband Echo Envelopes as a Function of Fish Side-Aspect Angle. ICES J. Mar. Sci. 2007, 64, 1066–1074. [Google Scholar] [CrossRef]
  21. Demer, D.A.; Berger, L.; Bernasconi, M.; Bethke, E.; Boswell, K.; Chu, D.; Domokos, R.; Dunford, A.; Fässler, S.; Gauthier, S.; et al. Calibration of Acoustic Instruments. ICES Coop. Res. Rep. (CRR) 2015, 326, 136. [Google Scholar] [CrossRef]
  22. Oppenheim, A.V.; Schafer, R.W. Discrete-Time Signal Processing, 2nd ed.; Prentice Hall: Upper Saddle River, NJ, USA, 1989; ISBN 978-0-13-216292-0. [Google Scholar]
  23. Tušer, M.; Frouzová, J.; Balk, H.; Muška, M.; Mrkvička, T.; Kubečka, J. Evaluation of Potential Bias in Observing Fish with a DIDSON Acoustic Camera. Fish. Res. 2014, 155, 114–121. [Google Scholar] [CrossRef]
  24. Hastie, T.J.; Tibshirani, R.J. Generalized Additive Models; CRC Press: Boca Raton, FL, USA, 1990; ISBN 978-0-412-34390-2. [Google Scholar]
  25. Wood, S.N. Generalized Additive Models: An Introduction with R, 2nd ed.; Chapman and Hall/CRC: New York, NY, USA, 2017; ISBN 978-1-315-37027-9. [Google Scholar]
  26. De Boor, C. A Practical Guide to Splines; Springer: New York, NY, USA, 2001; Volume 27, ISBN 978-0-387-95366-3. [Google Scholar]
  27. Tukey, J.W. Exploratory Data Analysis; Addison-Wesley Publishing Company: Boston, MA, USA, 1977; ISBN 978-0-201-07616-5. [Google Scholar]
  28. Wood, S.N. Thin Plate Regression Splines. J. R. Stat. Soc. Ser. B (Stat. Methodol.) 2003, 65, 95–114. [Google Scholar] [CrossRef]
  29. Wood, S.N. Fast Stable Restricted Maximum Likelihood and Marginal Likelihood Estimation of Semiparametric Generalized Linear Models. J. R. Stat. Soc. Ser. B (Stat. Methodol.) 2011, 73, 3–36. [Google Scholar] [CrossRef]
  30. Wood, S.N.; Pya, N.; Säfken, B. Smoothing Parameter and Model Selection for General Smooth Models. J. Am. Stat. Assoc. 2016, 111, 1548–1563. [Google Scholar] [CrossRef]
  31. R Core Team. R: A Language and Environment for Statistical Computing; R Foundation for Statistical Computing: Vienna, Austria, 2022. [Google Scholar]
  32. Wickham, H.; François, R.; Henry, L.; Müller, K.; Vaughan, D. Dplyr: A Grammar of Data Manipulation; 2022. Available online: https://CRAN.R-project.org/package=dplyr (accessed on 12 March 2023).
  33. Wickham, H. Ggplot2: Elegant Graphics for Data Analysis; Springer: New York, NY, USA, 2016; ISBN 978-3-319-24277-4. [Google Scholar]
  34. Wood, S.N.; Goude, Y.; Shaw, S. Generalized Additive Models for Large Data Sets. J. R. Stat. Society. Ser. C (Appl. Stat.) 2015, 64, 139–155. [Google Scholar] [CrossRef]
  35. Ho, T.K. Random Decision Forests. In Proceedings of the 3rd International Conference on Document Analysis and Recognition, Montreal, QC, Canada, 14–16 August 1995; Volume 1, pp. 278–282. [Google Scholar]
  36. Au, W.W.L.; Benoit-Bird, K.J. Acoustic Backscattering by Hawaiian Lutjanid Snappers. II. Broadband Temporal and Spectral Structure. J. Acoust. Soc. Am. 2003, 114, 2767–2774. [Google Scholar] [CrossRef]
  37. Lavery, A.C.; Bassett, C.; Lawson, G.L.; Jech, J.M. Exploiting Signal Processing Approaches for Broadband Echosounders. ICES J. Mar. Sci. 2017, 74, 2262–2275. [Google Scholar] [CrossRef]
  38. Henderson, M.J.; Horne, J.K.; Towler, R.H. The Influence of Beam Position and Swimming Direction on Fish Target Strength. ICES J. Mar. Sci. 2008, 65, 226–237. [Google Scholar] [CrossRef]
  39. Foote, K.G. Importance of the Swimbladder in Acoustic Scattering by Fish: A Comparison of Gadoid and Mackerel Target Strengths. J. Acoust. Soc. Am. 1980, 67, 2084–2089. [Google Scholar] [CrossRef]
  40. Macaulay, G.J. Anatomically Detailed Acoustic Scattering Models of Fish. Bioacoustics 2002, 12, 275–277. [Google Scholar] [CrossRef]
  41. Beregi, A.; Székely, C.; Békési, L.; Szabó, J.; Molnár, V.; Molnár, K. Radiodiagnostic Examination of the Swimbladder of Some Fish Species. Acta. Vet. Hung. 2001, 49, 87–98. [Google Scholar] [CrossRef]
Figure 1. Illustration of experimental design for collecting hydroacoustic data of anesthetized fish of known size with controllably adjustable dorsal body orientation. (A) Fish positioned in true dorsal body orientation. (B) Fish positioned at tilt angle with head closer to the transducer, i.e., in head-up dorsal orientation.
Water 15 01596 g001
Figure 2. An example of raw amplitude data for a 295-mm-long bream observed in given dorsal orientations (0° correlates to the true dorsal aspect; negative angles correlate to the head tilted toward the transducer; positive angles correlate to the tail tilted toward the transducer) using fast- and slow-tapered acoustic pulses.
Water 15 01596 g002
Figure 3. Amplitude echo envelopes modeled using the generalized additive mixed model M1 for given individual tilt angles (0° correlates to the true dorsal aspect; negative angles correlate to the head tilted toward the transducer; positive angles correlate to the tail tilted toward the transducer) in fast- or slow-tapered acoustic pulses. Individual curves correspond to the plot of sangle profile (a, t) for given angle a.
Water 15 01596 g003
Figure 4. Effect of the fish tilt angle (0° correlates to the true dorsal aspect; negative angles correlate to the head tilted toward the transducer; positive angles correlate to the tail tilted toward the transducer) on the amplitude echo descriptors in the fitted generalized additive mixed models (GAMM) for fast- and slow-tapered broadband acoustic pulses. A black line represents a smooth component (function of one variable) implemented as a thin-plate spline, with a gray area representing a 95% confidence interval. AMAX stands for the amplitude maximum. EL stands for the echo length at several levels, expressed as the number of decibels below AMAX (dB; labeled as a subscript). Note the different y-axis scales.
Water 15 01596 g004
Table 1. Body measurements of the common bream Abramis brama (L.) observed in dorsal aspect using pulse-compressed broadband acoustic pulses. The data is sorted in ascending order of fish size.
IDStandard Length [mm]Total Length [mm]Weight [g]
bream516520594
bream1170225120
bream3205255186
bream6240295304
bream2290355518
bream4310375628
bream7325400622
Table 2. Results of the generalized additive mixed model M1 assessing variation in individual model components for fast ramping (n = 1,202,670; deviance explained = 82.3%; restricted maximum likelihood score (REML) = 3.9 × 10⁶; Akaike information criterion (AIC) = 7,887,672) and for slow ramping (n = 1,058,036; deviance explained = 76.7%; REML = 3.9 × 10⁶; AIC = 7,769,839). The effective degrees of freedom (edf), F statistic (F) and the probability value of the statistic (p) are represented.
RampingModel M1 ComponentedfFp
fastbi52441<2 × 10⁻¹⁶
ssize187<2 × 10⁻¹⁶
s501433,001<2 × 10⁻¹⁶
s601440,008<2 × 10⁻¹⁶
s701449,688<2 × 10⁻¹⁶
s801444,410<2 × 10⁻¹⁶
s901440,766<2 × 10⁻¹⁶
s1001447,679<2 × 10⁻¹⁶
s1101441,846<2 × 10⁻¹⁶
s1201440,478<2 × 10⁻¹⁶
s1301444,044<2 × 10⁻¹⁶
slowbi44662<2 × 10⁻¹⁶
ssize118<2 × 10⁻¹⁶
s501425,782<2 × 10⁻¹⁶
s601426,706<2 × 10⁻¹⁶
s701424,904<2 × 10⁻¹⁶
s801428,241<2 × 10⁻¹⁶
s901429,702<2 × 10⁻¹⁶
s1001425,088<2 × 10⁻¹⁶
s1101427,635<2 × 10⁻¹⁶
s1201429,312<2 × 10⁻¹⁶
s1301424,902<2 × 10⁻¹⁶
Table 3. Results of the generalized additive mixed model M2 for the amplitude maximum (AMAX) and echo lengths (EL) at several levels assessing their explained deviance, generalized cross-validation criterion (GCV), and variation (F = F statistic) in their components of bi (effective degrees of freedom = 5, p-value = <2 × 10⁻¹⁶) and sangle (effective degrees of freedom = 7, p-value = <2 × 10⁻¹⁶) for fast (n = 5928) and slow ramping (n = 5212).
Deviance Explained [%] F
RampingExplanatoryGCVbisangle
fastAMAX616917580
EL3dB172851128
EL6dB207139170
EL9dB3593108311
EL12dB5287124556
EL15dB71611641308
EL18dB81401272342
EL24dB61104127875
slowAMAX46992193
EL3dB24397666
EL6dB314644178
EL9dB6238103738
EL12dB68521861003
EL15dB71631751031
EL18dB6977124852
EL24dB5118757464
Disclaimer/Publisher’s Note: The statements, opinions and data contained in all publications are solely those of the individual author(s) and contributor(s) and not of MDPI and/or the editor(s). MDPI and/or the editor(s) disclaim responsibility for any injury to people or property resulting from any ideas, methods, instructions or products referred to in the content.

