
Infiltration and Failure Behavior of an Unsaturated Soil Slope under Artificial Rainfall Model Experiments

Department of Civil Engineering, National Pingtung University of Science and Technology, Pingtung 912, Taiwan
*
Author to whom correspondence should be addressed.
Water 2023, 15(8), 1599; https://doi.org/10.3390/w15081599
Submission received: 28 March 2023
/
Revised: 17 April 2023
/
Accepted: 18 April 2023
/
Published: 20 April 2023
(This article belongs to the Section Soil and Water)
Abstract
:Slope disasters often include soil erosion and shallow landslides. These types of slope failure can occur in unsaturated soil. In this study, artificial rainfall is applied to a compacted soil slope in a laboratory to investigate the effects of rainfall intensity, initial moisture content and relative compaction on infiltration and failure behavior of an unsaturated soil slope subjected to rainfall infiltration. Soil moisture probes installed in the soil slope were used to monitor soil moisture content during the experiment. Test results show that the soil saturation at the toe of the slope was observed to be higher than other areas of the slope following the onset of rainfall. Gradually, the saturation advanced towards the crest, resulting in the formation of a wetting band along the slope surface. With increasing rainfall duration, the wetting band progressed further downwards along the slope. The failure of the slope began at the crest and junction of the slope, and the primary cause was soil erosion resulting from high-intensity rainfall. The most significant variable affecting infiltration behavior is relative compaction, followed by the initial moisture content of the compacted slope. During the experiment, the low hydraulic conductivity of the saturated soil caused most of the rainfall on the slope to become surface runoff, which minimized the impact of rainfall intensity on infiltration behavior. Specifically, the hydraulic conductivity of soil compacted at optimal moisture content and 90 R.C. is only 7.041 × 10⁻⁵ cm/sec or 2.53 mm/h, which is much lower than rainfall intensities of 80 mm/h and 160 mm/h. In addition, soil saturation contours facilitated visualization and quantification of the infiltration behavior of slopes, enabling a more detailed analysis of experimental results. These results help understand the behavior of unsaturated soil slopes under artificial rainfall conditions and aid in designing effective slope stabilization measures to prevent slope failure and minimize the risk of landslides.
1. Introduction
Taiwan is situated at the intersection of the Eurasian Plate and the Philippine Sea Plate. More than 70% of Taiwan’s land area is mountainous terrain. The slopes of mountainous areas in Taiwan typically range between 30° and 50°. However, in rugged terrain, such as the cliffs along the eastern coast of Taiwan, very steep slope angles exceeding 60° are common [1]. The unique terrain often leads to slope disasters. Mountainous slopes can be severely affected by soil erosion and shallow landslides, indicating instability of slopes [2,3]. Soil erosion refers to the detachment, transportation, and deposition of soil particles by water, wind, or other external forces. In grasslands, the most visible form of soil erosion is shallow erosion, which occurs in bare soil areas [4,5,6]. This type of erosion often occurs in conjunction with gully initiation in steep mountainous and hilly landscapes that are covered by a layer of regolith [7,8]. Shallow landslides are defined as any landslides that occur within the material that forms above the bedrock, such as soil, saprolite, and colluvium [9]. These types of landslides are typically triggered by rainfall events with short durations but high intensities, or long durations but medium to low intensities [10,11,12]. On the other hand, slope disasters also associated with land development often occur on artificial slopes constructed of backfill that is inadequately compacted. High and steep slopes that are backfilled to increase land use area are particularly prone to slope disasters. Inadequate compaction is caused when the degree of compaction applied during construction does not meet standards or if the soil is compacted at sub-standard moisture content. Compaction controls many soil properties, including hydraulic conductivity, swell and shrink and soil strength [13,14]. Backfilled slopes that are compacted inadequately have high hydraulic conductivity, permitting rapid infiltration. Areas with inadequate compaction tend to settle more, which can lead to instability of slopes. Reducing the infiltration of water into the slope can help improve stability. Both the degree of compaction and initial moisture content at the time of compaction are important factors that control infiltration [14].
Many studies have examined the effect of precipitation on natural slopes [15,16,17,18,19,20,21,22]. In contrast, studies that specifically examined slope failures in artificial backfilled slopes are rare. As a result, the failure mechanisms and soil moisture conditions of backfilled slopes that do fail are not well understood [23,24,25,26]. It has been found that the number of backfill layers can influence the stress distribution in the backfill materials [26]. The infiltration of precipitation into a backfilled slope results in a decrease in matric suction and an increase in moisture content. As a result, the effective strength of the slope rapidly drops. Once the shear strength of the slope is no longer adequate enough to sustain stability, the likelihood of slope failure increases [27,28,29].
The infiltration rate is an important factor for determining the stability of slopes [28,30,31,32,33,34]. Regarding the infiltration rate, as the moisture content of the soil increases, the infiltration rate of the slope decreases. The infiltration process is influenced by various factors, such as soil depth and geomorphology, soil hydraulic properties, and rainfall or climatic properties. The spatiotemporal evolution of infiltration rates under natural conditions cannot be currently deduced by direct measurements alone at any scale of interest in applied hydrology; therefore, the use of infiltration models that rely on measurable quantities is of fundamental importance [35]. Despite the importance of representing natural areal infiltration processes in hydrologic models for both flat and sloping surfaces, research in this area has been limited mainly to the development of local infiltration models, which are point-based. Various local infiltration models have been proposed for vertically homogeneous soils with a constant initial soil water content and over horizontal surfaces [35,36,37,38,39,40,41,42,43,44]. The infiltration and failure behavior of an unsaturated soil slope under artificial rainfall can be studied through physical model experiments [45,46,47,48,49,50,51]. Physical model experiments on slopes have been conducted as an alternative to field monitoring because they enable the investigation of the same slope under different conditions, reduce costs by shortening the duration of the study, and allow for the consideration of various slope types [51]. To investigate the infiltration process under simplified and known geometrical and boundary conditions, many researchers have conducted physical model experiments. In their experiments [45,46,47,48,49,50,51], the slope is constructed and instrumented with sensors to measure various parameters such as soil moisture, pore water pressure, earth pressure and ground movement. Artificial rainfall is then applied to the slope, and the response of the slope is monitored.
This study involved conducting model experiments on compacted unsaturated soil slopes, with artificial rainfall applied to the slope. Soil moisture probes were used to monitor the infiltration behavior of the soil at different locations on the slope under the influence of rainfall. In this study, the experimental data were analyzed and presented as soil saturation contours, which were used to evaluate the effects of different factors on the infiltration behavior of the compacted unsaturated soil slopes. Specifically, the impacts of rainfall intensity, initial moisture content, and relative compaction on the infiltration behavior were examined.
2. Laboratory Methods and Materials
2.1. Physical Properties of the Soil
The experimental soil used in this study is typically found in the Pingtung area of southern Taiwan. CNS and ASTM standards for soil analysis and experiments are followed to understand the basic physical properties of the soil. Results of basic soil properties of the study soil are shown in Table 1.
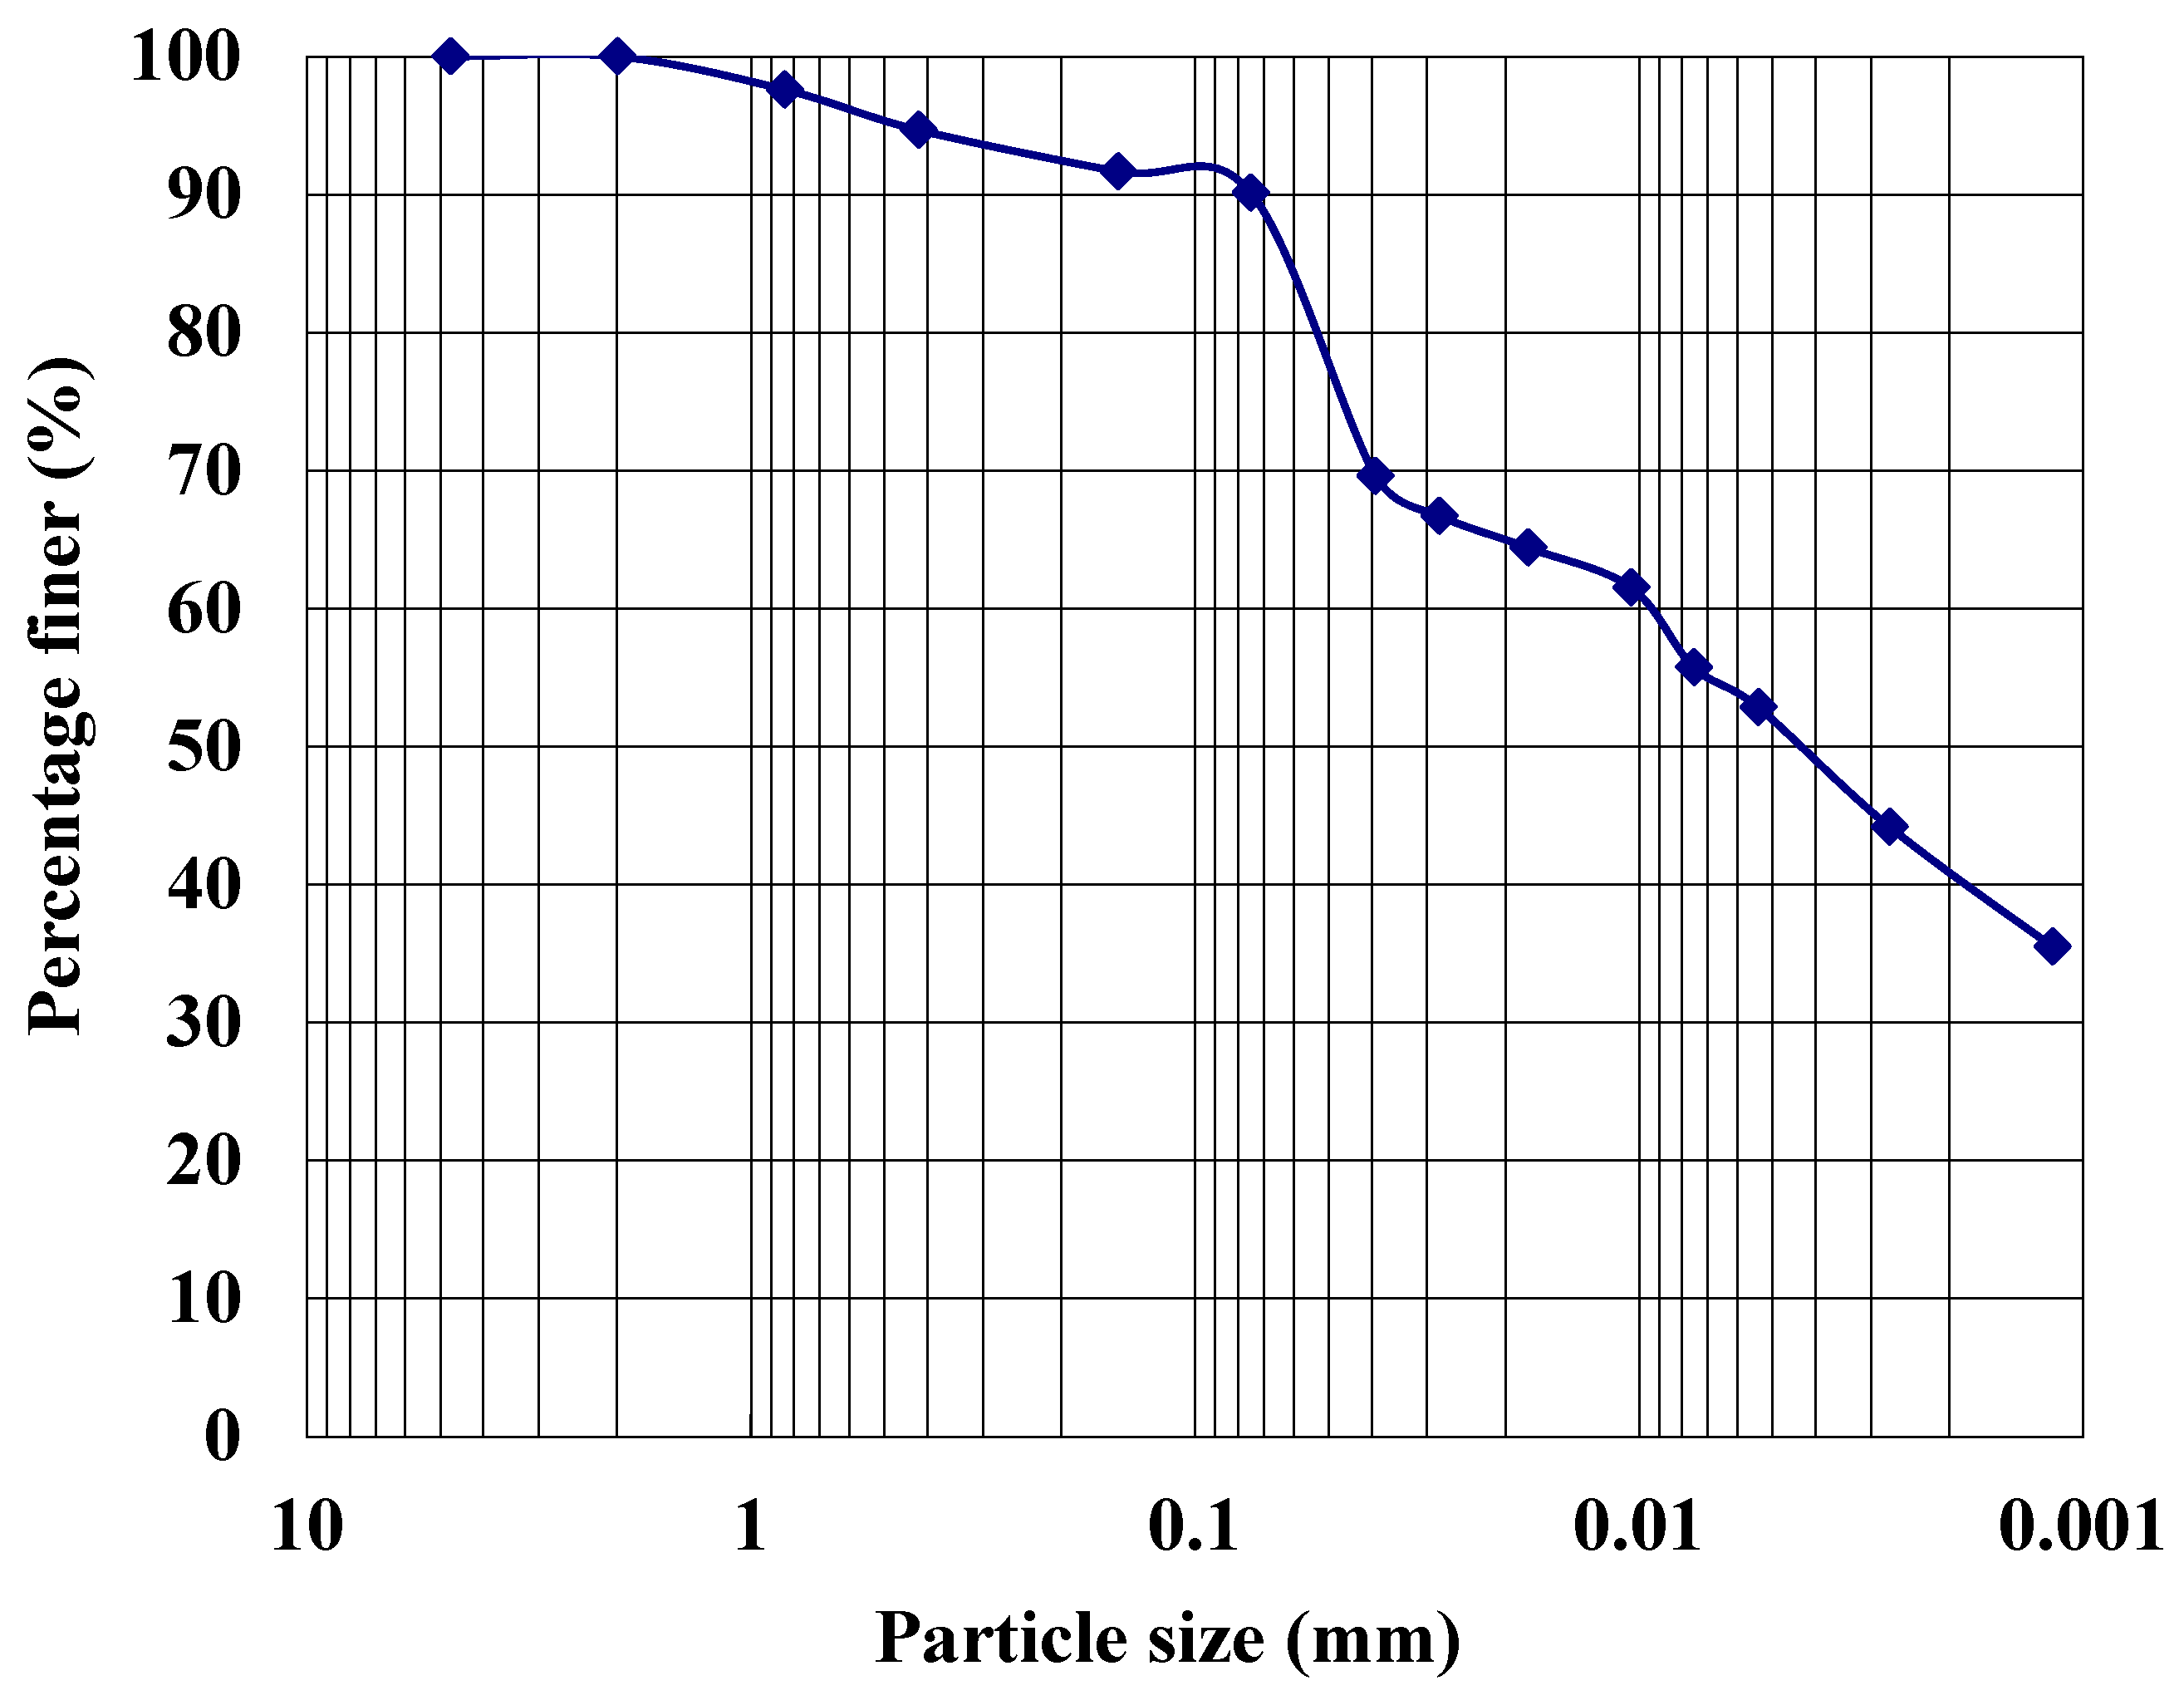
Particle size analysis is shown in Figure 1. From Figure 1, it can be observed that the sand fraction (0.05–2.0 mm) is 8%, the silt fraction (2–50 μm) is 50%, and the clay fraction (<2 μm) is 42%. Using the Unified Soil Classification System (USCS), the soil was classified as ML (Silt with low plasticity).
2.2. Experimental Procedure
In this study, the soil was initially passed through a number 10 sieve with a mesh size of 2 mm to remove any impurities. Prior to compaction, the soil was adjusted to its initial moisture content, and each layer of 5 cm was uniformly compacted to achieve the desired relative compaction. This was performed to ensure consistency and uniformity in the soil of the slope. The soil moisture probes were installed within an artificially compacted soil slope. The soil moisture meters continuously record moisture content throughout the soil during the application of artificial rainfall. During the experiments, a single-lens reflex camera monitored the experiments. After the experiments, the data were organized and analyzed.
2.3. Artificial Rainfall System
The artificial rainfall system is located at the Pingtung University of Science and Technology campus. The total area of the center is 210.27 m2, with four floors. Under these conditions, wind is controlled and precipitation is applied from a height of 9.5 m, which permits the terminal velocity of the rainfall to be reached before impact with the artificial slope. The artificial rainfall system is controlled by the central console. Flow to the rain system can be adjusted using the central console to meet the needs of the experiment. A sieve rapidly oscillates below the sprinklers to ensure an even distribution of rainfall, as shown in Figure 2. Precipitation is monitored at the hillslope using a continuously recording tipping bucket. The opening of the tipping bucket is 200 cm3. The diameter is 15.5 cm and the height is 24 cm. The bucket has a precision of 0.2 mm/tip.
2.4. Experimental Slope
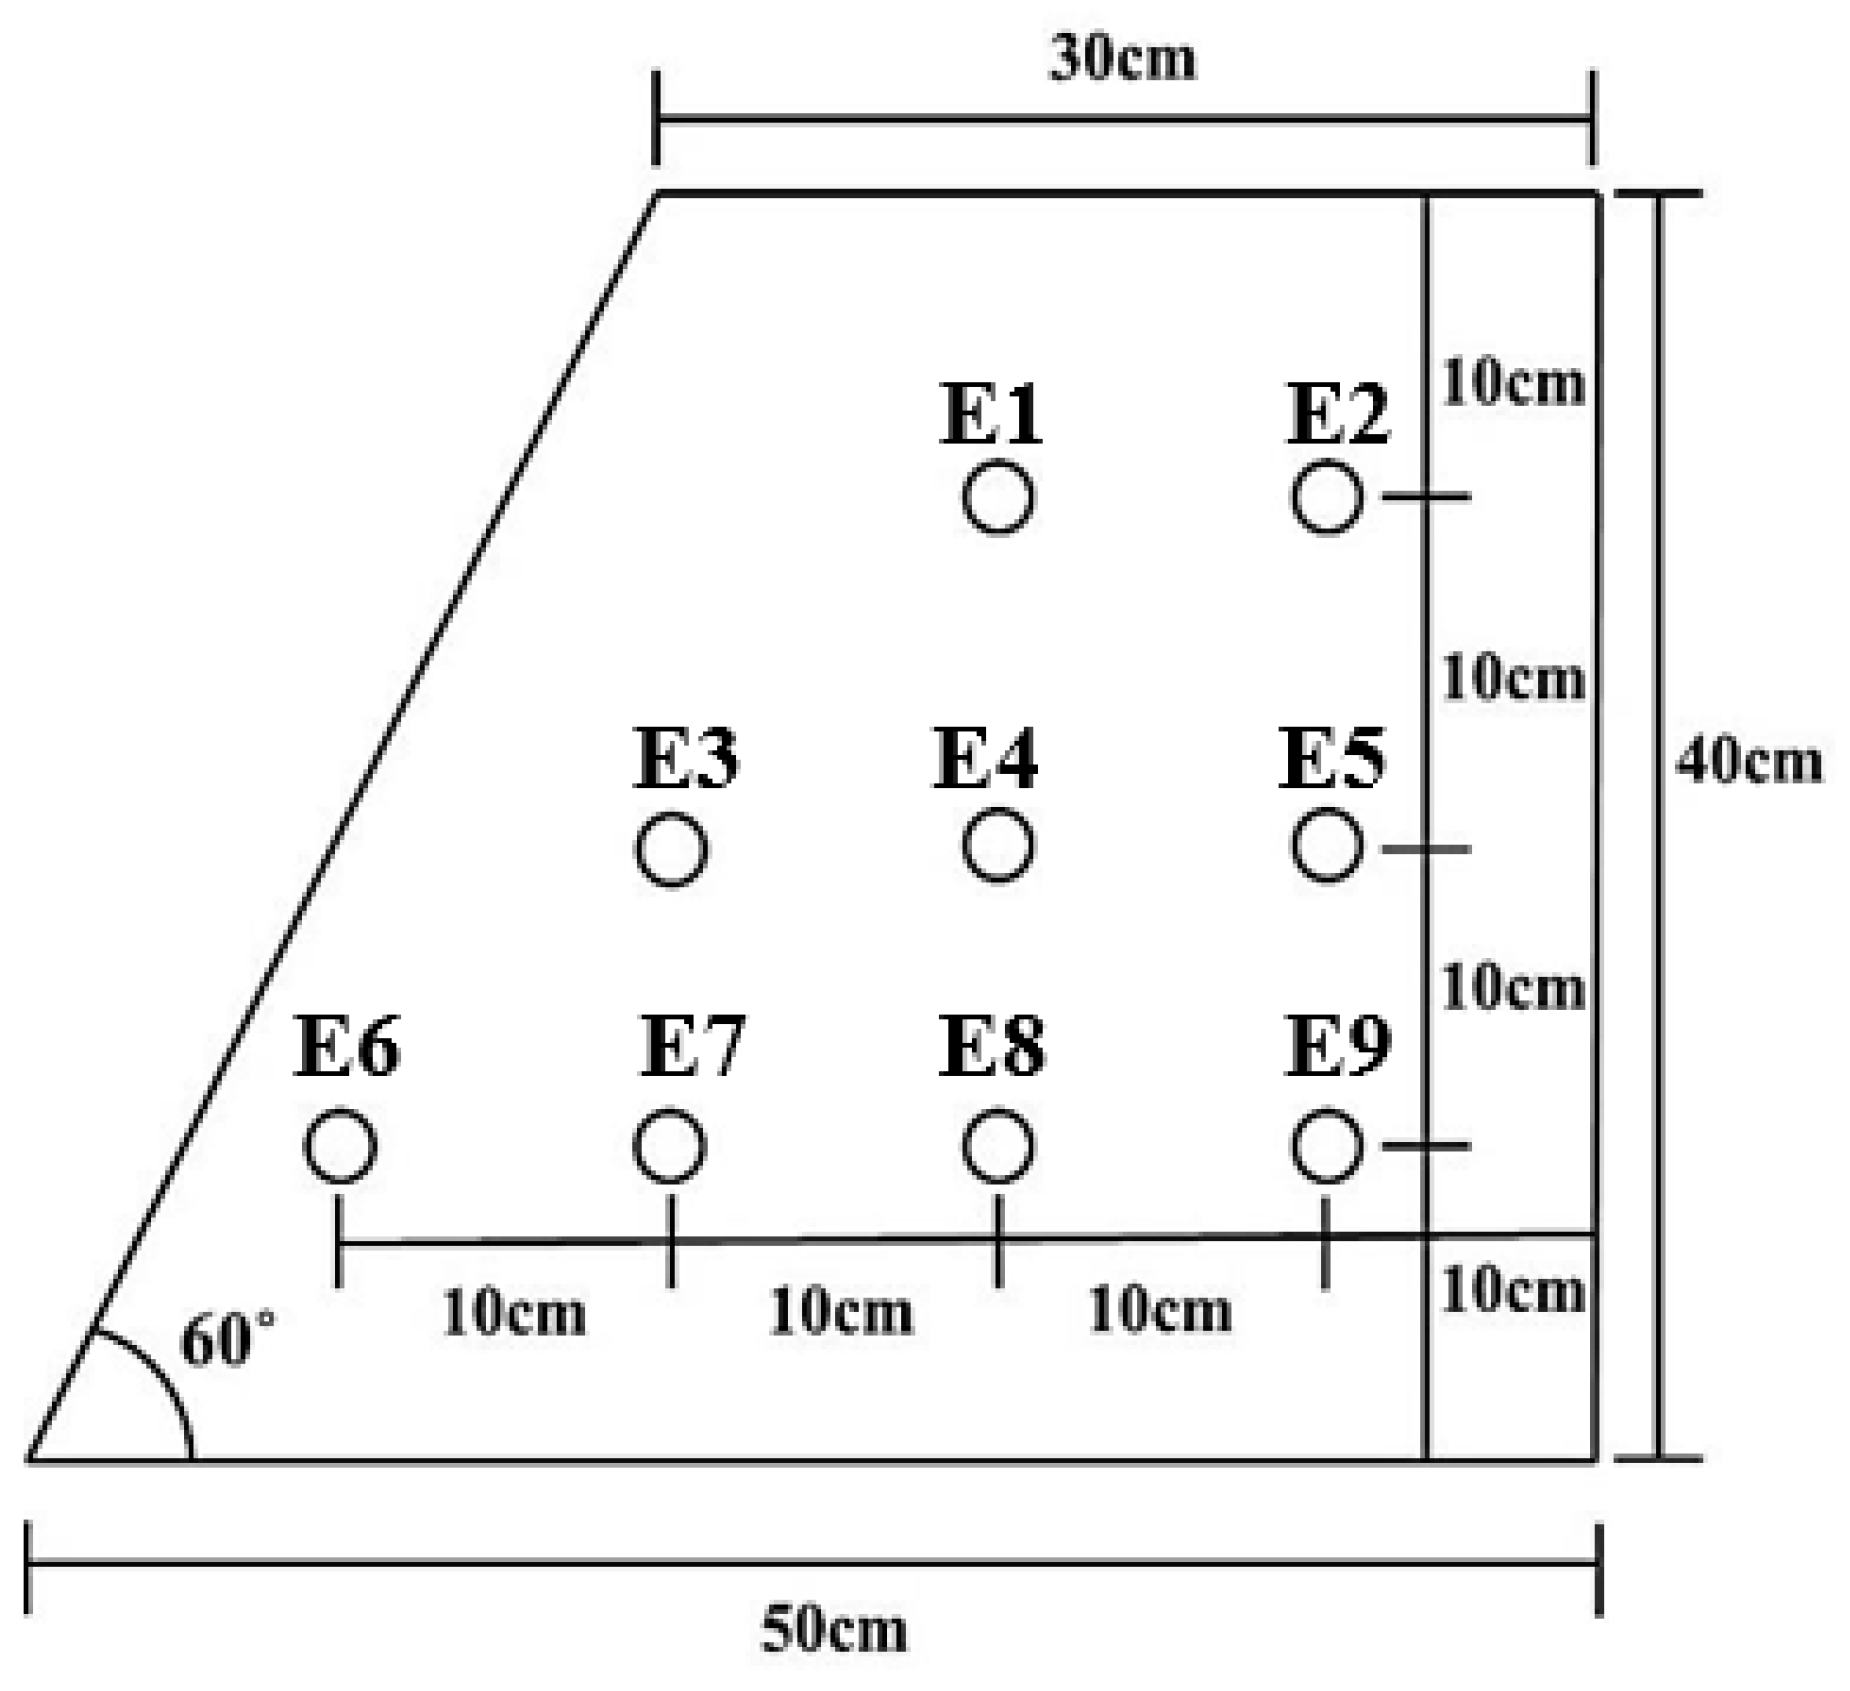
The artificial slope was constructed inside an acrylic box measuring 0.8 m in length, 0.3 m in width, and 0.9 m in height. The dimensions of the slope are 0.5 m in length, 0.3 m in width and 0.4 m in height. The soil slope was compacted to relative compaction levels of 70%, 80% and 90%, with initial moisture contents of 22%, 24% and 26%. The Optimum Moisture Content (OMC) is 24%. The slope angle after compaction is 60°. The soil moisture probes were installed when the soil was placed in the box. The layers were compacted every 5 cm, and a total of 10 layers were installed. The locations of the soil moisture probes are shown in Figure 3.
A total of 9 soil moisture probes were used to monitor moisture conditions of the slope. The soil moisture probe model number is EC-5. The probe is 8.9 cm long, 1.8 cm wide and 0.7 cm high. The precision of the probe is ±2%, and the monitoring range is 0 to 100%. The experiment used a CR1000 data collector to record and save moisture data, with saving occurring every minute.
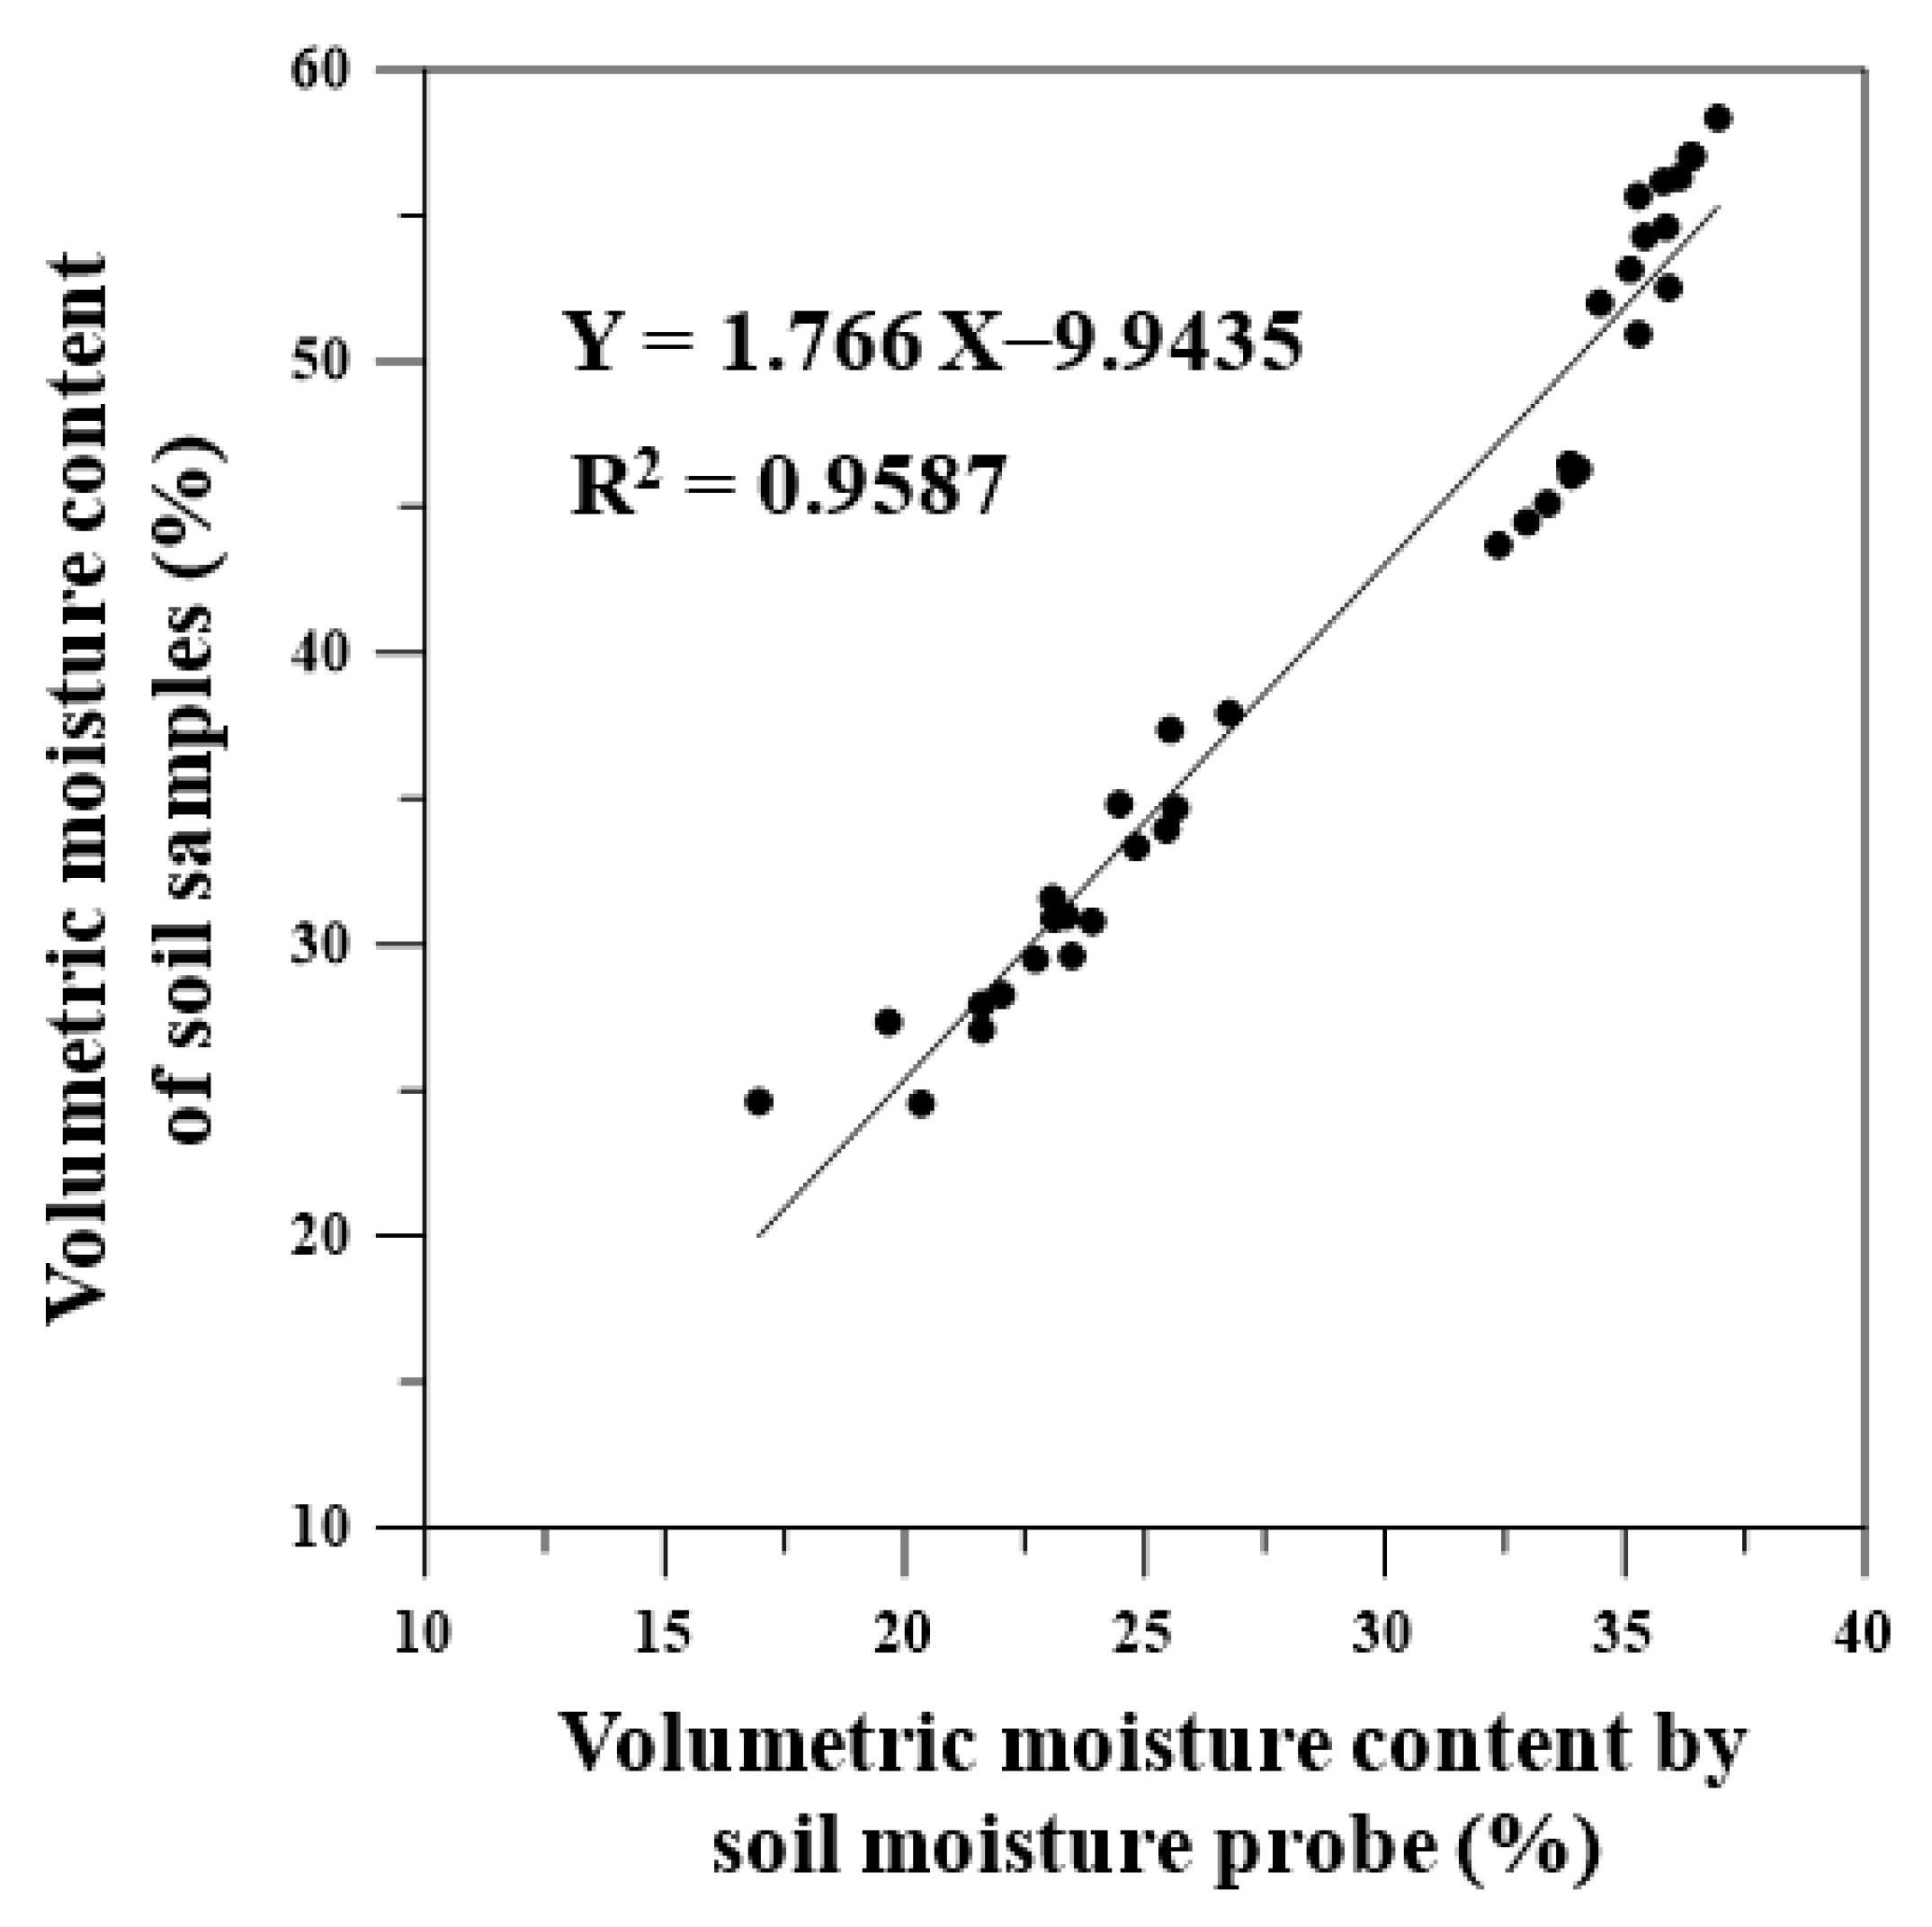
Before conducting the artificial rainfall infiltration experiment, the soil moisture probes were calibrated. This involved obtaining the actual weight moisture content of the experimental soil and converting it to volumetric moisture content. Subsequently, a linear regression trend line was established between the converted values and the values measured by the instrument, thus obtaining the calibration regression equation.
To investigate the potential effects of soil compaction and initial moisture content on the accuracy of soil moisture probes, we utilized an acrylic mold with a height of 50 cm and a diameter of 20 cm. Soil was compacted into the mold in 5 cm layers at relative compaction levels of 70%, 80% and 90%, and initial moisture contents of 22%, 24% and 26% were tested. Soil moisture probes were buried at various depths within each layer during the compaction process. The experimental instrument was turned on for monitoring after setup. Water was then poured into the mold to infiltrate the soil, and data were recorded accordingly. Afterward, samples were taken from the soil adjacent to each soil moisture probe to serve as a reference for the instrument’s response and the sampled moisture content. Figure 4 presents the calibration regression equation of one of the nine soil moisture probes. The figure demonstrates a strong linear correlation between the data obtained from the soil moisture probe and the actual volumetric moisture content of the soil, indicating that soil compaction and initial moisture content do not affect the accuracy of the soil moisture probe measurements.
3. Results and Discussion
The results obtained from the soil moisture probe measurements were used to create soil saturation contours, which were subsequently utilized to comprehend the infiltration depth during varying rainfall duration to evaluate the influence of rainfall intensity (I), relative compaction (R.C.), and initial moisture content (ω) on the infiltration behavior of unsaturated soil.
3.1. Effect of Rainfall Intensity on Infiltration Behavior
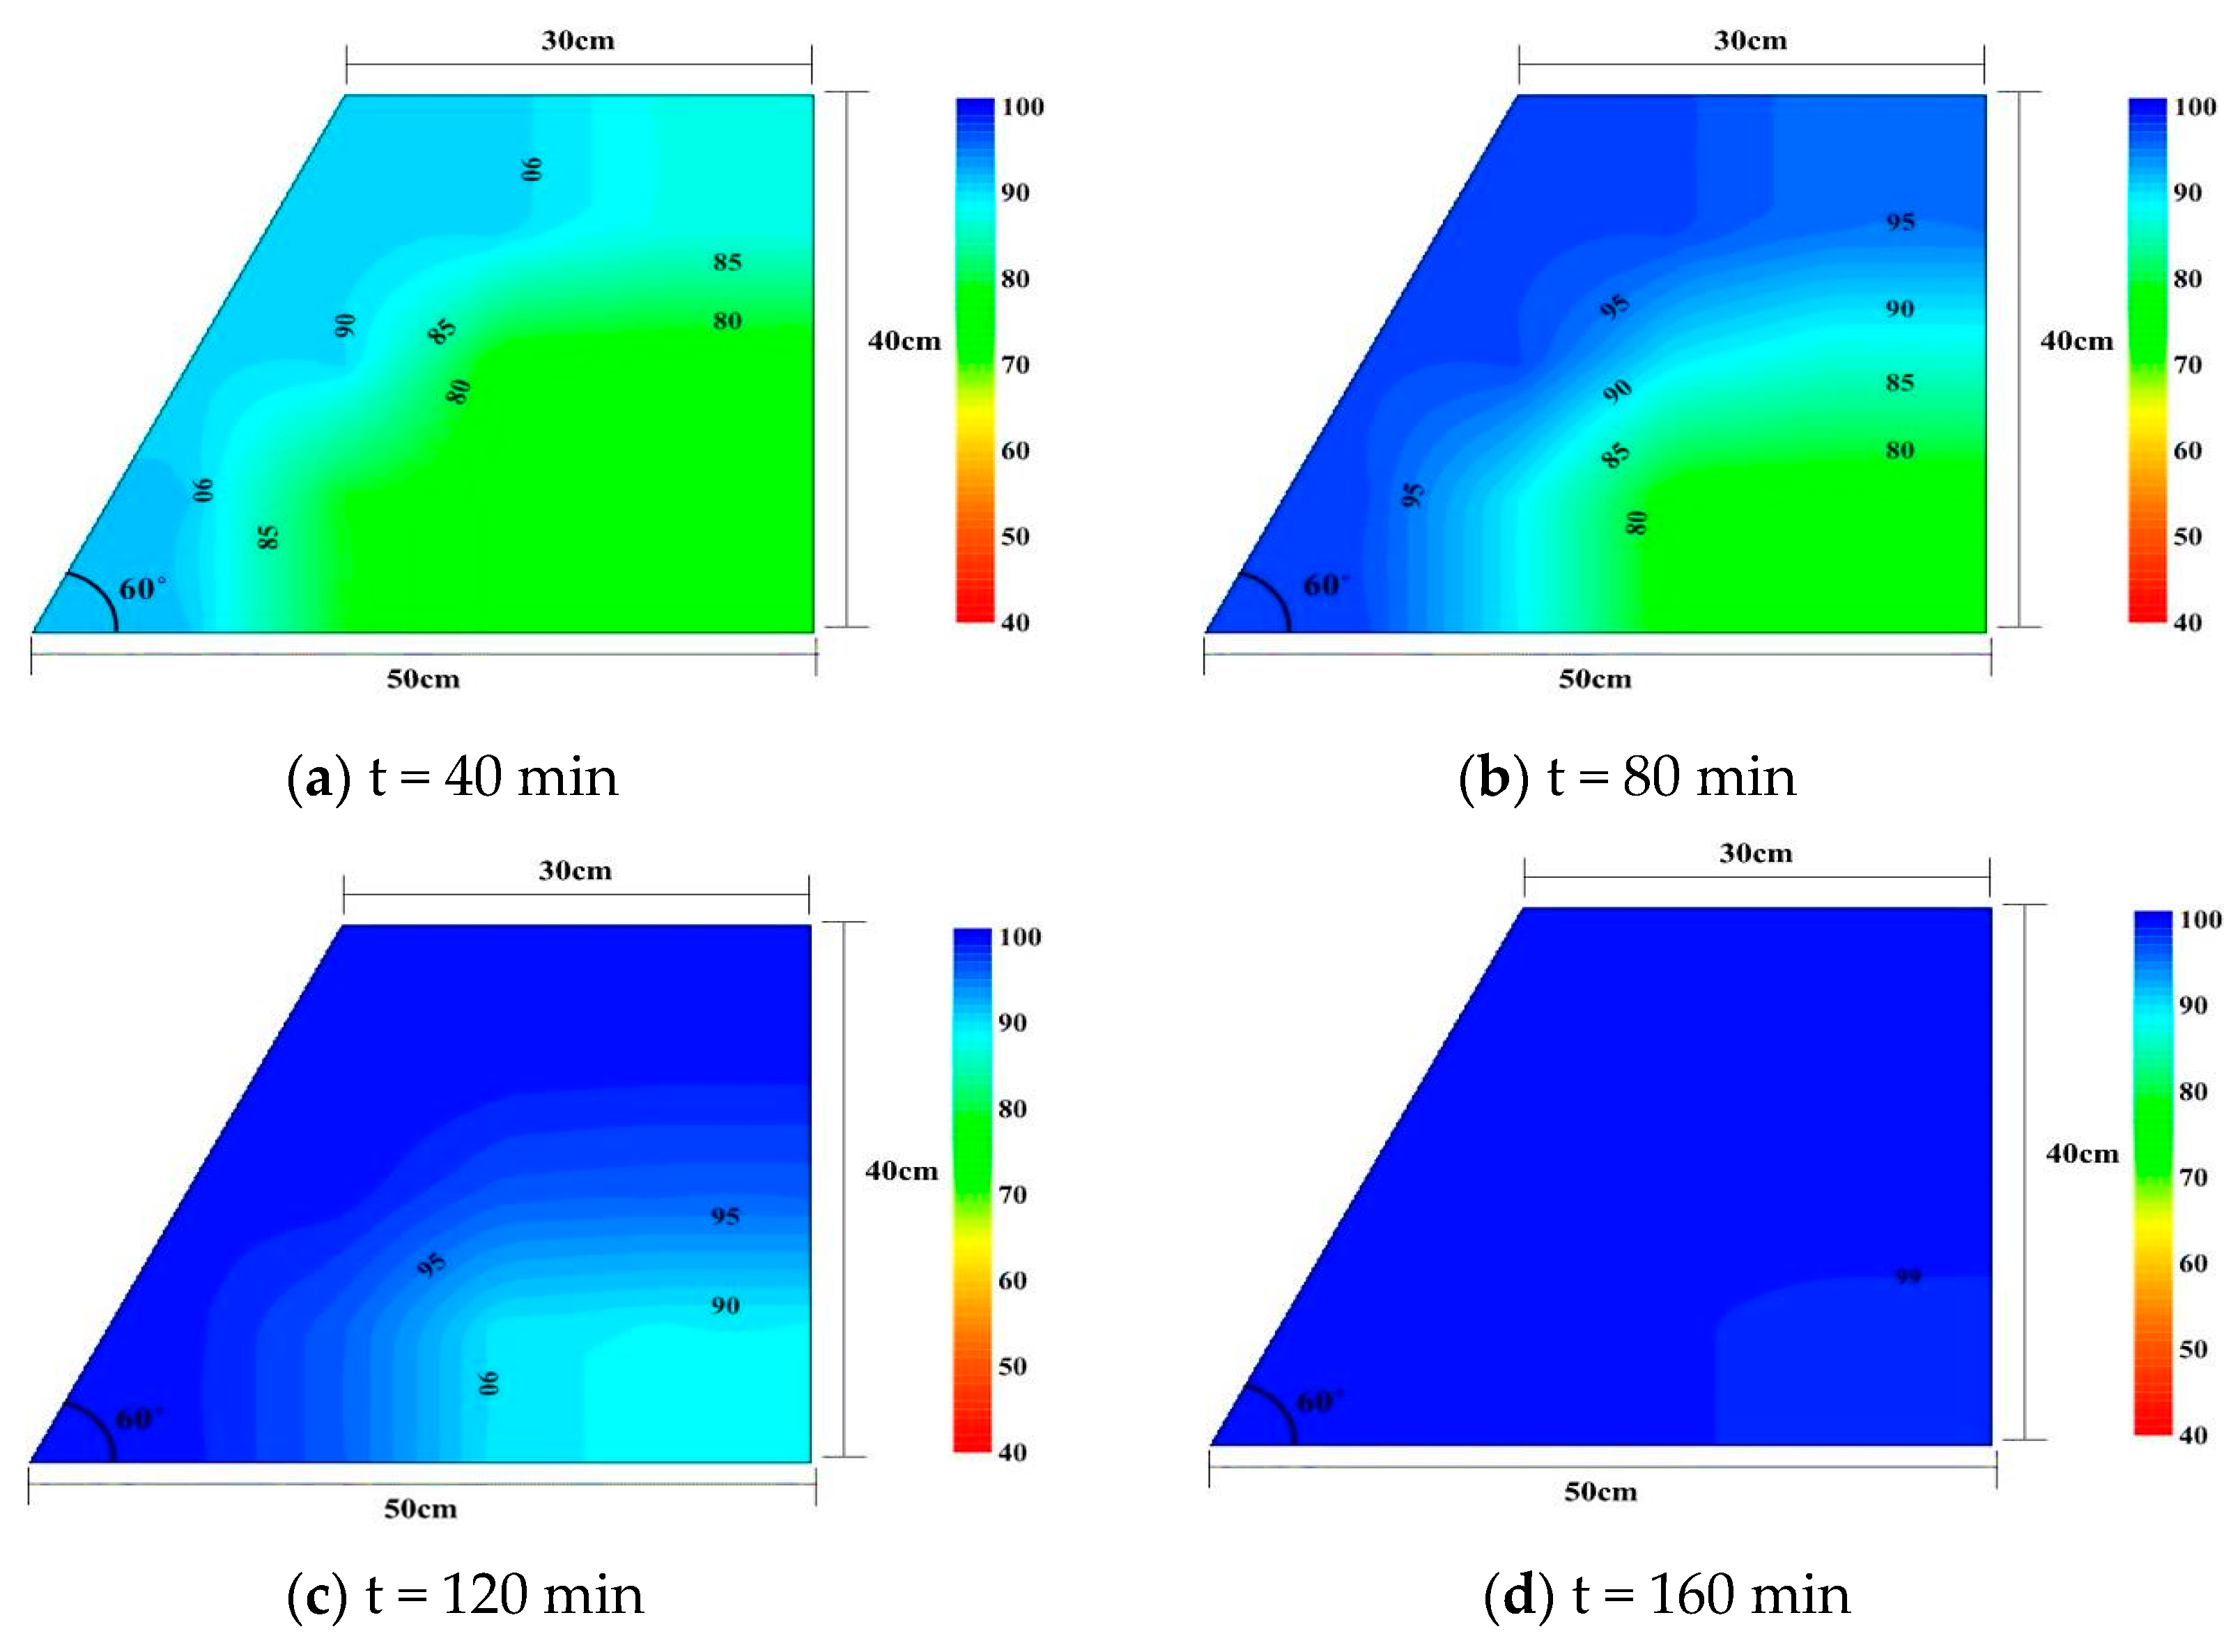
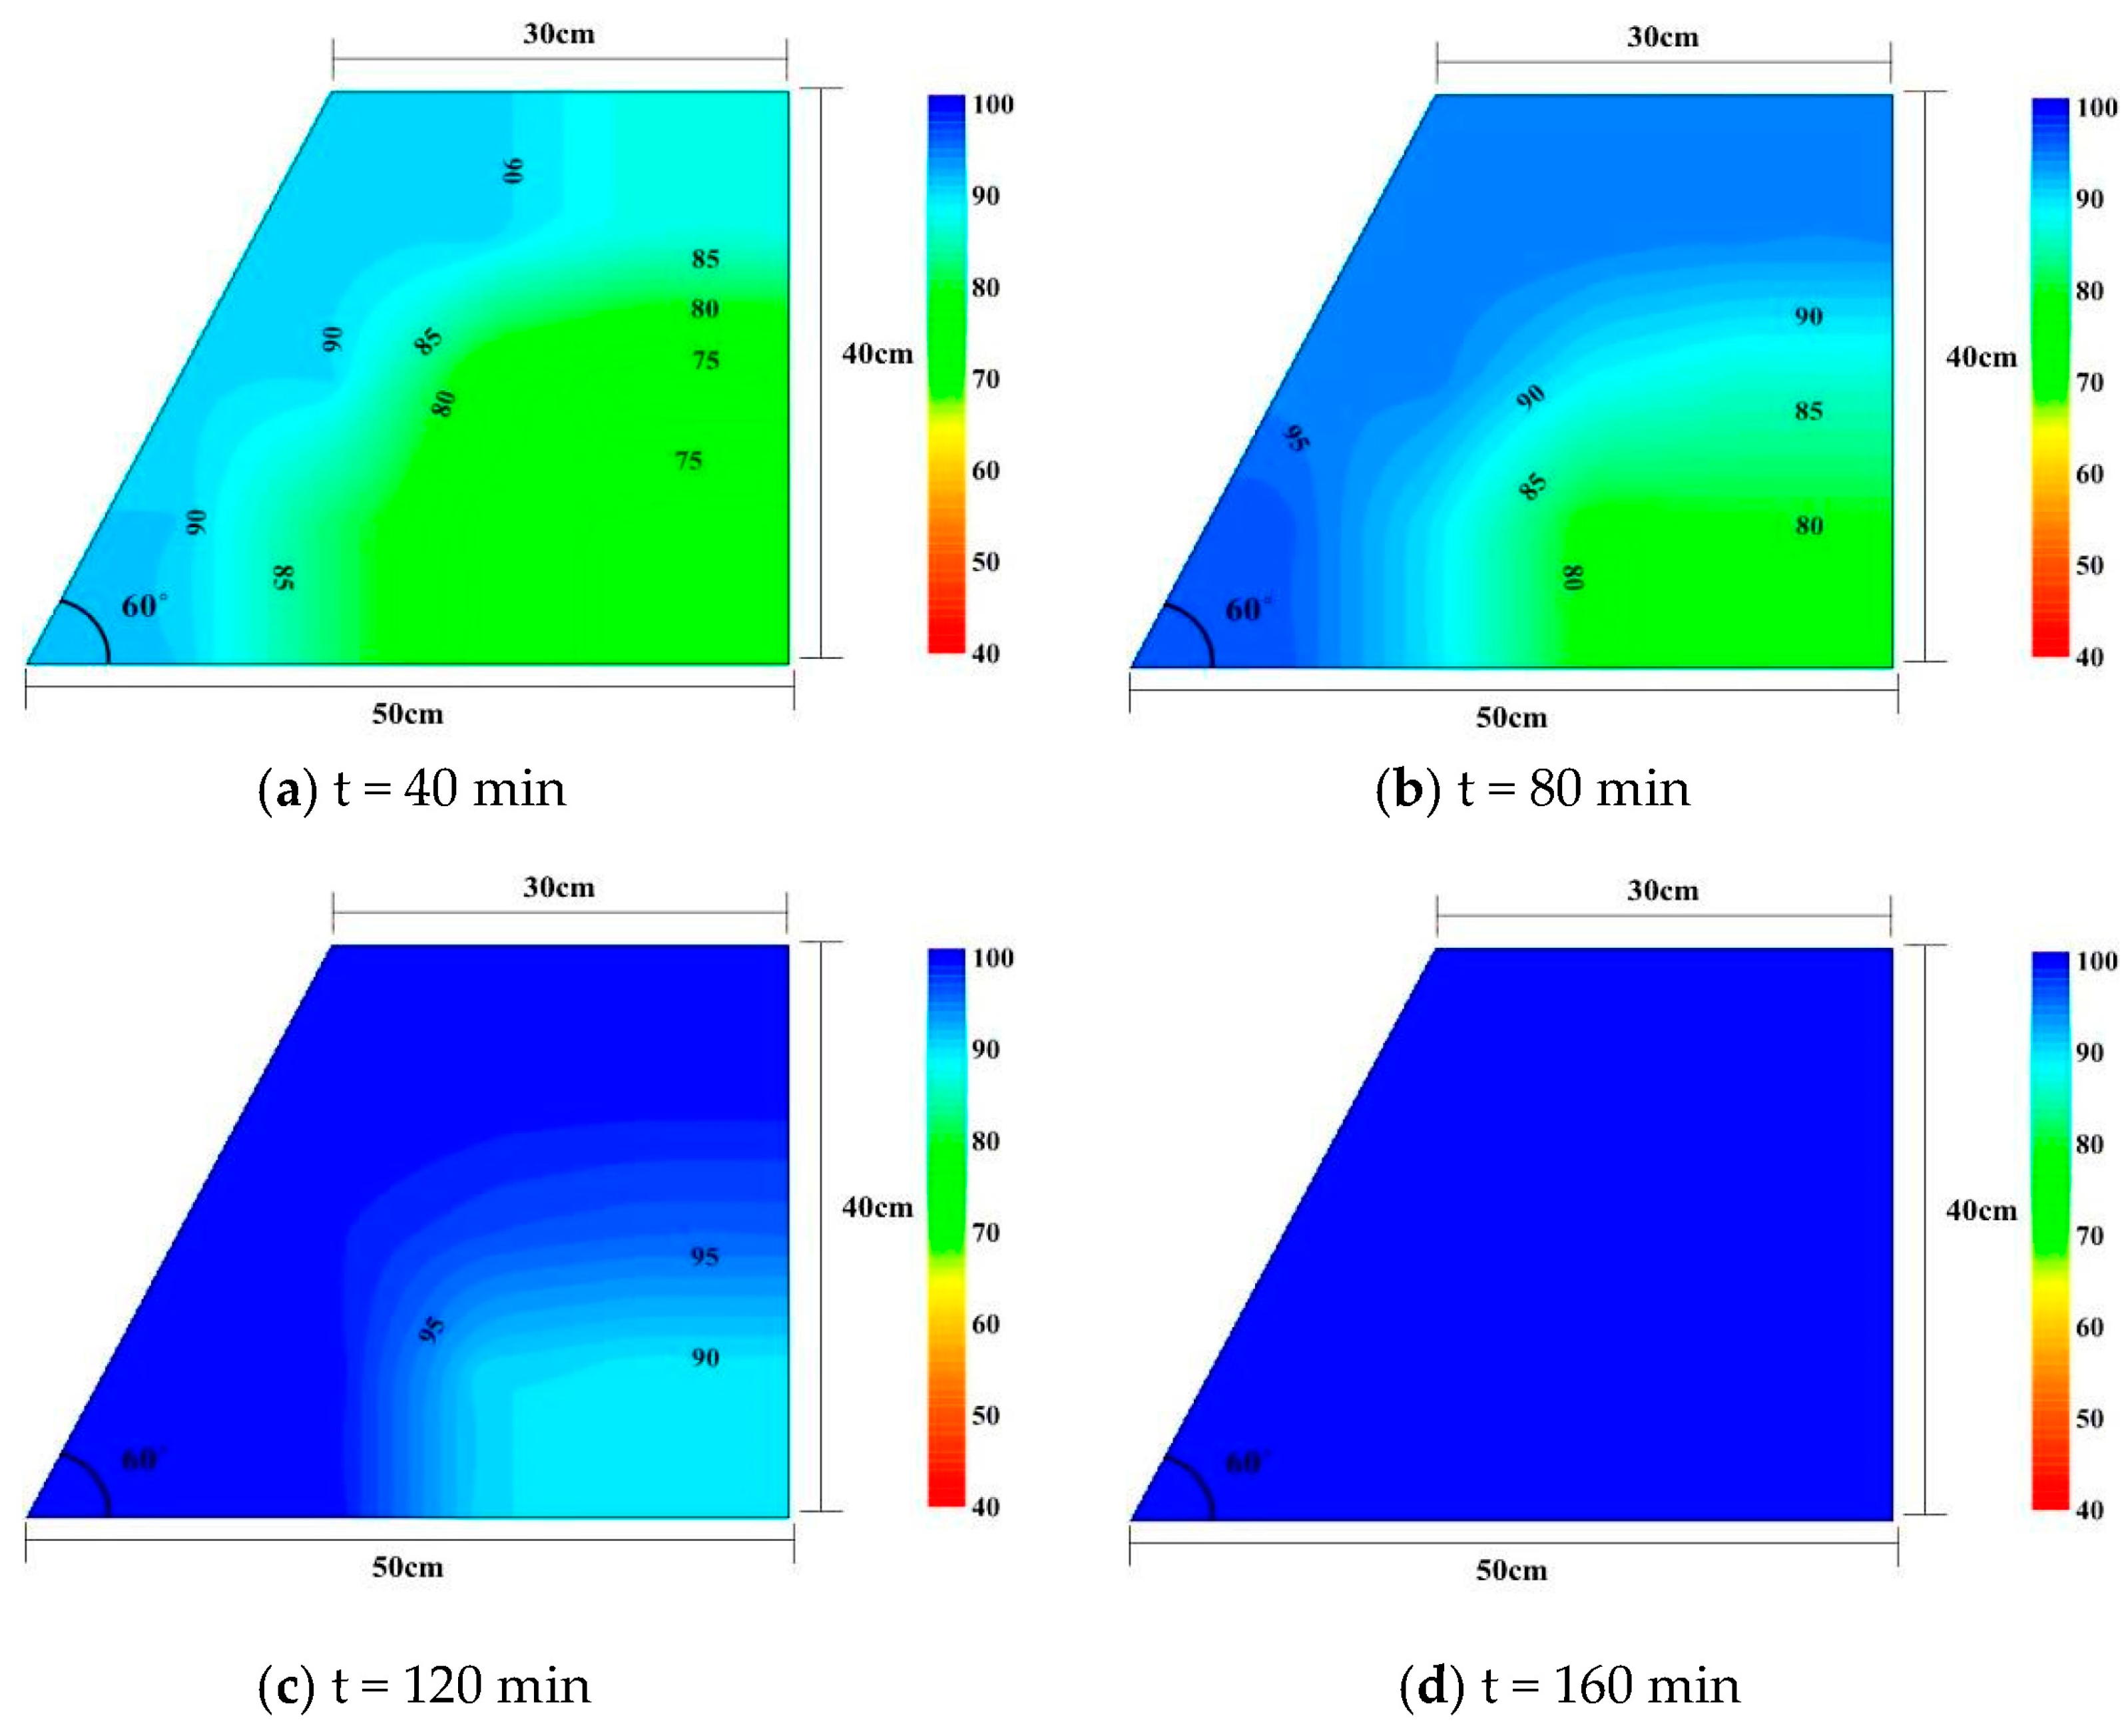
This section examines the impact of varying levels of rainfall intensity on the infiltration behavior and soil saturation in a slope compacted to a relative compaction of 90% at the Optimum Moisture Content (OMC). Figure 5 illustrates the soil saturation contours under different rainfall durations of 40, 80, 120 and 160 min, resulting from a rainfall intensity of 80 mm/h. Based on the figure, it was observed that as the rainfall duration increased, water infiltrated from both the top and the slope surface, causing the soil to gradually approach saturation from the initial saturation level of around 75% from the upper left to the lower right of the slope. The degree of saturation was indicated by the color, with deeper blue indicating closer proximity to saturation. It was seen from Figure 5a that the soil saturation was higher at the toe of the slope than at other locations, primarily due to the rainfall infiltration from the slope surface and subsequent seepage towards the toe. Park and Song [52] also indicated that the wetting front initially progresses downward, and then the accumulated rainwater at the toe of the slope creates a water table that advances toward the crest.
As shown in Figure 5b, rainfall infiltration caused the soil near the surface to transition from a partially saturated state to a saturated state, resulting in the formation of a wetting band after 80 min of rainfall duration. When the rainfall duration reached 120 min, the depth of the wetting band on the slope gradually increased, as shown in Figure 5c. After a rainfall duration of 160 min, the soil of the entire slope had almost fully saturated, as shown in Figure 5d. Figure 6 displays the soil saturation contours at various rainfall durations with a rainfall intensity of 160 mm/h. It is worth noting that an increase in rainfall intensity caused a slight rise in infiltration rate. However, the overall infiltration behavior under a rainfall intensity of 160 mm/h was very similar to that observed under a rainfall intensity of 80 mm/h, indicating that rainfall intensity had a monor effect on the rainfall infiltration behavior during the experiment. The high rainfall intensity during the experiment resulted in most of the rainfall on the slope becoming surface runoff. This was because the hydraulic conductivity of saturated soil, compacted at optimal moisture content and 90 R.C., is only 7.041 × 10⁻⁵ cm/sec, which is equivalent to 2.53 mm/h. This is much lower than the rainfall intensities of 80 mm/h and 160 mm/h. According to Mein and Larson [53], when the infiltration rate is at capacity and decreasing, runoff is generated. At this point, the hydraulic conductivity is smaller than the infiltration rate and rainfall intensity. As a result, an increase in rainfall intensity had a limited impact on the infiltration rate but had a significant effect on slope erosion. However, when the rainfall intensity is not as high, it may have an impact on the rainfall infiltration behavior.
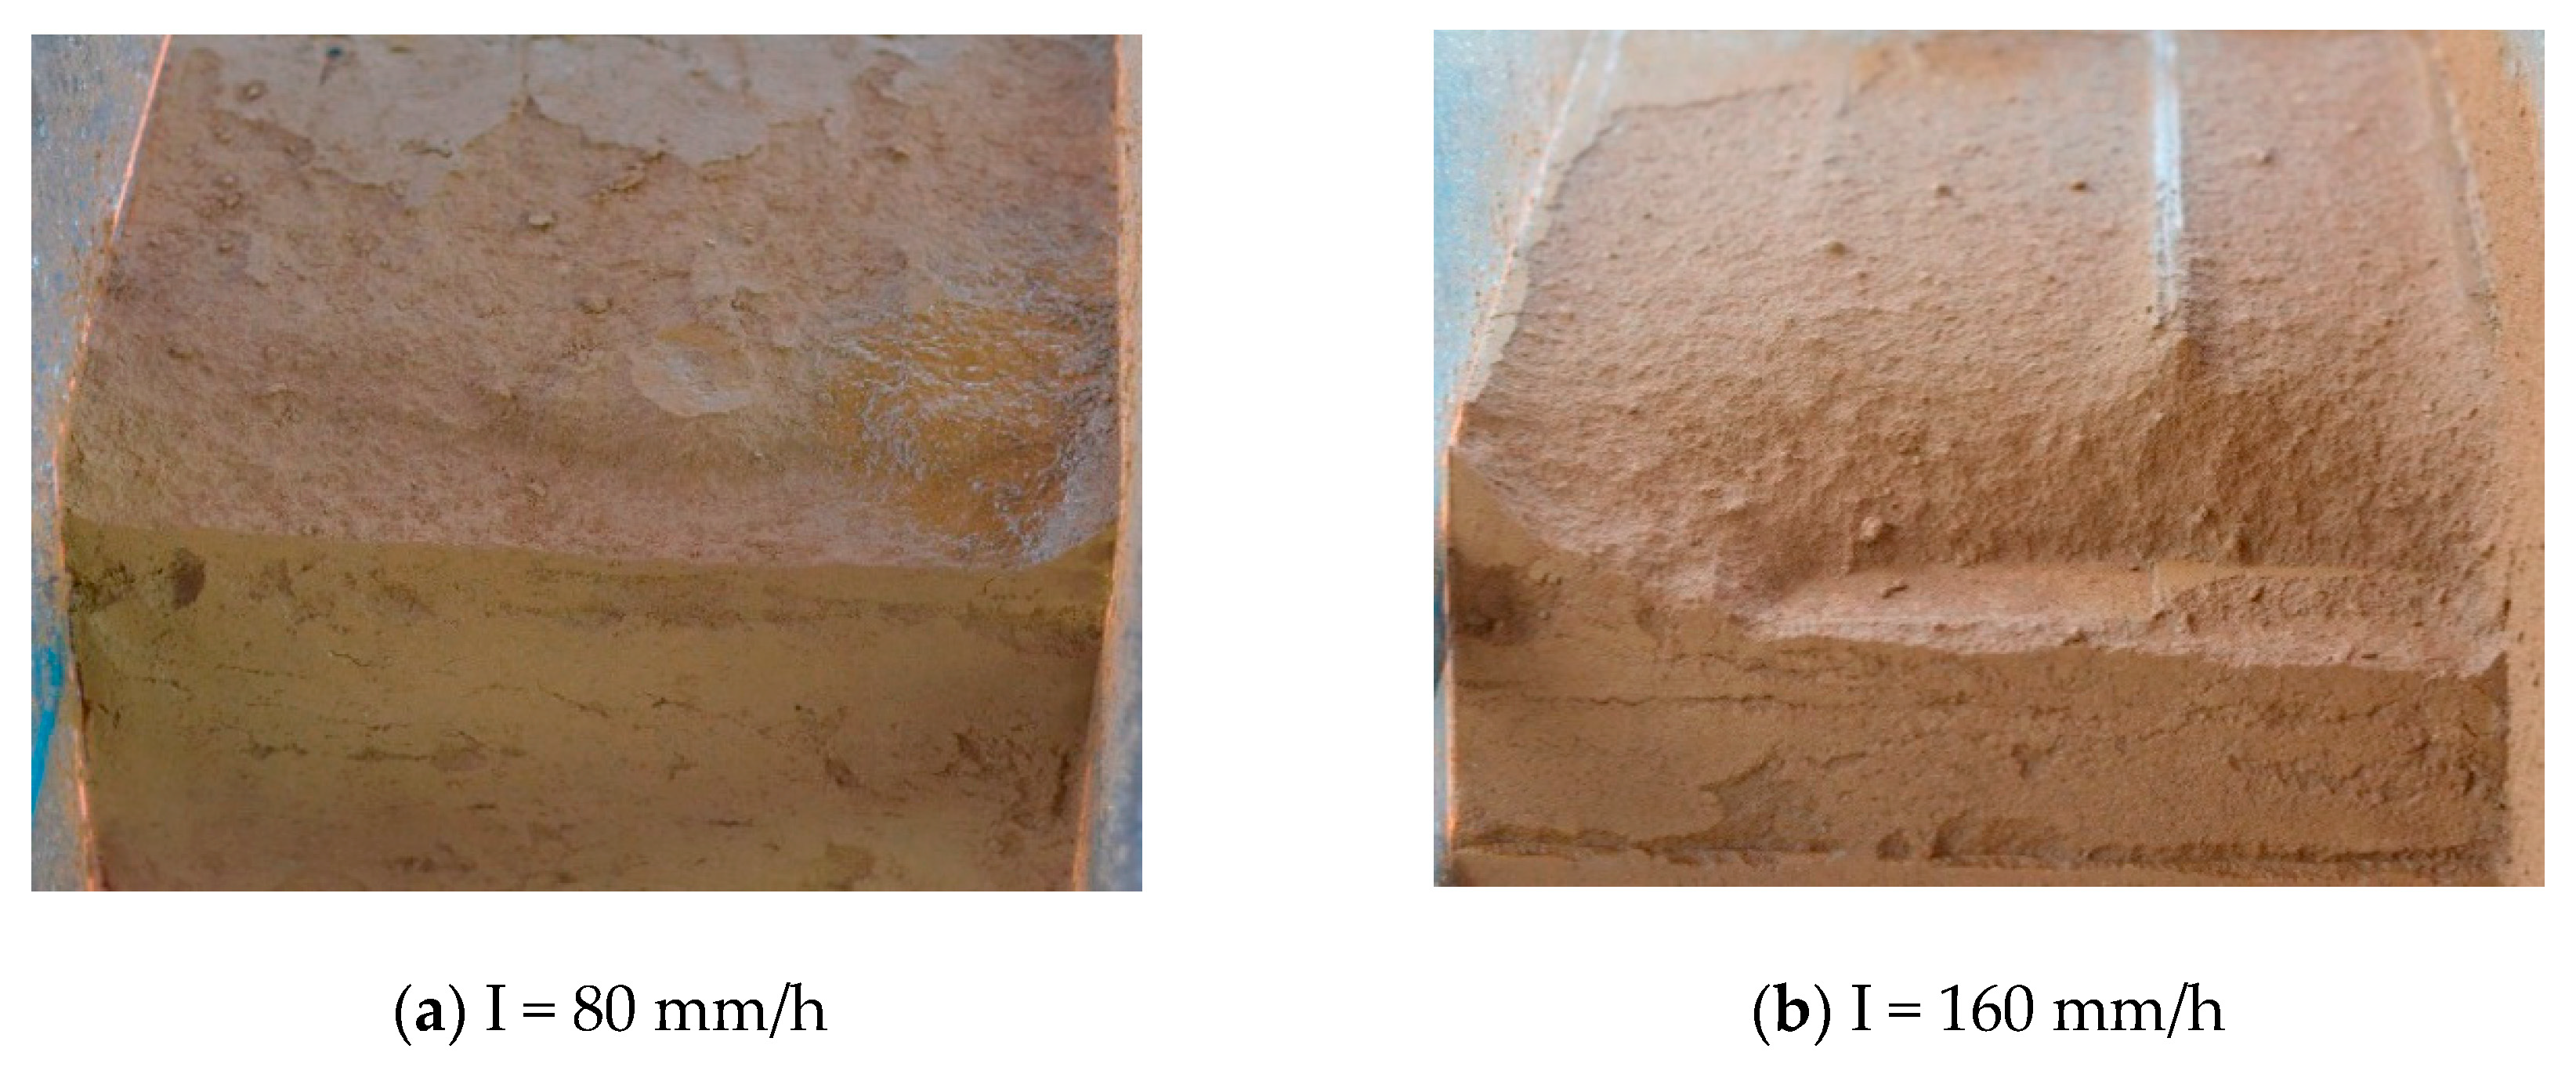
In Figure 7, the failure conditions of the slope at saturation are depicted for a relative compaction of 90% at the Optimum Moisture Content (OMC) under rainfall intensities of 80 mm/h and 160 mm/h, respectively. The direction of the view is the front of the slope. Figure 7 shows that after 160 min of artificial rainfall, the slope failure characteristics varied significantly with rainfall intensity. The high intensity of rainfall, measuring 160 mm/h, resulted in an increase in overland surface runoff, causing severe erosion at the crest of the slope and ultimately resulting in the formation of an arcuate gully. In contrast, rainfall with a low intensity of 80 mm/h resulted in significantly less gullying. Despite differences in the severity of gullying, the observations show that gullying initiated at the crest of the slope and propagated downslope under both high and low rainfall intensities.
3.2. Effect of Initial Moisture Content of Compaction on Infiltration Behavior
This section describes an experiment where a rainfall intensity of 80 mm/h was applied to a slope that had been compacted to a relative compaction of 90%. To investigate the effect of the initial moisture content of the compacted soil on infiltration behavior, we repeated the experiment with varying levels of soil moisture at the time of compaction. The findings of the experiment are presented in Figure 8 and Figure 9. Figure 8 and Figure 9 illustrate that the initial saturation level for the dry of compaction is approximately 70%, while for the wet of compaction, it is around 85%. Regarding the effect of initial moisture contnet on infiltration behavior, the results show that as the initial moisture content of the compacted soil increased, the rainfall duration required to infiltrate to the same depth also increased. Specifically, the infiltration duration increased from the dry of optimum, to OMC and to the wet of optimum compaction. For instance, to fully saturate the soil of a slope through rainfall infiltration, it would require 150, 160 and 168 min of rainfall duration, respectively, for a slope compacted at the dry of optimum, at the OMC and at the wet of optimum.
The soil slopes compacted at dry of optimum exhibited a flocculated structure with a large number of voids and high hydraulic conductivity when the same relative compaction was applied [14]. In contrast, compaction at Optimum Moisture Content (OMC) and wet of optimum resulted in a dispersed structure that reduced the infiltration rate.
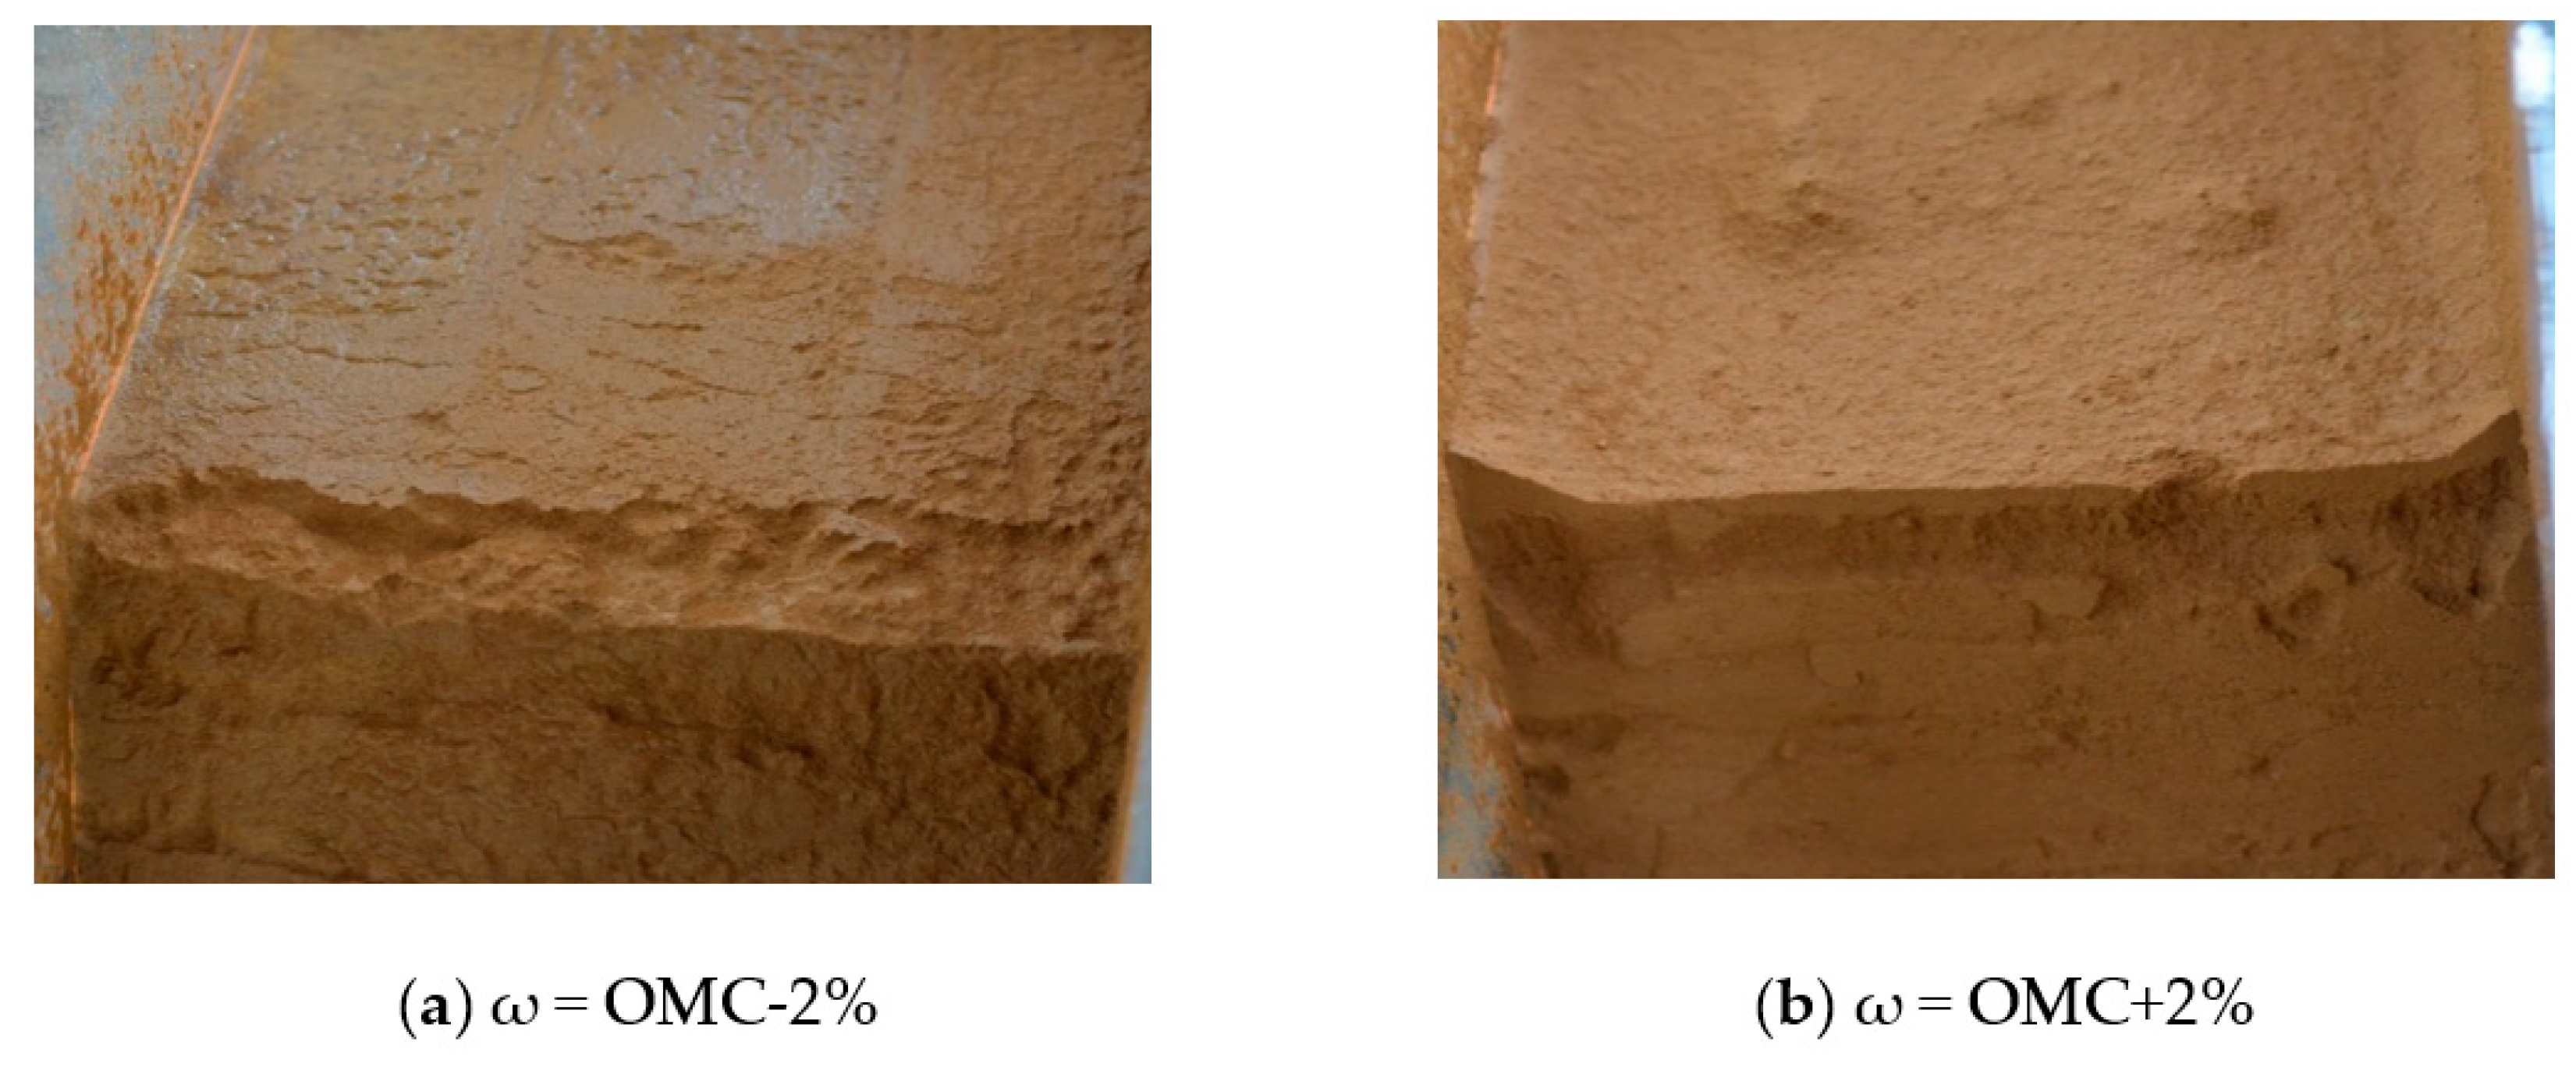
When comparing the failure characteristics of the slope at saturation, it was observed that the severity of failure was higher for the soil compacted at the dry of the optimum (Figure 10a) than for the soil compacted at the Optimum Moisture Content (OMC) (Figure 7a) and the wet of optimum (Figure 10b). The failure process developed rapidly in the soil slope that was compacted at the dry of optimum, with surface runoff causing particle loss and resulting in failure at the crest and slope surface.
Lambe [14] found that the dry density of the soil decreases after hydraulic conductivity tests on soil compacted at dry of optimum. In contrast, no significant change or only a slight increase in density occurs for a soil compacted at wet of optimum. This demonstrates that soil compacted at a wet of optimum and affected by sub-surface flow or infiltration during precipitation is less prone to subsiding and more likely to remain stable compared to soil compacted at a dry of optimum. Therefore, when compacting soil, it is important that the initial water content of the soil be controlled during compaction. Otherwise, the soil structure may be altered, which may, in turn, affect the infiltration characteristics and magnitude of any failure that occurs in the slope.
3.3. Effect of Relative Compaction on Infiltration Behavior
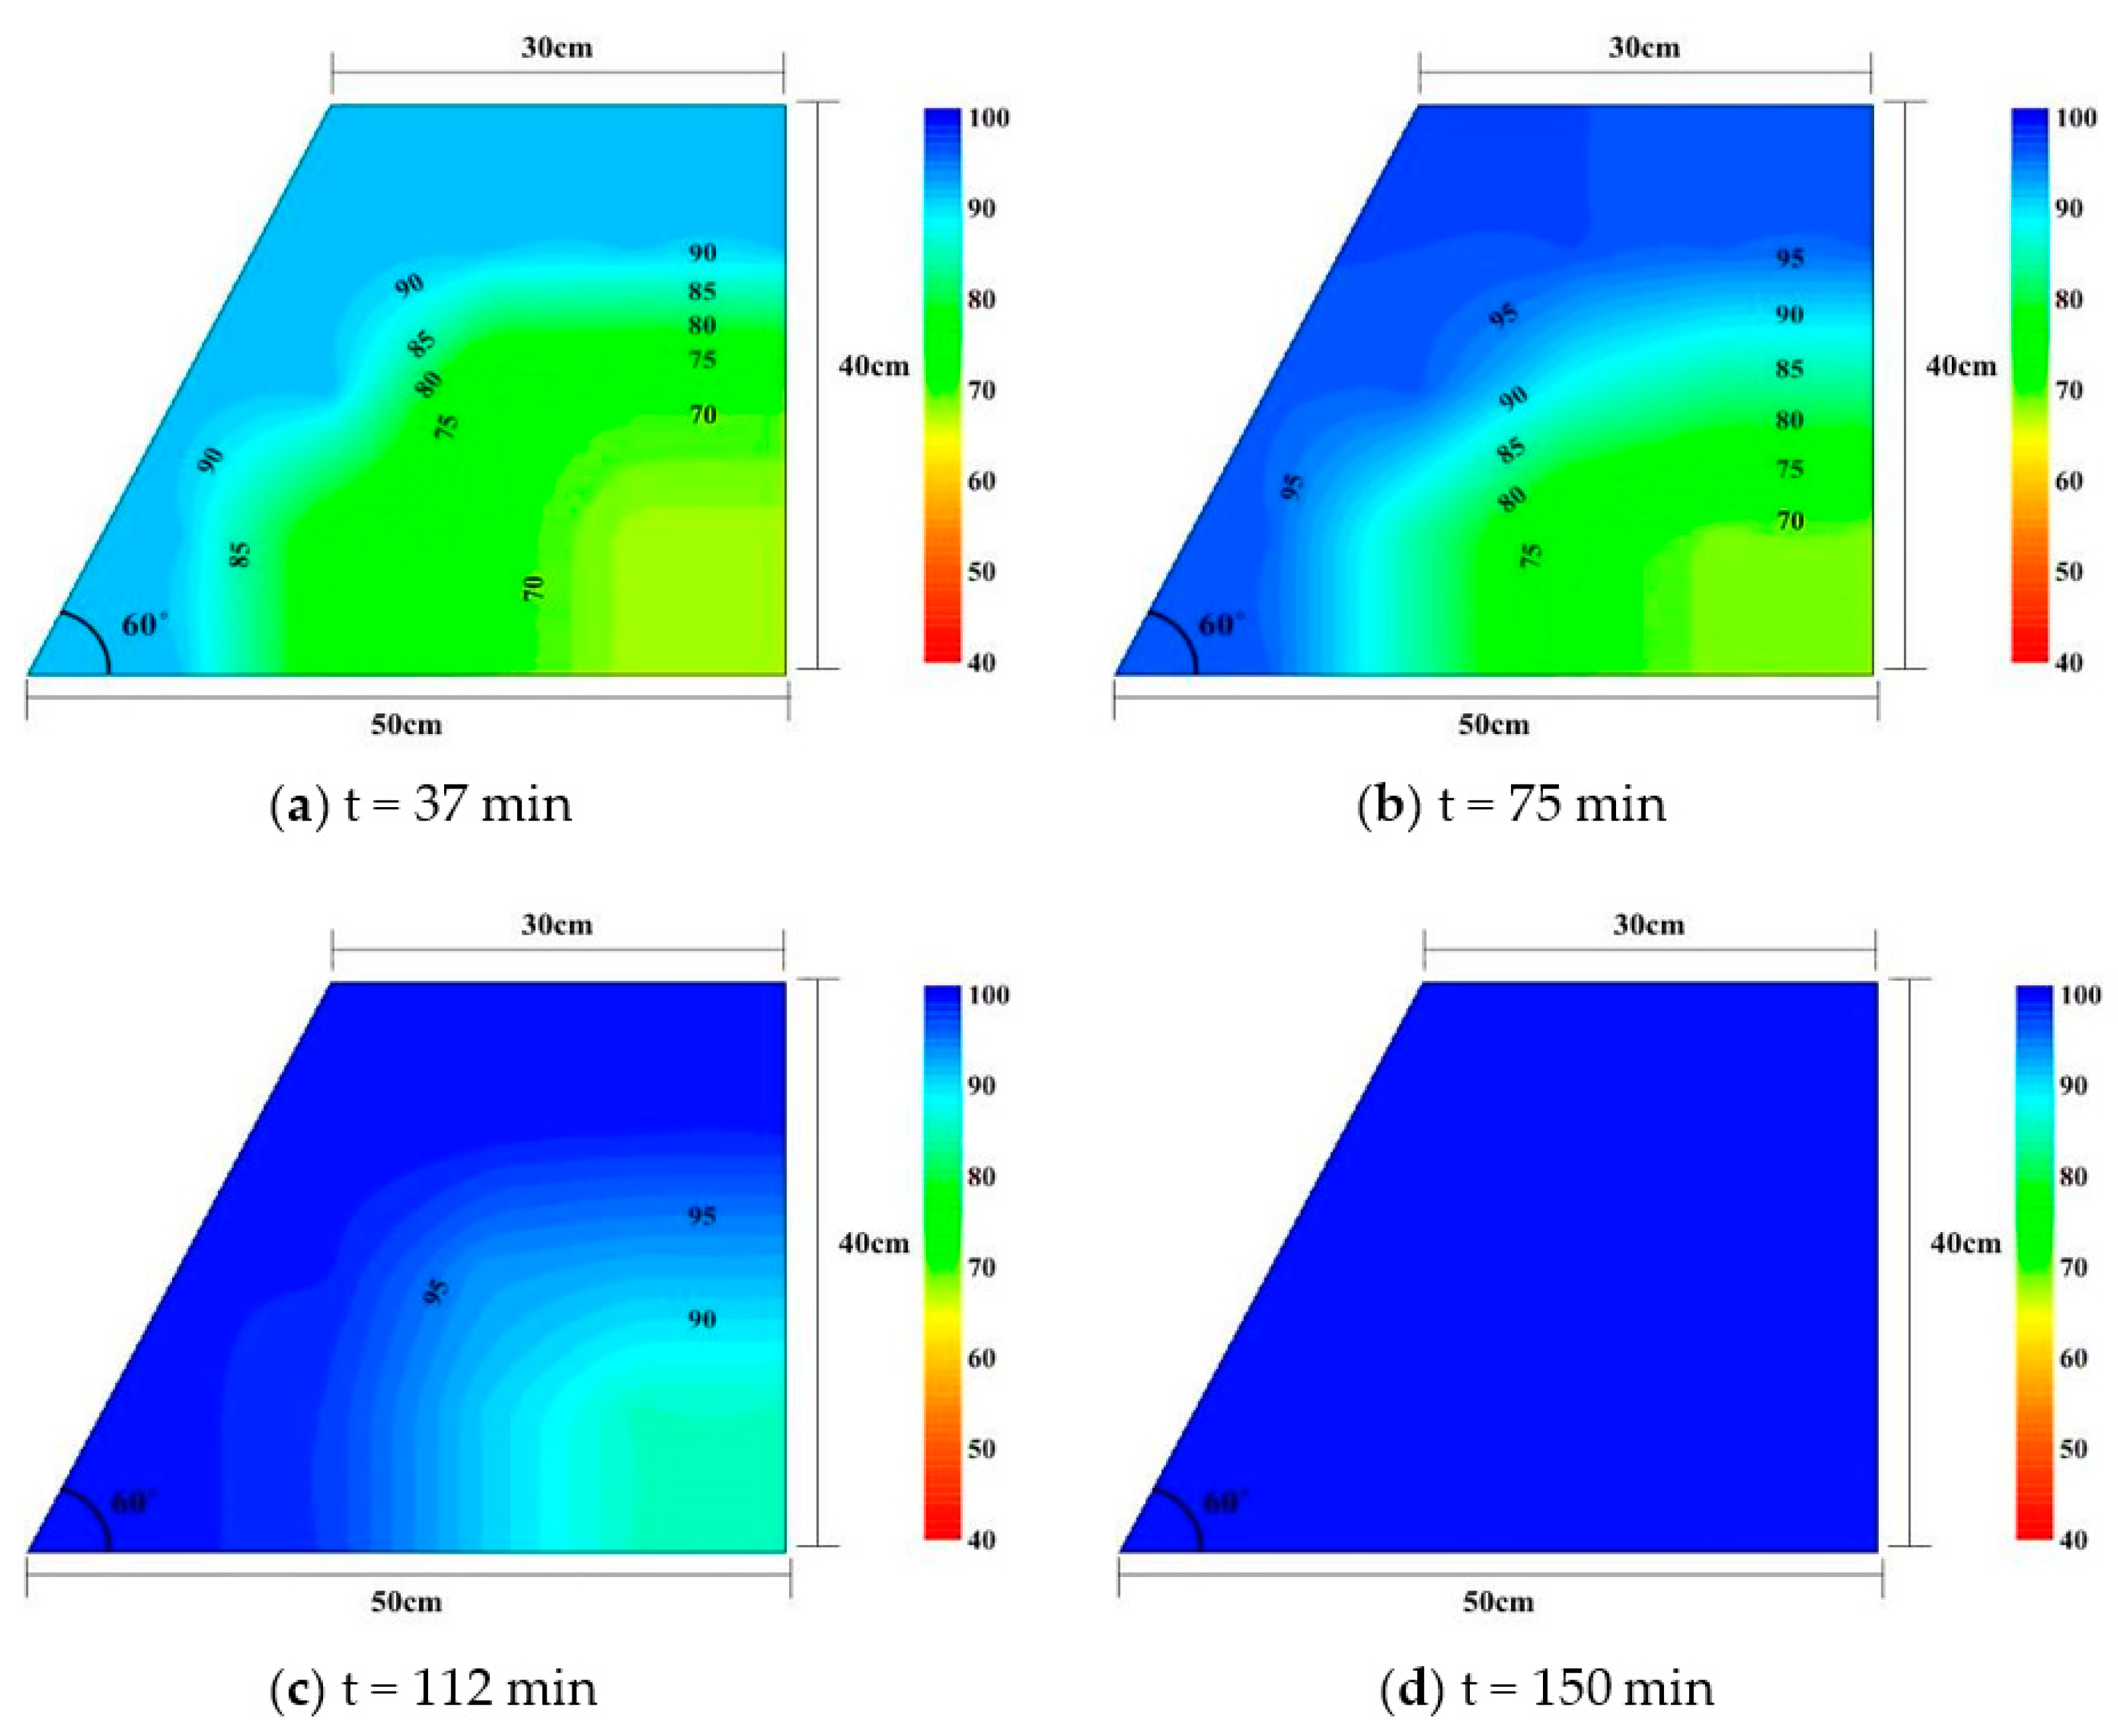
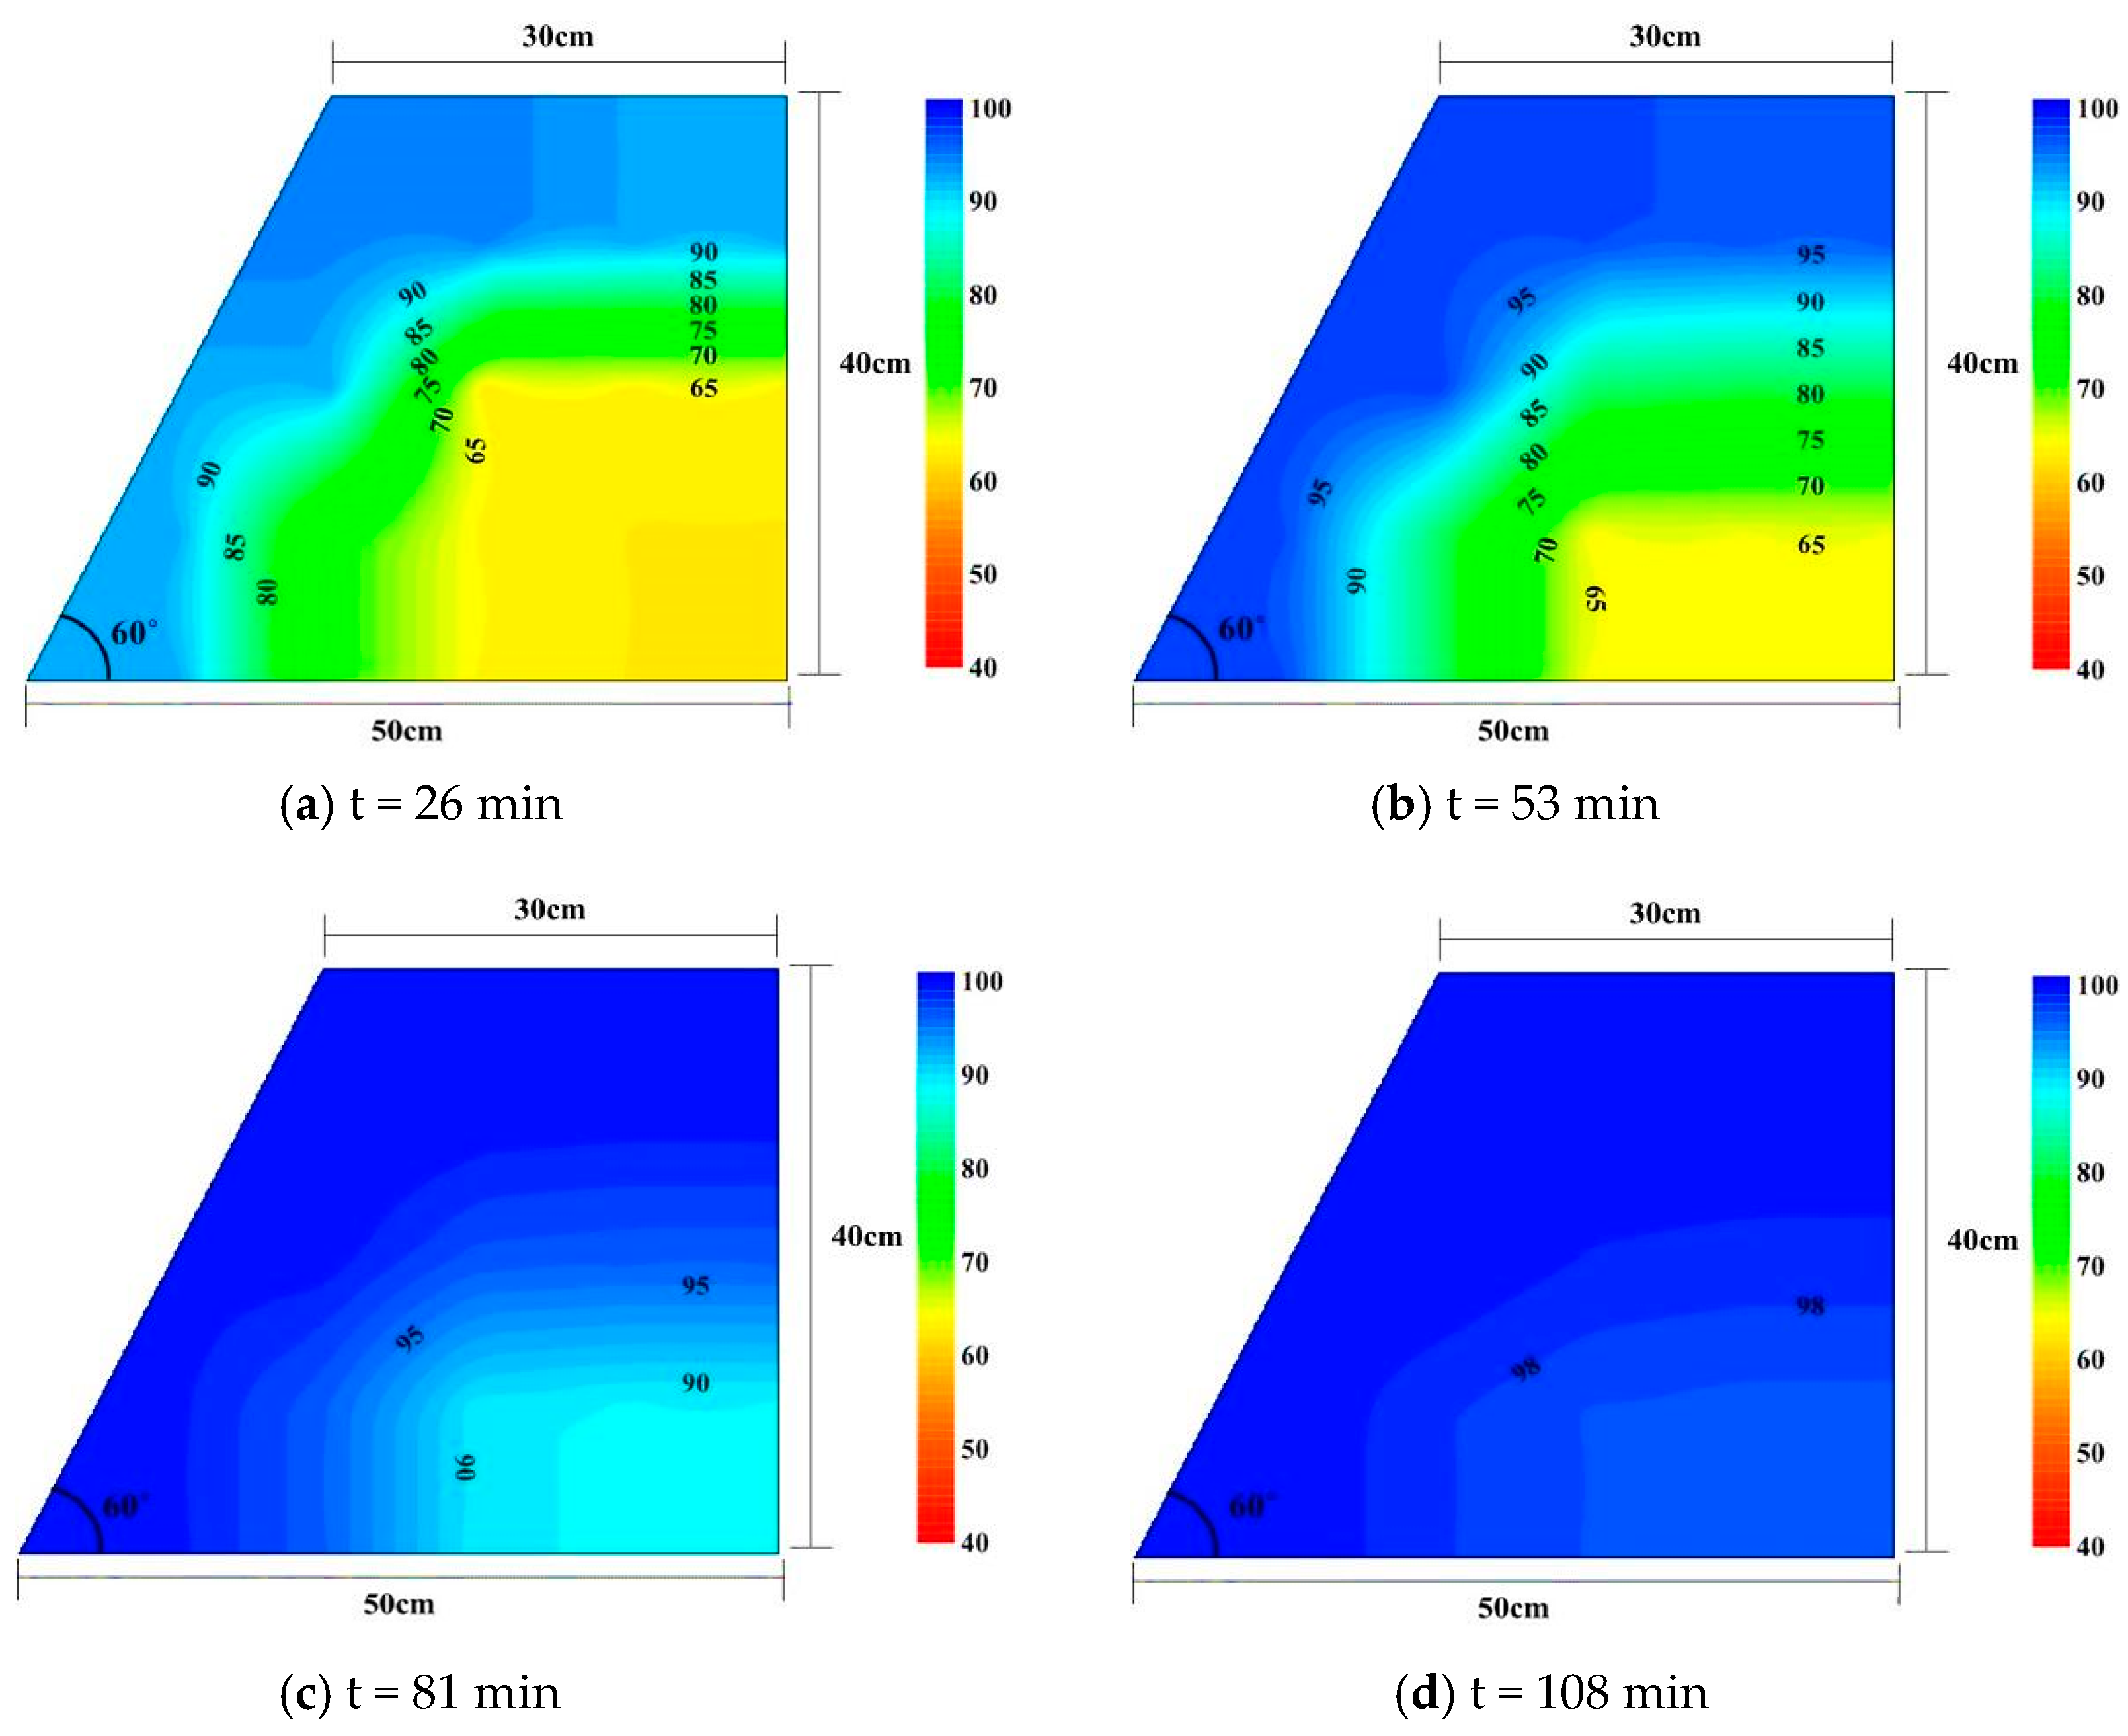
This section examines the impact of relative compaction on infiltration behavior and soil saturation for a slope that was compacted at the Optimum Moisture Content (OMC) under a rainfall intensity of 80 mm/h. Results are plotted in Figure 11 and Figure 12. From soil saturation contours, the initial soil saturation of the compacted slope was lower when the relative compaction was lower. The initial saturation level of the soil was 50% at a relative compaction level of 70%, 60% at 80% relative compaction, and 75% at 90% relative compaction, based on the soil saturation conditions shown in the saturation contours. These findings indicate that as the relative compaction increased, the saturation level of the soil increased. However, as the rainfall duration increased, the slope quickly saturated due to its low relative compaction. In other words, as the relative compaction increased, the infiltration time also increased. To fully saturate the soil of a slope through rainfall infiltration, it would take different amounts of time depending on the level of relative compaction. Specifically, for a slope that was compacted at 70%, 80% and 90% relative compaction, it would take approximately 64, 108 and 160 min of rainfall duration, respectively.
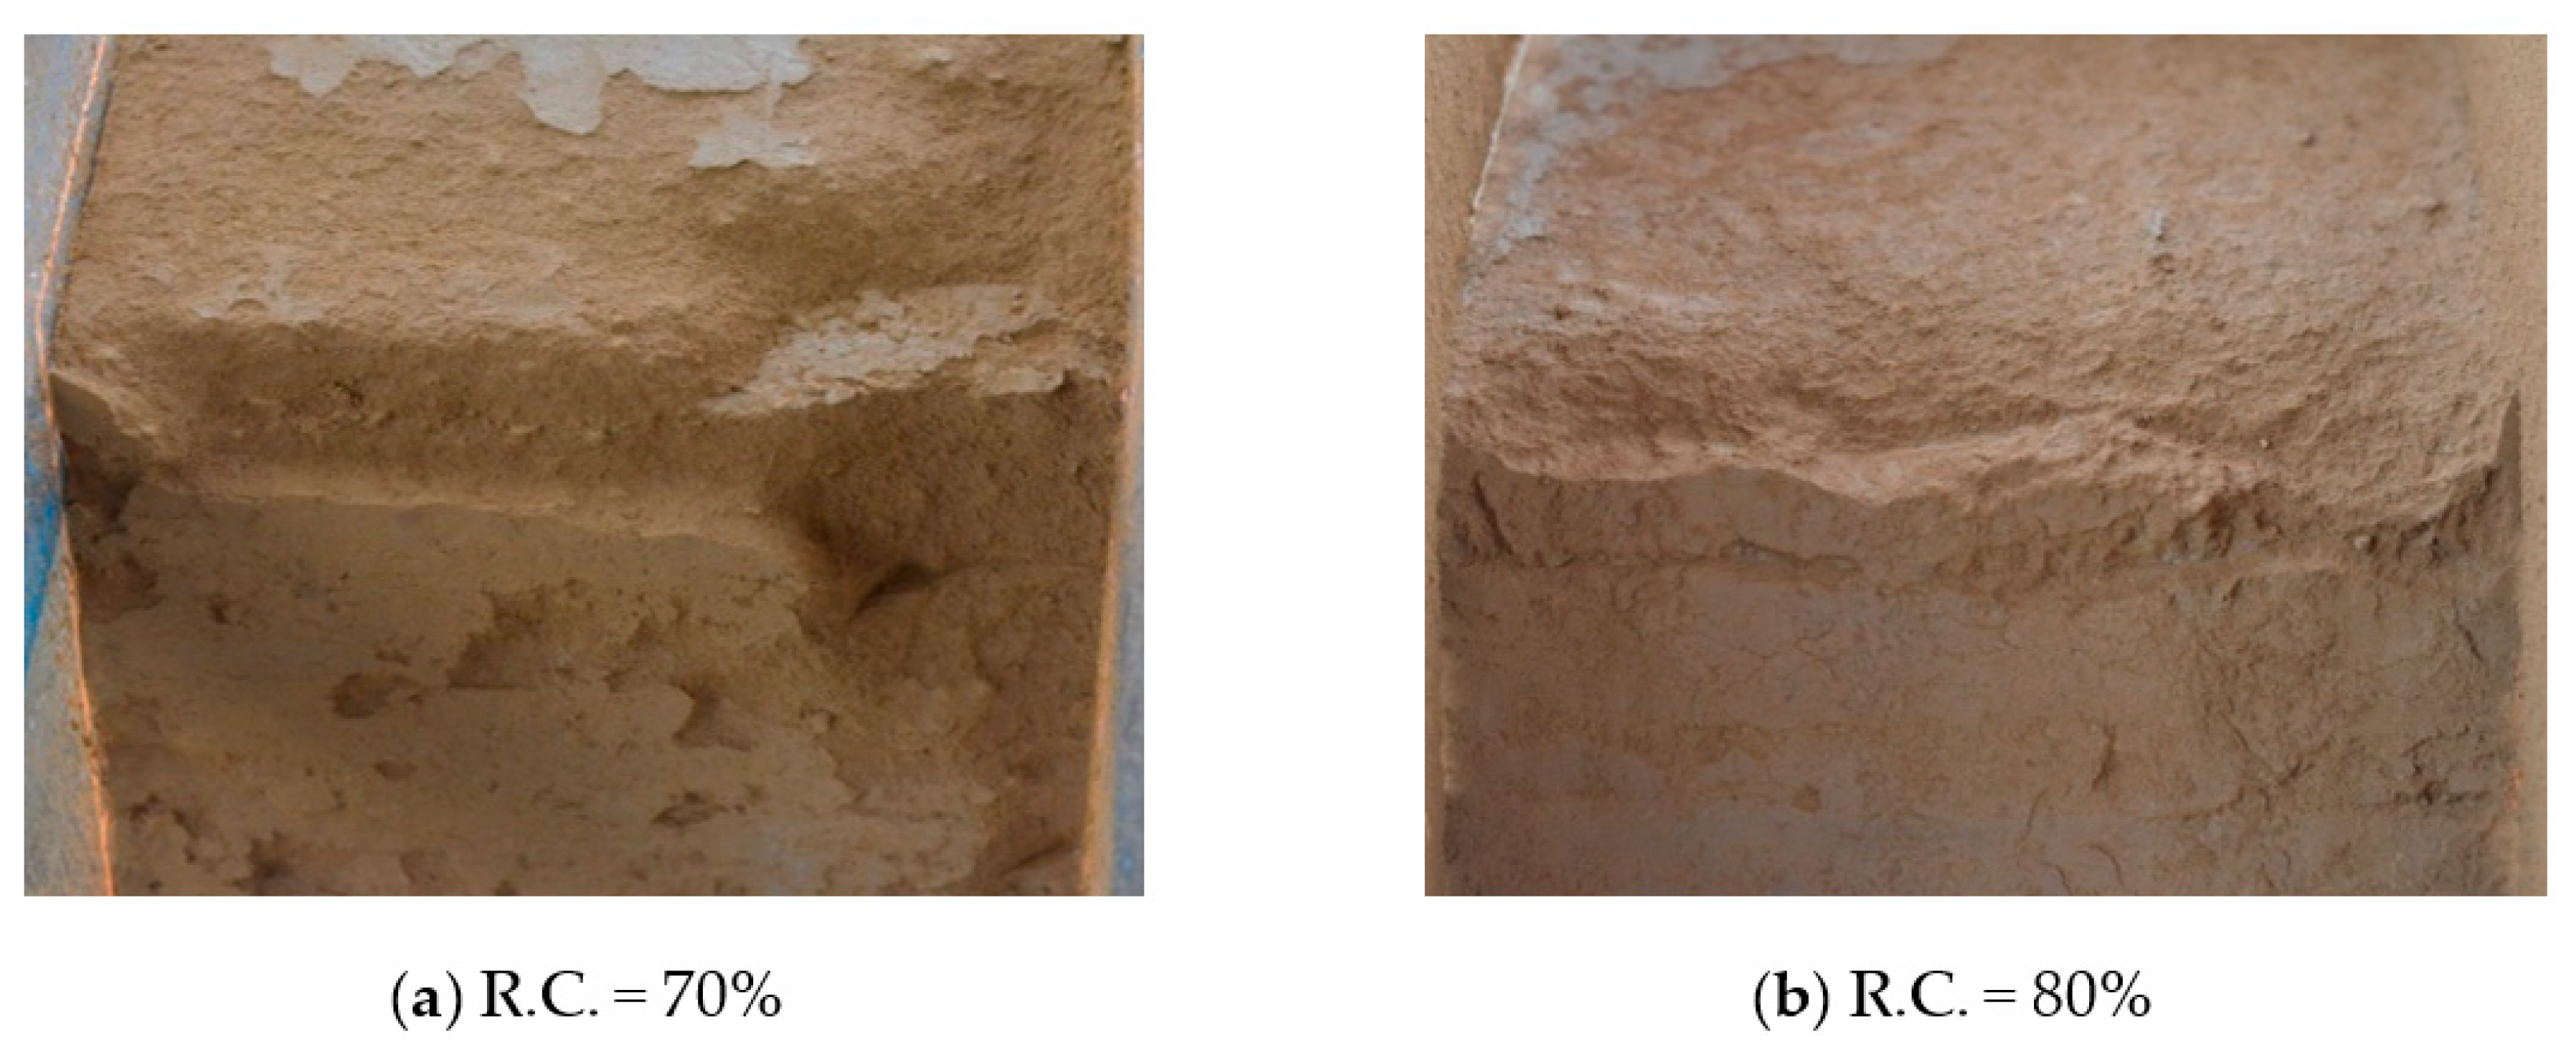
Figure 13 illustrates the slope failure conditions at the Optimum Moisture Content (OMC) for relative compaction levels of 70% and 80% under a rainfall intensity of 80 mm/h. The severity of the slope failure was observed to be greater for the soil that had been compacted at relative compaction of 70% (Figure 13a) in comparison to the soil that had been compacted at 80% (Figure 13b) and 90% (Figure 7a) relative compaction levels. It can be known that an increase in relative compaction reduces the probability of rainfall-triggered landslides. Ultimately, increasing the level of compaction decreases the likelihood of slope land disasters.
4. Conclusions
This study conducted model experiments of artificial rainfall on compacted unsaturated soil slopes, utilizing soil moisture probes to monitor the infiltration behavior of the soil at various locations under the influence of rainfall. The experimental data were presented as soil saturation contours to evaluate the impacts of rainfall intensity, initial moisture content and relative compaction on the infiltration behavior of the compacted unsaturated soil slopes. The use of soil saturation contours helped to visualize and quantify the infiltration behavior of the slopes, allowing for a more detailed analysis of the experimental results of the model experiments. These results provide insights into the behavior of unsaturated soil slopes under artificial rainfall conditions, which can be used to design more effective slope stabilization measures to prevent slope failure and minimize the risk of landslides. The findings of this study were summarized as follows:
- During the initial rainfall infiltration, the soil saturation was observed to be higher at the toe of the slope compared to other areas of the slope, and it gradually advanced towards the crest, resulting in the formation of a wetting band along the slope surface. As the rainfall duration increased, the wetting band progressed downwards along the slope.
- Failure began at the crest of the slope and junction with the slope. Soil erosion was the main cause of slope failure due to the high rainfall intensity.
- As the rainfall intensity increased to 160 mm/h, the majority of the rainfall on the slope became surface runoff. Therefore, an increase in rainfall intensity caused only a slight increase in the infiltration rate, indicating that once significant runoff was initiated, increasing the rainfall intensity had minimal effect on the infiltration behavior of the rainfall.
- The slope compacted at the dry of optimum had a higher infiltration rate compared to slopes compacted at OMC or wet of optimum, which made it more vulnerable to failure.
- As the degree of relative compaction increases, the infiltration time also increases, resulting in a greater generation of surface runoff at a fixed rainfall intensity. However, a higher degree of relative compaction causes the soil to become more tightly packed, reducing its susceptibility to soil erosion caused by surface runoff.
- Relative compaction is the most significant factor that affects infiltration rates, followed by the initial moisture content of the compacted slope.
- Although the intensity of rainfall had only a minor impact on the infiltration rates, it had a significant effect on the severity of scour due to the substantial amount of surface runoff, particularly when the soil slope is compacted at low relative compaction.
Author Contributions
Conceptualization, S.-R.Y.; data curation, S.-R.Y. and L.-J.H.; formal analysis, S.-R.Y. and L.-J.H.; visualization, L.-J.H.; writing—original draft, S.-R.Y.; writing—review and editing, S.-R.Y. All authors have read and agreed to the published version of the manuscript.
Funding
This study was supported under project No. MOST 110-2221-E-020-007 by the National Science and Technology Council (NSTC) of the Republic of China, Taiwan.
Data Availability Statement
The data that support the findings of this study are available from the corresponding author upon reasonable request.
Conflicts of Interest
The authors declare no conflict of interest.
References
- Chen, C.W.; Saito, H.; Oguchi, T. Rainfall intensity–duration conditions for mass movements in Taiwan. Prog. Earth Planet. Sci. 2015, 2, 14. [Google Scholar] [CrossRef]
- Geitner, C.; Mayr, A.; Rutzinger, M.; Tobias, M.; Tonin, R.; Zerbe, S.; Wellstein, C.; Markart, G.; Kohl, B. Shallow erosion on grassland slopes in the European Alps—Geomorphological classification, spatio-temporal analysis, and understanding snow and vegetation impacts. Geomorphology 2021, 373, 107446. [Google Scholar] [CrossRef]
- Zweifel, L.; Samarin, M.; Meusburger, K.; Alewell, C. Investigating causal factors of shallow landslides in grassland regions of Switzerland. Nat. Hazards Earth Syst. Sci. 2021, 21, 3421–3437. [Google Scholar] [CrossRef]
- De Rose, R.C. Quantifying sediment production in steepland environments. Eur. J. For. Res. 2009, 12, 9–46. [Google Scholar]
- Larsen, I.J.; Montgomery, D.R.; Korup, O. Landslide erosion controlled by hillslope material. Nat. Geosci. 2010, 3, 247–251. [Google Scholar] [CrossRef]
- Prancevic, J.P.; Lamb, M.P.; McArdell, B.W.; Rickli, C.; Kirchner, J.W. Decreasing landslide erosion on steeper slopes in soil-mantled landscapes. Geophys. Res. Lett. 2020, 47, e2020GL087505. [Google Scholar] [CrossRef]
- Forbes, K.; Broadhead, J. Forests and landslides. In The Role of Trees and Forests in the Prevention of Landslides and Rehabilitation of Landslide-Affected Areas in Asia; FAO RAP Publication: Bangkok, Thailand, 2013. [Google Scholar]
- García-Ruiz, J.M.; Beguería, S.; Arnáez, J.; Sanjuán, Y.; Lana-Renault, N.; Gómez-Villar, A.; Álvarez-Martínez, J.; Coba-Pérez, P. Deforestation induces shallow landsliding in the montane and subalpine belts of the Urbion’ Mountains, Iberian Range, Northern Spain. Geomorphology 2017, 296, 31–44. [Google Scholar] [CrossRef]
- Phillips, C.; Hales, T.; Smith, H.; Basher, L. Shallow landslides and vegetation at the catchment scale: A perspective. Ecol. Eng. 2021, 173, 106436. [Google Scholar] [CrossRef]
- Caine, N. The rainfall intensity-duration control of shallow landslides and debris flows. Geogr. Ann. 1980, 62, 23–27. [Google Scholar]
- Giannecchini, R. Relationship between rainfall and shallow landslides in the southern Apuan Alps (Italy). Nat. Hazards Earth Syst. Sci. 2006, 6, 357–364. [Google Scholar] [CrossRef]
- Giannecchini, R.; Galanti, Y.; D’Amato Avanzi, G.; Barsanti, M. Probabilistic rainfall thresholds for triggering debris flows in a human-modified landscape. Geomorphology. 2016, 257, 94–107. [Google Scholar] [CrossRef]
- Beck-Broichsitter, S.; Gerke, H.H.; Horn, R. Effect of compaction on soil physical properties of differently textured landfill liner materials. Geosciences 2019, 9, 1. [Google Scholar] [CrossRef]
- Lambe, T.W. The structure of compacted clay. J. Soil Mech. Found. Eng. 1958, 84, 1654-1–1654-34. [Google Scholar] [CrossRef]
- Lumb, P. Slope failures in Hong Kong. Q. J. Eng. Geol. Hydrogeol. 1975, 8, 31–65. [Google Scholar] [CrossRef]
- Iverson, R.M. Landslide triggering by rain infiltration. Water Resour. Res. 2000, 36, 1897–1910. [Google Scholar] [CrossRef]
- Li, A.G.; Yue, Z.Q.; Tham, L.G.; Lee, C.F.; Law, K.T. Field-monitored variations of soil moisture and matric suction in a saprolite slope. Can. Geotech. J. 2005, 42, 13–26. [Google Scholar] [CrossRef]
- Tsai, T.-L.; Yang, J.-C. Modeling of rainfall-triggered shallow landslide. Environ. Geol. 2006, 50, 525–534. [Google Scholar] [CrossRef]
- Salciarini, D.; Tamagnini, C.; Conversini, P.; Rapinesi, S. Spatially distributed rainfall thresholds for the initiation of shallow landslides. Nat. Hazards 2012, 61, 229–245. [Google Scholar] [CrossRef]
- Kang, S.; Lee, S.R.; Cho, S.E. Slope Stability analysis of unsaturated soil slopes based on the site-specific characteristics: A case study of Hwangryeong Mountain, Busan, Korea. Sustainability 2020, 12, 2839. [Google Scholar] [CrossRef]
- Kim, J.; Jeong, S.; Park, S.; Sharma, J. Influence of rainfall-induced wetting on the stability of slopes in weathered soils. Eng. Geol. 2004, 75, 251–262. [Google Scholar] [CrossRef]
- Urciuoli, G.; Pirone, M.; Comegna, L.; Picarelli, L. Long-term investigations on the pore pressure regime in saturated and unsaturated sloping soils. Eng. Geol. 2016, 212, 98–119. [Google Scholar] [CrossRef]
- Fu, J.; Wang, J.; Song, W. Damage constitutive model and strength criterion of cemented paste backfill based on layered effect considerations. J. Mater. Res. Technol. 2020, 9, 6073–6084. [Google Scholar] [CrossRef]
- Zhang, Y.-H.; Wang, X.-M.; Wei, C.; Zhang, Q.-L. Dynamic mechanical properties and instability behavior of layered backfill under intermediate strain rates. Trans. Nonferrous Met. Soc. China 2017, 27, 1608–1617. [Google Scholar] [CrossRef]
- Cao, S.; Song, W.D.; Xue, G.L.; Wang, Y.; Zhu, P.R. Tests of strength reduction of cemented tailings filling considering layering character. Rock Soil Mech. 2015, 36, 2869–2876. [Google Scholar]
- Li, L.; Aubertin, M. Numerical investigation of the stress state in inclined backfilled stopes. Int. J. Géoméch. 2009, 9, 52–62. [Google Scholar] [CrossRef]
- Alonso, E.; Lloret, A.; Romero, E. Rainfall induced deformations of road embackments. Riv. Ital. Geotec. 1999, 33, 8–15. [Google Scholar]
- Lu, N.; Wayllace, A.; Oh, S. Infiltration-induced seasonally reactivated instability of a highway embankment near the Eisenhower Tunnel, Colorado, USA. Eng. Geol. 2013, 162, 22–32. [Google Scholar] [CrossRef]
- Briggs, K.M.; Loveridge, F.A.; Glendinning, S. Failures in transport infrastructure embankments. Eng. Geol. 2017, 219, 107–117. [Google Scholar] [CrossRef]
- Ng, C.W.W.; Shi, Q. A numerical investigation of the stability of unsaturated soil slopes subjected to transient seepage. Comput. Geotech. 1998, 22, 1–28. [Google Scholar] [CrossRef]
- Lu, N.; Godt, J. Infinite slope stability under steady unsaturated seepage conditions. Water Resour. Res. 2008, 44, 1–13. [Google Scholar] [CrossRef]
- Gui, M.W.; Wu, Y.M. Failure of soil under water infiltration condition. Eng. Geol. 2014, 181, 124–141. [Google Scholar] [CrossRef]
- Mburu, J.W.; Li, A.-J.; Lin, H.-D.; Lu, C.-W. Investigations of unsaturated slopes subjected to rainfall infiltration using numerical approaches—A parametric study and comparative review. Sustainability 2022, 14, 14465. [Google Scholar] [CrossRef]
- Yang, C.; Sheng, D.C.; Carter, J.P. Effect of hydraulic hysteresis on seepage analysis for unsaturated soils. Comput. Geotech. 2012, 41, 36–56. [Google Scholar] [CrossRef]
- Morbidell, R.; Saltalippi, C.; Flammini, A.; Govindaraju, R.S. Role of slope on infiltration: A review. J. Hydrol. 2018, 557, 878–886. [Google Scholar] [CrossRef]
- Green, W.A.; Ampt, G.A. Studies on soil physics: 1. The flow of air and water through soils. J. Agric. Sci. 1911, 4, 1–24. [Google Scholar]
- Kostiakov, A.N. On the dynamics of the coefficient of water-percolation in soils and on the necessity for studying it from a dynamic point of view for purposes of amelioration. Trans. Sixth Comm. Int. Soil Sci. Soc. Russ. Part A 1932, 17–21. Available online: https://cir.nii.ac.jp/crid/1570572699970385664 (accessed on 27 March 2023).
- Holtan, H.N. A Concept for Infiltration Estimates in Watershed Engineering; USDA: Washington, DC, USA, 1961; pp. 41–51.
- Horton, R.E. An approach towards a physical interpretation of infiltration rate. Soil Sci. Soc. Am. Proc. 1940, 5, 399–417. [Google Scholar] [CrossRef]
- Philip, J.R. An infiltration equation with physical significance. Soil Sci. 1954, 77, 153–158. [Google Scholar] [CrossRef]
- Philip, J.R. The theory of infiltration: 1. The infiltration equation and its solution. Soil Sci. 1957, 83, 345–357. [Google Scholar] [CrossRef]
- Swartzendruber, D. Revised attribution of the power form infiltration equation. Water Resour. Res. 1993, 29, 2455–2456. [Google Scholar] [CrossRef]
- Smith, R.E.; Parlange, J.Y. A parameter-efficient hydrologic infiltration model. Water Resour. Res. 1978, 14, 533–538. [Google Scholar] [CrossRef]
- Poesen, J. The influence of slope angle on infiltration rate and Hortonian overland flow. Zeitschrift für Geomorphol. Suppl. Band 1984, 49, 117–131. [Google Scholar]
- Tang, J.; Taro, U.; Huang, D.; Xie, J.; Tao, S. Physical model experiments on water infiltration and failure modes in multi-layered slopes under heavy rainfall. Appl. Sci. 2020, 10, 3458. [Google Scholar] [CrossRef]
- Pajalić, S.; Peranić, J.; Maksimović, S.; Čeh, N.; Jagodnik, V.; Arbanas, Ž. Monitoring and Data Analysis in Small-Scale Landslide Physical Model. Appl. Sci. 2021, 11, 5040. [Google Scholar] [CrossRef]
- Jagodnik, V.; Peranić, J.; Arbanas, Ž. Mechanism of landslide initiation in small-scale sandy slope triggered by an artificial rain. In Understanding and Reducing Landslide Disaster Risk: Volume 6 Specific Topics in Landslide Science and Applications; Arbanas, Ž., Bobrowsky, P.T., Konagai, K., Sassa, K., Takara, K., Eds.; Springer International Publishing: Cham, Switzerland, 2021; pp. 177–184. [Google Scholar]
- Capparelli, G.; Damiano, E.; Greco, R.; Olivares, L.; Spolverino, G. Physical modeling investigation of rainfall infiltration in steep layered volcanoclastic slopes. J. Hydrol. 2020, 580, 124199. [Google Scholar] [CrossRef]
- Vivoda Prodan, M.; Peranić, J.; Pajalić, S.; Jagodnik, V.; Čeh, N.; Arbanas, Ž. Mechanism of rainfall induced landslides in small-scale models built of different materials. In Proceedings of the 5th Regional Symposium on Landslides in Adriatic-Balkan Region; Peranić, J., Vivoda Prodan, M., Bernat Gazibara, S., Krkăc, M., Mihalić Arbanas, S., Arbanas, Ž., Eds.; University of Rijeka: Rijeka, Croatia, 2022. [Google Scholar]
- Bezak, N.; Peranić, J.; Mikoš, M.; Arbanas, Z. Evaluation of hydrological rainfall loss methods using small-scale physical landslide model. Water 2022, 14, 2726. [Google Scholar] [CrossRef]
- Hamrouni, F.; Trabelsi, H.; Jamei, M.; Olivella, S. Numerical analysis of landslides caused by rainfall in a reduced physical slope model. Eur. J. Environ. Civ. Eng. 2019, 25, 1–22. [Google Scholar]
- Park, J.Y.; Song, Y.S. Laboratory experiment and numerical analysis on the precursory hydraulic process of rainfall-induced slope failure. Adv. Civ. Eng. 2020, 2020, 1–12. [Google Scholar] [CrossRef]
- Mein, R.G.; Larson, C.L. Modelling infiltration during asteady rain. Water Resour. Res. 1973, 9, 384–393. [Google Scholar] [CrossRef]
Figure 1.
Particle size analysis.

Figure 2.
A sieve below the sprinklers.

Figure 3.
Location of the soil moisture probes.

Figure 4.
Calibration curve of the soil moisture probes.

Figure 5.
Soil saturation contours relative to rainfall duration (I = 80 mm/h, R.C. = 90%, ω = OMC).
Figure 5.
Soil saturation contours relative to rainfall duration (I = 80 mm/h, R.C. = 90%, ω = OMC).

Figure 6.
Soil saturation contours relative to rainfall duration (I = 160 mm/h, R.C. = 90%, ω = OMC).
Figure 6.
Soil saturation contours relative to rainfall duration (I = 160 mm/h, R.C. = 90%, ω = OMC).

Figure 7.
Failure conditions under different rainfall intensities (R.C. = 90%, ω = OMC).

Figure 8.
Soil saturation contours relative to rainfall duration (I = 80 mm/h, R.C. = 90%, ω = OMC-2%).
Figure 8.
Soil saturation contours relative to rainfall duration (I = 80 mm/h, R.C. = 90%, ω = OMC-2%).

Figure 9.
Soil saturation contours relative to rainfall duration (I = 80 mm/h, R.C. = 90%, ω = OMC + 2%).
Figure 9.
Soil saturation contours relative to rainfall duration (I = 80 mm/h, R.C. = 90%, ω = OMC + 2%).

Figure 10.
Failure conditions under different initial moisture content (I = 80 mm/h, R.C. = 90%).

Figure 11.
Soil saturation contours relative to rainfall duration (I = 80 mm/h, R.C. = 70%, ω = OMC).
Figure 11.
Soil saturation contours relative to rainfall duration (I = 80 mm/h, R.C. = 70%, ω = OMC).

Figure 12.
Soil saturation contours relative to rainfall duration (I = 80 mm/h, R.C. = 80%, ω = OMC).
Figure 12.
Soil saturation contours relative to rainfall duration (I = 80 mm/h, R.C. = 80%, ω = OMC).

Figure 13.
Failure conditions under different relative compaction (I = 80 mm/h, ω = OMC).


Table 1.
Basic soil properties of the study soil.
| Soil Properties | Value |
|---|---|
| Specific gravity, Gs | 2.65 |
| Liquid limit, LL (%) | 30 |
| Plastic limit, PL (%) | 26 |
| Plasticity index, PI (%) | 4 |
| Clay fraction (grain size < 2 μm), CF (%) | 42 |
| Optimum moisture content, OMC (%) | 24 |
| Maximum dry density, γdmax (g/cm3) | 1.55 |
Disclaimer/Publisher’s Note: The statements, opinions and data contained in all publications are solely those of the individual author(s) and contributor(s) and not of MDPI and/or the editor(s). MDPI and/or the editor(s) disclaim responsibility for any injury to people or property resulting from any ideas, methods, instructions or products referred to in the content. |
© 2023 by the authors. Licensee MDPI, Basel, Switzerland. This article is an open access article distributed under the terms and conditions of the Creative Commons Attribution (CC BY) license (https://creativecommons.org/licenses/by/4.0/).
Share and Cite
MDPI and ACS Style
Yang, S.-R.; Huang, L.-J. Infiltration and Failure Behavior of an Unsaturated Soil Slope under Artificial Rainfall Model Experiments. Water 2023, 15, 1599. https://doi.org/10.3390/w15081599
AMA Style
Yang S-R, Huang L-J. Infiltration and Failure Behavior of an Unsaturated Soil Slope under Artificial Rainfall Model Experiments. Water. 2023; 15(8):1599. https://doi.org/10.3390/w15081599
Chicago/Turabian StyleYang, Shu-Rong, and Li-Jie Huang. 2023. "Infiltration and Failure Behavior of an Unsaturated Soil Slope under Artificial Rainfall Model Experiments" Water 15, no. 8: 1599. https://doi.org/10.3390/w15081599
Note that from the first issue of 2016, this journal uses article numbers instead of page numbers. See further details here.