
Integrating Remote Sensing Techniques and Meteorological Data to Assess the Ideal Irrigation System Performance Scenarios for Improving Crop Productivity

 ,
,  ,
,  , and
, and 
Abstract
:1. Introduction
2. Materials and Methods
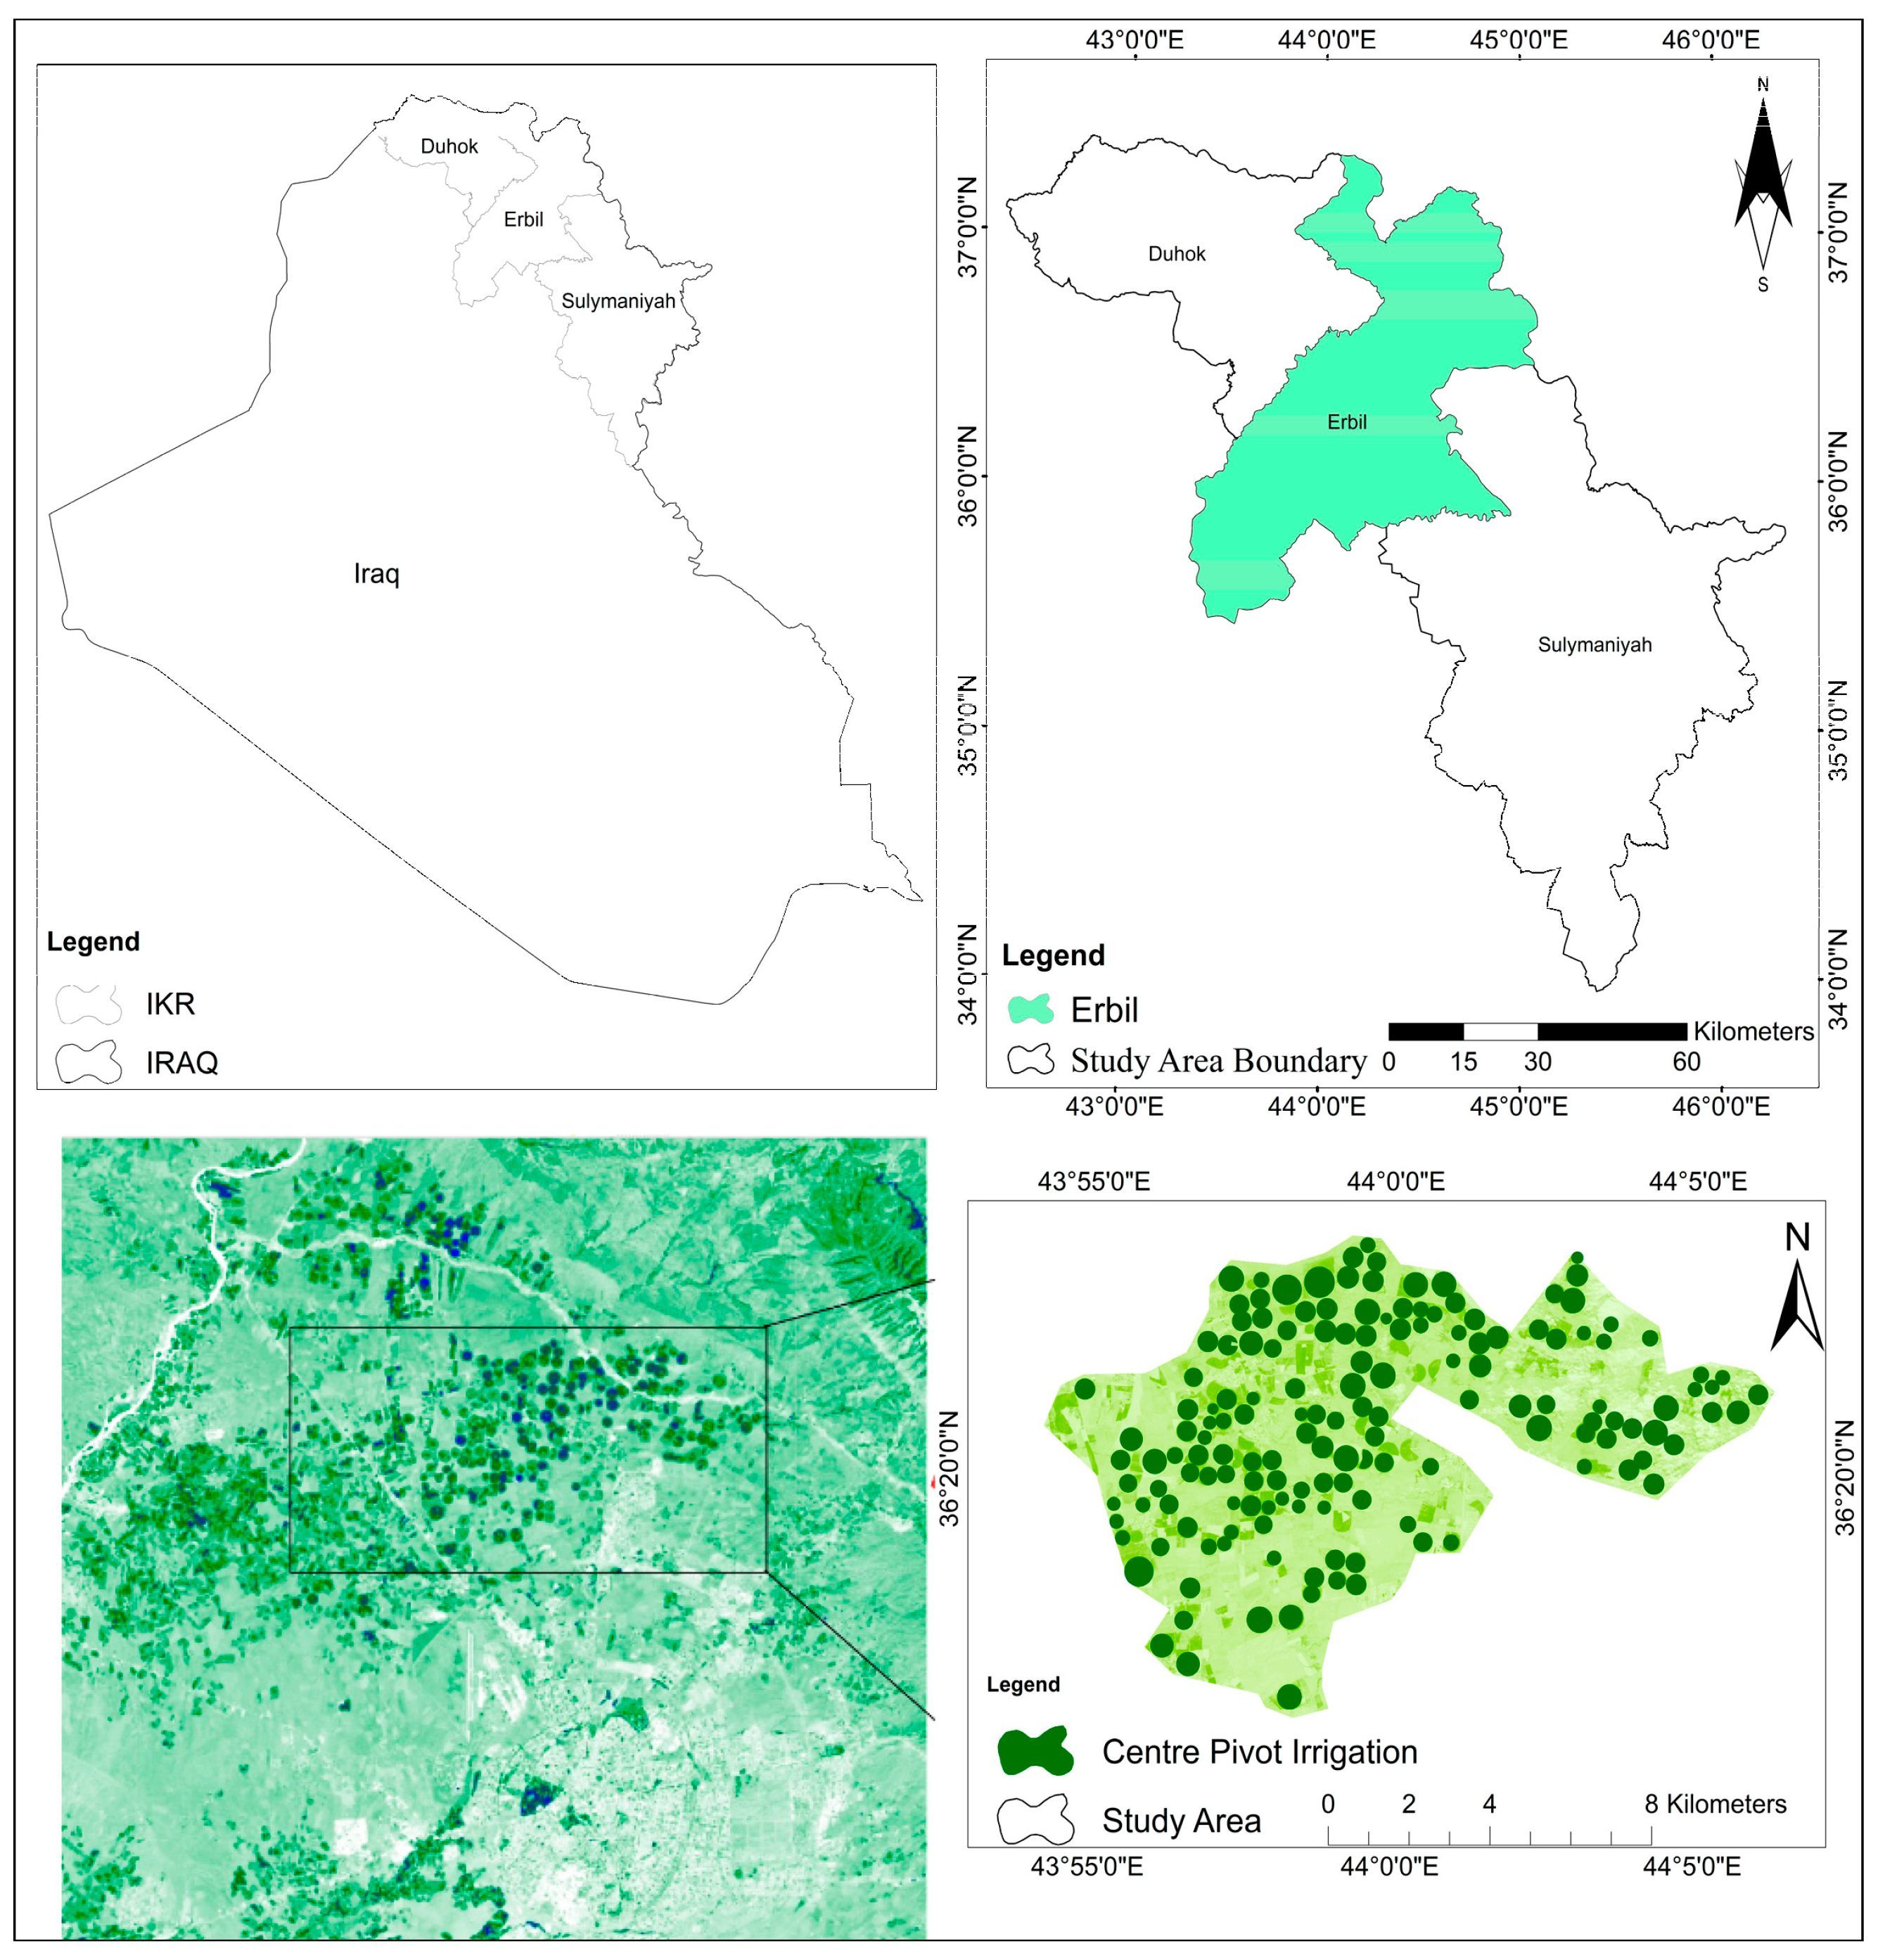
2.1. Study Area
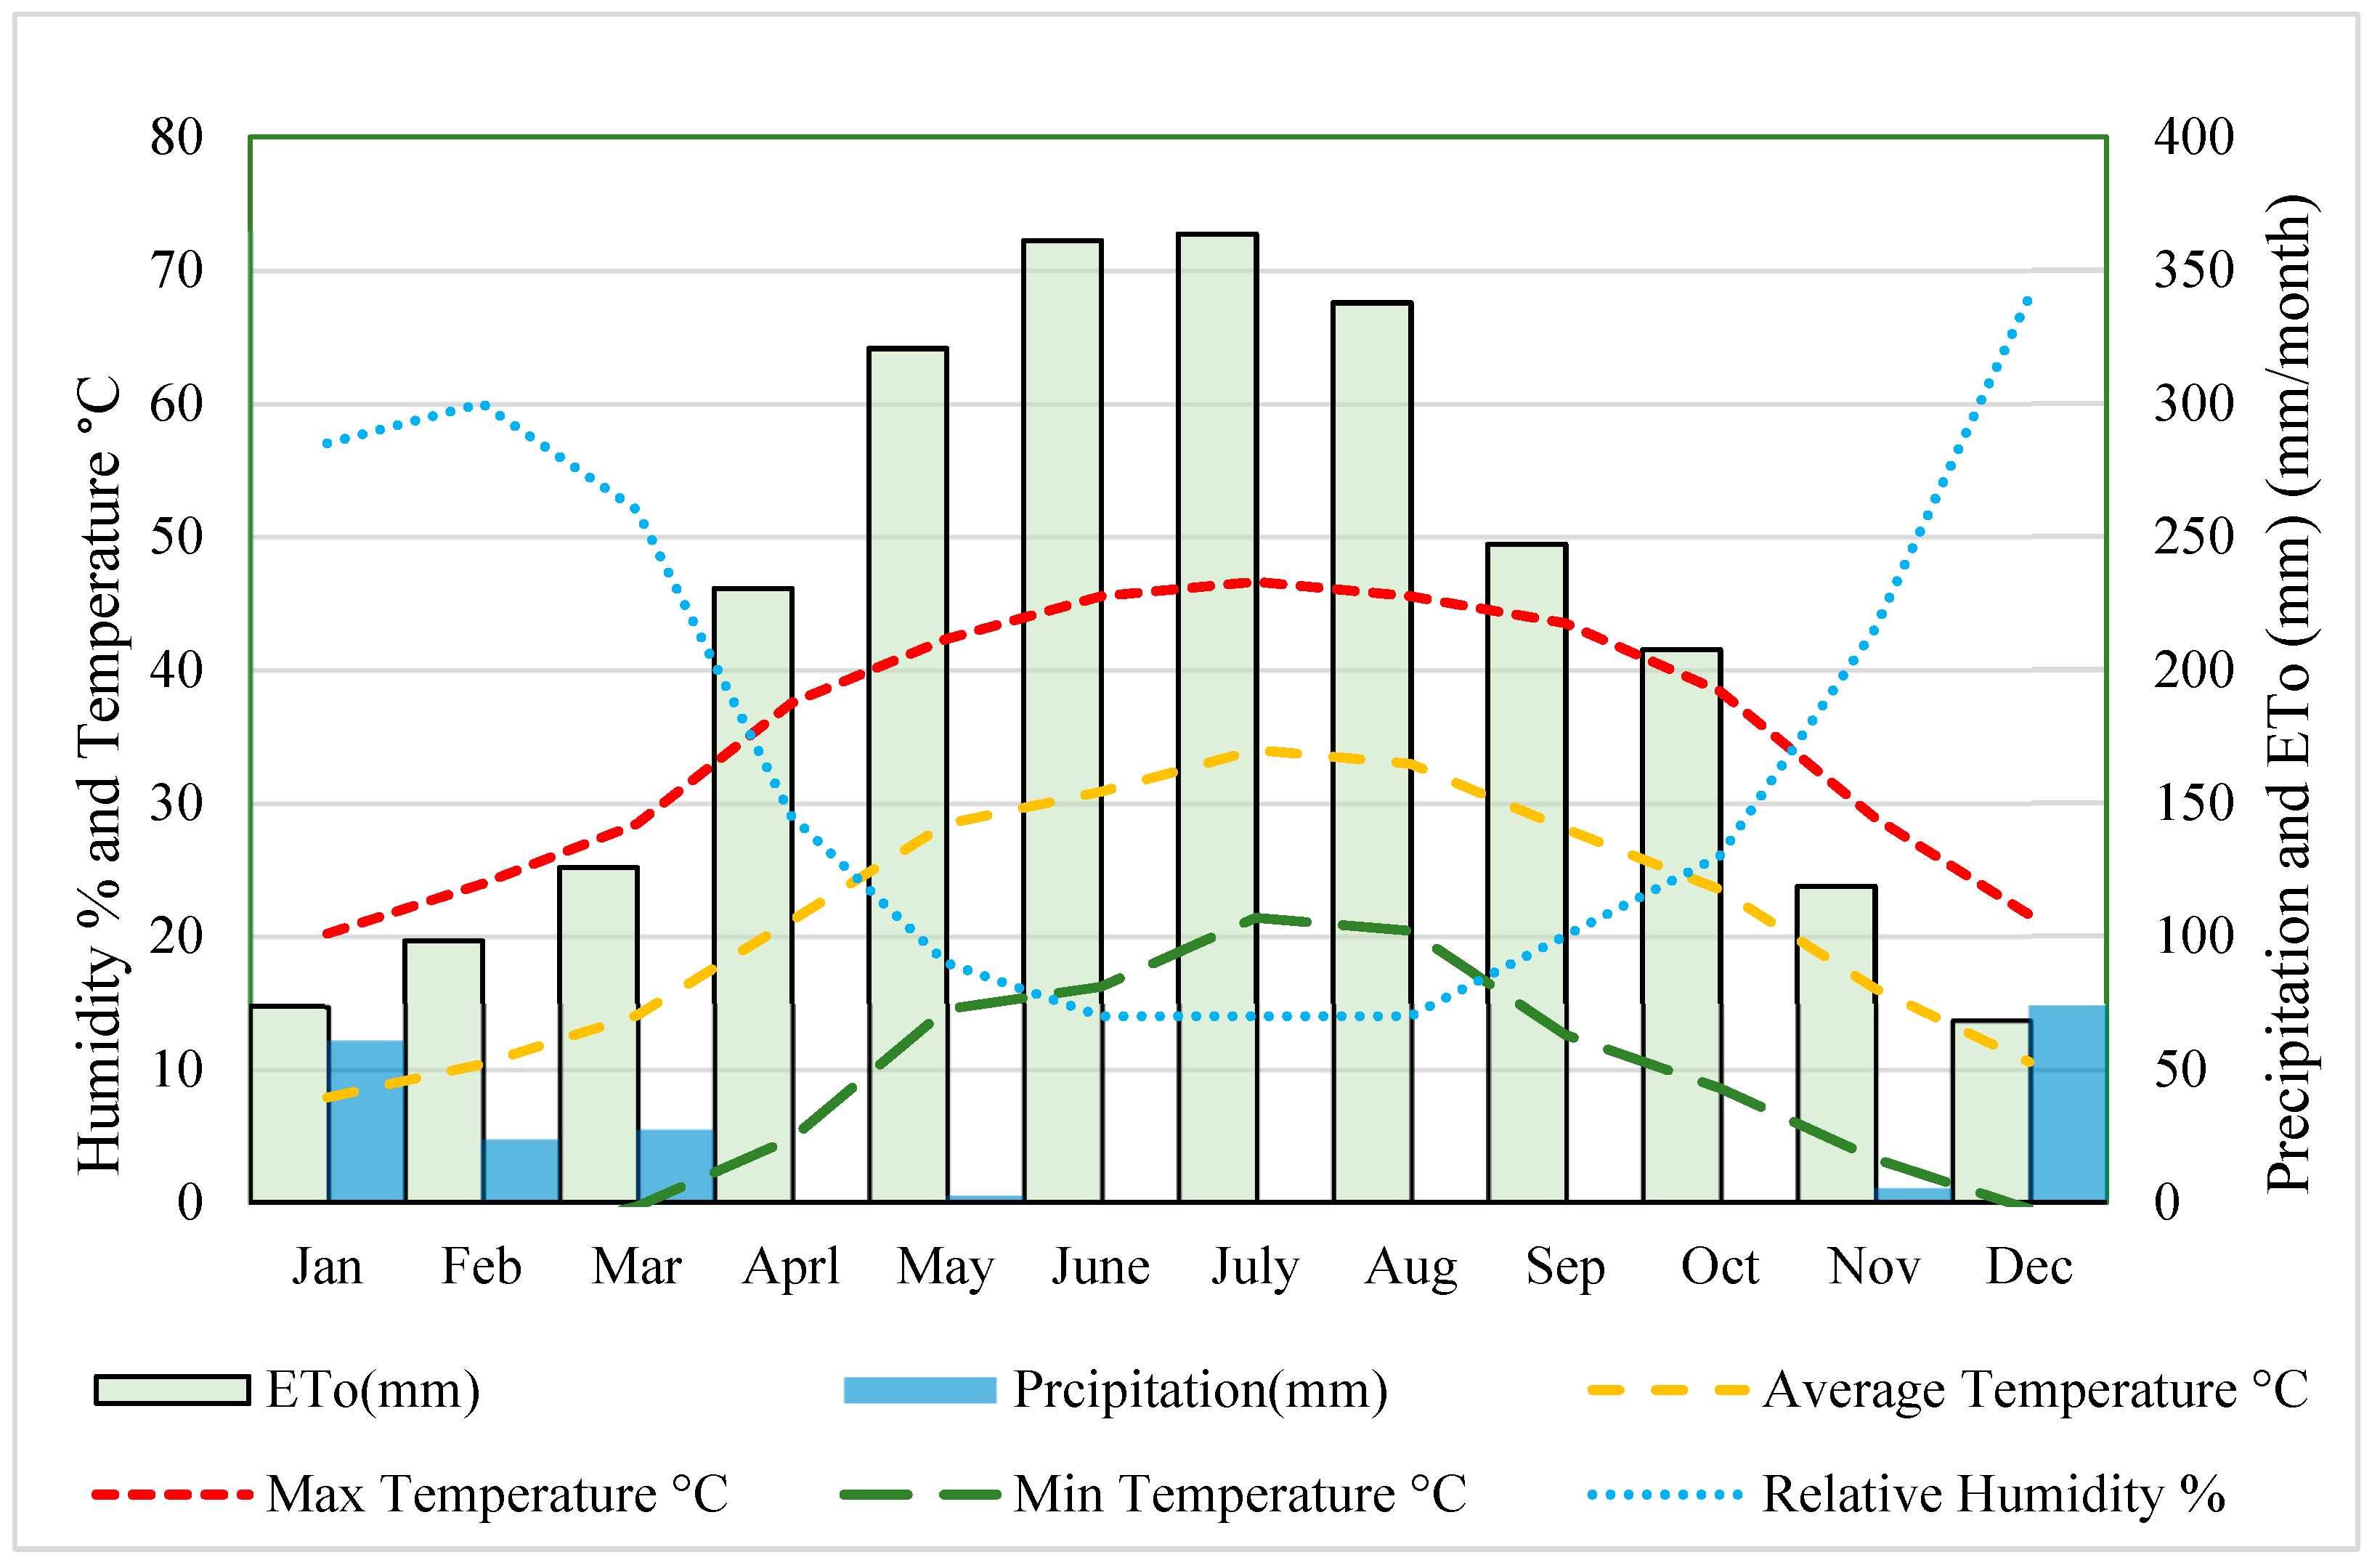
2.2. Climate
Meteorological Data
2.3. Sentinel 2 Satellite Imagery Acquisition
2.4. Validation Fields
2.5. Spectral Indices
2.5.1. NDVI
2.5.2. NDMI
2.6. Meteorological Indices
Reference Evapotranspiration (ETo), and Crop Evapotranspiration (ETc)
3. Results and Discussion
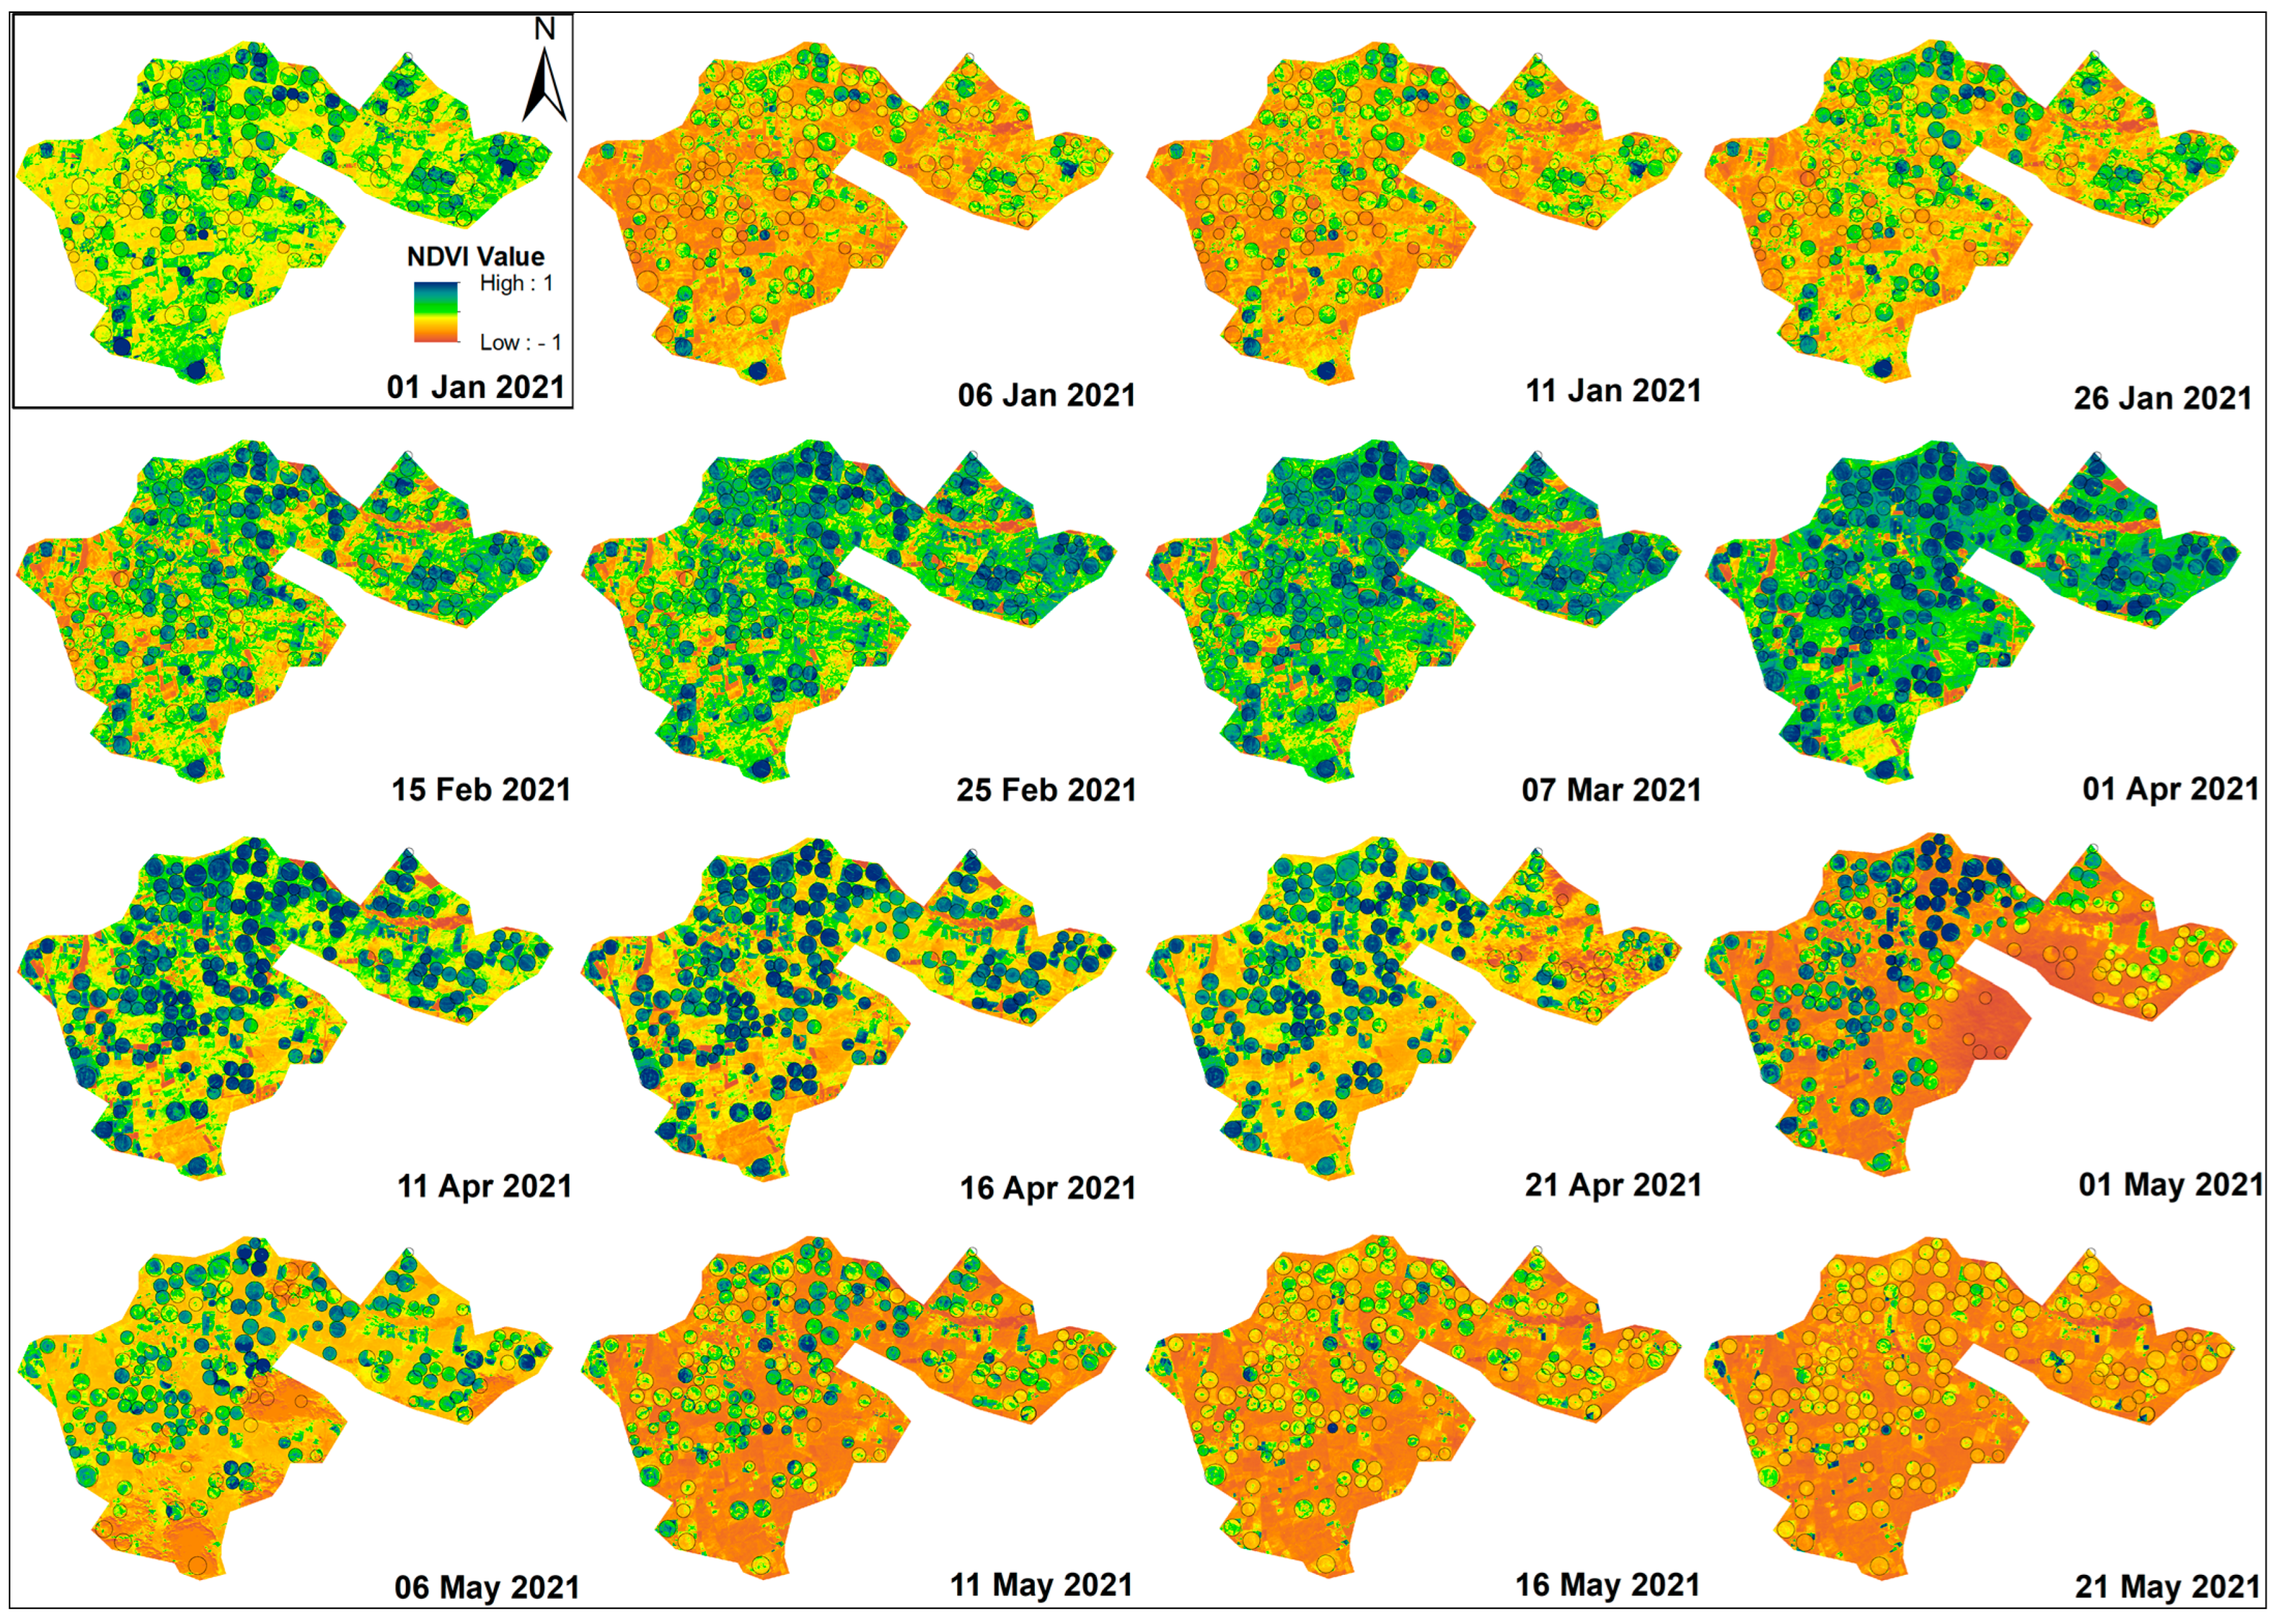
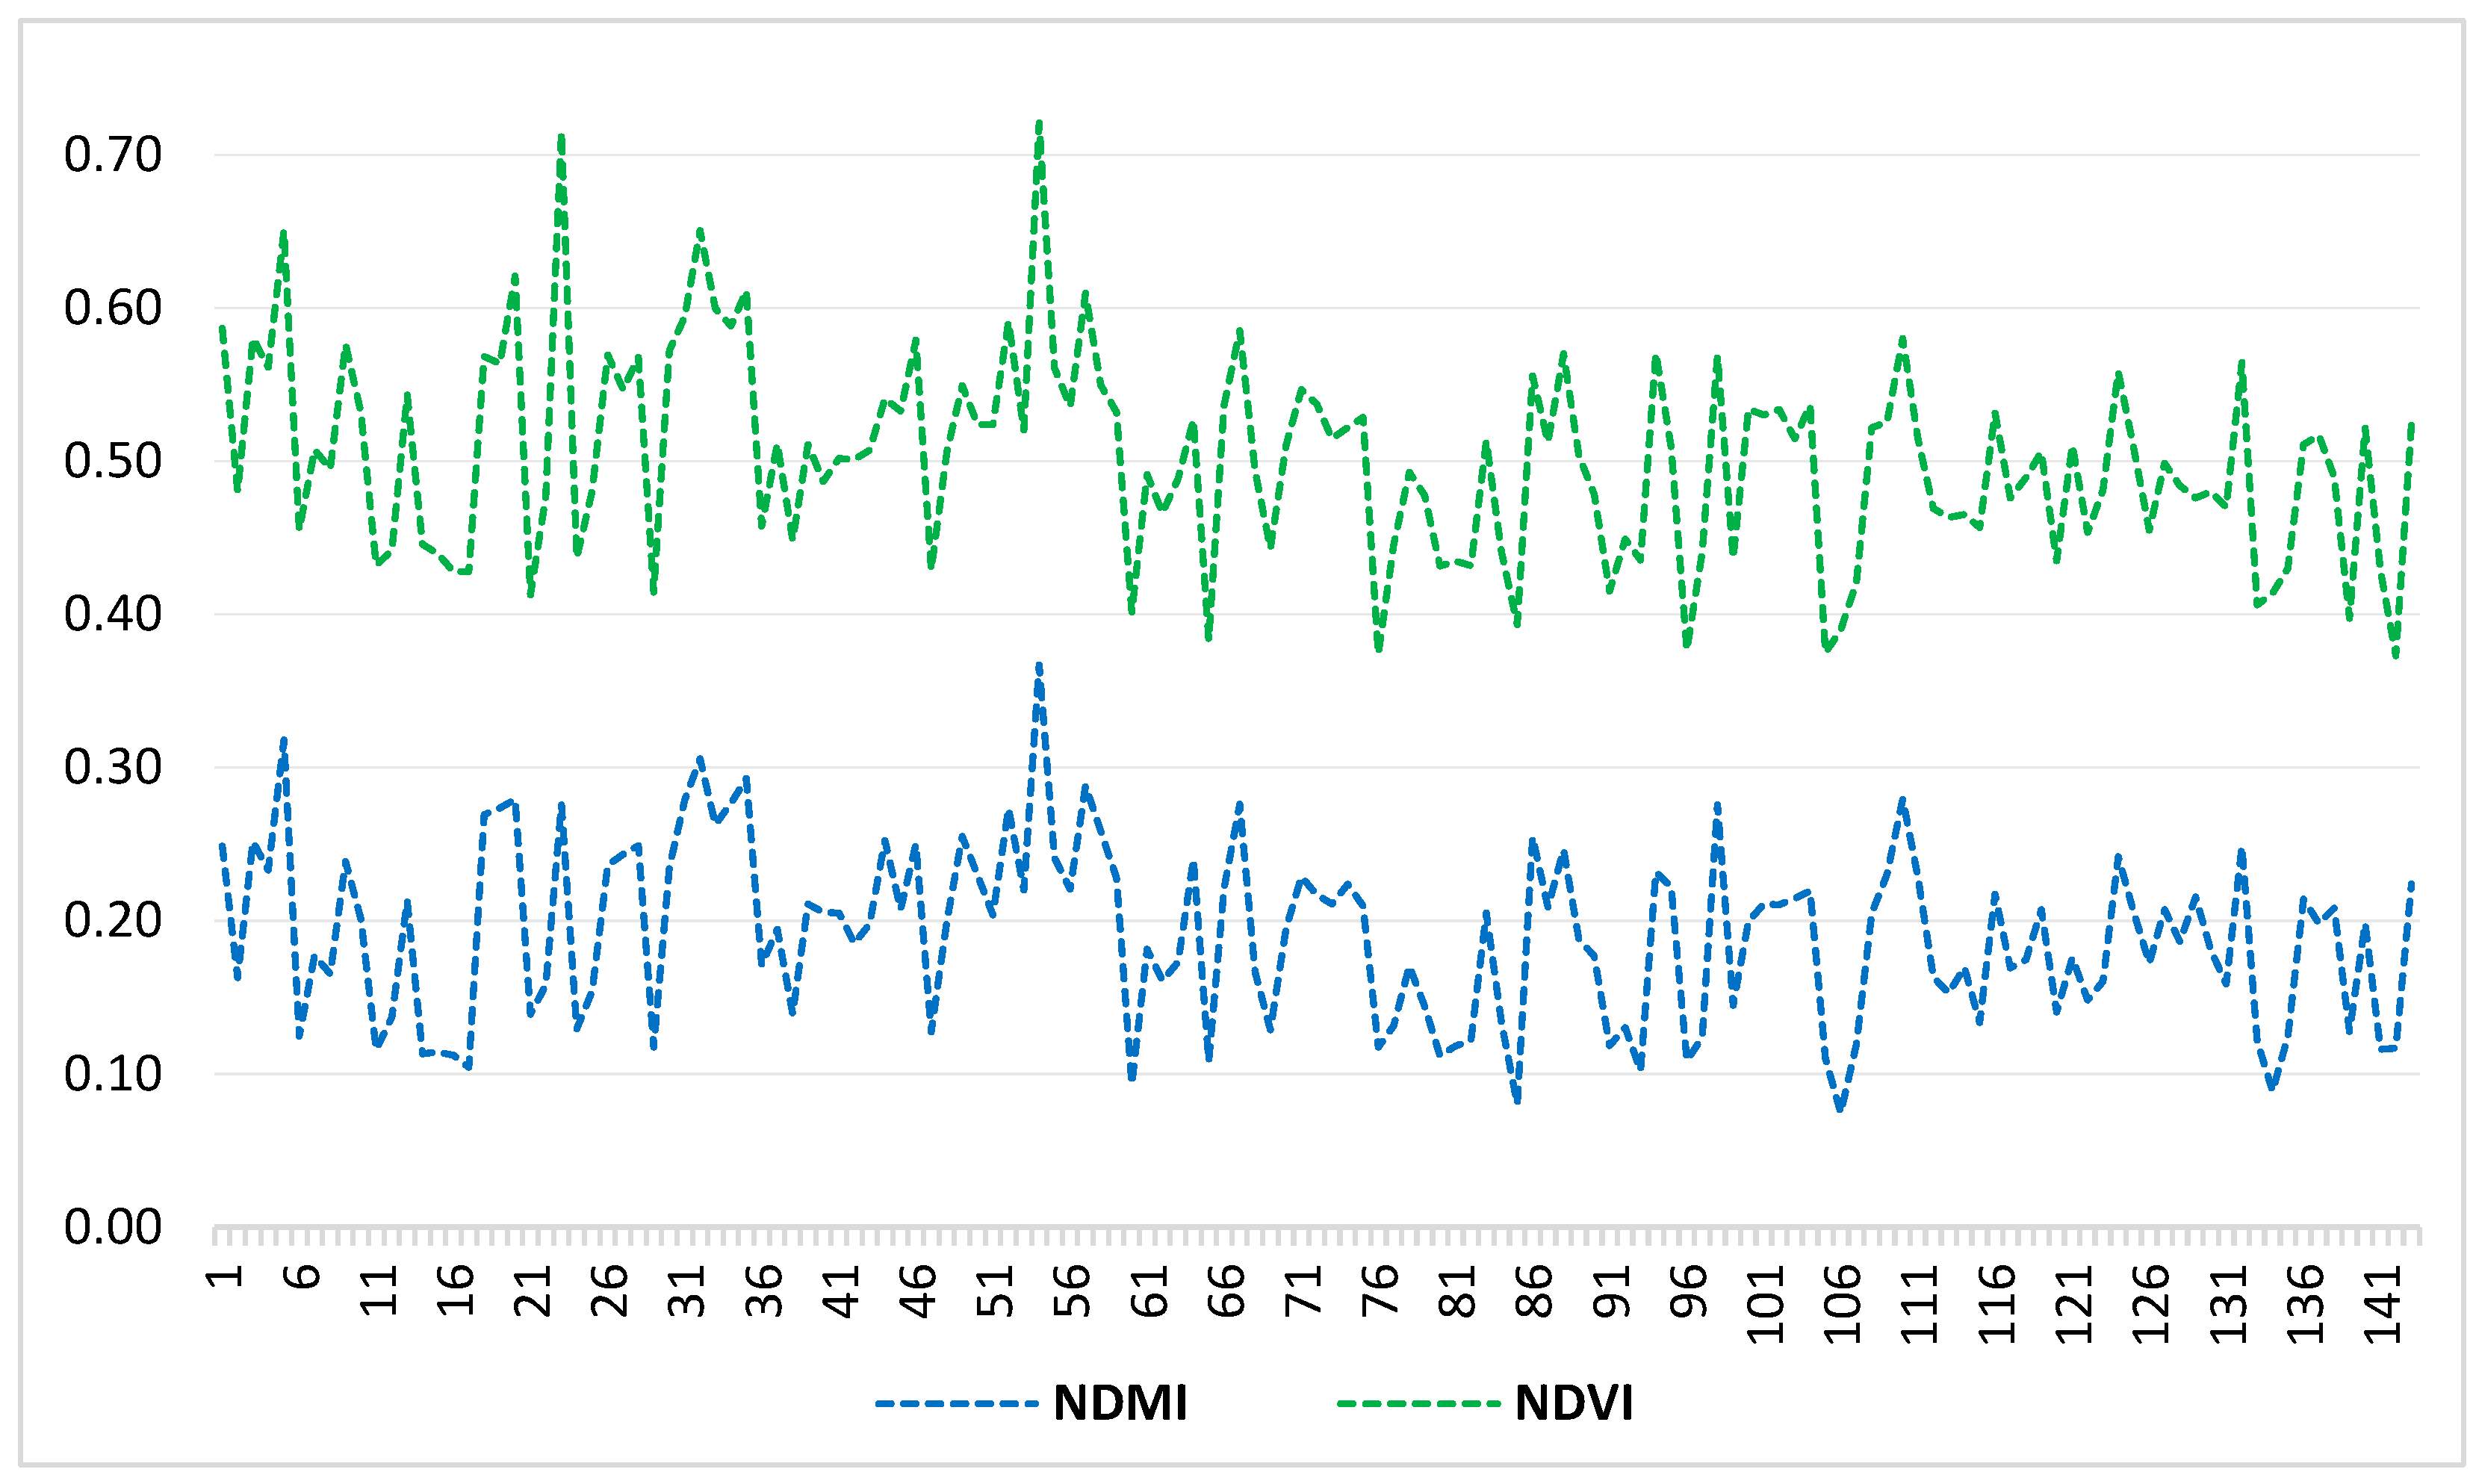
3.1. NDVI and NDMI
3.2. Crop Water Use and Water Use Efficiency
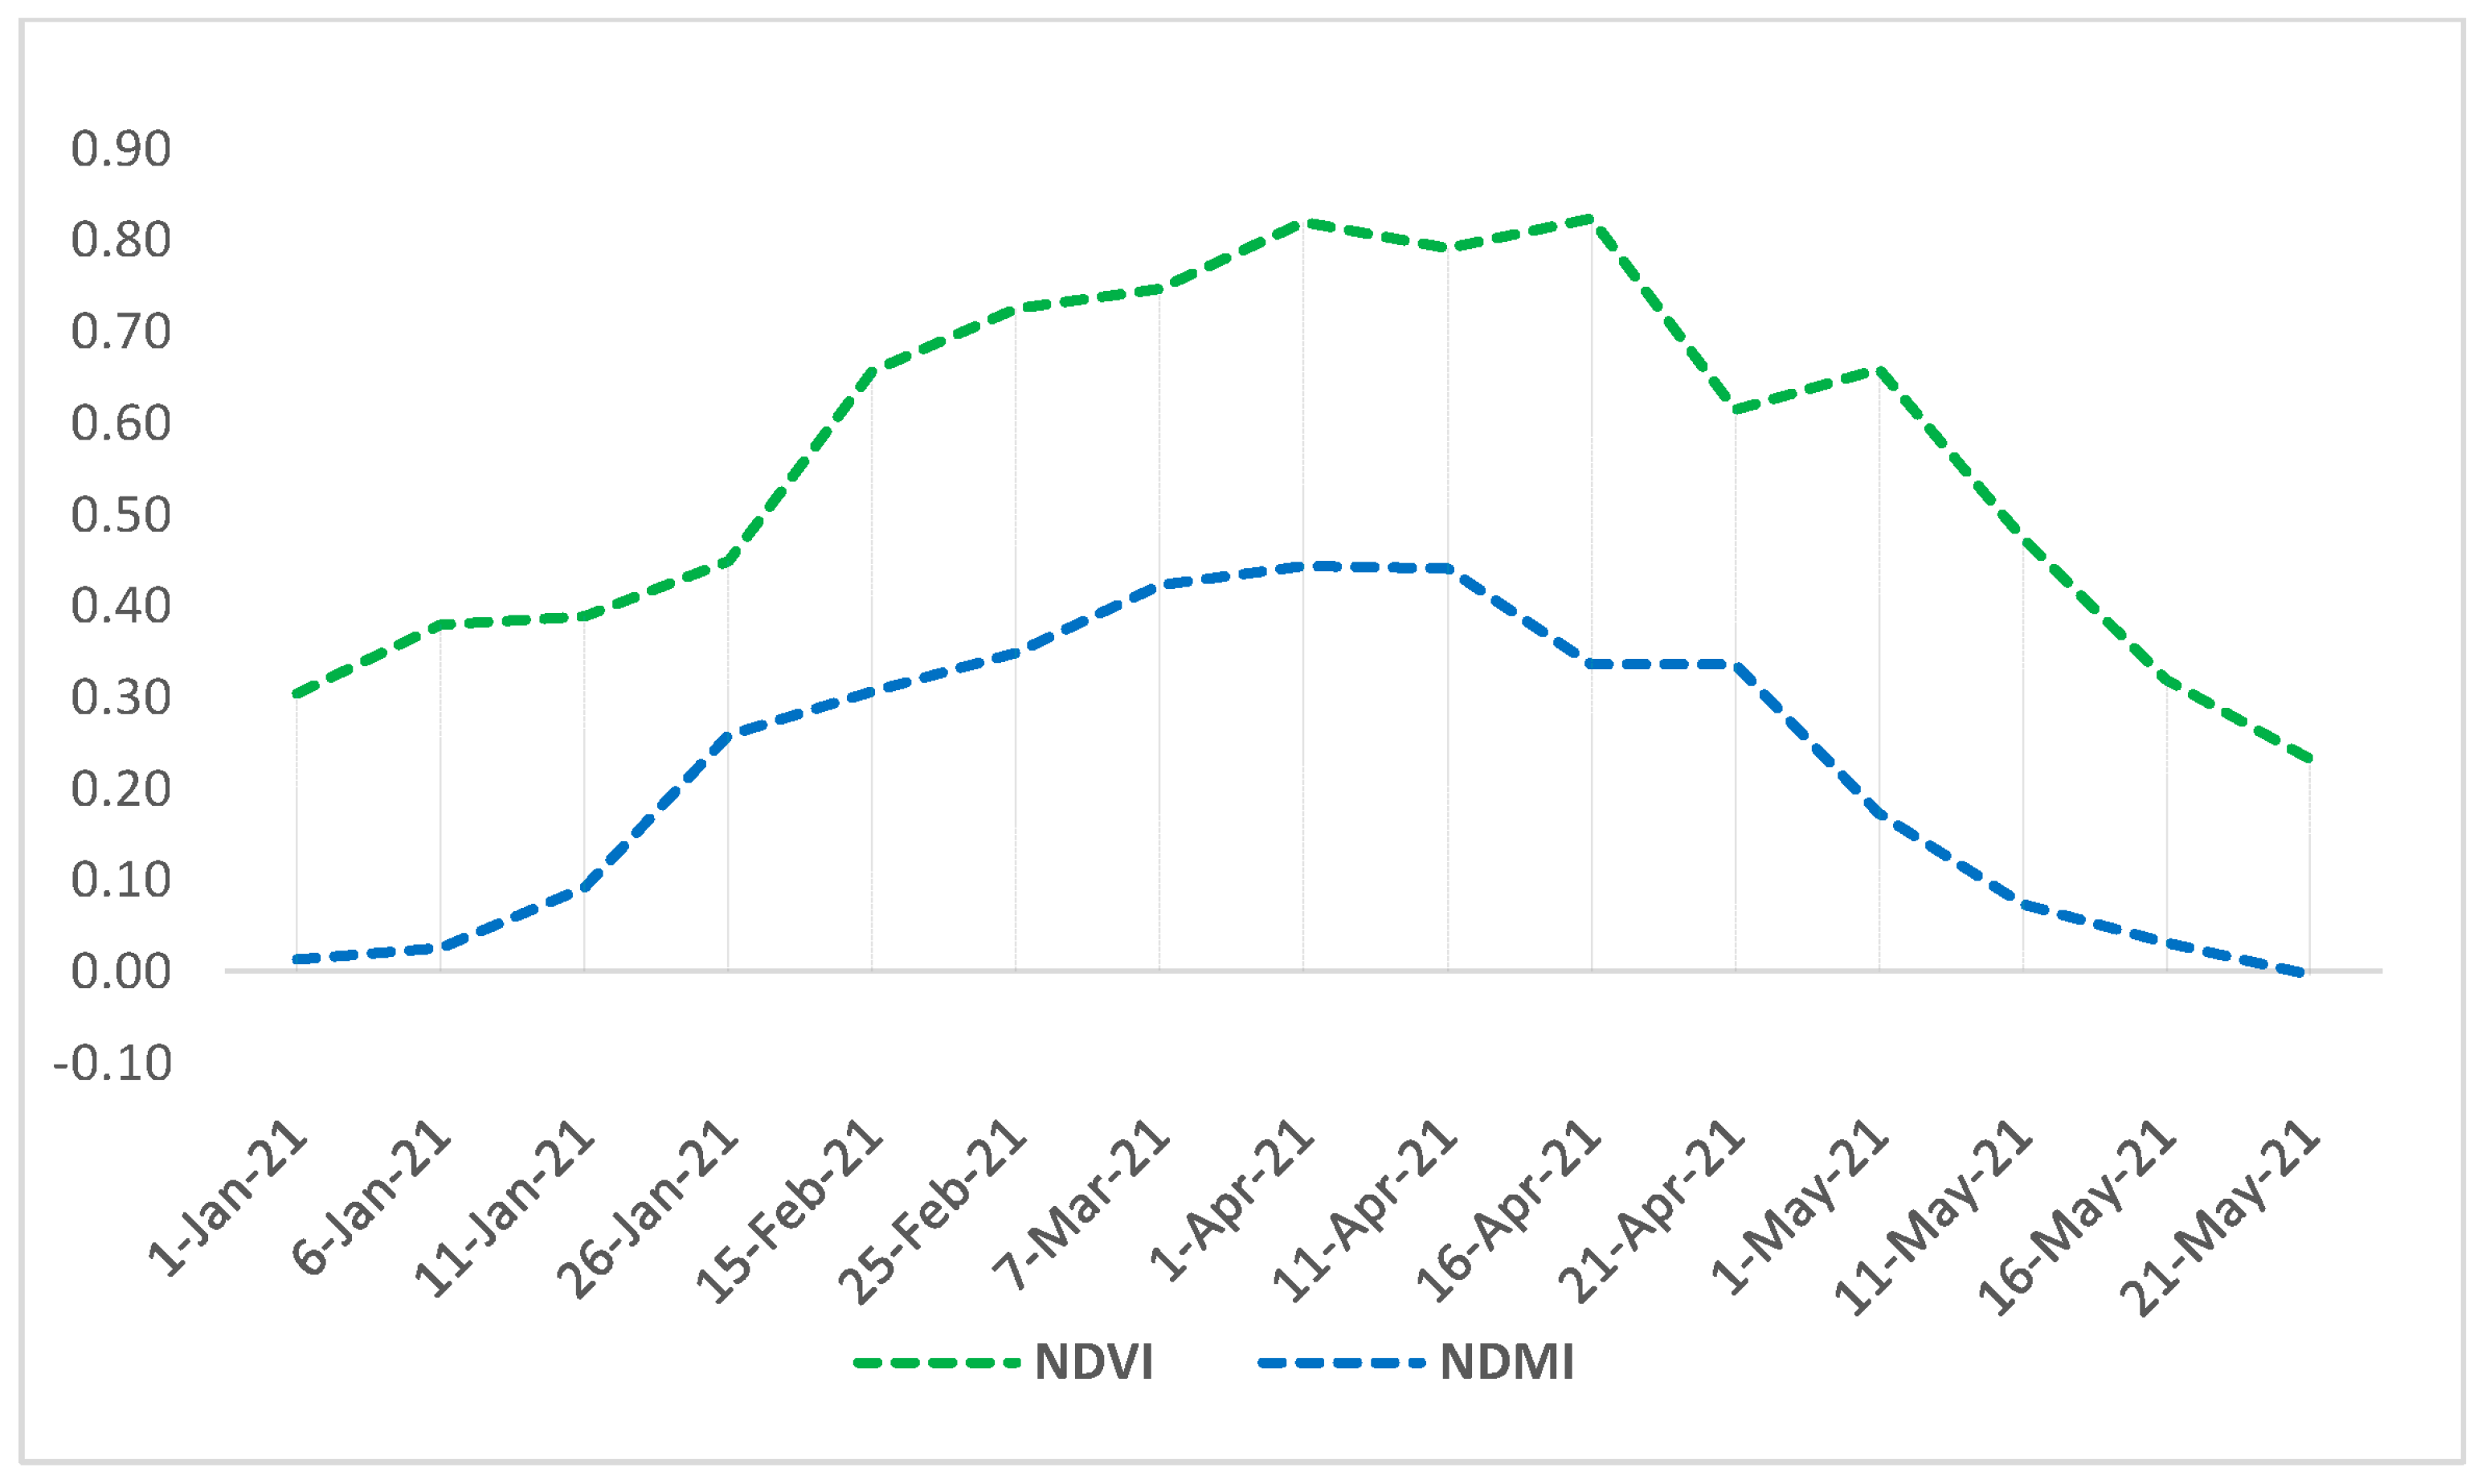
3.3. NDVI and NDMI Time Series of Wheat Crop
3.4. Evolutions of Observed NDVI and NDMI
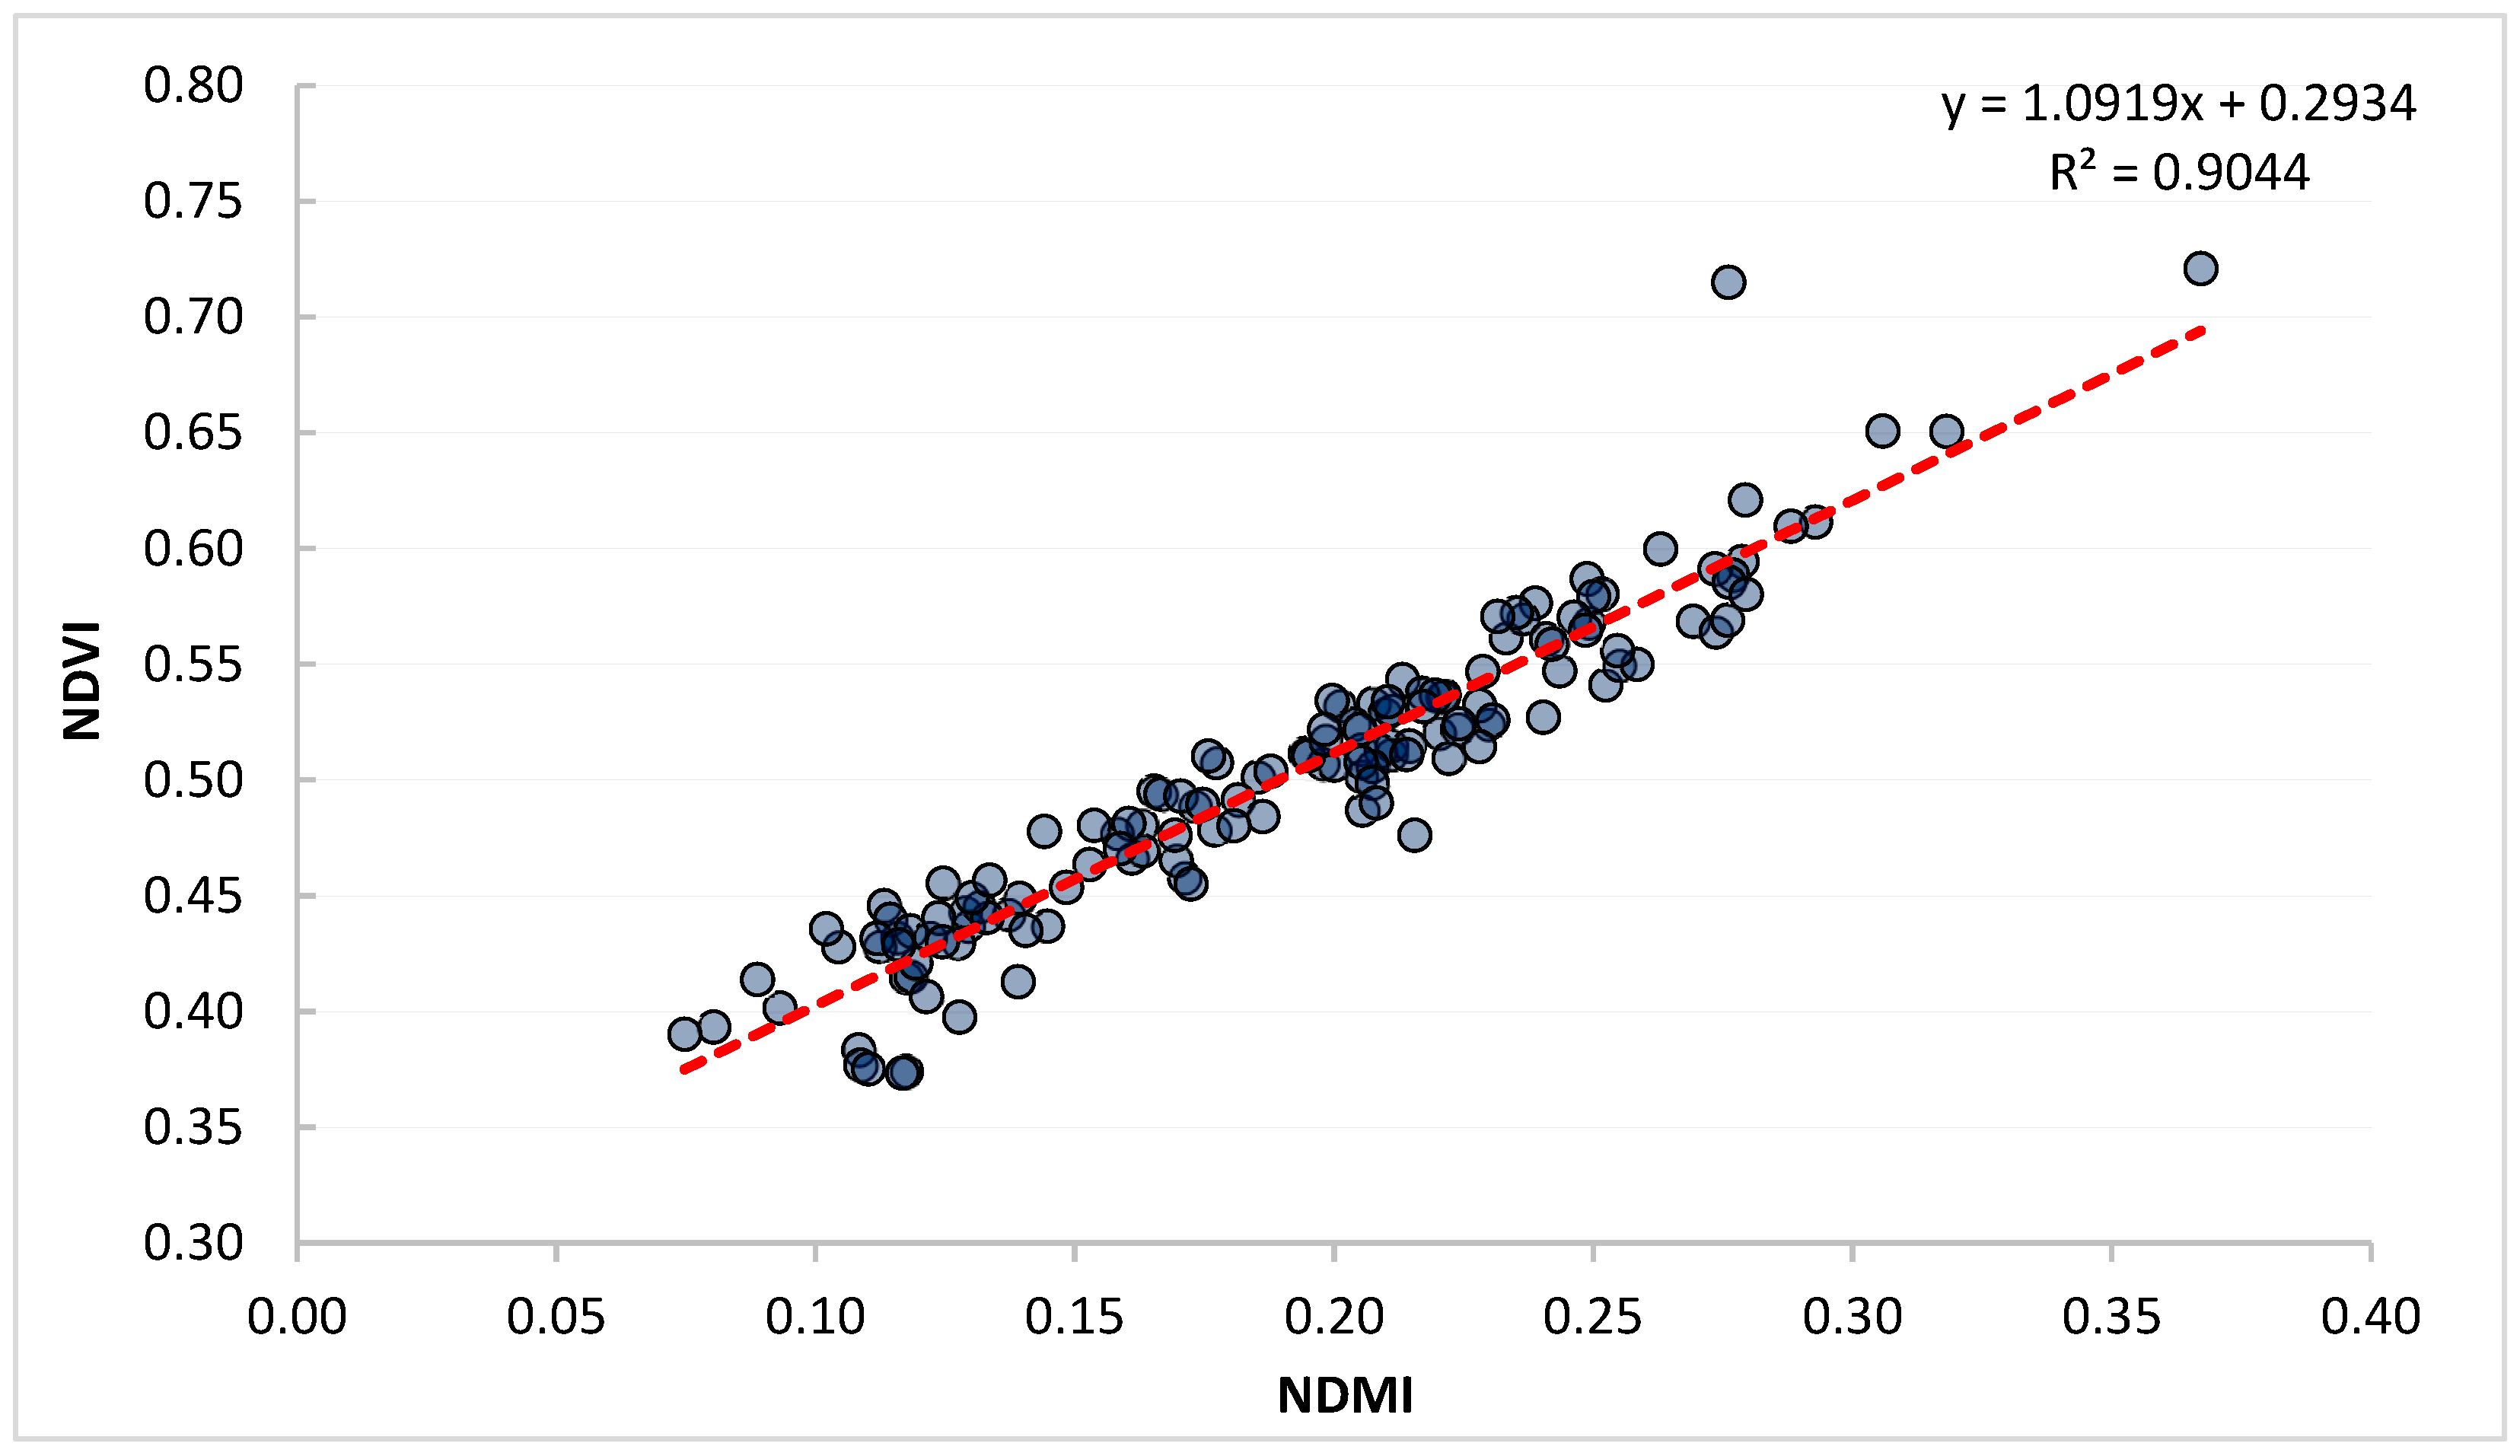
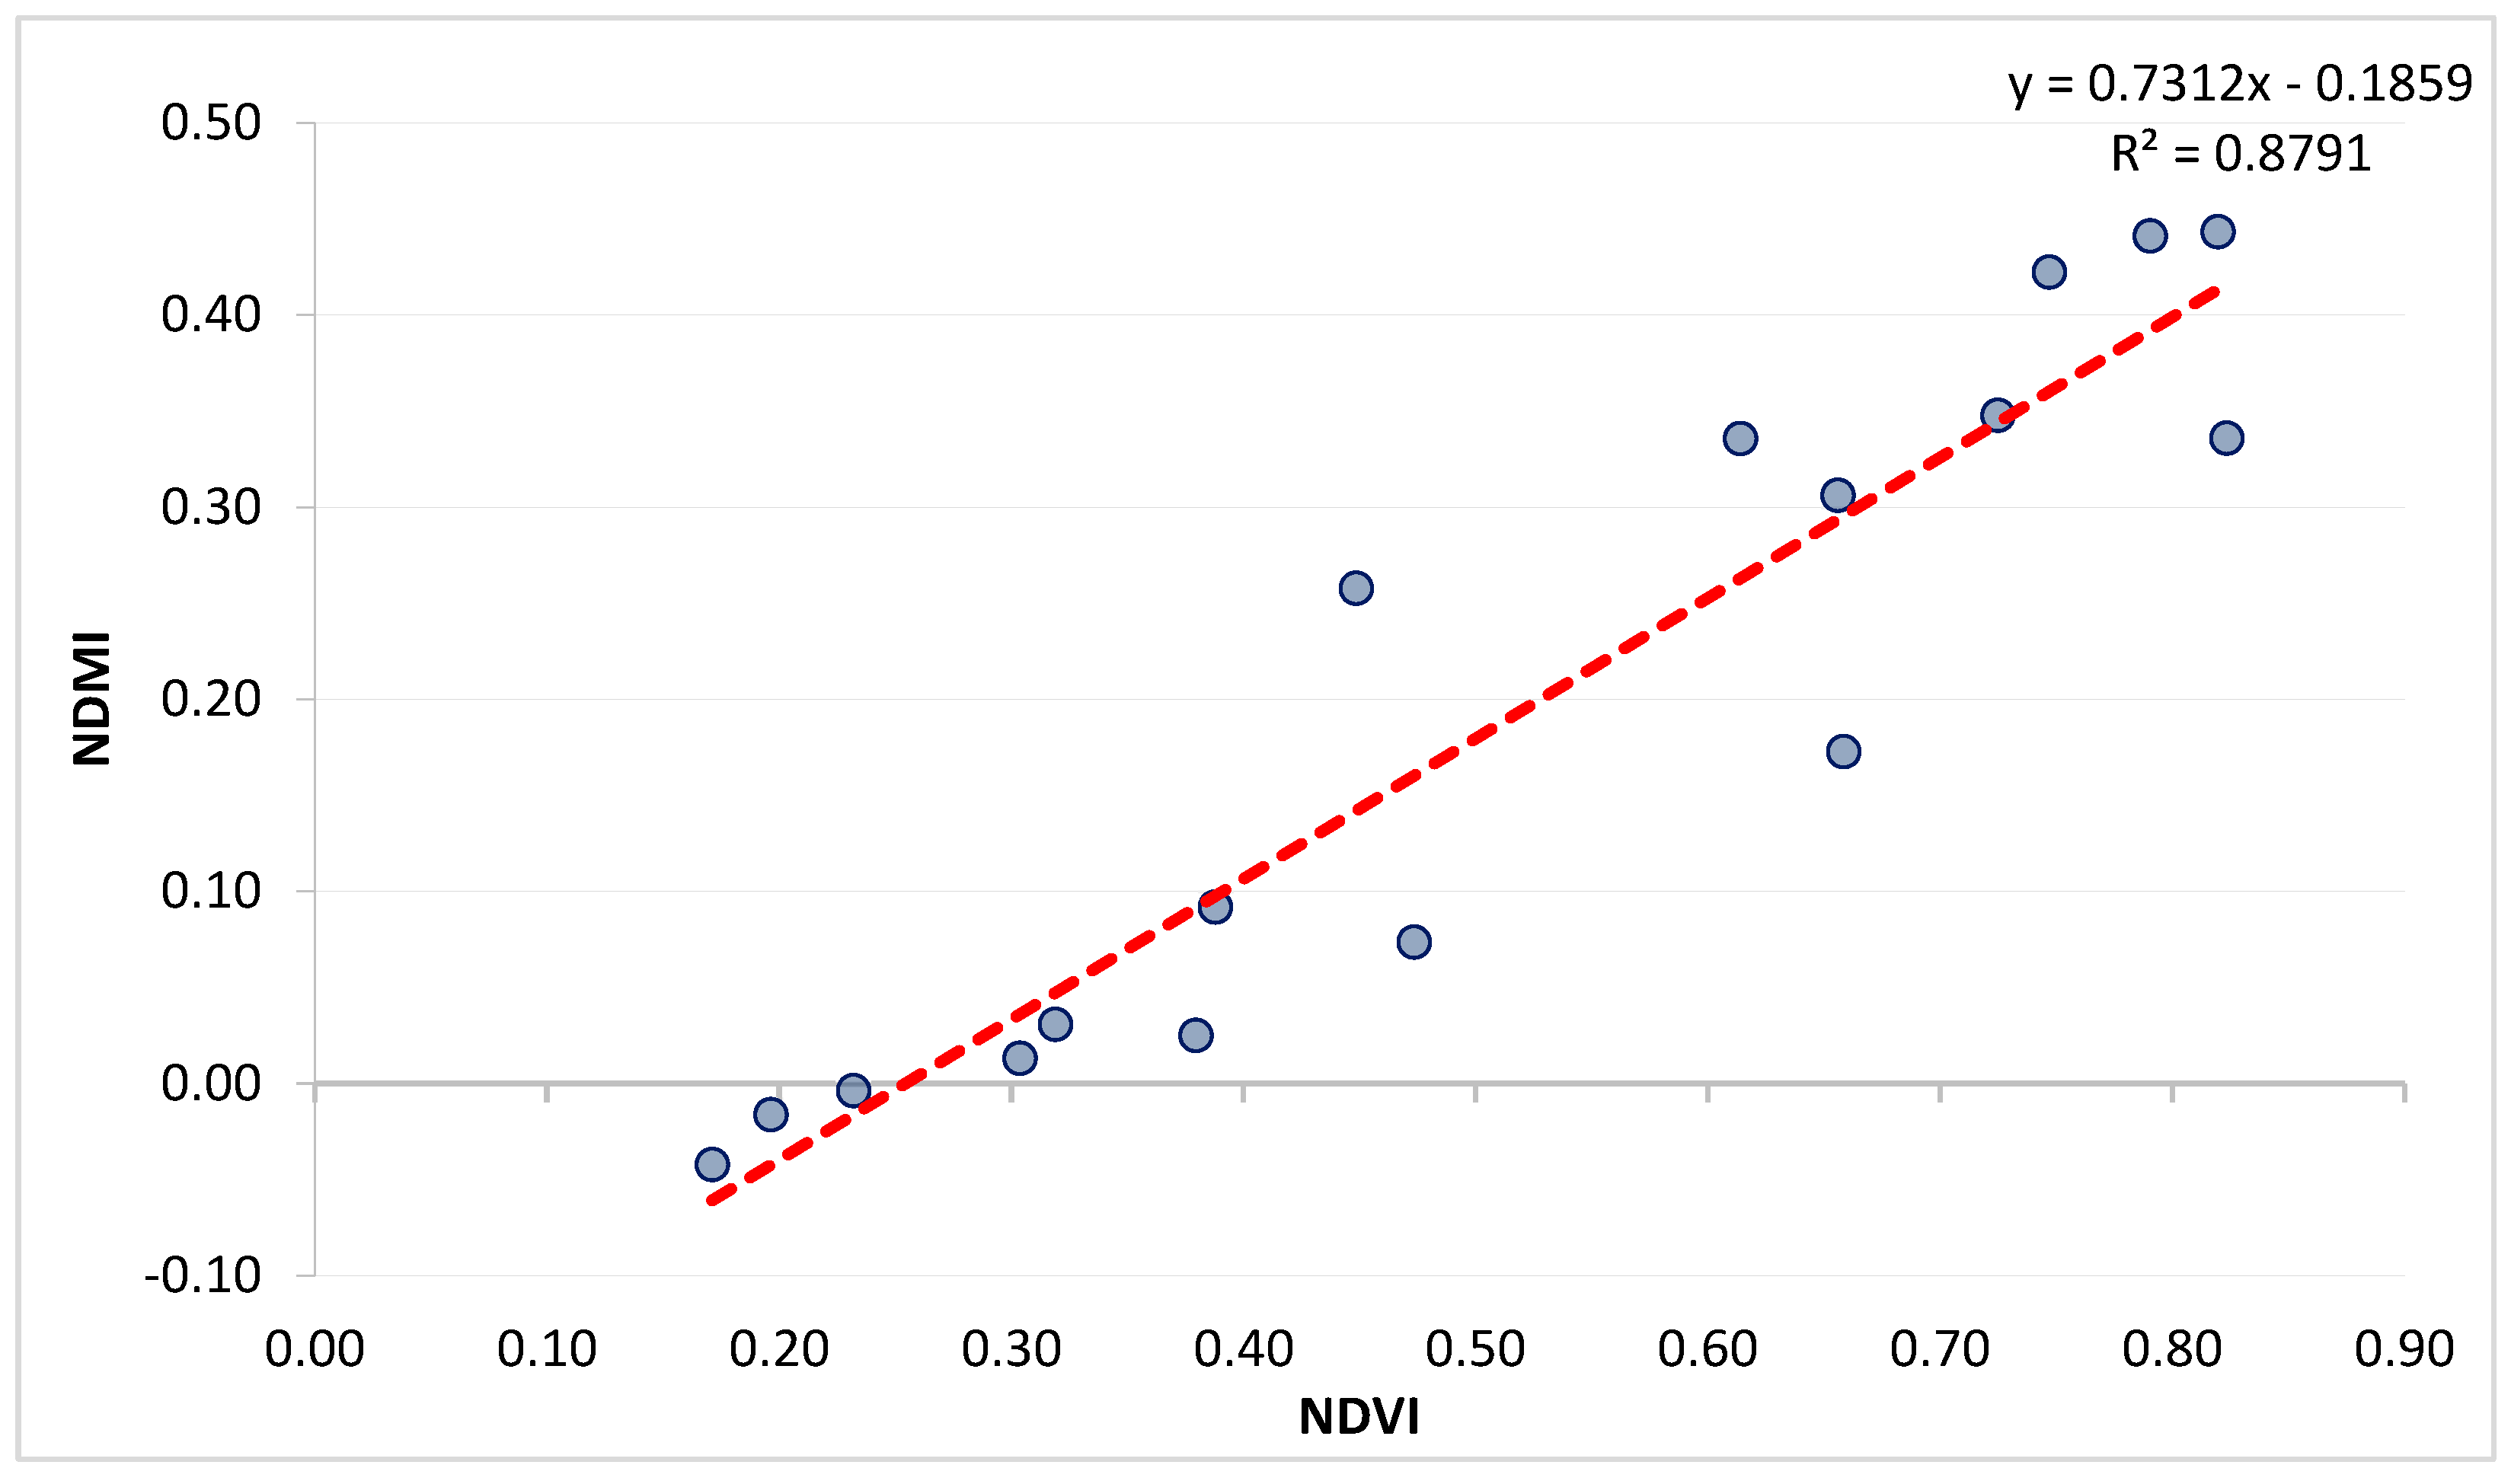
3.5. Correlation Matrix between NDVI and NDMI
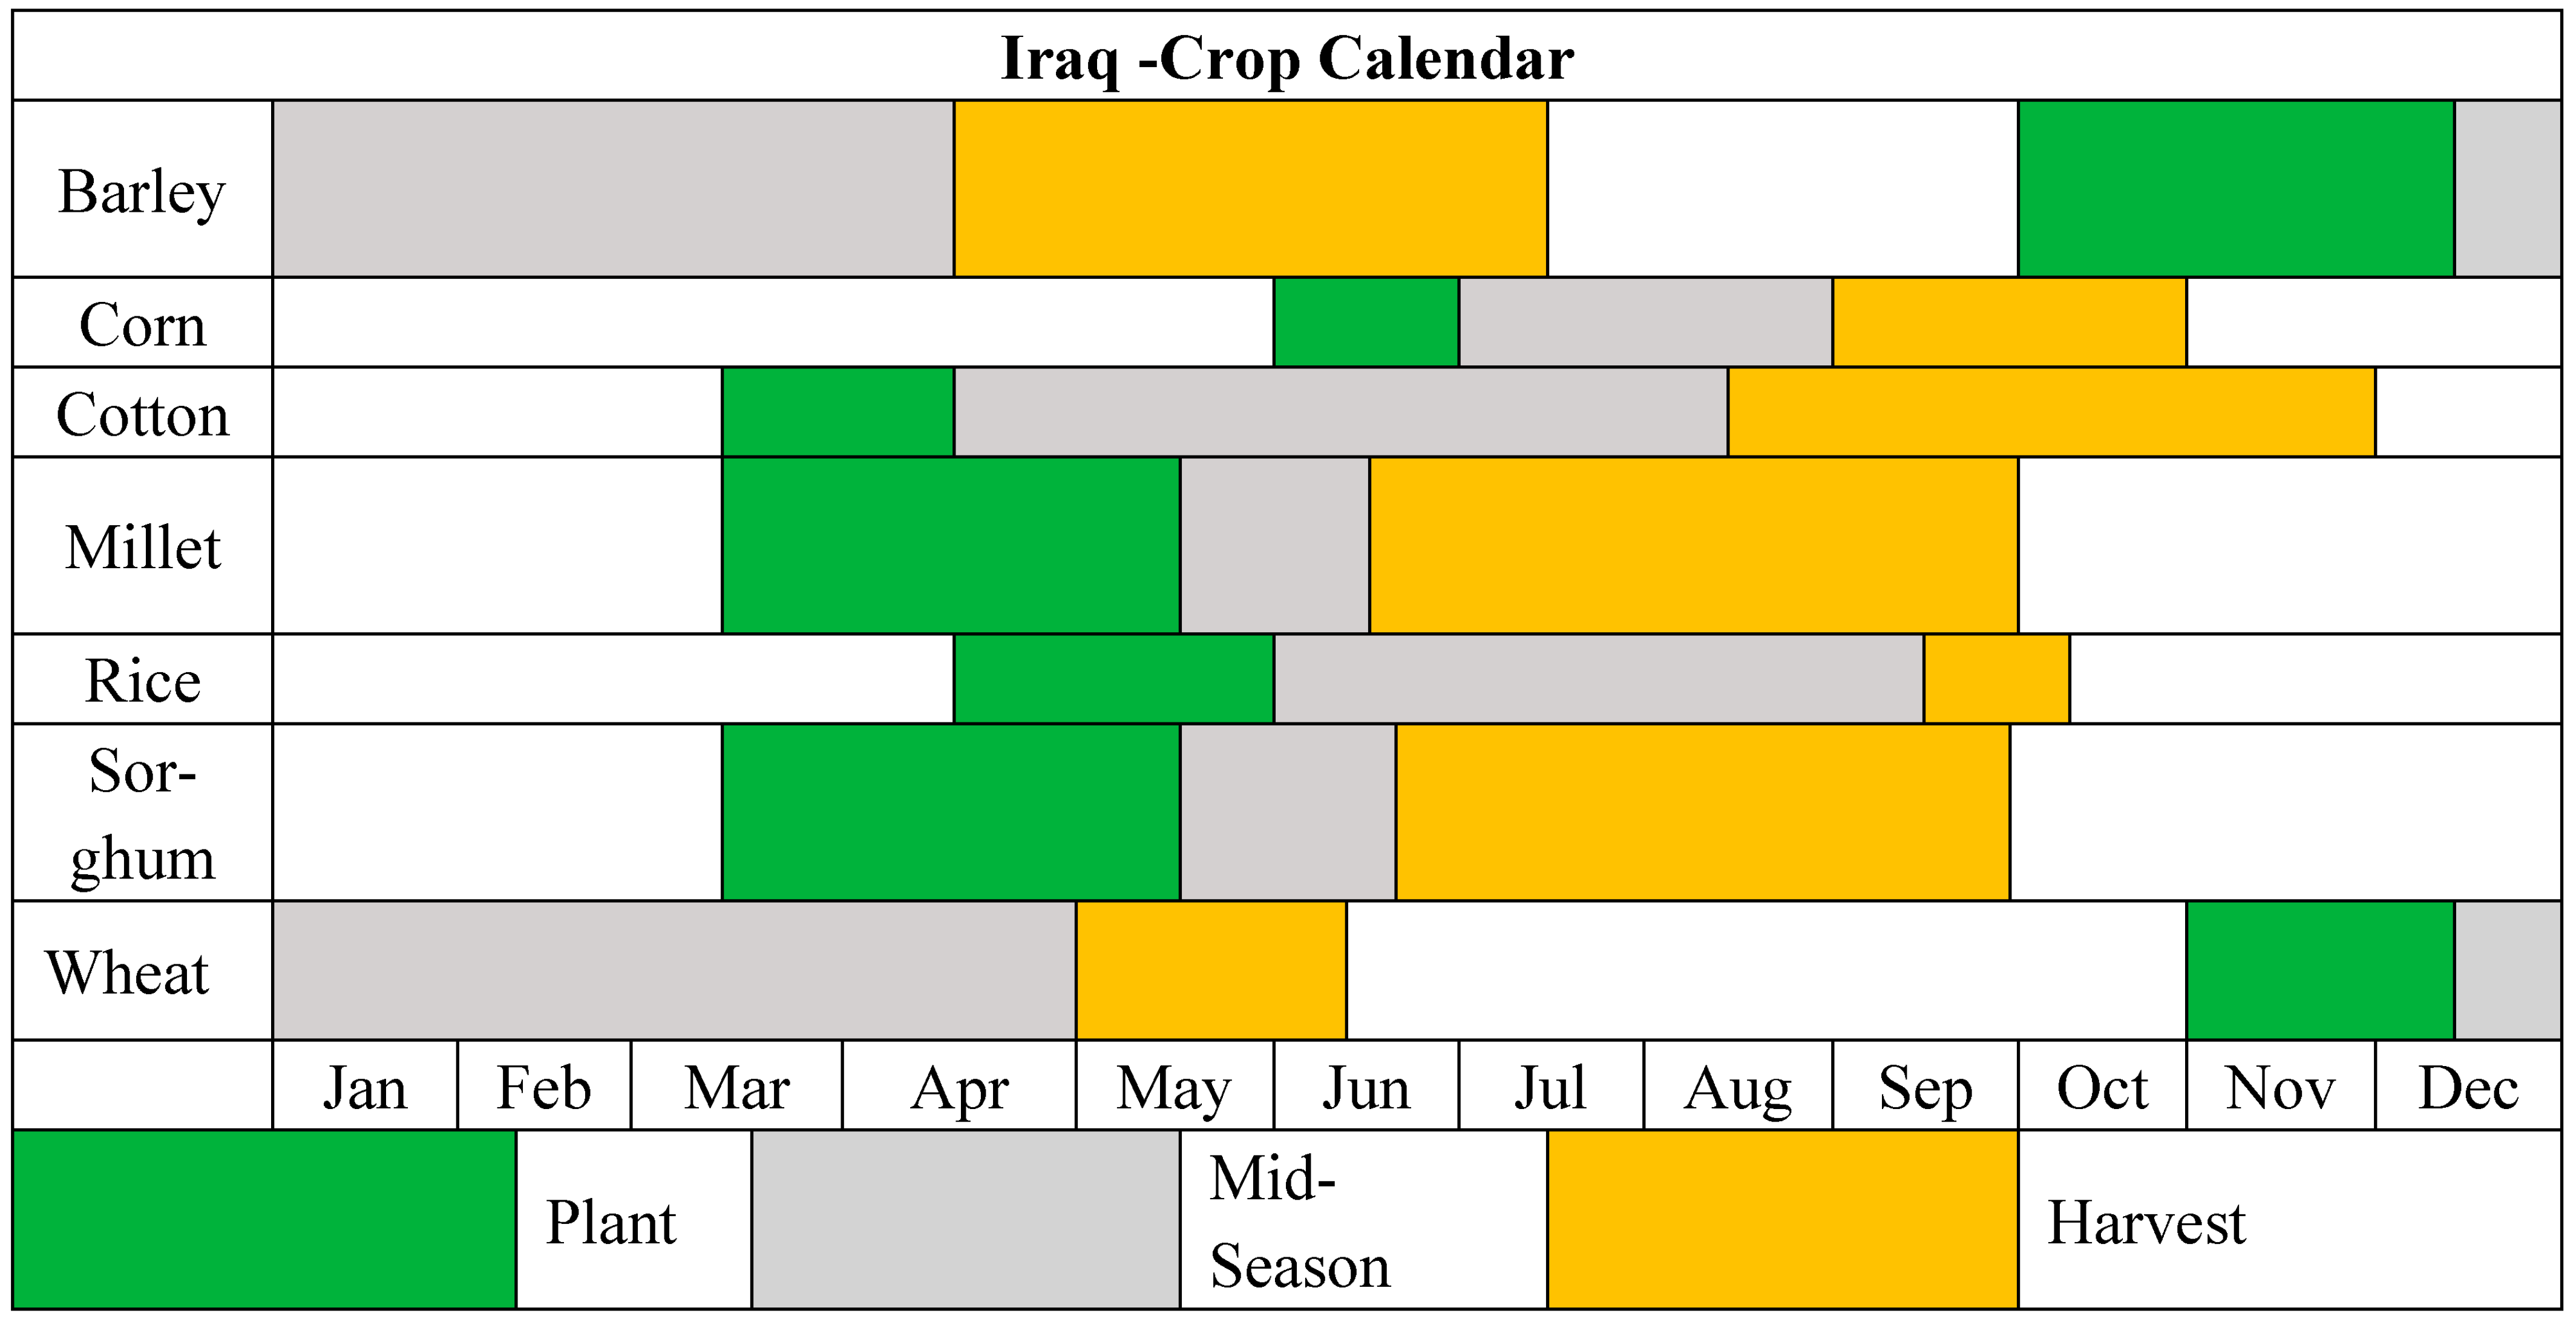
3.6. Crop Growing Period (NDVI)
4. Conclusions
Author Contributions
Funding
Data Availability Statement
Acknowledgments
Conflicts of Interest
Appendix A

| Variables | NDVI | NDMI | Precipitation (mm) | Min Temp °C | Max Temp °C | Humidity % | ETo/mm/ Month | ETc/mm/ Month | Soil Temperature (30 cm) | Irrigation (Hours) |
|---|---|---|---|---|---|---|---|---|---|---|
| NDVI | 1.00 | 0.93 | −0.86 | 0.42 | 0.63 | −0.44 | 0.49 | 0.80 | 0.55 | 0.67 |
| NDMI | 0.93 | 1.00 | −0.62 | 0.07 | 0.32 | −0.12 | 0.15 | 0.59 | 0.22 | 0.89 |
| Precipitation (mm) | −0.86 | −0.62 | 1.00 | −0.77 | −0.89 | 0.78 | −0.83 | −0.95 | −0.85 | −0.26 |
| Min Temp °C | 0.42 | 0.07 | −0.77 | 1.00 | 0.96 | −0.96 | 0.99 | 0.79 | 0.98 | −0.27 |
| Max Temp °C | 0.63 | 0.32 | −0.89 | 0.96 | 1.00 | −0.97 | 0.98 | 0.93 | 0.99 | 0.01 |
| Humidity % | −0.44 | −0.12 | 0.78 | −0.96 | −0.97 | 1.00 | −0.98 | −0.87 | −0.98 | 0.14 |
| ET0/mm/month | 0.49 | 0.15 | −0.83 | 0.99 | 0.98 | −0.98 | 1.00 | 0.86 | 1.00 | −0.17 |
| ETc/mm/month | 0.80 | 0.59 | −0.95 | 0.79 | 0.93 | −0.87 | 0.86 | 1.00 | 0.89 | 0.32 |
| Soil Temperture | 0.55 | 0.22 | −0.85 | 0.98 | 0.99 | −0.98 | 1.00 | 0.89 | 1.00 | −0.11 |
| Irrigation (h) | 0.67 | 0.89 | −0.26 | −0.27 | 0.01 | 0.14 | −0.17 | 0.32 | −0.11 | 1.00 |
Appendix B
| Field | NDVI-Jan | NDVI-Febf | NDVI- Mar | NDVI-Apr | NDVI-May | Count | Sum | Mean | St. Dev | Variance | Mean |
|---|---|---|---|---|---|---|---|---|---|---|---|
| 1 | 0.71 | 0.81 | 0.81 | 0.77 | 0.31 | 2634.0 | 2209.8 | 0.84 | 0.07 | 0.00 | 0.84 |
| 2 | 0.20 | 0.56 | 0.72 | 0.83 | 0.53 | 2568.0 | 2198.4 | 0.86 | 0.04 | 0.00 | 0.86 |
| 3 | 0.65 | 0.85 | 0.84 | 0.80 | 0.31 | 1639.0 | 1425.4 | 0.87 | 0.05 | 0.00 | 0.87 |
| 4 | 0.57 | 0.85 | 0.83 | 0.80 | 0.35 | 1944.0 | 1678.4 | 0.86 | 0.04 | 0.00 | 0.86 |
| 5 | 0.84 | 0.88 | 0.85 | 0.80 | 0.36 | 2876.0 | 2507.8 | 0.87 | 0.04 | 0.00 | 0.87 |
| 6 | 0.18 | 0.43 | 0.61 | 0.80 | 0.53 | 3793.0 | 3089.1 | 0.81 | 0.08 | 0.01 | 0.81 |
| 7 | 0.41 | 0.61 | 0.68 | 0.79 | 0.44 | 1512.0 | 1237.9 | 0.82 | 0.03 | 0.00 | 0.82 |
| 8 | 0.40 | 0.61 | 0.62 | 0.76 | 0.43 | 864.0 | 693.0 | 0.80 | 0.06 | 0.00 | 0.80 |
| 9 | 0.57 | 0.76 | 0.81 | 0.83 | 0.42 | 865.0 | 765.2 | 0.88 | 0.04 | 0.00 | 0.88 |
| 10 | 0.40 | 0.70 | 0.77 | 0.80 | 0.47 | 1720.0 | 1417.8 | 0.82 | 0.06 | 0.00 | 0.82 |
| 11 | 0.19 | 0.53 | 0.65 | 0.73 | 0.45 | 835.0 | 632.5 | 0.76 | 0.06 | 0.00 | 0.76 |
| 12 | 0.25 | 0.54 | 0.69 | 0.79 | 0.38 | 1787.0 | 1479.5 | 0.83 | 0.07 | 0.00 | 0.83 |
| 13 | 0.42 | 0.76 | 0.81 | 0.81 | 0.46 | 1506.0 | 1269.7 | 0.84 | 0.04 | 0.00 | 0.84 |
| 14 | 0.21 | 0.25 | 0.37 | 0.72 | 0.66 | 1861.0 | 1229.1 | 0.66 | 0.18 | 0.03 | 0.66 |
| 15 | 0.25 | 0.62 | 0.67 | 0.65 | 0.44 | 829.0 | 558.1 | 0.67 | 0.12 | 0.01 | 0.67 |
| 16 | 0.23 | 0.56 | 0.65 | 0.74 | 0.38 | 1727.0 | 1332.9 | 0.77 | 0.06 | 0.00 | 0.77 |
| 17 | 0.18 | 0.43 | 0.62 | 0.74 | 0.47 | 1703.0 | 1363.0 | 0.80 | 0.06 | 0.00 | 0.80 |
| 18 | 0.40 | 0.78 | 0.79 | 0.84 | 0.58 | 2014.0 | 1732.6 | 0.86 | 0.04 | 0.00 | 0.86 |
| 19 | 0.44 | 0.82 | 0.81 | 0.80 | 0.53 | 2076.0 | 1773.0 | 0.85 | 0.04 | 0.00 | 0.85 |
| 20 | 0.72 | 0.89 | 0.88 | 0.81 | 0.37 | 985.0 | 854.9 | 0.87 | 0.05 | 0.00 | 0.87 |
| 21 | 0.29 | 0.59 | 0.65 | 0.60 | 0.33 | 1988.0 | 1420.8 | 0.71 | 0.23 | 0.05 | 0.71 |
| 22 | 0.24 | 0.56 | 0.66 | 0.77 | 0.55 | 844.0 | 662.4 | 0.78 | 0.05 | 0.00 | 0.78 |
| 23 | 0.73 | 0.79 | 0.66 | 0.74 | 0.77 | 874.0 | 730.8 | 0.84 | 0.10 | 0.01 | 0.84 |
| 24 | 0.22 | 0.51 | 0.59 | 0.78 | 0.44 | 1810.0 | 1451.4 | 0.80 | 0.06 | 0.00 | 0.80 |
| 25 | 0.25 | 0.70 | 0.78 | 0.74 | 0.48 | 1838.0 | 1412.2 | 0.77 | 0.05 | 0.00 | 0.77 |
| 26 | 0.45 | 0.77 | 0.80 | 0.77 | 0.56 | 1997.0 | 1627.5 | 0.81 | 0.14 | 0.02 | 0.81 |
| 27 | 0.38 | 0.77 | 0.78 | 0.81 | 0.55 | 2117.0 | 1778.2 | 0.84 | 0.04 | 0.00 | 0.84 |
| 28 | 0.44 | 0.79 | 0.83 | 0.82 | 0.52 | 1510.0 | 1300.7 | 0.86 | 0.04 | 0.00 | 0.86 |
| 29 | 0.17 | 0.49 | 0.60 | 0.76 | 0.40 | 1014.0 | 808.1 | 0.80 | 0.09 | 0.01 | 0.80 |
| 30 | 0.55 | 0.78 | 0.80 | 0.82 | 0.43 | 1986.0 | 1690.8 | 0.85 | 0.06 | 0.00 | 0.85 |
| 31 | 0.52 | 0.81 | 0.86 | 0.79 | 0.54 | 2013.0 | 1720.3 | 0.85 | 0.03 | 0.00 | 0.85 |
| 32 | 0.69 | 0.87 | 0.88 | 0.82 | 0.53 | 1699.0 | 1448.5 | 0.85 | 0.04 | 0.00 | 0.85 |
| 33 | 0.50 | 0.80 | 0.85 | 0.80 | 0.58 | 1097.0 | 938.9 | 0.86 | 0.05 | 0.00 | 0.86 |
| 34 | 0.50 | 0.86 | 0.85 | 0.82 | 0.52 | 3061.0 | 2688.2 | 0.88 | 0.04 | 0.00 | 0.88 |
| 35 | 0.63 | 0.86 | 0.85 | 0.83 | 0.44 | 1897.0 | 1628.4 | 0.86 | 0.04 | 0.00 | 0.86 |
| 36 | 0.27 | 0.72 | 0.81 | 0.75 | 0.35 | 1943.0 | 1653.0 | 0.85 | 0.05 | 0.00 | 0.85 |
| 37 | 0.32 | 0.69 | 0.74 | 0.81 | 0.49 | 1807.0 | 1531.8 | 0.85 | 0.03 | 0.00 | 0.85 |
| 38 | 0.29 | 0.61 | 0.71 | 0.74 | 0.33 | 2107.0 | 1663.0 | 0.79 | 0.05 | 0.00 | 0.79 |
| 39 | 0.56 | 0.83 | 0.81 | 0.63 | 0.31 | 1910.0 | 1511.9 | 0.79 | 0.04 | 0.00 | 0.79 |
| 40 | 0.52 | 0.81 | 0.80 | 0.65 | 0.26 | 1606.0 | 1311.1 | 0.82 | 0.03 | 0.00 | 0.82 |
| 41 | 0.37 | 0.75 | 0.81 | 0.75 | 0.41 | 2374.0 | 2018.5 | 0.85 | 0.09 | 0.01 | 0.85 |
| 42 | 0.42 | 0.71 | 0.75 | 0.77 | 0.36 | 2020.0 | 1614.6 | 0.80 | 0.07 | 0.00 | 0.80 |
| 43 | 0.22 | 0.60 | 0.72 | 0.80 | 0.64 | 3040.0 | 2545.3 | 0.84 | 0.06 | 0.00 | 0.84 |
| 44 | 0.41 | 0.81 | 0.81 | 0.80 | 0.46 | 2252.0 | 1917.3 | 0.85 | 0.05 | 0.00 | 0.85 |
| 45 | 0.45 | 0.79 | 0.81 | 0.77 | 0.41 | 4415.0 | 3704.2 | 0.84 | 0.04 | 0.00 | 0.84 |
| 46 | 0.48 | 0.82 | 0.85 | 0.81 | 0.51 | 4122.0 | 3596.2 | 0.87 | 0.03 | 0.00 | 0.87 |
| 47 | 0.35 | 0.61 | 0.66 | 0.67 | 0.30 | 1145.0 | 893.7 | 0.78 | 0.06 | 0.00 | 0.78 |
| 48 | 0.47 | 0.74 | 0.79 | 0.74 | 0.34 | 1445.0 | 1168.7 | 0.81 | 0.10 | 0.01 | 0.81 |
| 49 | 0.52 | 0.83 | 0.83 | 0.82 | 0.33 | 1663.0 | 1469.9 | 0.88 | 0.03 | 0.00 | 0.88 |
| 50 | 0.33 | 0.73 | 0.77 | 0.77 | 0.55 | 1074.0 | 900.4 | 0.84 | 0.05 | 0.00 | 0.84 |
| 51 | 0.44 | 0.77 | 0.81 | 0.79 | 0.37 | 1924.0 | 1611.9 | 0.84 | 0.04 | 0.00 | 0.84 |
| 52 | 0.46 | 0.84 | 0.87 | 0.83 | 0.56 | 3039.0 | 2651.7 | 0.87 | 0.03 | 0.00 | 0.87 |
| 53 | 0.25 | 0.67 | 0.79 | 0.83 | 0.59 | 1864.0 | 1625.3 | 0.87 | 0.04 | 0.00 | 0.87 |
| 54 | 0.73 | 0.89 | 0.90 | 0.84 | 0.69 | 1139.0 | 997.6 | 0.88 | 0.02 | 0.00 | 0.88 |
| 55 | 0.51 | 0.78 | 0.83 | 0.78 | 0.44 | 1167.0 | 972.6 | 0.83 | 0.04 | 0.00 | 0.83 |
| 56 | 0.43 | 0.78 | 0.81 | 0.77 | 0.46 | 612.0 | 508.9 | 0.83 | 0.04 | 0.00 | 0.83 |
| 57 | 0.53 | 0.86 | 0.89 | 0.84 | 0.52 | 2074.0 | 1802.1 | 0.87 | 0.02 | 0.00 | 0.87 |
| 58 | 0.44 | 0.83 | 0.86 | 0.78 | 0.46 | 2331.0 | 2037.8 | 0.87 | 0.05 | 0.00 | 0.87 |
| 59 | 0.44 | 0.80 | 0.83 | 0.79 | 0.40 | 2475.0 | 2078.2 | 0.84 | 0.04 | 0.00 | 0.84 |
| 60 | 0.20 | 0.46 | 0.59 | 0.76 | 0.35 | 2504.0 | 1993.8 | 0.80 | 0.08 | 0.01 | 0.80 |
| 61 | 0.41 | 0.72 | 0.75 | 0.77 | 0.33 | 1957.0 | 1614.6 | 0.83 | 0.04 | 0.00 | 0.83 |
| 62 | 0.33 | 0.66 | 0.77 | 0.77 | 0.33 | 3045.0 | 2469.6 | 0.81 | 0.06 | 0.00 | 0.81 |
| 63 | 0.24 | 0.70 | 0.72 | 0.81 | 0.46 | 1678.0 | 1405.9 | 0.84 | 0.07 | 0.00 | 0.84 |
| 64 | 0.47 | 0.82 | 0.84 | 0.77 | 0.34 | 1829.0 | 1515.3 | 0.83 | 0.08 | 0.01 | 0.83 |
| 65 | 0.25 | 0.43 | 0.53 | 0.59 | 0.39 | 3014.0 | 2110.2 | 0.70 | 0.11 | 0.01 | 0.70 |
| 66 | 0.61 | 0.79 | 0.81 | 0.71 | 0.28 | 2074.0 | 1670.3 | 0.81 | 0.13 | 0.02 | 0.81 |
| 67 | 0.45 | 0.86 | 0.88 | 0.81 | 0.53 | 2009.0 | 1781.4 | 0.89 | 0.04 | 0.00 | 0.89 |
| 68 | 0.23 | 0.68 | 0.75 | 0.81 | 0.50 | 2264.0 | 1911.2 | 0.84 | 0.04 | 0.00 | 0.84 |
| 69 | 0.18 | 0.39 | 0.62 | 0.81 | 0.51 | 1767.0 | 1487.3 | 0.84 | 0.10 | 0.01 | 0.84 |
| 70 | 0.29 | 0.72 | 0.75 | 0.83 | 0.50 | 1618.0 | 1383.9 | 0.86 | 0.08 | 0.01 | 0.86 |
| 71 | 0.42 | 0.83 | 0.84 | 0.81 | 0.44 | 1870.0 | 1594.9 | 0.85 | 0.06 | 0.00 | 0.85 |
| 72 | 0.37 | 0.75 | 0.79 | 0.83 | 0.50 | 1966.0 | 1695.6 | 0.86 | 0.07 | 0.00 | 0.86 |
| 73 | 0.53 | 0.83 | 0.84 | 0.74 | 0.25 | 1208.0 | 1004.4 | 0.83 | 0.04 | 0.00 | 0.83 |
| 74 | 0.54 | 0.86 | 0.85 | 0.75 | 0.25 | 1013.0 | 859.8 | 0.85 | 0.03 | 0.00 | 0.85 |
| 75 | 0.74 | 0.80 | 0.77 | 0.61 | 0.20 | 1938.0 | 1482.1 | 0.76 | 0.06 | 0.00 | 0.76 |
| 76 | 0.26 | 0.53 | 0.58 | 0.50 | 0.33 | 2413.0 | 1588.0 | 0.66 | 0.29 | 0.08 | 0.66 |
| 77 | 0.16 | 0.30 | 0.51 | 0.82 | 0.58 | 1046.0 | 850.2 | 0.81 | 0.05 | 0.00 | 0.81 |
| 78 | 0.40 | 0.74 | 0.77 | 0.78 | 0.32 | 1906.0 | 1594.4 | 0.84 | 0.08 | 0.01 | 0.84 |
| 79 | 0.41 | 0.62 | 0.63 | 0.72 | 0.38 | 1521.0 | 1114.7 | 0.73 | 0.07 | 0.01 | 0.73 |
| 80 | 0.18 | 0.49 | 0.71 | 0.72 | 0.46 | 1378.0 | 1023.4 | 0.74 | 0.15 | 0.02 | 0.74 |
| 81 | 0.30 | 0.63 | 0.63 | 0.66 | 0.38 | 1226.0 | 858.2 | 0.70 | 0.06 | 0.00 | 0.70 |
| 82 | 0.32 | 0.63 | 0.73 | 0.68 | 0.30 | 2679.0 | 2022.2 | 0.75 | 0.07 | 0.00 | 0.75 |
| 83 | 0.47 | 0.82 | 0.81 | 0.75 | 0.33 | 1704.0 | 1401.2 | 0.82 | 0.06 | 0.00 | 0.82 |
| 84 | 0.27 | 0.67 | 0.68 | 0.73 | 0.36 | 954.0 | 740.3 | 0.78 | 0.06 | 0.00 | 0.78 |
| 85 | 0.31 | 0.56 | 0.60 | 0.62 | 0.27 | 2026.0 | 1393.7 | 0.69 | 0.18 | 0.03 | 0.69 |
| 86 | 0.47 | 0.84 | 0.85 | 0.82 | 0.41 | 1806.0 | 1568.4 | 0.87 | 0.06 | 0.00 | 0.87 |
| 87 | 0.40 | 0.77 | 0.77 | 0.77 | 0.40 | 1482.0 | 1202.8 | 0.81 | 0.06 | 0.00 | 0.81 |
| 88 | 0.41 | 0.80 | 0.85 | 0.84 | 0.53 | 1929.0 | 1682.8 | 0.87 | 0.03 | 0.00 | 0.87 |
| 89 | 0.39 | 0.65 | 0.70 | 0.78 | 0.44 | 1354.0 | 1115.4 | 0.82 | 0.03 | 0.00 | 0.82 |
| 90 | 0.28 | 0.61 | 0.72 | 0.77 | 0.47 | 3457.0 | 2815.9 | 0.81 | 0.09 | 0.01 | 0.81 |
| 91 | 0.22 | 0.47 | 0.55 | 0.73 | 0.42 | 1128.0 | 865.4 | 0.77 | 0.06 | 0.00 | 0.77 |
| 92 | 0.19 | 0.48 | 0.62 | 0.78 | 0.51 | 1553.0 | 1253.3 | 0.81 | 0.11 | 0.01 | 0.81 |
| 93 | 0.18 | 0.39 | 0.55 | 0.76 | 0.54 | 1193.0 | 910.4 | 0.76 | 0.10 | 0.01 | 0.76 |
| 94 | 0.58 | 0.80 | 0.81 | 0.77 | 0.43 | 1696.0 | 1386.2 | 0.82 | 0.05 | 0.00 | 0.82 |
| 95 | 0.42 | 0.83 | 0.85 | 0.82 | 0.29 | 1732.0 | 1499.9 | 0.87 | 0.04 | 0.00 | 0.87 |
| 96 | 0.16 | 0.39 | 0.55 | 0.76 | 0.32 | 1258.0 | 998.8 | 0.79 | 0.09 | 0.01 | 0.79 |
| 97 | 0.19 | 0.55 | 0.73 | 0.74 | 0.45 | 1606.0 | 1306.9 | 0.81 | 0.07 | 0.01 | 0.81 |
| 98 | 0.47 | 0.84 | 0.87 | 0.81 | 0.47 | 1800.0 | 1531.6 | 0.85 | 0.04 | 0.00 | 0.85 |
| 99 | 0.21 | 0.56 | 0.64 | 0.75 | 0.43 | 1882.0 | 1486.4 | 0.79 | 0.12 | 0.01 | 0.79 |
| 100 | 0.35 | 0.71 | 0.76 | 0.79 | 0.55 | 1706.0 | 1401.2 | 0.82 | 0.03 | 0.00 | 0.82 |
| 101 | 0.41 | 0.75 | 0.78 | 0.82 | 0.41 | 1430.0 | 1233.9 | 0.86 | 0.04 | 0.00 | 0.86 |
| 102 | 0.51 | 0.81 | 0.81 | 0.80 | 0.31 | 1954.0 | 1654.8 | 0.85 | 0.04 | 0.00 | 0.85 |
| 103 | 0.42 | 0.79 | 0.84 | 0.83 | 0.33 | 1796.0 | 1571.3 | 0.87 | 0.03 | 0.00 | 0.87 |
| 104 | 0.37 | 0.76 | 0.80 | 0.83 | 0.48 | 1864.0 | 1587.3 | 0.85 | 0.06 | 0.00 | 0.85 |
| 105 | 0.26 | 0.56 | 0.61 | 0.69 | 0.19 | 1693.0 | 1216.8 | 0.72 | 0.08 | 0.01 | 0.72 |
| 106 | 0.23 | 0.40 | 0.50 | 0.73 | 0.34 | 1807.0 | 1346.3 | 0.75 | 0.09 | 0.01 | 0.75 |
| 107 | 0.27 | 0.58 | 0.62 | 0.73 | 0.33 | 2854.0 | 2193.8 | 0.77 | 0.12 | 0.01 | 0.77 |
| 108 | 0.23 | 0.64 | 0.69 | 0.81 | 0.67 | 1813.0 | 1480.6 | 0.82 | 0.06 | 0.00 | 0.82 |
| 109 | 0.39 | 0.71 | 0.79 | 0.73 | 0.52 | 1619.0 | 1358.1 | 0.84 | 0.04 | 0.00 | 0.84 |
| 110 | 0.56 | 0.84 | 0.84 | 0.73 | 0.48 | 1872.0 | 1557.7 | 0.83 | 0.09 | 0.01 | 0.83 |
| 111 | 0.33 | 0.73 | 0.83 | 0.77 | 0.49 | 2219.0 | 1893.3 | 0.85 | 0.04 | 0.00 | 0.85 |
| 112 | 0.38 | 0.69 | 0.78 | 0.63 | 0.40 | 1124.0 | 930.3 | 0.83 | 0.06 | 0.00 | 0.83 |
| 113 | 0.43 | 0.77 | 0.79 | 0.68 | 0.25 | 1222.0 | 955.1 | 0.78 | 0.09 | 0.01 | 0.78 |
| 114 | 0.31 | 0.58 | 0.70 | 0.80 | 0.38 | 1625.0 | 1365.7 | 0.84 | 0.07 | 0.00 | 0.84 |
| 115 | 0.23 | 0.56 | 0.72 | 0.77 | 0.47 | 3150.0 | 2604.8 | 0.83 | 0.07 | 0.00 | 0.83 |
| 116 | 0.40 | 0.75 | 0.80 | 0.80 | 0.45 | 2733.0 | 2322.8 | 0.85 | 0.10 | 0.01 | 0.85 |
| 117 | 0.41 | 0.75 | 0.77 | 0.71 | 0.31 | 1380.0 | 1075.2 | 0.78 | 0.07 | 0.00 | 0.78 |
| 118 | 0.16 | 0.54 | 0.76 | 0.83 | 0.60 | 908.0 | 789.5 | 0.87 | 0.03 | 0.00 | 0.87 |
| 119 | 0.42 | 0.71 | 0.77 | 0.76 | 0.39 | 1422.0 | 1153.8 | 0.81 | 0.09 | 0.01 | 0.81 |
| 120 | 0.22 | 0.65 | 0.73 | 0.75 | 0.33 | 1188.0 | 978.2 | 0.82 | 0.04 | 0.00 | 0.82 |
| 121 | 0.27 | 0.71 | 0.73 | 0.79 | 0.55 | 551.0 | 453.8 | 0.82 | 0.05 | 0.00 | 0.82 |
| 122 | 0.31 | 0.64 | 0.73 | 0.76 | 0.32 | 1740.0 | 1416.5 | 0.81 | 0.05 | 0.00 | 0.81 |
| 123 | 0.34 | 0.53 | 0.55 | 0.74 | 0.53 | 936.0 | 726.9 | 0.78 | 0.05 | 0.00 | 0.78 |
| 124 | 0.43 | 0.79 | 0.84 | 0.80 | 0.50 | 2891.0 | 2422.4 | 0.84 | 0.11 | 0.01 | 0.84 |
| 125 | 0.42 | 0.74 | 0.80 | 0.77 | 0.36 | 445.0 | 372.6 | 0.84 | 0.06 | 0.00 | 0.84 |
| 126 | 0.32 | 0.73 | 0.80 | 0.68 | 0.34 | 2584.0 | 2171.8 | 0.84 | 0.03 | 0.00 | 0.84 |
| 127 | 0.42 | 0.77 | 0.81 | 0.76 | 0.33 | 761.0 | 649.7 | 0.85 | 0.03 | 0.00 | 0.85 |
| 128 | 0.39 | 0.75 | 0.79 | 0.75 | 0.32 | 875.0 | 700.9 | 0.80 | 0.04 | 0.00 | 0.80 |
| 129 | 0.36 | 0.79 | 0.68 | 0.74 | 0.34 | 1960.0 | 1659.0 | 0.85 | 0.09 | 0.01 | 0.85 |
| 130 | 0.43 | 0.74 | 0.80 | 0.74 | 0.28 | 2010.0 | 1754.8 | 0.87 | 0.03 | 0.00 | 0.87 |
| 131 | 0.30 | 0.73 | 0.78 | 0.75 | 0.37 | 805.0 | 651.1 | 0.81 | 0.15 | 0.02 | 0.81 |
| 132 | 0.50 | 0.80 | 0.85 | 0.74 | 0.49 | 1836.0 | 1583.5 | 0.86 | 0.05 | 0.00 | 0.86 |
| 133 | 0.26 | 0.52 | 0.64 | 0.69 | 0.32 | 922.0 | 701.8 | 0.76 | 0.08 | 0.01 | 0.76 |
| 134 | 0.19 | 0.51 | 0.66 | 0.70 | 0.40 | 1071.0 | 821.4 | 0.77 | 0.07 | 0.00 | 0.77 |
| 135 | 0.19 | 0.56 | 0.73 | 0.78 | 0.36 | 941.0 | 801.6 | 0.85 | 0.03 | 0.00 | 0.85 |
| 136 | 0.50 | 0.82 | 0.83 | 0.81 | 0.21 | 1294.0 | 1131.7 | 0.87 | 0.03 | 0.00 | 0.87 |
| 137 | 0.47 | 0.83 | 0.85 | 0.74 | 0.32 | 1419.0 | 1214.4 | 0.86 | 0.02 | 0.00 | 0.86 |
| 138 | 0.33 | 0.64 | 0.74 | 0.74 | 0.48 | 935.0 | 808.2 | 0.86 | 0.02 | 0.00 | 0.86 |
| 139 | 0.29 | 0.64 | 0.71 | 0.71 | 0.17 | 1201.0 | 958.4 | 0.80 | 0.16 | 0.02 | 0.80 |
| 140 | 0.50 | 0.75 | 0.78 | 0.75 | 0.35 | 1148.0 | 923.8 | 0.80 | 0.16 | 0.03 | 0.80 |
| 141 | 0.19 | 0.37 | 0.54 | 0.75 | 0.50 | 957.0 | 706.4 | 0.74 | 0.12 | 0.01 | 0.74 |
| 142 | 0.26 | 0.55 | 0.62 | 0.61 | 0.23 | 3077.0 | 2179.4 | 0.71 | 0.18 | 0.03 | 0.71 |
| 143 | 0.43 | 0.82 | 0.84 | 0.81 | 0.33 | 1062.0 | 946.9 | 0.89 | 0.02 | 0.00 | 0.89 |
| Field | NDMI-Jan | NDMI-Feb | NDMI- Mar | NDMI-April | NDMI-May | Count | Sum | Mean | St. Dev | Variance | Mean |
|---|---|---|---|---|---|---|---|---|---|---|---|
| 1 | 0.27 | 0.36 | 0.41 | 0.44 | 0.08 | 658.0 | 181.6 | 0.28 | 0.06 | 0.00 | 0.46 |
| 2 | −0.10 | 0.17 | 0.32 | 0.45 | 0.18 | 643.0 | −69.3 | −0.11 | 0.03 | 0.00 | 0.44 |
| 3 | 0.23 | 0.45 | 0.47 | 0.43 | 0.07 | 410.0 | 85.4 | 0.21 | 0.09 | 0.01 | 0.47 |
| 4 | 0.15 | 0.44 | 0.44 | 0.43 | 0.10 | 484.0 | 61.0 | 0.13 | 0.08 | 0.01 | 0.45 |
| 5 | 0.40 | 0.46 | 0.45 | 0.47 | 0.15 | 722.0 | 296.8 | 0.41 | 0.10 | 0.01 | 0.50 |
| 6 | −0.12 | 0.06 | 0.21 | 0.41 | 0.14 | 961.0 | −113.2 | −0.12 | 0.03 | 0.00 | 0.40 |
| 7 | 0.04 | 0.19 | 0.28 | 0.42 | 0.14 | 380.0 | 19.1 | 0.05 | 0.06 | 0.00 | 0.42 |
| 8 | 0.03 | 0.20 | 0.23 | 0.38 | 0.12 | 213.0 | 5.0 | 0.02 | 0.07 | 0.00 | 0.37 |
| 9 | 0.14 | 0.33 | 0.41 | 0.47 | 0.16 | 218.0 | 28.8 | 0.13 | 0.07 | 0.00 | 0.49 |
| 10 | 0.02 | 0.28 | 0.36 | 0.44 | 0.17 | 427.0 | 8.4 | 0.02 | 0.06 | 0.00 | 0.43 |
| 11 | −0.09 | 0.12 | 0.22 | 0.35 | 0.12 | 210.0 | −20.5 | −0.10 | 0.02 | 0.00 | 0.34 |
| 12 | −0.07 | 0.15 | 0.30 | 0.43 | 0.10 | 447.0 | −38.0 | −0.08 | 0.04 | 0.00 | 0.43 |
| 13 | 0.04 | 0.33 | 0.40 | 0.44 | 0.17 | 375.0 | 9.0 | 0.02 | 0.05 | 0.00 | 0.44 |
| 14 | −0.09 | −0.05 | 0.02 | 0.34 | 0.24 | 465.0 | −19.2 | −0.04 | 0.08 | 0.01 | 0.27 |
| 15 | −0.05 | 0.21 | 0.28 | 0.28 | 0.09 | 207.0 | −13.3 | −0.06 | 0.03 | 0.00 | 0.29 |
| 16 | −0.08 | 0.16 | 0.24 | 0.36 | 0.08 | 430.0 | −40.3 | −0.09 | 0.03 | 0.00 | 0.36 |
| 17 | −0.10 | 0.07 | 0.20 | 0.37 | 0.11 | 425.0 | −44.3 | −0.10 | 0.03 | 0.00 | 0.39 |
| 18 | 0.03 | 0.36 | 0.39 | 0.50 | 0.31 | 508.0 | 2.8 | 0.01 | 0.03 | 0.00 | 0.47 |
| 19 | 0.06 | 0.41 | 0.42 | 0.48 | 0.29 | 516.0 | 12.1 | 0.02 | 0.03 | 0.00 | 0.48 |
| 20 | 0.27 | 0.48 | 0.48 | 0.45 | 0.12 | 245.0 | 64.6 | 0.26 | 0.10 | 0.01 | 0.48 |
| 21 | −0.04 | 0.20 | 0.27 | 0.29 | 0.15 | 501.0 | −24.2 | −0.05 | 0.06 | 0.00 | 0.35 |
| 22 | −0.07 | 0.16 | 0.26 | 0.40 | 0.21 | 216.0 | −20.4 | −0.09 | 0.04 | 0.00 | 0.37 |
| 23 | 0.27 | 0.34 | 0.22 | 0.35 | 0.29 | 219.0 | 63.2 | 0.29 | 0.09 | 0.01 | 0.41 |
| 24 | −0.08 | 0.14 | 0.20 | 0.40 | 0.12 | 450.0 | −33.5 | −0.07 | 0.03 | 0.00 | 0.38 |
| 25 | −0.06 | 0.28 | 0.38 | 0.37 | 0.13 | 457.0 | −37.8 | −0.08 | 0.04 | 0.00 | 0.38 |
| 26 | 0.07 | 0.36 | 0.41 | 0.42 | 0.22 | 498.0 | 27.4 | 0.06 | 0.07 | 0.01 | 0.44 |
| 27 | 0.02 | 0.35 | 0.38 | 0.47 | 0.26 | 530.0 | −1.5 | 0.00 | 0.03 | 0.00 | 0.45 |
| 28 | 0.06 | 0.38 | 0.44 | 0.47 | 0.23 | 374.0 | 15.2 | 0.04 | 0.06 | 0.00 | 0.47 |
| 29 | −0.11 | 0.11 | 0.22 | 0.38 | 0.11 | 254.0 | −29.5 | −0.12 | 0.03 | 0.00 | 0.37 |
| 30 | 0.14 | 0.38 | 0.41 | 0.45 | 0.13 | 495.0 | 63.9 | 0.13 | 0.10 | 0.01 | 0.45 |
| 31 | 0.12 | 0.39 | 0.47 | 0.47 | 0.26 | 504.0 | 54.9 | 0.11 | 0.07 | 0.00 | 0.48 |
| 32 | 0.24 | 0.45 | 0.50 | 0.47 | 0.24 | 423.0 | 99.4 | 0.24 | 0.06 | 0.00 | 0.46 |
| 33 | 0.09 | 0.37 | 0.46 | 0.45 | 0.27 | 280.0 | 21.6 | 0.08 | 0.06 | 0.00 | 0.47 |
| 34 | 0.10 | 0.43 | 0.46 | 0.49 | 0.25 | 768.0 | 56.0 | 0.07 | 0.04 | 0.00 | 0.48 |
| 35 | 0.20 | 0.46 | 0.48 | 0.50 | 0.19 | 474.0 | 86.9 | 0.18 | 0.07 | 0.01 | 0.50 |
| 36 | −0.07 | 0.27 | 0.39 | 0.42 | 0.15 | 488.0 | −38.5 | −0.08 | 0.05 | 0.00 | 0.45 |
| 37 | −0.02 | 0.28 | 0.35 | 0.45 | 0.17 | 450.0 | −15.4 | −0.03 | 0.08 | 0.01 | 0.46 |
| 38 | −0.03 | 0.20 | 0.31 | 0.38 | 0.08 | 530.0 | −22.5 | −0.04 | 0.04 | 0.00 | 0.40 |
| 39 | 0.15 | 0.42 | 0.42 | 0.34 | 0.11 | 479.0 | 68.8 | 0.14 | 0.09 | 0.01 | 0.42 |
| 40 | 0.13 | 0.40 | 0.40 | 0.36 | 0.10 | 405.0 | 48.0 | 0.12 | 0.09 | 0.01 | 0.44 |
| 41 | 0.02 | 0.31 | 0.40 | 0.43 | 0.18 | 591.0 | 1.9 | 0.00 | 0.04 | 0.00 | 0.44 |
| 42 | 0.04 | 0.30 | 0.34 | 0.40 | 0.11 | 502.0 | 11.7 | 0.02 | 0.06 | 0.00 | 0.40 |
| 43 | −0.09 | 0.19 | 0.31 | 0.45 | 0.30 | 763.0 | −82.3 | −0.11 | 0.03 | 0.00 | 0.42 |
| 44 | 0.05 | 0.38 | 0.41 | 0.47 | 0.23 | 564.0 | 9.5 | 0.02 | 0.04 | 0.00 | 0.47 |
| 45 | 0.06 | 0.38 | 0.43 | 0.43 | 0.11 | 1099.0 | 36.7 | 0.03 | 0.06 | 0.00 | 0.45 |
| 46 | 0.08 | 0.41 | 0.46 | 0.47 | 0.20 | 1036.0 | 62.0 | 0.06 | 0.06 | 0.00 | 0.49 |
| 47 | −0.01 | 0.20 | 0.22 | 0.33 | 0.08 | 287.0 | −3.4 | −0.01 | 0.06 | 0.00 | 0.35 |
| 48 | 0.09 | 0.31 | 0.38 | 0.40 | 0.12 | 357.0 | 28.8 | 0.08 | 0.08 | 0.01 | 0.43 |
| 49 | 0.11 | 0.40 | 0.43 | 0.46 | 0.18 | 415.0 | 38.8 | 0.09 | 0.06 | 0.00 | 0.47 |
| 50 | 0.00 | 0.32 | 0.36 | 0.44 | 0.26 | 267.0 | −7.0 | −0.03 | 0.02 | 0.00 | 0.43 |
| 51 | 0.06 | 0.33 | 0.39 | 0.43 | 0.13 | 482.0 | 25.4 | 0.05 | 0.07 | 0.00 | 0.44 |
| 52 | 0.07 | 0.41 | 0.48 | 0.49 | 0.27 | 761.0 | 29.2 | 0.04 | 0.06 | 0.00 | 0.49 |
| 53 | −0.07 | 0.24 | 0.37 | 0.49 | 0.30 | 464.0 | −37.1 | −0.08 | 0.05 | 0.00 | 0.46 |
| 54 | 0.28 | 0.48 | 0.54 | 0.52 | 0.35 | 284.0 | 80.6 | 0.28 | 0.09 | 0.01 | 0.53 |
| 55 | 0.11 | 0.35 | 0.43 | 0.46 | 0.18 | 292.0 | 28.9 | 0.10 | 0.08 | 0.01 | 0.48 |
| 56 | 0.05 | 0.35 | 0.41 | 0.44 | 0.18 | 150.0 | 5.0 | 0.03 | 0.06 | 0.00 | 0.45 |
| 57 | 0.13 | 0.43 | 0.49 | 0.50 | 0.25 | 518.0 | 56.5 | 0.11 | 0.07 | 0.00 | 0.49 |
| 58 | 0.06 | 0.39 | 0.45 | 0.46 | 0.24 | 588.0 | 26.0 | 0.04 | 0.07 | 0.00 | 0.47 |
| 59 | 0.08 | 0.37 | 0.41 | 0.43 | 0.19 | 618.0 | 33.3 | 0.05 | 0.04 | 0.00 | 0.43 |
| 60 | −0.10 | 0.09 | 0.18 | 0.36 | 0.05 | 627.0 | −66.5 | −0.11 | 0.02 | 0.00 | 0.38 |
| 61 | 0.04 | 0.32 | 0.36 | 0.41 | 0.08 | 486.0 | 4.2 | 0.01 | 0.04 | 0.00 | 0.43 |
| 62 | −0.02 | 0.26 | 0.37 | 0.41 | 0.09 | 761.0 | −17.2 | −0.02 | 0.05 | 0.00 | 0.42 |
| 63 | −0.09 | 0.28 | 0.31 | 0.43 | 0.18 | 421.0 | −46.1 | −0.11 | 0.03 | 0.00 | 0.41 |
| 64 | 0.11 | 0.40 | 0.46 | 0.44 | 0.17 | 458.0 | 53.2 | 0.12 | 0.04 | 0.00 | 0.45 |
| 65 | −0.05 | 0.09 | 0.16 | 0.28 | 0.15 | 754.0 | −40.9 | −0.05 | 0.05 | 0.00 | 0.31 |
| 66 | 0.19 | 0.37 | 0.42 | 0.41 | 0.07 | 519.0 | 99.6 | 0.19 | 0.11 | 0.01 | 0.46 |
| 67 | 0.07 | 0.42 | 0.48 | 0.48 | 0.27 | 503.0 | 21.5 | 0.04 | 0.05 | 0.00 | 0.48 |
| 68 | −0.09 | 0.25 | 0.33 | 0.43 | 0.16 | 566.0 | −57.9 | −0.10 | 0.05 | 0.00 | 0.43 |
| 69 | −0.11 | 0.05 | 0.21 | 0.43 | 0.17 | 442.0 | −51.1 | −0.12 | 0.09 | 0.01 | 0.43 |
| 70 | −0.04 | 0.30 | 0.35 | 0.46 | 0.20 | 407.0 | −12.6 | −0.03 | 0.07 | 0.01 | 0.45 |
| 71 | 0.05 | 0.42 | 0.48 | 0.45 | 0.15 | 466.0 | 11.1 | 0.02 | 0.04 | 0.00 | 0.46 |
| 72 | 0.00 | 0.33 | 0.39 | 0.47 | 0.21 | 491.0 | −17.1 | −0.03 | 0.04 | 0.00 | 0.46 |
| 73 | 0.13 | 0.39 | 0.42 | 0.40 | 0.09 | 306.0 | 39.1 | 0.13 | 0.06 | 0.00 | 0.44 |
| 74 | 0.13 | 0.42 | 0.45 | 0.42 | 0.10 | 253.0 | 32.3 | 0.13 | 0.06 | 0.00 | 0.47 |
| 75 | 0.31 | 0.37 | 0.36 | 0.29 | 0.04 | 487.0 | 156.2 | 0.32 | 0.12 | 0.02 | 0.39 |
| 76 | −0.05 | 0.15 | 0.22 | 0.24 | 0.16 | 605.0 | −37.9 | −0.06 | 0.05 | 0.00 | 0.30 |
| 77 | −0.12 | −0.01 | 0.14 | 0.44 | 0.19 | 256.0 | −31.5 | −0.12 | 0.03 | 0.00 | 0.41 |
| 78 | 0.02 | 0.30 | 0.36 | 0.41 | 0.07 | 476.0 | 9.3 | 0.02 | 0.05 | 0.00 | 0.43 |
| 79 | 0.04 | 0.22 | 0.23 | 0.33 | 0.08 | 378.0 | 17.1 | 0.05 | 0.08 | 0.01 | 0.32 |
| 80 | −0.12 | 0.11 | 0.30 | 0.35 | 0.12 | 347.0 | −46.1 | −0.13 | 0.05 | 0.00 | 0.37 |
| 81 | −0.02 | 0.21 | 0.23 | 0.29 | 0.09 | 307.0 | −10.9 | −0.04 | 0.04 | 0.00 | 0.30 |
| 82 | −0.02 | 0.22 | 0.32 | 0.31 | 0.04 | 671.0 | −19.3 | −0.03 | 0.04 | 0.00 | 0.36 |
| 83 | 0.09 | 0.41 | 0.43 | 0.39 | 0.09 | 426.0 | 26.9 | 0.06 | 0.07 | 0.00 | 0.43 |
| 84 | −0.04 | 0.27 | 0.29 | 0.35 | 0.06 | 239.0 | −11.0 | −0.05 | 0.03 | 0.00 | 0.36 |
| 85 | −0.03 | 0.16 | 0.20 | 0.26 | 0.00 | 506.0 | −17.7 | −0.04 | 0.09 | 0.01 | 0.30 |
| 86 | 0.08 | 0.42 | 0.45 | 0.49 | 0.20 | 450.0 | 24.1 | 0.05 | 0.06 | 0.00 | 0.48 |
| 87 | 0.04 | 0.35 | 0.37 | 0.42 | 0.16 | 368.0 | 5.1 | 0.01 | 0.05 | 0.00 | 0.40 |
| 88 | 0.04 | 0.37 | 0.44 | 0.48 | 0.23 | 485.0 | 0.8 | 0.00 | 0.05 | 0.00 | 0.47 |
| 89 | 0.03 | 0.26 | 0.30 | 0.43 | 0.15 | 343.0 | 3.0 | 0.01 | 0.04 | 0.00 | 0.43 |
| 90 | −0.04 | 0.22 | 0.32 | 0.43 | 0.18 | 863.0 | −49.0 | −0.06 | 0.06 | 0.00 | 0.42 |
| 91 | −0.08 | 0.11 | 0.17 | 0.38 | 0.12 | 282.0 | −28.0 | −0.10 | 0.04 | 0.00 | 0.37 |
| 92 | −0.10 | 0.11 | 0.22 | 0.41 | 0.14 | 387.0 | −38.6 | −0.10 | 0.04 | 0.00 | 0.40 |
| 93 | −0.11 | 0.04 | 0.14 | 0.36 | 0.15 | 302.0 | −32.1 | −0.11 | 0.04 | 0.00 | 0.34 |
| 94 | 0.15 | 0.37 | 0.40 | 0.41 | 0.14 | 432.0 | 60.1 | 0.14 | 0.09 | 0.01 | 0.42 |
| 95 | 0.05 | 0.41 | 0.44 | 0.49 | 0.10 | 430.0 | 10.8 | 0.03 | 0.06 | 0.00 | 0.50 |
| 96 | −0.11 | 0.06 | 0.16 | 0.37 | 0.15 | 316.0 | −39.2 | −0.12 | 0.05 | 0.00 | 0.36 |
| 97 | −0.09 | 0.14 | 0.30 | 0.37 | 0.10 | 402.0 | −36.6 | −0.09 | 0.03 | 0.00 | 0.40 |
| 98 | 0.08 | 0.42 | 0.48 | 0.49 | 0.24 | 438.0 | 25.5 | 0.06 | 0.06 | 0.00 | 0.49 |
| 99 | −0.08 | 0.17 | 0.24 | 0.39 | 0.14 | 469.0 | −42.2 | −0.09 | 0.05 | 0.00 | 0.39 |
| 100 | −0.02 | 0.29 | 0.37 | 0.43 | 0.19 | 428.0 | −11.7 | −0.03 | 0.05 | 0.00 | 0.44 |
| 101 | 0.05 | 0.34 | 0.39 | 0.47 | 0.13 | 361.0 | 18.1 | 0.05 | 0.08 | 0.01 | 0.47 |
| 102 | 0.11 | 0.40 | 0.42 | 0.43 | 0.07 | 485.0 | 45.2 | 0.09 | 0.08 | 0.01 | 0.45 |
| 103 | 0.04 | 0.36 | 0.43 | 0.47 | 0.12 | 450.0 | 11.2 | 0.02 | 0.05 | 0.00 | 0.48 |
| 104 | 0.01 | 0.34 | 0.41 | 0.46 | 0.20 | 465.0 | −1.8 | 0.00 | 0.06 | 0.00 | 0.44 |
| 105 | −0.04 | 0.17 | 0.23 | 0.31 | 0.07 | 424.0 | −22.3 | −0.05 | 0.03 | 0.00 | 0.32 |
| 106 | −0.09 | 0.05 | 0.12 | 0.34 | 0.04 | 453.0 | −42.9 | −0.09 | 0.04 | 0.00 | 0.32 |
| 107 | −0.05 | 0.19 | 0.23 | 0.36 | 0.07 | 711.0 | −49.6 | −0.07 | 0.03 | 0.00 | 0.37 |
| 108 | −0.07 | 0.22 | 0.30 | 0.44 | 0.30 | 453.0 | −31.7 | −0.07 | 0.03 | 0.00 | 0.42 |
| 109 | 0.04 | 0.29 | 0.38 | 0.42 | 0.27 | 405.0 | 9.5 | 0.02 | 0.07 | 0.00 | 0.44 |
| 110 | 0.16 | 0.42 | 0.45 | 0.43 | 0.27 | 467.0 | 70.1 | 0.15 | 0.07 | 0.01 | 0.45 |
| 111 | 0.02 | 0.31 | 0.42 | 0.45 | 0.25 | 554.0 | −2.8 | 0.00 | 0.07 | 0.00 | 0.47 |
| 112 | 0.02 | 0.26 | 0.36 | 0.33 | 0.14 | 284.0 | 4.8 | 0.02 | 0.06 | 0.00 | 0.41 |
| 113 | 0.06 | 0.35 | 0.37 | 0.32 | 0.02 | 305.0 | 17.6 | 0.06 | 0.07 | 0.01 | 0.37 |
| 114 | −0.02 | 0.19 | 0.30 | 0.45 | 0.14 | 407.0 | −13.5 | −0.03 | 0.05 | 0.00 | 0.45 |
| 115 | −0.08 | 0.16 | 0.31 | 0.38 | 0.12 | 785.0 | −67.0 | −0.09 | 0.03 | 0.00 | 0.41 |
| 116 | 0.04 | 0.33 | 0.40 | 0.44 | 0.18 | 684.0 | 13.2 | 0.02 | 0.06 | 0.00 | 0.44 |
| 117 | 0.04 | 0.33 | 0.37 | 0.35 | 0.08 | 345.0 | 9.5 | 0.03 | 0.06 | 0.00 | 0.38 |
| 118 | −0.14 | 0.14 | 0.34 | 0.48 | 0.25 | 228.0 | −35.0 | −0.15 | 0.02 | 0.00 | 0.46 |
| 119 | 0.07 | 0.30 | 0.36 | 0.41 | 0.16 | 353.0 | 20.7 | 0.06 | 0.05 | 0.00 | 0.42 |
| 120 | −0.08 | 0.23 | 0.32 | 0.39 | 0.08 | 298.0 | −26.5 | −0.09 | 0.04 | 0.00 | 0.42 |
| 121 | −0.04 | 0.28 | 0.33 | 0.43 | 0.15 | 138.0 | −8.9 | −0.06 | 0.02 | 0.00 | 0.43 |
| 122 | −0.02 | 0.23 | 0.32 | 0.39 | 0.07 | 432.0 | −14.7 | −0.03 | 0.04 | 0.00 | 0.41 |
| 123 | 0.00 | 0.14 | 0.17 | 0.38 | 0.21 | 236.0 | −2.4 | −0.01 | 0.05 | 0.00 | 0.35 |
| 124 | 0.05 | 0.35 | 0.43 | 0.46 | 0.24 | 717.0 | 14.7 | 0.02 | 0.05 | 0.00 | 0.45 |
| 125 | 0.05 | 0.31 | 0.39 | 0.42 | 0.16 | 119.0 | 3.8 | 0.03 | 0.09 | 0.01 | 0.46 |
| 126 | 0.00 | 0.31 | 0.40 | 0.37 | 0.13 | 646.0 | −10.5 | −0.02 | 0.03 | 0.00 | 0.45 |
| 127 | 0.06 | 0.35 | 0.40 | 0.43 | 0.14 | 191.0 | 7.3 | 0.04 | 0.04 | 0.00 | 0.46 |
| 128 | 0.06 | 0.34 | 0.39 | 0.39 | 0.10 | 213.0 | 7.5 | 0.04 | 0.05 | 0.00 | 0.39 |
| 129 | 0.04 | 0.37 | 0.35 | 0.42 | 0.20 | 493.0 | 3.2 | 0.01 | 0.05 | 0.00 | 0.46 |
| 130 | 0.05 | 0.31 | 0.39 | 0.39 | 0.10 | 500.0 | 15.0 | 0.03 | 0.06 | 0.00 | 0.46 |
| 131 | −0.05 | 0.32 | 0.40 | 0.39 | 0.08 | 199.0 | −14.2 | −0.07 | 0.05 | 0.00 | 0.41 |
| 132 | 0.08 | 0.35 | 0.46 | 0.43 | 0.25 | 458.0 | 35.8 | 0.08 | 0.13 | 0.02 | 0.47 |
| 133 | −0.05 | 0.14 | 0.25 | 0.35 | 0.09 | 230.0 | −9.5 | −0.04 | 0.04 | 0.00 | 0.36 |
| 134 | −0.10 | 0.12 | 0.24 | 0.33 | 0.06 | 269.0 | −26.7 | −0.10 | 0.03 | 0.00 | 0.35 |
| 135 | −0.10 | 0.15 | 0.29 | 0.41 | 0.08 | 236.0 | −24.2 | −0.10 | 0.02 | 0.00 | 0.44 |
| 136 | 0.08 | 0.39 | 0.42 | 0.44 | 0.10 | 324.0 | 16.6 | 0.05 | 0.08 | 0.01 | 0.47 |
| 137 | 0.09 | 0.39 | 0.45 | 0.42 | 0.06 | 354.0 | 20.4 | 0.06 | 0.05 | 0.00 | 0.48 |
| 138 | 0.00 | 0.24 | 0.36 | 0.42 | 0.25 | 233.0 | −4.0 | −0.02 | 0.04 | 0.00 | 0.48 |
| 139 | −0.03 | 0.24 | 0.30 | 0.34 | 0.05 | 297.0 | −9.8 | −0.03 | 0.06 | 0.00 | 0.38 |
| 140 | 0.09 | 0.33 | 0.37 | 0.40 | 0.10 | 288.0 | 23.7 | 0.08 | 0.07 | 0.00 | 0.41 |
| 141 | −0.10 | 0.04 | 0.16 | 0.38 | 0.15 | 240.0 | −28.2 | −0.12 | 0.07 | 0.00 | 0.34 |
| 142 | −0.04 | 0.16 | 0.24 | 0.29 | 0.10 | 770.0 | −36.6 | −0.05 | 0.05 | 0.00 | 0.32 |
| 143 | 0.06 | 0.37 | 0.43 | 0.45 | 0.16 | 268.0 | 11.4 | 0.04 | 0.04 | 0.00 | 0.46 |
References
- Ghazaryan, G.; König, S.; Rezaei, E.E.; Siebert, S.; Dubovyk, O. Analysis of Drought Impact on Croplands from Global to Regional Scale: A Remote Sensing Approach. Remote Sens. 2020, 12, 4030. [Google Scholar] [CrossRef]
- Ministry of Agriculture and Water Resources. Review of the Agricultural Sector in the Kurdistan Region of Iraq: Analysis on Crops, Water Resources And Irrigation, and Selected Value Chains; Annual Report; Ministry of Agriculture and Water Resources: Erbil, Iraq, 2019. [Google Scholar]
- Yousuf, M.A.; Rapantova, N.; Younis, J.H. Sustainable Water Management in Iraq (Kurdistan) as a Challenge for Governmental Responsibility. Water 2018, 10, 1651. [Google Scholar] [CrossRef]
- Dong, J.; Liu, W.; Han, W.; Xiang, K.; Lei, T.; Yuan, W. A Phenology-Based Method for Identifying the Planting Fraction of Winter Wheat Using Moderate-Resolution Satellite Data. Int. J. Remote Sens. 2020, 41, 6892–6913. [Google Scholar] [CrossRef]
- Jin, X.; Kumar, L.; Li, Z.; Xu, X.; Yang, G.; Wang, J. Estimation of Winter Wheat Biomass and Yield by Combining the Aquacrop Model and Field Hyperspectral Data. Remote Sens. 2016, 8, 972. [Google Scholar] [CrossRef]
- Van Dam, J.C.; Singh, R.; Bessembinder, J.J.E.; Leffelaar, P.A.; Bastiaanssen, W.G.M.; Jhorar, R.K.; Kroes, J.G.; Droogers, P. Assessing Options to Increase Water Productivity in Irrigated River Basins Using Remote Sensing and Modelling Tools. Int. J. Water Resour. Dev. 2006, 22, 115–133. [Google Scholar] [CrossRef]
- Kamal, K.; Hakzi, A. Spatiotemporal Variation of Wheat Yield and Water Productivity in Centre Pivot Irrigation Systems. Master’s Thesis, IHE Delft Institute for Water Education, Delft, The Netherlands, 2022. [Google Scholar]
- FAO; WFP. Dates, Grapes, Tomatoes and Wheat; Food and Agriculture Organization: Rome, Italy, 2021; ISBN 9789251336342. [Google Scholar]
- Huang, J.; Sedano, F.; Huang, Y.; Ma, H.; Li, X.; Liang, S.; Tian, L.; Zhang, X.; Fan, J.; Wu, W. Assimilating a Synthetic Kalman Filter Leaf Area Index Series into the WOFOST Model to Improve Regional Winter Wheat Yield Estimation. Agric. For. Meteorol. 2016, 216, 188–202. [Google Scholar] [CrossRef]
- Morel, J.; Bégué, A.; Todoroff, P.; Martiné, J.-F.; Lebourgeois, V.; Petit, M. Coupling a Sugarcane Crop Model with the Remotely Sensed Time Series of FIPAR to Optimise the Yield Estimation. Eur. J. Agron. 2014, 61, 60–68. [Google Scholar] [CrossRef]
- FAO; IHE Delft. Water Accounting in the Jordan River Basin, Remote Sensing for Water Productivity; Food and Agriculture Organization: Rome, Italy, 2020; ISBN 9789251326619. [Google Scholar]
- Nichols, P.D.; Murphy, M.K.; Kenney, D.S. Water and Growth in Colorado; Natural Resources Law Center: Boulder, CO, USA, 2021; ISBN 1045021091. [Google Scholar]
- International Organization for Migration. All Small Scale Irrigation Infrastructure Development in Iraq: A Feasibility Review; International Organization for Migration: Grand-Saconnex, Switzerland, 2022. [Google Scholar]
- Schnepf, R. Iraq Agriculture and Food Supply: Background and Issues. CRS Rep. Congr. 2004, 57, 62. [Google Scholar]
- Bastiaanssen, W.G.M.; Molden, D.J.; Makin, I.W. Remote Sensing for Irrigated Agriculture: Examples from Research and Possible Applications. Agric. Water Manag. 2000, 46, 137–155. [Google Scholar] [CrossRef]
- FAO; IHE Delft. WaPOR Quality Assessment; Food and Agriculture Organization: Rome, Italy, 2019; ISBN 9789251315354. [Google Scholar]
- Jaradat, A. Agriculture in Iraq: Resources, Potentials, Constraints, Research Needs and Priorities. Agriculture 2003, 1, 160–166. [Google Scholar]
- Cooper, B.P.J.M.; Gregoryf, P.J.; Tully, D.; Harris, H.C.; August, A. Improving water use efficiency of annual crops in the rainfed farming systems of west asia and north africa. Exp. Agric. 1987, 23, 113–158. [Google Scholar] [CrossRef]
- Jin, X.; Yang, G.; Li, Z.; Xu, X.; Wang, J.; Lan, Y. Estimation of Water Productivity in Winter Wheat Using the AquaCrop Model with Field Hyperspectral Data. Precis. Agric. 2018, 19, 1–17. [Google Scholar] [CrossRef]
- Awchi, T.A.; Jasim, A.I. Rainfall Data Analysis and Study of Meteorological Draught in Iraq for the Period 1970–2010. Tikrit J. Eng. Sci. 2017, 24, 110–121. [Google Scholar] [CrossRef]
- Gaznayee, H.A.A.; Al-Quraishi, A.M.F.; Mahdi, K.; Ritsema, C. A Geospatial Approach for Analysis of Drought Impacts on Vegetation Cover and Land Surface Temperature in the Kurdistan Region of Iraq. Water 2022, 14, 927. [Google Scholar] [CrossRef]
- Al-Quraishi, A.M.F.; Gaznayee, H.A.; Crespi, M. Drought Trend Analysis in a Semi-Arid Area of Iraq Based on Normalized Difference Vegetation Index, Normalized Difference Water Index and Standardized Precipitation Index. J. Arid Land 2021, 13, 413–430. [Google Scholar] [CrossRef]
- Namdar, R.; Karami, E.; Keshavarz, M. Climate Change and Vulnerability: The Case of Mena Countries. ISPRS Int. J. Geo-Inf. 2021, 10, 794. [Google Scholar] [CrossRef]
- Ahmad, M.D.; Turral, H.; Nazeer, A. Diagnosing Irrigation Performance and Water Productivity through Satellite Remote Sensing and Secondary Data in a Large Irrigation System of Pakistan. Agric. Water Manag. 2009, 96, 551–564. [Google Scholar] [CrossRef]
- Polinova, M.; Salinas, K.; Bonfante, A.; Brook, A. Irrigation Optimization under a Limited Water Supply by the Integration of Modern Approaches into Traditional Water Management on the Cotton Fields. Remote Sens. 2019, 11, 2127. [Google Scholar] [CrossRef]
- Mustafa, M.T.; Hassoon, K.I.; Hussain, H.M.; Modher, H. Using Water Indices (Ndwi, Mndwi, Ndmi, Wri and Awei) to Detect Physical and Chemical Parameters by Apply. Int. J. Res.-Granthaalayah 2017, 5, 117–128. [Google Scholar] [CrossRef]
- Elbeltagi, A.; Aslam, M.R.; Mokhtar, A.; Deb, P.; Abubakar, G.A.; Kushwaha, N.L.; Venancio, L.P.; Malik, A.; Kumar, N.; Deng, J. Spatial and Temporal Variability Analysis of Green and Blue Evapotranspiration of Wheat in the Egyptian Nile Delta from 1997 to 2017. J. Hydrol. 2021, 594, 125662. [Google Scholar] [CrossRef]
- Gaznayee, H.A.; Al-Quraishi, A.M.F. Analysis of Agricultural Drought’s Severity and Impacts in Erbil Province, the Iraqi Kurdistan Region Based on Time Series NDVI and TCI Indices for 1998 through 2017. J. Adv. Res. Dyn. Control Syst. 2019, 11, 287–297. [Google Scholar] [CrossRef]
- Wan, Z.; Wang, P. Using MODIS Land Surface Temperature and Normalized Difference Vegetation Index Products for Monitoring Drought in the Southern Great Plains, USA. Int. J. Remote Sens. 2004, 25, 61–72. [Google Scholar] [CrossRef]
- Heydari, H.; Zoej, M.J.V.; Maghsoudi, Y.; Dehnavi, S. An Investigation of Drought Prediction Using Various Remote-Sensing Vegetation Indices for Different Time Spans. Int. J. Remote Sens. 2018, 39, 1871–1889. [Google Scholar] [CrossRef]
- Qader, S.H.; Dash, J.; Atkinson, P.M. Forecasting Wheat and Barley Crop Production in Arid and Semi-Arid Regions Using Remotely Sensed Primary Productivity and Crop Phenology: A Case Study in Iraq. Sci. Total Environ. 2018, 613–614, 250–262. [Google Scholar] [CrossRef] [PubMed]
- Jaafar, H.H.; Ahmad, F.A. Crop Yield Prediction from Remotely Sensed Vegetation Indices and Primary Productivity in Arid and Semi-Arid Lands. Int. J. Remote Sens. 2015, 36, 4570–4589. [Google Scholar] [CrossRef]
- Bolton, D.K.; Friedl, M.A. Forecasting Crop Yield Using Remotely Sensed Vegetation Indices and Crop Phenology Metrics. Agric. For. Meteorol. 2013, 173, 74–84. [Google Scholar] [CrossRef]
- Ghazaryan, G.; Dubovyk, O.; Graw, V.; Kussul, N.; Schellberg, J. Local-Scale Agricultural Drought Monitoring with Satellite-Based Multi-Sensor Time-Series. GIScience Remote Sens. 2020, 57, 704–718. [Google Scholar] [CrossRef]
- Das, A.C.; Noguchi, R.; Ahamed, T. An Assessment of Drought Stress in Tea Estates Using Optical and Thermal Remote Sensing. Remote Sens. 2021, 13, 2730. [Google Scholar] [CrossRef]
- AlJawa, S.B.; Al-Ansari, N. Open Access Online Journal of the International Association for Environmental Hydrology assessment of groundwater quality using. Groundw. Qual. Using 2017, 26, 1–14. [Google Scholar]
- Al-quraishi, A.M.F.; Negm, A.M. Environmental Remote Sensing and GIS in Iraq; Springer: Berlin/Heidelberg, Germany, 2019; ISBN 9783030213435. [Google Scholar]
- Phiri, D.; Simwanda, M.; Salekin, S.; Nyirenda, V.R.; Murayama, Y.; Ranagalage, M. Sentinel-2 Data for Land Cover/Use Mapping: A Review. Remote Sens. 2020, 12, 2291. [Google Scholar] [CrossRef]
- Mahdianpari, M.; Salehi, B.; Mohammadimanesh, F.; Homayouni, S.; Gill, E. The First Wetland Inventory Map of Newfoundland at a Spatial Resolution of 10 m Using Sentinel-1 and Sentinel-2 Data on the Google Earth Engine Cloud Computing Platform. Remote Sens. 2019, 11, 43. [Google Scholar] [CrossRef]
- Yengoh, G.T.; Dent, D.; Olsson, L.; Tengberg, A.E.; Tucker, C.J. Use of the Normalized Difference Vegetation Index (NDVI) to Assess Land Degradation at Multiple Scaless: A Review of the Current Status, Future Trends, and Practical Considerations; Springer: Berlin/Heidelberg, Germany, 2014; ISBN 978-3-319-24110-4. [Google Scholar]
- Hunt, E.R.; Rock, B.N. Detection of Changes in Leaf Water Content Using Near- and Middle-Infrared Reflectances. Remote Sens. Environ. 1989, 30, 43–54. [Google Scholar] [CrossRef]
- Anderson, R.G.; French, A.N. Crop Evapotranspiration. Agronomy 2019, 9, 614. [Google Scholar] [CrossRef]
- Kharrou, M.H.; Simonneaux, V.; Er-raki, S.; Page, M.L.; Khabba, S.; Chehbouni, A. Assessing Irrigation Water Use with Remote Sensing-based Soil Water Balance at an Irrigation Scheme Level in a Semi-arid Region of Morocco. Remote Sens. 2021, 13, 1133. [Google Scholar] [CrossRef]
- Anyamba, A.; Tucker, C.J. Historical Perspectives on AVHRR NDVI and Vegetation Drought Monitoring. Remote Sens. Drought Innov. Monit. Approaches 2012, 23, 20. [Google Scholar] [CrossRef]
- Mukherjee, A.; Wang, S.Y.S.; Promchote, P. Examination of the Climate Factors That Reduced Wheat Yield in Northwest India during the 2000s. Water 2019, 11, 343. [Google Scholar] [CrossRef]
- Aquino, D.d.N.; Neto, O.C.d.R.; Moreira, M.A.; Teixeira, A.d.S.; de Andrade, E.M. Use of Remote Sensing to Identify Areas at Risk of Degradation in the Semi-Arid Region. Rev. Cienc. Agron. 2018, 49, 420–429. [Google Scholar] [CrossRef]
- Pedro-Monzonís, M.; Solera, A.; Ferrer, J.; Estrela, T.; Paredes-Arquiola, J. A Review of Water Scarcity and Drought Indexes in Water Resources Planning and Management. J. Hydrol. 2015, 527, 482–493. [Google Scholar] [CrossRef]
- Maimaitijiang, M.; Sagan, V.; Sidike, P.; Hartling, S.; Esposito, F.; Fritschi, F.B. Soybean Yield Prediction from UAV Using Multimodal Data Fusion and Deep Learning. Remote Sens. Environ. 2020, 237, 111599. [Google Scholar] [CrossRef]
- Taghvaeian, S.; Neale, C.M.U.; Osterberg, J.C.; Sritharan, S.I.; Watts, D.R. Remote Sensing and GIS Techniques for Assessing Irrigation Performance: Case Study in Southern California. J. Irrig. Drain. Eng. 2018, 144, 05018002. [Google Scholar] [CrossRef]
- Elmetwalli, A.H.; Mazrou, Y.S.A.; Tyler, A.N.; Hunter, P.D.; Elsherbiny, O.; Yaseen, Z.M.; Elsayed, S. Assessing the Efficiency of Remote Sensing and Machine Learning Algorithms to Quantify Wheat Characteristics in the Nile Delta Region of Egypt. Agriculture 2022, 12, 332. [Google Scholar] [CrossRef]
- Ali, M.H. Practices of Irrigation & On-Farm Water Management: Volume 2; Springer Science & Business Media: Berlin/Heidelberg, Germany, 2011; ISBN 9781441976369. [Google Scholar]
- Abuzar, M.; Whitfield, D.; McAllister, A.; Sheffield, K. Application of ET-NDVI-Relationship Approach and Soil-Water-Balance Modelling for the Monitoring of Irrigation Performance of Treed Horticulture Crops in a Key Fruit-Growing District of Australia. Int. J. Remote Sens. 2019, 40, 4724–4742. [Google Scholar] [CrossRef]
- Mahmoud, S.H.; Gan, T.Y. Irrigation Water Management in Arid Regions of Middle East: Assessing Spatio-Temporal Variation of Actual Evapotranspiration through Remote Sensing Techniques and Meteorological Data. Agric. Water Manag. 2019, 212, 35–47. [Google Scholar] [CrossRef]
- Gadédjisso-Tossou, A.; Avellán, T.; Schütze, N. Potential of Deficit and Supplemental Irrigation under Climate Variability in Northern Togo, West Africa. Water 2018, 10, 1803. [Google Scholar] [CrossRef]
- Ma, C.; Johansen, K.; McCabe, M.F. Monitoring Irrigation Events and Crop Dynamics Using Sentinel-1 and Sentinel-2 Time Series. Remote Sens. 2022, 14, 1205. [Google Scholar] [CrossRef]
- Karamage, F.; Zhang, C.; Fang, X.; Liu, T.; Ndayisaba, F.; Nahayo, L.; Kayiranga, A.; Nsengiyumva, J.B. Modeling Rainfall-Runoffresponse to Land Use and Land Cover Change in Rwanda (1990–2016). Water 2017, 9, 147. [Google Scholar] [CrossRef]
- Armitage, F.B. Irrigated Forestry in Arid and Semi-Arid Lands: A Synthesis; IDRC: Ottawa, ON, USA, 1986; Volume 61, ISBN 088936432X. [Google Scholar]
- Nouri, H.; Beecham, S.; Anderson, S.; Nagler, P. High Spatial Resolution WorldView-2 Imagery for Mapping NDVI and Its Relationship to Temporal Urban Landscape Evapotranspiration Factors. Remote Sens. 2013, 6, 580–602. [Google Scholar] [CrossRef]
- Moran, M.S.; Clarke, T.R.; Inoue, Y.; Vidal, A. Estimating Crop Water Deficit Using the Relation between Surface-Air Temperature and Spectral Vegetation Index. Remote Sens. Environ. 1994, 49, 246–263. [Google Scholar] [CrossRef]
- Bryla, D.R. Crop evapotranspiration and irrigation scheduling in blueberry. In Evapotranspiration—From Measurements to Agricultural and Environmental Applications; Intech: Rijeka, Croatia, 2011; pp. 167–186. [Google Scholar]


| Vegetation Classes | 1-Jan-21 | 6-Jan-21 | 11-Jan-21 | 26-Jan-21 | 15-Feb-21 | 25-Feb-21 | 7-Mar-21 | 1-Apr-21 |
|---|---|---|---|---|---|---|---|---|
| DENSE | 0.60–1.00 | 0.60–1.00 | 0.60–1.00 | 0.60–1.00 | 0.60–1.00 | 0.60–1.00 | 0.60–1.00 | 0.60–1.00 |
| Area/ha | 174.49 | 386.00 | 372.47 | 549.33 | 3191.68 | 4536 | 5334.15 | 6028.25 |
| MODERATE | 0.40–0.60 | 0.40–0.60 | 0.40–0.60 | 0.40–0.60 | 0.40–0.60 | 0.40–0.60 | 0.40–0.60 | 0.40–0.60 |
| Area/ha | 411.69 | 1294.53 | 1171.53 | 2028.78 | 3269.82 | 3154.02 | 3043.28 | 2296.82 |
| SPARCE | 0.20–0.40 | 0.20–0.40 | 0.20–0.40 | 0.20–0.40 | 0.20–0.40 | 0.20–0.40 | 0.20–0.40 | 0.20–0.40 |
| Area/ha | 3601.15 | 5261.86 | 4639.91 | 4554.1 | 2880.12 | 1410.72 | 1161.43 | 762.6 |
| OPEN SOIL | −1.00–0.20 | −1.00–0.20 | −1.00–0.20 | −1.00–0.20 | −1.00–0.20 | −1.00–0.20 | −1.00–0.20 | −1.00–0.20 |
| Area/ha | 5055.9 | 3031.05 | 3182.37 | 1495.82 | 664.35 | 542.26 | 443.31 | 481.79 |
| Vegetation Classes | 11-Apr-21 | 16-Apr-21 | 21-Apr-21 | 1-May-21 | 6-May-21 | 11-May-21 | 16-May-21 | 21-May-21 |
| DENSE | 0.60–1.00 | 0.60–1.00 | 0.60–1.00 | 0.60–1.00 | 0.60–1.00 | 0.60–1.00 | 0.60–1.00 | 0.60–1.00 |
| Area/ha | 3850.27 | 3327.33 | 2362.02 | 1789.78 | 1702.87 | 801.12 | 171.77 | 58.61 |
| MODERATE | 0.40–0.60 | 0.40–0.60 | 0.40–0.60 | 0.40–0.60 | 0.40–0.60 | 0.40–0.60 | 0.40–0.60 | 0.40–0.60 |
| Area/ha | 2825.15 | 1535.55 | 1229.22 | 295.54 | 708.61 | 1184.93 | 409.53 | 126.65 |
| SPASE | 0.20–0.40 | 0.20–0.40 | 0.20–0.40 | 0.20–0.40 | 0.20–0.40 | 0.20–0.40 | 0.20–0.40 | 0.20–0.40 |
| Area/ha | 2787.42 | 3660.23 | 4406.41 | 919.25 | 1600.48 | 2179.02 | 2961.71 | 2577.09 |
| OPEN SOIL | −1.00–0.20 | −1.00–0.20 | −1.00–0.20 | −1.00–0.20 | −1.00–0.20 | −1.00–0.20 | −1.00–0.20 | −1.00–0.20 |
| Area/ha | 442.22 | 626 | 763.32 | 1662.93 | 4208.1 | 5691.78 | 6222.15 | 7201.58 |
| NDMI Classes | 1-Jan-21 | 6-Jan-21 | 11-Jan-21 | 26-Jan-21 | 15-Feb-21 | 25-Feb-21 | 7-Mar-21 | 1-Apr-21 |
|---|---|---|---|---|---|---|---|---|
| HIGH Area/ha | 0.50–1.00 | 0.50–1.00 | 0.50–1.00 | 0.50–1.00 | 0.50–1.00 | 0.50–1.00 | 0.50–1.00 | 0.50–1.00 |
| 0.28 | 1.68 | 3.72 | 0.04 | 65.96 | 115.88 | 239.64 | 337.28 | |
| MODERATE Area/ha | 0.30–0.50 | 0.30–0.50 | 0.30–0.50 | 0.30–0.50 | 0.30–0.50 | 0.30–0.50 | 0.30–0.50 | 0.30–0.50 |
| 63.12 | 90.56 | 95.48 | 184.76 | 1618.2 | 2329.76 | 2961.12 | 3515.56 | |
| LOW Area/ha | 0.10–0.30 | 0.10–0.30 | 0.10–0.30 | 0.10–0.30 | 0.10–0.30 | 0.10–0.30 | 0.10–0.30 | 0.10–0.30 |
| 354.76 | 667.24 | 779.72 | 1700.92 | 3576.84 | 4301.56 | 4486.52 | 4859.68 | |
| OPEN SOIL Area/ha | 0.00–−1.00 | 0.00–−1.00 | 0.00–−1.00 | 0.00–−1.00 | 0.00–−1.00 | 0.00–−1.00 | 0.00–−1.00 | 0.00–−1.00 |
| 9563.54 | 9250.72 | 7202.48 | 3567.1 | 4781.4 | 3066.52 | 2331.81 | 921.62 | |
| NDMI Classes | 11-Apr-21 | 16-Apr-21 | 21-Apr-21 | 1-May-21 | 6-May-21 | 11-May-21 | 16-May-21 | 21-May-21 |
| HIGH Area/ha | 0.50–1.00 | 0.50–1.00 | 0.50–1.00 | 0.50–1.00 | 0.50–1.00 | 0.50–1.00 | 0.50–1.00 | 0.50–1.00 |
| 877.52 | 979.24 | 5.12 | 367.44 | 37.7 | 5.48 | 2.52 | 1.84 | |
| MODERATE Area/ha | 0.30–0.50 | 0.30–0.50 | 0.30–0.50 | 0.30–0.50 | 0.30–0.50 | 0.30–0.50 | 0.30–0.50 | 0.30–0.50 |
| 2616.08 | 2125.84 | 2313.64 | 1187.68 | 1005.96 | 594.6 | 86.76 | 40.36 | |
| LOW Area/ha | 0.10–0.30 | 0.10–0.30 | 0.10–0.30 | 0.10–0.30 | 0.10–0.30 | 0.10–0.30 | 0.10–0.30 | 0.10–0.30 |
| 3554.6 | 1700.84 | 1850.08 | 1024.64 | 1647.48 | 1840.68 | 361.7 | 489.92 | |
| OPEN SOIL Area/ha | 0.00–−1.00 | 0.00–−1.00 | 0.00–−1.00 | 0.00–−1.00 | 0.00–−1.00 | 0.00–−1.00 | 0.00–−1.00 | 0.00–−1.00 |
| 2968.74 | 3588.14 | 4579.58 | 671.2 | 5759.16 | 2529.62 | 8867.86 | 9504.2 |
| Irrigation/h/mm | |||||||||||
|---|---|---|---|---|---|---|---|---|---|---|---|
| Location | Longitude | Latitude | Yield Kg/ Hectare | January | February | March | April | May | Total/ Hours | Mm/ Hours | Mm/ Season |
| 1 | 43.96674 | 36.35929 | 3120 | 24 | 48 | 72 | 72 | 18 | 234 | 2.1 | 491.4 |
| 2 | 43.96334 | 36.36667 | 3400 | 36 | 48 | 86 | 72 | 18 | 260 | 2.1 | 546.0 |
| 3 | 43.96235 | 36.37074 | 3320 | 24 | 36 | 72 | 72 | 12 | 216 | 2.1 | 453.6 |
| 4 | 43.96983 | 36.37265 | 2960 | 24 | 48 | 72 | 72 | 12 | 228 | 2.1 | 478.8 |
| 5 | 43.97896 | 36.37460 | 3520 | 36 | 48 | 96 | 96 | 6 | 282 | 2.1 | 592.2 |
| 6 | 43.98112 | 36.36880 | 3360 | 24 | 48 | 72 | 80 | 6 | 230 | 2.1 | 483.0 |
| 7 | 43.98278 | 36.36585 | 3400 | 12 | 48 | 72 | 72 | 12 | 216 | 2.1 | 453.6 |
| 8 | 43.97472 | 36.37033 | 3400 | 12 | 36 | 72 | 80 | 12 | 212 | 2.1 | 445.2 |
| 9 | 43.97036 | 36.36933 | 3800 | 24 | 48 | 72 | 72 | 12 | 228 | 2.1 | 478.8 |
| 10 | 43.97635 | 36.36438 | 4800 | 24 | 48 | 96 | 96 | 12 | 276 | 2.1 | 579.6 |
| 11 | 43.97226 | 36.36283 | 3520 | 18 | 36 | 72 | 80 | 6 | 212 | 2.1 | 445.2 |
| 12 | 43.97428 | 36.36111 | 4400 | 24 | 48 | 72 | 96 | 24 | 264 | 2.1 | 554.4 |
| 13 | 43.95905 | 36.28151 | 5000 | 24 | 48 | 76 | 96 | 12 | 256 | 2.1 | 537.6 |
| 14 | 43.97158 | 36.28487 | 4800 | 36 | 48 | 76 | 96 | 18 | 274 | 2.1 | 575.4 |
Disclaimer/Publisher’s Note: The statements, opinions and data contained in all publications are solely those of the individual author(s) and contributor(s) and not of MDPI and/or the editor(s). MDPI and/or the editor(s) disclaim responsibility for any injury to people or property resulting from any ideas, methods, instructions or products referred to in the content. |
© 2023 by the authors. Licensee MDPI, Basel, Switzerland. This article is an open access article distributed under the terms and conditions of the Creative Commons Attribution (CC BY) license (https://creativecommons.org/licenses/by/4.0/).
Share and Cite
Gaznayee, H.A.A.; Zaki, S.H.; Al-Quraishi, A.M.F.; Aliehsan, P.H.; Hakzi, K.K.; Razvanchy, H.A.S.; Riksen, M.; Mahdi, K. Integrating Remote Sensing Techniques and Meteorological Data to Assess the Ideal Irrigation System Performance Scenarios for Improving Crop Productivity. Water 2023, 15, 1605. https://doi.org/10.3390/w15081605
Gaznayee HAA, Zaki SH, Al-Quraishi AMF, Aliehsan PH, Hakzi KK, Razvanchy HAS, Riksen M, Mahdi K. Integrating Remote Sensing Techniques and Meteorological Data to Assess the Ideal Irrigation System Performance Scenarios for Improving Crop Productivity. Water. 2023; 15(8):1605. https://doi.org/10.3390/w15081605
Chicago/Turabian StyleGaznayee, Heman Abdulkhaleq A., Sara H. Zaki, Ayad M. Fadhil Al-Quraishi, Payman Hussein Aliehsan, Kawa K. Hakzi, Hawar Abdulrzaq S. Razvanchy, Michel Riksen, and Karrar Mahdi. 2023. "Integrating Remote Sensing Techniques and Meteorological Data to Assess the Ideal Irrigation System Performance Scenarios for Improving Crop Productivity" Water 15, no. 8: 1605. https://doi.org/10.3390/w15081605