
Influence of Radial Installation Deviation on Hydraulic Thrust Characteristics of a 1000 MW Francis Turbine
by
 , , ,
, , ,
Yifan Wang
1 ,
,
Kun Jin
2,
Xingxing Huang
3 ,
,
Peng Lin
2,
Zhengwei Wang
4,*,
Wenliang Wang
2 and
Lingjiu Zhou
1 1
College of Water Resources and Civil Engineering, China Agricultural University, Beijing 100083, China
2
Baihetan Engineering Construction Department, China Three Gorges Construction Engineering Corporation, Chengdu 610041, China
3
S.C.I. Energy, Future Energy Research Institute, Seidengasse 17, 8706 Zurich, Switzerland
4
State Key Laboratory of Hydroscience and Engineering, Department of Energy and Power Engineering, Tsinghua University, Beijing 100084, China
*
Author to whom correspondence should be addressed.
Water 2023, 15(8), 1606; https://doi.org/10.3390/w15081606
Submission received: 18 February 2023
/
Revised: 6 April 2023
/
Accepted: 7 April 2023
/
Published: 20 April 2023
(This article belongs to the Topic Advanced Technology of Full Lifecycle Service for Hydraulic Machinery)
Abstract
:In this paper, a 1000 MW Francis turbine was used to study the influences of uneven clearance distribution caused by various radial installation deviations on the hydraulic thrust of a runner under the rated operating condition with steady-state CFD analysis. Then, the influences of radial installation deviation on the pressure pulsations of the runner and the fluid domains most affected by the deviation were investigated via unsteady CFD calculation. The results show that the radial hydraulic force on the chambers increased linearly with the increase in the radial installation deviation. Additionally, the high-pressure zone was not located in the same position as the radial deviation. With increasing values of the radial installation deviation, the high-pressure zone rotated along the opposite direction of the rotating direction of the runner. This study also found that the flow in the upper crown chamber was most affected by radial installation deviation and that the percentage of high frequencies of the pressure pulsations increased with the flow in the clearances.
1. Introduction
In recent years, with the increasing capacity and size of large Francis turbines, problems such as serious vibration and blade cracks have appeared in different turbines during operation. In particular, the vibration, resonance, and strong noise of the turbine unit caused by pressure pulsation of the high partial load directly endanger the safe operation of the power station. As a result, the problem of water pressure stability has attracted a great deal of attention from power station owners and manufacturing industries [1]. The reason for this phenomenon is the presence of clearances in the fluid domain that are casued by different reasons, especially installation deviations.
The runner clearance connecting the vaneless zone to the crown chamber and the bottom ring chamber makes the hydraulic characteristics of the vaneless zone have a strong correlation with the hydraulic characteristics of the crown chamber and the bottom ring chamber [2]. The installation deviations change clearance size, which can affect the flow characteristics around the turbine runner [3]. The change in flow characteristics around the runner may lead to power swings, strong structural vibrations, and fatigue failure, and these phenomena influence the safe and stable operation of the power station [4].
Shao et al. [5] studied the structural vibration characteristics induced by the uneven clearance of the labyrinth ring of the turbine runner and pointed out that the uneven distribution of the clearance structure has a great influence on the vibration of the whole unit structure. They found that the vibration direction and amplitude are both related to the internal pressure of the clearance. Zhou et al. [6] gave regular changes to a turbine leakage and cavity pressure under the condition of different seal clearance sizes and different parameters of the drain holes, and they also pointed out that their research can provide a certain reference for the size of the seal clearance and the determination of the parameters of the drain holes. Feng et al. [7,8] pointed out that, under the premise of optimal unit speed and the removal of disc loss, the turbine efficiency obtained by numerical simulation was consistent with model test results. In the non-optimal working condition area, there are a large number of vortices and shedding in the flow field of the calculation domain, and the efficiency obtained by numerical simulation is lower than that of the model test.
More fundamentally, the influence of uneven flow in the clearance on the force of the runner and other components can be summed up as axial force and radial force. The axial force of hydraulic machinery is generally composed of the mass of the rotating part, the buoyancy force of the water on the runner, the axial force on the blade during the operation of hydraulic machinery, the hydrostatic force at the shaft end, the axial force formed by the crown chamber and bottom ring chamber under the action of water pressure, etc. [3]. Radial water thrust is mainly divided into frequency radial force and other radial forces. The reasons for the frequency radial force include the unbalanced force of the runner mass, the hydraulic imbalance force caused by the uneven distribution of water in the inner cavity of the runner, the hydraulic imbalance force formed by the inconsistent blade profile and installation angle, and the different dynamic deformations of the blade [5]. The frequency radial force is the main factor that causes shaft partial wear and uniform wear of the bearing bush. Other factors, such as the radial force with a fixed direction caused by the asymmetry of the inlet and outlet flow of the runner, cause uniform wear of the shaft and partial wear of the bearing bush.
In terms of axial force, You et al. [9] established a mathematical model of axial force prediction for a pump turbine based on theories and empirical formulas, and they analyzed the axial force characteristics of the unit. Wang et al. [10] believed that the water flow rotation speed was half of the runner speed and should not be adopted in the calculation of axial water thrust. In addition, it has been proven that using CFD to calculate the axial water thrust is feasible and can play a good role in structural design. In addition, Anderson [11], Weidong Shi [12], and Zhou et al. [13] also proved that the application of CFD technology is a worthy method for calculating the characteristics of axial force. Shi et al. [12] also concluded that the axial force on the inner surface of the runner is the most important factor affecting the axial force, for it accounts for a large proportion of the hydraulic mechanical axial force. Zhou et al. [13] concluded that the axial force on the inner surface of the runner is restricted by hydraulic construction, and the main feasible way to adjust the hydraulic mechanical axial force is to balance the pressure difference between the front and rear cover plates of the runner. Research on measures to balance axial force indicate that the most common way is to add a balance hole, and this effectiveness was proven by Pehlivan et al. [14] In addition, there are balance tubes [15], balance holes and balance tube combinations [16], balance plates/drums [17,18] and other approaches.
In terms of radial force, Adkins et al. [19,20] found that the deviation of the radial force of the centrifugal pump runner from the design condition was greater than the design condition. Wu et al. [21] adopted CFX (is a computational fluid dynamics software package developed by ANSYS Inc.) to simulate different working conditions before and after optimization and concluded that a large radial force, as well as a strong pressure pulsation and radial force pulsation would cause the volute and rotor system to be subjected to larger and more unstable dynamic unbalance force, thus causing a greater vibration of the pump. As for how to balance the radial force, several methods were given in [22,23], such as using a double volute, structuring of the guide vane and vortex chamber, or the staggered arrangement of two adjacent stages of spiral water pressure chambers by 180. In addition, due to the viscosity of water, there should be a fluid close to the runner’s speed at the clearance [24], so it is unreasonable to only set the runner’s speed. In this paper, the calculation results of the velocity on the lower surface of the upper crown and the inner surface of the lower ring were more reasonable.
From the current research in [25], it can be seen that the research on the clearance flow characteristics around the runner and the resulting force characteristics has begun to take shape. However, in engineering applications, due to the influence of the actual installation and site, the clearance is often uneven, and an uneven flow often produces pulse power, especially for the radial clearance. For very large units, this influence often has a great impact. In addition, the setting of calculation conditions can be too idealized, so the boundary conditions should be added on a certain basis to make it closer to the real situation. Therefore, in this study, the influence of radial installation deviation on the pressure pulsations induced by the rotor–stator interaction of a very large turbine was investigated. In the next chapter, we will introduce the establishment of Computational Fluid Dynamics (CFD) models and radial deviation models, as well as grid partitioning. In chapter three, we will elaborate on the introduction of wall velocity at the interface of moving and stationary parts, in order to conduct steady-state calculations under three types of deviations (0.5 mm, 1.5 mm, and 2.5 mm) and unsteady-state calculations under a deviation of 0.5mm, and analyze the results. The last two chapters will analyze the results obtained from the calculations and draw conclusions and discussions.
2. Research Object and Methodology
The investigated 1000 MW Francis turbine and the unit layout are shown in Figure 1, and Table 1 shows its parameters:
A three-dimensional model of the entire flow channel of the unit was established (Figure 2) and meshed to analyze the flow characteristics. The boundary conditions were set according to the measured data in order to carry out the subsequent flow calculations of the runner and to analyze the radial deviation clearance on the flow characteristics of the turbine unit.
According to the boundary conditions of the rated working conditions, the meshes of the entire flow domains containing 5 million and 10 million elements were calculated for the mesh independence test, and, according to the Table 2, it was concluded that the efficiency of the two cases was not much different. Consequently, the mesh with 5 million elements was used for subsequent calculations to save computing time. As for a more detailed validation of grid independence and parameter comparison, another article [26] by our team specifically validated the number of grids under an unbiased ideal condition, so we only show simple results here. The radial deviation grid studied in this article was redrawn based on this foundation, thereby ensuring that the total number of deviation grids after drawing was almost the same as the total number of grids in the unbiased ideal model.
The numbers of elements in each flow domain of the 5 million elements are shown in Table 3:
Numerical simulations were performed using Reynolds Time Averaging (RANS) Equations (3) based on the Navier–Stokes (N-S) Equations (1) and (2), and the turbulence model used the SST turbulence model Equations (4). Using the finite volume method, the three-dimensional flow domains of the unit were discretized and solved to obtain the turbulent flow field inside the unit.
where (a = i, j, i, j = 1, 2, 3) are the three direction components of the velocity in the Cartesian coordinate system; are the coordinates. The indicator a represents the three-dimensional coordinate direction; is the body force or the kinematic viscosity. t is the time; p is the pressure; and is the water density. In order to close the system of equations, the RANS equations introduce a new unknown, Reynolds stress, which relates the Reynolds stress to the turbulent mean.
where k is the turbulent kinetic energy; P is the turbulence generation term; is the turbulence scale; is the dynamic viscosity; is the turbulent viscosity coefficient; is the production term coefficient; is a mixing function; and is the turbulent frequency. The empirical coefficients , , and were used as usual.
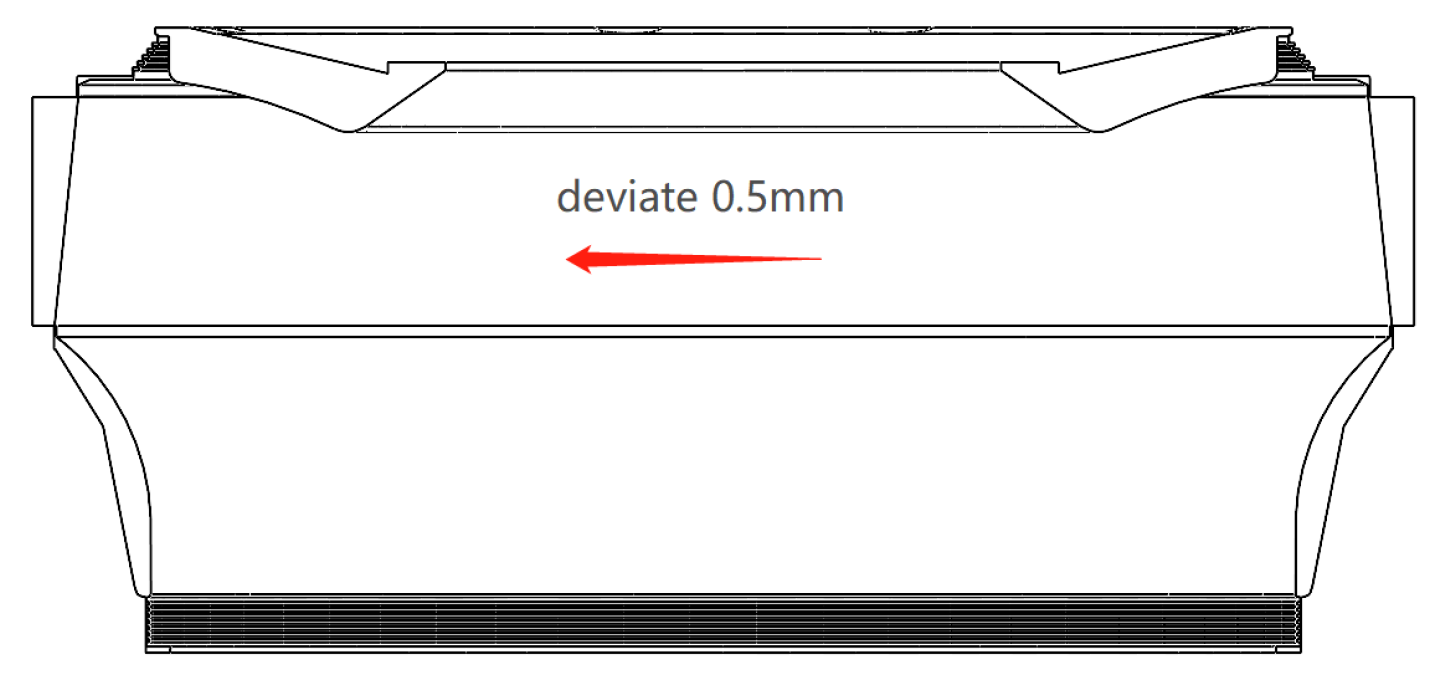
To build the model with radi al deviations, the crown chamber, the bottom ring chamber and the vaneless zone model were modified based on the ideal model, and the runner was moved toward the negative Y-axis by 0.5 mm, 1.5 mm, and 2.5 mm, respectively. This is a schematic diagram (Figure 3) and grid plot (Figure 4) with a deviation of 0.5 mm. The mesh was a structured mesh with an element number of about 830,000.
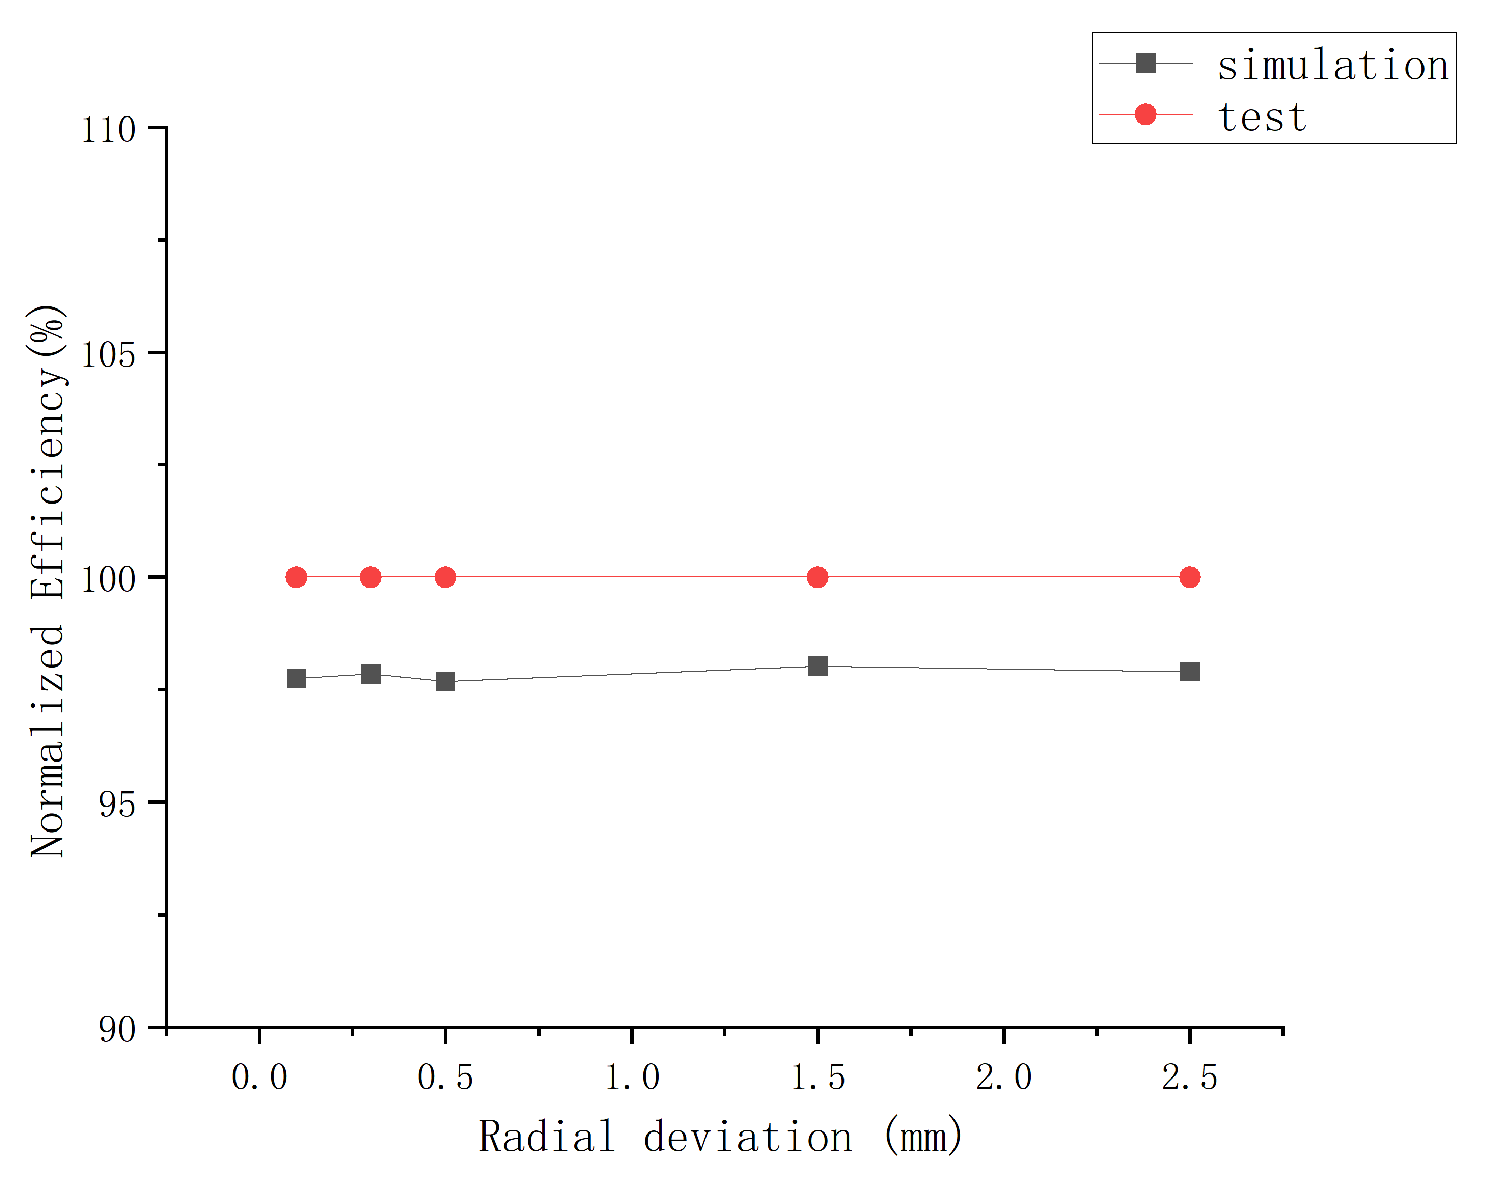
Finally, we needed to verify if the computational model we established could match the actual situation to a certain extent. This was necessary to give practical meaning to our study. We used the efficiency of the actual unit operation under rated conditions as the data comparison standard, compared the efficiency results under different radial installation deviations, and judged whether the model we established was reasonable. As shown in Figure 5, the difference between the efficiency results obtained under each deviation and the actual operating efficiency was not more than 5%. It can be said that the establishment of the model was reasonable to a certain extent.
3. Calculation Setup and Results Analysis
The boundary conditions were set as follows:
- (a)
- The CFD calculation used the mesh with 5 million elements. The mesh independence verification had been done previously, and the subsequent deviation model only changed the clearance mesh division and size on this basis.
- (b)
- The total pressure was set as the inlet conditon, and the static pressure was set as outlet condition.
- (c)
- The calculated steps were 2000, and the residual converges were limited to . We use a convergence criterion of instead of higher orders, because the gap size in the mesh was much smaller than that of the impeller, which made it difficult to converge in the calculations. Multiple calculations only converged to , so we set the criterion at this value.
Due to the existence of viscosity in the water, it was considered that the runner was close to the lower surface of the crown chamber clearance and the inner surface of the bottom ring clearance during rotation. Newton’s law of viscosity contextualizes this as follows:
is shear stress; is the shear deformation rate; is the hydrodynamic viscosity coefficient (viscosity).
According to Newton’s law of viscosity, the fluid in close proximity to a wall has the same velocity as the wall. Therefore, to better reflect actual engineering situations, we introduced wall velocity on the lower surface of the crown chamber and the inner surface of the bottom ring chamber. For simplicity, we set the wall velocity to be the same as the rotational speed of the impeller to better simulate actual operation. Since this approach has not been used in other studies, we will make comparisons later on.
Comparison of the two calculate conditions: Because the main research goal was to study the influence of deviation on the force of the runner, the question as to whether the force was reasonable was the main comparison factor. The radial force of the runner, the blade, the hub, the shroud, the crown chamber, and the bottom ring chamber were read by a computer to compare whether adding the wall speed was reasonable to arrive at the actual result.
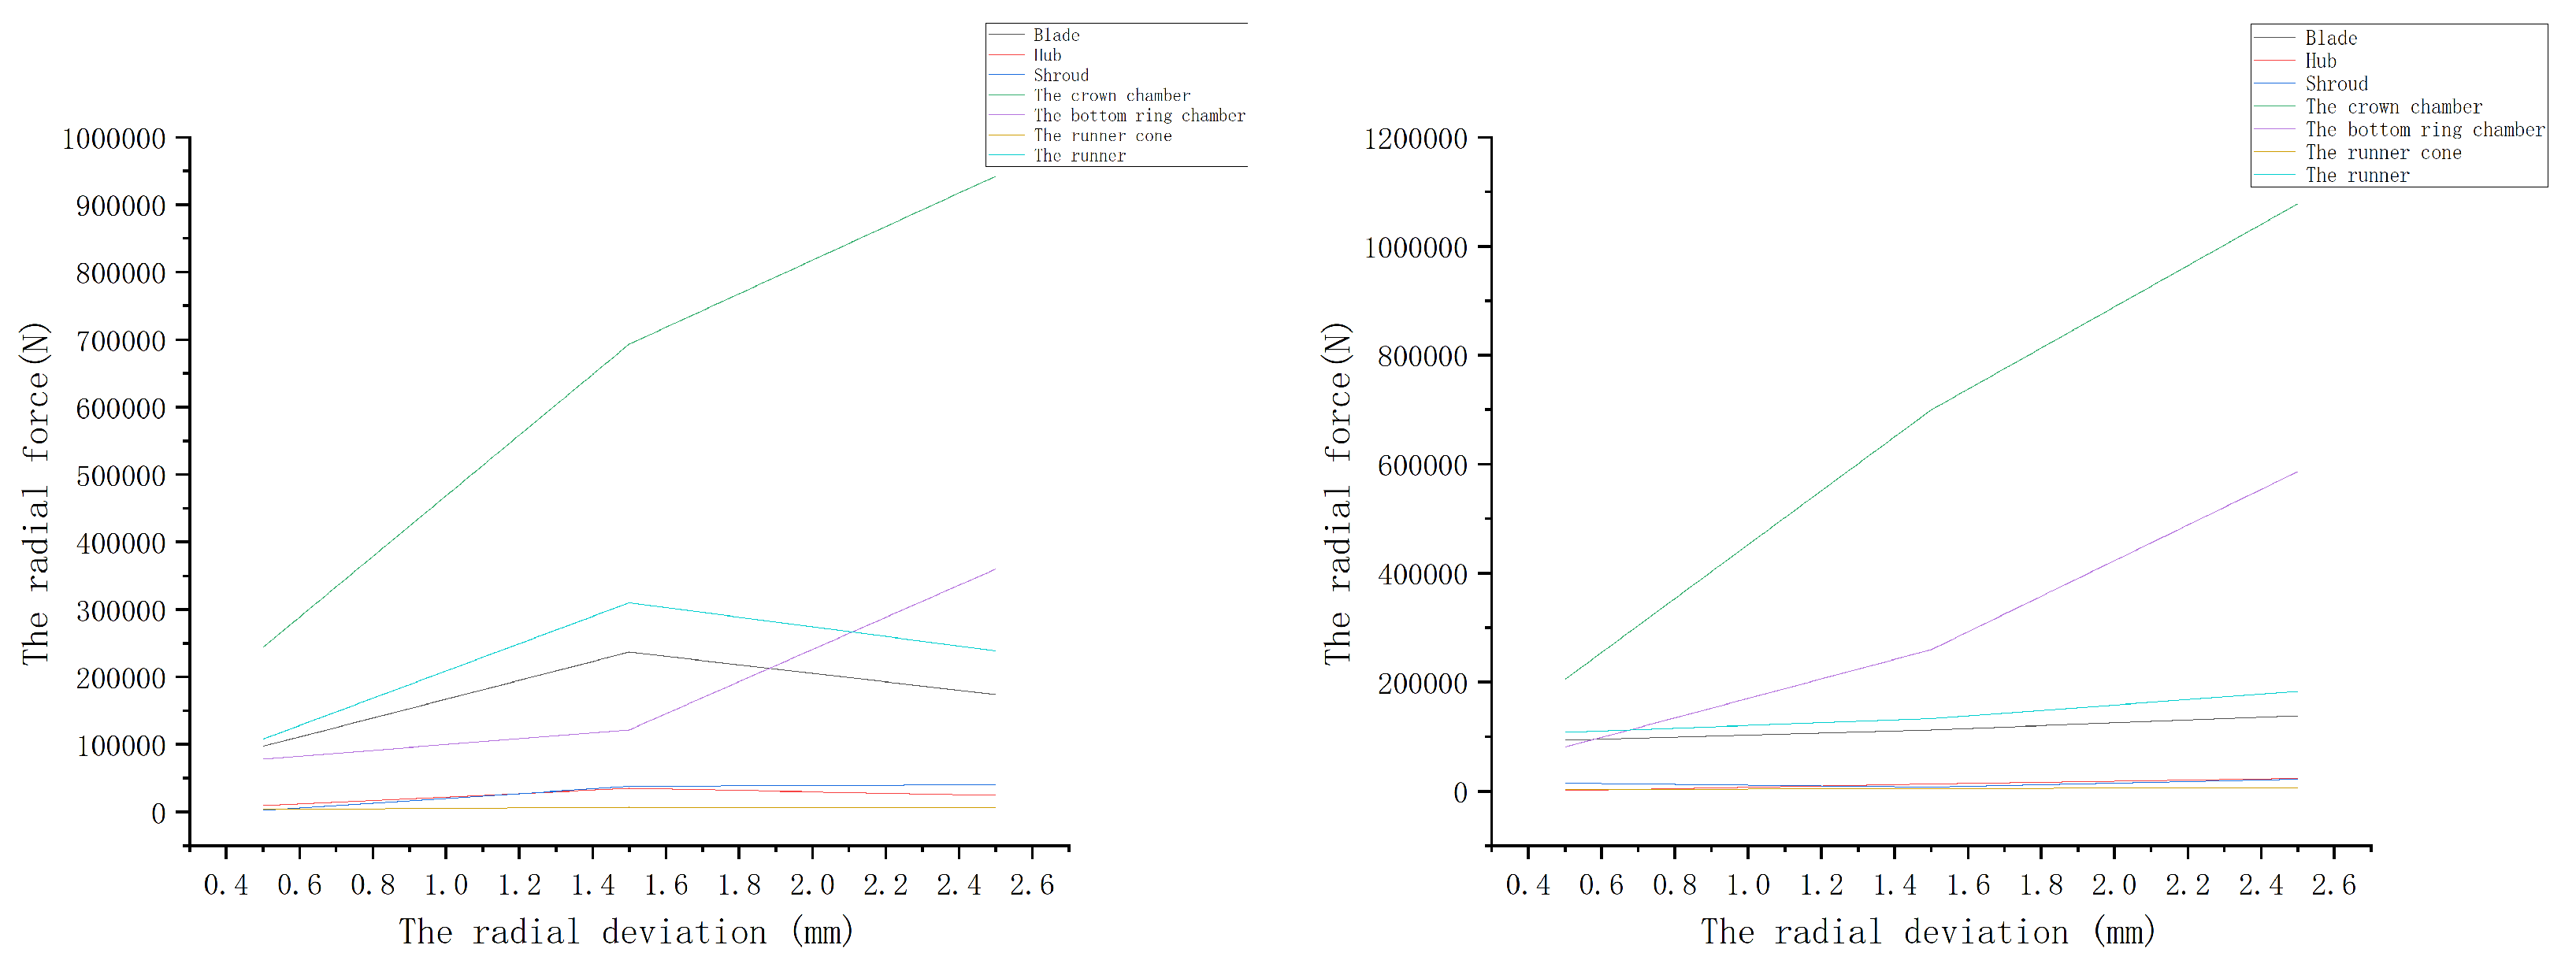
By comparing the results in Figure 6, the following conclusions have been shown:
- (a)
- Regardless of whether wall velocity was added or not, the radial force increased with the increase in deviation in any part.
- (b)
- The radial force on the crown chamber was the largest.
- (c)
- Compared to with and without the wall velocity, the radial force trend with the wall velocity added was more realistic.
Therefore, the wall velocity was considered in the simulation.
3.1. Steady-State Calculation
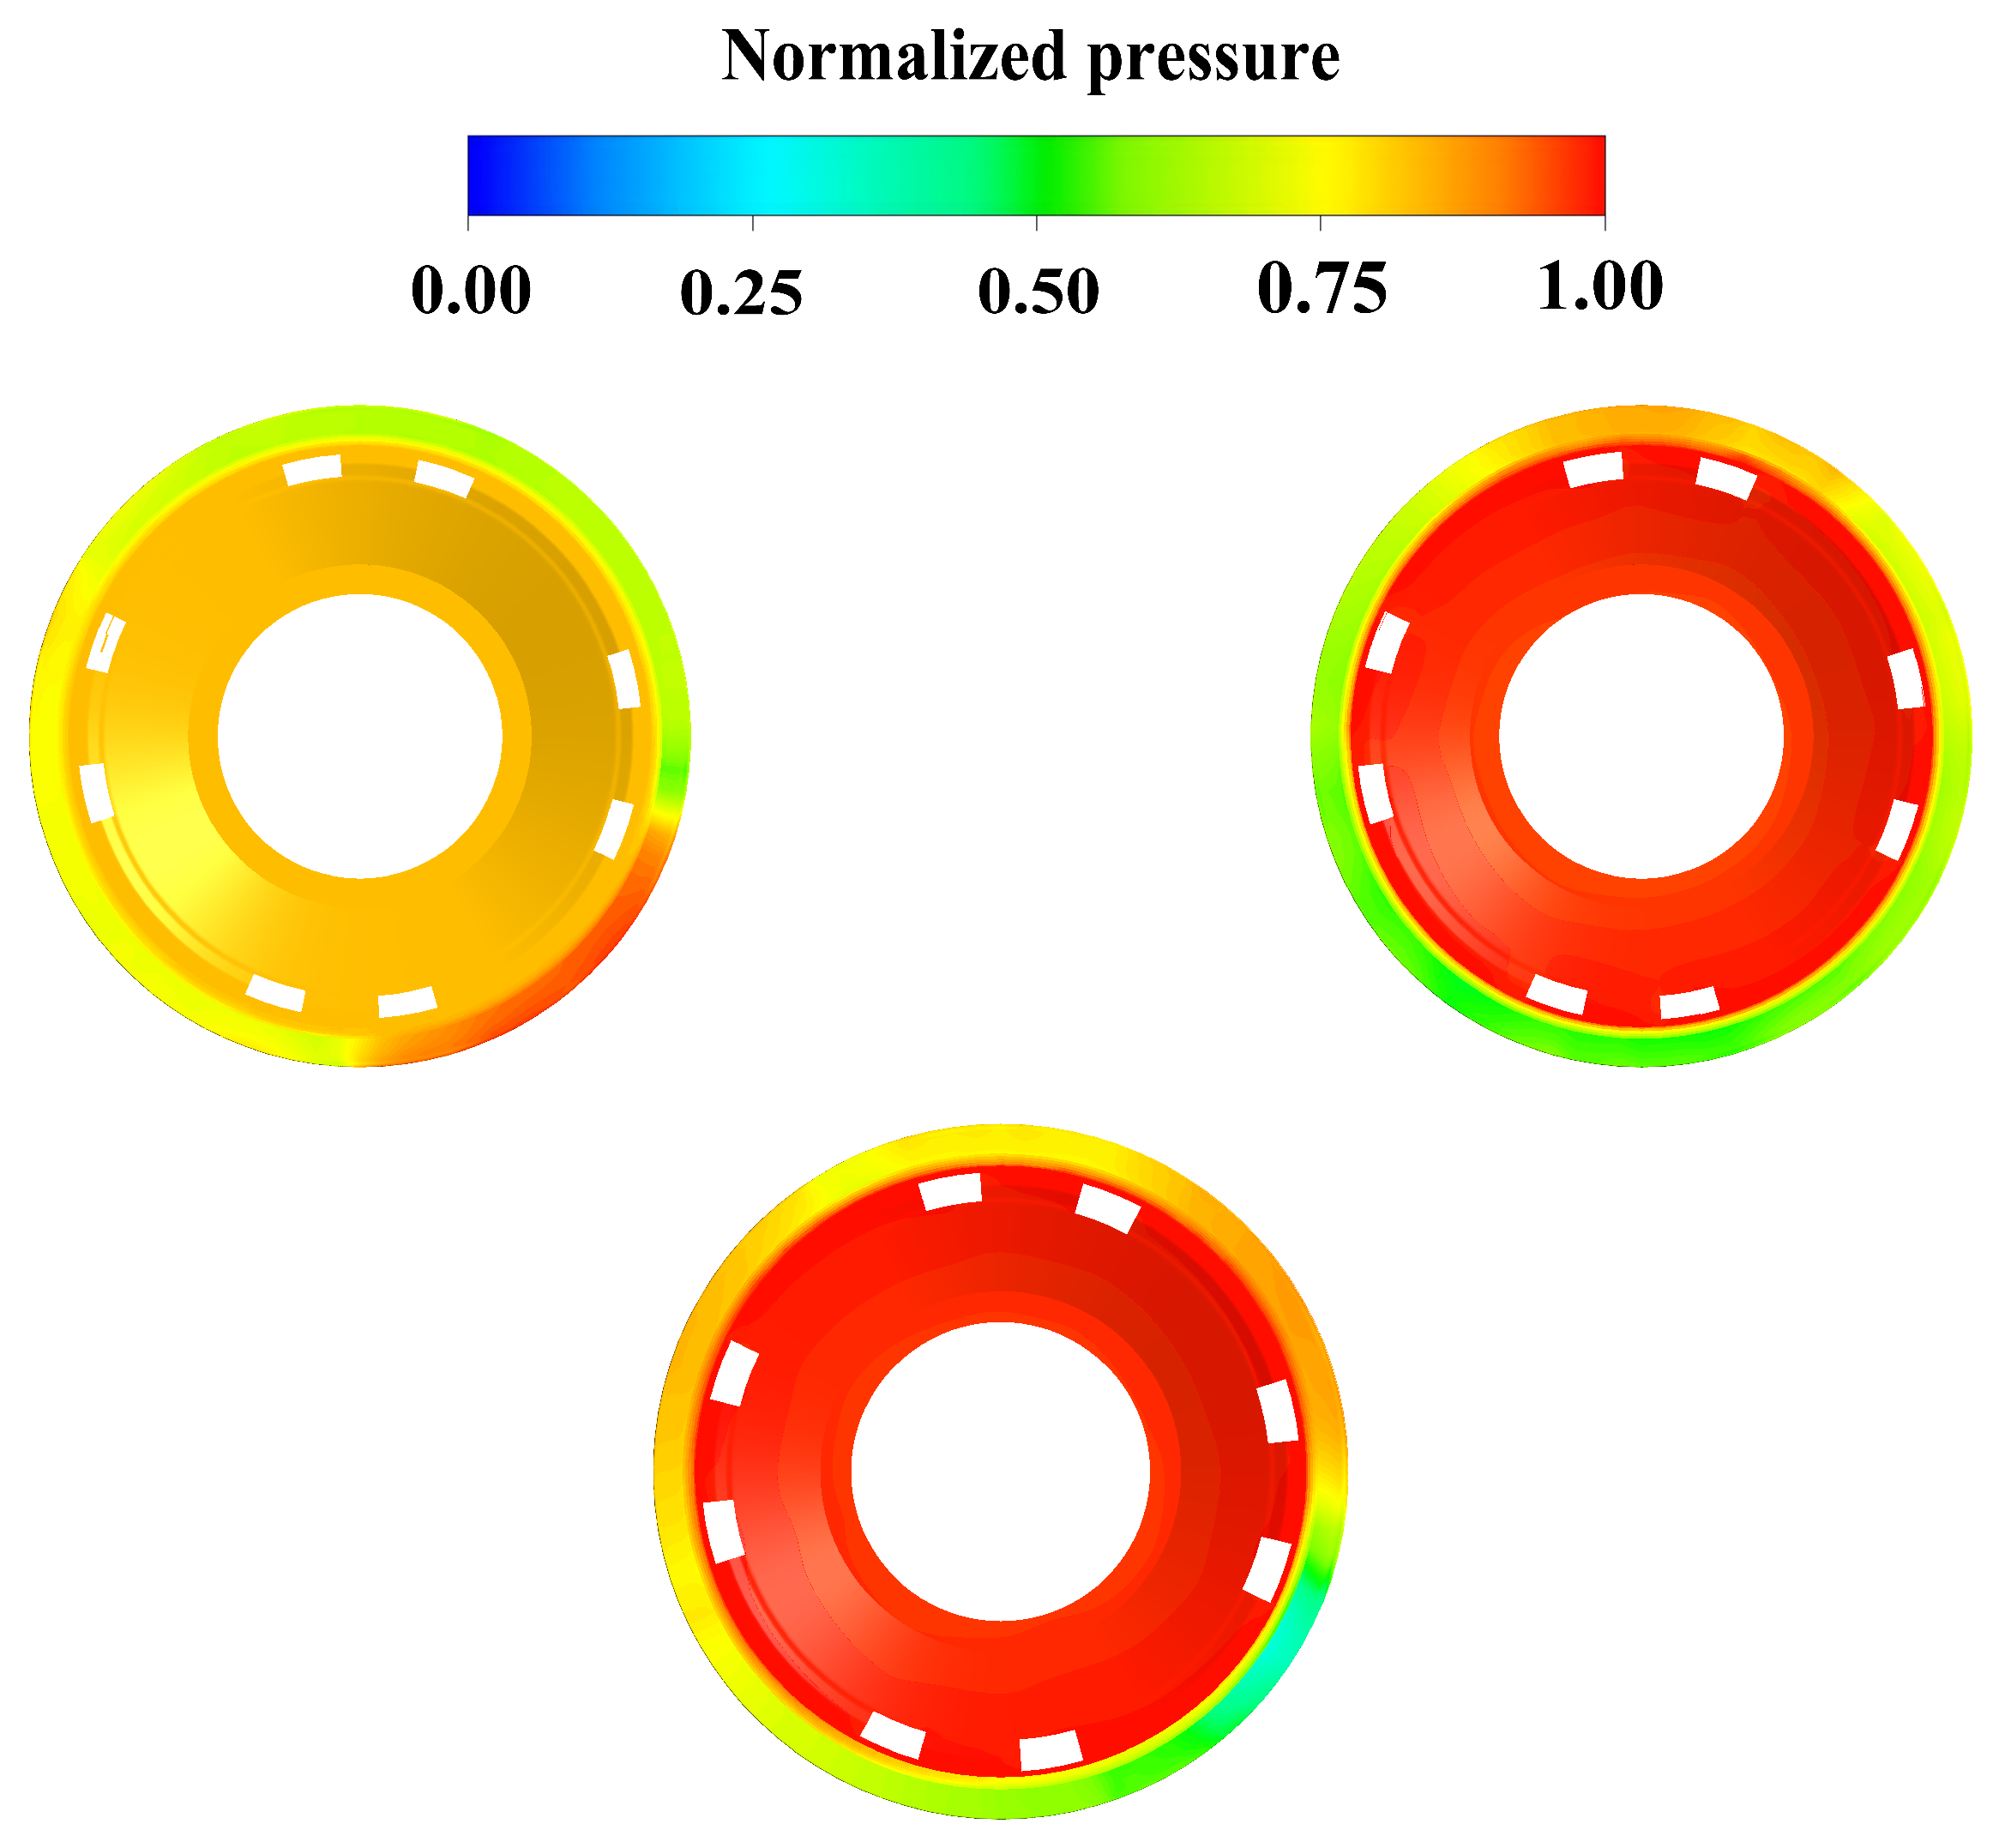
The pressure distribution of the crown chamber is shown in Figure 7.
It can be seen that, with the addition of wall velocity, the pressure distribution at the edge of the crown chamber was consistent with that without wall velocity, while the pressure inside the crown chamber rose due to the presence of wall velocity, and the internal pressure gradually increased with the increase in deviation. However, even with the increase in pressure, the crown chamber pressure with the addition of wall velocity was lower than that without the addition of wall velocity.
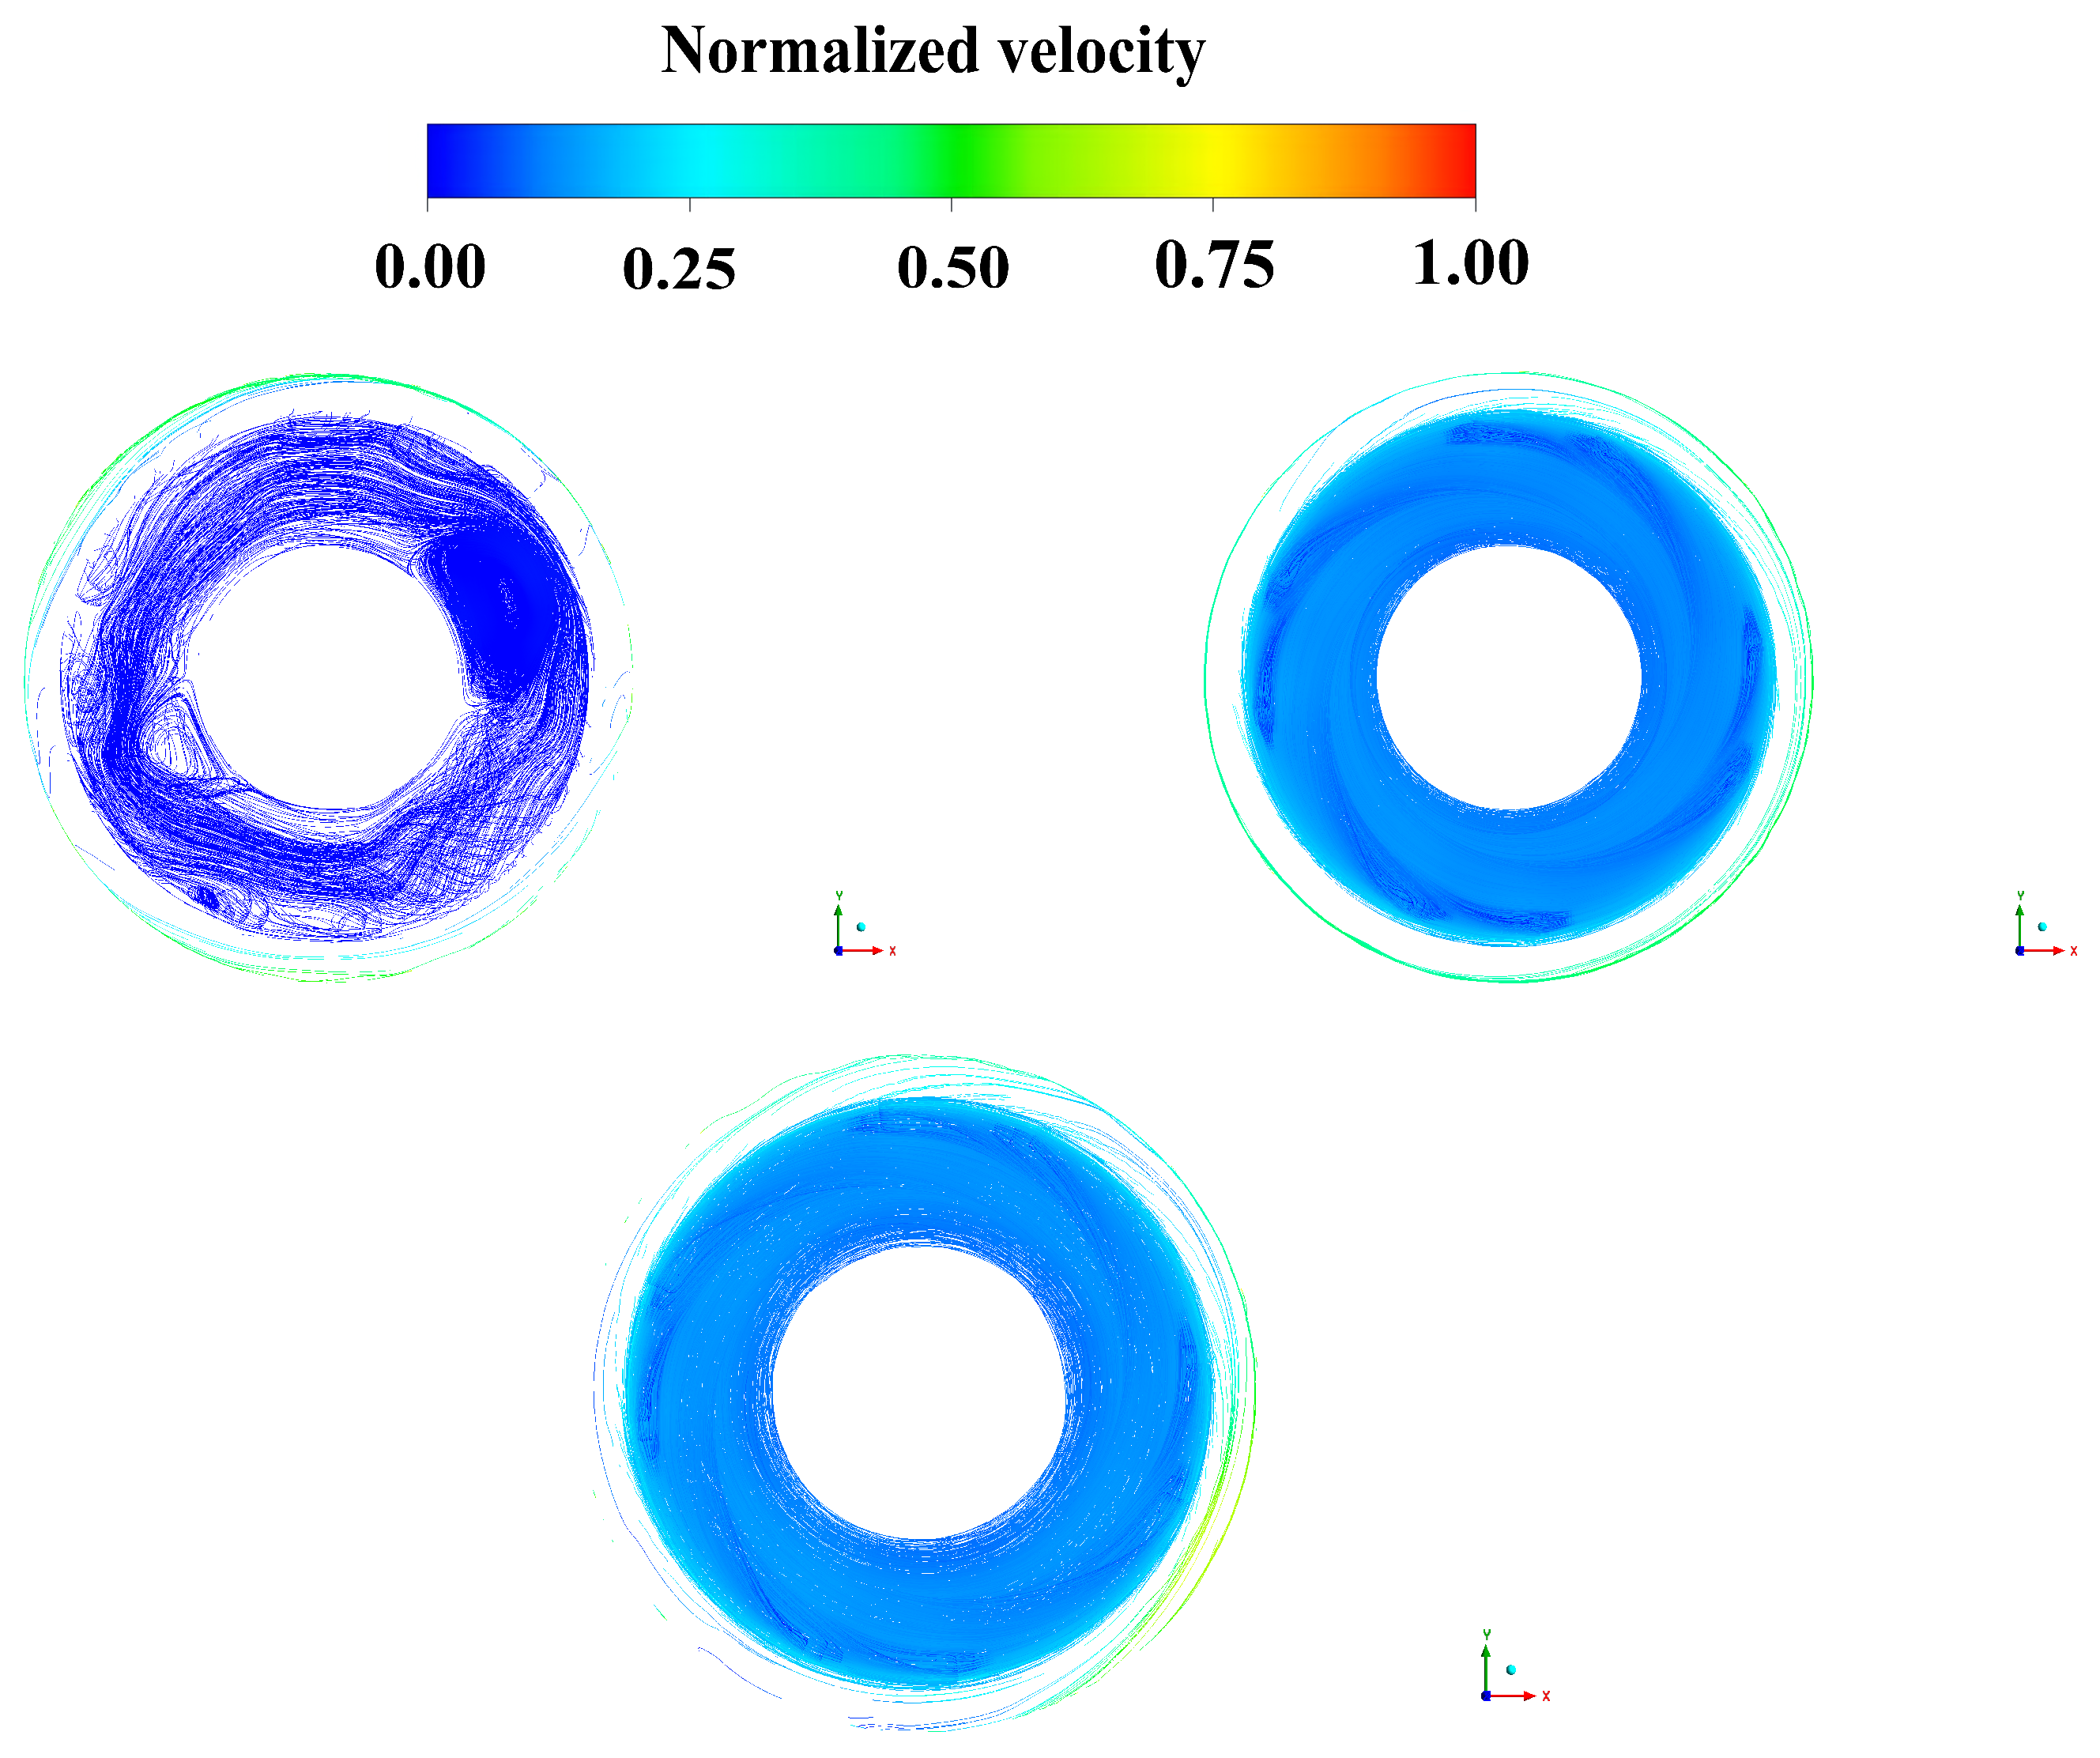
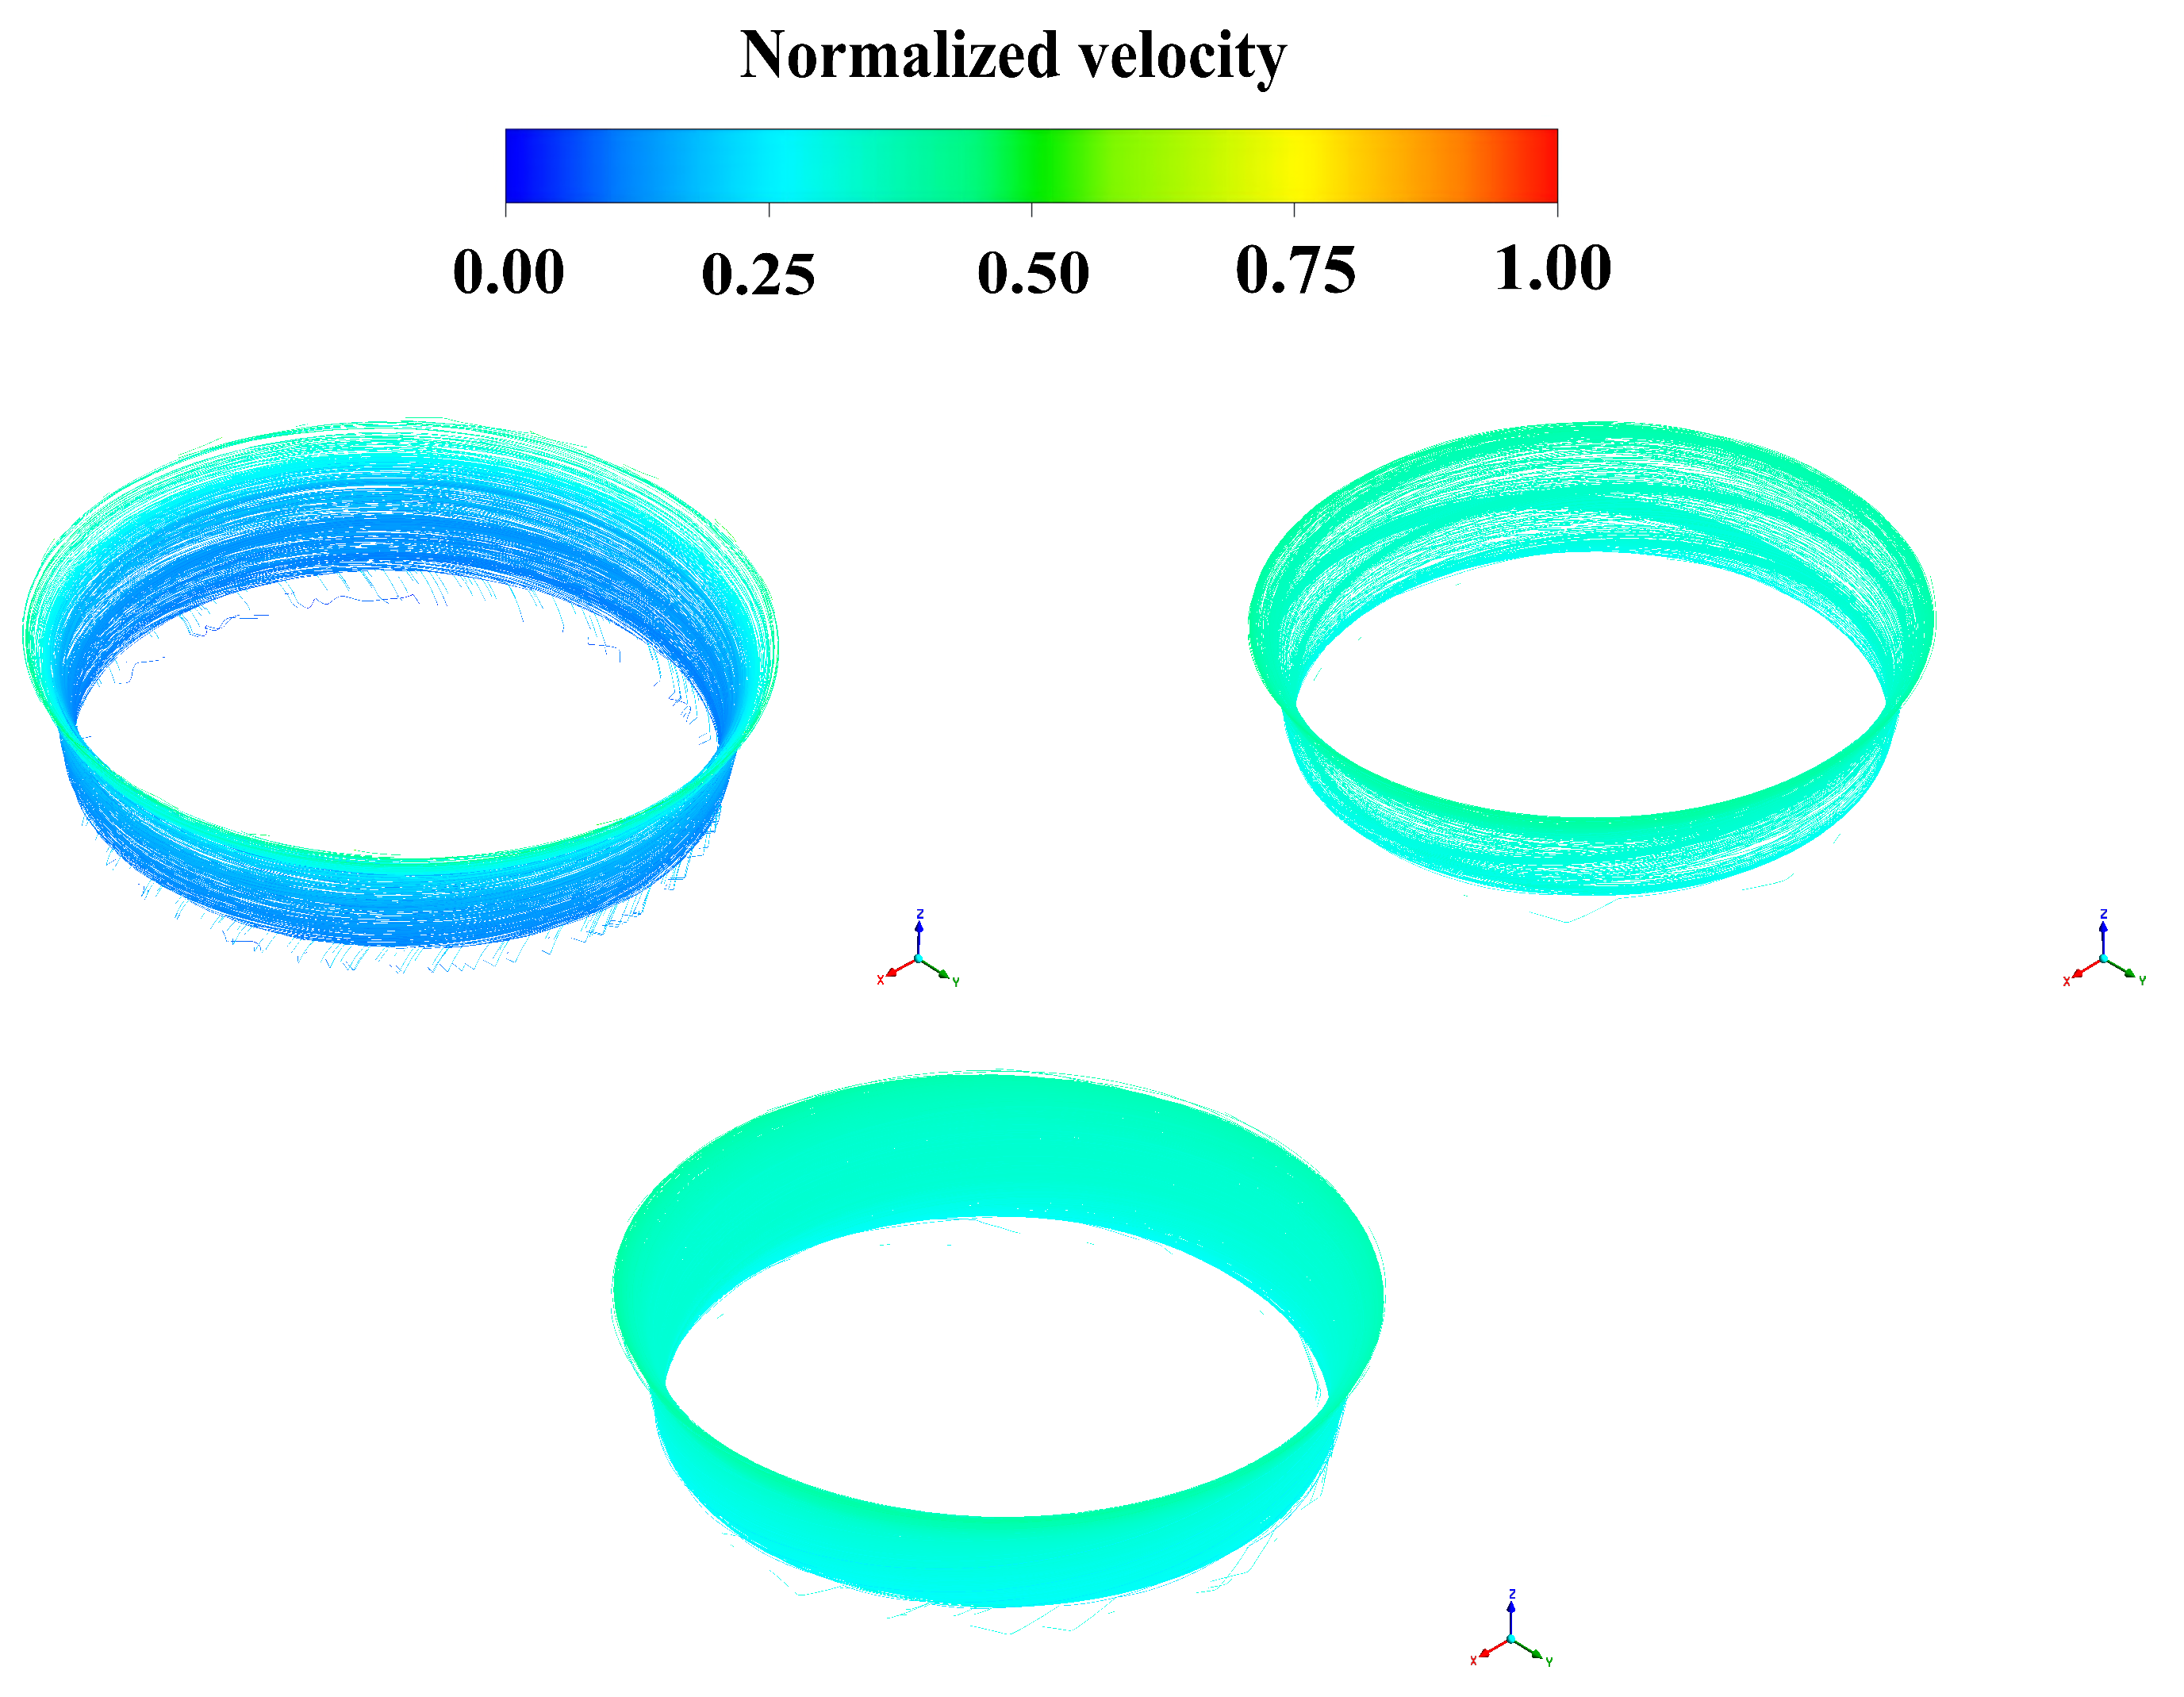
The velocity distributions of the crown chamber are illustrated in Figure 8.
In terms of velocity, at a low deviation, the flow in the cavity was disordered due to the rotation velocity on the lower surface, but it can still be seen that there was a vortex with the highest intensity. However, when the deviation was large, the flow region was stable, and there was no vortex. This may be because the deviation iwas too large, and the wall velocity of the lower surface was dominant, while the flow in the whole cavity was dominated by the rotation of the lower surface.
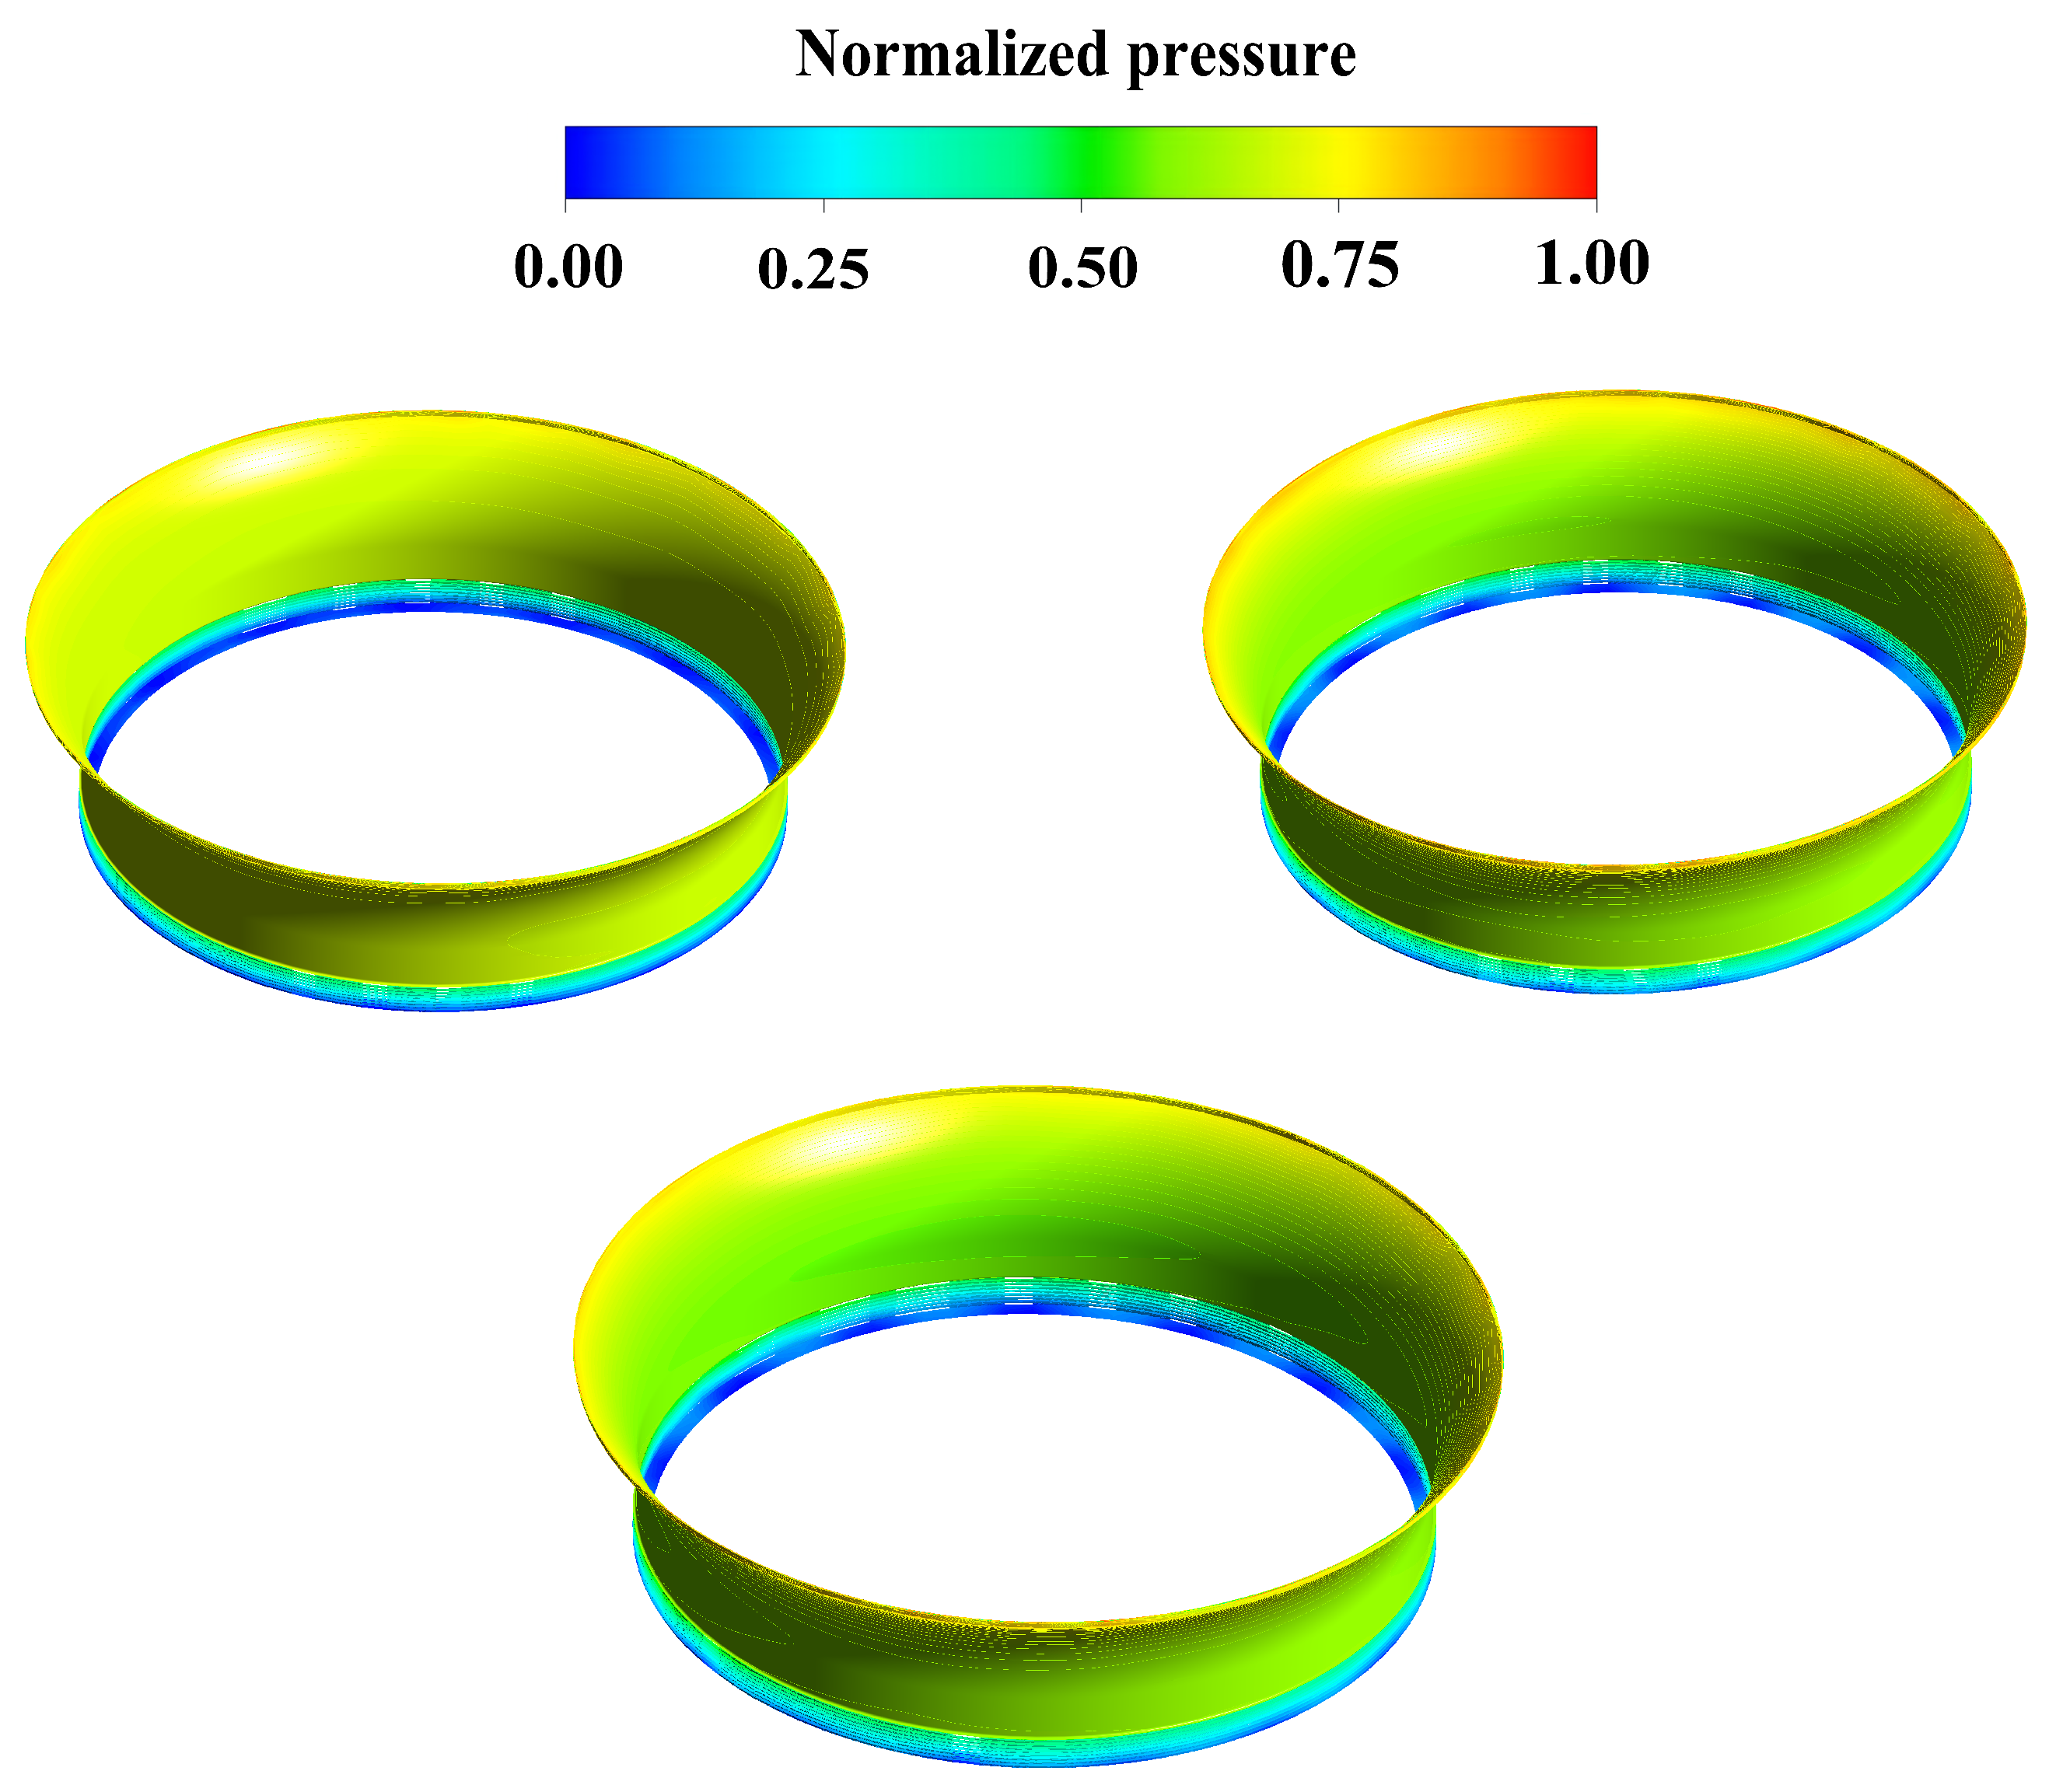
The pressure distributions of the bottom ring chamber are presented in Figure 9.
It can be seen here that, even with the presence of wall velocity, the pressure distribution of the lower ring still changed little.
The velocity distributions of the bottom ring chamber are demonstrated in Figure 10.
It can be seen here that the direction and flow characteristics of the three streamline lines were roughly the same. However, under a large deviation, the overall velocity was consistent with the inner surface flow and velocity, and the region was stable, just like the conclusion of the crown chamber velocity distribution.
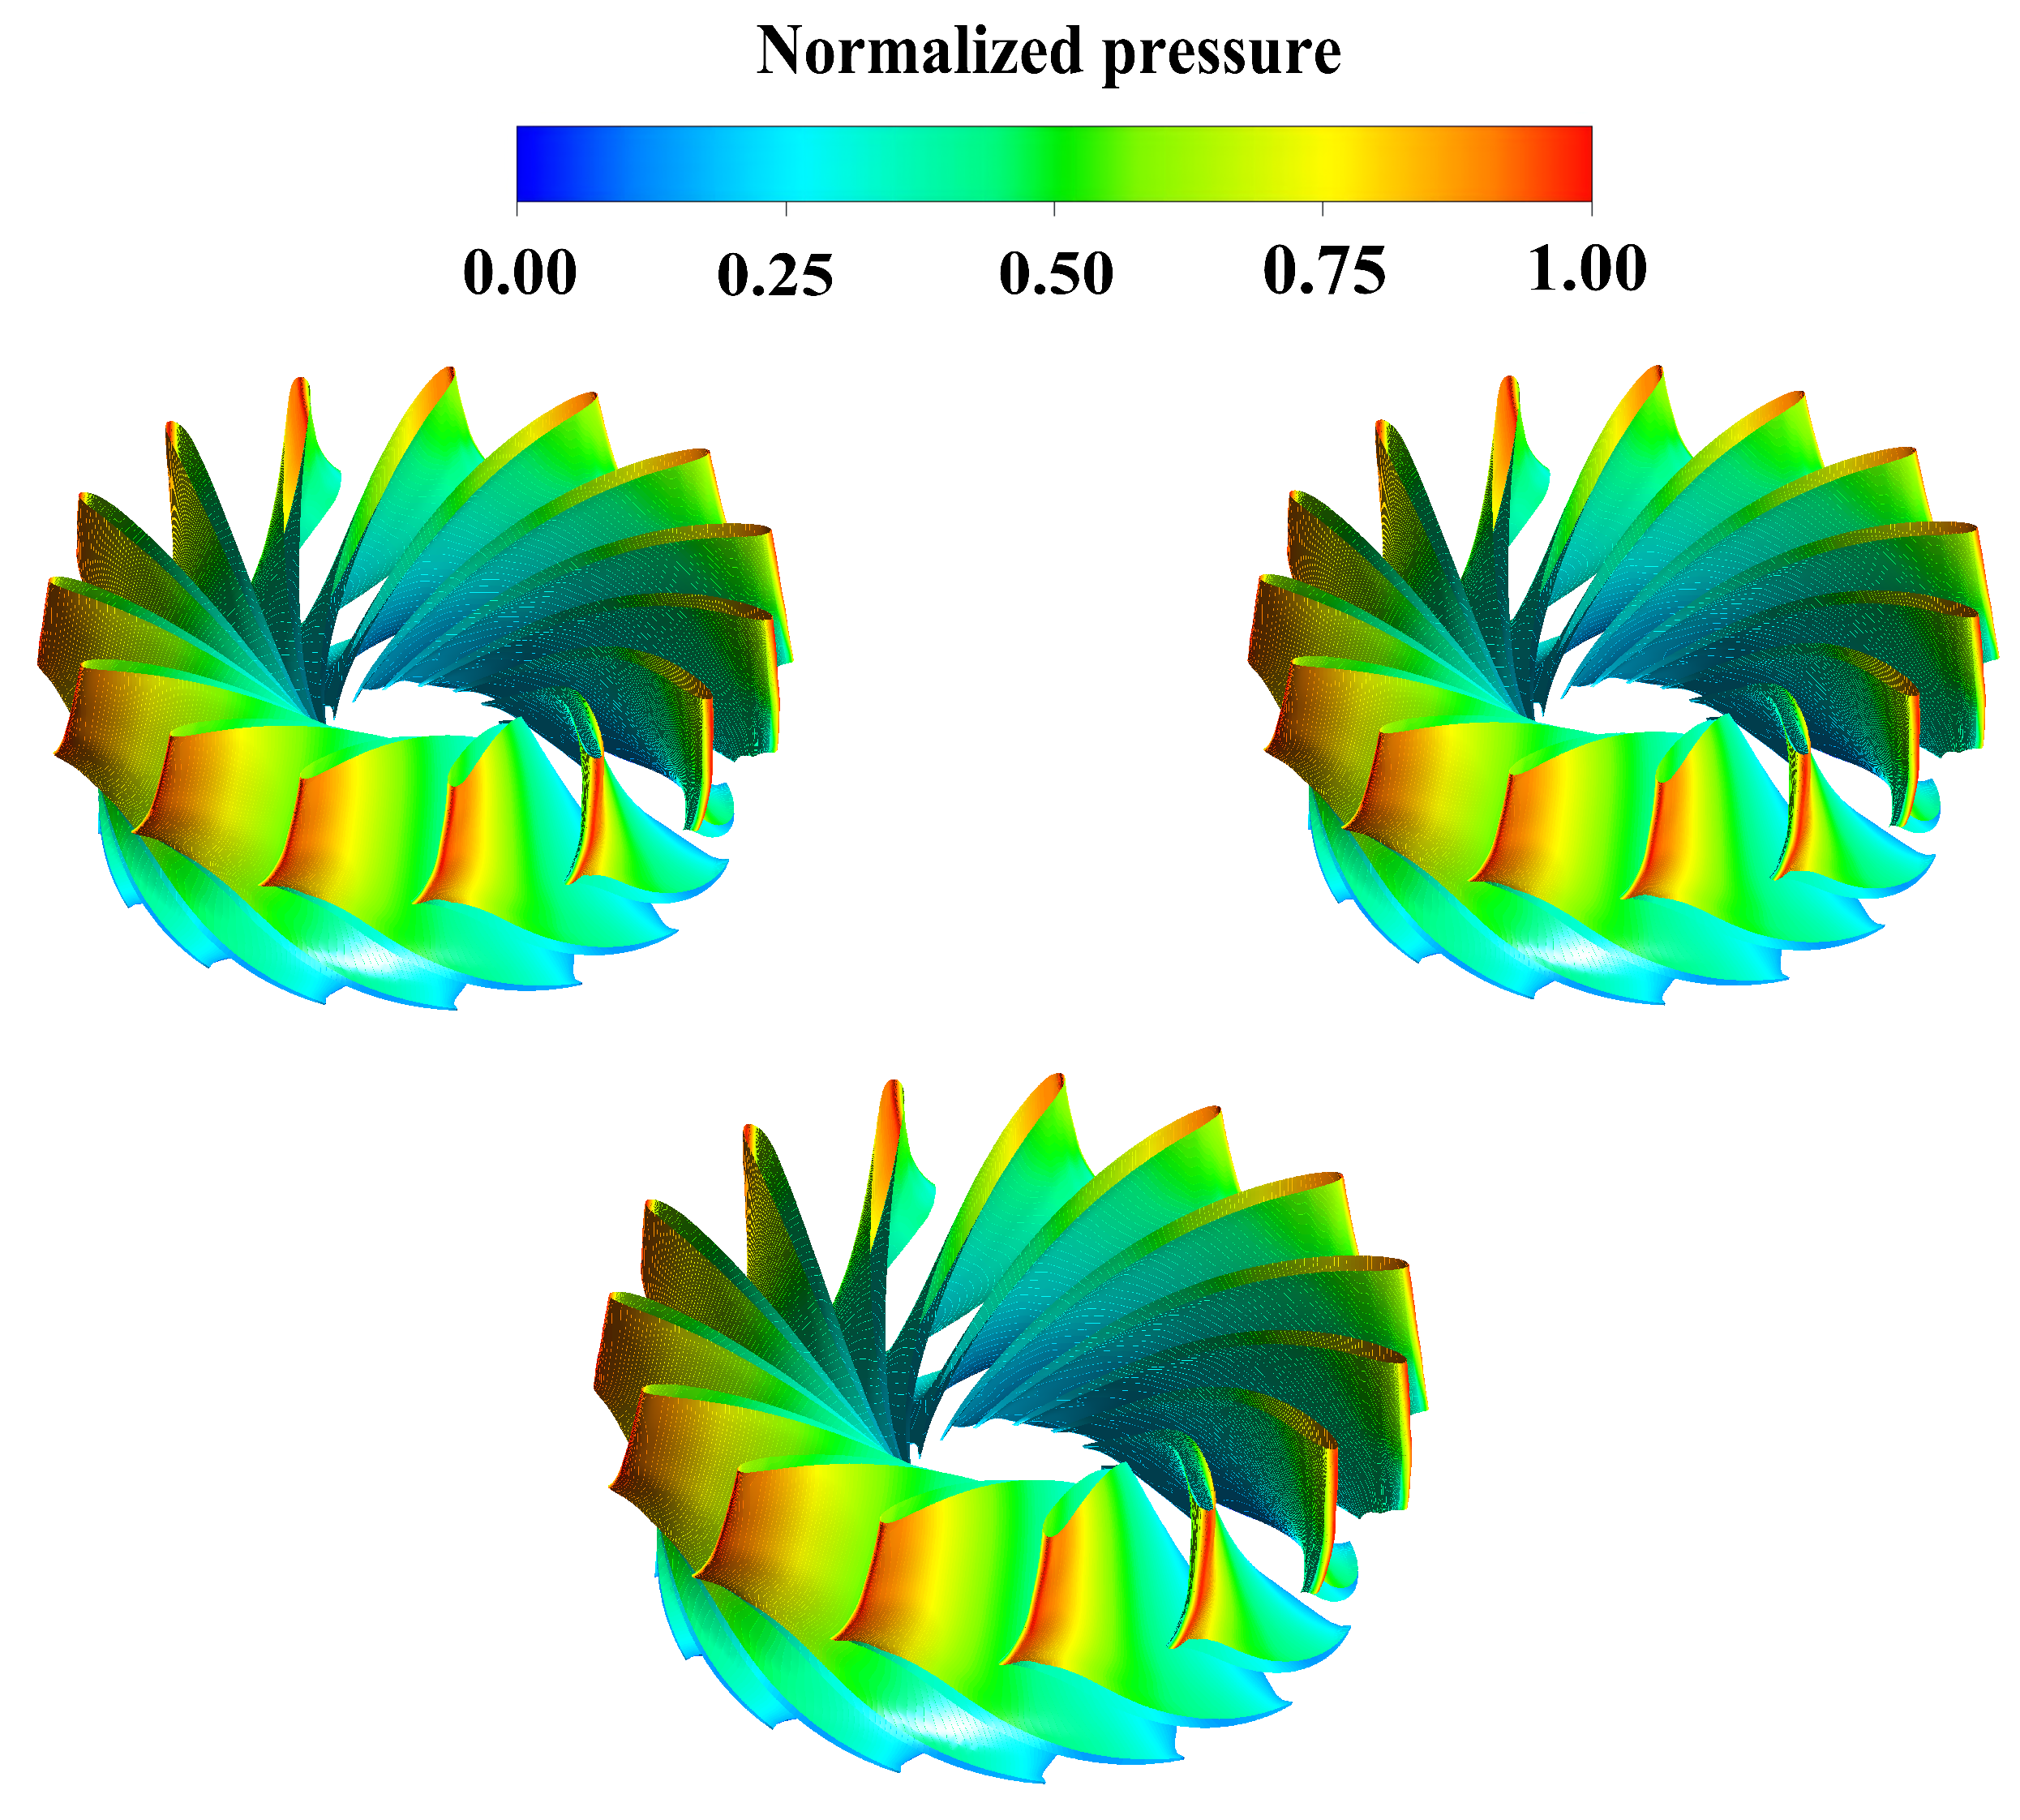
Figure 11 shows the pressure distributions of the runner.
In terms of blade pressure, it was almost the same as the velocity without a wall, and there was no obvious difference.
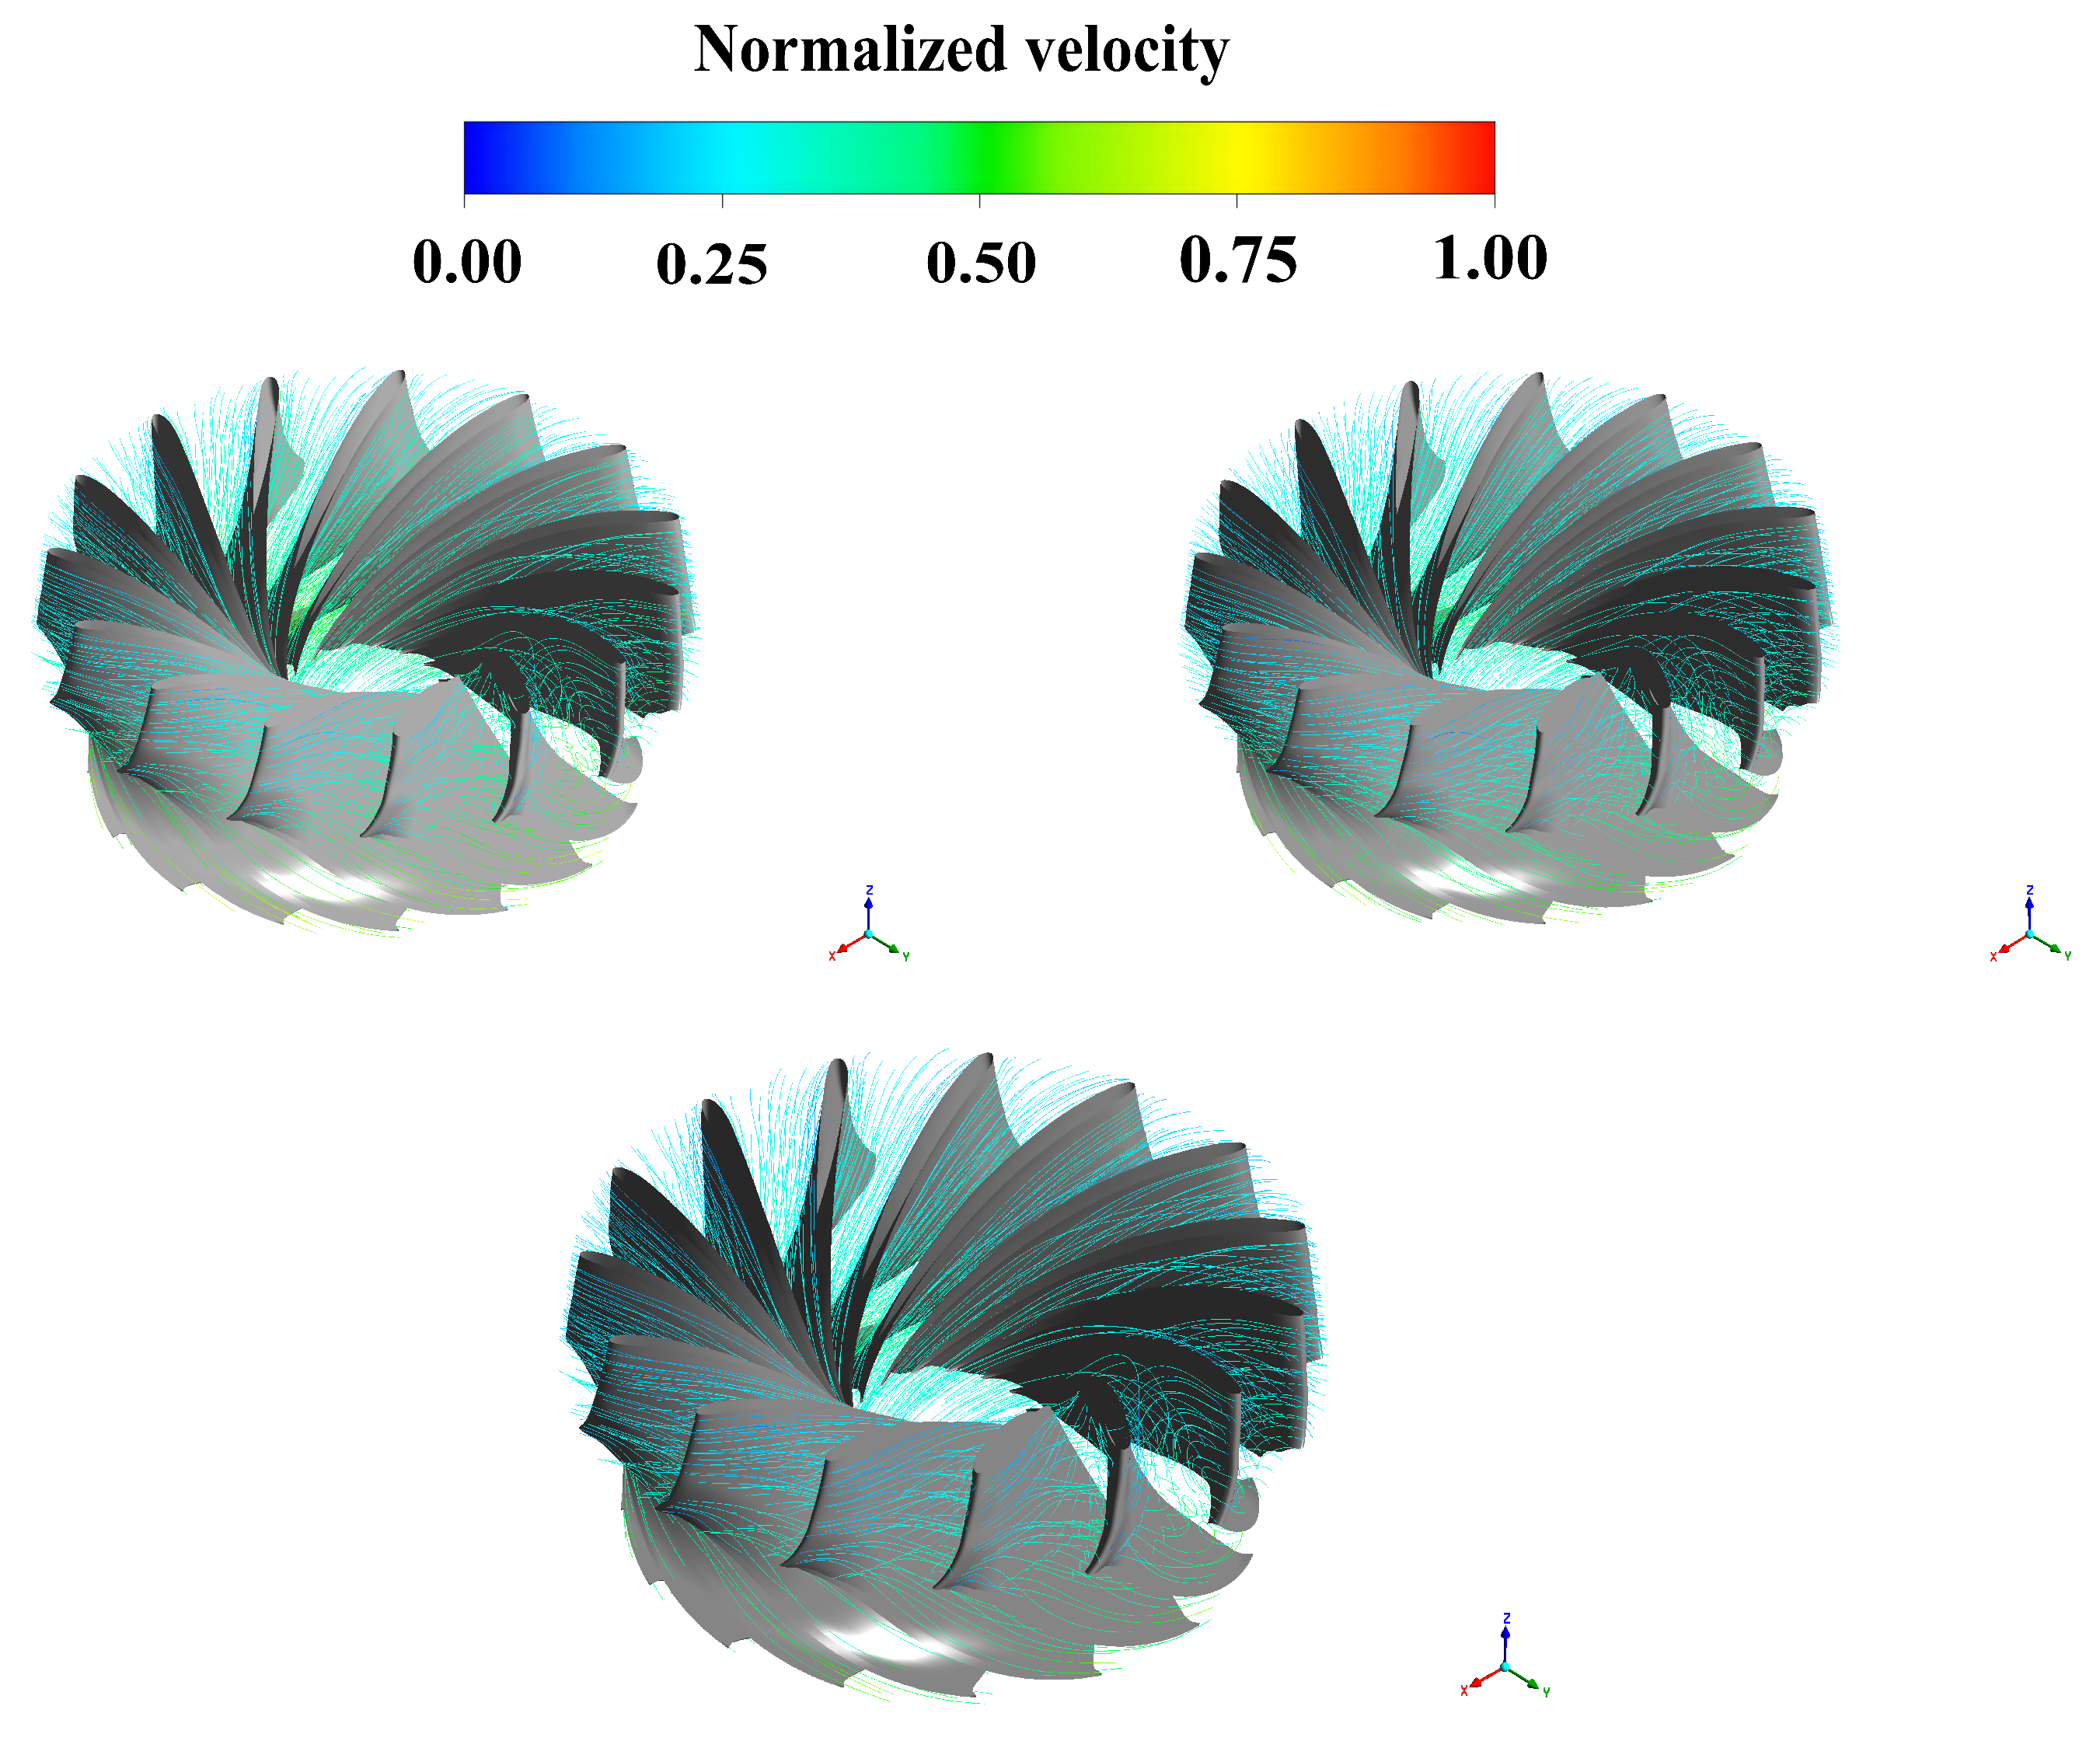
Figure 12 gives the velocity distributions of the runner. Compared to the runner flow channel pressure distribution, the streamlines of the three cases were not very different.
The findings from the CFD analysis are listed below:
- (1)
- The radial hydraulics force increased with the increase in deviation in different fluid domains.
- (2)
- The radial hydraulics force on the crown chamber was the largest, and the second largest was the runner.
3.2. Unsteady Computation
Through the calculation of the above three working conditions, the general distribution law of the main variables was obtained. However, in practice, the actual engineering deviation cannot be so large, due to the fact that the main shaft is rigid and the maximum clearance of the turbine bearing is only about 0.5 mm. Therefore, in the unsteady calculation, only the 0.5 mm radial installation deviation was calculated.
In order to pay better attention to the changes in radial force and pressure pulsation inside the flow field, the radial force on the inner surface of the crown chamber, the hub of the runner, the blade, the shroud of the runner, and the inner surface of the bottom ring chamber was monitored. Eight pressure monitoring points were arranged in the crown chamber, the blade along the flow passage, and the bottom ring along the circumference to pay attention to the pressure pulsation changes.
In order to better analyze the changes in radial forces and pressure pulsations inside the flow field, the radial forces on the inner surface of the crown chamber, runner hub, runner blades, runner shroud, and inner surface of the bottom ring chamber were monitored.
As shown in Figure 13, eight fluid domain pressure monitoring points were arranged in each of the crown chambers, the blades along the flow path, and the bottom ring along the circumference.
3.2.1. Analysis of the Radial Force Fluctuations
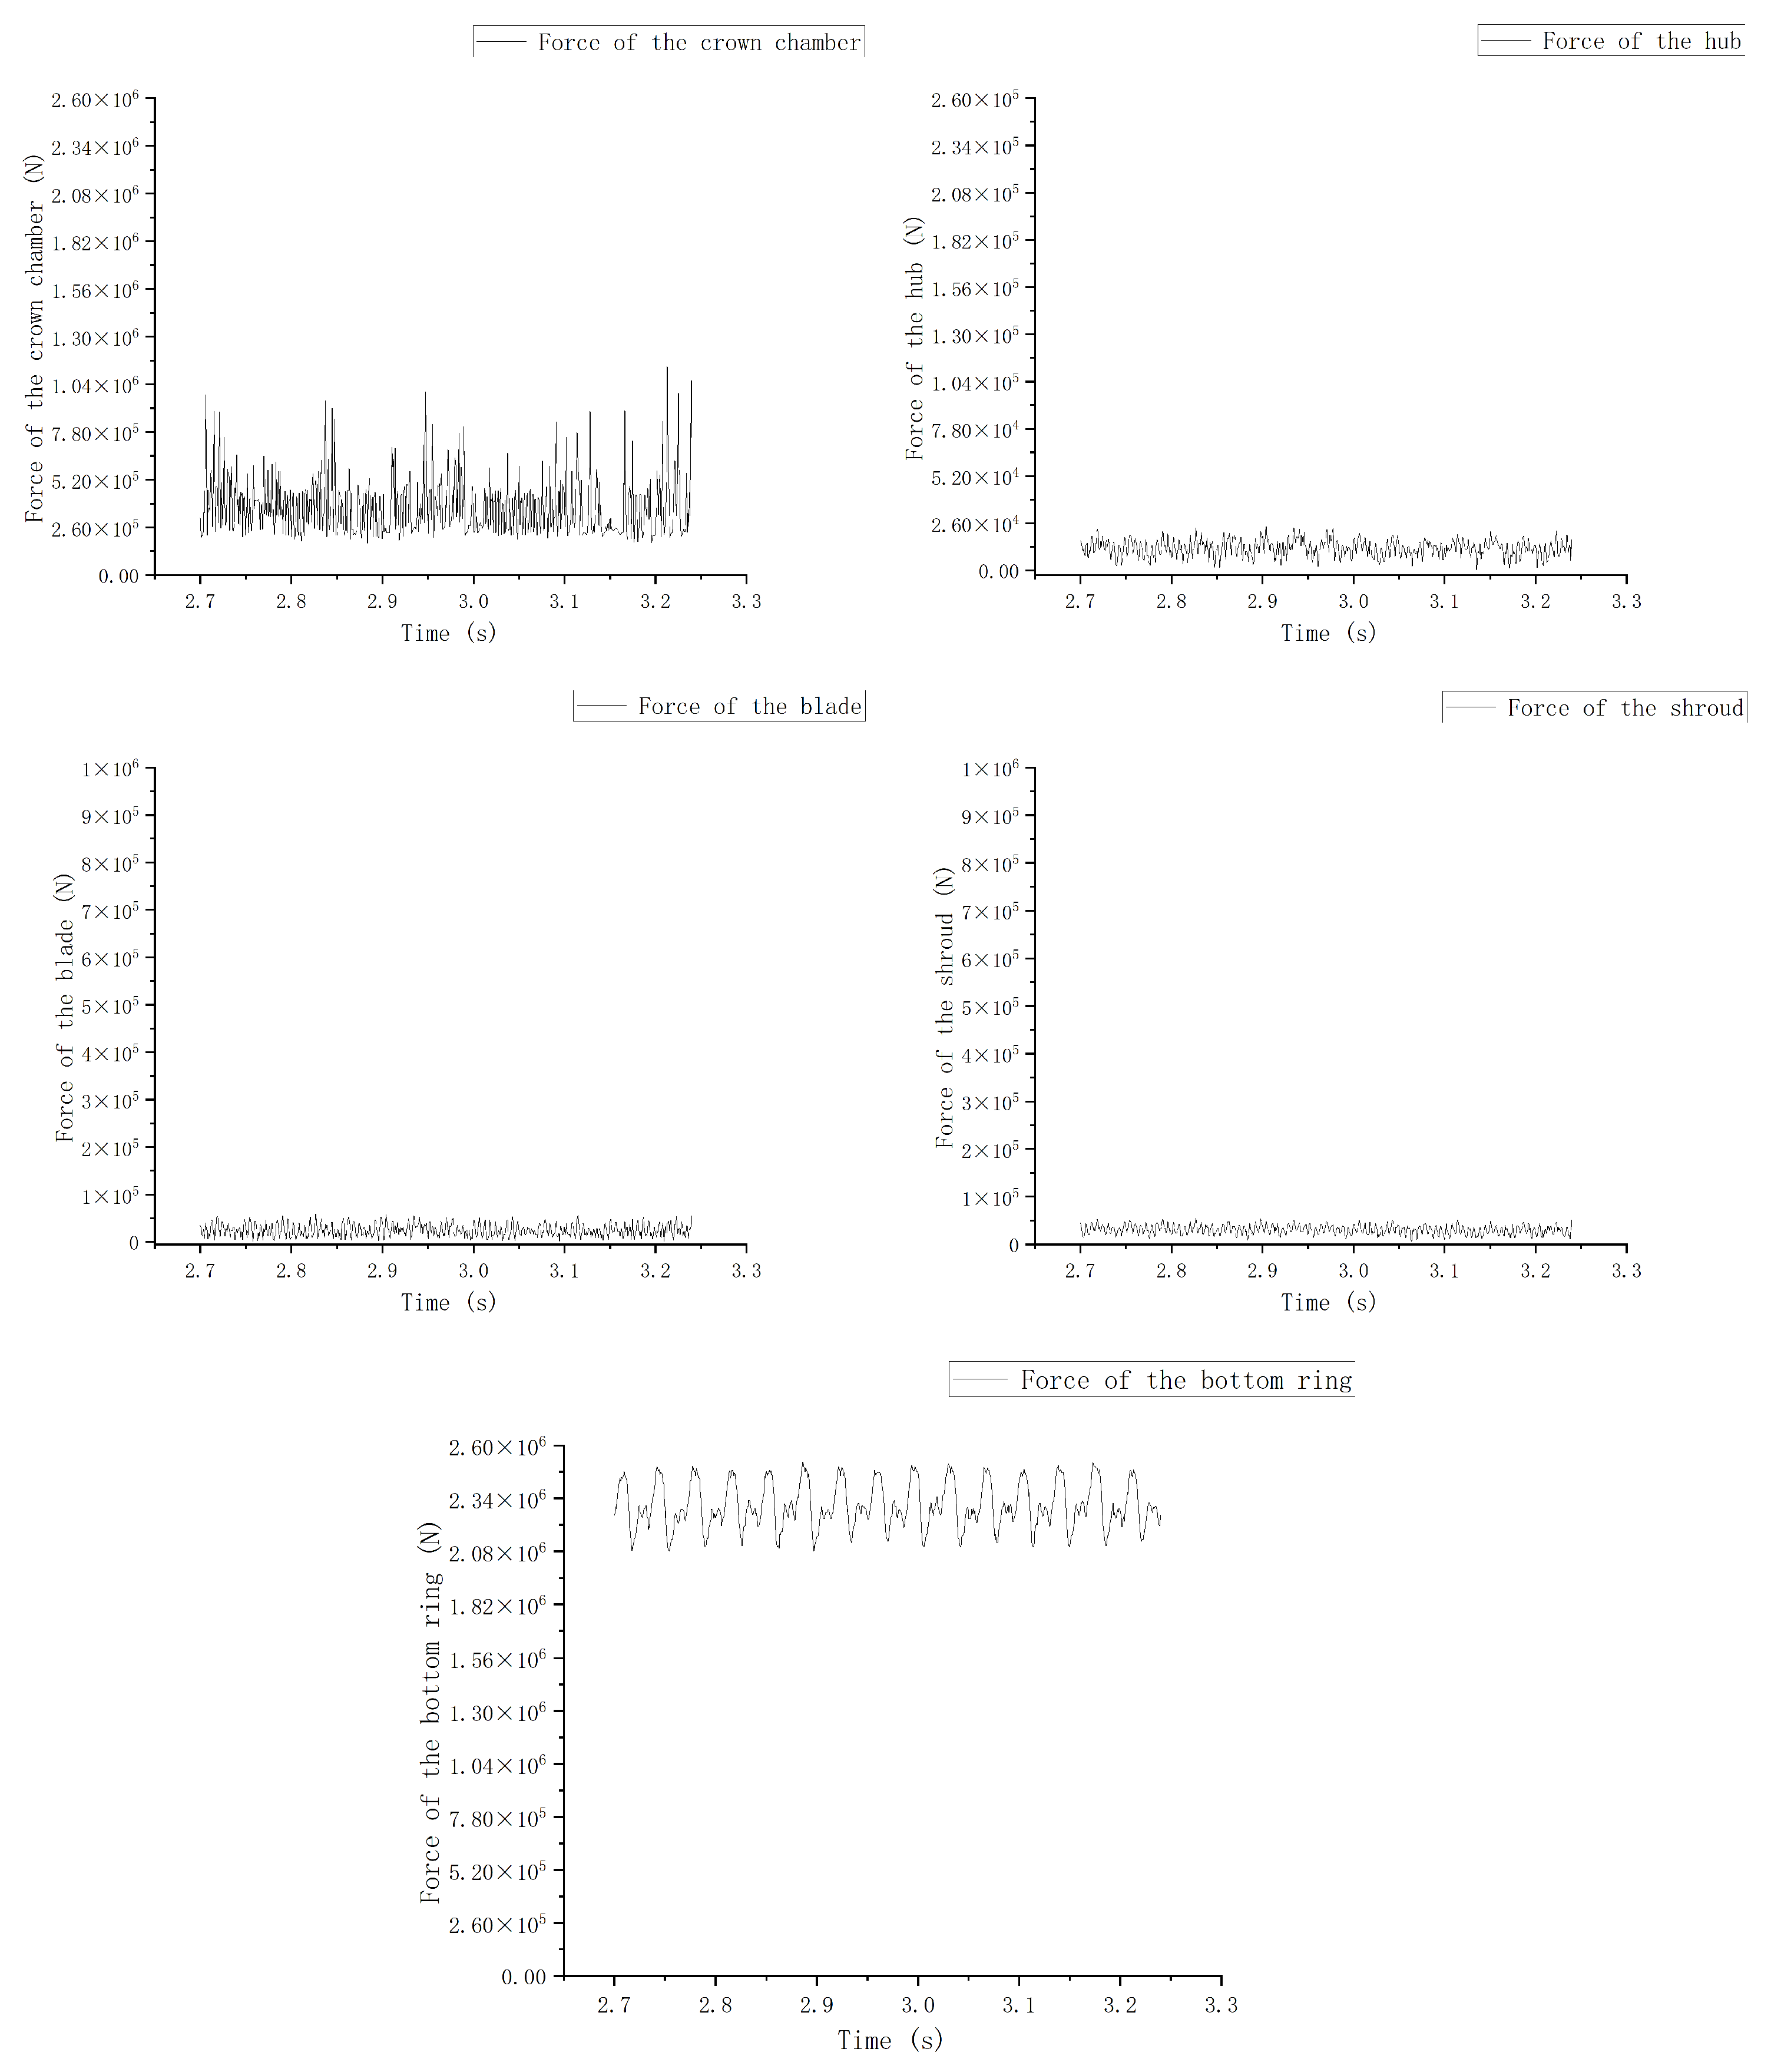
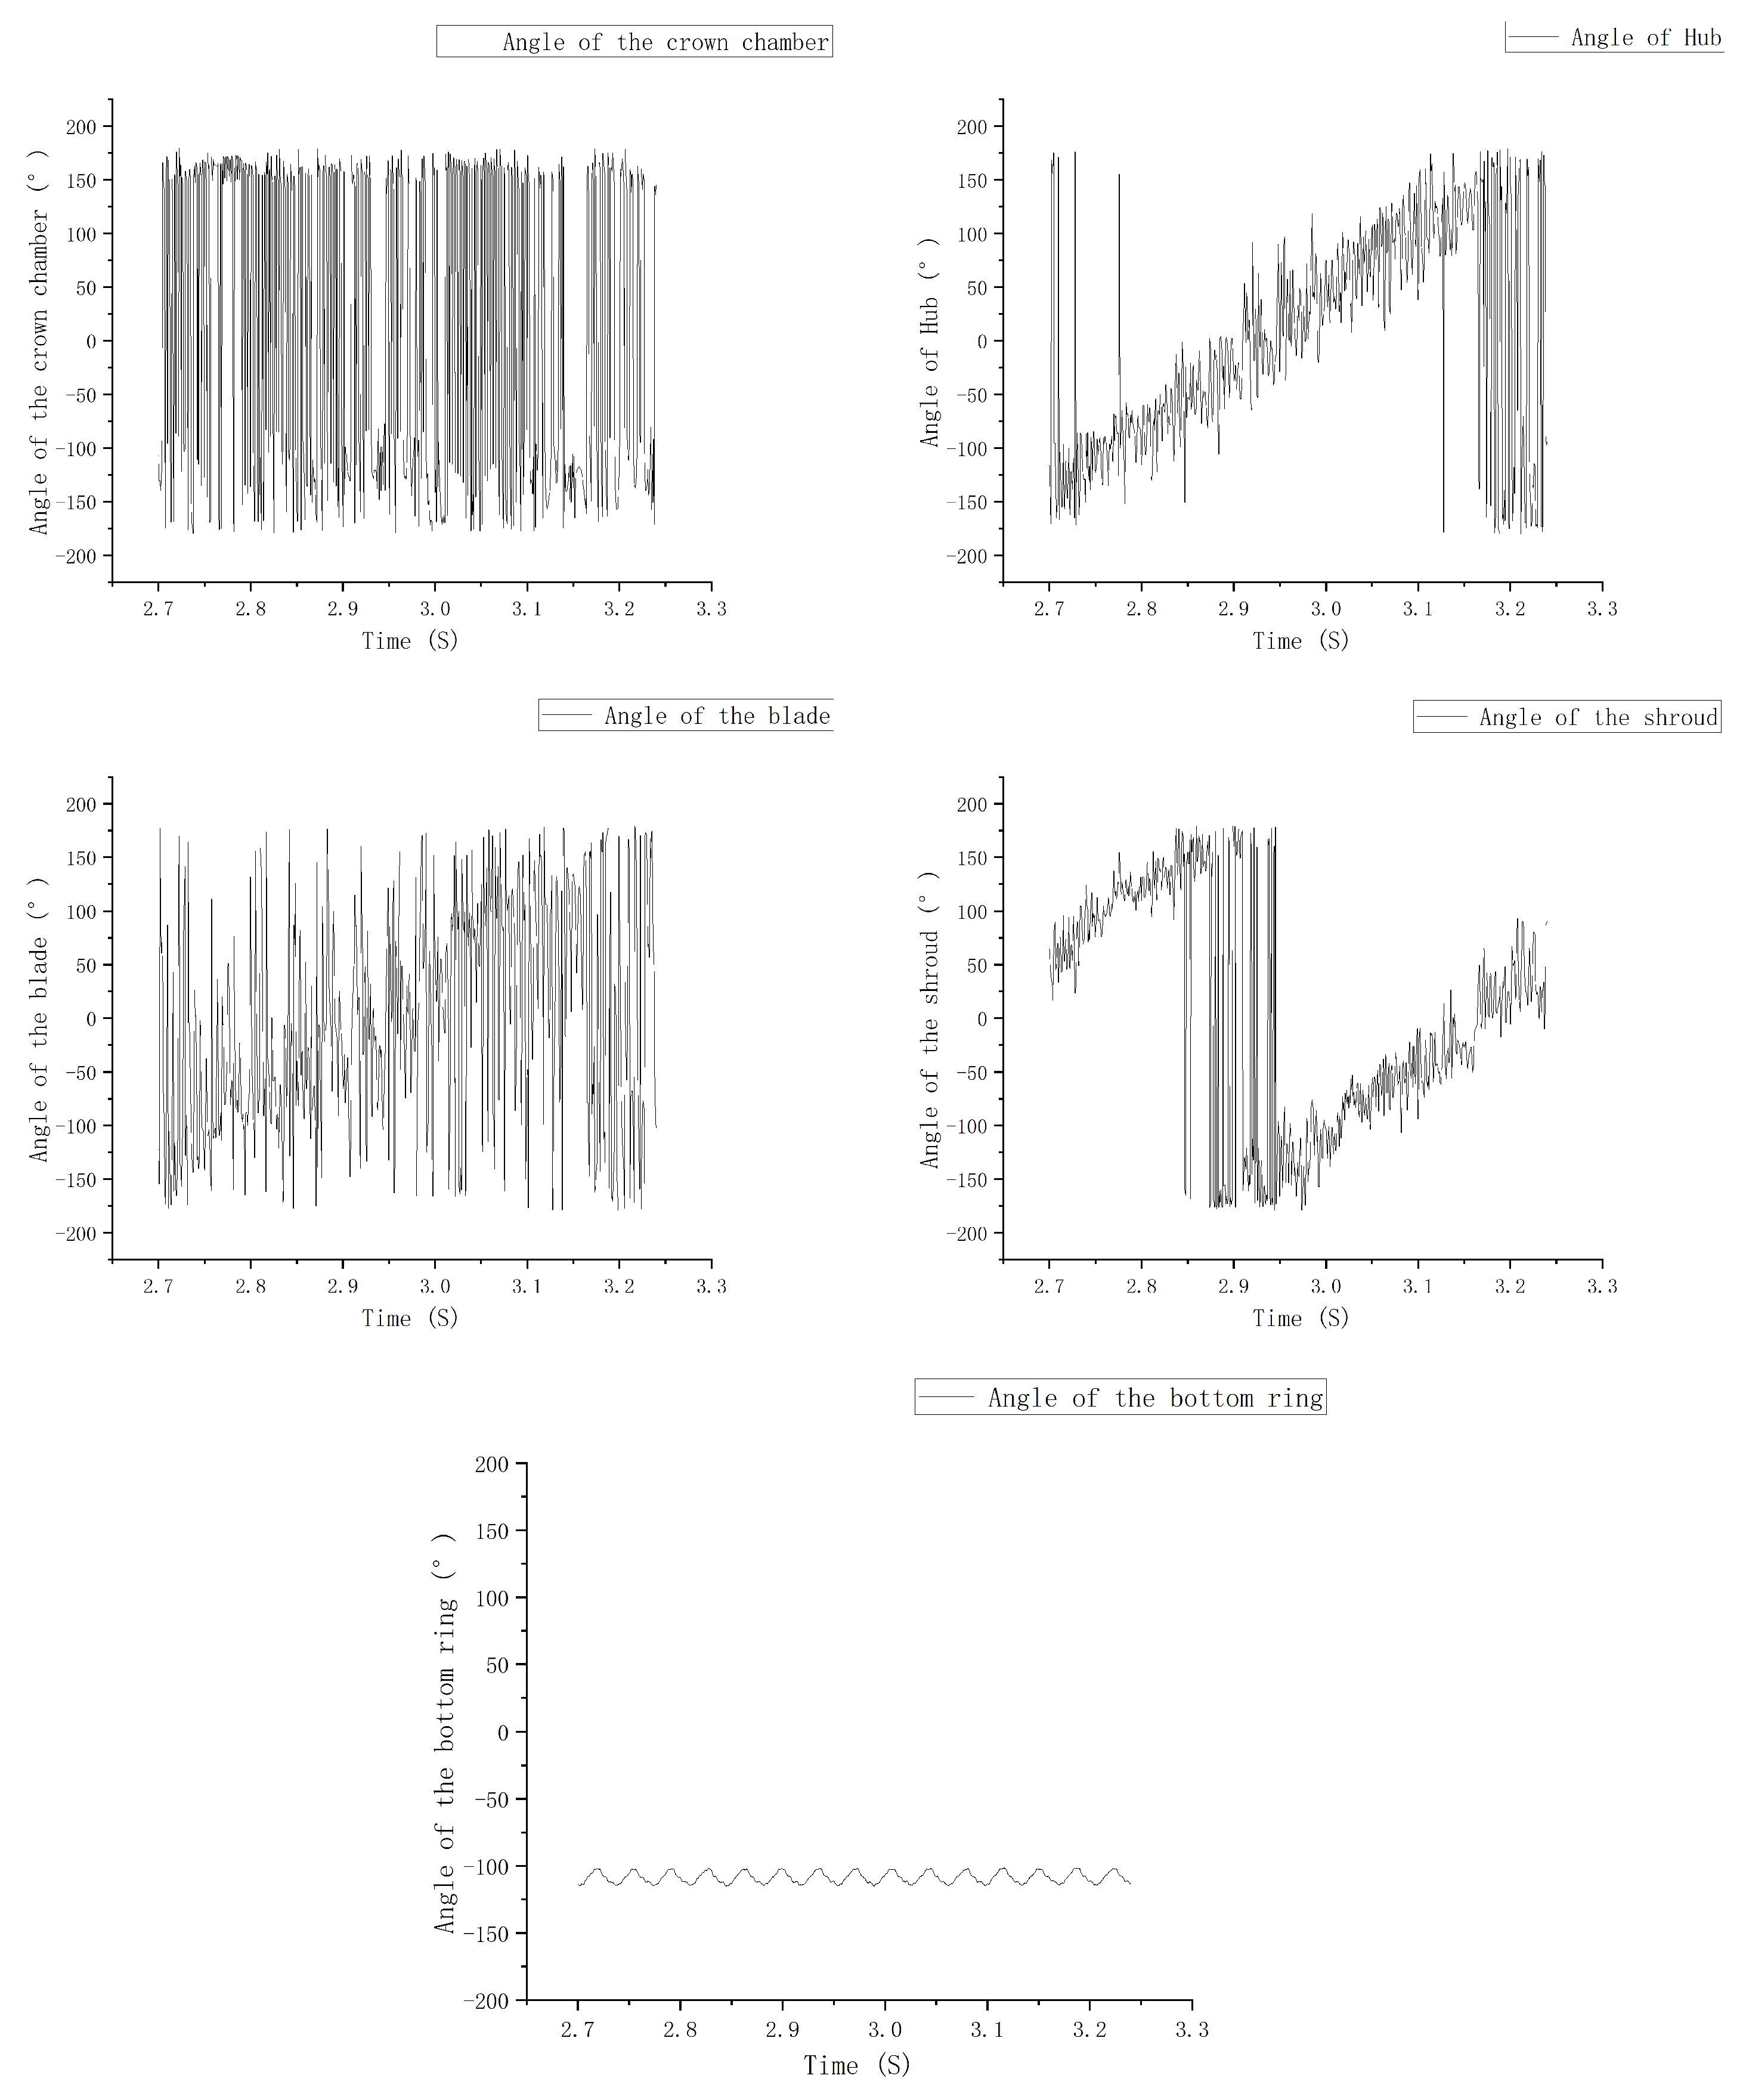
The force of the unsteady calculation in the x and y directions of the last revolution was exported and converted into polar coordinates to obtain the polar diameter and angle. The data was read and used the FFT transform to used to obtain the time domain plot and frequency domain plot.
In Figure 14 and Figure 15, it can be seen that the radial installation deviation had different influences on the radial force of each flow domain.
- 1.
- The crown chamber
As can be seen from the images of the magnitude and direction of the comprehensive force changing over time, the radial installation deviation had a great influence on the crown chamber, which can be seen from the operational images of each component. Except for the crown chamber image, the other images did not have large fluctuation points and had a certain periodicity. However, the crown chamber image still had large fluctuation points after a long calculation. Nevertheless, we can see some patterns in this image:
- (1)
- The force received by the crown chamber was the smallest. Although there are large force fluctuations, the average force value was the lowest among all the components.
- (2)
- The direction of the crown chamber force mostly focused on the direction from −50 to −150 showed in Figure 15. This was consistent with the position change of the high-pressure area we later observed.
- 2.
- The runner
Because we only considered the eccentric rotation of the runner and did not consider the static movement of the runner, the change in the force displayed over time was the same as the characteristics of the runner without radial installation deviation, which was in accordance with a certain period of vibration. Considering the angle of the force in Figure 15, it can be seen that the hub, the blade, and the shroud cover plate changed from −150 to 150 over time. It can be imagined that this was the vibration of the runner in the process of operation. In addition, the phase of the shroud cover plate was different from that of the other two parts. Combined with the picture analysis, in the middle of a cycle, the direction of multiple forces was the biggest difference.
- 3.
- The bottom ring
Because the clearance of the bottom ring was too narrow, the influence of radial deviation was not obvious. As can be seen, it was almost unaffected, with very regular periodic force fluctuations. The direction of the force was the same as that of the upper crown, which was in the position of −90 to −150. This was also because the deviation was at a minimum near this range, and this position also corresponded to the high-pressure area with a 0.5 mm wall velocity. Compared with other parts, the radial force of the bottom ring was the largest, which may be because the lower ring’s perpendicular force to the radial direction of the projector surface was large; in the case of a certain radial force, the lower ring bears more force.
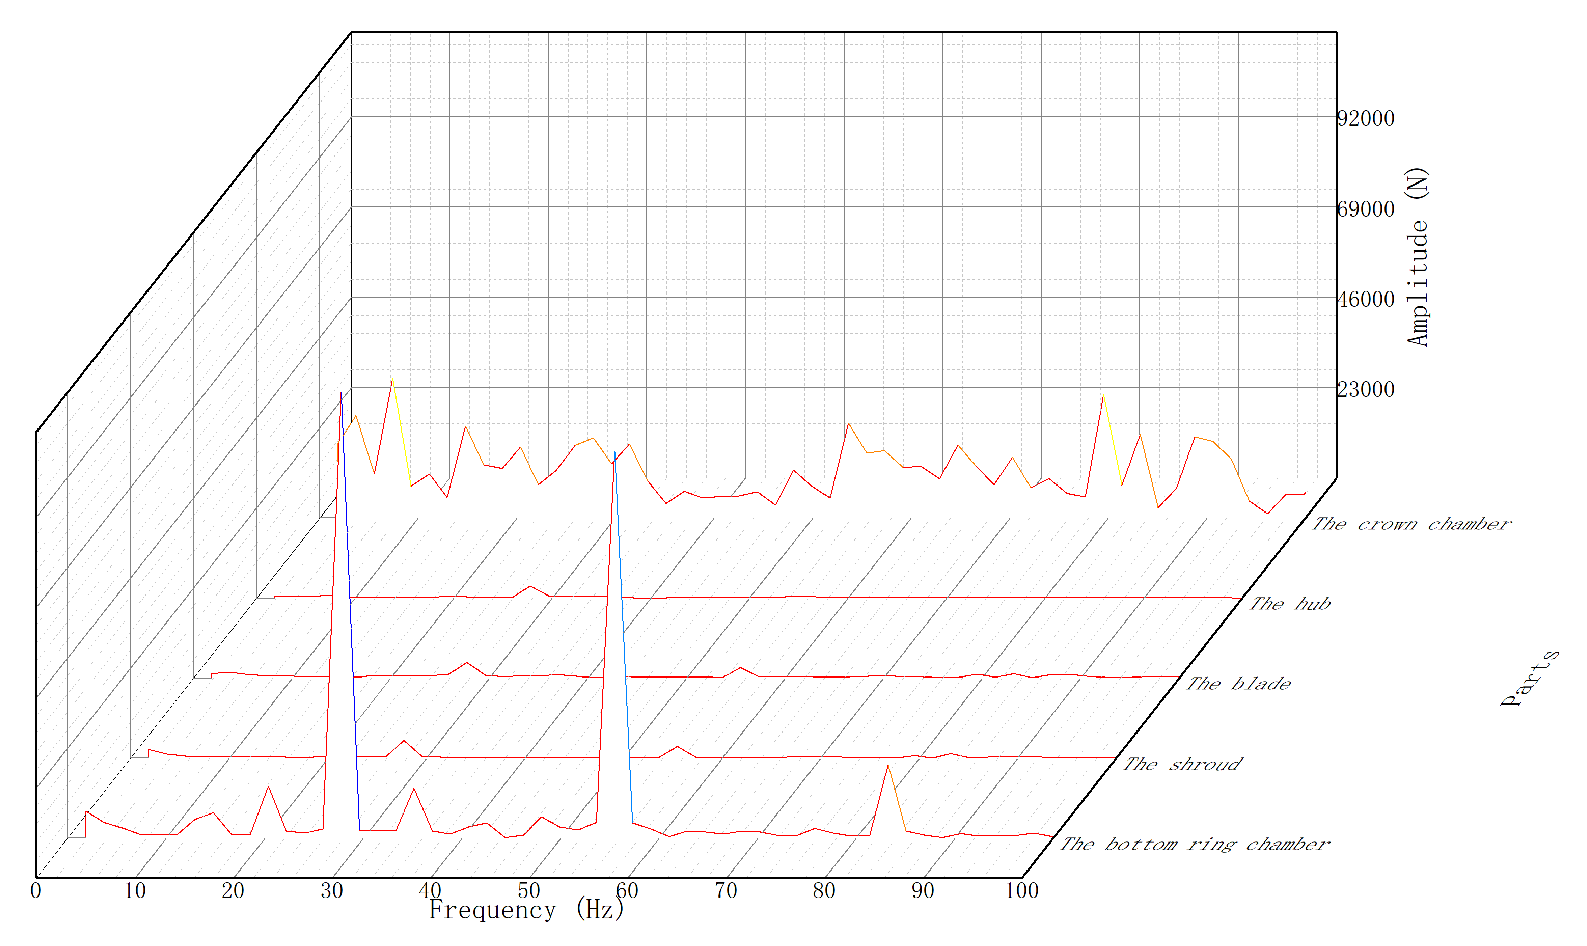
According to the Figure 16, it can be seen that the crown chamber was heavily affected by the radial deviation:
- 1.
- Under influence by radial deviation, the primary frequency of the hub, blade, and shroud was large, and the secondary frequency was the second. In addition, the third frequency of the bottom ring was obvious. The effect of the blade was greater than the other two.
- 2.
- In addition to the primary frequency and secondary frequency of the bottom ring, there were 0.75, 1.25, and 1.5 times the frequency, and other parts were not as large.
- 3.
- In addition, fluctuations could be seen in the curves of all components. It can be seen that radial deviation will cause great vibrations to the unit, among which the influence of the crown chamber would be the most obvious.
3.2.2. Pressure and Pressure Fluctuations
- 1.
- The crown chamber
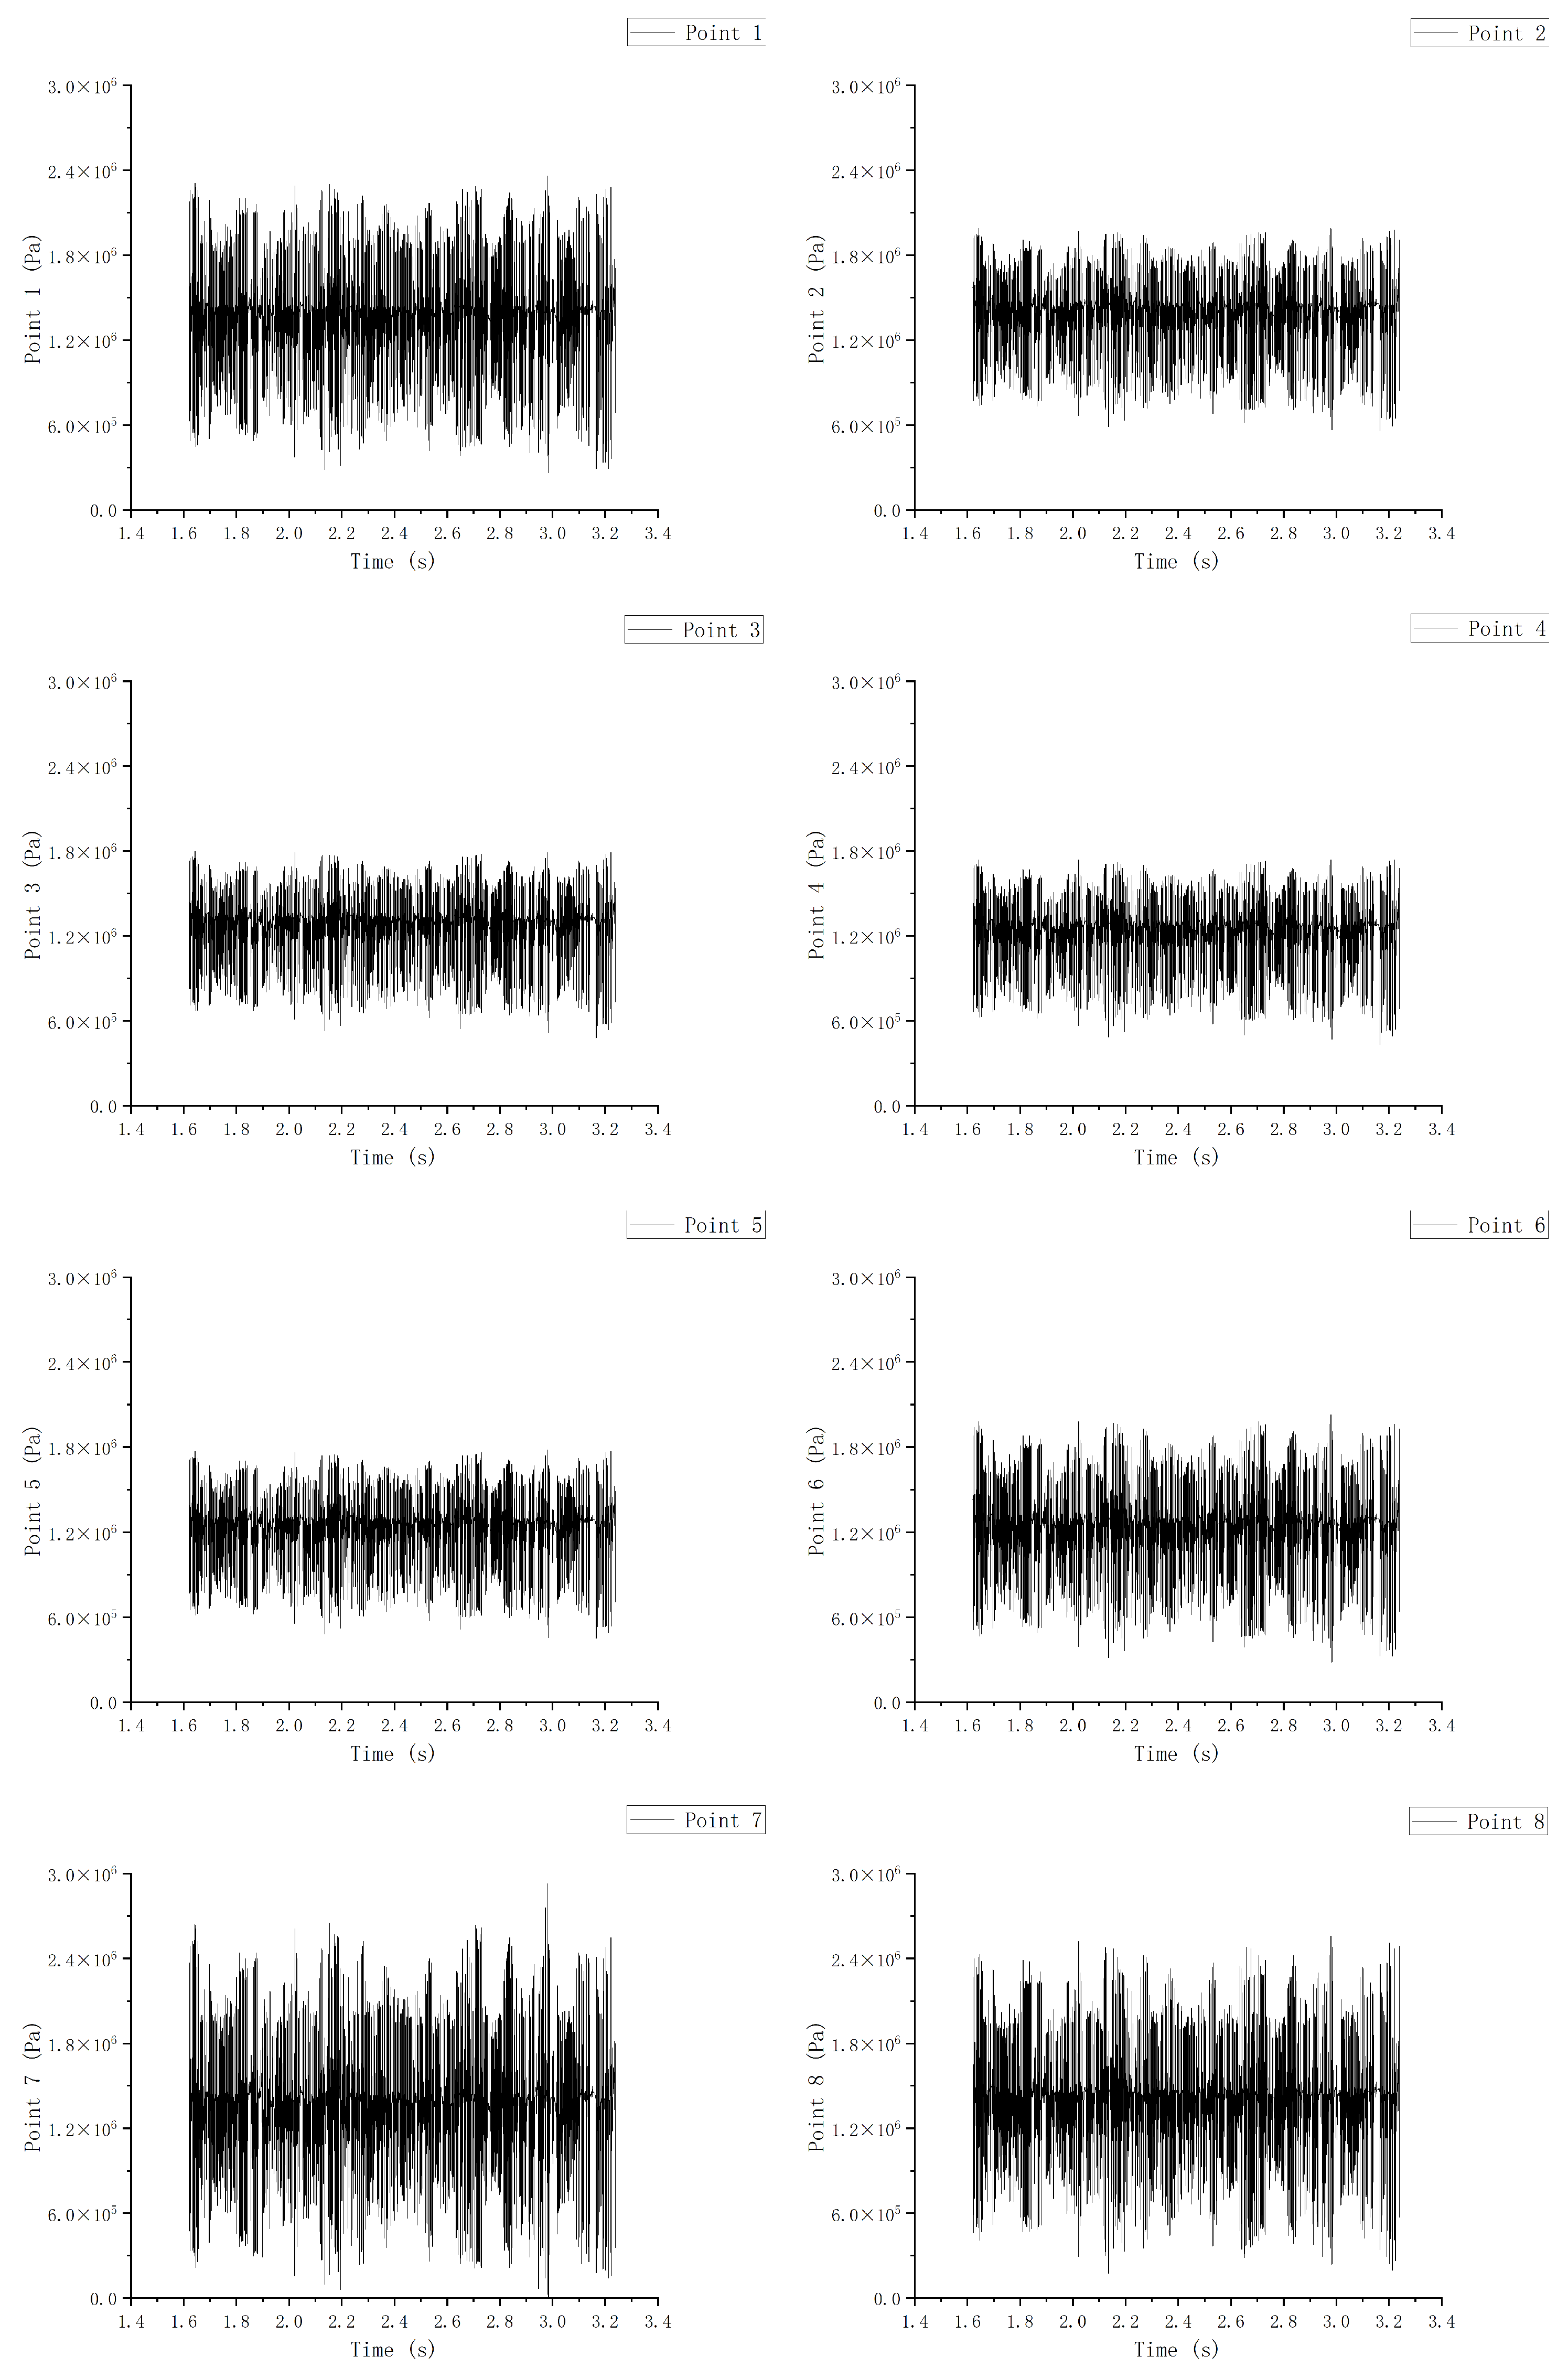
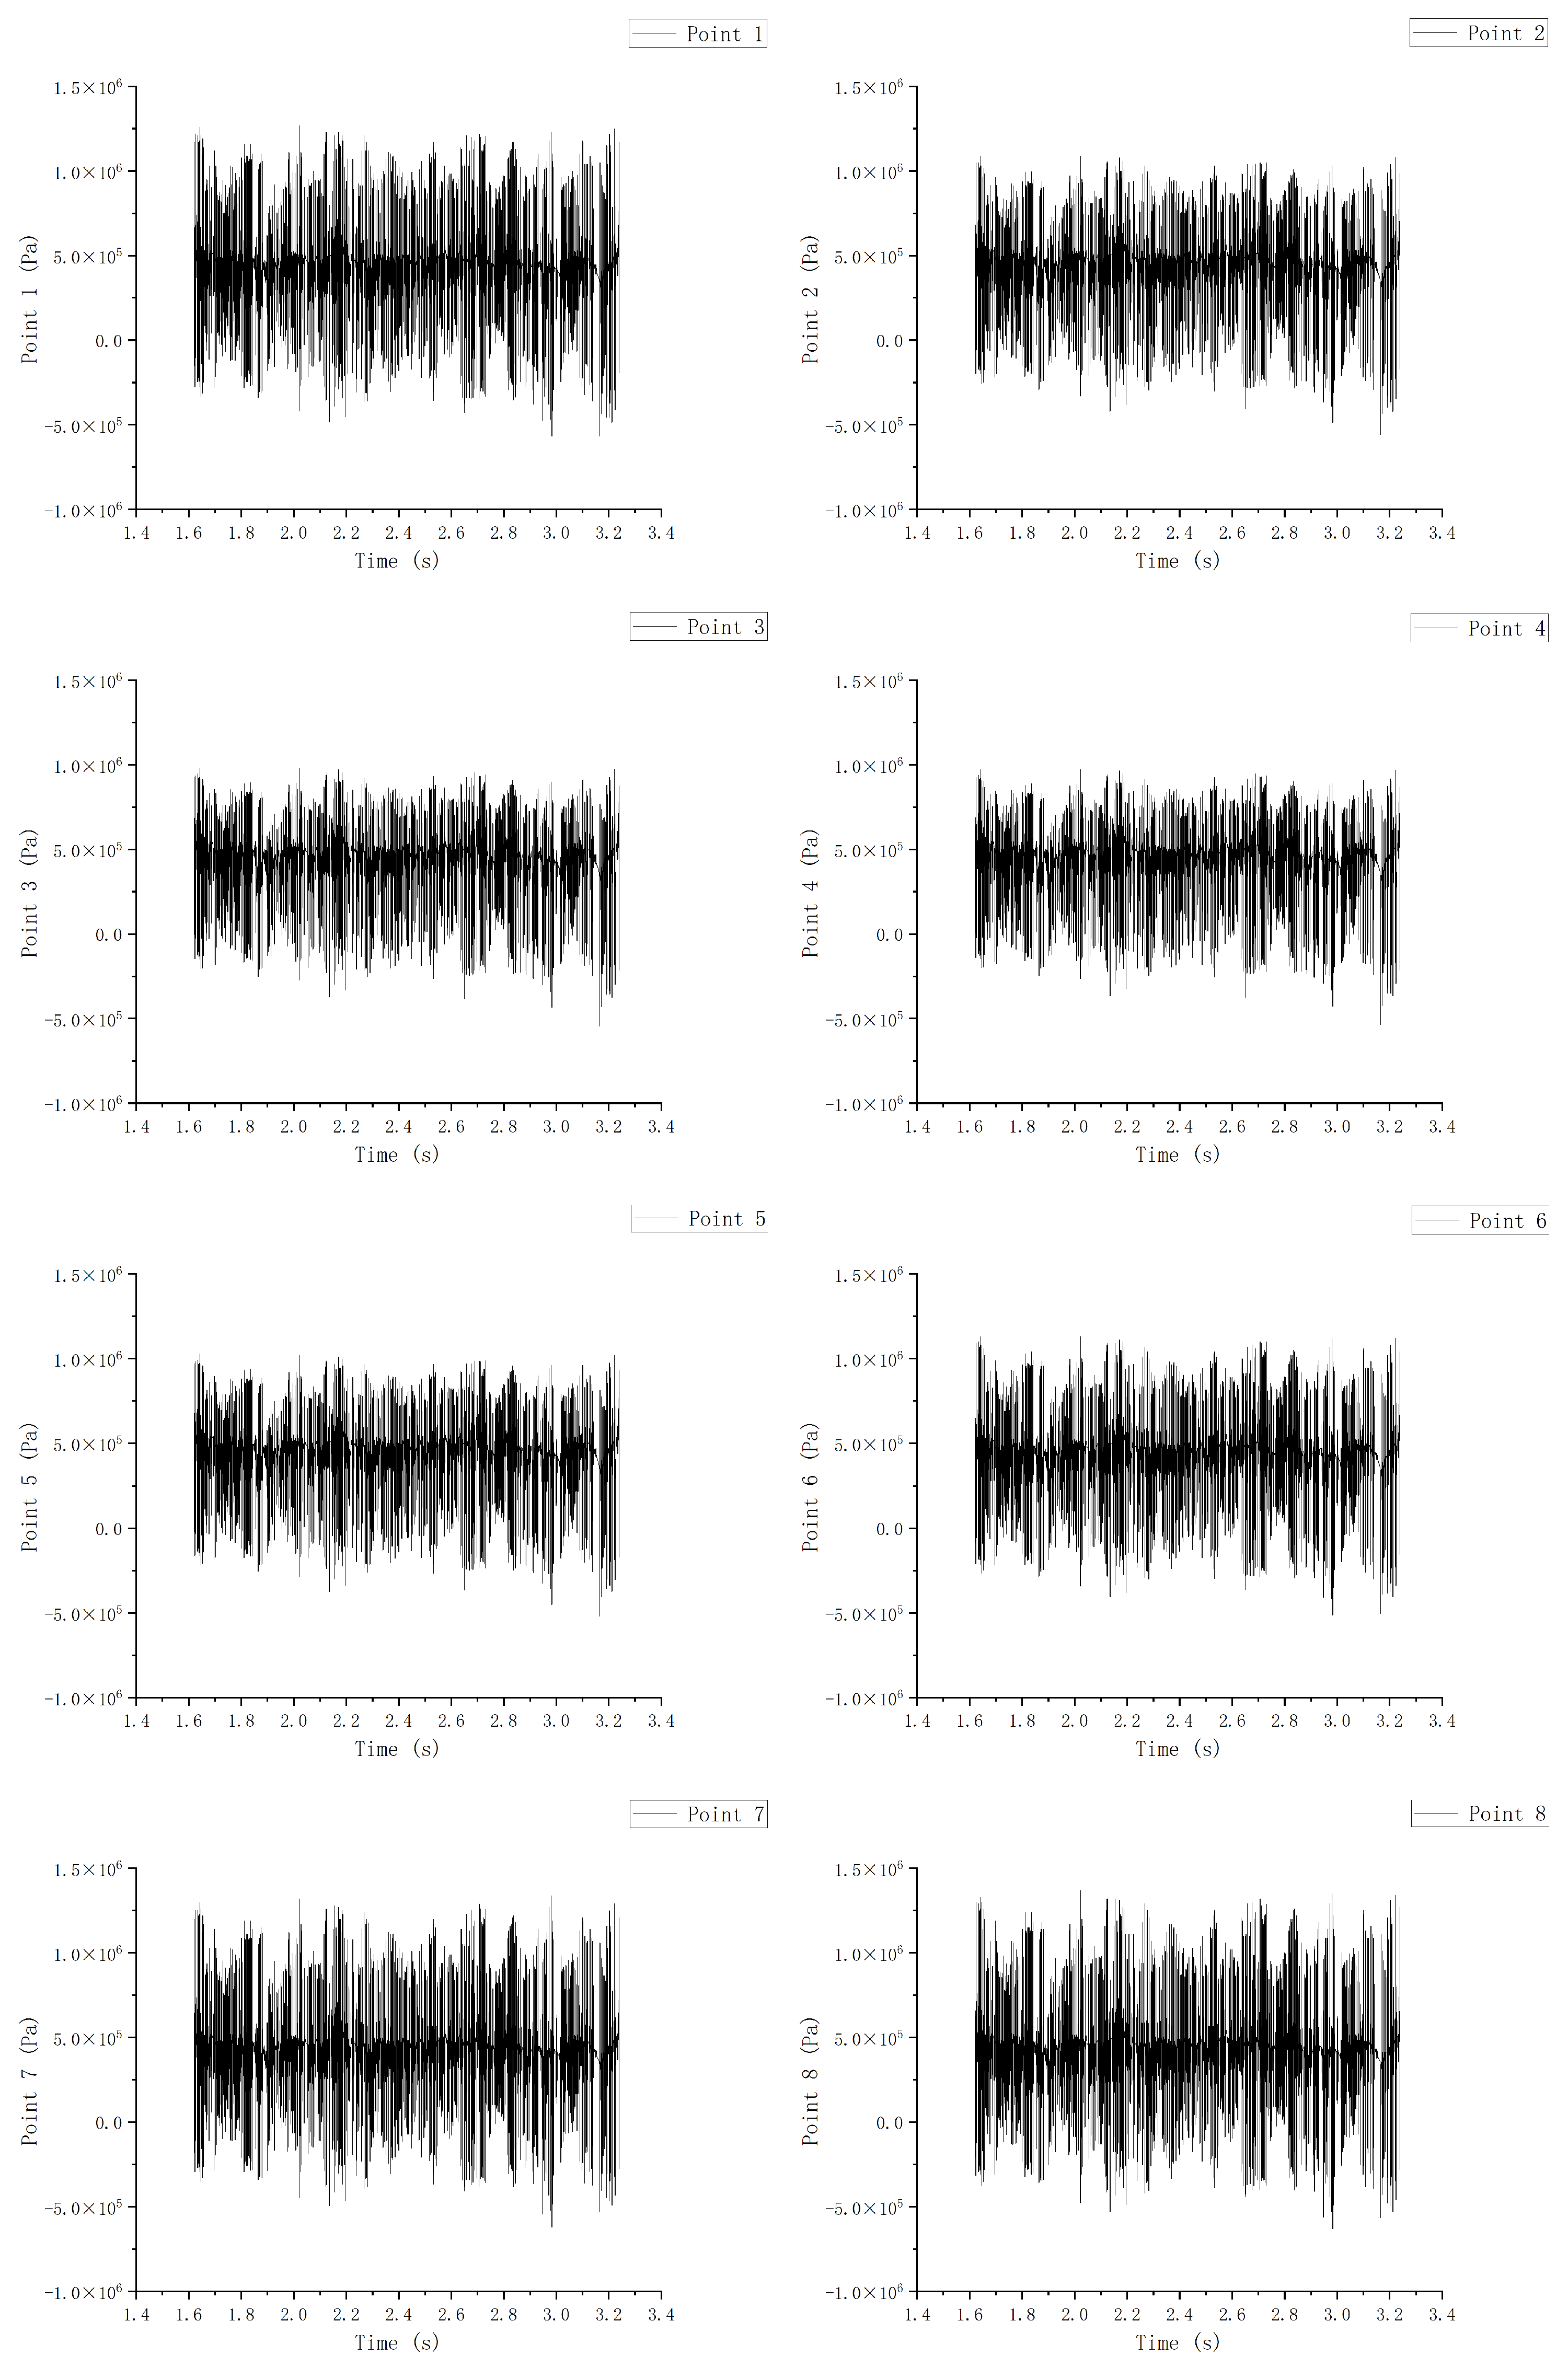
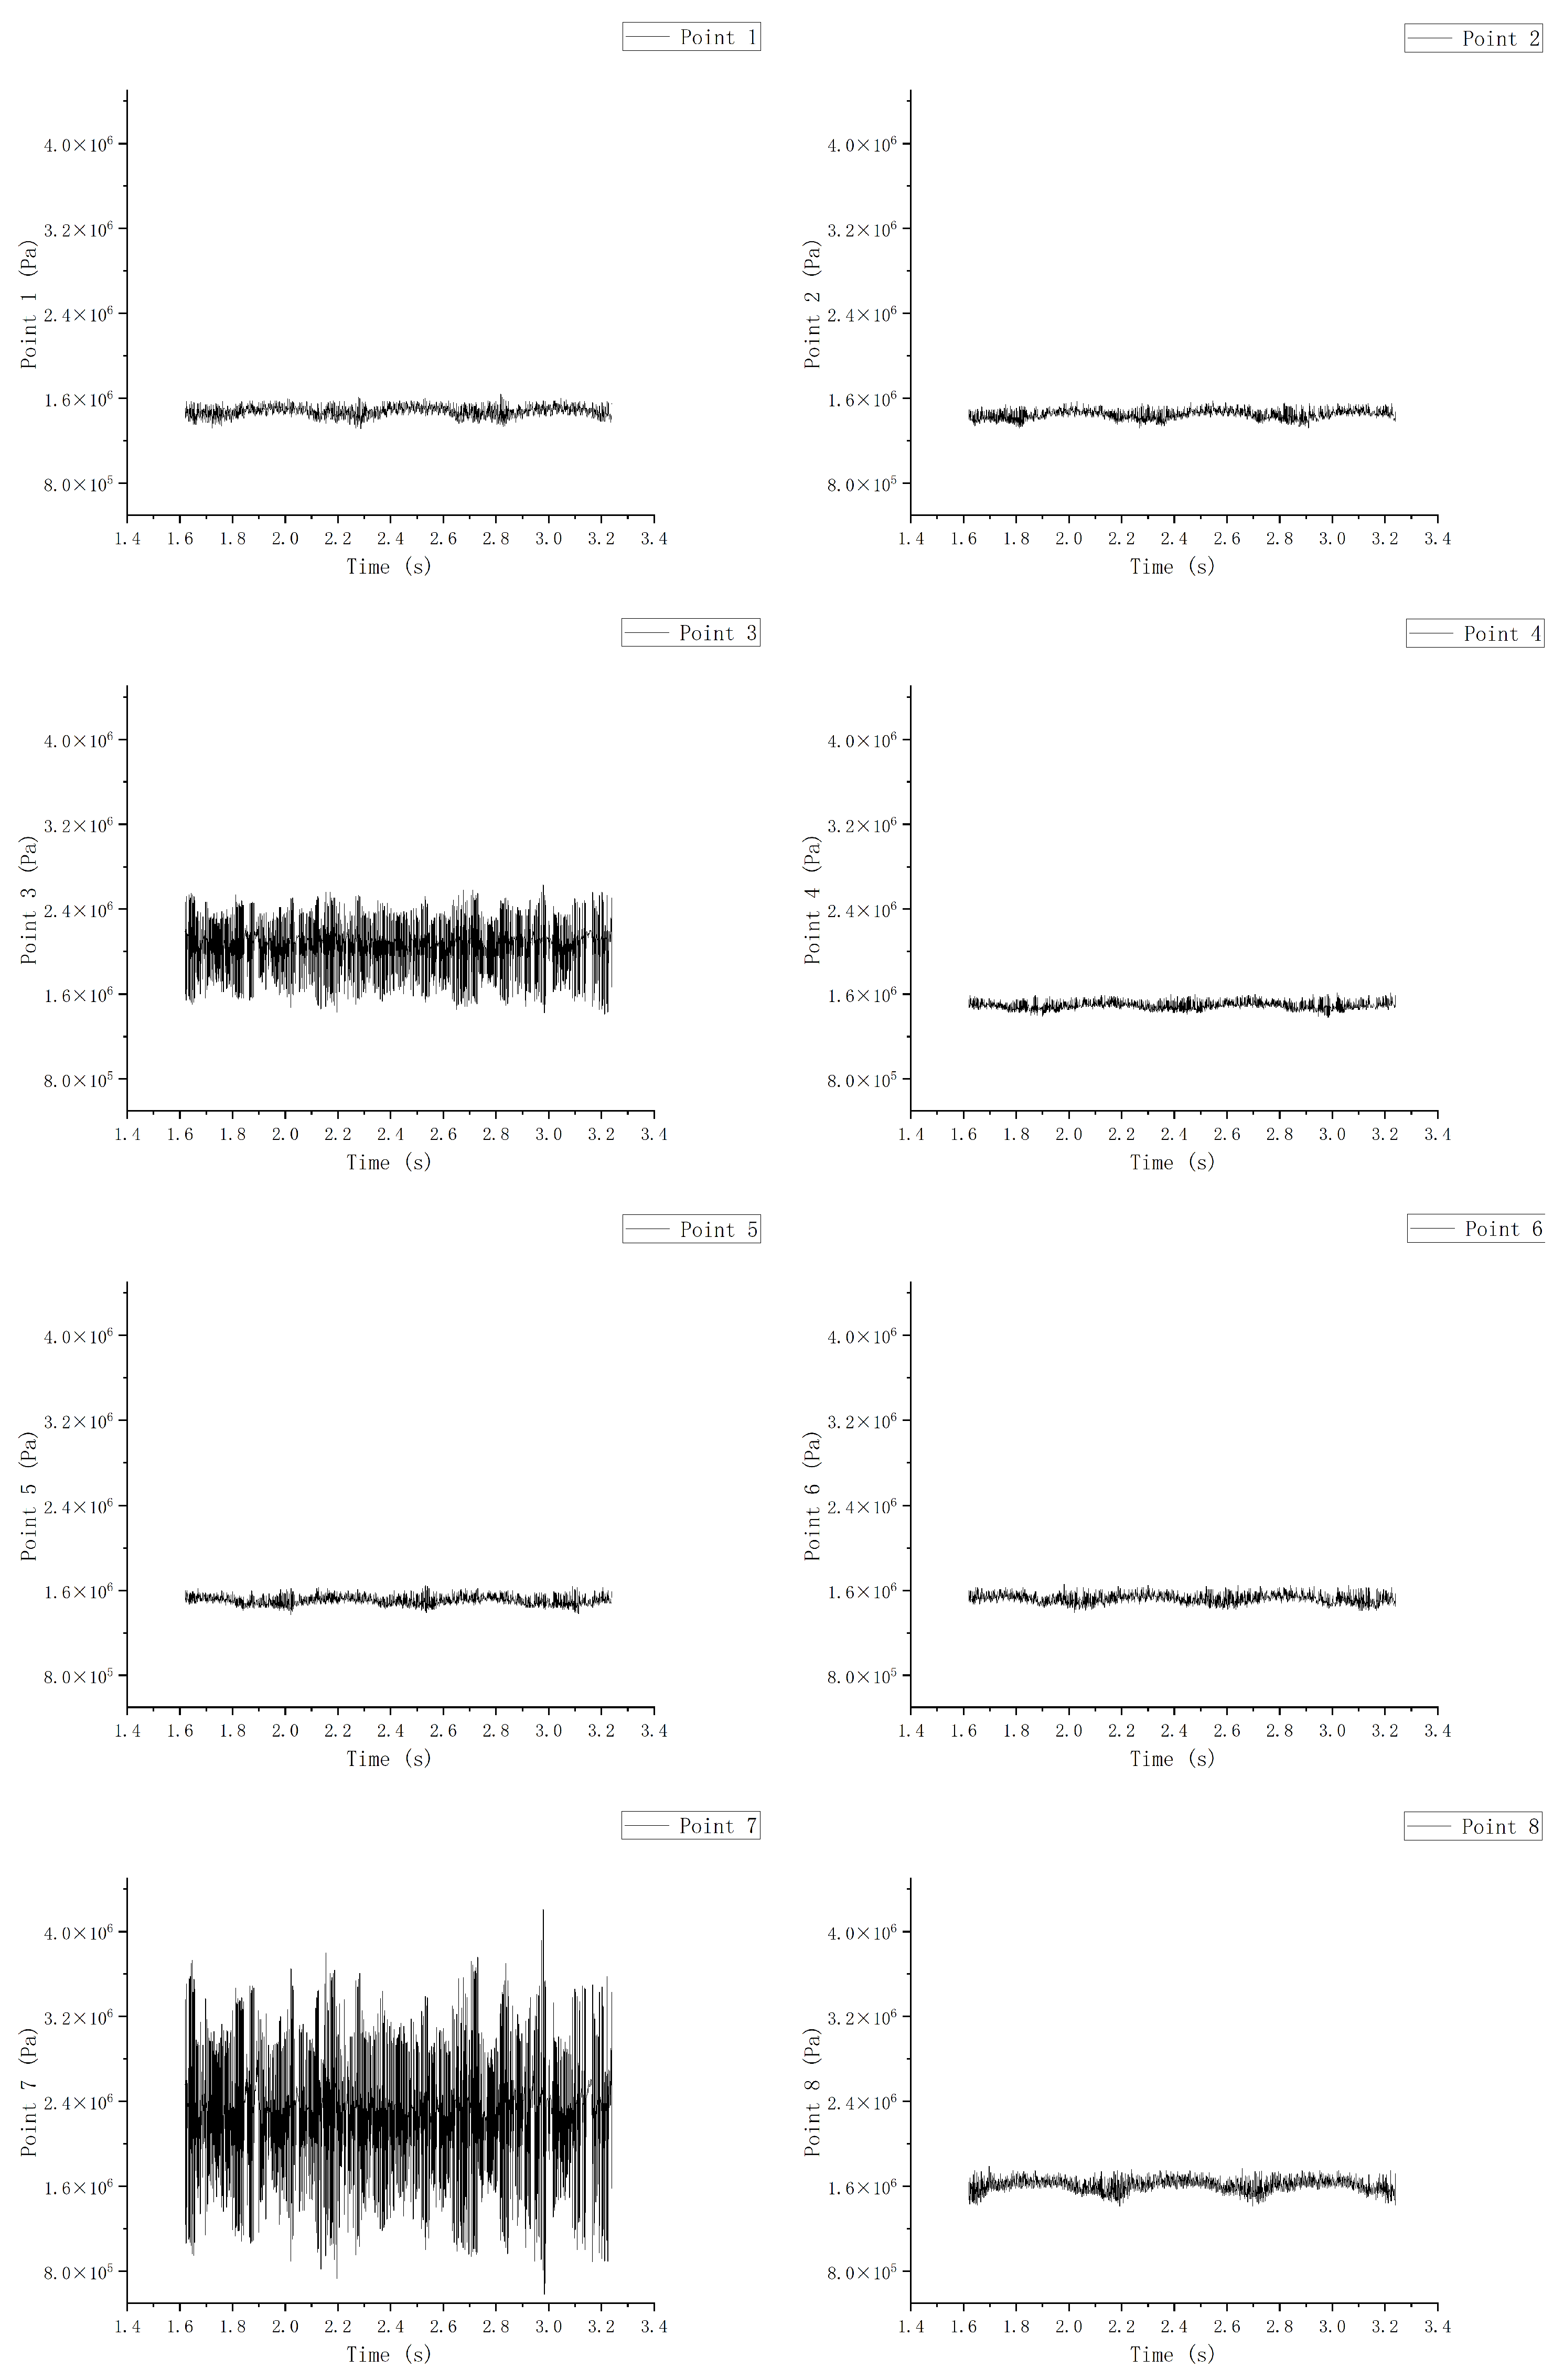
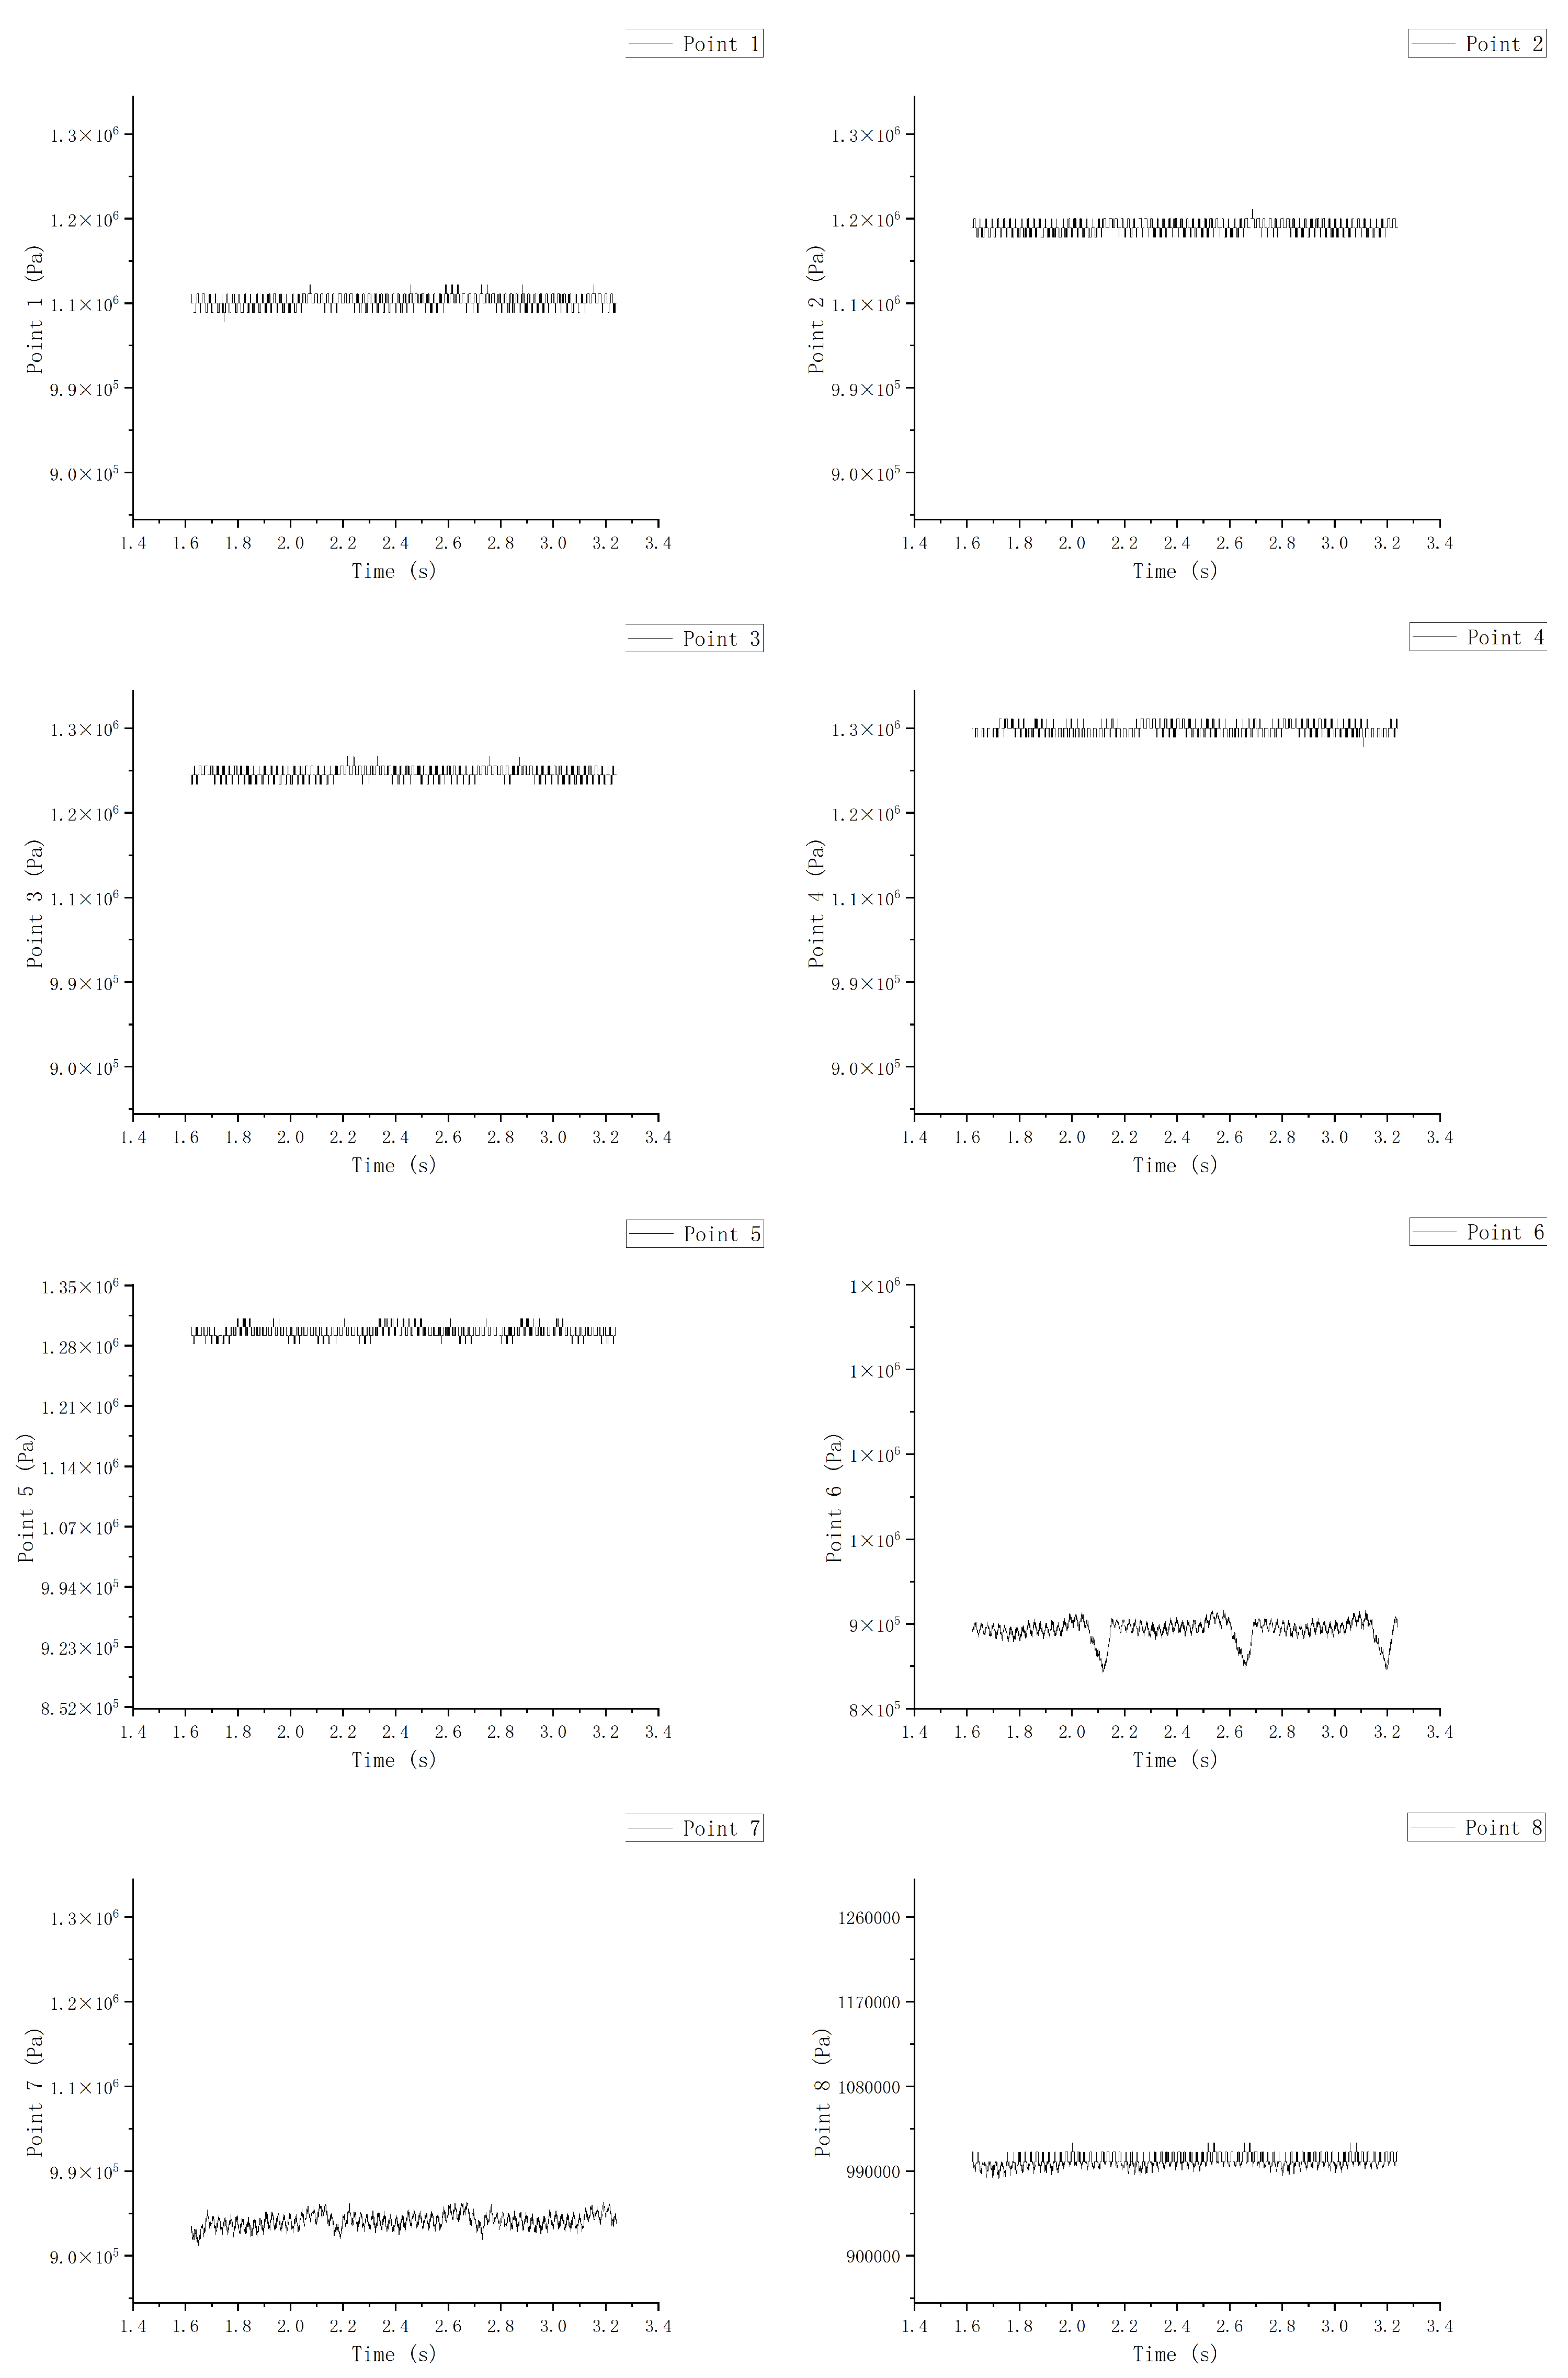
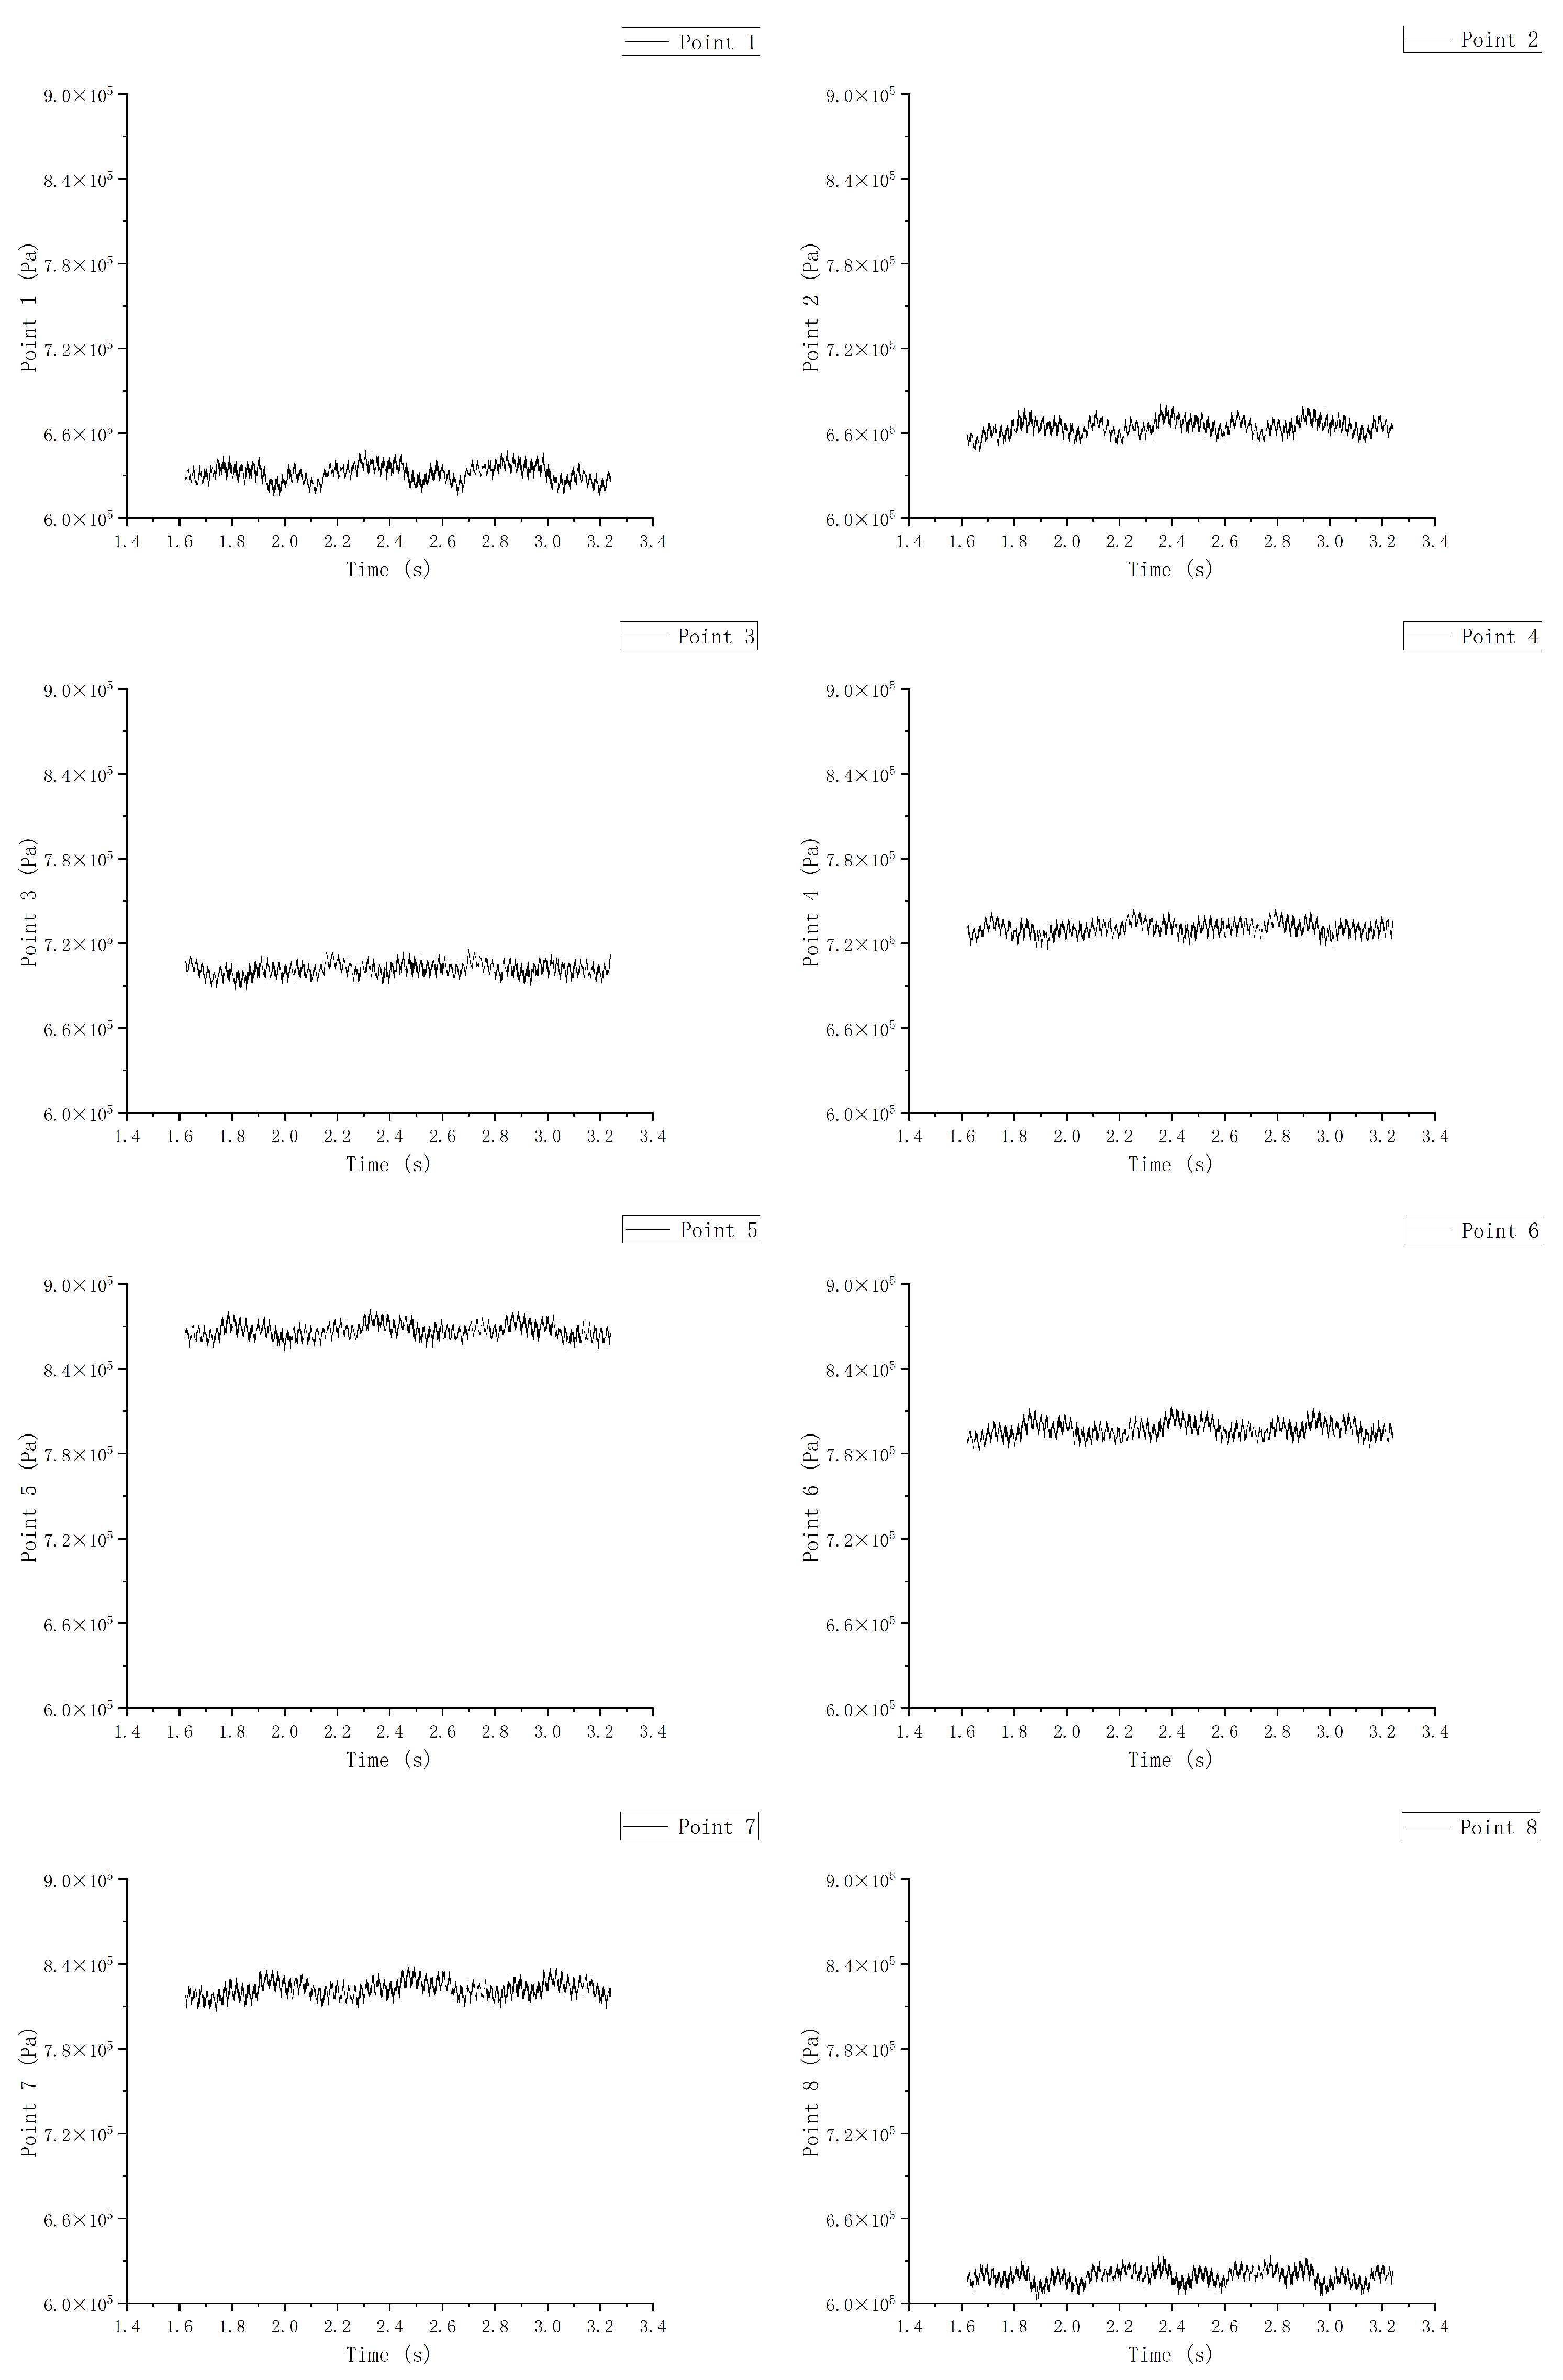
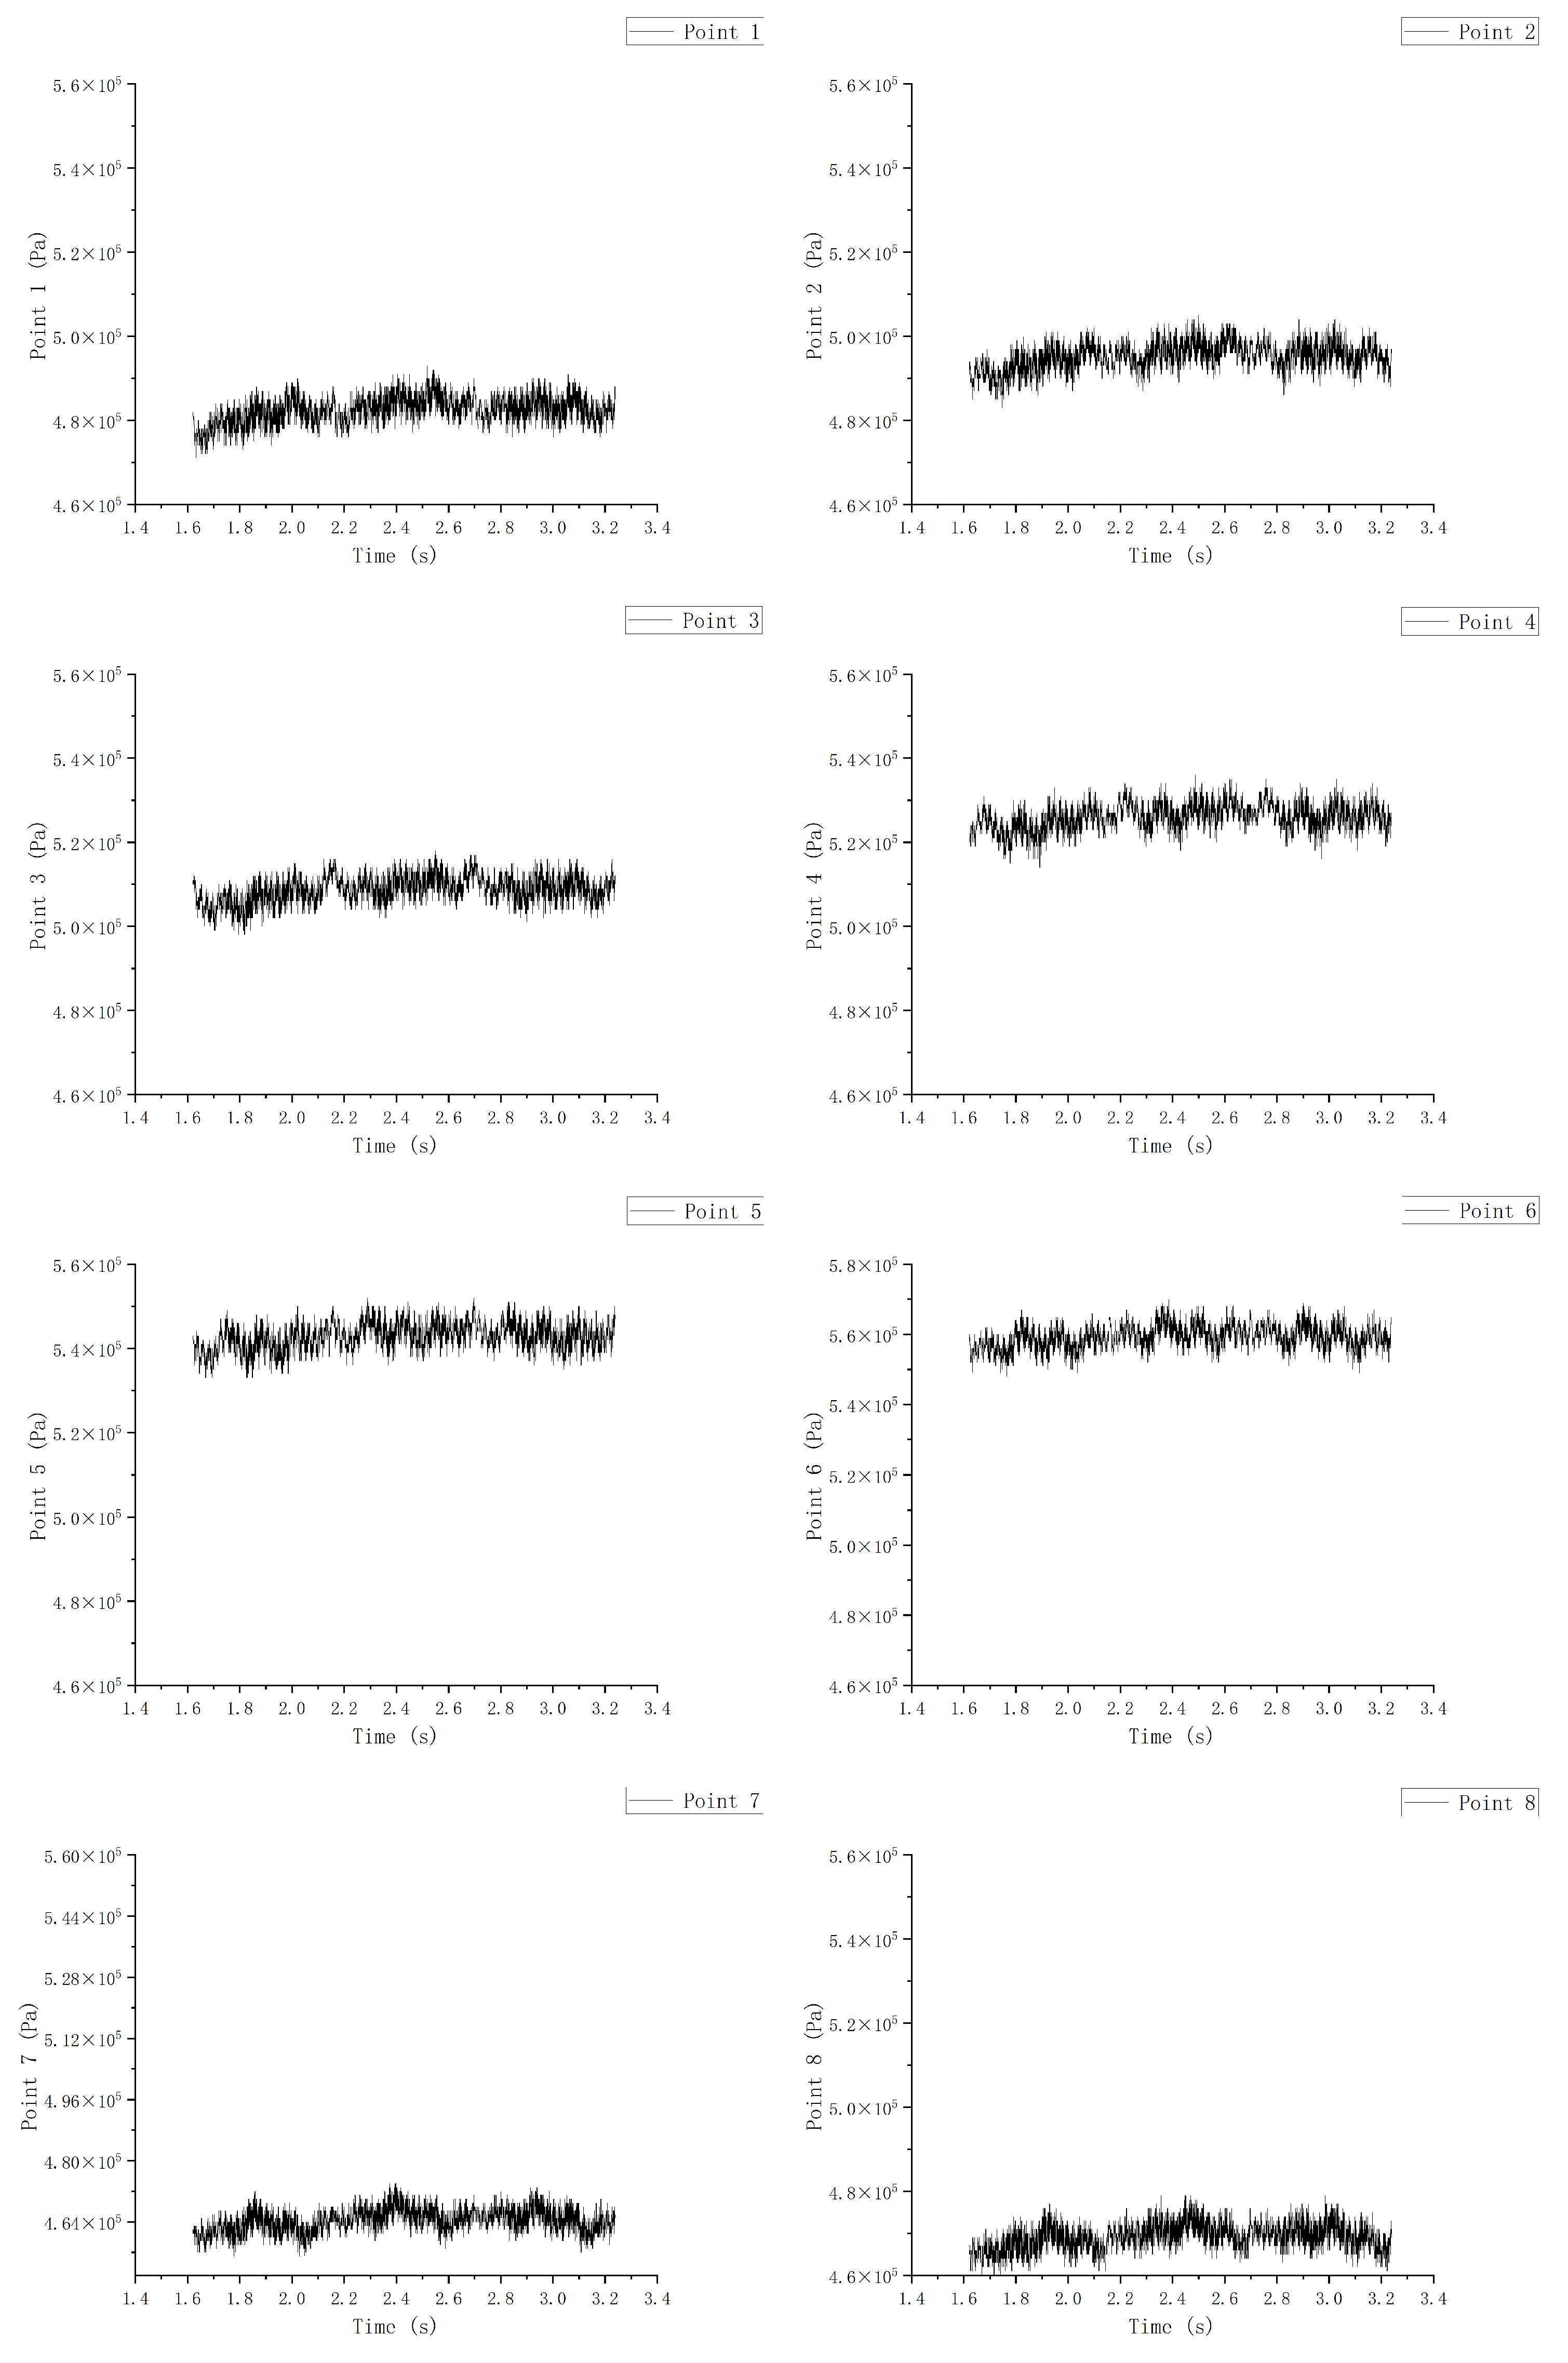
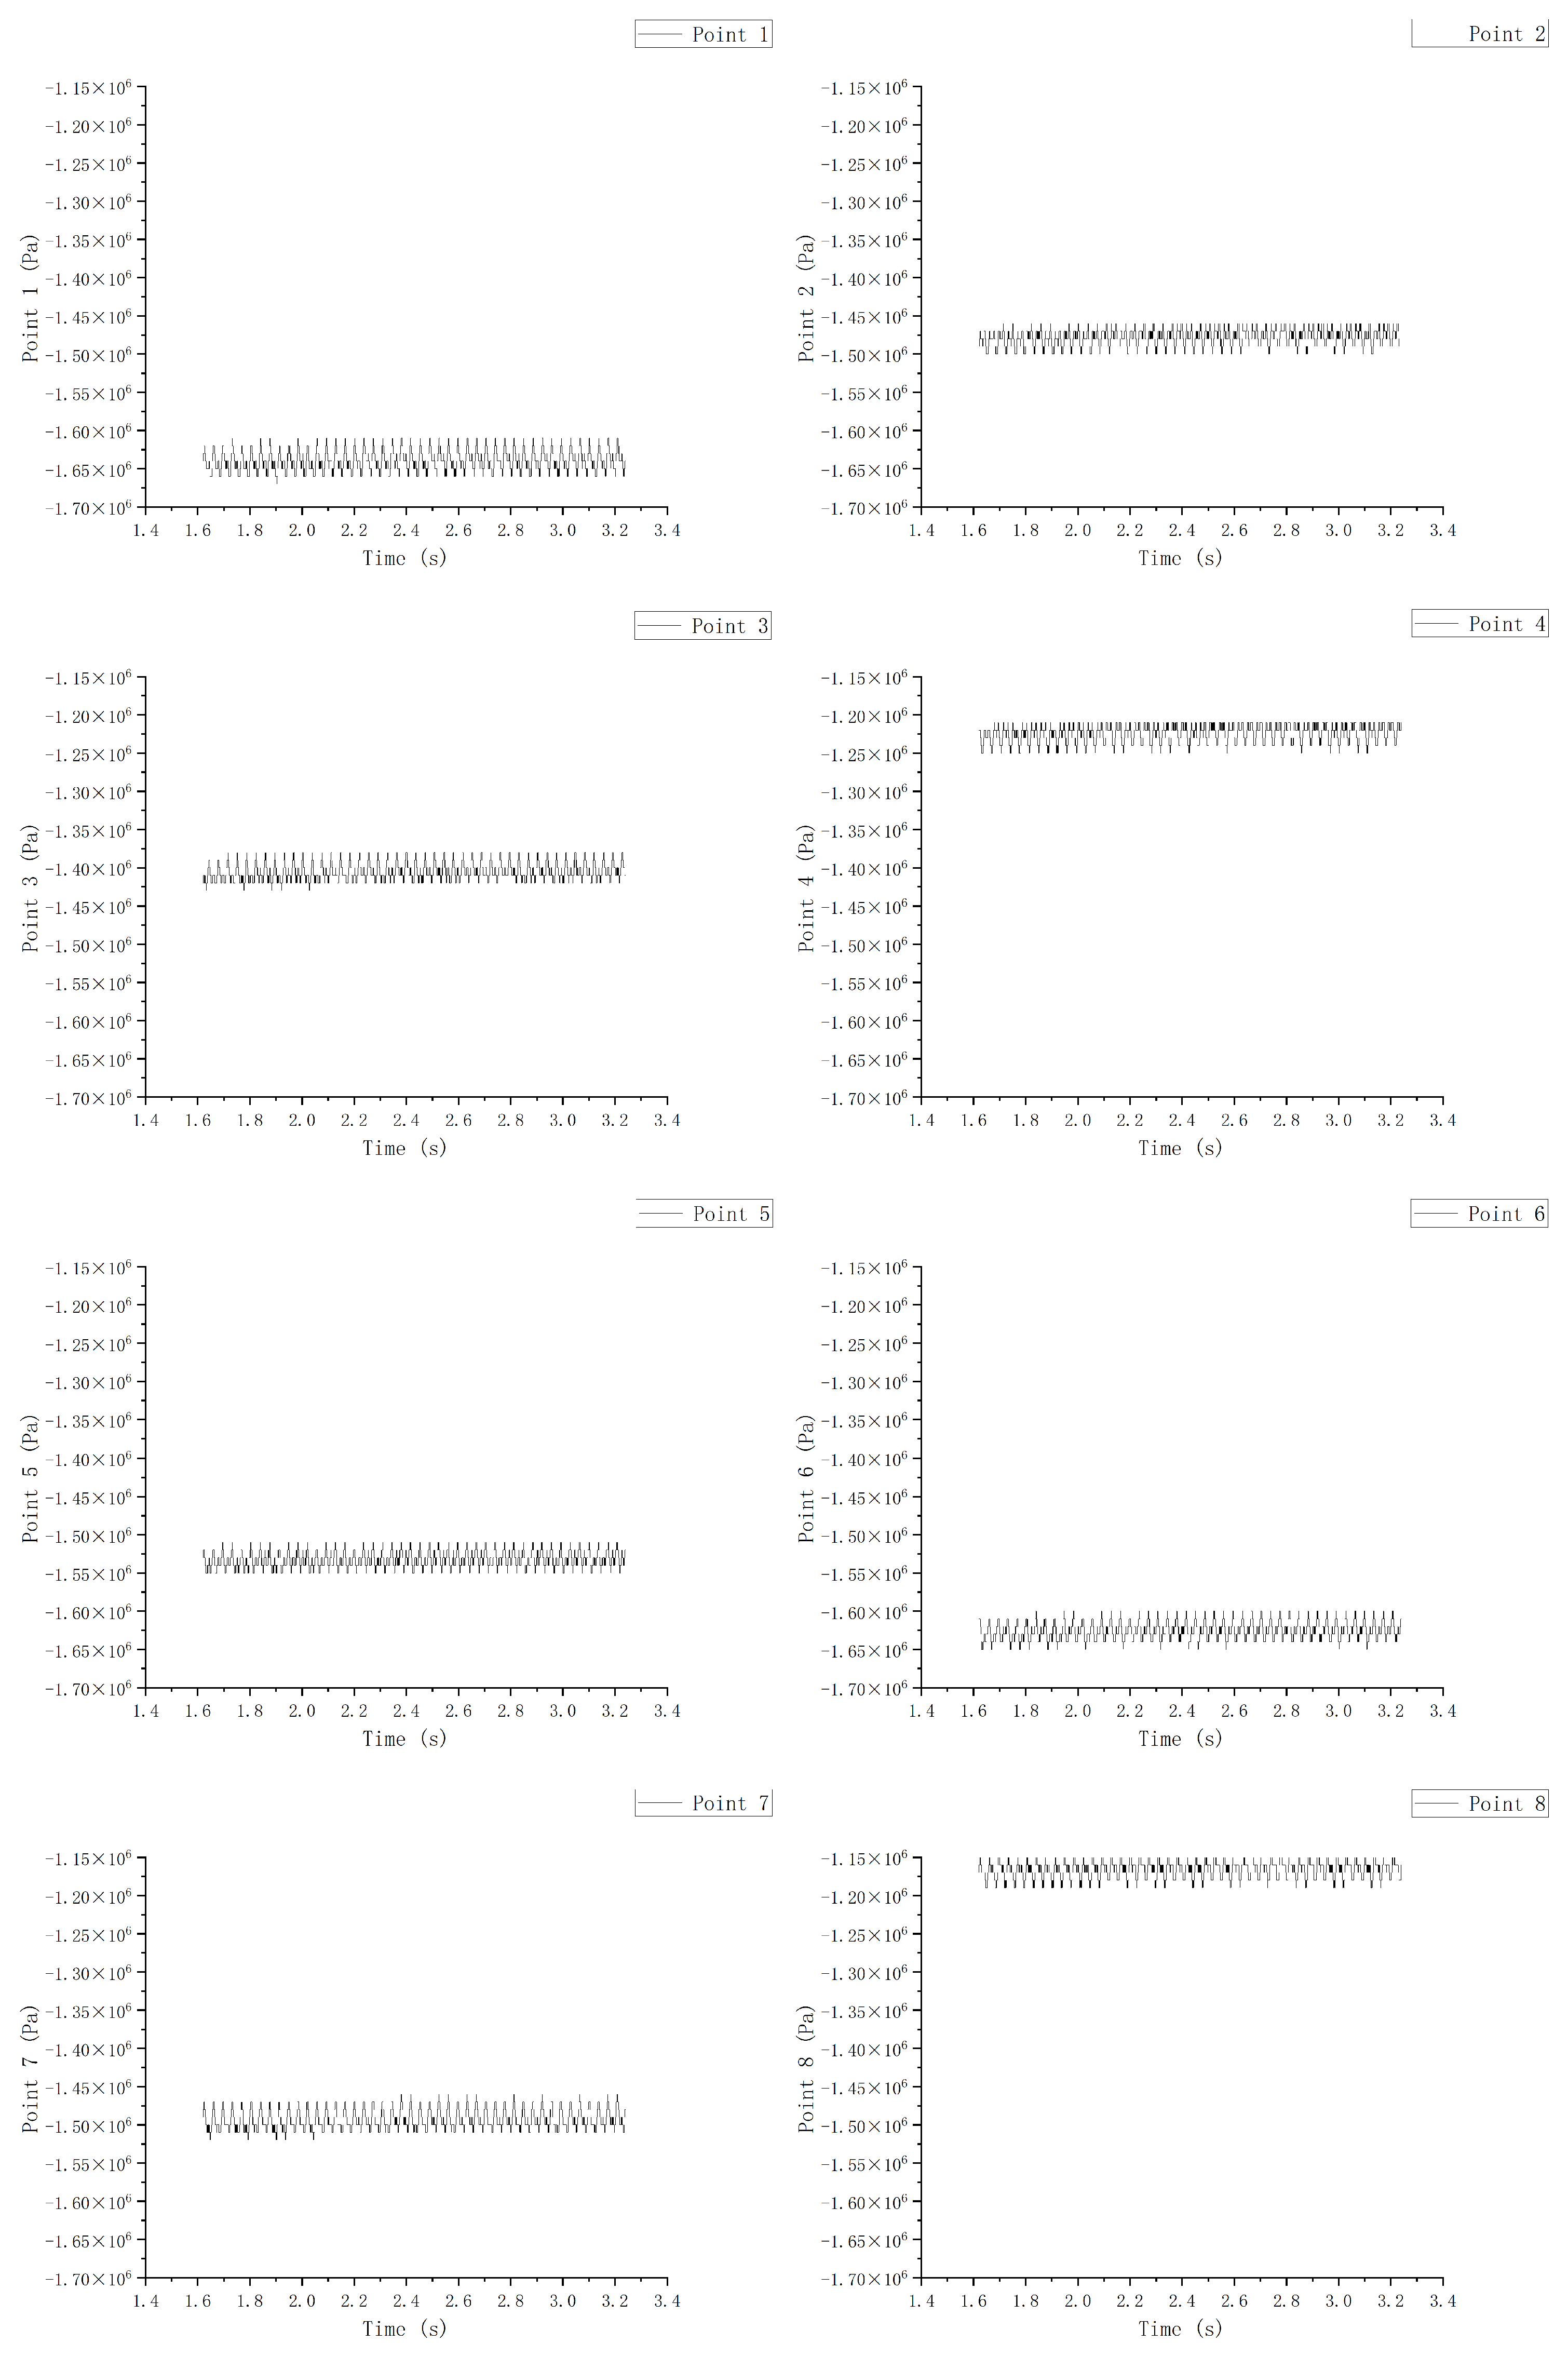
According to Figure 13, we obtained the pressure observation data of the upper, middle, and lower parts every 8 points for a total of 24 points along the circumferential direction of the crown chamber.
As we can see, the data of pressure was similar to that of radial force. Since the crown chamber was greatly affected by radial force, its pressure fluctuated violently, which was still very messy even after a long calculation. However, as can be seen from the comparison in Figure 17, Figure 18 and Figure 19, the pressure fluctuations in the middle part of the crown chamber, that is, the crown chamber cavity, were the most drastic, followed by the sealing part of the crown chamber, and the clearance closest to the runner had the least influence. In addition, in the upper direction, it can be seen that point 3 and point 7 were the most intense. Since point 3 was the high-pressure area and point 7 was the place with the minimum clearance, the pressure of both was most obviously affected by the clearance.
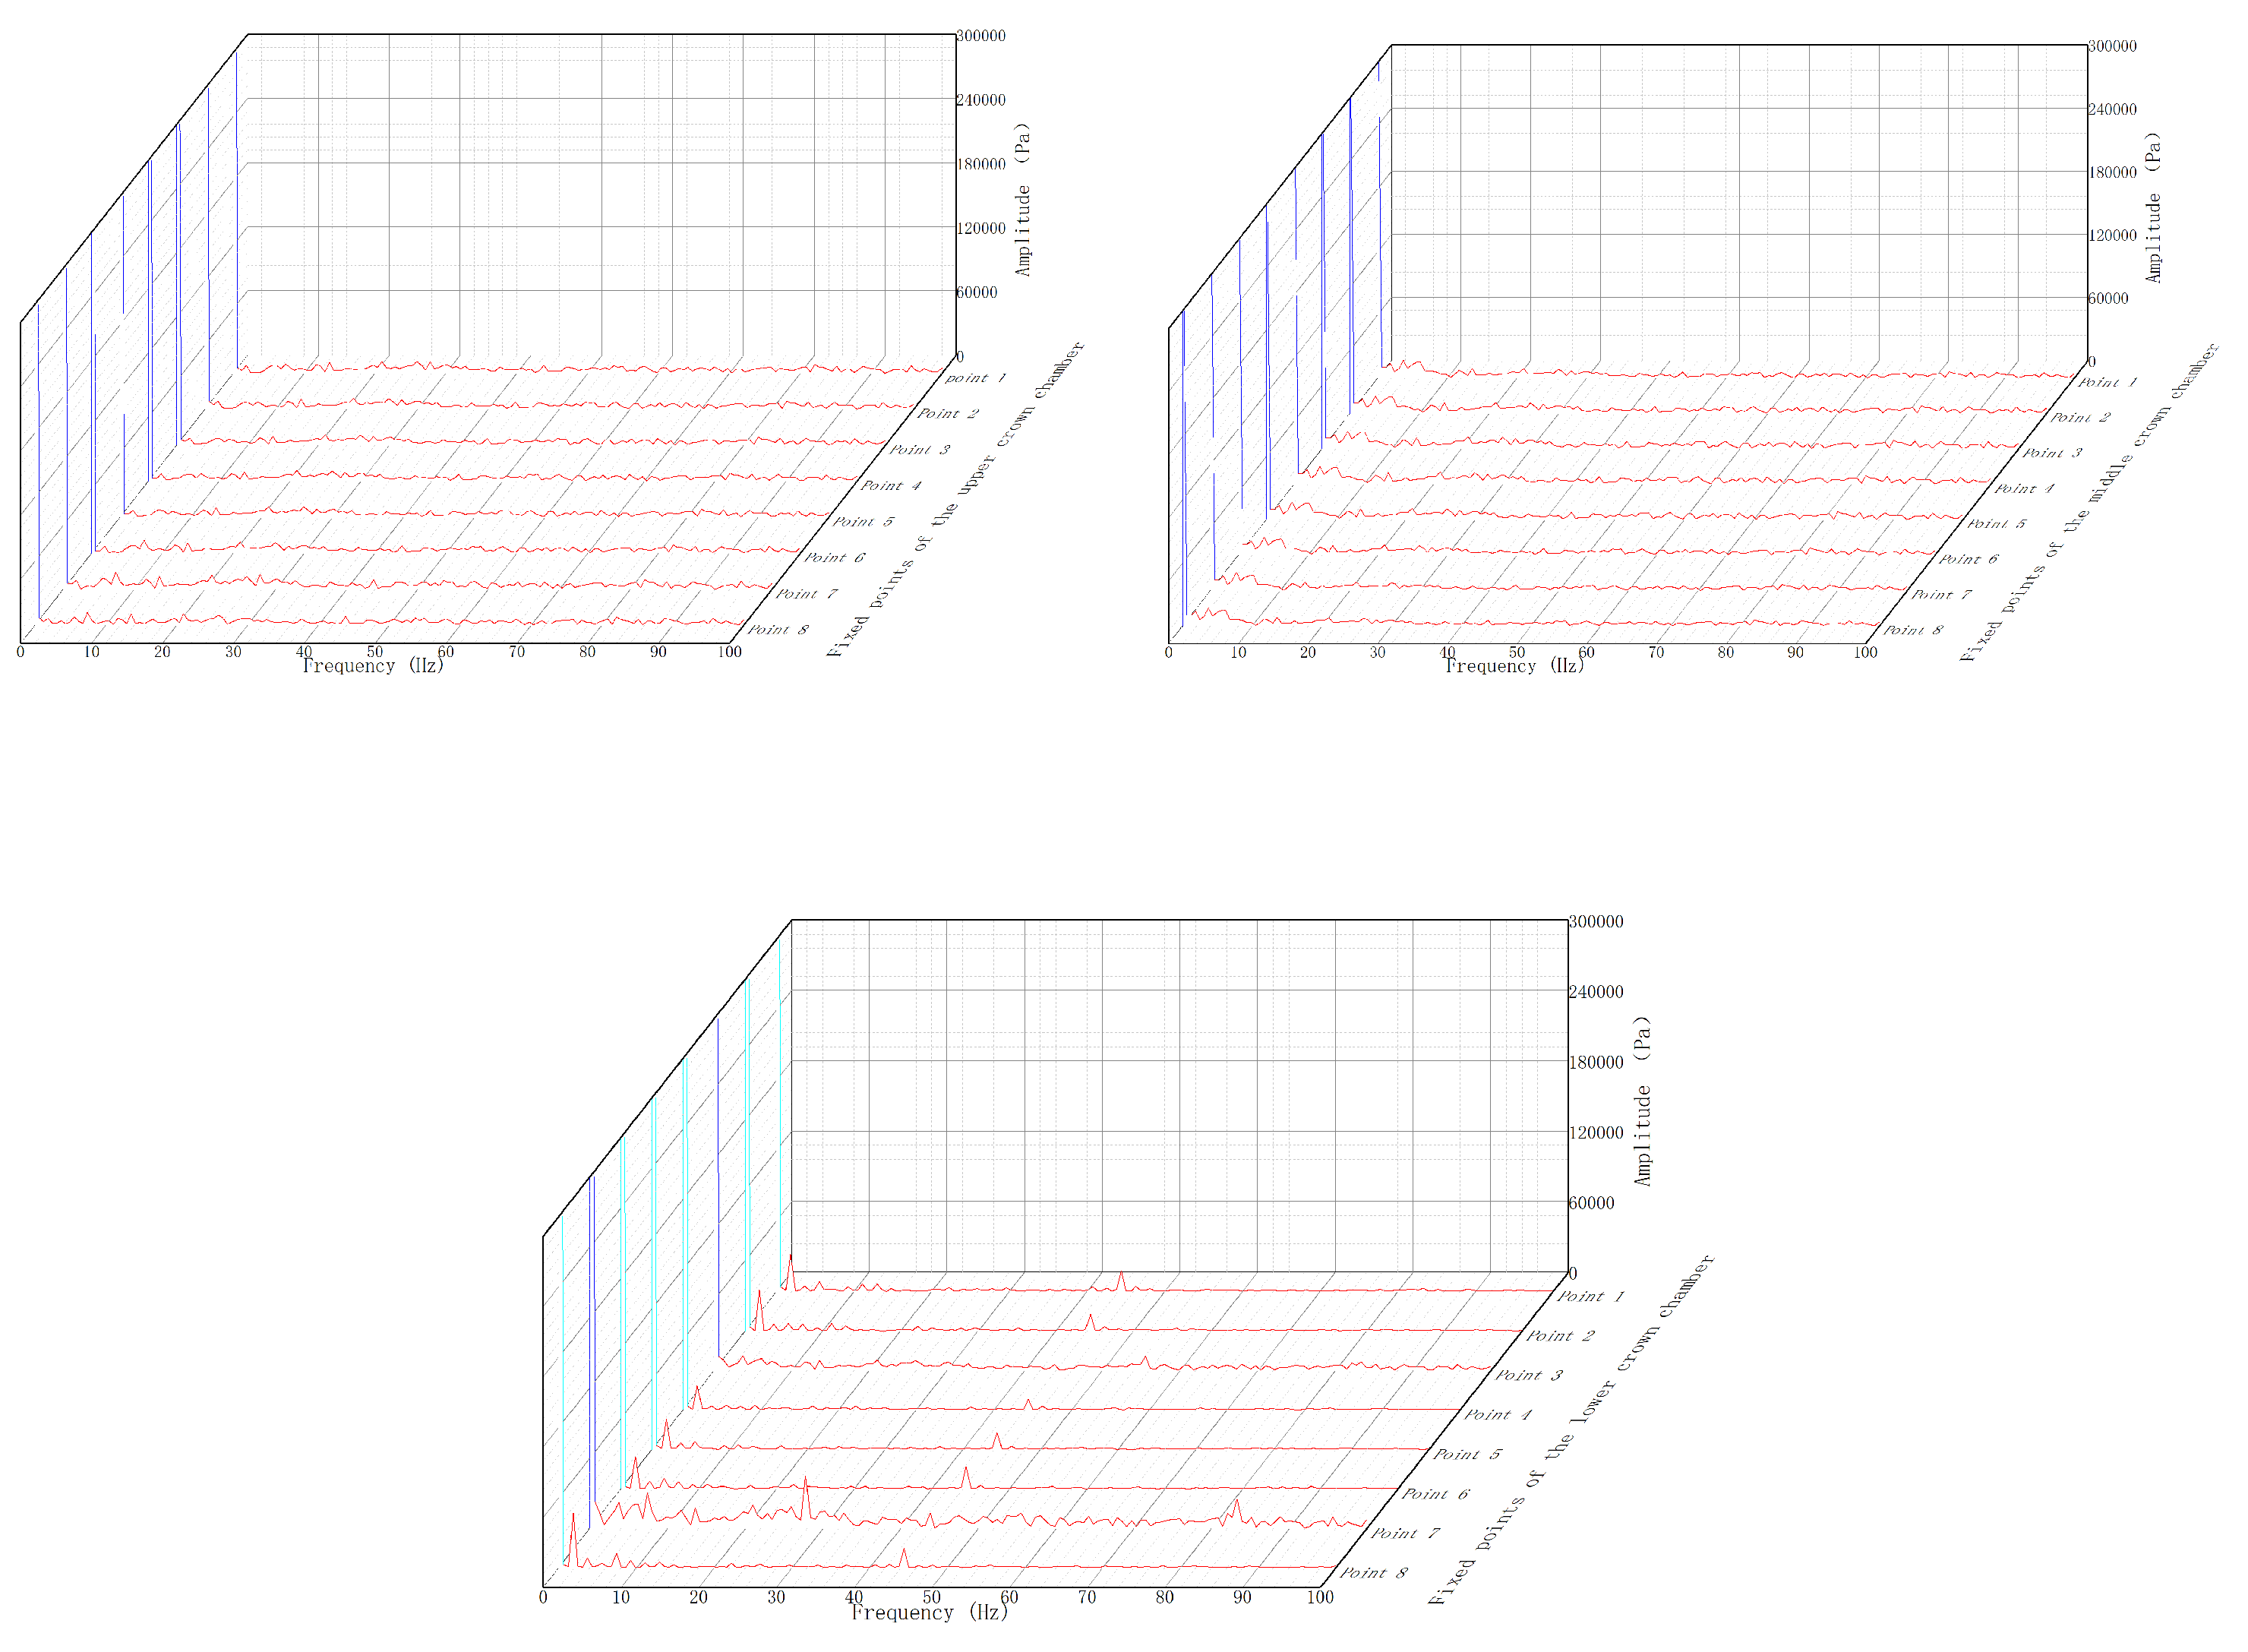
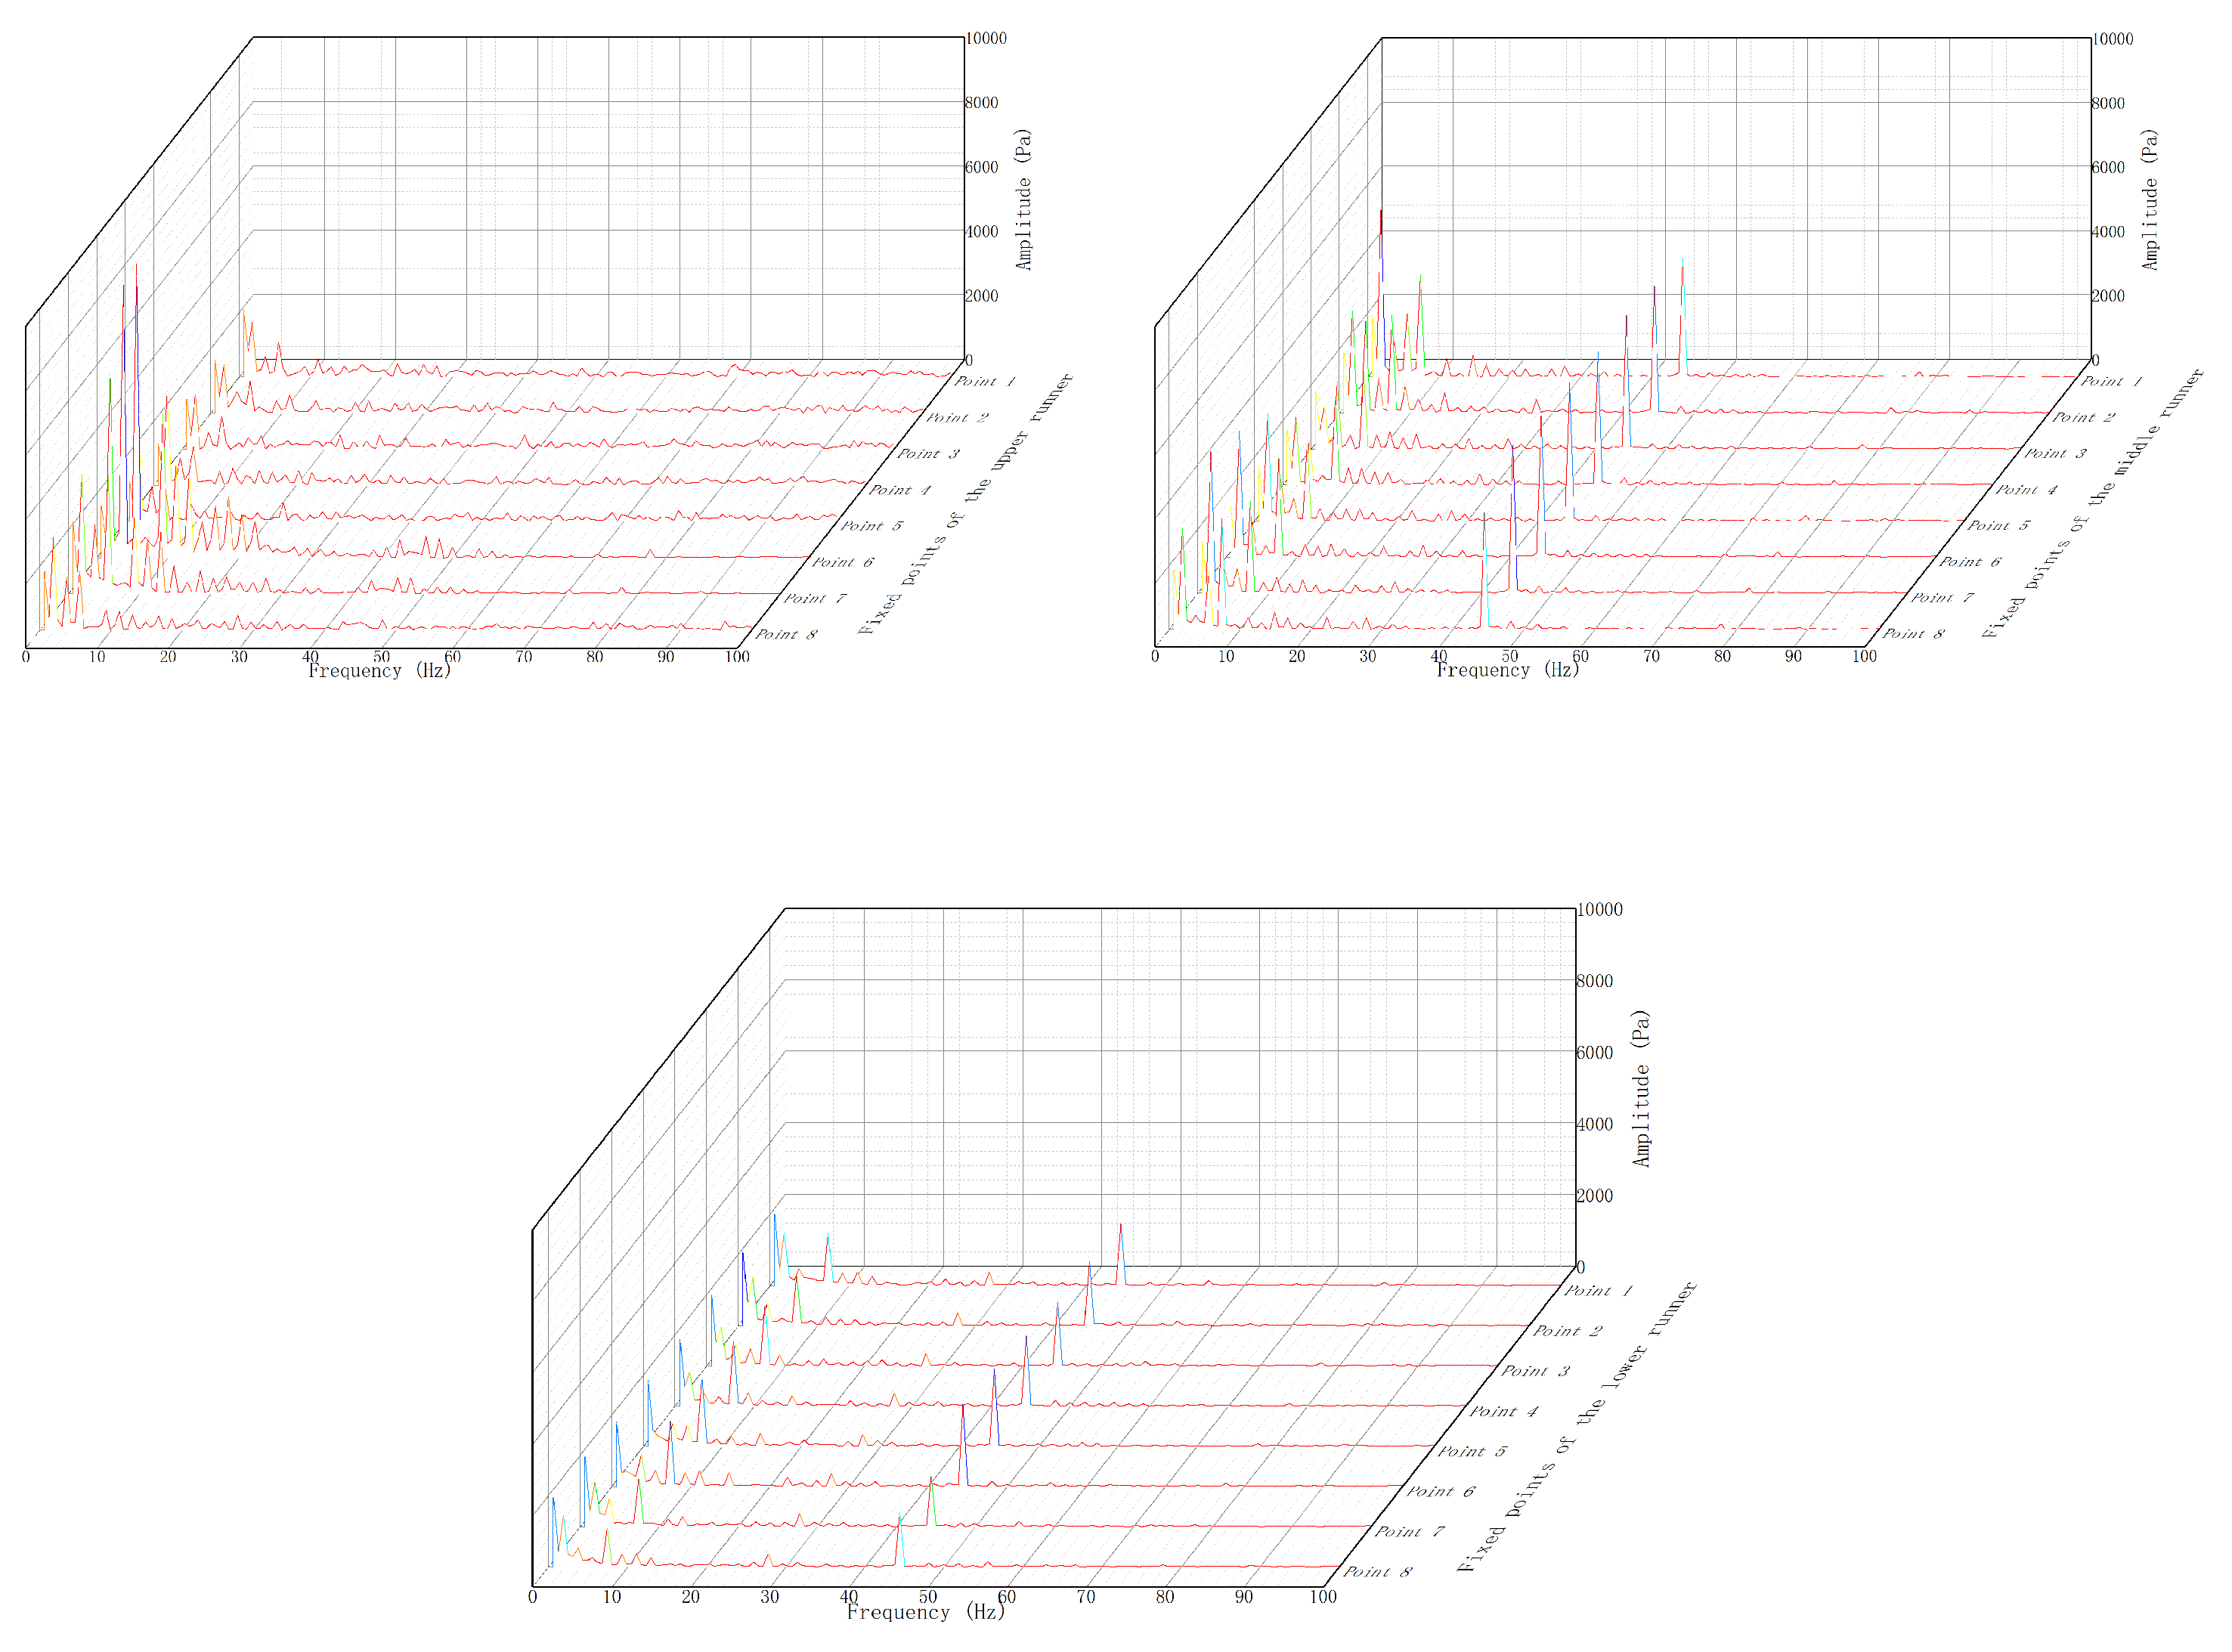
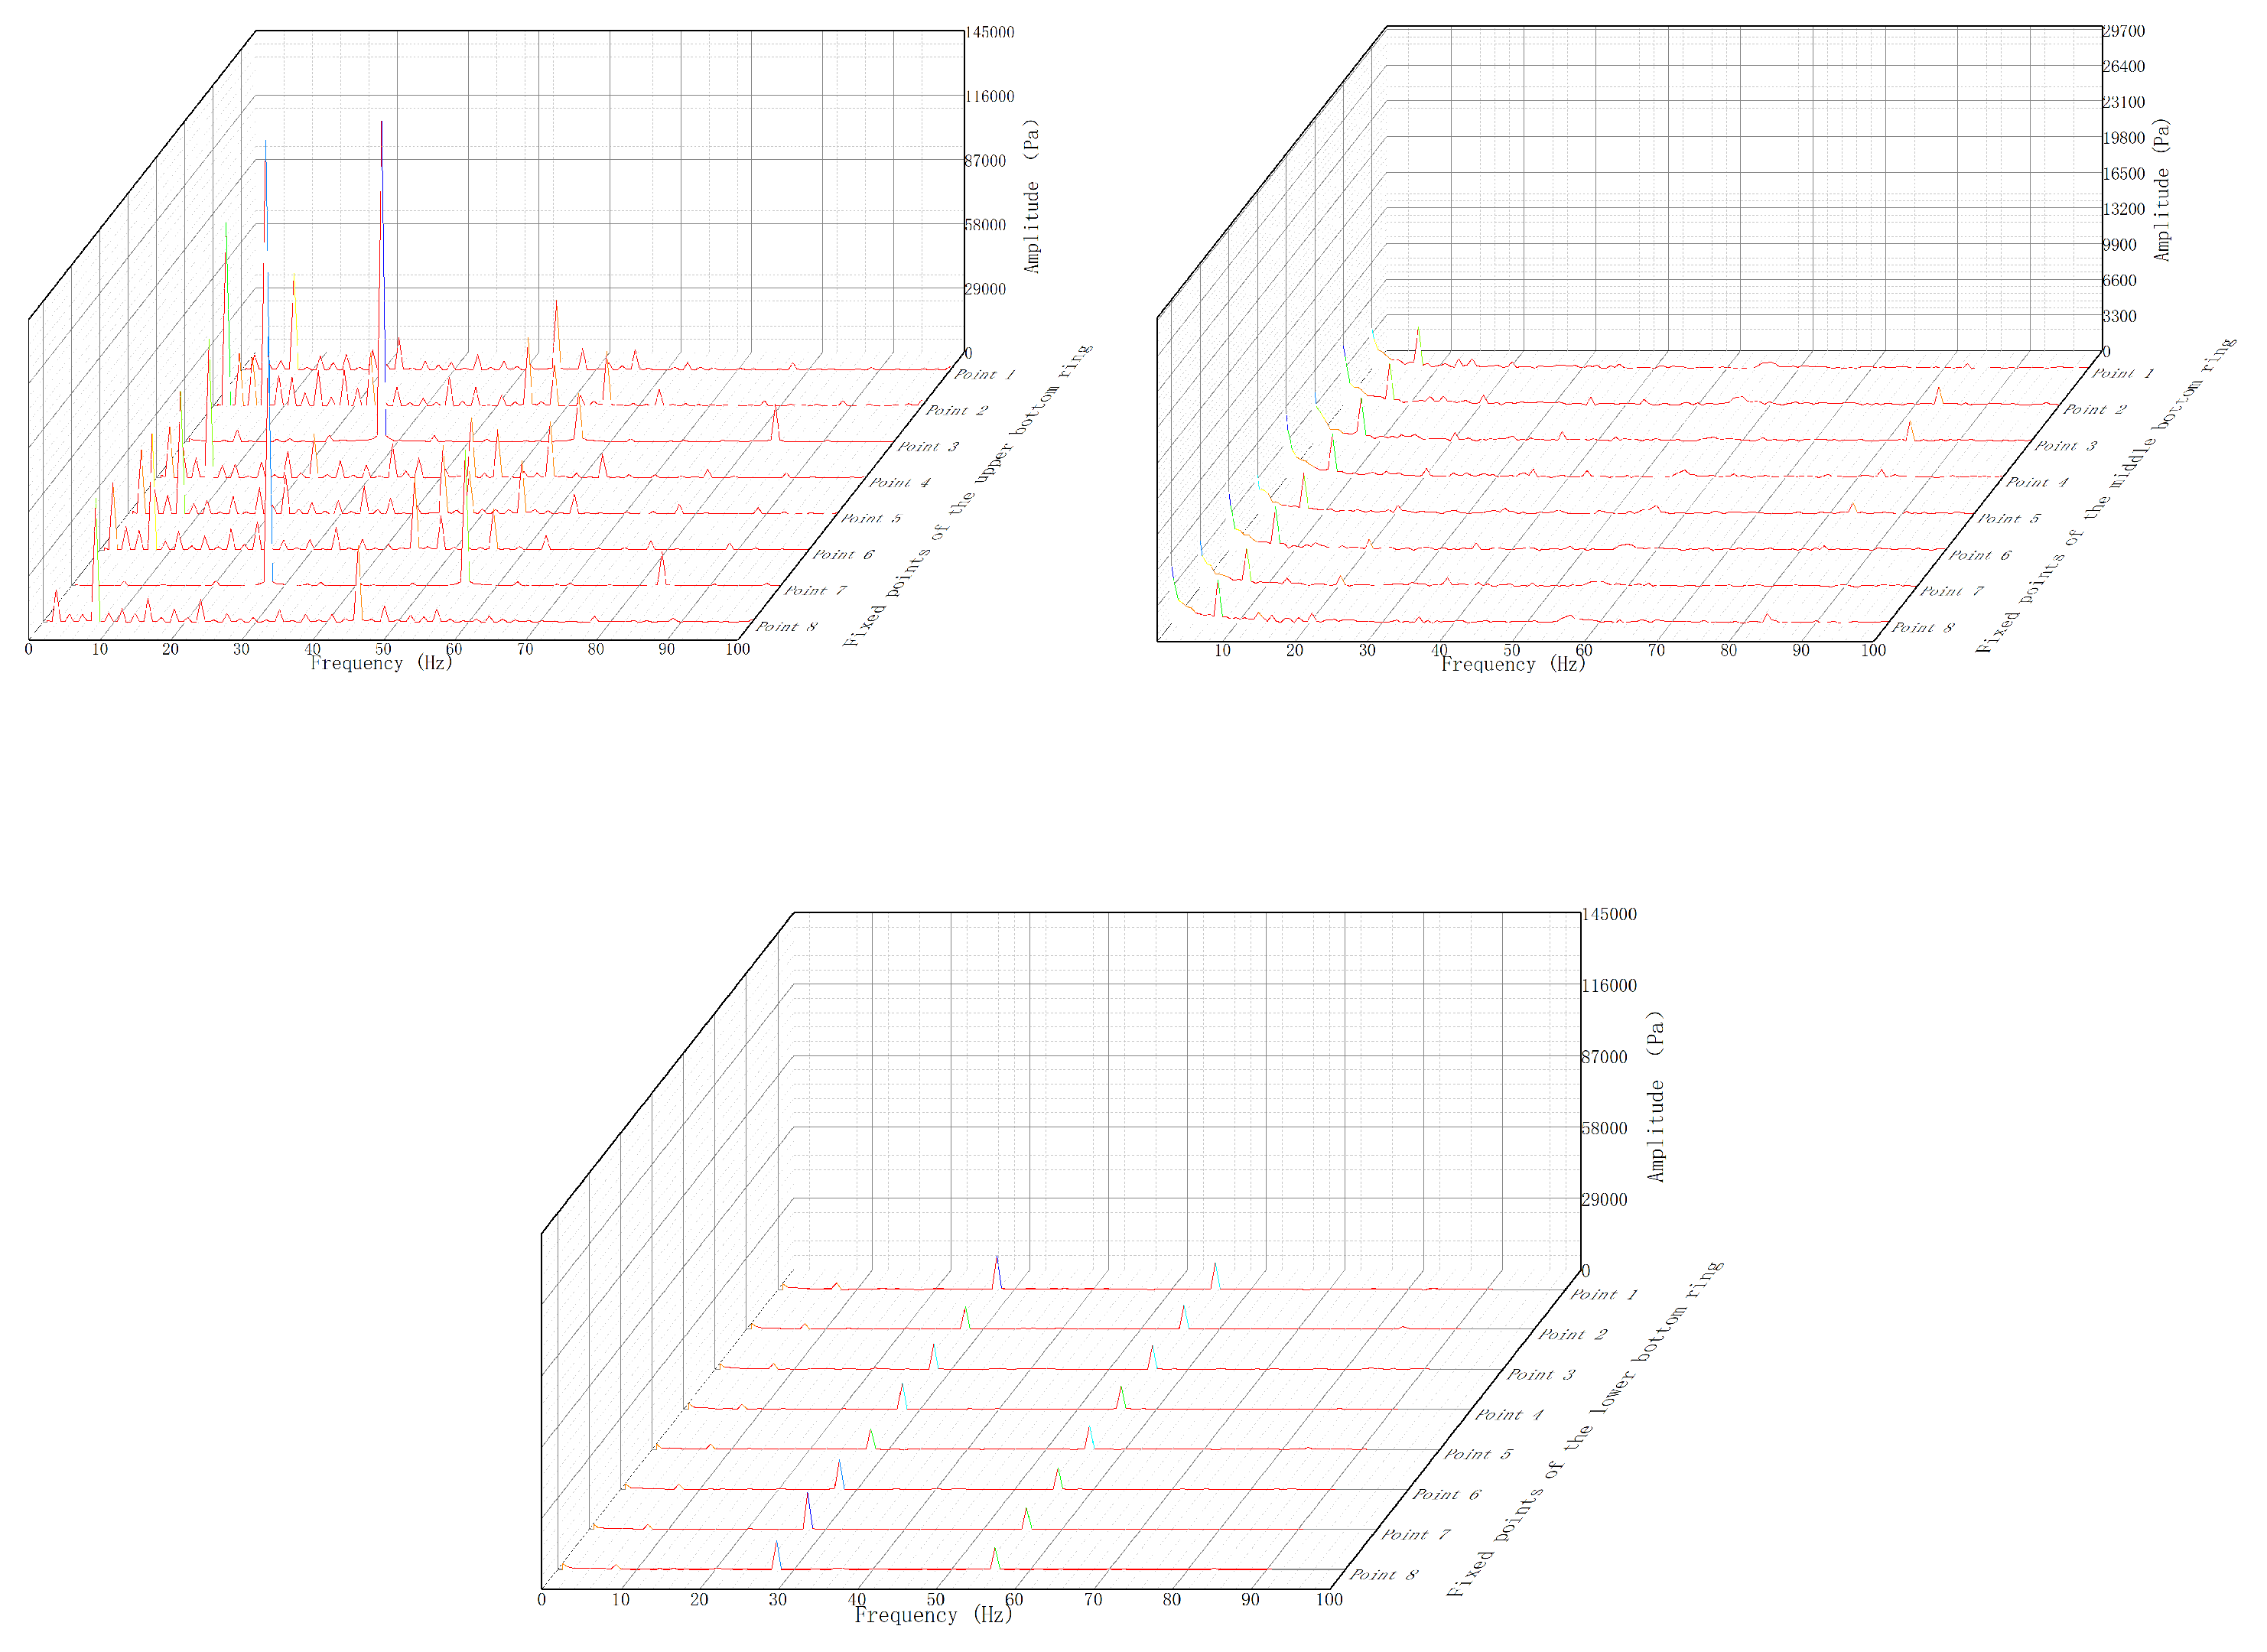
The FFT analysis results are shown below:
The FFT analysis results of the upper and middle crown in Figure 20 provided little useful data because of the high-pressure fluctuations. The lower part shows that the frequency was mainly concentrated in the primary frequency and the 1.5 times frequency, while the frequency of point 3 and point 7 appeared to violently jitter due to the great influence of the radial deviation.
- 2.
- The runner
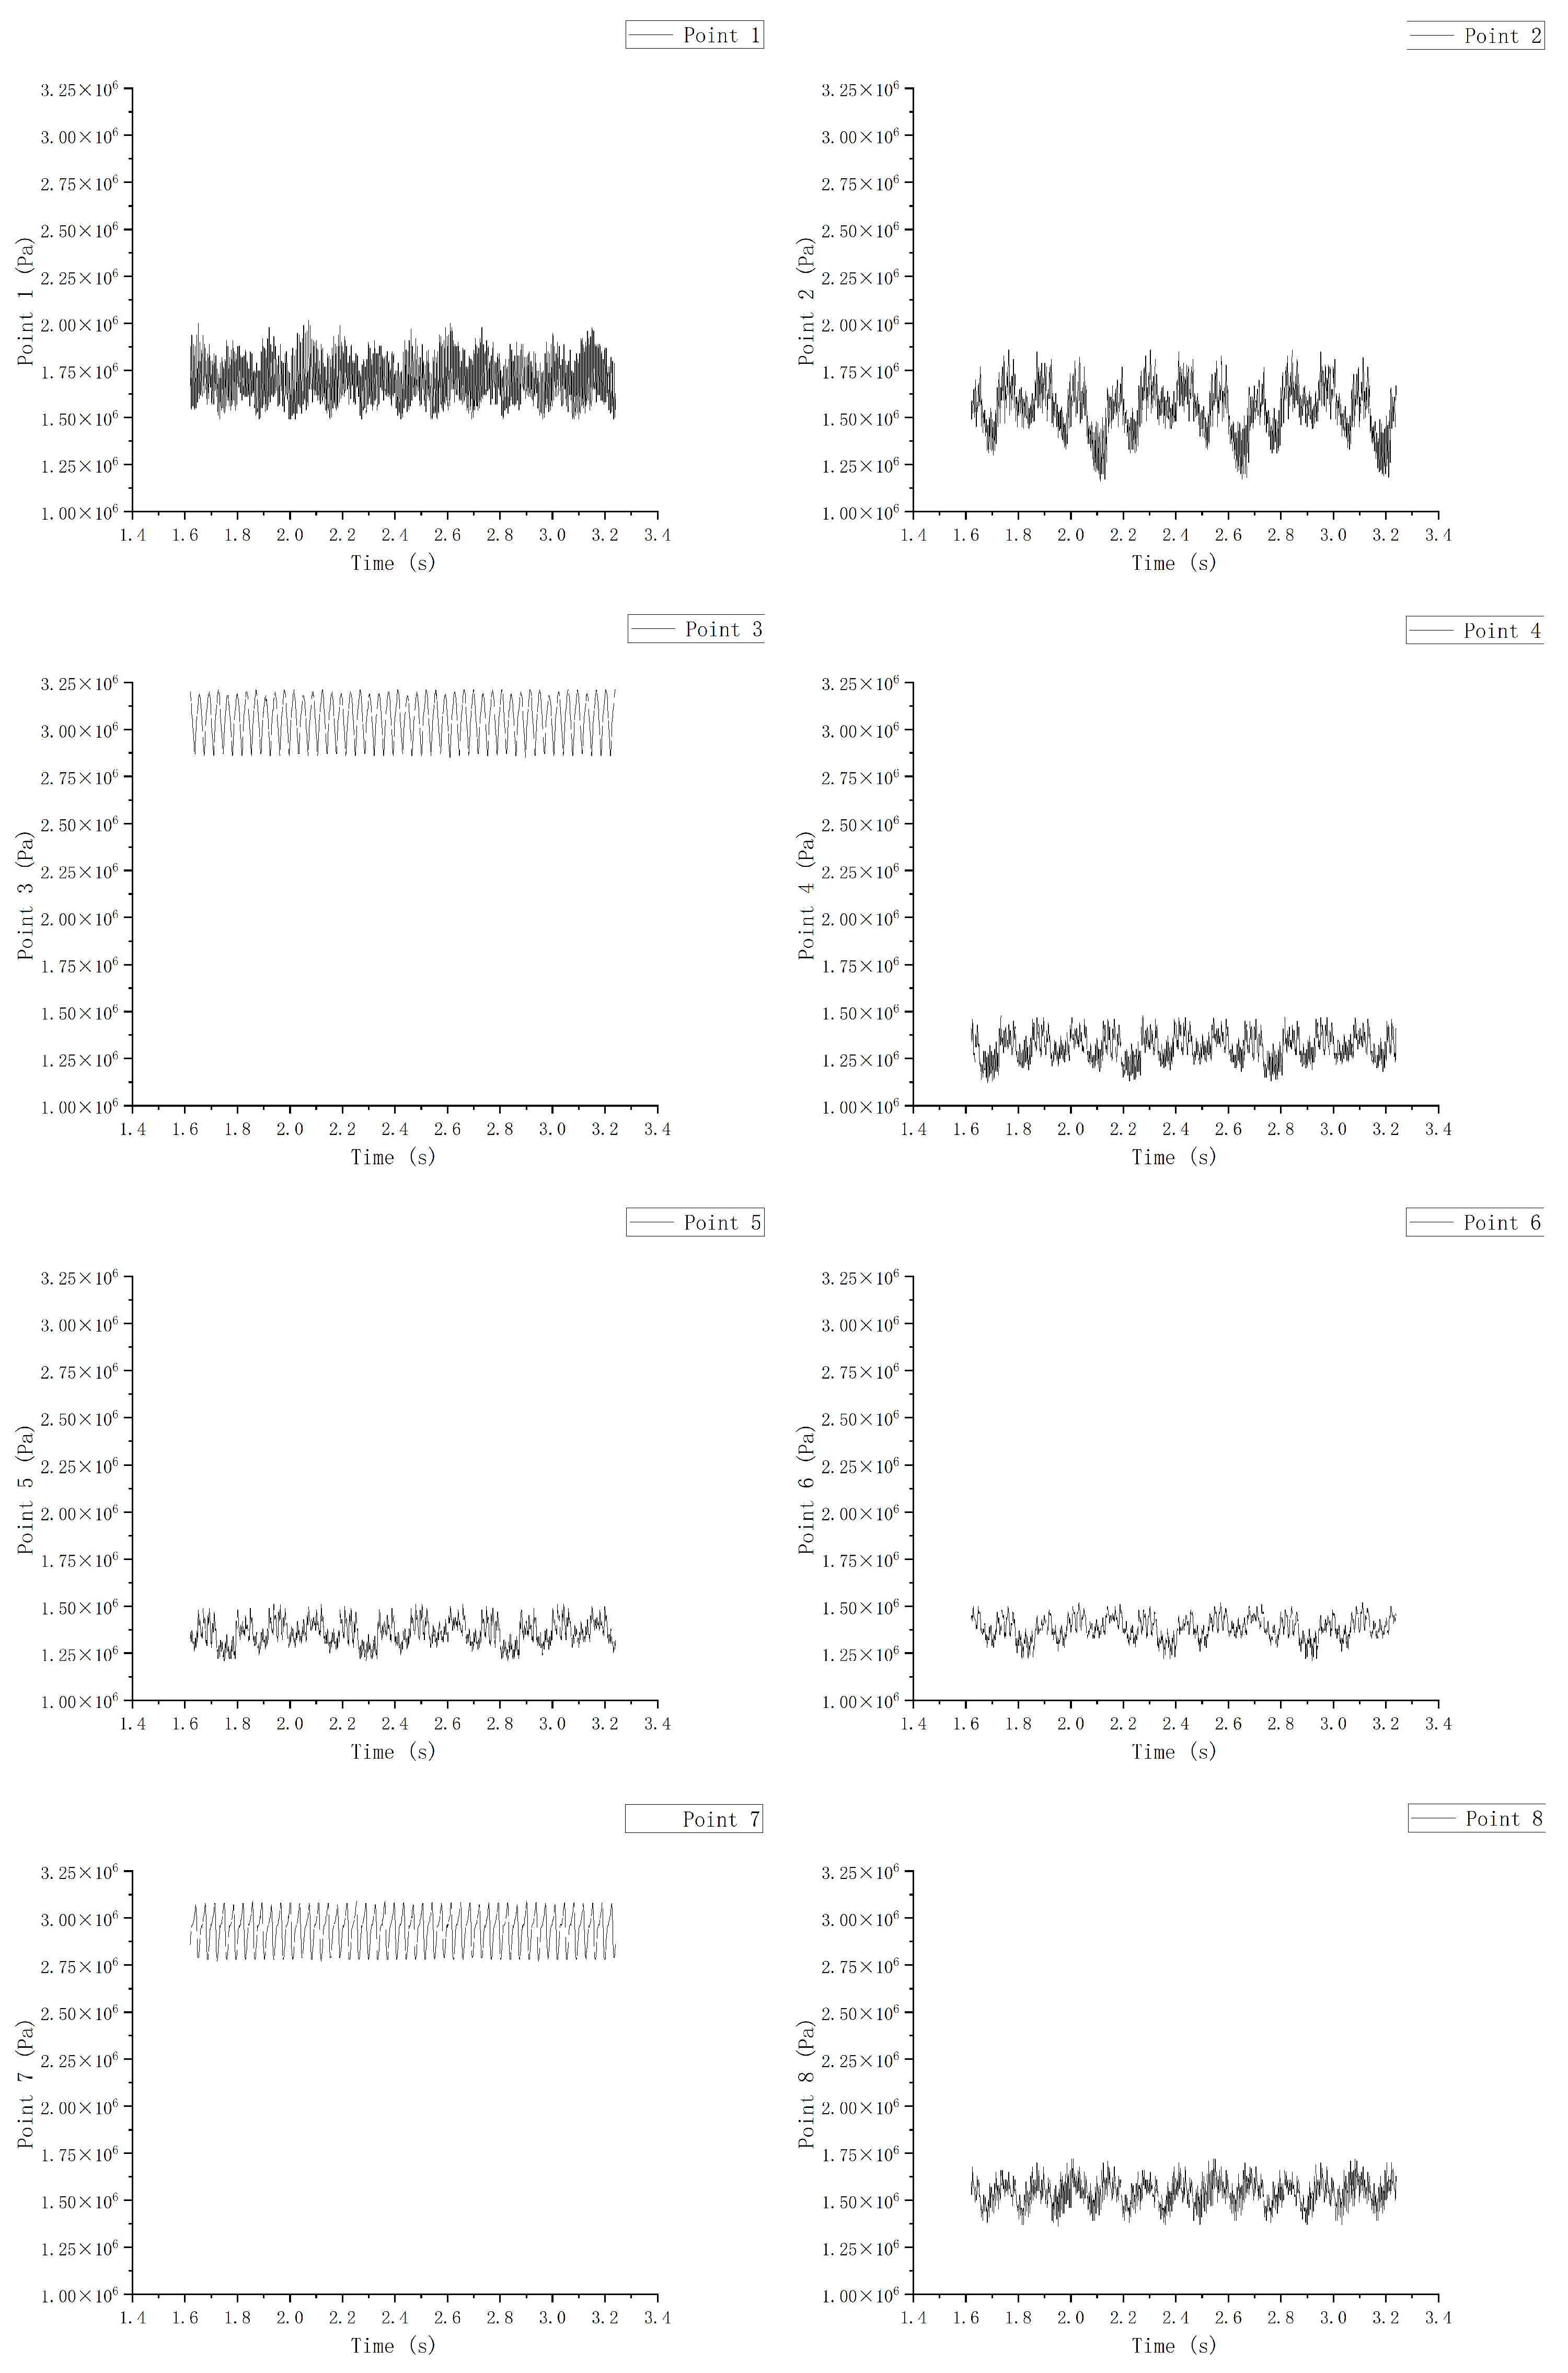
It can be seen here that, among the detection points on the upper part of the runner in Figure 21, Figure 22 and Figure 23, the pressure at point 6 was the smallest. This is because when the point is arranged circumferentially, it just falls on the side of the inlet edge of the blade, where the low-pressure area happens to be. However, other parts of point 6 showed high-pressure values. This was because the two points, point 5 and point 6, happened to be high-pressure areas. When the fluid flowed into this point, the pressure increased and decreased along the circumferential direction toward point 1 due to the reduction of the size. This trend was consistent at the three detection points at the top, middle, and bottom positions, and the pressure values decreased gradually along the flow path. The direction of the pressure decline was also consistent with the direction of the resultant radial force on the runner, which pointed to the vicinity of point 1.
After using FFT showed as Figure 24, we can see that the three parts had frequencies of the primary frequency, the 1.5 times frequency occupied the main part, and there was a secondary frequency in the lower part. Secondly, it can be seen that the influence of deviation on the runner was more and more obvious with the flow and that the higher the pressure was, the less affected the runner was. In the upper monitoring point, points 6 and 7 of the high-pressure area almost had more frequency influence, and, with the downward movement of the detection point, the influence was more and more obvious.
- 3.
- The bottom ring chamber
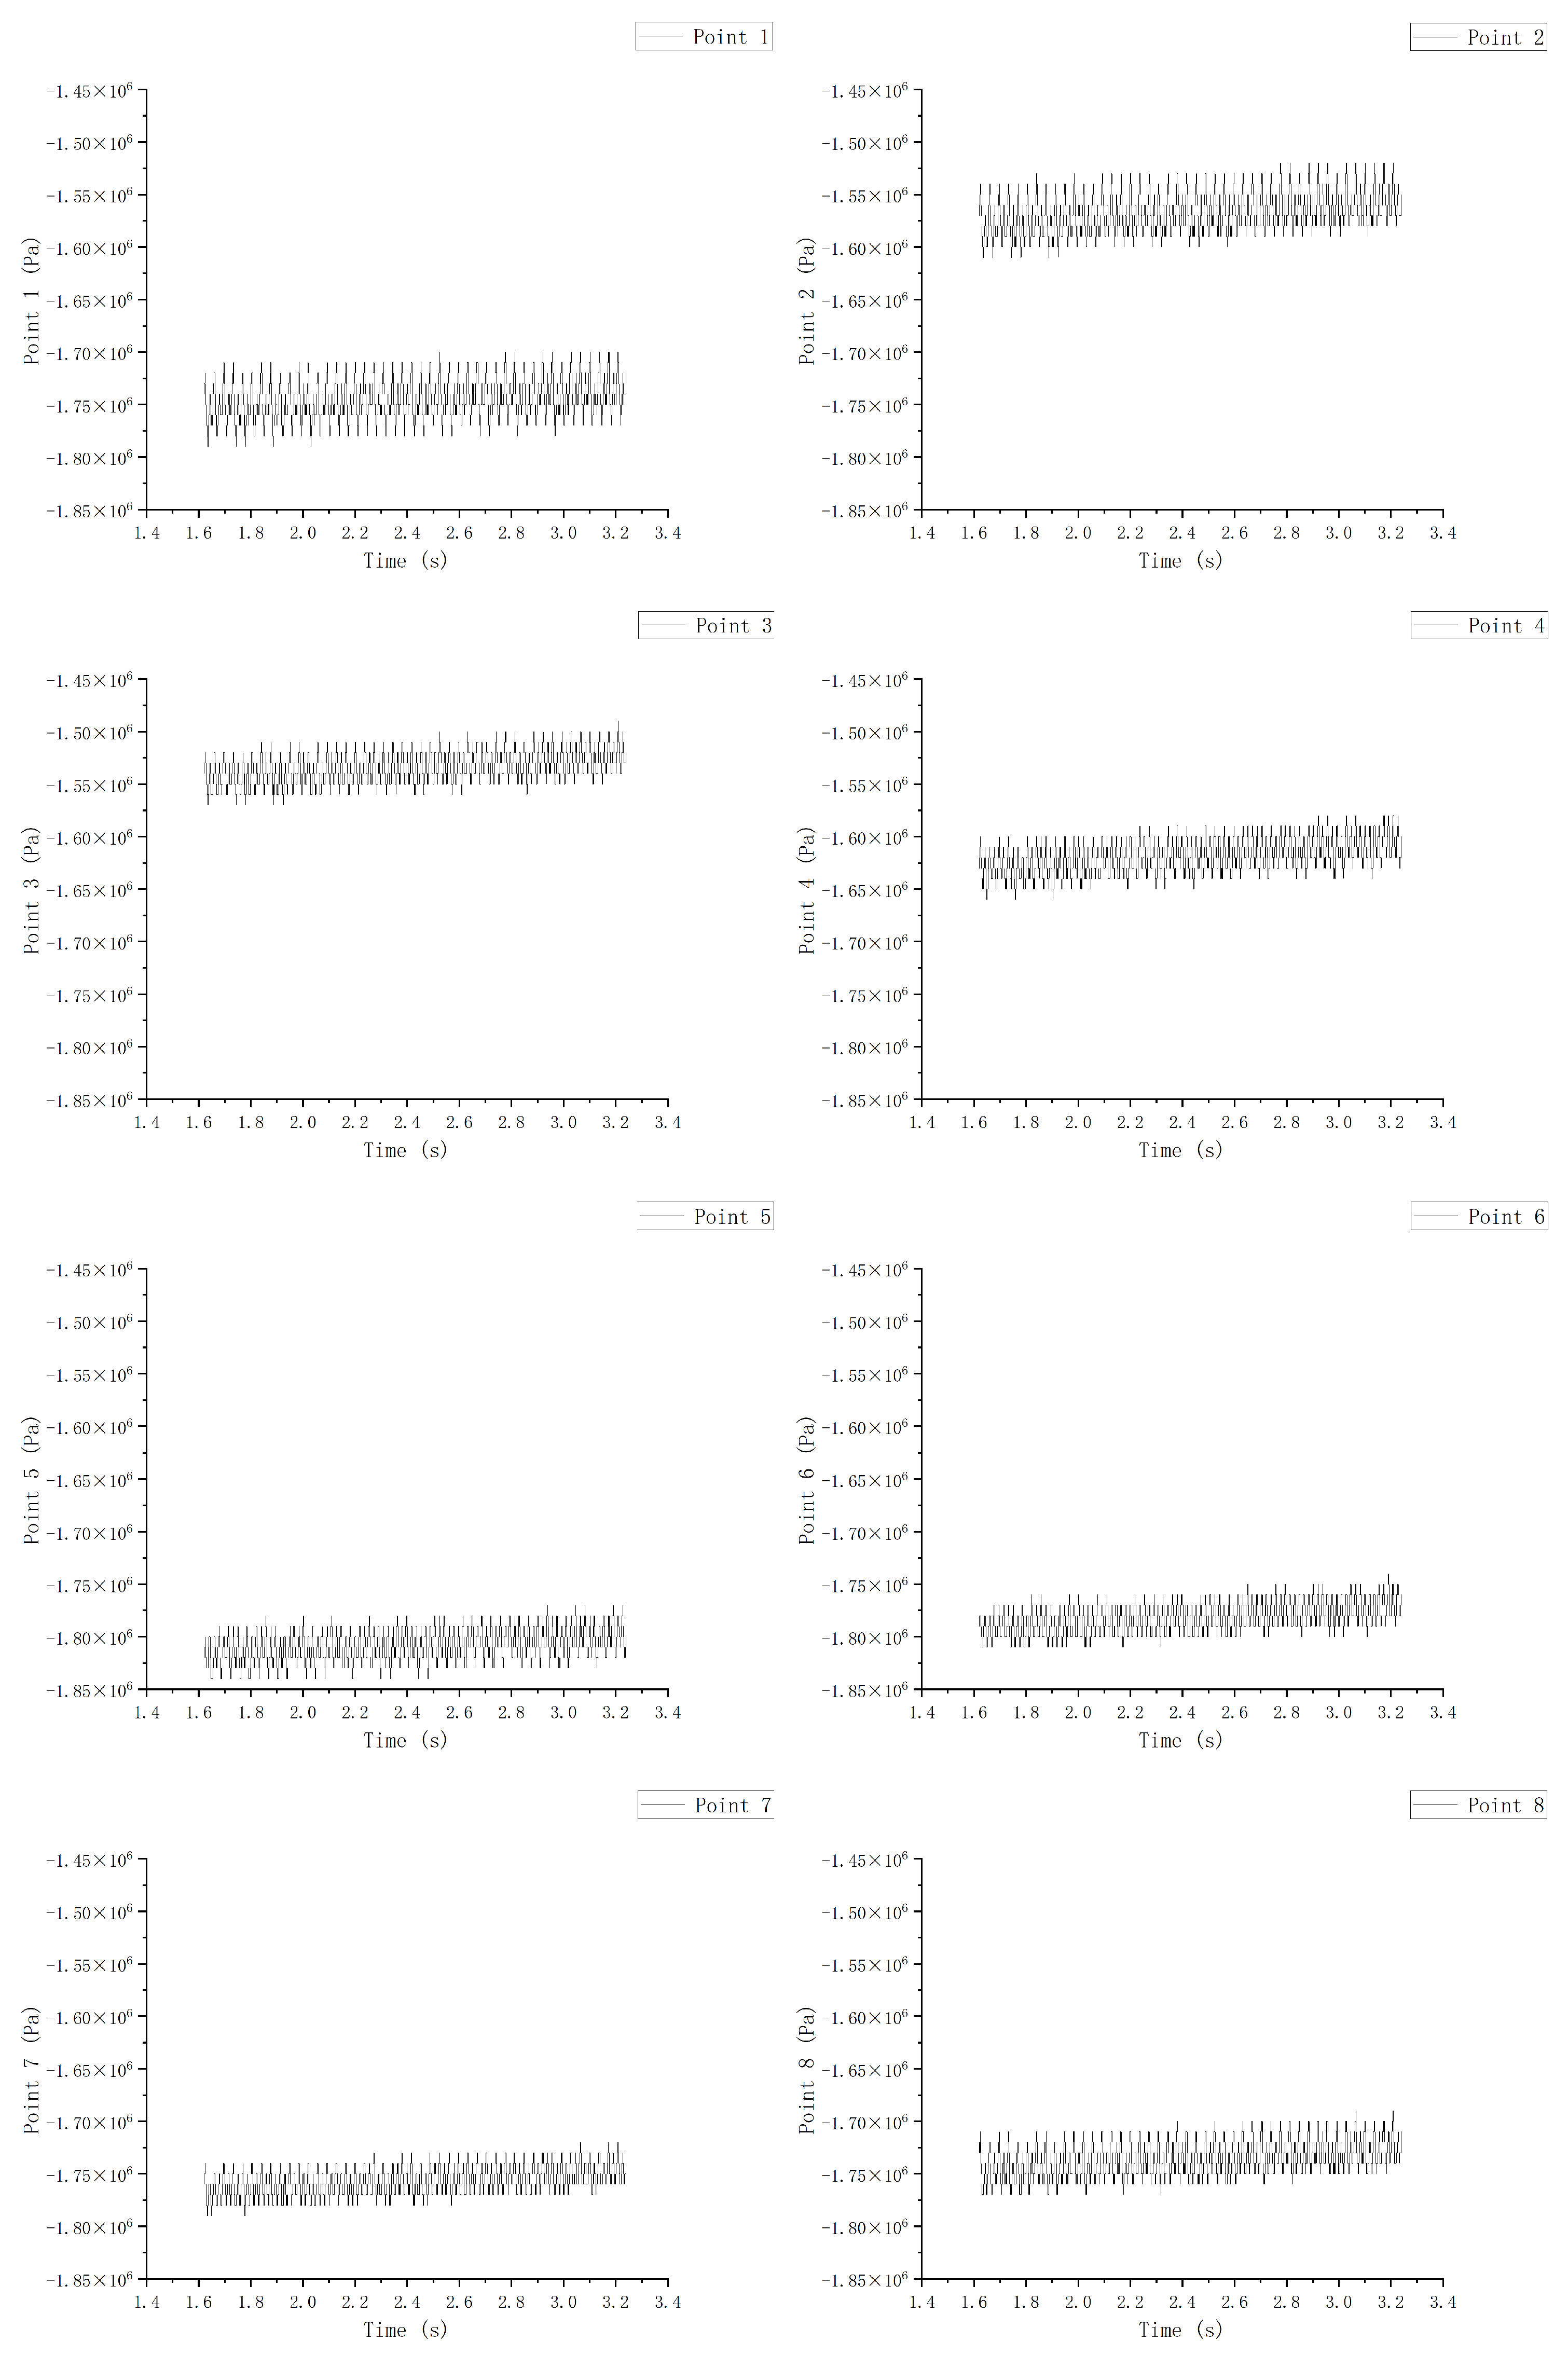
The pressure fluctuations of the lower ring were more regular than those of the crown chamber and the runner. It can be seen that when the fluid had just entered in Figure 25, Figure 26 and Figure 27, the circumferential pressure fluctuations at point 3 and point 7 were the highest. In addition, the maximum and minimum values of the two were opposite at the same time, which reflects that the radial deviation affected the inner part of the bottom ring to fluctuate back and forth at the deviation position. Additionally, because the pressure was concentrated at these two points, the rest of it was very different, but the rest of it was pretty much the same. In the middle part, because the point was set in the inner center of the bottom ring cavity, which is a large size, and because the wall velocity was added, the influence of the radial deviation on the pressure was reduced. Therefore, in the middle part, there was little difference between the values of each monitoring point, and the value of the point with the highest influence also decreased. At the lower part, the point was set in the middle part of the seal ring of the bottom ring. It can be seen that, as the fluid was affected by the wall velocity when it flowed through the middle part, the influence of the radial deviation increased. As a result, the highest pressure area moved in the opposite direction to the runner, which is consistent with the pressure law of high deviation under steady calculation.
The FFT transformation of the bottom ring chamber in Figure 28 shows that, as with the runner, it occupied the main part with frequencies of the primary frequency and the 1.5 times frequency, and they also had a low 0.25 times frequency. In addition, there was also a high frequency of the tertiary frequency in every part; it became higher as the space became more narrow, and its frequency amplitude was much higher than that of the runner. The curve vibrated violently in the middle part, which may be because the addition of the wall velocity intensified the generation of a jitter.
Finally, the average value of the pressure in the last three revolutions of each point was exported to make a polar graph of the angle and pressure distributions showed in Figure 29.
By comparing these three figures, it can be found that, when the crown chamber and bottom ring chamber were near the runner, the high-pressure region was indeed in the direction of the maximum radial deviation, that is 90 and 270. However, as the size increased, in the crown chamber and bottom ring chamber cavity, which are the central monitoring sites, it can be seen that, although it was not the same, the circumferential direction had almost no influence. When it comes to the top of the crown chamber and the bottom of the bottom ring chamber, due to the introduction of wall velocity, the influence of the radial deviation was increased, so the high-pressure region moved counterclockwise, which is consistent with the characteristics of large deviations in the steady calculation. In the runner part, it can be seen that, because the runner itself was rotating, its high-pressure direction was moving in the same direction as the runner.
4. Conclusions
In this paper, the influence of radial installation deviation on the pressure pulsations induced by the rotor–stator interaction of a giant turbine was investigated in detail, and the conclusions are listed below:
- 1.
- With the increase in radial deviation, the radial force on the component also increased linearly.
- 2.
- After comparison with the steady calculation, it was necessary to add wall velocity, although it caused instability in the unsteady calculation.
- 3.
- The greater the deviation was, the greater the pressure was in the region, within a certain deviation value. However, when the maximum value was exceeded, the high-pressure region generated by the deviation moved in the direction where the maximum value of the radial deviation existed because of the fluid flowing harder.
- 4.
- Near the runner, the pressure pulsations vibrated periodically along the direction of deviation, but, as the flow continued, the influence of the wall velocity was introduced, and the pressure pulsations moved in the opposite direction of the runner rotation, just like in the high-pressure area.
- 5.
- Different parts were affected by different degrees of radial deviation, with the crown chamber having the greatest influence, followed by the lower ring and, finally, the runner.
- 6.
- The affected parts were mainly produced at four frequencies: 7 Hz, 28 Hz, 42 Hz, and 56 Hz which are the 0.25 times frequency, the primary frequency, the 1.5 times frequency and the secondary frequency, respectively. Additionally, the bottom ring chamber also had the tertiary frequency, and as the space became more narrow, the percentage of the high frequency increased.
- 7.
- The addition of wall velocity intensified the influence of the radial deviation, thus resulting in the characteristics of high deviation at a low deviation.
5. Discussion
Our study encompassed several aspects that require discussion with our peers:
- 1.
- We added the condition of wall velocity, which only considers the case of large-scale hydro turbines, as many literature sources do not include this condition. While our study shows that this condition better reflects actual situations, further verification is needed to determine its applicability to hydro turbines of different sizes.
- 2.
- The radial deviation value used in the steady-state calculation was actually higher than the value that is likely to occur during the operation of large-scale hydro turbines, where a deviation of 2.5 mm is almost impossible. We calculated this value mainly to consider the performance of the turbines under the worst-case scenario. However, we have started to calculate smaller deviations upon the writing of this paper.
- 3.
- Due to time and length constraints, we only calculated the non-steady-state part for a deviation of 0.5 mm. To summarize the overall pattern, we also need to provide results for deviations of 1.5 mm and 2.5 mm, which will be calculated in our future studies.
- 4.
- There is very little research on the radial installation deviation of large-scale mixed-flow and axial-flow hydro turbines, and even less research on the combination of these two types of turbines. We only found relevant studies on the radial deviation of fans and axial-flow turbines, so this direction is still in its exploratory stage and lacks sufficient reference materials.
Author Contributions
Conceptualization, Y.W. and K.J.; methodology, X.H.; investigation, W.W. and P.L.; validation, X.H. and K.J.; writing—original draft preparation, Y.W.; writing—review and editing, Y.W. and X.H.; supervision, Z.W. and L.Z. All authors have read and agreed to the published version of the manuscript.
Funding
This research received funding by the Three Gorges Construction Group Co., Ltd. (Contract No.: JGJD0322003) in China.
Institutional Review Board Statement
Not applicable.
Informed Consent Statement
Not applicable.
Data Availability Statement
Not applicable.
Acknowledgments
The authors received support from the following project: “Multi-field coupling study on dynamic characteristics of 1000 MW hydrogenerator unit” which was supported by the Three Gorges Construction Group Co., Ltd. (Contract No.: JGJD0322003) in China.
Conflicts of Interest
The authors declare no conflict of interest.
References
- Mei, Z. Pumped Storage Power Generation Technology; China Machine Press: Beijing, China, 2000; p. 7. [Google Scholar]
- Lei, C.; Shoudao, L.I. Comparative Analysis and Research on Hydraulic Characteristics of narrow-seam energy dissipator. Water Resour. Hydropower Technol. 2019, 50, 126–131. [Google Scholar]
- Song, B. Study on Shafting Instability Induced by Crown Clearance Flow in the Runner of a Hybrid Turbine; Dalian University of Technology: Dalian, China, 2010. [Google Scholar]
- Song, B.; Ma, Z.; Kojiro, H.; Yoshinobu, T. Analysis of Flow Field Characteristics in the Upper Crown Gap during the Start-up Process of a Mixed-Flow Pump-Turbine. Hydropower Energy Sci. 2010, 28, 112–116. [Google Scholar]
- Shao, L.; Wang, W. Study on structural vibration characteristics induced by uneven clearance of turbine labyrinth ring. J. Hydraul. Eng. Civ. Eng. 2013, 11, 141–144. [Google Scholar]
- Zhou, D.; Chen, Y. Numerical simulation of clearance flow in hybrid turbine with drain hole. Trans. Chin. Soc. Agric. Mach. 2015, 1, 53–58. [Google Scholar]
- Wu, Y.; Feng, J. Research on the influence of hub clearance on the performance of axial-flow propeller turbine. J. Hydroelectr. Power 2014, 33, 185–190. [Google Scholar]
- Feng, J.; Luo, X. Effect of gap flow on efficiency prediction of hybrid turbine. Trans. Chin. Soc. Agric. Eng. 2015, 31, 53–58. [Google Scholar]
- Liu, D.; You, G.; Wang, F.; Zhang, J. Calculation and analysis of axial water thrust of mixed-flow reversible turbine. J. Hohai Univ. (Natural Sci. Ed.) 2004, 32, 557–561. [Google Scholar]
- Dai, Y.; Wang, H.; Zhang, K.; Zheng, L.; You, G.; Kong, L.; Zhu, X. Research on Axial Water Thrust of Mixed-Flow Reversible Wheel. J. Hydraul. Power Gener. 2005, 24, 105–113. [Google Scholar]
- Anderson, J.D. Computational Fluid Mechanics; McGraw Hill: New York, NY, USA, 1995. [Google Scholar]
- Shi, W.; Li, Q.; Lu, W.; Zhang, D. Calculation and Test of Axial Force in Centrifugal Pump Based on CFD. Trans. Chin. Soc. Agric. Mach. 2009, 40, 60–63. [Google Scholar]
- Zhou, L.; Shi, W.; Li, W.; Ramesh, A. Numerical and experimental study of axial force and hydraulic performance in a deep-well the concurrent pump with different reorganization radius. J. Fluids Eng. 2013, 135, 104501. [Google Scholar] [CrossRef]
- Pehlivan, H.; Parlak, Z. Investigation of Parameters Affecting Axial Load in an End Suction Centrifugal Pump by Numerical Analysis. J. Appl. Fluid Mech. 2019, 12, 1615–1627. [Google Scholar] [CrossRef]
- Zhu, Z. Research on Axial Force Balance Method of High Speed Centrifugal Pump. J. Eng. Thermophys. 2000, 6, 713–715. [Google Scholar]
- Liu, Z.; Chen, T.; Lu, W. Experiment and Analysis of Influence of Impeller Back Blade on axial Force of Centrifugal Pump. J. Drain. Irrig. Mach. Eng. 2019, 37, 1013–1018. [Google Scholar]
- Ruan, Z.; Zhou, S. Principle and Practice of Floating Impeller Automatic Balancing axial Force of Centrifugal Pump. Water Pump Technol. 2002, 5, 29–32. [Google Scholar]
- Lu, X.; Fan, Z.; Xue, J. Balancing the axial Force of single stage single suction centrifugal Pump by Increasing the sealing ring method. Water Pump Technol. 1998, 5, 3–9. [Google Scholar]
- Adkins, D.R.; Brennen, C.E. Analyses of Hydrodynamic Radial Forces on Centrifugal Pump Impellers. J. Fluids Eng. 1988, 110, 20–28. [Google Scholar] [CrossRef]
- Barrio, R.; Fernandez, J.; Blanco, E.; Parrondo, J. Estimation of Radial Load in Centrifugal Pumps Using Computational Fluid Dynamics. Eur. J. Mech. B/Fluid 2011, 30, 316–324. [Google Scholar] [CrossRef]
- Wu, D.; Yuan, S.; Ren, Y.; Zhang, J. Influence of Blade Geometry Parameters on Radial Force and Vibration of Pipeline Pump. J. Drain. Irrig. Mach. Eng. 2013, 31, 277–283. [Google Scholar]
- Guan, X. Modern Pump Theory and Design; China Aerospace Press: Beijing, China, 2011. [Google Scholar]
- Jo, S.-H.; Shin, D. Reduction of the Axial Force of Water Pump Using CFD. Transactions of Korean Society of Automotive Engineers 2012, 20, 83–87. [Google Scholar] [CrossRef]
- Li, H.; Geng, B.; Liu, D. Influence of Radial Clearance on surrounding Flow field characteristics of the turbine runner of a mixed-flow pump. Water Resour. Hydropower Technol. 2020, 51, 136–142. [Google Scholar]
- Zhu, D.; Xiao, R.; Yao, Z.; Yang, W.; Liu, W. Optimization design for reducing the axial force of a vaned mixed-flow pump. Eng. Appl. Comput. Fluid Mech. 2020, 14, 882–896. [Google Scholar] [CrossRef]
- Liu, Y.; Liu, C.; Zhang, Y.; Huang, X.; Guo, T.; Zhou, L.; Wang, Z. Influence of Axial Installation Deviation on the Hydraulic Axial Force of the 1000 MW Francis Runner in the Rated Operating Condition. Energies 2023, 16, 1878. [Google Scholar] [CrossRef]
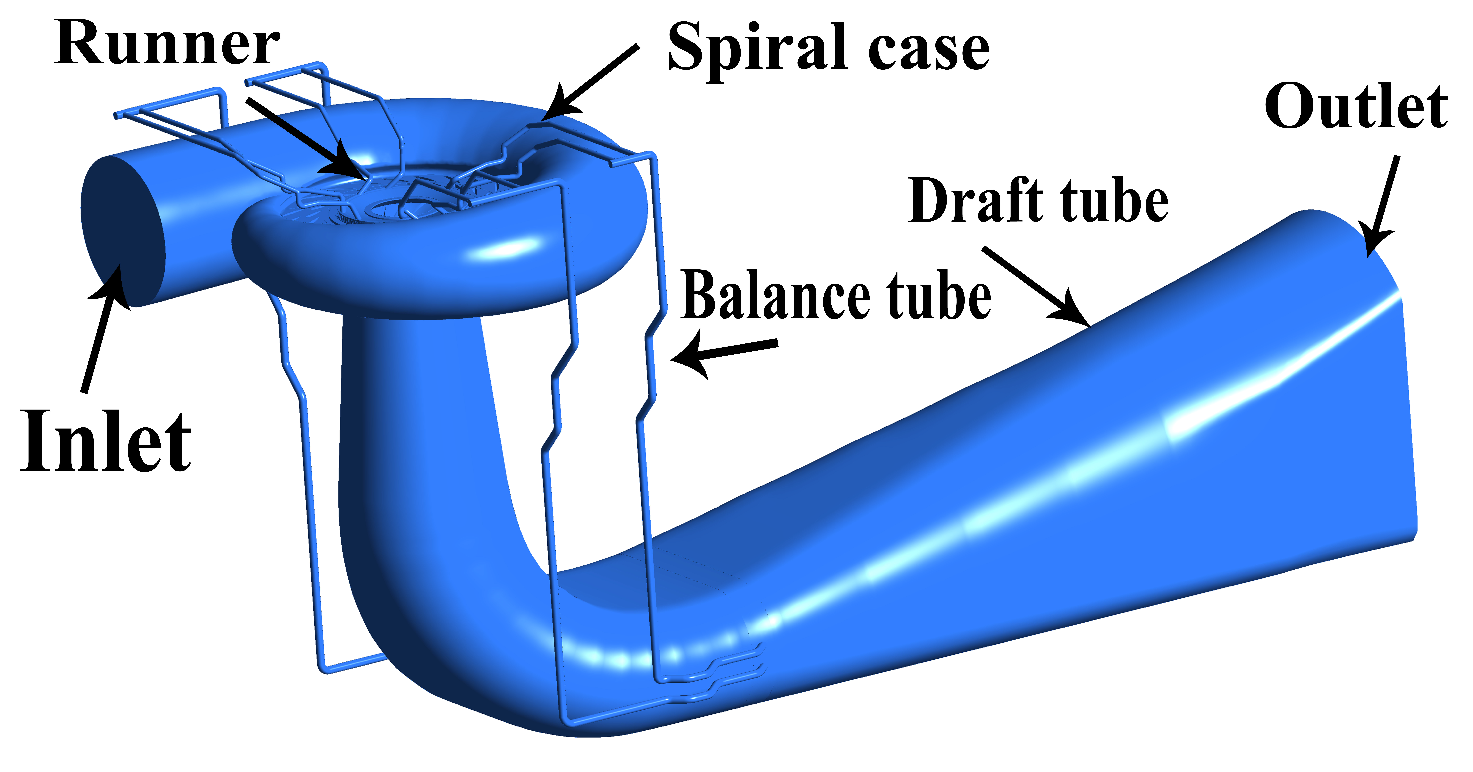
Figure 1.
Flow domain model of a high-quality 1000 MW Francis turbine unit.

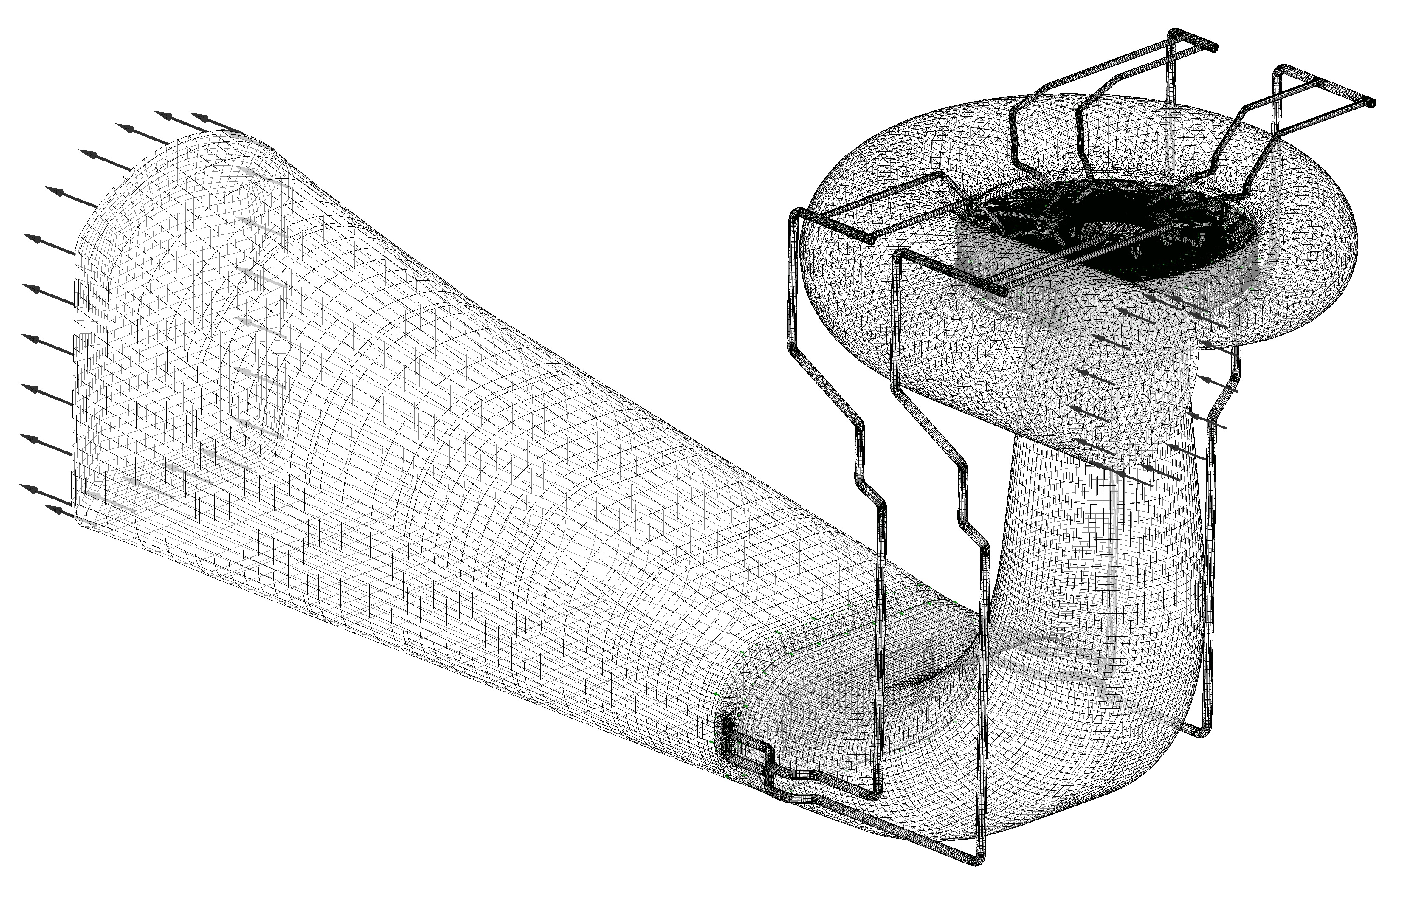
Figure 2.
Mesh of the entire flow domains.

Figure 3.
A 0.5 mm radial installation deviation model.

Figure 4.
Updated mesh of the 0.5 mm radial installation deviation model.

Figure 5.
Simulation and experimental efficiency comparison.

Figure 6.
The differences in the radial forces between the radial deviation model with speed or without.
Figure 6.
The differences in the radial forces between the radial deviation model with speed or without.

Figure 7.
Pressure distributions of the crown chamber with the 0.5 mm (top-left), 1.5 mm (top-right), and 2.5 mm (lower) radial installation deviation models with speed.
Figure 7.
Pressure distributions of the crown chamber with the 0.5 mm (top-left), 1.5 mm (top-right), and 2.5 mm (lower) radial installation deviation models with speed.

Figure 8.
Velocity distributions of the crown chamber with the 0.5 mm (top-left), 1.5 mm (top-right), and 2.5 mm (lower) radial installation deviation models.
Figure 8.
Velocity distributions of the crown chamber with the 0.5 mm (top-left), 1.5 mm (top-right), and 2.5 mm (lower) radial installation deviation models.

Figure 9.
Pressure distributions of the bottom ring with the 0.5 mm (top-left), 1.5mm (top-right), and 2.5 mm (lower) radial installation deviation models with speed.
Figure 9.
Pressure distributions of the bottom ring with the 0.5 mm (top-left), 1.5mm (top-right), and 2.5 mm (lower) radial installation deviation models with speed.

Figure 10.
Velocity distributions of the bottom ring with the 0.5 mm (top-left), 1.5 mm (top-right), and 2.5 mm (lower) radial installation deviation models.
Figure 10.
Velocity distributions of the bottom ring with the 0.5 mm (top-left), 1.5 mm (top-right), and 2.5 mm (lower) radial installation deviation models.

Figure 11.
Pressure distributions of the runner with the 0.5 mm (top-left), 1.5 mm (top-right), and 2.5 mm (lower) radial installation deviation models with speed.
Figure 11.
Pressure distributions of the runner with the 0.5 mm (top-left), 1.5 mm (top-right), and 2.5 mm (lower) radial installation deviation models with speed.

Figure 12.
Velocity distributions of the runner of the 0.5 mm (top-left), 1.5 mm (top-right), 2.5 mm (lower) radial installation deviation model.
Figure 12.
Velocity distributions of the runner of the 0.5 mm (top-left), 1.5 mm (top-right), 2.5 mm (lower) radial installation deviation model.

Figure 13.
The monitoring points of the crown chamber (top-left), the runner (top-right), and the bottom ring chamber (lower).
Figure 13.
The monitoring points of the crown chamber (top-left), the runner (top-right), and the bottom ring chamber (lower).

Figure 14.
The time domain signals of the radial force fluctuations.

Figure 15.
The phase angles of the radial force fluctuations.

Figure 16.
The FFT of the total radial force.

Figure 17.
The pressure distributions of the upper crown chamber.

Figure 18.
The pressure distributions of the middle crown chamber.

Figure 19.
The pressure distributions of the lower crown chamber.

Figure 20.
The pressure fluctuations of the upper, middle, and lower crown chamber.

Figure 21.
The pressure distributions of the upper runner.

Figure 22.
The pressure distributions of the middle runner.

Figure 23.
The pressure distributions of the lower runner.

Figure 24.
The pressure fluctuations of the upper, middle, and lower runner.

Figure 25.
The pressure distributions of the upper bottom ring chamber.

Figure 26.
The pressure distributions of the middle bottom ring chamber.

Figure 27.
The pressure distributions of the lower bottom ring chamber.

Figure 28.
The pressure fluctuations of the upper, middle, and lower bottom ring chamber.

Figure 29.
The polar graph of the three parts for the angle and pressure distributions.


Table 1.
The unit parameters of the high-quality 1000 MW Francis turbine.
| Parameters | Value |
|---|---|
| Rated Power | 1000 MW |
| Runner blade number | 15 |
| Guide vane number | 24 |
| Stay vanes number | 23 |
Table 2.
Mesh independence test.
| Rated Conditions | Relative Opening (%) | Rated Head (%) | Relative Efficiency (%) |
|---|---|---|---|
| Meshes with 5 million elements | 100 | 100 | 99.6 |
| Meshes with 10 million elements | 100 | 100 | 100 |
Table 3.
Number of elements in the flow domains.
| Flow Domain | Number of Elements |
|---|---|
| Spiral case | |
| Stay vane | |
| Guide vane | |
| Runner | |
| Crown chamber | |
| Bottom ring chamber | |
| Balance tubes × 4 | |
| Runner cone | |
| Draft tube | |
| Total |
Disclaimer/Publisher’s Note: The statements, opinions and data contained in all publications are solely those of the individual author(s) and contributor(s) and not of MDPI and/or the editor(s). MDPI and/or the editor(s) disclaim responsibility for any injury to people or property resulting from any ideas, methods, instructions or products referred to in the content. |
© 2023 by the authors. Licensee MDPI, Basel, Switzerland. This article is an open access article distributed under the terms and conditions of the Creative Commons Attribution (CC BY) license (https://creativecommons.org/licenses/by/4.0/).
Share and Cite
MDPI and ACS Style
Wang, Y.; Jin, K.; Huang, X.; Lin, P.; Wang, Z.; Wang, W.; Zhou, L. Influence of Radial Installation Deviation on Hydraulic Thrust Characteristics of a 1000 MW Francis Turbine. Water 2023, 15, 1606. https://doi.org/10.3390/w15081606
AMA Style
Wang Y, Jin K, Huang X, Lin P, Wang Z, Wang W, Zhou L. Influence of Radial Installation Deviation on Hydraulic Thrust Characteristics of a 1000 MW Francis Turbine. Water. 2023; 15(8):1606. https://doi.org/10.3390/w15081606
Chicago/Turabian StyleWang, Yifan, Kun Jin, Xingxing Huang, Peng Lin, Zhengwei Wang, Wenliang Wang, and Lingjiu Zhou. 2023. "Influence of Radial Installation Deviation on Hydraulic Thrust Characteristics of a 1000 MW Francis Turbine" Water 15, no. 8: 1606. https://doi.org/10.3390/w15081606
Note that from the first issue of 2016, this journal uses article numbers instead of page numbers. See further details here.