Article

Assessment of Dams’ Failure and Flood Wave Hazards on the Downstream Countries: A Case Study of the Grand Ethiopian Renaissance Dam (GERD)

by
Hazem M. Eldeeb
1,
Ali Ibrahim
1,
Magdy H. Mowafy
1,
Martina Zeleňáková
2,*,
Hany F. Abd-Elhamid
1,4,
Katarzyna Pietrucha-Urbanik
3,4 and
Mahmoud T. Ghonim
1
1
Department of Water and Water Structures Engineering, Faculty of Engineering, Zagazig University, Zagazig 44519, Egypt
2
Institute of Sustainable and Circular Construction, Faculty of Civil Engineering, Technical University of Kosice, 040 01 Kosice, Slovakia
3
Department of Water Supply and Sewerage Systems, Faculty of Civil, Environmental Engineering and Architecture, Rzeszow University of Technology, Al. Powstancow Warszawy 6, 35-959 Rzeszow, Poland
4
Department of Environmental Engineering, Faculty of Civil Engineering, Technical University of Kosice, 040 01 Kosice, Slovakia
*
Author to whom correspondence should be addressed.
Water 2023, 15(8), 1609; https://doi.org/10.3390/w15081609
Submission received: 15 March 2023 / Revised: 14 April 2023 / Accepted: 17 April 2023 / Published: 20 April 2023
(This article belongs to the Special Issue Aquatic Ecosystem: Problems and Benefits)

Abstract

:
Dams are built for different purposes, but failure of a dam could result in extreme disasters such as floods. The Grand Ethiopian Renaissance Dam (GERD) was mainly built for power generation, but concerns about its safety, location and site conditions have led the downstream countries to investigate the GERD’s stability. This paper aims to investigate the impact of the failure of the dam on the downstream countries using the Hydrologic Engineering Center River Analysis System (HEC-RAS). Outflow hydrographs and flood inundation maps were provided through a hypothetical dam break scenario. An unsteady flow hydrodynamic routing with a 2D model was used to simulate the failure of the dam. A sensitivity analysis study of the output’s findings against breach parameters was also performed. The breach outflow discharge increases as the breach dimension increases. However, the peak discharge decreases with increasing breach formation time. Moreover, to prepare emergency action plans, it is important to predict the inundation depth, levels, arrival of flood waves, flood coverage area and water velocity. Furthermore, the results showed that Khartoum would turn into lakes within about 10 days and flood water depth would exceed 11 m at some locations in residential areas. Moreover, the flood waves overtopped the Roseires, Sennar and Merowe dams by 11, 7 and 20 m, respectively. In addition, the level of Lake Nasser would reach 188 m above sea level and the Aswan High Dam might be in great danger.

1. Introduction

A dam is a strategic structure that holds huge amounts of water upstream. Dams have been a crucial component of the social infrastructure that supports socio–economic growth and prosperity [1]. They are constructed for a variety of objectives, such as irrigation, flood control, hydroelectric generation and supply of water. Nevertheless, failure of dams can cause catastrophic events such as floods that release an uncontrolled volumes of water downstream [2]. The effects of dams’ failure on the ecosystem have not yet been formally defined. The fundamental meaning of the term “environmental effect” is environment and ecological changes in the area around the reservoir as a result of dam failure [3].
In the previous 20 years, floods caused by dams’ failure have resulted in terrible catastrophes. Moreover, the creation of effective emergency response plans requires accurate predictions of inundation elevations and the timing of the arrival of the floodwater at a particular place [4]. Around the world, there were more than 200 significant dams breaches between the years 2000 and 2009 [5]. Additionally, there have been a number of dam failure incidents in recent years in various countries. For instance, in 2017 the spillway of Oroville Dam in the United States failed and caused significant downstream damage [6]. The Brumadinho iron mine’s tailings dam in Brazil catastrophically collapsed in January 2019, resulted in 259 fatalities [7]. Another disaster in 2018, a saddle dam failure in the Mekong basin of Laos, resulted in devastating floods, killing dozens of people and displacing thousands of people [8]. Recently, two catastrophic earthquakes recorded as 7.5 and 7.8 on the Richter scale happened relatively near to the Atatürk Dam in southeast Turkey, and it now appears to be in critical condition. According to experts’ expectations, about a 30 square kilometer area next to the dam might be devastated if the dam failure occurred [9].
Due to public concern, decision makers are now more accountable for the safety of dams. Disasters brought about by dam failure can happen more frequently as infrastructure ages. As a non-structural measure to reduce the effects of flooding, emergency preparation is crucial to crisis management. Using accurate flood inundation maps to learn more about the flood risk is one of the keys for avoiding and minimizing flood disasters [10]. Distinct and social structural preparation may help with risk reduction when a disaster cannot be prevented [11]. Therefore, a dam failure analysis should be taken into account for every dam. When compared to the total cost resulting from disasters, the cost of a dam failure evaluation is negligible [12].
Several studies showed that internal erosion and external factors both contributed to dams’ failure. There are several factors that might cause a dam to fail, including internal erosion, seepage, overtopping because of inadequate spillway capacities or free board and settlement owing to slope slips on upstream shells, as well as earthquakes [13]. In addition, no matter the cause, most failures begin with a breach formation. A breach is defined as a hole made in the body of a dam that induces the dam to break and spreads water from upstream areas to the downstream [4]. The three main goals of dam break analysis are to estimate the hydrograph of the dam break out flow, route the hydrograph through the downstream valley, estimate the degrees of inundation and estimate damages to downstream structures [14]. Accordingly, in a dam breach flood wave assessment, the hydrograph’s shape and length are the two most crucial variables [15].
Although the Grand Ethiopian Renaissance Dam (GERD) is planned to be utilized in the hydropower generation process, the downstream region is anticipated to experience a number of negative effects. Potential flow reduction and lack of control over the operation of the dam are the main concerns for those downstream countries. One of the main effects is the surge wave that is produced when a dam fails or when a dam spills quickly due to unanticipated circumstances. The downstream region will be significantly impacted by such rapid release of a large volume. A dam failure might cause a flood wave with a depth of tens of meters to travel down the river at very high velocities, which could have extremely disastrous effects on the developed communities downriver. If there are no early warning systems or emergency evacuation preparations in place, such a devastating force results in an unavoidable loss of life.
Due to the enormous size and massive dimensions of dams, the dam break assessment is a very important part of the analysis in the case of the GERD. Additionally, there is a considerable possibility of soil instability at the site, which increases the likelihood that the GERD may collapse. One of the world’s principal tectonic plates and faults is located where the GERD is situated. There have been 15,000 earthquakes recorded in Ethiopia around that fault [16]. About 11 earthquakes in Ethiopia that recorded 6.2 on the Richter scale during the 20th century caused significant damage [17]. Despite the fact that a large system of faults and stress fractures crosses right next to the dam [18], this fear about the GERD’s safety is continually neglected. In spite of the importance of the GERD, few studies have been carried out on it so far. Moreover, few studies have assessed the effect of dam failure. Soliman et al. [19] used the International River Interface Cooperative (IRIC) two-dimensional model to investigate GERD failure. In addition, Ali et al. [20] used a 1-D HEC-RAS model to assess GERD failure via a piping failure process.
Thus, this study aims to investigate the effects of the GERD’s failure with different scenarios, which will help to define the amount of damage likely to be caused by dam failure. Accordingly, it will be useful to prepare an emergency plan and disaster mitigation strategies to limit the damage in the event of such a catastrophic failure.

2. Materials and Methods

A 2D dam failure model was simulated using HEC-RAS. The HEC-RAS model has recently risen to the top of the list for dam breach flow analysis due to its accurate predictions and accessibility [21]. Furthermore, West et al. [22] provide information on various techniques for simulating the process of a dam break. HEC-RAS is an integrated software system designed for use in multi-tasking networks. HEC-RAS is frequently used for channel and floodplain management, as well as flood insurance studies to analyze floodway encroachments, due to its comprehensive modeling capabilities. Moreover, terrain data and 2D flow area must be included in the 2D model created in HEC-RAS [23]. Furthermore, a HEC-RAS dam break model is an important tool for predicting the potential flooding and damage from dams in terms of flood water time arrival, peak outflow and time to peak, maximum water level, extension of inundation, flood water depth, flood wave velocity and the duration of flood.

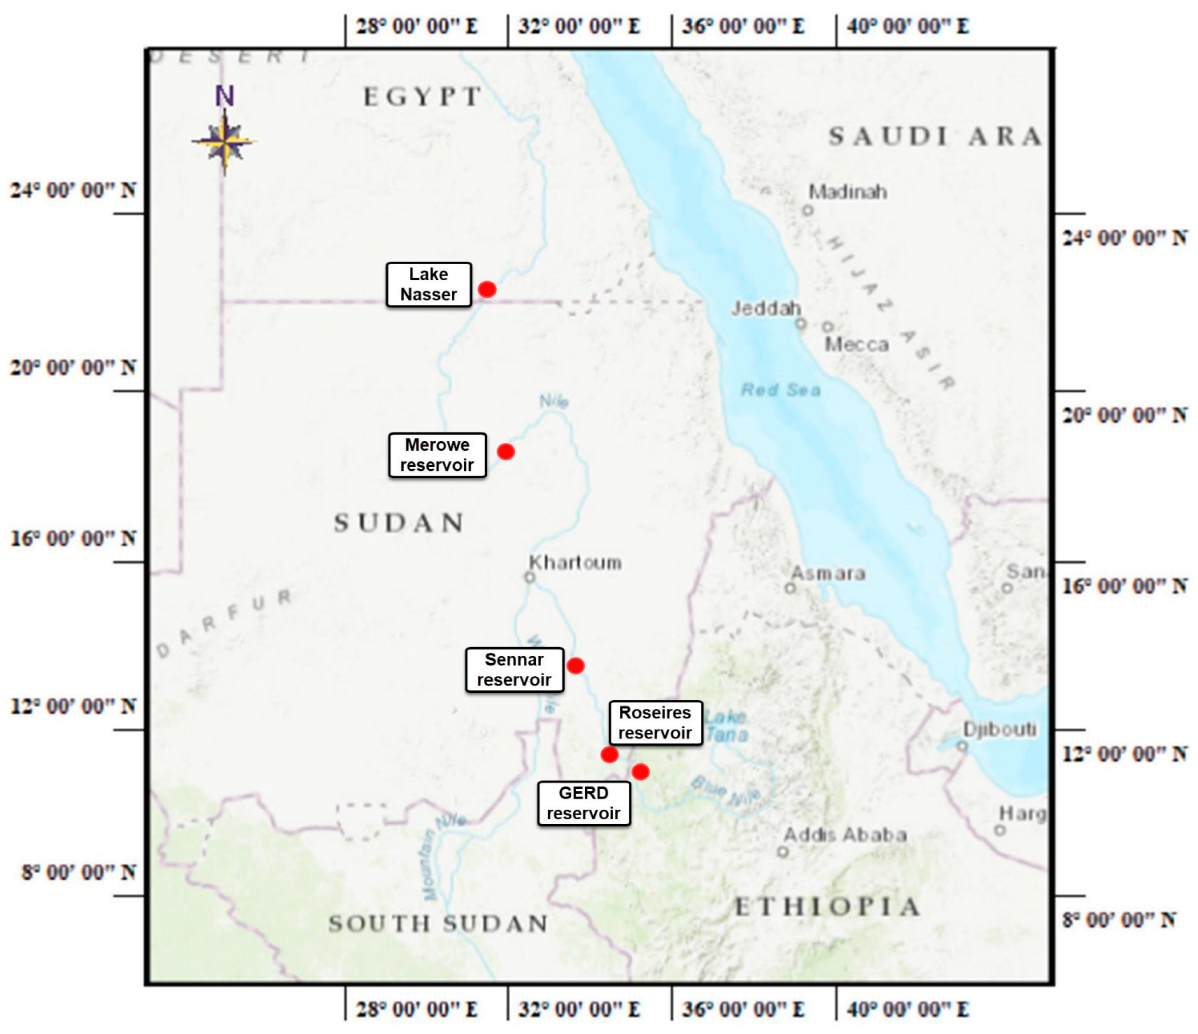
2.1. The Study Area Description
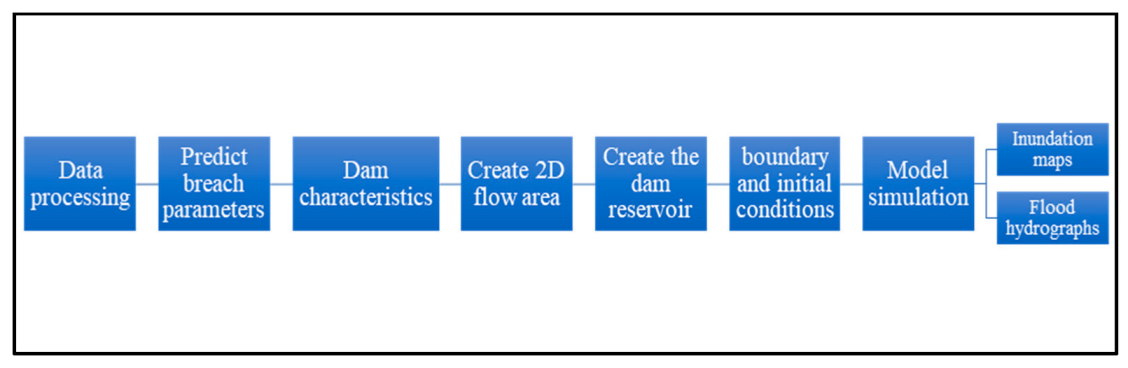
To conduct a 2D model simulation using HEC-RAS, a digital elevation model (DEM) should be provided. The geometric information needed for hydraulic simulation is produced using a digital elevation model (DEM) with a 30 m × 30 m resolution, which was provided by the Shuttle Radar Topography Mission (SRTM). Although the accuracy of DEM data at different resolutions may raise questions about accuracy, the huge amount of water discharged as a result of dam failure means that DEM accuracy will not have a substantial impact on dam break simulation [24].
The study region includes three existing dams, Roseires, Sennar and Merowe, along the watercourse from the GERD in Ethiopia to the Aswan high dam (AHD) in Egypt, as shown in Figure 1.
The GERD is about 20 km upstream from the southern Ethiopian and Sudanese borders. The reservoir storage capacity is 74 BCM at full reservoir level of 640 ASL [25]. GERD is an Ethiopian project that combines a 50 m high concrete-facing rock-fill saddle dam with a 175 m high roller-compacted concrete gravity dam [26]. Due to the relatively low topography of the dam site, the saddle dam helps to maintain the design storage and water level for the gravity dam, which is constructed over the Blue Nile. In addition, the design discharge of the main dam is equal to 4305 m3/s [27].
Roseires dam is the first dam downstream of the GERD, and is located in Sudan at Ad Damazin city. It is a concrete dam built in 1966 and strengthened in 2013. Moreover, it is located 500 km upstream of Khartoum and 120 km downstream of the GERD. The initial capacity of this dam was 3.0 × 10⁹ m3, and it was increased to 7.4 × 10⁹ m3 in 2013. The final height of the dam is 78 m, and its lake length is 75 km. Furthermore, Roseires dam is used to provide irrigation on demand to the surrounding lands and is also used in hydropower generation, where it generates 280 megawatts [28].
The second dam is Sennar dam, which is located 300 km south of Khartoum, across the Blue Nile. It is the oldest rock-fill dam in Sudan and was built in 1925. Sennar dam is about 3.0 km in length, and its height is 40 m. Moreover, this dam has a reservoir capacity of 0.63 × 10⁹ m3. It is also used to provide irrigation water for agricultural projects, and it is used in hydropower generation with a capacity of 15 megawatts [29].
The third dam is the Merowe dam, which is located approximately 350 km north of Khartoum city, across the Nile River. It was built in 2009 and has a storage capacity of 12.4 × 10⁹ m3. Moreover, the dam is about 9 km long and 67 m high. Moreover, it is an embankment dam, and the length of the reservoir is about 174 km [30]. This dam is mainly used to produce hydropower with an installed capacity of 1250 megawatts [31].
The last dam in this study is Aswan High Dam (AHD). It was built in 1968 across the Nile River in Egypt, at Aswan city. AHD is a rock-fill dam with a clay core. It stands 111 m height and has a storage capacity of 162 × 109 m3 at the maximum allowable water level. The reservoir of the dam is called Lake Nasser; it has a surface area of 5250 km2 and is 550 km in length. Moreover, the dam has an emergency spillway, which is called Toshka spillway. This spillway was built in 1982. Furthermore, a channel was built to link Lake Nasser with the downstream Toshka Depressions. AHD is considered a multi-purpose dam as it is used to provide water for irrigation, flood control and hydropower generation, with an installed capacity of 2100 megawatts [32].

2.2. Methodology

Figure 2 shows the developed methodology for assessment of dam failure. The methodology of this paper starts with data processing and ends with creation of inundation maps and flood hydrographs. The first step is data processing, which involves collection of the topographic data for the study area and obtaining the digital elevation model (DEM). Then, this DEM was pre-processed using ArcGIS. Afterward, the breach parameters such as breach size and formation time were predicted, according to guidelines. Then, the dam characteristics, such as location, size and height were defined. Then, the 2D flow area and the reservoir of the dam were created. The following phase was to define the upstream and downstream boundary conditions in addition to defining the initial condition of the unsteady flow. Once these steps are completed, the HEC-RAS model is ready for simulation. After the simulation is finished, the output results can be obtained. The results are displayed in terms of flood hydrographs, flood stage curves, flood wave velocity, inundation depth, flood arrival time and water surface elevation. Afterward, the flood inundation maps are provided using RAS mapper and can be exported to any GIS software. Furthermore, a sensitivity analysis of the output results against the breach parameters is carried out by changing the breach size and formation time. Additionally, for constructing dam break analysis utilizing a hydraulic model, the following project components have been represented in the model.

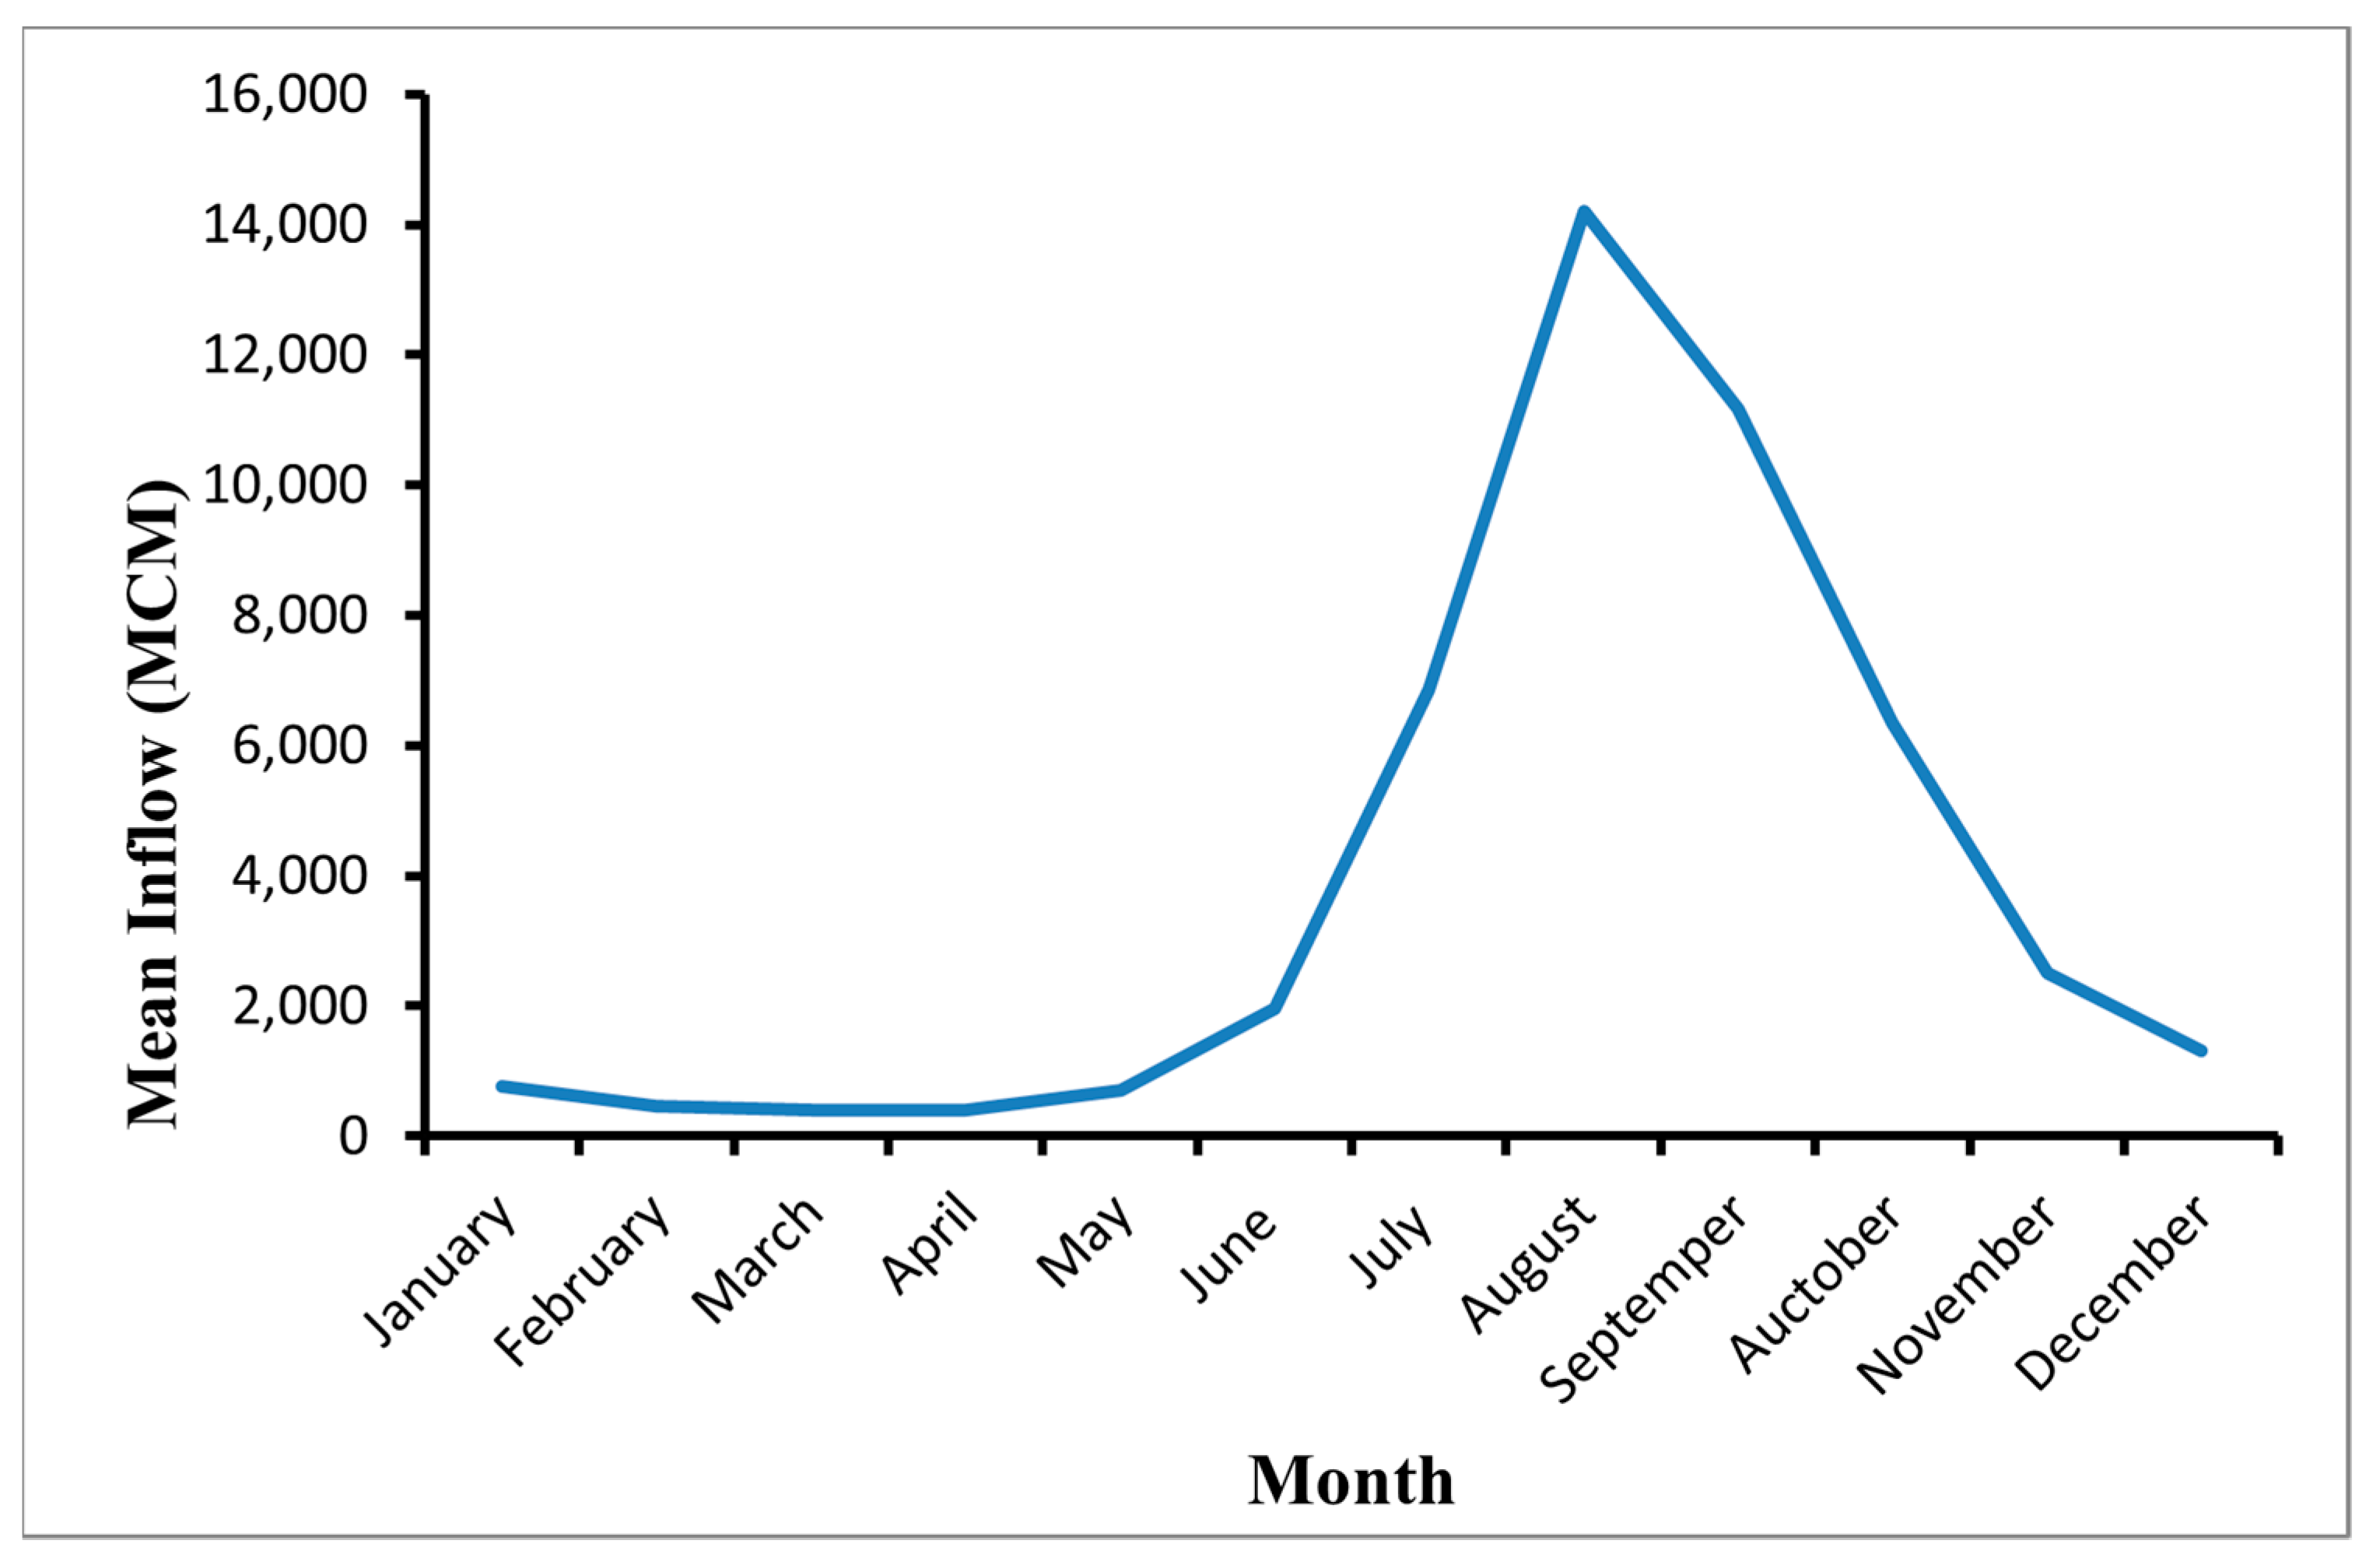
2.2.1. Boundary and Initial Conditions

Both upstream and downstream boundary conditions in addition to the initial condition must be specified to define both ends of a river system. The reservoir basin upstream of the dam can be represented using either cross-sections or storage areas. HEC-RAS employs level pool routing across the reservoir and unsteady flow routing downstream of the dam if a storage area is used. In the current study, storage area is taken into account using upstream boundary conditions for dam break simulation. Table 1 shows the elevation–capacity curve data of the reservoir. The reservoir’s lateral inflow hydrograph is regarded as an upstream boundary condition, as shown in Figure 3. On the other side, normal depth is assumed to be the downstream boundary condition. In addition to the boundary conditions, the input data in the HEC-RAS software at the start of the unsteady flow simulation has been provided. The initial conditions comprise the elevation of the storage area. The GERD reservoir’s initial storage elevation is considered to be 645 m ASL, which represents the dam’s crest elevation.

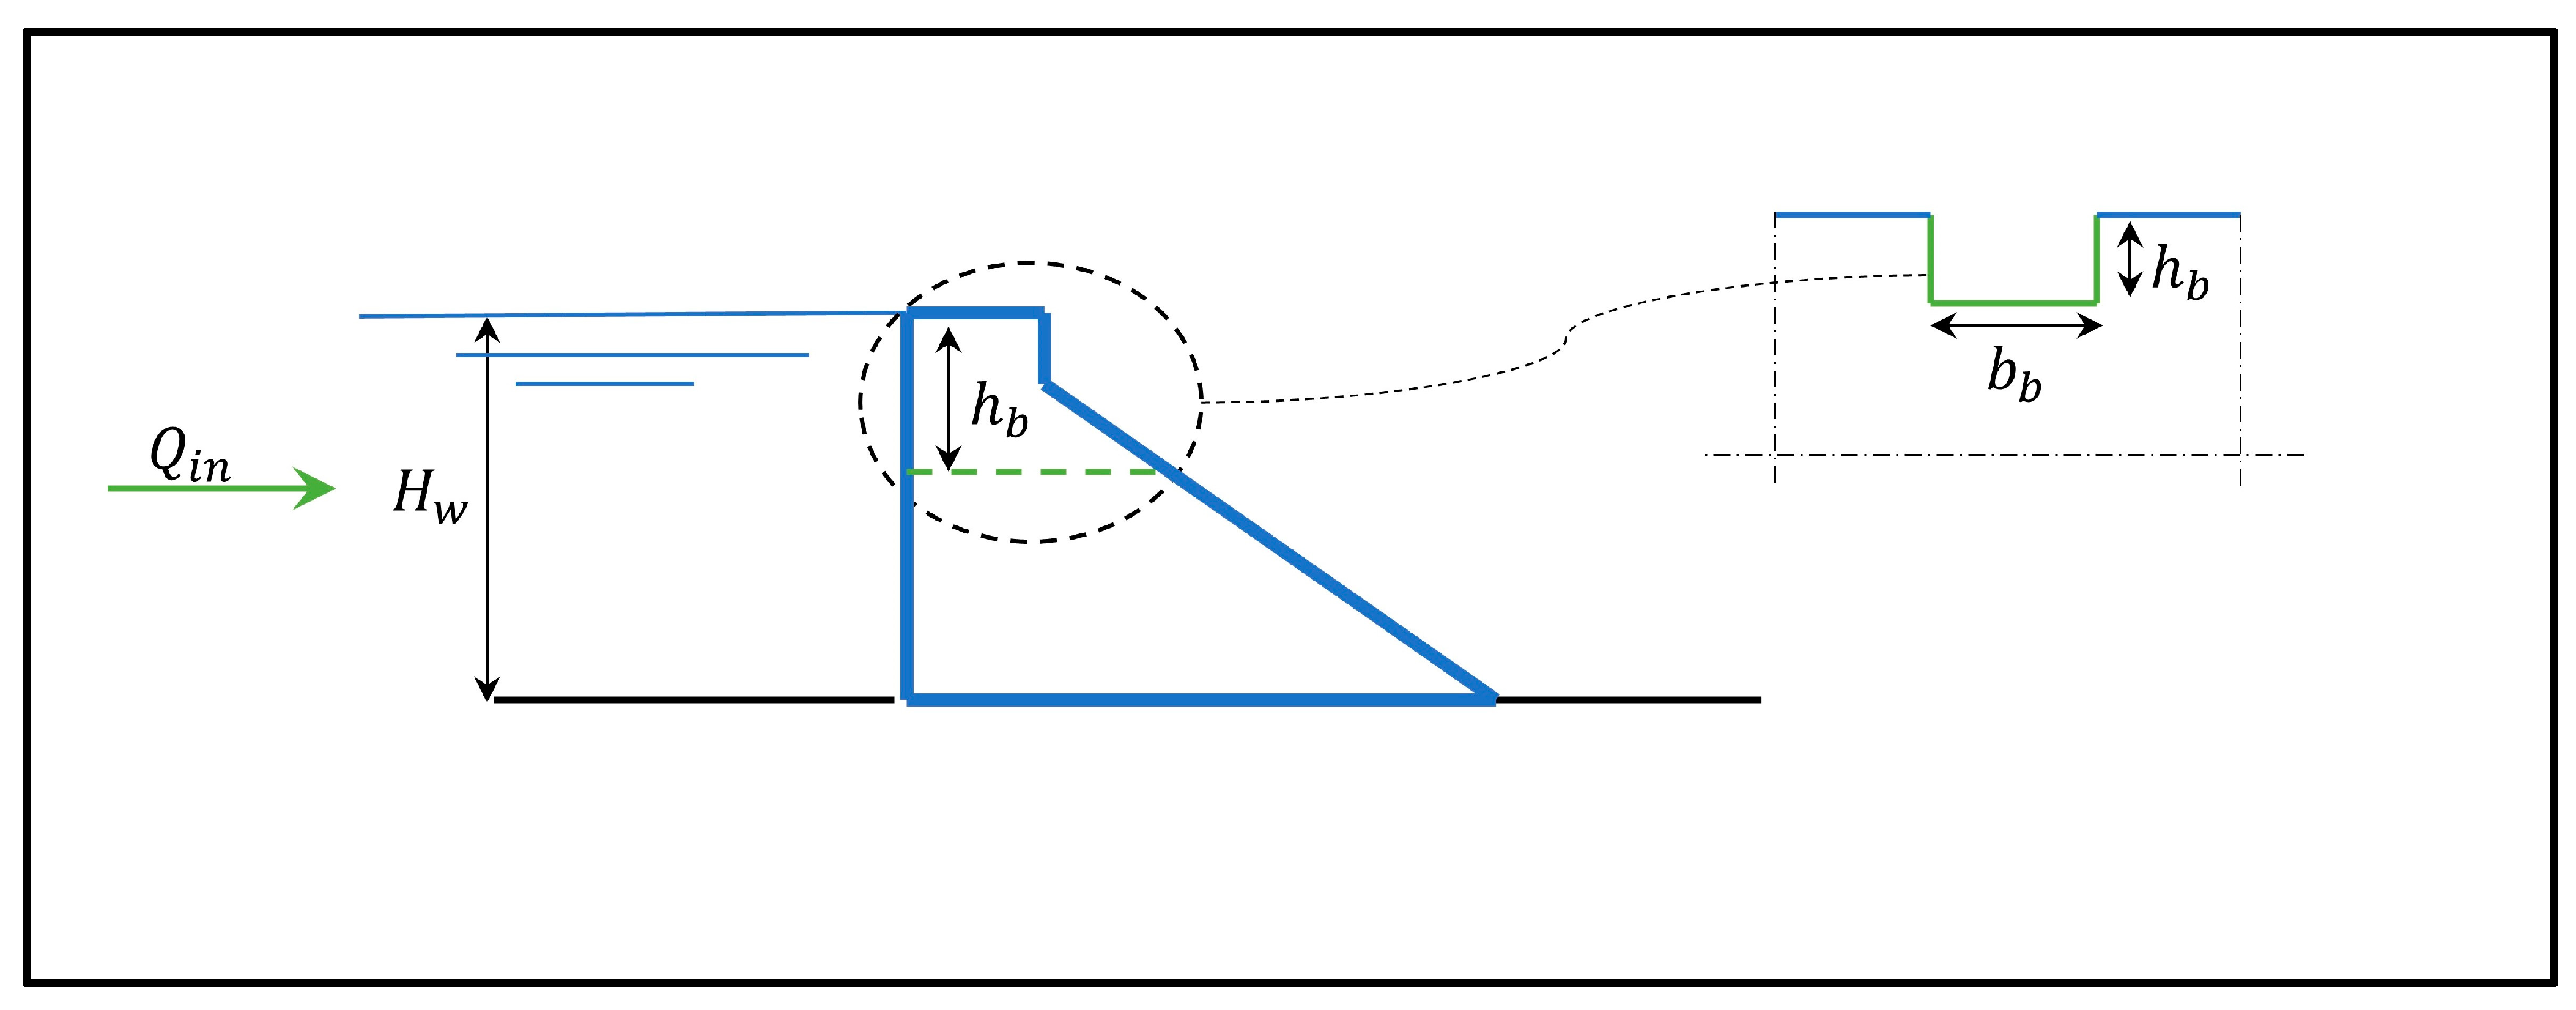
2.2.2. Defining Breach Parameters

It is obviously very difficult to predict the probability of dam failure in any dam break research because predicting the dam breach dimensions and time of breach is beyond the capabilities of any commonly available mathematical models [34]. Estimating the location, magnitude and development time of the breach is crucial in order to provide accurate estimates of outflow hydrographs and downstream flooding [35]. After estimating the breaching parameters, the HEC-RAS may be utilized to compute the outflow hydrograph from the dam breach and execute downstream routing. The following breach characteristics are used as input into the existing dam break models: (i) entire final bottom width of the breach; (ii) final bottom elevation of the breach; (iii) left and right-side slopes of the breaching section; (iv) full formation time of the breach and (v) reservoir level at the time of breach start. Furthermore, the breach development mechanism is heavily influenced by the type of dam and the cause of the dam failure [34].
A statistical analysis study of 100 concrete dams around the world was conducted, and it was found that the most common cause of failure for concrete dams is quality problems, followed by overtopping [1]. The dam break scenario in this study basically depends on the following assumptions:
  • The breach height (H) is equal to 50 m and it refers to the difference between the maximum operation level (640 m ASL) and the minimum operation level (590 m ASL);
  • The breach is rectangular, with a width of 250 m. This width equalizes to five times the breach height (5H) according to Wetmore and Fread recommendations [36];
  • Based on the previous guidelines, the breach formation time should be H/40 in minutes, but it is believed this period would really be shorter. Thus, as recommended by agencies such as HEC [37] and ICOLD [38], the time of breach formation ranges from 0.1 to 0.5 h for concrete dams. Therefore, the breach full time was assumed to be 0.1 h;
  • The main dam will break when reservoir elevation reaches up to 645 m ASL;
  • The failure mechanism is overtopping.

3. Results and Discussion

The first set of analyses examined the effect of the GERD failure due to the previously mentioned breach parameters. The current case findings show that the peak outflow from the GERD approaches 163,230 cubic meters per second and the maximum water elevation is equal to 566 m ASL. In addition, these peak discharge and water levels occur 3 and 2 h after dam failure. Furthermore, this peak outflow is equivalent to more than 37 times the design discharge of the dam. The flood wave triggered by the dam failure has a high velocity that reaches 10 m per second.

3.1. Sensitivity of Results against Breach Parameters

Sensitivity analysis is carried out by changing the values of the input breach parameters to simulate the dam failure and analyze the impact of each breach parameter on discharge values and water levels. Thus, the breach time and breach size are analyzed as input parameters for the sensitivity analysis.

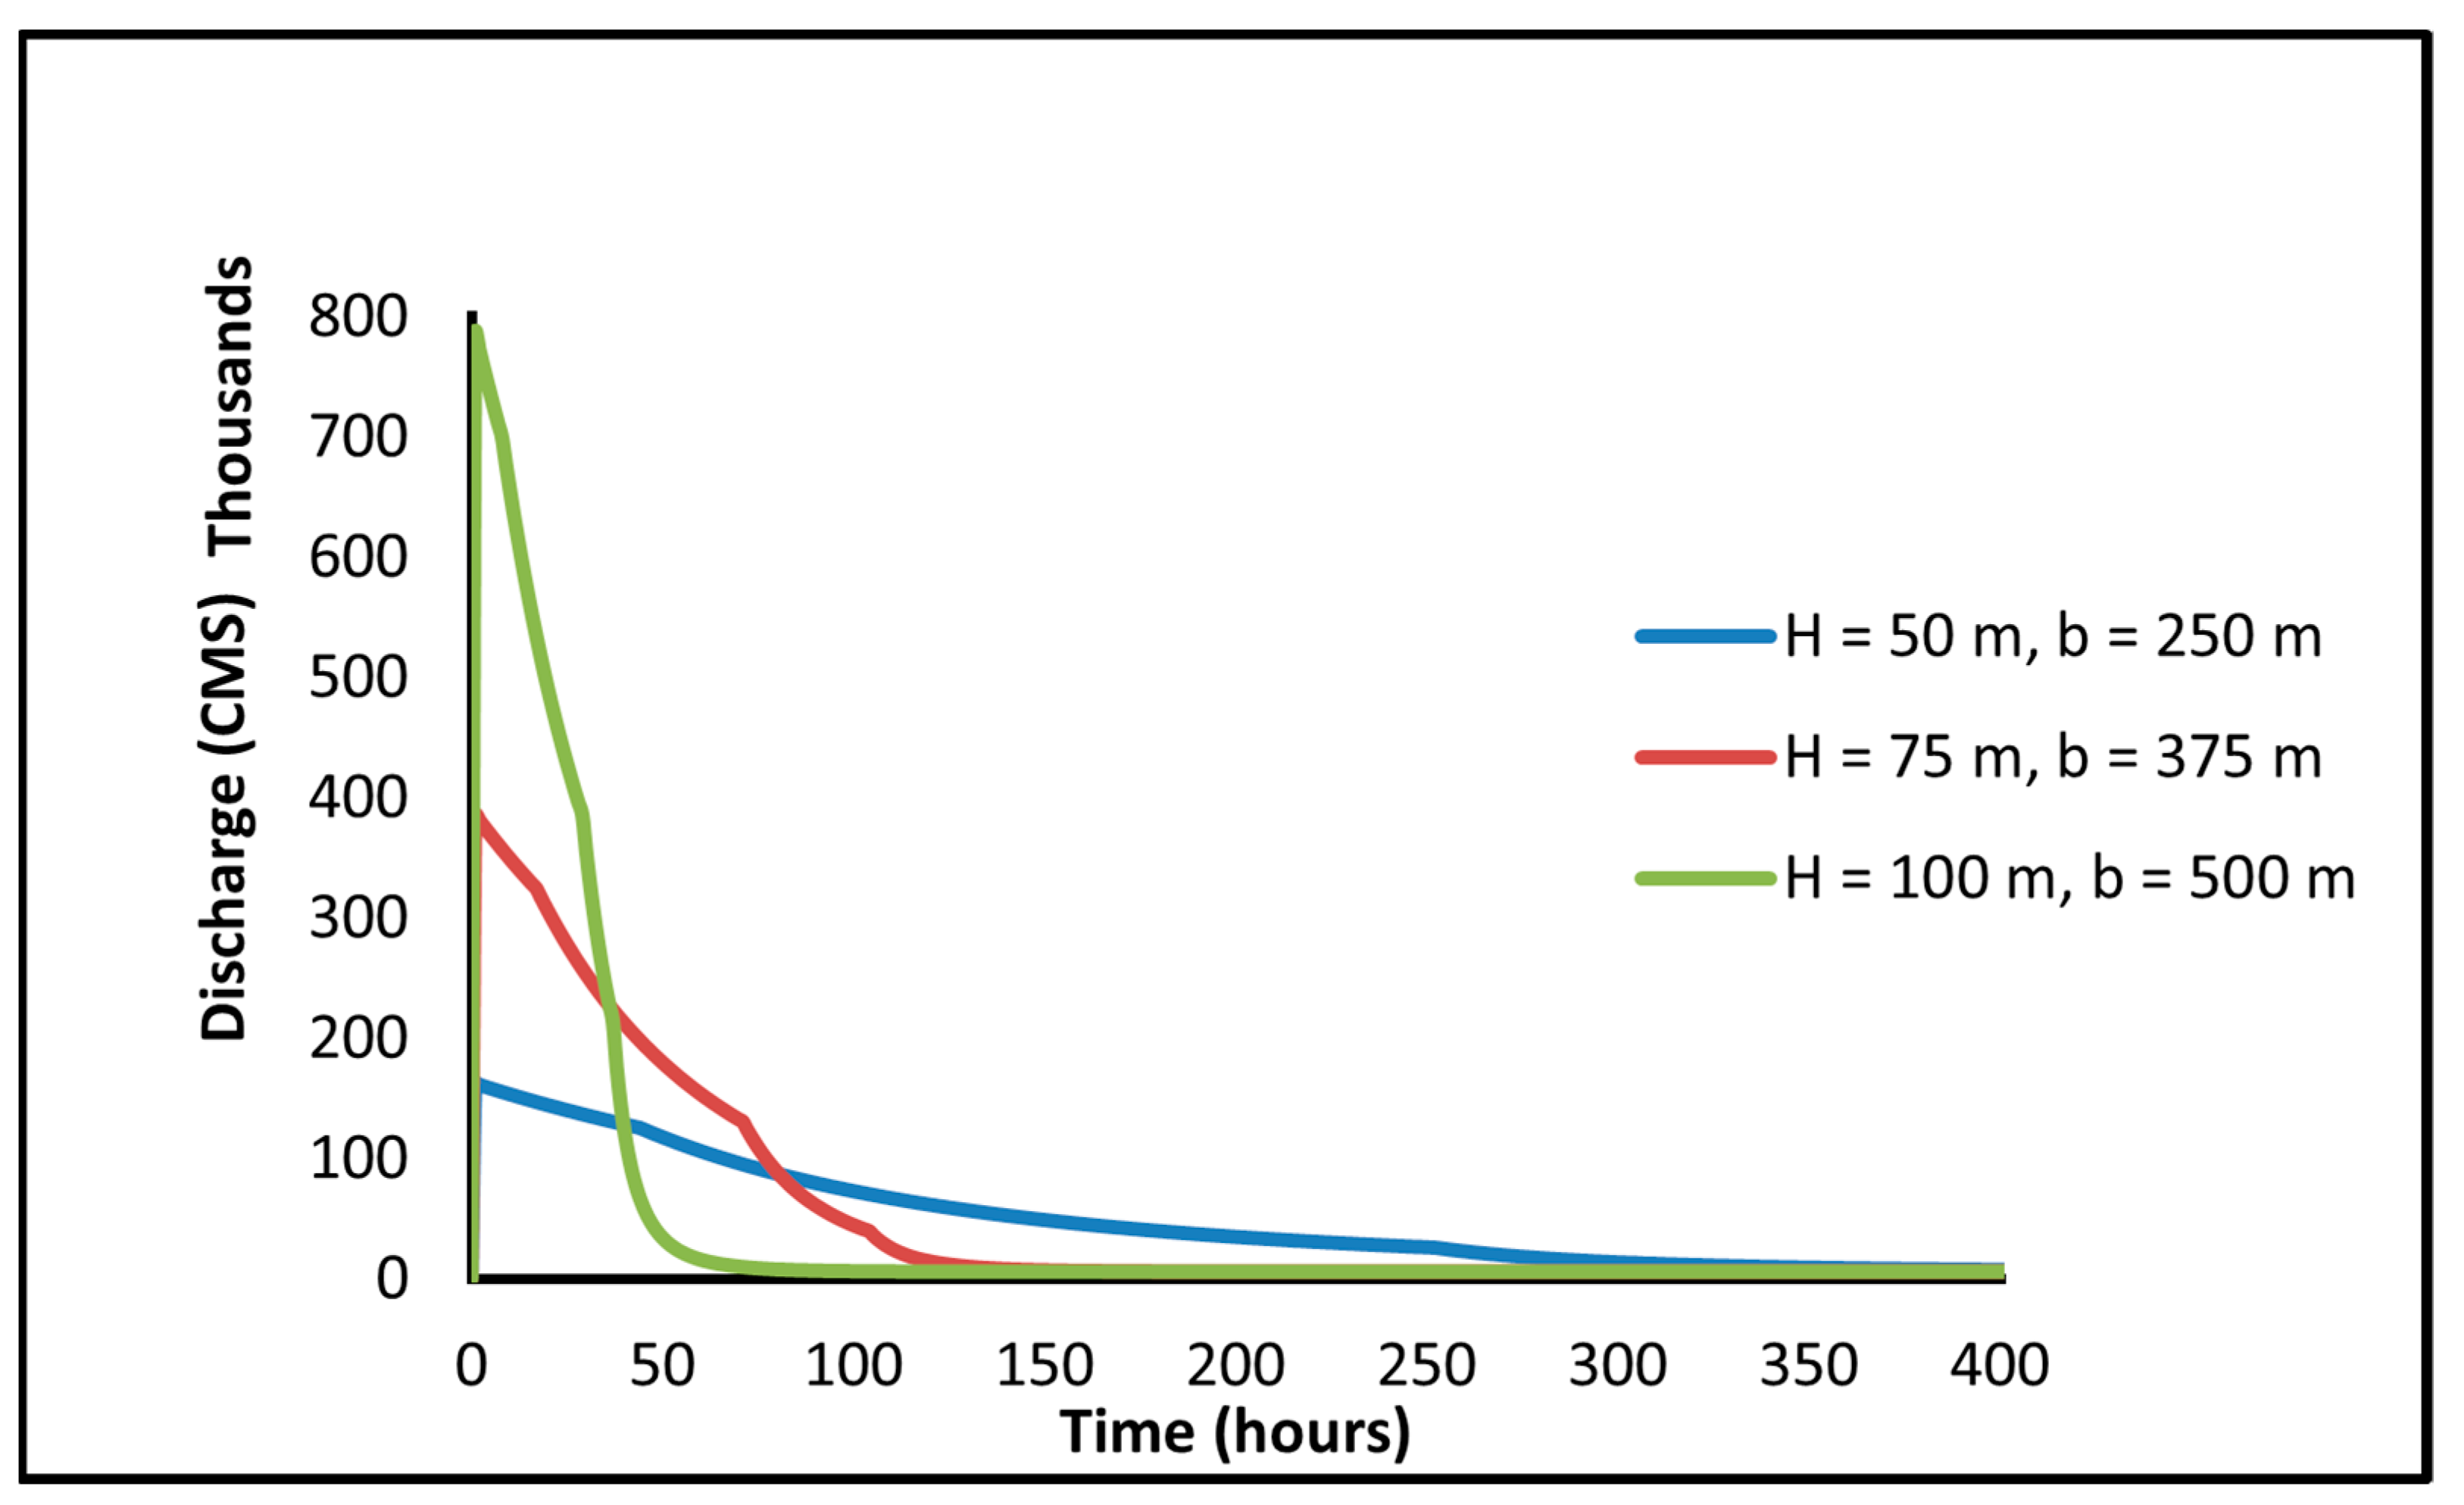
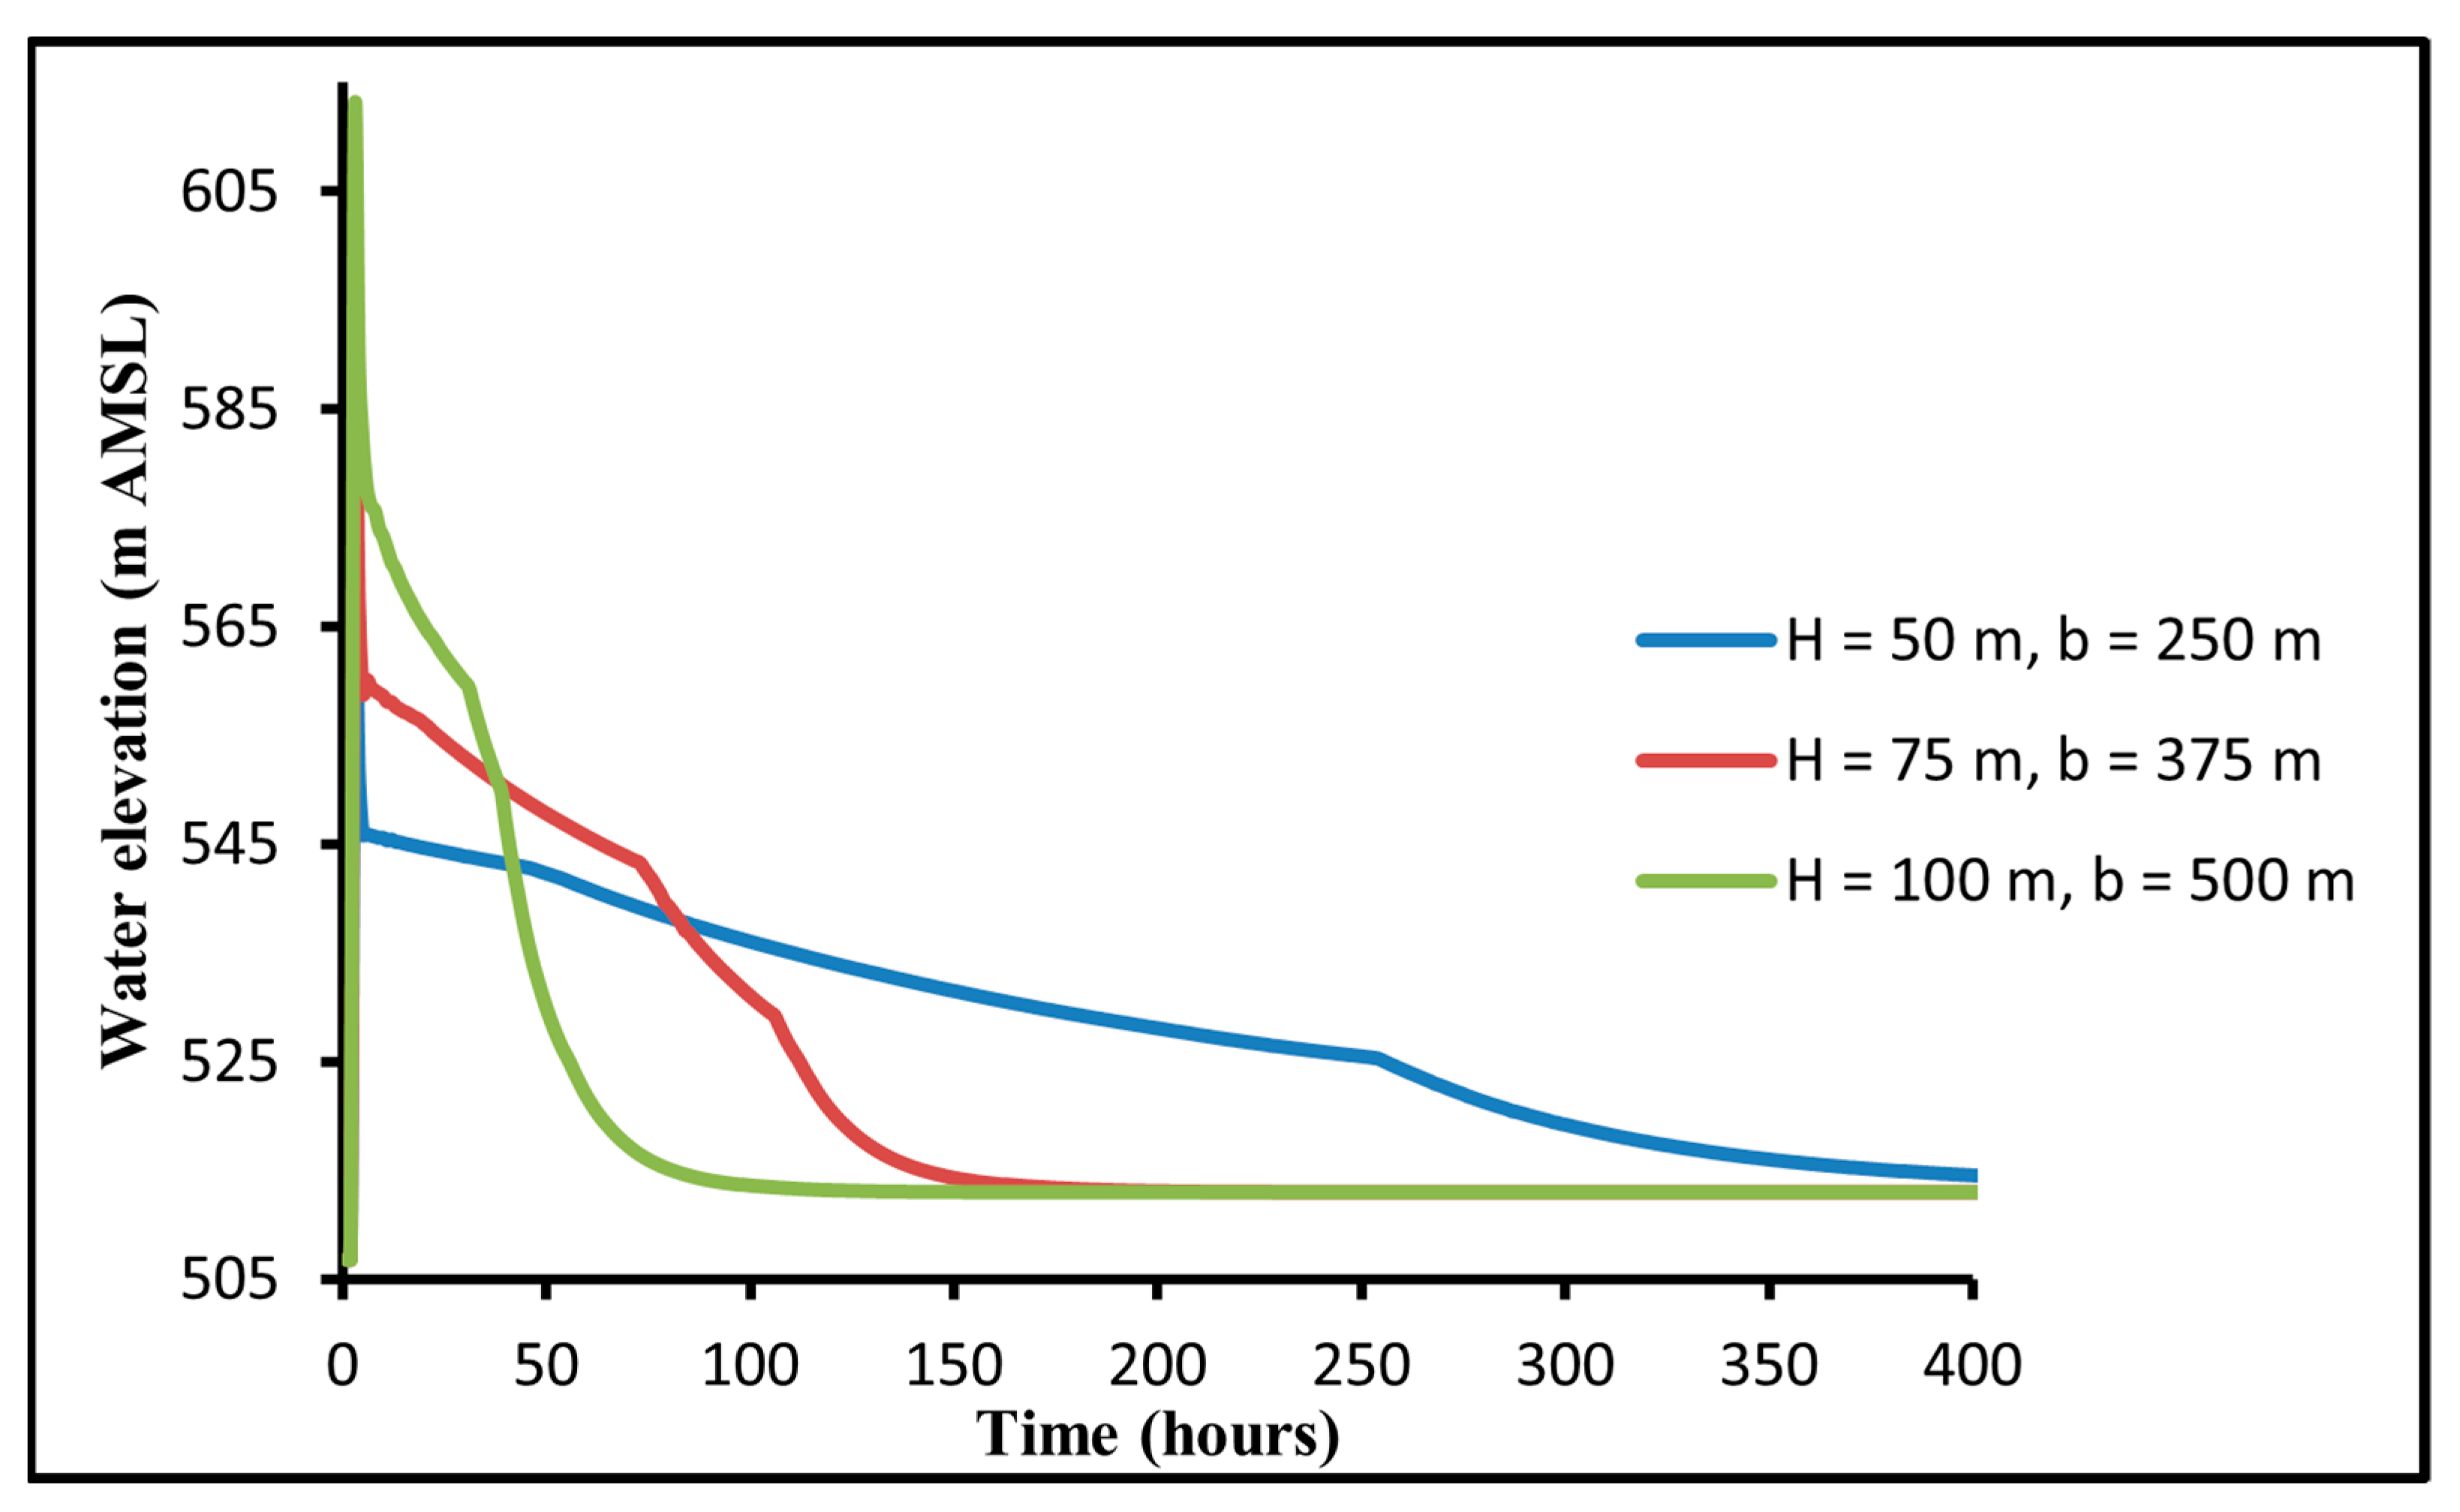
3.1.1. Effect of Breach Size

Figure 4 indicates a cross-section of the dam with a breach showing the different parameters that affect the dam breaching process due to overtopping, where Q i n is the reservoir inflow, b b is the breach width, h b is the breach height and H W refers to the reservoir headwater.
By modifying the breach bottom width and consequently the breach height, (where H = 5b), the dam failure model with this sensitive parameter is examined. In contrast, other parameters remain constant. The breach widths were assumed to be increased by 50% of the base case as the first scenario and 100% as the second one, while the breach heights were increased by 50% and 100% from the base case, respectively.
Flood hydrographs and stage curves for the previous three cases are displayed in Figure 5 and Figure 6. It was found that, when the bottom width and breach height are increased by 50%, the maximum flow increases from 163,230 to 385,678 m3/s. Moreover, the flood elevation due to the dam failure at the dam location increases from 566 to 585 m ASL. Additionally, when breach width and height are increased by 100%, the peak outflow becomes 787,042 m3/s and the peak flood water level increases to 611 m ASL. It is clearly apparent that water levels stay at higher elevations for a longer duration in smaller breaches than in larger breaches since the dam’s reservoir is emptying more slowly.
It was found that at a distance of 450 km from the GERD site, the effect of breach width on the flood peak and inundation area can be neglected. Shallow slopes and significant floodplain storage will cause the downstream attenuation to occur more quickly.

3.1.2. Effect of Breach Formation Time

Breach time refers to the time required for the breach to be fully formed through the dam body. Various breach times (0.1, 0.3 and 0.5 h) were chosen for running the model so as to carry out a sensitivity analysis for the time of breach for a height of 50 m and 250 m width. The peak flow was found to be slightly reduced by increasing the time until full formation occurred. Where the maximum outflow for time equals 0.1 h was 163,230 m3/s and occurred 8 min after dam failure, the maximum outflow for time equals 0.3 h was found to be 163,131 m3/s and occurred 20 min after dam failure. After that, when increasing the breach time to 0.5 h, the peak discharge decreased to 163,030 m3/s and occurred 32 min after dam failure. The reason for this result is that slower-forming breaches of the same size allow the reservoir’s headwater to drop more gradually and the tailwater to peak later than those that form quickly. Furthermore, nearly the same maximum water level is observed at the downstream locations as the breach time is increased.

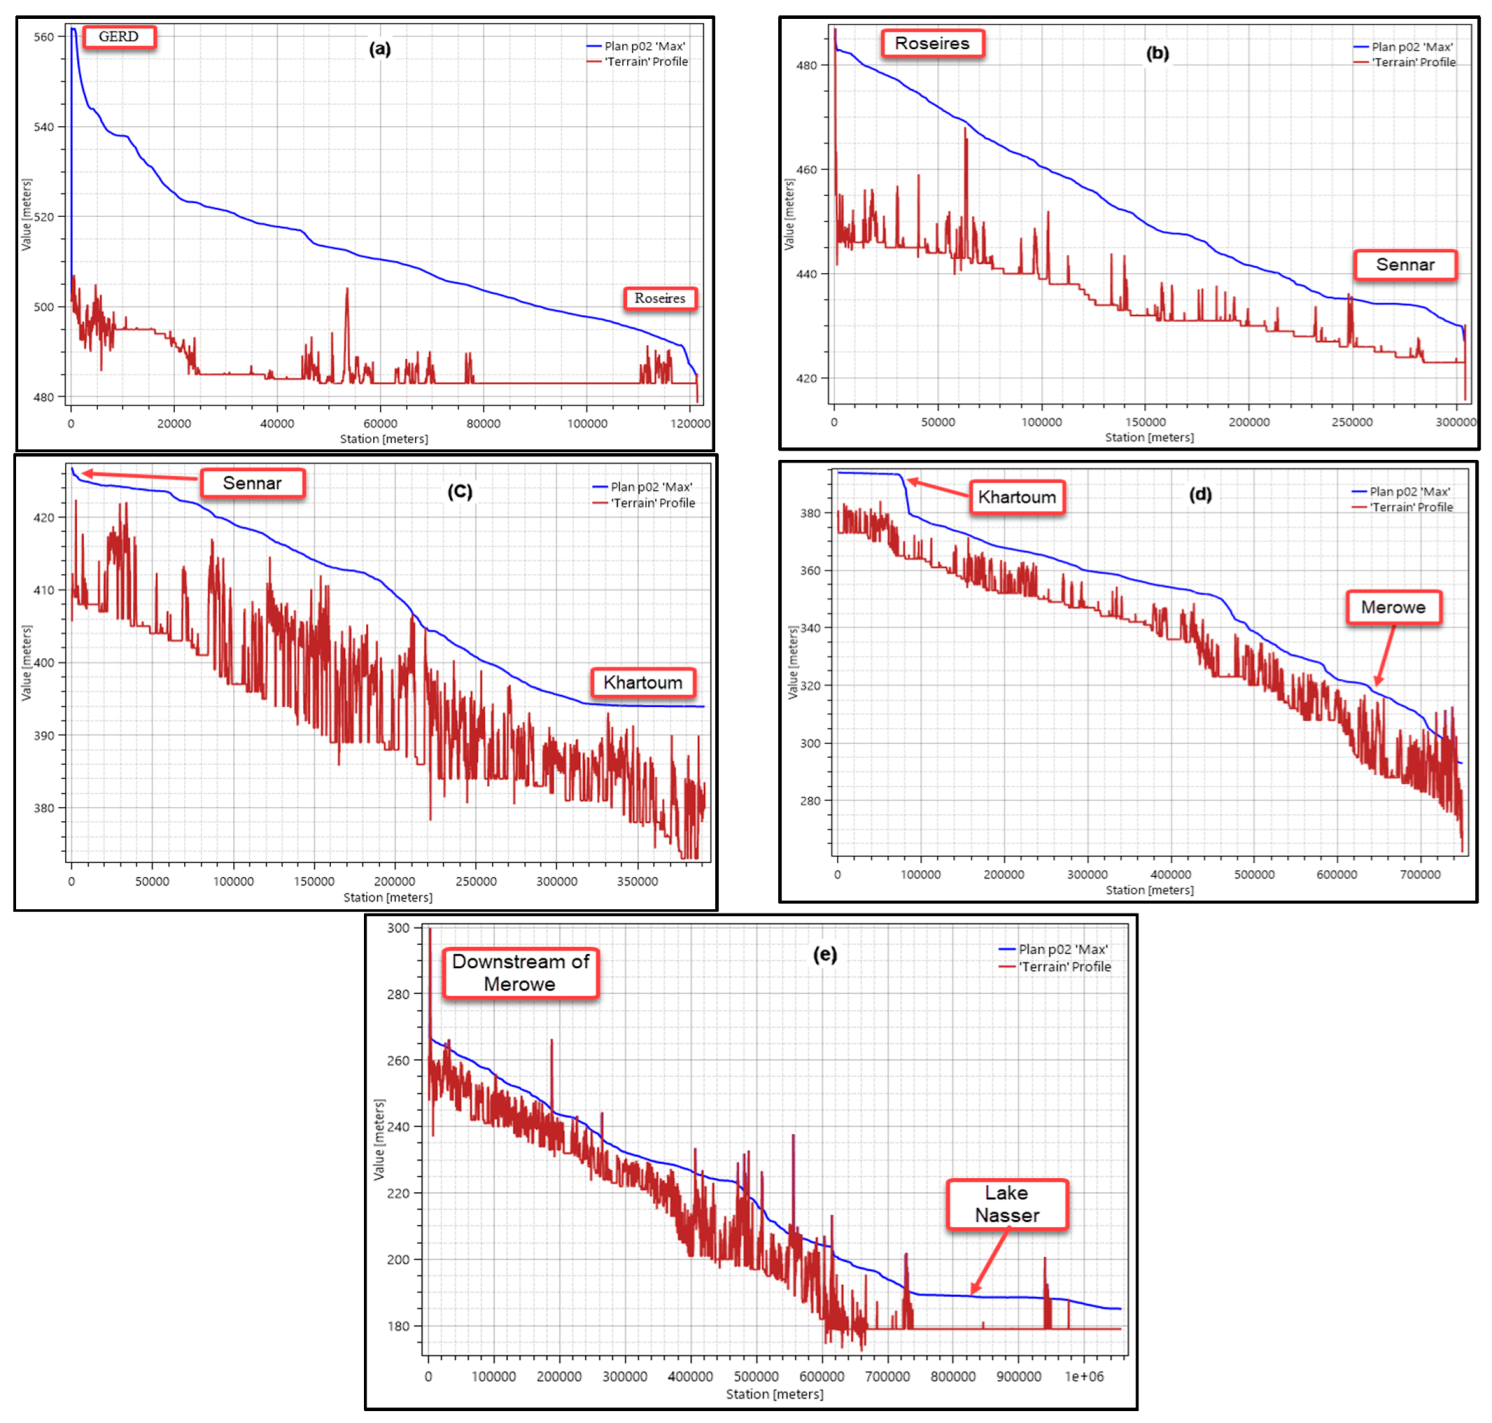
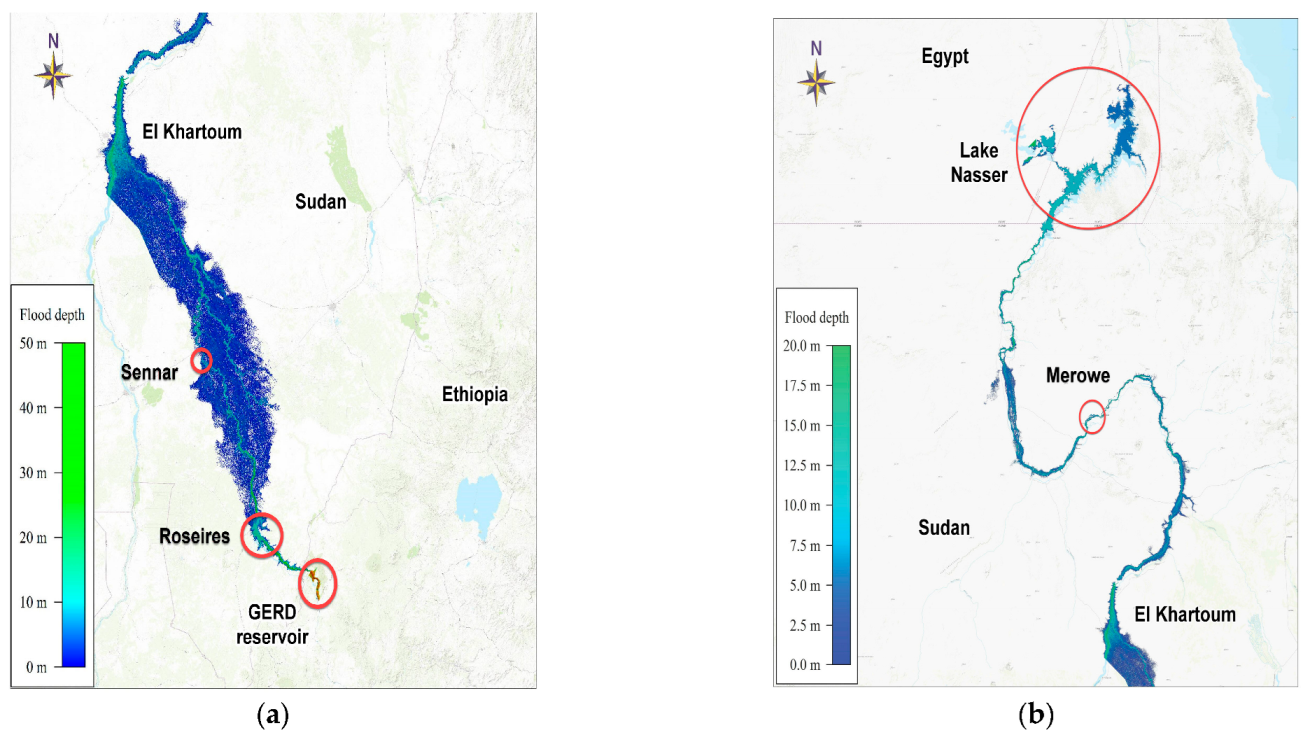
3.2. Emergency Plan and Inundation Map

Accurate forecasting of inundation levels, top widths and the time of flood wave arrival at a specific location where infrastructure and population are at risk is required for the development of effective emergency response strategies. The predicted velocity and water surface elevation in the HEC-RAS model can be determined when the flood waves arrive at the vital spot along the flood path. Table 2 summarizes the flood wave velocity, maximum water surface elevation, maximum depth and arrival time at critical locations downstream of the GERD.
A detailed perspective of the flood area, propagation and depth is provided by the two-dimensional flood modeling in HEC-RAS Mapper. Depending on the study results, high population communities such as Khartoum would experience high flood waves up to 11 m. This would endanger the lives of residents and destroy roads and properties. The arrival time of the waves was 10 days, which may be considered sufficient for inhabitants to be evacuated. Based on the results in the above table, the flood water depth above the Roseires, Sennar and Merowe dams would reach 11, 7 and 20 m and, as a result, these Sudanese dams would fail due to overtopping. Moreover, the water levels exceeded the peak levels of the dams’ reservoirs.
The maximum reservoir level of Roseires dam is 480 m ASL [39], and it may reach 490 m ASL because of the GERD failure, as shown in Figure 7. In addition, the water level upstream of Sennar Dam increased from 420 m ASL [40] to 429 m ASL. Likewise, the water level upstream of the Merowe Dam increased to 320 m ASL, exceeding the maximum reservoir elevation of 300 m ASL. It was also found that the wave’s velocity just downstream of the GERD was 8 m/s, and it decreased further downstream to reach 1 m/s in highly populated areas. In addition, the water surface elevation in Lake Nasser upstream of the AHD would reach 188 m ASL whereas the peak allowable level of the lake is 182 m ASL, and this would expose the AHD to danger. In order to prevent overtopping, the gated and ungated spillways must be opened to increase the outflow from tunnels to its maximum capacity to reduce the level of the lake to below the allowable level. However, in this case, the downstream structures and floodplains would be highly endangered.
Figure 8 represents the extent of inundation depth due to the GERD’s failure. Due to the topography and closeness to the dam, the depth and extent of the inundation varies. Furthermore, the analyzed inundated regions were identified as being approximately 168,000 km2 of agricultural lands, roads and houses using the created maps. Furthermore, the water spreads up to 105 km transversely to the river.
In places with limited topographic and cross-sectional data, the use of a high-spatial-resolution DEM was necessary for the preparation of 2D flood maps and the assessment of inundation extent. For numerous rivers around the world, cross-sectional dimension statistics at a given interval are hardly ever accessible. Furthermore, it is crucial to employ a 2D model to establish the flow direction for flood patterns near discrete features [41]. Furthermore, due to a lack of data, the existing structures downstream of the dam could not be included in this analysis. Weirs, bridges and dykes are examples of existing structures that can be added to the model to increase the results’ accuracy. To illustrate scenario-based flow change and anticipated damage, the impact of land use on the floodplain and the watershed may be observed. In order to aid the estimation of damage and flood forecasting, the velocity and depth of inundation can be synchronized.

4. Conclusions

The process of dam break is so complex that the real failure mechanisms are not really understood. However, flood mapping and prediction of inundated levels are important in evaluation of flood risk and mitigation strategies. In this study, the GERD downstream important structures are examined in terms of the flood hydrograph, flood arrival time, water level, velocity and flood map in case of the GERD’s failure. Additionally, sensitivity analysis for the overtopping mode is performed for breach time and breach magnitude. The magnitude of the hazard and the identification of risk zones were considerably aided by the use of 2D flood mapping, especially in places with high population density. In the event of the GERD’s failure, the peak discharge is 162,248 m3/s, and the maximum flood stage just downstream of the dam equals 566 m above mean sea level. According to sensitivity analysis, breach time has less impact on water levels than outflow discharge. Furthermore, there is a positive correlation between breach size and flood wave discharge and elevation. Using 2D flood mapping, a greater evaluation of the extent of any form of a flood’s inundation can be achieved. Moreover, cities with massive populations in Sudan will be inundated by flood waves as high as 11 m, resulting in the devastating loss of highly agricultural lands, livestock, people and infrastructure. Additionally, within 10 days, Khartoum city would be under water from the flood. Therefore, this city will quickly fall into a terrible condition and turn into a large lake. Results show that the three Sudanese dams, Roseires, Sennar and Merowe, will be overtopped and as a result they may collapse. The water level in Lake Nasser will reach 188 m above mean sea level, exceeding 182 m, which is considered the maximum allowable water surface elevation. Thus, the emergency spillway must be fully opened to provide safety to the AHD and to avoid overtopping. On the other hand, it is believed that the floodplains and structures downstream of the AHD will be at high risk. It is strongly advised that the dam safety study be revised in light of the research’s findings and that a thorough monitoring and safety inspection program should be put in place. Moreover, a comprehensive socio–economic impact study is required to evaluate the significant damage, loss and cost associated with flooding such large areas with high inundation depths.
Further research is recommended to investigate the GERD’s failure using a DEM with more accuracy than the one used in this research and each dam downstream of the GERD should have an emergency action plan specific to the conditions at its location. Moreover, emergency preparedness plans should be provided in coordination with local authorities to help put together evacuation plans.

Author Contributions

Conceptualization, H.M.E., A.I. and M.Z.; methodology, H.M.E., M.H.M. and A.I.; software, A.I. and H.M.E.; validation, H.F.A.-E., H.M.E., M.H.M. and M.Z.; formal analysis, A.I, M.T.G. and H.F.A.-E.; investigation, A.I., H.M.E. and M.Z.; resources, A.I. and M.Z.; data curation, A.I., H.M.E. and H.F.A.-E.; writing—original draft preparation, A.I, M.T.G. and H.M.E.; writing—review and editing, H.M.E., H.F.A.-E., M.Z. and K.P.-U.; visualization, M.H.M. and H.F.A.-E.; supervision, M.H.M. and H.M.E.; project administration, H.F.A.-E. and M.Z; funding acquisition, M.Z. All authors have read and agreed to the published version of the manuscript.

Funding

This research received no external funding.

Data Availability Statement

It will be available if requested.

Acknowledgments

This work was supported by the Slovak Research and Development Agency under contract no. APVV-20-0281. This work was supported by project HUSKROUA/1901/8.1/0088, Complex flood-control strategy on the Upper-Tisza catchment area.

Conflicts of Interest

The authors declare no conflict of interest.

References

  1. Peng, M.; Zhang, L.; Chang, D.; Xu, Y. Dam Failure Mechanisms and Risk Assessment; John Wiley & Sons: Hoboken, NJ, USA, 2016. [Google Scholar]
  2. Azeez, O.; Elfeki, A.; Kamis, A.S.; Chaabani, A. Dam break analysis and flood disaster simulation in arid urban environment: The Um Al-Khair dam case study, Jeddah, Saudi Arabia. Nat. Hazards 2020, 100, 995–1011. [Google Scholar] [CrossRef]
  3. Wu, M.; Ge, W.; Li, Z.; Wu, Z.; Zhang, H.; Li, J.; Pan, Y. Improved Set Pair Analysis and Its Application to Environmental Impact Evaluation of Dam Break. Water 2019, 11, 821. [Google Scholar] [CrossRef]
  4. Yi, X. A dam break analysis using HEC-RAS. J. Water Resour. Prot. 2011, 3, 370–379. [Google Scholar]
  5. Cannata, M.; Marzocchi, R. Two-dimensional dam break flooding simulation: A GIS-embedded approach. Nat. Hazards 2012, 61, 1143–1159. [Google Scholar] [CrossRef]
  6. Koskinas, A.; Tegos, A.; Tsira, P.; Dimitriadis, P.; Iliopoulou, T.; Papanicolaou, P.; Koutsoyiannis, D.; Williamson, T. Insights into the Oroville dam 2017 Spillway incident. Geosciences 2019, 9, 37. [Google Scholar] [CrossRef]
  7. Rotta, L.H.S.; Alcantara, E.; Park, E.; Negri, R.G.; Lin, Y.N.; Bernardo, N.; Mendes, T.S.G.; Souza Filho, C.R. The 2019 Brumadinho tailings dam collapse: Possible cause and impacts of the worst human and environmental disaster in Brazil. Int. J. Appl. Earth Obs. Geoinf. 2020, 90, 102119. [Google Scholar]
  8. Latrubesse, E.M.; Park, E.; Sieh, K.; Dang, T.; Lin, Y.N.; Yun, S.-H. Dam failure and a catastrophic flood in the Mekong basin (Bolaven Plateau), southern Laos, 2018. Geomorphology 2020, 362, 107221. [Google Scholar] [CrossRef]
  9. Athens News. Available online: https://en.rua.gr/2023/02/06/cracks-in-the-ataturk-dam-after-earthquakes/ (accessed on 1 April 2023).
  10. Zin, W.W.; Kawasaki, A.; Takeuchi, W.; San, Z.M.L.T.; Htun, K.Z.; Aye, T.H.; Win, S. Flood hazard assessment of Bago river basin, Myanmar. J. Disaster Res. 2018, 13, 14–21. [Google Scholar] [CrossRef]
  11. Mao, J.; Wang, S.; Ni, J.; Xi, C.; Wang, J. Management system for dam-break hazard mapping in a complex basin environment. ISPRS Int. J. Geo-Inf. 2017, 6, 162. [Google Scholar] [CrossRef]
  12. Rodrigues, A.S.; Santos, M.A.; Santos, A.; Rocha, F. Dam-break flood emergency management system. Water Resour. Manag. 2002, 16, 489–503. [Google Scholar] [CrossRef]
  13. Dincergok, T. The role of dam safety in dam-break induced flood management. In Proceedings of the International Congress on River Basin Management, Antalya, Turkey, 22–24 March 2007; p. 697. [Google Scholar]
  14. Duressa, J.N.; Jubir, A.K. Dam Break Analysis and Inundation Mapping, Case Study of Fincha’a Dam in Horro Guduru Wollega Zone, Oromia Region, Ethiopia. Sci. Res. 2018, 6, 29–38. [Google Scholar] [CrossRef]
  15. Khosravi, K.; Rostaminejad, M.; Cooper, J.R.; Mao, L.; Melesse, A.M. Dam break analysis and flood inundation mapping: The case study of Sefid-Roud Dam, Iran. In Extreme Hydrology and Climate Variability; Elsevier: Amsterdam, The Netherlands, 2019; pp. 395–405. [Google Scholar]
  16. Gouin, P. Earthquake History of Ethiopia and the Horn of Africa; IDRC: Ottawa, ON, USA, 1979. [Google Scholar]
  17. Kebede, F.; Van Eck, T. Probabilistic seismic hazard assessment for the Horn of Africa based on seismotectonic regionalisation. Tectonophysics 1997, 270, 221–237. [Google Scholar] [CrossRef]
  18. Abbate, E.; Bruni, P.; Sagri, M. Geology of Ethiopia: A review and geomorphological perspectives. In Landscapes and Landforms of Ethiopia; Billi, P., Ed.; Springer: Dordrecht, The Netherlands, 2015; pp. 33–64. [Google Scholar]
  19. Soliman, A.H.; Zawahry, A.E.; Bekhit, H. GERD failure analysis and the impacts on downstream countries. In Grand Ethiopian Renaissance Dam versus Aswan High Da; Springer: Berlin/Heidelberg, Germany, 2017; pp. 149–171. [Google Scholar]
  20. Ali, H.A.N.; El-Moustafa, A.M.; Gad, M.A.E.-H. Hydrodynamic Modeling of Flood Wave Propagation in Major Rivers due to Dam Failures. Case Study: The Grand Ethiopian Renaissance Dam (GERD) on Nile River. Available online: http://azharcermjournal.com/CERMF1707/P17-07-07.pdf (accessed on 1 April 2023).
  21. Rendon, S.H.; Ashworth, C.E.; Smith, S.J. Dam-Breach Analysis and Flood-Inundation Mapping for Lakes Ellsworth and Lawtonka near Lawton, Oklahoma; US Department of Interior, US Geological Survey: Reston, VA, USA, 2012. [Google Scholar]
  22. West, M.; Morris, M.; Hassan, M. A guide to breach prediction. Dams Reserv. 2018, 28, 150–152. [Google Scholar]
  23. Brunner, G.W. HEC-RAS River Analysis System 2D Modeling User’s Manual; US Army Corps of Engineers—Hydrologic Engineering Center: Davis, CA, USA, 2016; pp. 1–171. [Google Scholar]
  24. Özdemir, H.; Akbulak, C.; Özcan, H. Cokal Dam-break model and flood risk analysis (Canakkale). J. Hum. Sci. 2011, 8, 659–698. [Google Scholar]
  25. Ahmed, A.T.; Elsanabary, M.H. Environmental and hydrological impacts of grand Ethiopian Renaissance Dam on the Nile River. Int. Water Technol. J. 2015, 5, 260–271. [Google Scholar]
  26. IPOE. International Panel of Experts for Grand Ethiopian Renaissance Dam (GERDP); IPoE Final Report; IPoE: Addis Ababa, Ethiopia, 2013. [Google Scholar]
  27. Abtew, W.; Dessu, S.B. The Grand Ethiopian Renaissance Dam on the Blue Nile; Springer: Berlin/Heidelberg, Germany, 2019. [Google Scholar]
  28. Hassaballah, K.; Jonoski, A.; Popescu, I.; Solomatine, D. Model-based optimization of downstream impact during filling of a new reservoir: Case study of Mandaya/Roseires Reservoirs on the Blue Nile River. Water Resour. Manag. 2012, 26, 273–293. [Google Scholar] [CrossRef]
  29. Shahin, M. Hydrology and Water Resources of Africa; Springer Science & Business Media: Davis, CA, USA, 2006; Volume 41. [Google Scholar]
  30. Hafsaas-Tsakos, H. Ethical implications of salvage archaeology and dam building: The clash between archaeologists and local people in Dar al-Manasir, Sudan. J. Soc. Archaeol. 2011, 11, 49–76. [Google Scholar] [CrossRef]
  31. Bosshard, P. China’s role in financing African infrastructure. Int. Rivers Netw. 2007, 14, 1–2. [Google Scholar]
  32. Abul-Atta, A.A. Egypt and the Nile after the Construction of the High Aswan Dam; Egypt Ministry of Irrigation and Land Reclamation: Giza, Egypt, 1978. [Google Scholar]
  33. El Bastawesy, M.; Gabr, S.; Mohamed, I. Assessment of hydrological changes in the Nile River due to the construction of Renaissance Dam in Ethiopia. Egypt. J. Remote Sens. Space Sci. 2015, 18, 65–75. [Google Scholar] [CrossRef]
  34. Kilania, S.; Chahar, B.R. A dam break analysis using HeC-RAs. In Proceedings of the World Environmental and Water Resources Congress 2019: Hydraulics, Waterways, and Water Distribution Systems Analysis, Pittsburgh, PA, USA, 19–23 May 2019; pp. 382–389. [Google Scholar]
  35. Shahrim, M.; Ros, F. Dam break analysis of temenggor dam using hec-ras. Proc. IOP Conf. Ser. Earth Environ. Sci. 2020, 479, 012041. [Google Scholar] [CrossRef]
  36. Wetmore, J.N.; Fread, D.L. The NWS Simplified Dam-Break Flood Forecasting Model; National Weather Service: Silver Spring, MD, USA, 1981; pp. 164–197. [Google Scholar]
  37. Owen, H.J. Flood Emergency Plans: Guidelines for Corps Dams; Hydrologic Engineering Center: Davis, CA, USA, 1980. [Google Scholar]
  38. Mohr, J. Dam-Break Flood Analysis: Review and Recommendations; International Commission on Large Dams: Paris, France, 1998. [Google Scholar]
  39. Kansara, P.; Lakshmi, V. Water Levels in the Major Reservoirs of the Nile River Basin—A Comparison of SENTINEL with Satellite Altimetry Data. Remote Sens. 2022, 14, 4667. [Google Scholar] [CrossRef]
  40. Ali, Y.S.A. The Impact of Soil Erosion in the Upper Blue Nile on Downstream Reservoir Sedimentation; Citeseer: Princeton, NJ, USA, 2014. [Google Scholar]
  41. Awal, R.; Nakagawa, H.; Kawaike, K.; Baba, Y.; Zhang, H. Experimental study on piping failure of natural dam. J. Jpn. Soc. Civ. Eng. Ser. B1 (Hydraul. Eng.) 2011, 67, I_157–I_162. [Google Scholar] [CrossRef] [PubMed]
Figure 1. Reservoirs through study area from GERD to AHD.
Water 15 01609 g001
Figure 2. Flow chart of the dam break stages.
Water 15 01609 g002
Figure 3. Inflow hydrograph for the GERD.
Water 15 01609 g003
Figure 4. Dam breach parameters.
Water 15 01609 g004
Figure 5. Flood hydrographs due to changes in the breach size.
Water 15 01609 g005
Figure 6. Stage curves due to changes in the breach size.
Water 15 01609 g006
Figure 7. Water surface profile: (a) from GERD to Roseires dam; (b) from Roseires dam to Sennar dam; (c) from Sennar dam to Khartoum; (d) from Khartoum to Merowe dam and (e) from Merowe dam to HAD.
Water 15 01609 g007
Figure 8. Maximum inundation depth: (a) GERD to Khartoum and (b) Khartoum to AHD.
Water 15 01609 g008
Table 1. Elevation–Storage curve data of the GERD reservoir, (after [33]).
Elevation (m ASL)Storage (109 m3)
5060
5869.6
60617.5
63656
65280.5
686173
Table 2. Flood parameters downstream of the GERD.
Location
Downstream
Distance from
GERD (km)
Vmax
(m/s)
Max. W.S.E
(m ASL)
Max. Water Depth (m)Arrival Time (hrs.)
Roseires dam1235490118
Sennar dam4201.4429776
Khartoum809139411240
Merowe dam15821.332020572
Lake Nasser, AHD26700.818810960
Disclaimer/Publisher’s Note: The statements, opinions and data contained in all publications are solely those of the individual author(s) and contributor(s) and not of MDPI and/or the editor(s). MDPI and/or the editor(s) disclaim responsibility for any injury to people or property resulting from any ideas, methods, instructions or products referred to in the content.

