Article

Evaluation and Prediction of Water Quality of Typical Wetlands in the Source Region of the Yangtze River

1
Eco-Environmental Engineering College, Qinghai University, Xining 810016, China
2
College of Agriculture and Animal Husbandry, Qinghai University, Xining 810016, China
3
Beijing Key Lab for Source Control Technology of Water Pollution, College of Environmental Science and Engineering, Beijing Forestry University, Beijing 100083, China
*
Author to whom correspondence should be addressed.
These authors contributed equally to this work.
Water 2023, 15(8), 1612; https://doi.org/10.3390/w15081612
Submission received: 23 February 2023 / Revised: 25 March 2023 / Accepted: 18 April 2023 / Published: 20 April 2023

Abstract

:
Wetlands play an important role in water storage and water conservation, but with global climate change, the degradation of wetland ecosystems is accelerating. In this study, we conducted research on the current situation and future prediction of water quality in typical wetlands in the source region of the Yangtze River to provide a scientific basis for the protection and restoration of wetlands in the source region of the Yangtze River. The Bayesian water quality assessment method and Yao Zhiqi evaluation method were used to evaluate the water quality of typical wetlands in the source region of the Yangtze River from 2016 to 2021 and based on the climate change scenarios of three RCPs (Representative Concentration Pathways) under the CMIP5 (Coupled Model Intercomparison Project Phase 5) global climate model and SWAT (soil and water assessment tool) hydrological model, the wetland water quality in the source region of the Yangtze River from 2022 to 2100 was predicted. The results show that the inter-annual changes in CODMn, NH3-N, and TN in a typical wetland show a downward trend, while the temperature and DO concentration show an upward trend from 2016–2021. The changes in CODMn, temperature, and conductivity within the year are abundant season > flat season > dry season; and DO, NH3-A, TN, and TP concentrations within the year are opposite. The water quality of typical wetlands in the source region of the Yangtze River has reached Class II and above. From 2022 to 2100, under climate change in the future, TN, TP, CODMn, NH3-N, and temperature in the wetland water in the source region of the Yangtze River will continue to rise, and the concentration of DO will continue to decline. Therefore, the pressure on water resources in the source region of the Yangtze River is further aggravated, so it is urgent to strengthen water resources protection.

1. Introduction

Wetlands play a major role in regulating and storing water resources and conserving water sources [1]. The wetland ecosystem is the most sensitive to climate change [2,3]. Under the background of global change, the wetland ecosystem is accelerating degradation all over the world [4]. The wetland ecosystem has been part of the most threatened ecosystems in the world [5]. The wetland region of the Qinghai Tibet Plateau, about 13.19 × 10⁴ km2 and accounting for 20% of China’s wetland region, is a sensitive region to global climate change and an important ecological security barrier in China and even Asia [6]. The quality of the wetland water body and evaluation of wetland water quality have traditionally been the focus of attention, and the work has developed accordingly. The quality index method, and physical, chemical, and biological indexes were incorporated into the evaluation system [7,8]. At the end of the 20th century, various models and mathematical methods were also introduced into the water quality evaluation system [9,10,11,12].
The research on the response of the water environment to climate change is a frontier issue in the field of global environmental change, which is linked to the future development of human society [13]. The climate model and hydrological model are the main means to study the response of hydrological resources to change in the environment at home and abroad. In the Fifth Assessment Report of IPCC (AR5) [14], climate models and emission scenarios (typical concentration path RCP, including RCP2.6, RCP4.5 and RCP8.5 emission scenarios) of the fifth phase (CMIP5) [15] were adopted to predict future climate system changes, and good results were achieved. Previous studies have demonstrated that compared with a single model, the simulation effect of a model set is often better, and model simulation evaluation is the basis of future climate change prediction. SWAT (soil and water assessment tool) is a long-time scale distributed hydrological model, which is applicable to a variety of environmental processes such as different regions, spatial scales, and time scales [16], and has been widely used [17]. The SWAT model was applied to Texas, Mississippi River, and other regions in the United States, and used for runoff simulation and development of the distributed hydrology soil vegetation model [18,19,20,21,22]. The application and research of the SWAT model in China began around 2000, when it successively carried out simulation research in the north ring region, Xilin River, and the upper reaches of the Yangtze River, and improved the application of the SWAT model [23,24,25,26].
The Qinghai-Tibet Plateau is a very important ecological security barrier in China’s ecological security strategy pattern, and the source region of the Yangtze River is an important part of the Qinghai-Tibet Plateau, as well as a water-conserving area among China’s key ecological function areas, carrying extremely important ecological functions such as conserving and storing water, maintaining biodiversity, preserving soil and water, and preventing wind and fixing sand [27]. The ecological quality of the source region of the Yangtze River and its water recharge capacity are not only directly related to the socio-economic development of the source area, but also have a direct or indirect impact on many areas in the middle and lower reaches of the Yangtze River basin. The source region of the Yangtze River of the wetland is in the hinterland of the Qinghai-Tibet plateau; the region’s ecological and environmental conditions are complex. Climate change, runoff regulation, clean water, and protecting biodiversity balance plays an important ecological function. China’s is one of the most vulnerable and ecologically valuable of the ecosystem; the area of wetland is a typical representative of the Qinghai-Tibet plateau alpine wetland. The wetland distribution area in the source region of the Yangtze River is widely distributed, mostly alpine swamps, alpine swampy meadows, and alpine lakes, which have a significant role and value in protecting biodiversity, preserving soil and water and maintaining ecological balance, and have a high sensitivity to global changes. The water quality condition of wetland ecosystems is an important hydrological feature of wetland systems and can directly affect the ecological security and sustainability of adjacent ecosystems. Since modern times, the natural ecological environment and water cycle process in the source region of the Yangtze River have undergone drastic changes under the joint influence of climate change and human activities [28]. The glaciers, lakes, and marshes in the source region of the Yangtze River are deteriorating in a patchy manner and shrinking faster. The annual average temperature in the source region is on the rise, especially since the beginning of the 21st century, and the runoff in the basin is decreasing [29]. The temporal and spatial distribution of wetlands in the source region of the Yangtze River is controlled by permafrost. As the multi-year permafrost retreats, the seasonal active layer increases, water level decreases, and wetland degrades. Due to their location in highland areas with a cold climate and generally high ice content permafrost areas, the freezing and swelling effect with seasonal thawing leads to strong destructive effects, resulting in very serious damage to vegetation and soil. In the context of global warming, the thickness of permafrost in high plains and wide valleys is thinned, upper limit of permafrost is shifted down, soil moisture content is significantly reduced, swampy meadows begin to evolve into alpine meadows, water content of the soil layer is reduced, shrinkage of wetlands is intensified, vegetation cover is reduced, and desertification is intensified. Therefore, it is urgent to protect the wetlands in the source region of the Yangtze River.
At present, there are few studies on the current situation of the water quality of typical wetlands in the source region of the Yangtze River, and most of them are short-term studies. There are some problems, such as one-sided water quality indicators and single evaluation methods; at present, the research on the SWAT hydrological model in the source region of the Yangtze River has achieved some results, but there are some problems such as short research space and time scale [30], and the research on future water quality prediction by climate change coupled with the SWAT hydrological model has not been reported on. It is of great significance to study the present situation and future prediction of the water quality of typical wetlands in the source region of the Yangtze River for the protection and restoration of wetlands in the source region of the Yangtze River and formulate the water environment protection and restoration plan for the development and utilization of water resources in the source region of the Yangtze River. This study analyzes the current situation of seven water quality indexes (permanganate index, ammonia nitrogen, total nitrogen, total phosphorus, temperature, dissolved oxygen, and conductivity) of typical wetland water quality in the source region of the Yangtze River from 2016 to 2021. The Bayesian water quality evaluation method and comprehensive pollution index method are used to evaluate the current situation of typical wetland water quality in the source region of the Yangtze River, as well as three RCP (RCP2.6, RCP4.5, and RCP8.5) scenarios coupled with the SWAT hydrological model to establish the change in sequence of water quality in the source region of the Yangtze River from 2022 to 2100 to provide a scientific basis for the protection of typical wetlands and the protection of water resources in the source region of the Yangtze River and the safety of water resources in the Yangtze River Basin under future climate change.

2. Materials and Methods

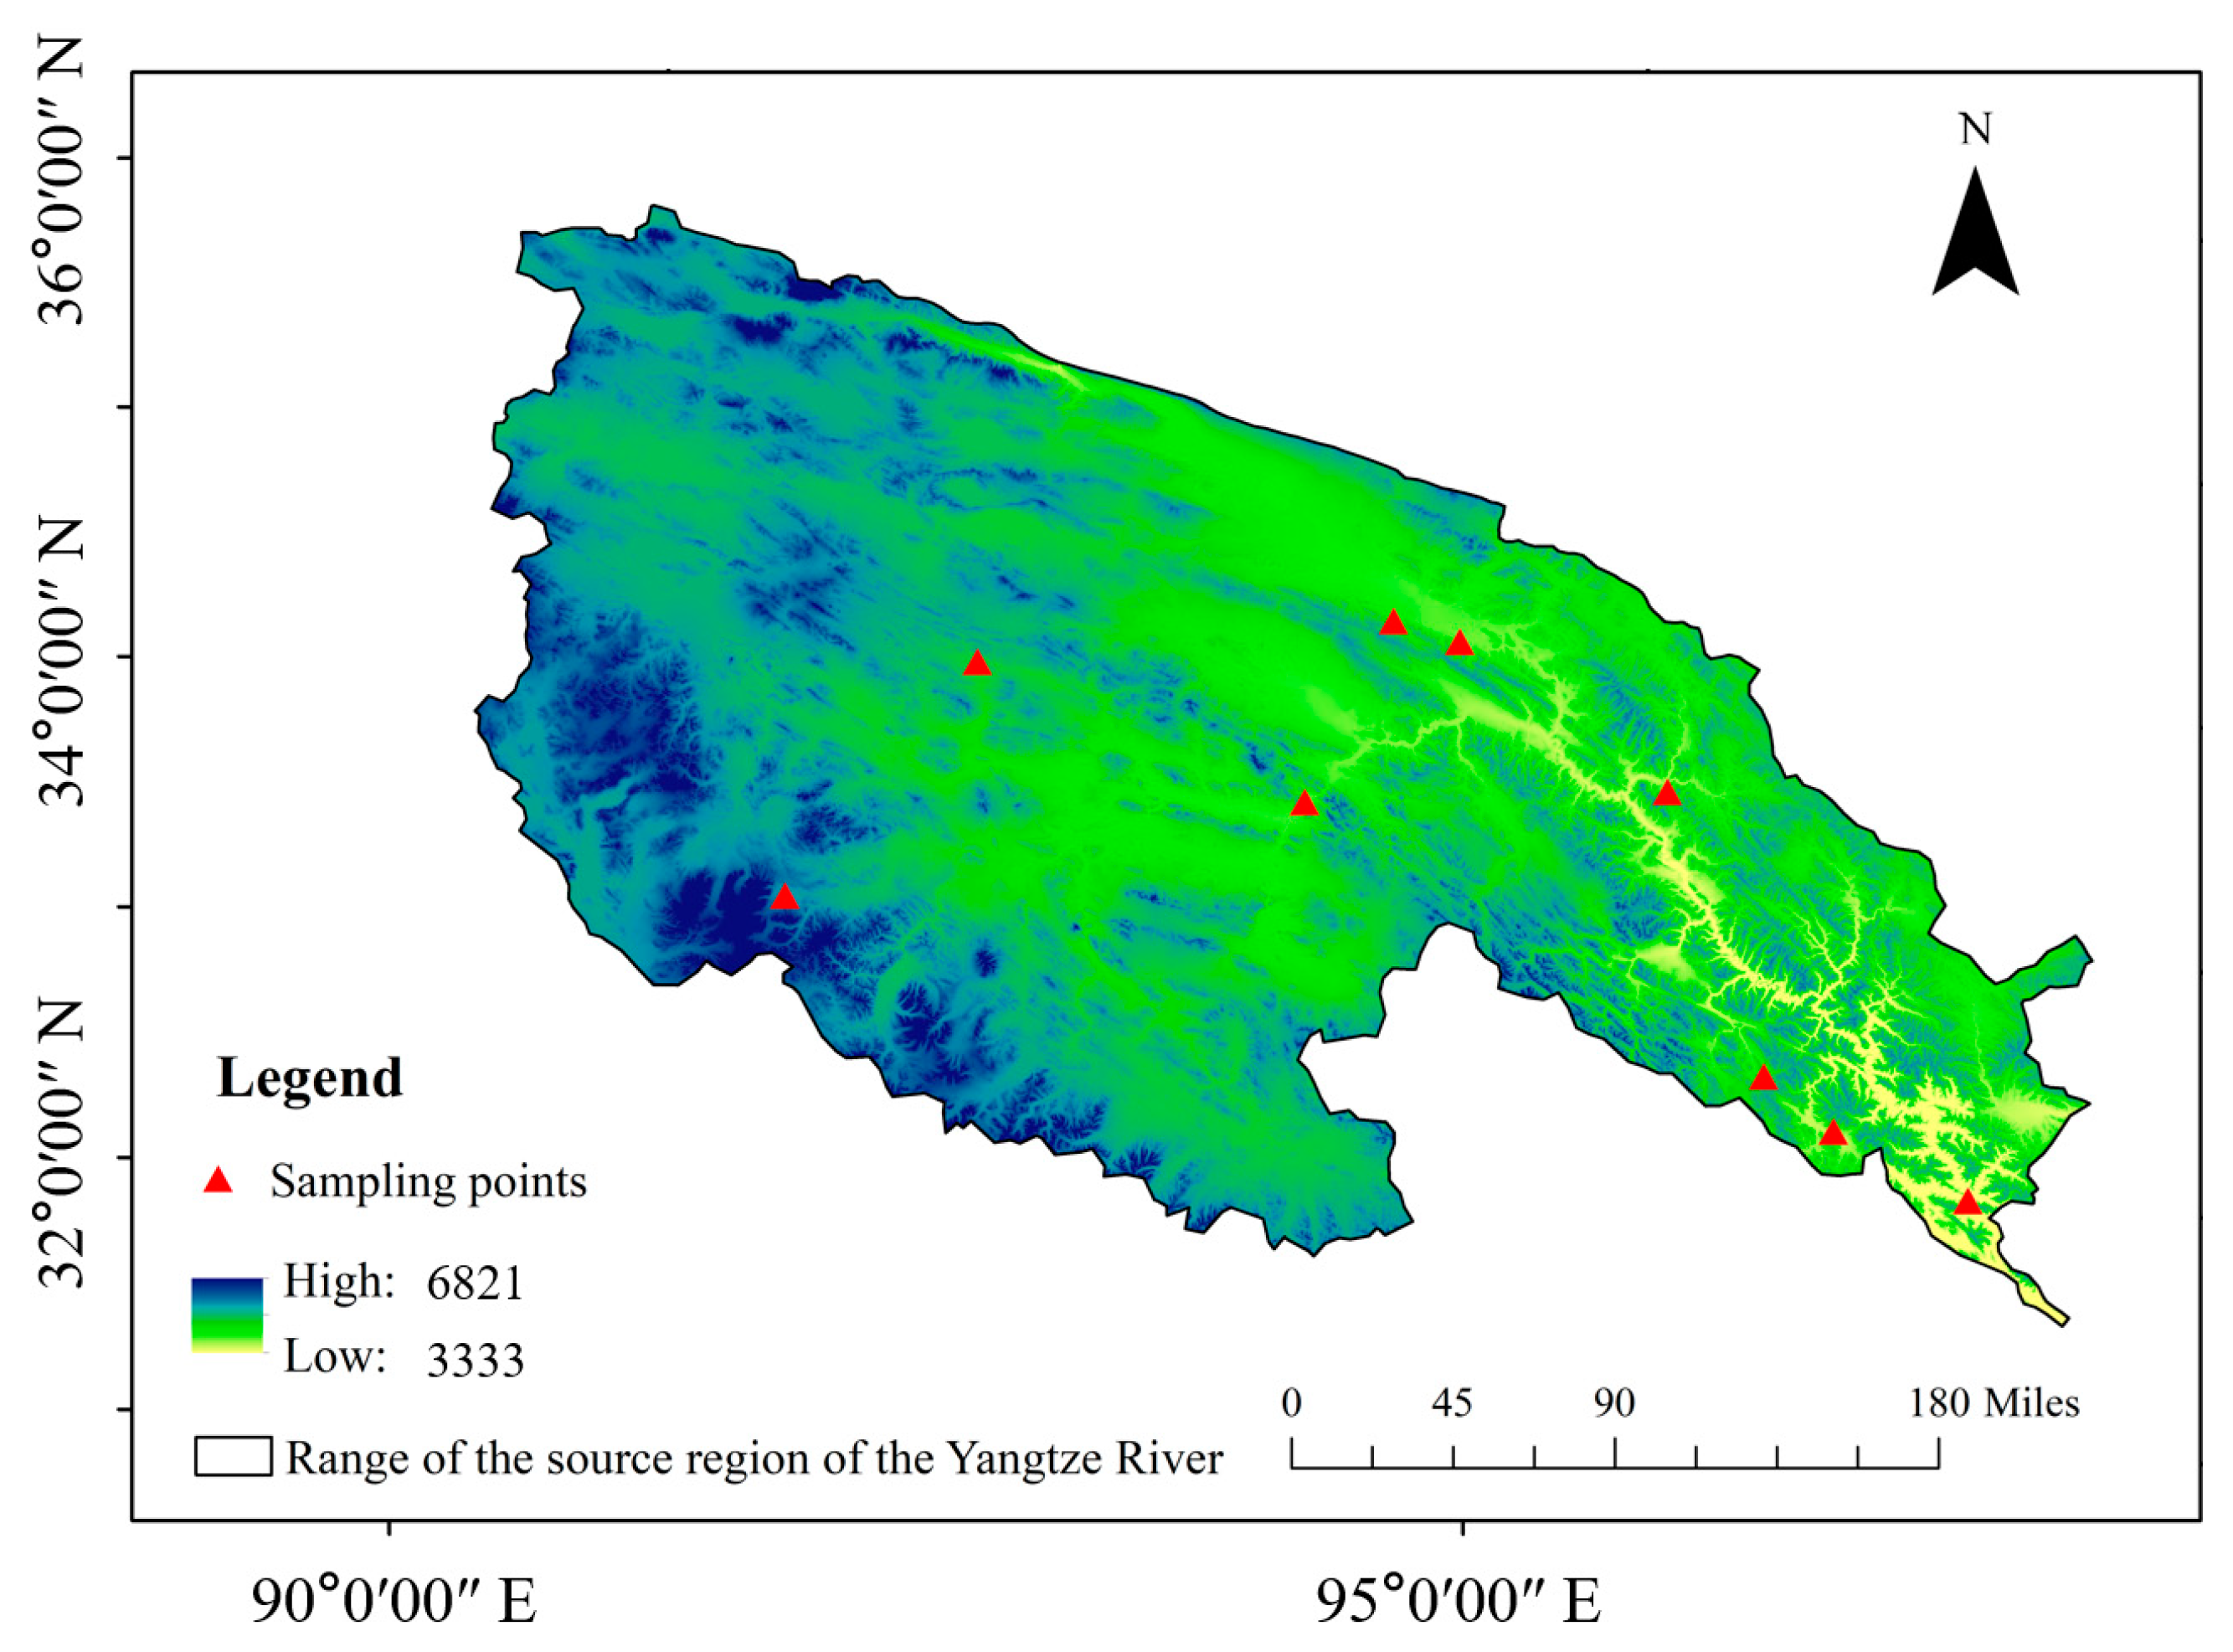
2.1. Overview of the Study Region

The source region of the Yangtze River is situated above the Zhimenda hydrological station, with an average altitude of about 4500 m, geographical coordinates of 32°30–35°35 N, 90°43–96°45, and the drainage region is 13.78 km2 [31] (Figure 1) (Table 1). The western part of the region is the Inland Lake region of Qiangtang Mountains in northern Tibet. The northwest is the eastern section of the Kunlun Mountains, and the southwest is the middle of Tanggula Mountain and the eastern section. The average altitude of the two mountains is 5500–6000 m. The top of the mountain is the subject with perennial snow or glaciers, and between the two mountains is a vast plateau [32]. It is a wetland ecosystem with a large region, high altitude, and the most significant biodiversity in the world. The source region of the Yangtze River is rich in biological resources and is the habitat of some terrestrial organisms, such as Tibetan antelope, rock sheep, rabbit, snow leopard, Tibetan fox, black can, etc. The aquatic resources include Herzensteinia microcephalus, Ptychobarbus kaznakovi, Triplophysa stoliczkae, Triplophysa stenura, and Triplophysa leptosoma, etc. It is likewise the main source of China’s freshwater resources and an important barrier for ecological security [33]. The region has a high proportion of endemic species, a large number of Grade I and II protected animals, and many rare plant species and is one of the areas with a rich distribution of endemic plant and animal resources in China, as well as an important treasure house of biological resources, species resources, and biological genes in China. The source region of the Yangtze River is a very important ecological security barrier in China’s “two screens and three belts” ecological security strategy pattern (The “two screens” include the Qinghai-Tibet Plateau Ecological Barrier and Loess Plateau-Sichuan-Yunnan Ecological Barrier; the “three belts” refer to the northeastern forest belt, southern hilly mountain belt, and northern sand control belt.), and it is also a key ecological function area in China’s key ecological function areas, carrying important ecological functions such as water conservation and storage, maintenance of biodiversity, soil and water conservation, and wind and sand control. The ecological quality of the source region of Yangtze River and its water recharge capacity are not only directly related to the socio-economic development of the source area, but also have a direct or indirect impact on many areas in the middle and lower reaches of each basin. The perennial permafrost in the source region of the Yangtze River is widespread, forming a stable water barrier that is not restricted by geological features. The regional groundwater includes three special groundwater types of water above the frozen layer, water below the frozen layer, and groundwater in the thaw zone. The river and lake melt area in the source area is mostly the convergence center of groundwater and surface water, and the lithology of the aquifer is mostly quaternary alluvial sand and gravel layer, with large thickness, high permeability, and a large volume of water, which is the main object of groundwater mining.

2.2. Data Sources

Water samples were collected from 9 wetland monitoring points in the source region of the Yangtze River. The geographical location of the source region of the Yangtze River is shown in Figure 1, and the information of each monitoring point is shown in Table 1.

Determination of Water Quality Data of Typical Wetlands from 2016 to 2021

From 2016 to 2021, different types of wetlands were choesen in the source region of the Yangtze River for continuous sampling and analysis in the dry season (October), normal season (April, May, September), and wet season (June, August). Each sampling time is from 10 a.m. to 2 p.m. Sampling shall be conducted in accordance with technical guidance for water quality sampling (HJ494-2009) [34]. Three water indices were measured directly by a Merck portable multi-parameter tester (WTM) in the field: water temperature, conductivity, and dissolved oxygen. Water samples from the monitoring sections were transported to the laboratory for analyses within 12 h in polyethylene bottles.TN was determined by potassium persulfate oxidation ultraviolet spectrophotometry (GB11893-89) [34], ammonia nitrogen (NH3-N) was determined by the flow analyzer method, total phosphorus (TP) was determined by the potassium persulfate digestion method (GB11893-89) [34], and the permanganate index (CODMn) was determined by the sulfuric acid method (The sample was added with a known amount of potassium permanganate and sulfuric acid, heated in boiling water for 30 min to oxidize some organic and inorganic reducing substances, and after the reaction, excess sodium oxalate was added to reduce the remaining potassium permanganate, and then the excess sodium oxalate was back-dropped with the standard solution of potassium permanganate.) (GB11892-89) [34].

2.3. Water Quality Evaluation Method

2.3.1. Environmental Quality Standard of Typical Wetland

Table 2 shows the I–V standard limits of dissolved oxygen, ammonia nitrogen, total nitrogen, total phosphorus, and permanganate and the environmental quality standard for typical wetlands in China (GB3838-2002) [34].

2.3.2. Bayesian Water Quality Evaluation Method

Bayesian formula [35]:
P ( y j i / x j ) = P ( y j i ) P ( x j / y j i ) i = 1 s P ( y j i ) P ( x j / y j i )
where i is the standard type,   i = 1, 2, …, s; i is the indicator, j = 1, 2, …, s, j for each monitoring point indicator observation value;   y j i is the water quality-type standard value. P( y j i ) represents the a priori probability, on behalf of the monitoring point water quality may belong to some level of water quality. P( x j / y j i ) is a likelihood probability, representing the likelihood of a particular water quality indicator corresponding to different levels of water quality at the monitoring site.
Derive the posterior probability that the water quality level at the monitoring point is i .
P i = j = 1 m w j P ( y j i / x j )
where w j is for the first j indicator of the impact of the weight of water quality. P i for m water quality indicators after the integrated post-test probability; in this study, w j is uniformly taken as 1/5, that is, the various water quality indicators accounted for the same weight.
P h = max i = 1 5 P i
where P h is the final level of water quality at the monitoring site; a low value of P h means the better the water quality.

2.3.3. Yao Zhiqi Evaluation Method

Yao Zhiqi Evaluation Formula [36]:
P = X × Y
where X is the highest score index, that is, the highest value of the ratio of each measured value to the standard value. Y is the average score index, that is, the mean value of the ratio of each measured value to the standard value. If p value is smaller, the water quality is better.
The classification bounds of Yao Zhiqi’s evaluation method are: I represents excellent, P ≤ 0.90. II represents good, P ≤ 1.51. III represents light pollution, P ≤ 2.63. IV represents moderate pollution, P ≤ 3.55. V represents heavy pollution, P > 3.55 [36].

2.4. Water Quality Prediction Method

The typical wetland water quality prediction flow chart of the source region of Yangtze River is shown in Figure 2.

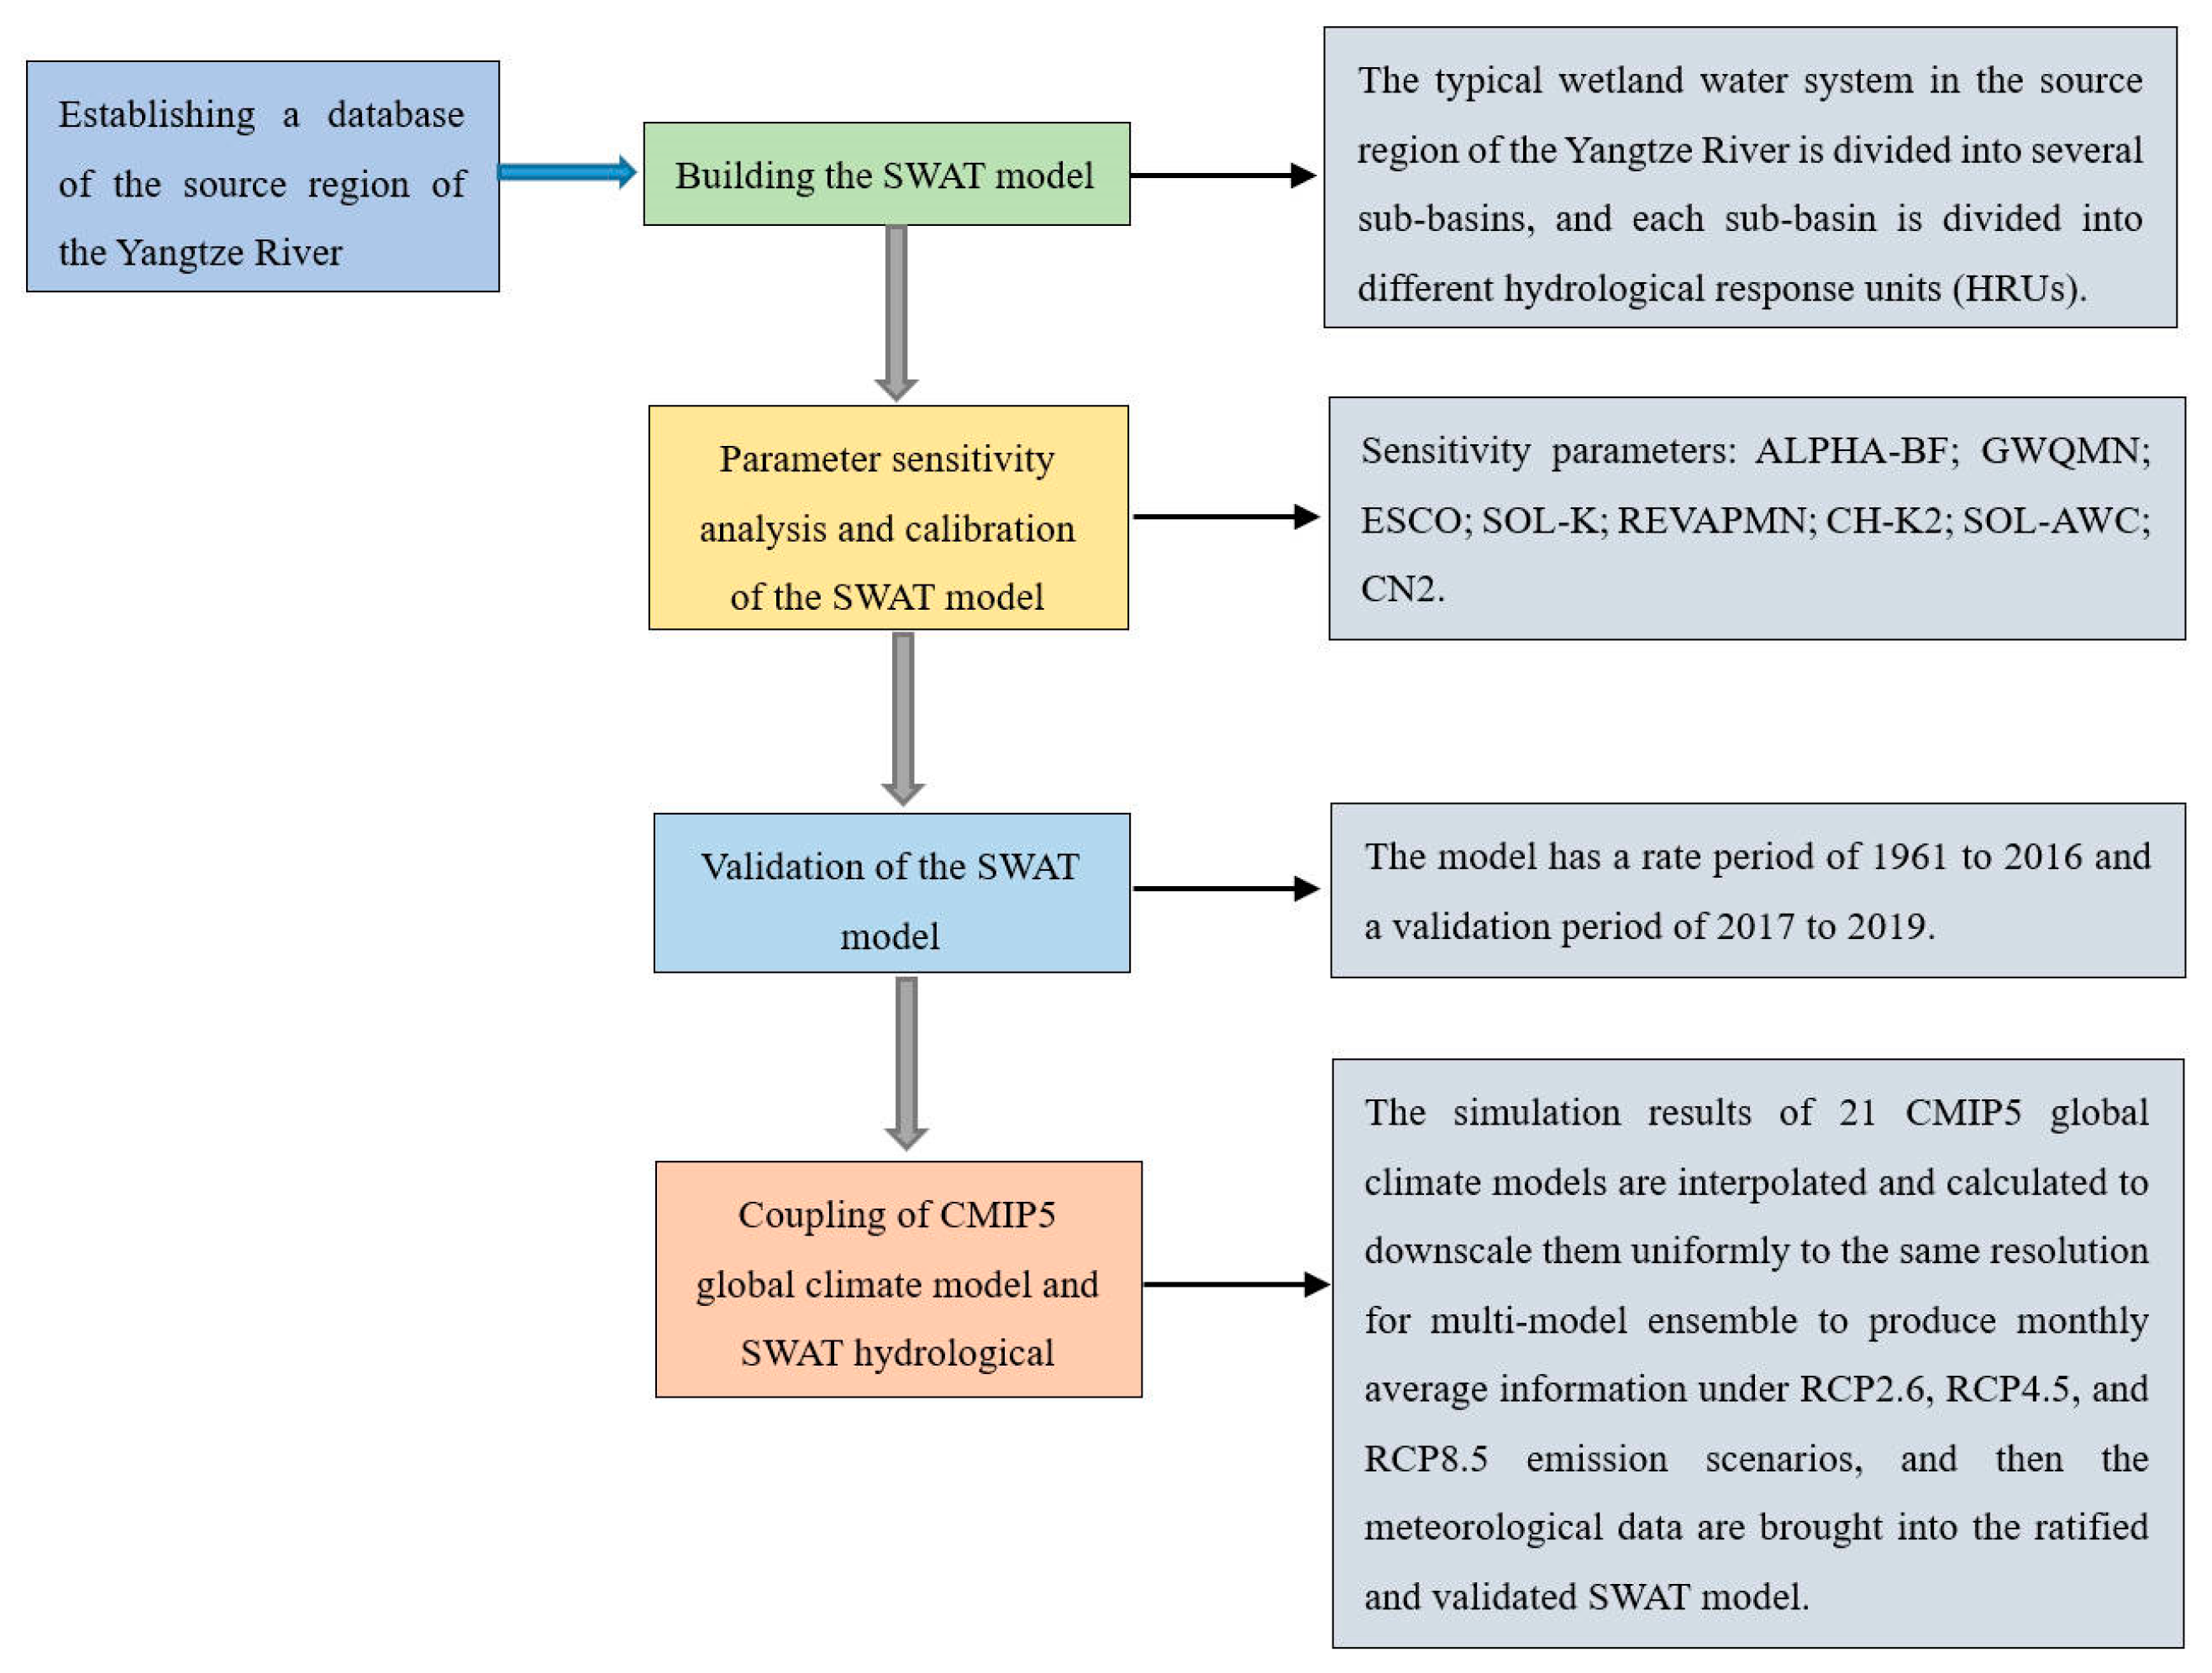
2.4.1. Establishment of SWAT Model Database of Typical Wetlands in the Source Region of the Yangtze River

The pre-treated high-precision DEM map was used to extract the wetland river network in the source region of the Yangtze River, and the outlet locations were obtained according to the calculation. The typical wetland water system in the source region of the Yangtze River is divided into several sub-basins, and then each sub-basin is divided into different hydrological response units (HRUs) based on the minimum threshold of land use type/soil type area, soil type, and wetland runoff data.

2.4.2. Parameter Sensitivity Analysis and Calibration of the SWAT Model

The built-in module of the SWAT model was used to analyze the parameters of the runoff, and the method was LH-OAT. The LH-OAT method combines the Latin square (LH) sampling method with one-way (OAT) sensitivity analysis, providing both the robustness of LH sampling and accuracy of the OAT algorithm [37]. Sensitivity analysis was performed on the parameters of the established SWAT model. Sensitivity parameters include base flow attenuation coefficient (ALPHA-BF), shallow aquifer water storage threshold (GWQMN), soil evaporation compensation factor (ESCO), saturated water conductivity of soil layer (SOL-K), shallow groundwater REVAPMN, effective water conductivity of the main riverbed (CH-K2), and effective water capacity of the soil layer (SO) L-AWC), SCS runoff curve number (CN2) (Table 3). Sensitivity analysis was performed to obtain the range of optimal parameters by SWAT-CUP calculation, and then according to the value range of the best parameter, the parameter range is continuously reduced by iterative analysis, and finally the rated value of the model (optimal parameter) is obtained (Table 4). According to the results of sensitivity analysis, the final rate values of each data are within the obtained value range, and the simulation effect is good. The optimal parameter values are brought into the SWAT model to verify and compare the actual measured values of the model.

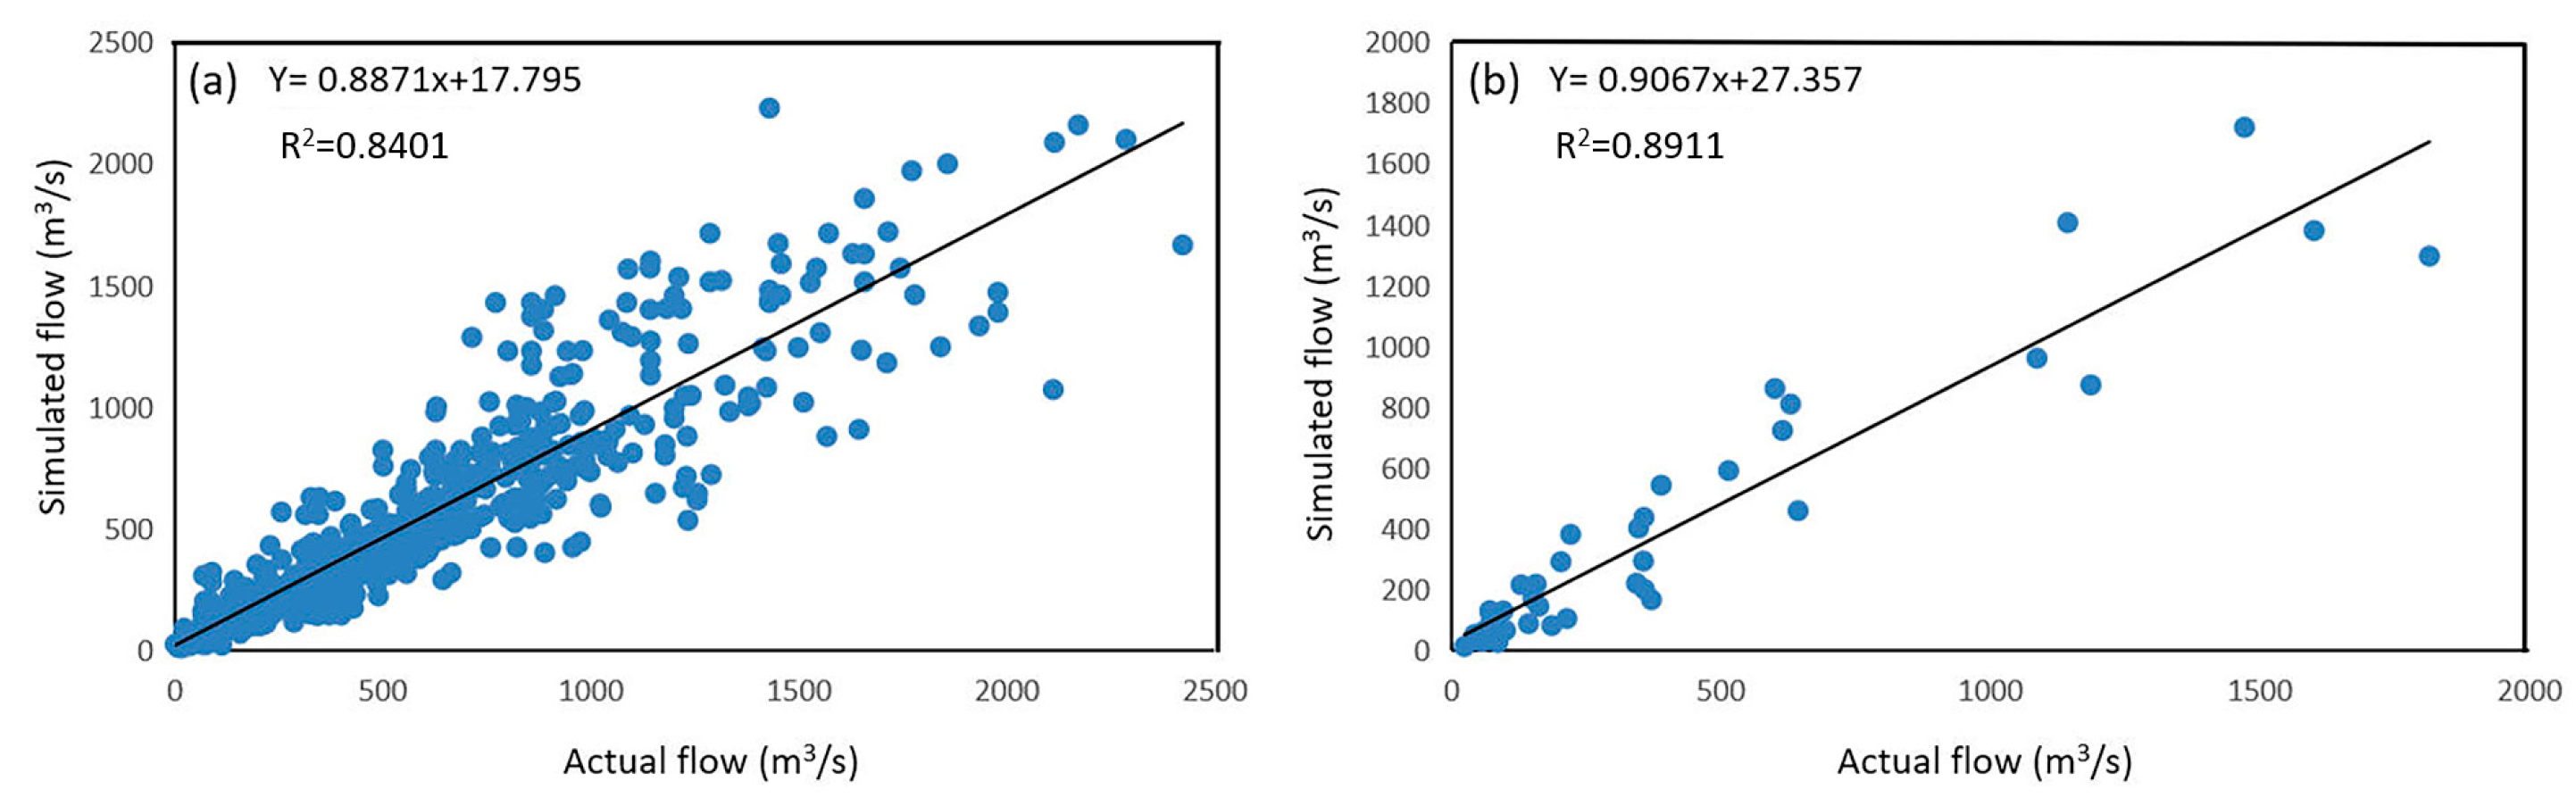
2.4.3. Validation of the SWAT Model

The model has a rate period of 1961 to 2016 and a validation period of 2017 to 2019 (Figure 3). The rate period R2 is 0.84, indicating that the measured and simulated values in the rate period fit well, and the SWAT model simulates the net flow in the source region of the Yangtze River in a realistic way. The R2 of the validation period was 0.89, indicating that the SWAT model has strong applicability and high reliability in the source region of the Yangtze River.

2.4.4. Coupling of CMIP5 Global Climate Model and SWAT Hydrological Model

Three RCP (RCP2.6, RCP4.5, RCP8.5) greenhouse gas emission scenarios released by IPCC are adopted, in which RCP8.5 refers to the climate scenario with high CO2 emission, while RCP2.6 and RCP4.5, respectively, represent the climate scenario with low CO2 emission and medium and low CO2 emission [38]. Combined with the statistical downscaling climate data of CMIP5 global climate model from 2021 to 2100 released by the IPCC data Center, the simulation results of 21 CMIP5 global climate models (Table 5) were interpolated, and the calculated results were uniformly downscaled to the same resolution. Then, the simple average method was used to conduct multi-model aggregation. The monthly average data under the emission scenarios of RCP2.6, RCP4.5, and RCP8.5 were made. The weather data is then fed into the calibrated and validated SWAT model.
The statistical downscaling method was adopted to downscale the output results. The processed meteorological data and collected spatial, soil, hydrological, and water quality data of the source region are taken as the initial data of the determined SWAT hydrological model and imported into the model for calculation. The responses of CODMn, NH3-N, conductivity, TN, TP, temperature, and DO to CMIP5 global climate change under RCP2.6, RCP4.5 and RCP8.5 scenarios were further simulated to obtain future data of wetland water quality changes in the source region of the Yangtze River under different climate scenarios.

2.5. Data Processing

The changing trend chart of water quality data of nine typical wetlands in the source region of the Yangtze River from 2016 to 2021 was obtained by Origin 2021. Data such as CODMn, NH3-N, TN, TP, conductivity, temperature, and DO in the SWAT hydrological model were imported into Excel. The trends of CODMn, NH3-N, conductivity, TN, TP, temperature, and DO in the forthcoming period (2022–2100) were plotted under three different climate scenarios (RCP2.6, RCP4.5, and RCP8.5).

3. Results and Analysis

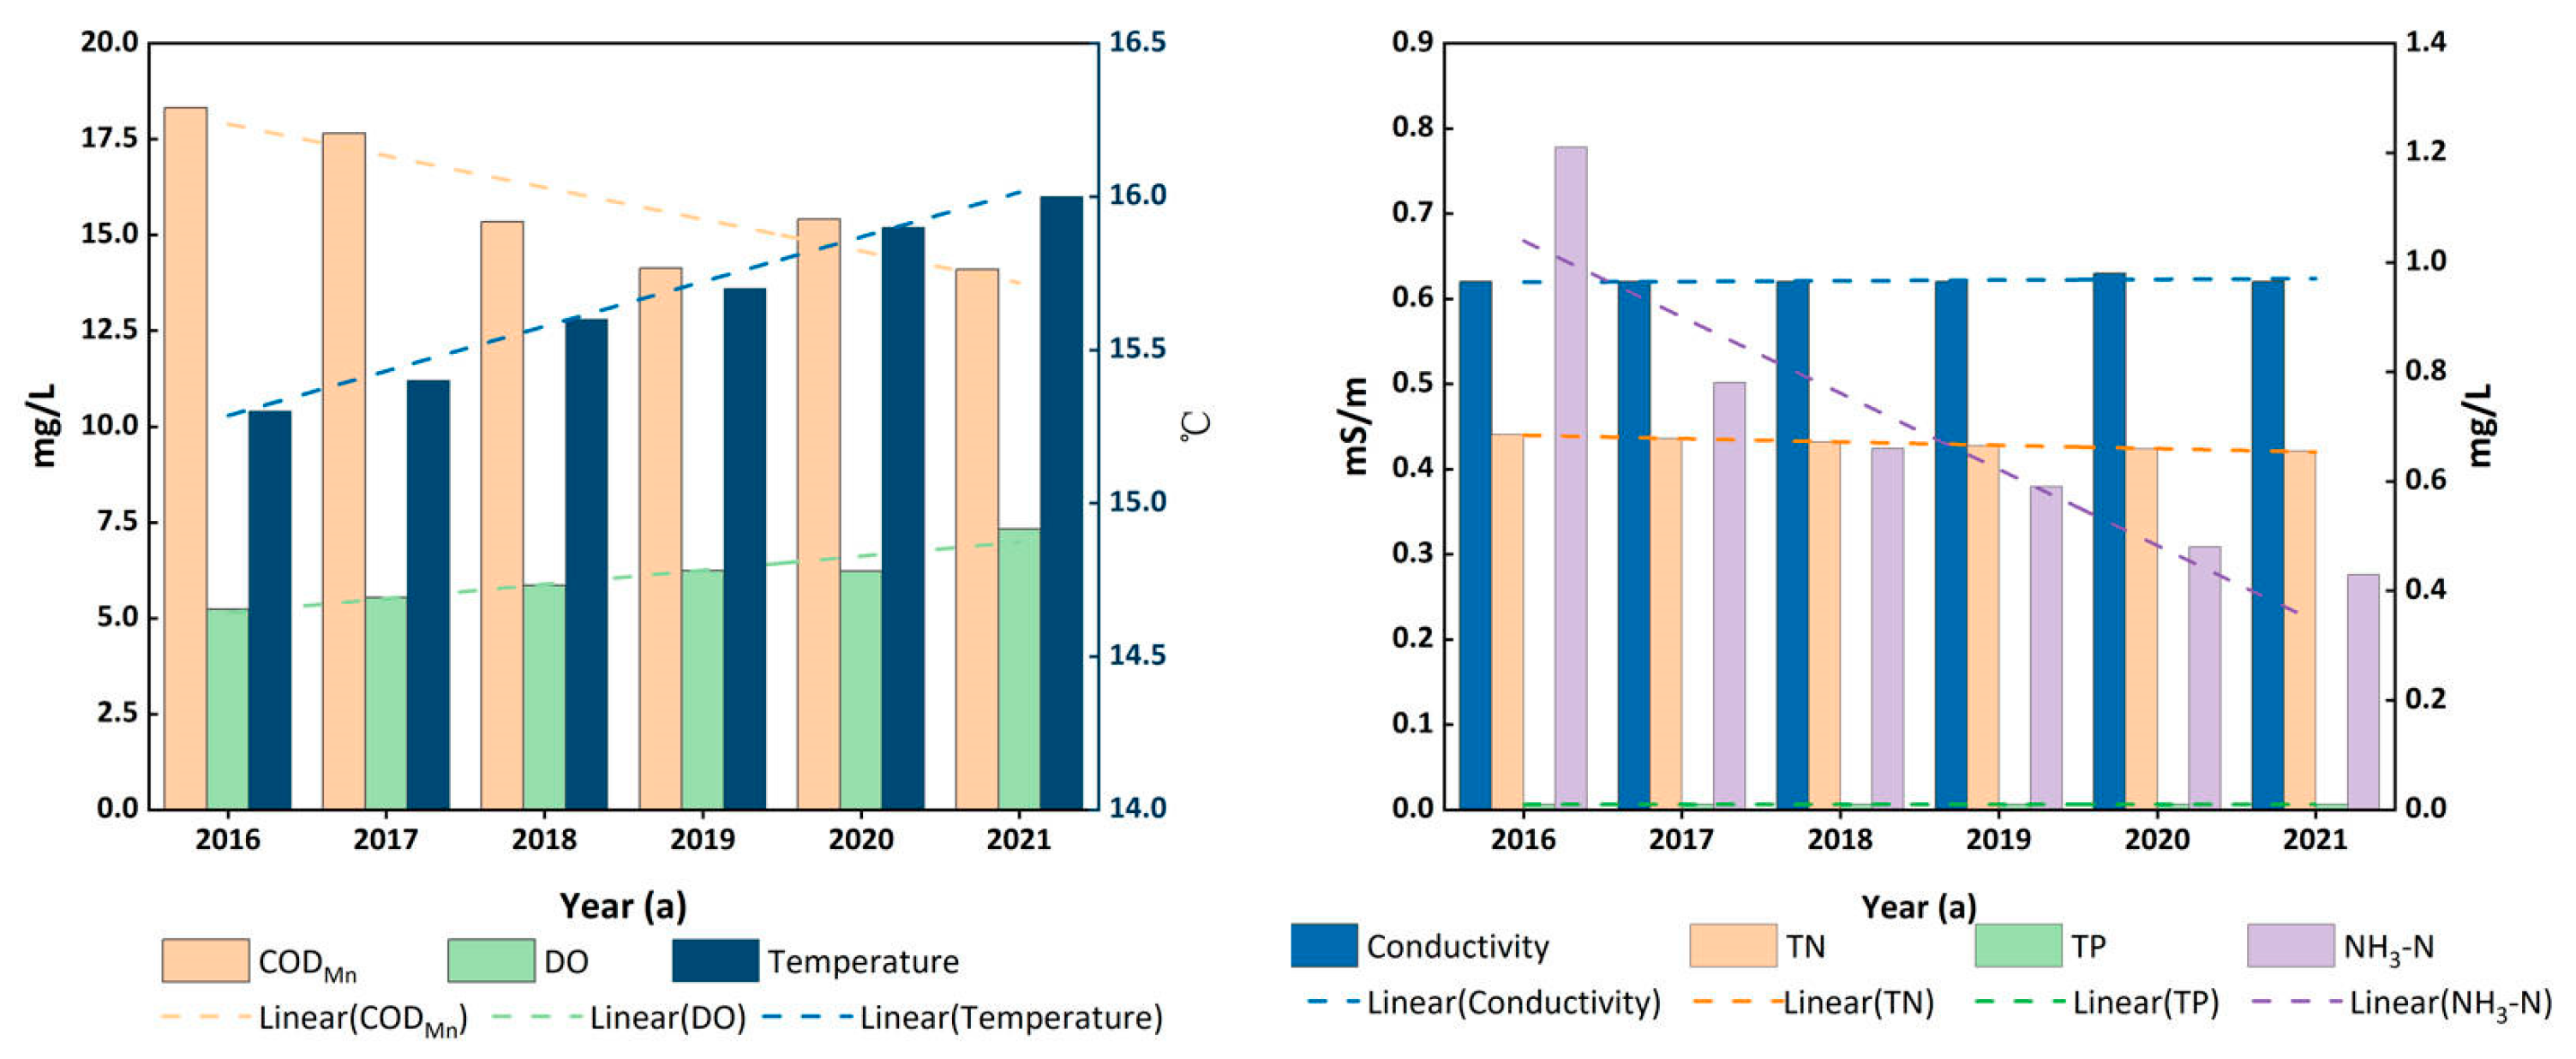
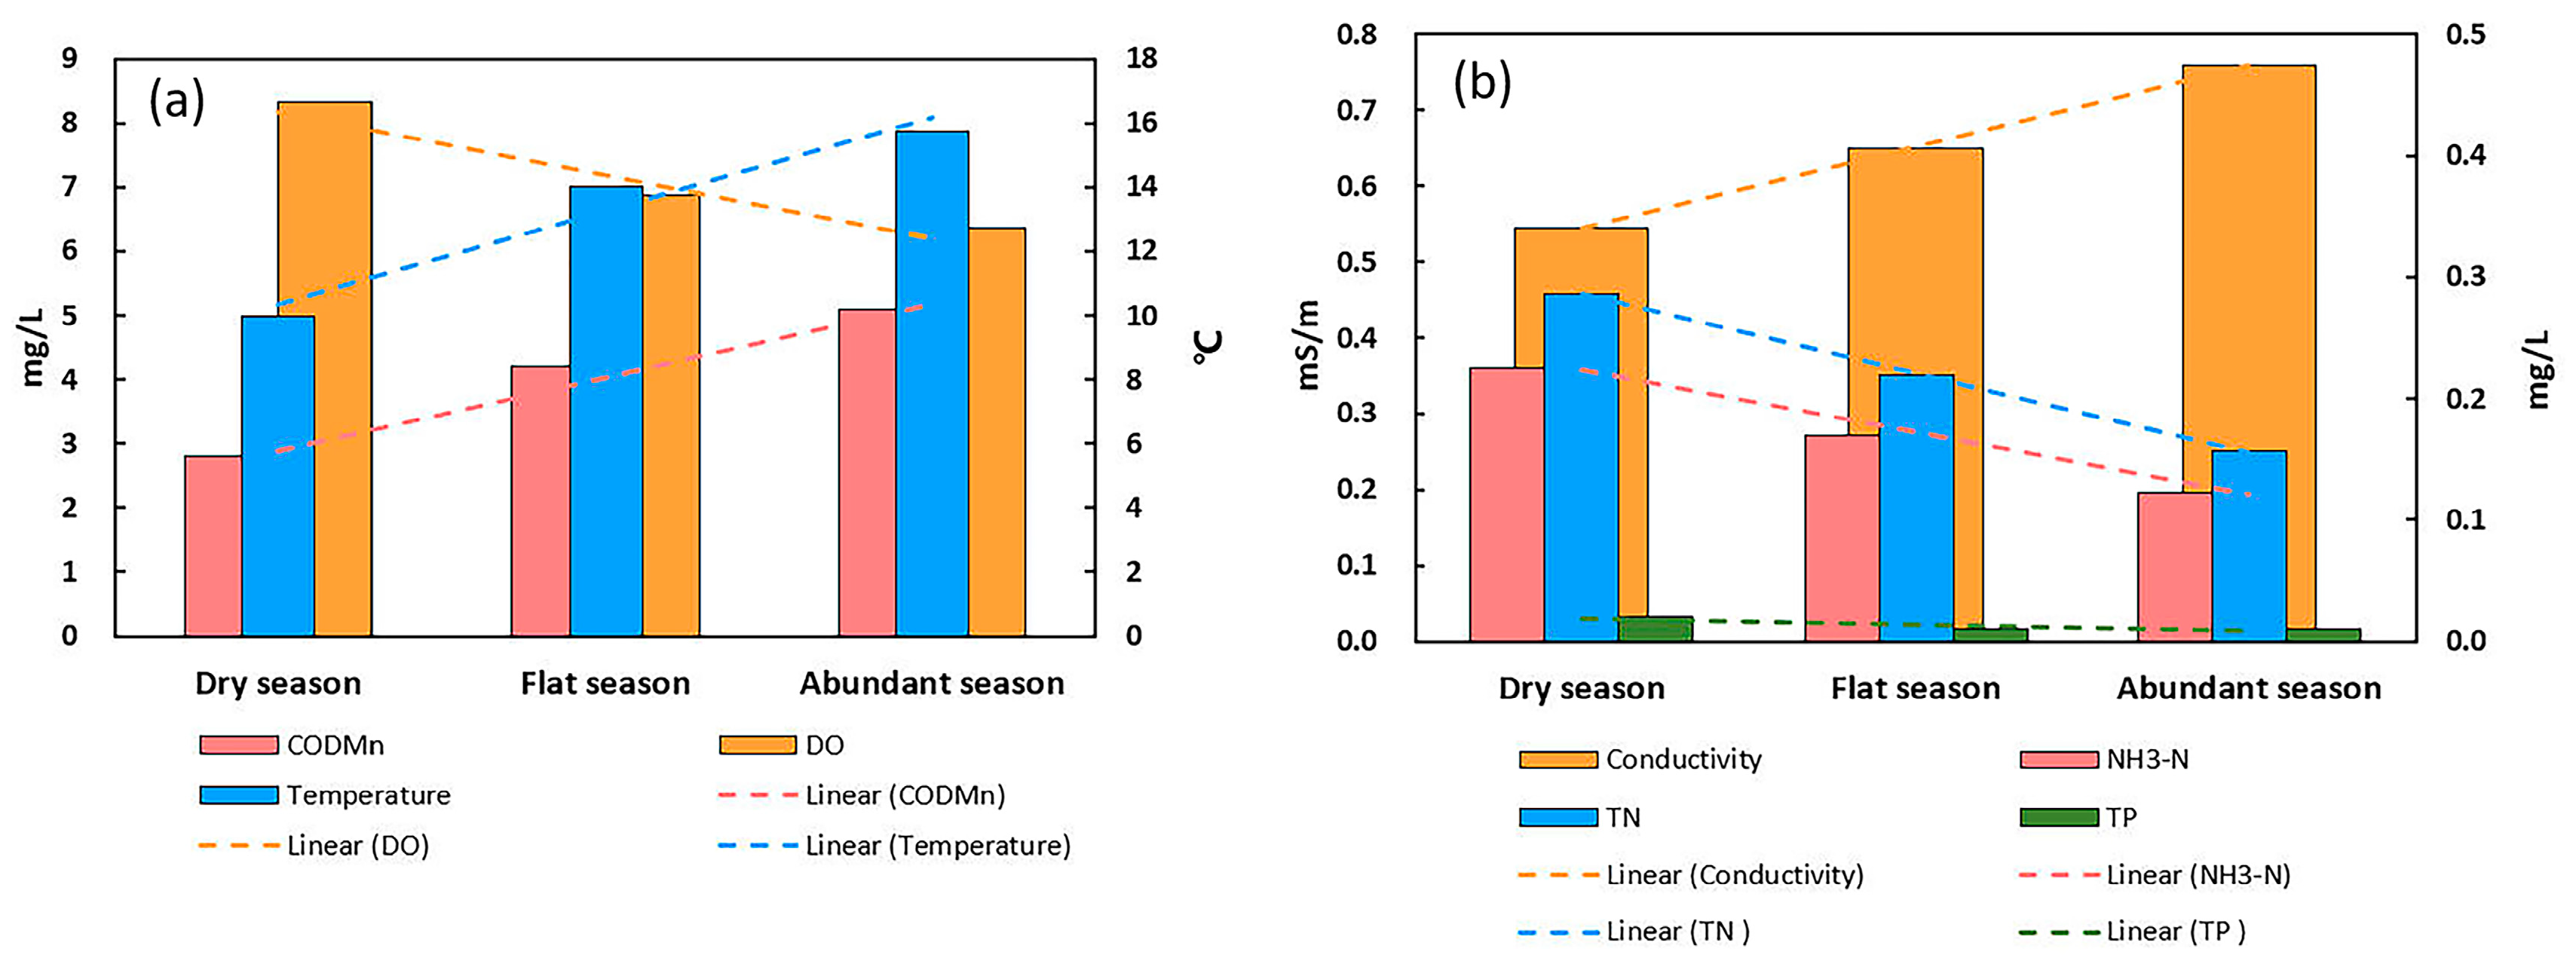
3.1. Analysis of Water Quality of Typical Wetlands in the Source Region of the Yangtze River from 2016 to 2021

The CODMn, NH3-And, and TN in typical wetland water bodies in the source region of the Yangtze River show an overall downward trend. The highest value of all parameters appears in 2016 and the lowest value of all parameters arise in 2021. Temperature and dissolved oxygen (DO) in the overall rise, its peak appear in 2021 (Figure 4). The TP concentration and water conductivity do not vary significantly. In general, water quality of typical wetlands in the source region of the Yangtze River has improved year by year.
Figure 5 shows, among the changes in the year, the changes of DO, NH3-N, and TN concentration in the year are dry season > flat season > abundant season, while the CODMn, temperature, and conductivity change in the opposite trend during the year, and the TP fluctuated slightly during the monitoring period.

3.2. Water Quality Evaluation of Typical Wetlands in the Source Region of the Yangtze River

3.2.1. Bayesian Water Quality Evaluation Results

The Bayesian evaluation method was used to evaluate the water quality indicators, and the evaluation results are shown in Table 6. From 2016 to 2021, the water quality at each monitoring point is above the Class II water standard. The water quality in 2016 and 2019 was mostly Class II water. The evaluation grade tends to improve in 2016 and 2017, but significantly declines in 2019. In 2019, except for the monitoring point 9, the water quality grade reached Class I; the remaining monitoring points were all listed as Class II. In 2020 and 2021, the water quality of most of the monitoring points had improved, and the water quality grade of most of the monitoring points had reached the Class I water quality standard. However, at the end of 2020, monitoring points 4, 6, and 7 were still classified as Class II water. 2021 is the best year for water quality evaluation, and all monitoring points are of first-class water quality. Being dependent on the above results, the water quality of typical wetlands in the source region of the Yangtze River fluctuates and rises during the six years from 2016 to 2021.

3.2.2. Yao Zhiqi Method Water Quality Evaluation Results

Depending on Yao Zhiqi’s evaluation method, the higher the p value, the worse the water quality. As shown in Table 7, water quality is above class II, but P2019 > P2016 > P2017 > P2018. The p value obtained in 2019 was larger than that in other years. The water quality in 2019 was the worst. In other years, the water quality of typical wetlands is class I, with P2021 > P2020. The water quality value in 2021 is the best. The water quality of typical wetlands from 2016 to 2021 was generally good, and the water quality rating from 2016 to 2019 was Class II, indicating good water quality. 2020 is the turning point. The water quality in 2019 is the worst, but from 2020 onwards, the water quality gradually improves and reaches Class I. In 2021, the water quality reaches the best, P2021 = 0.62.

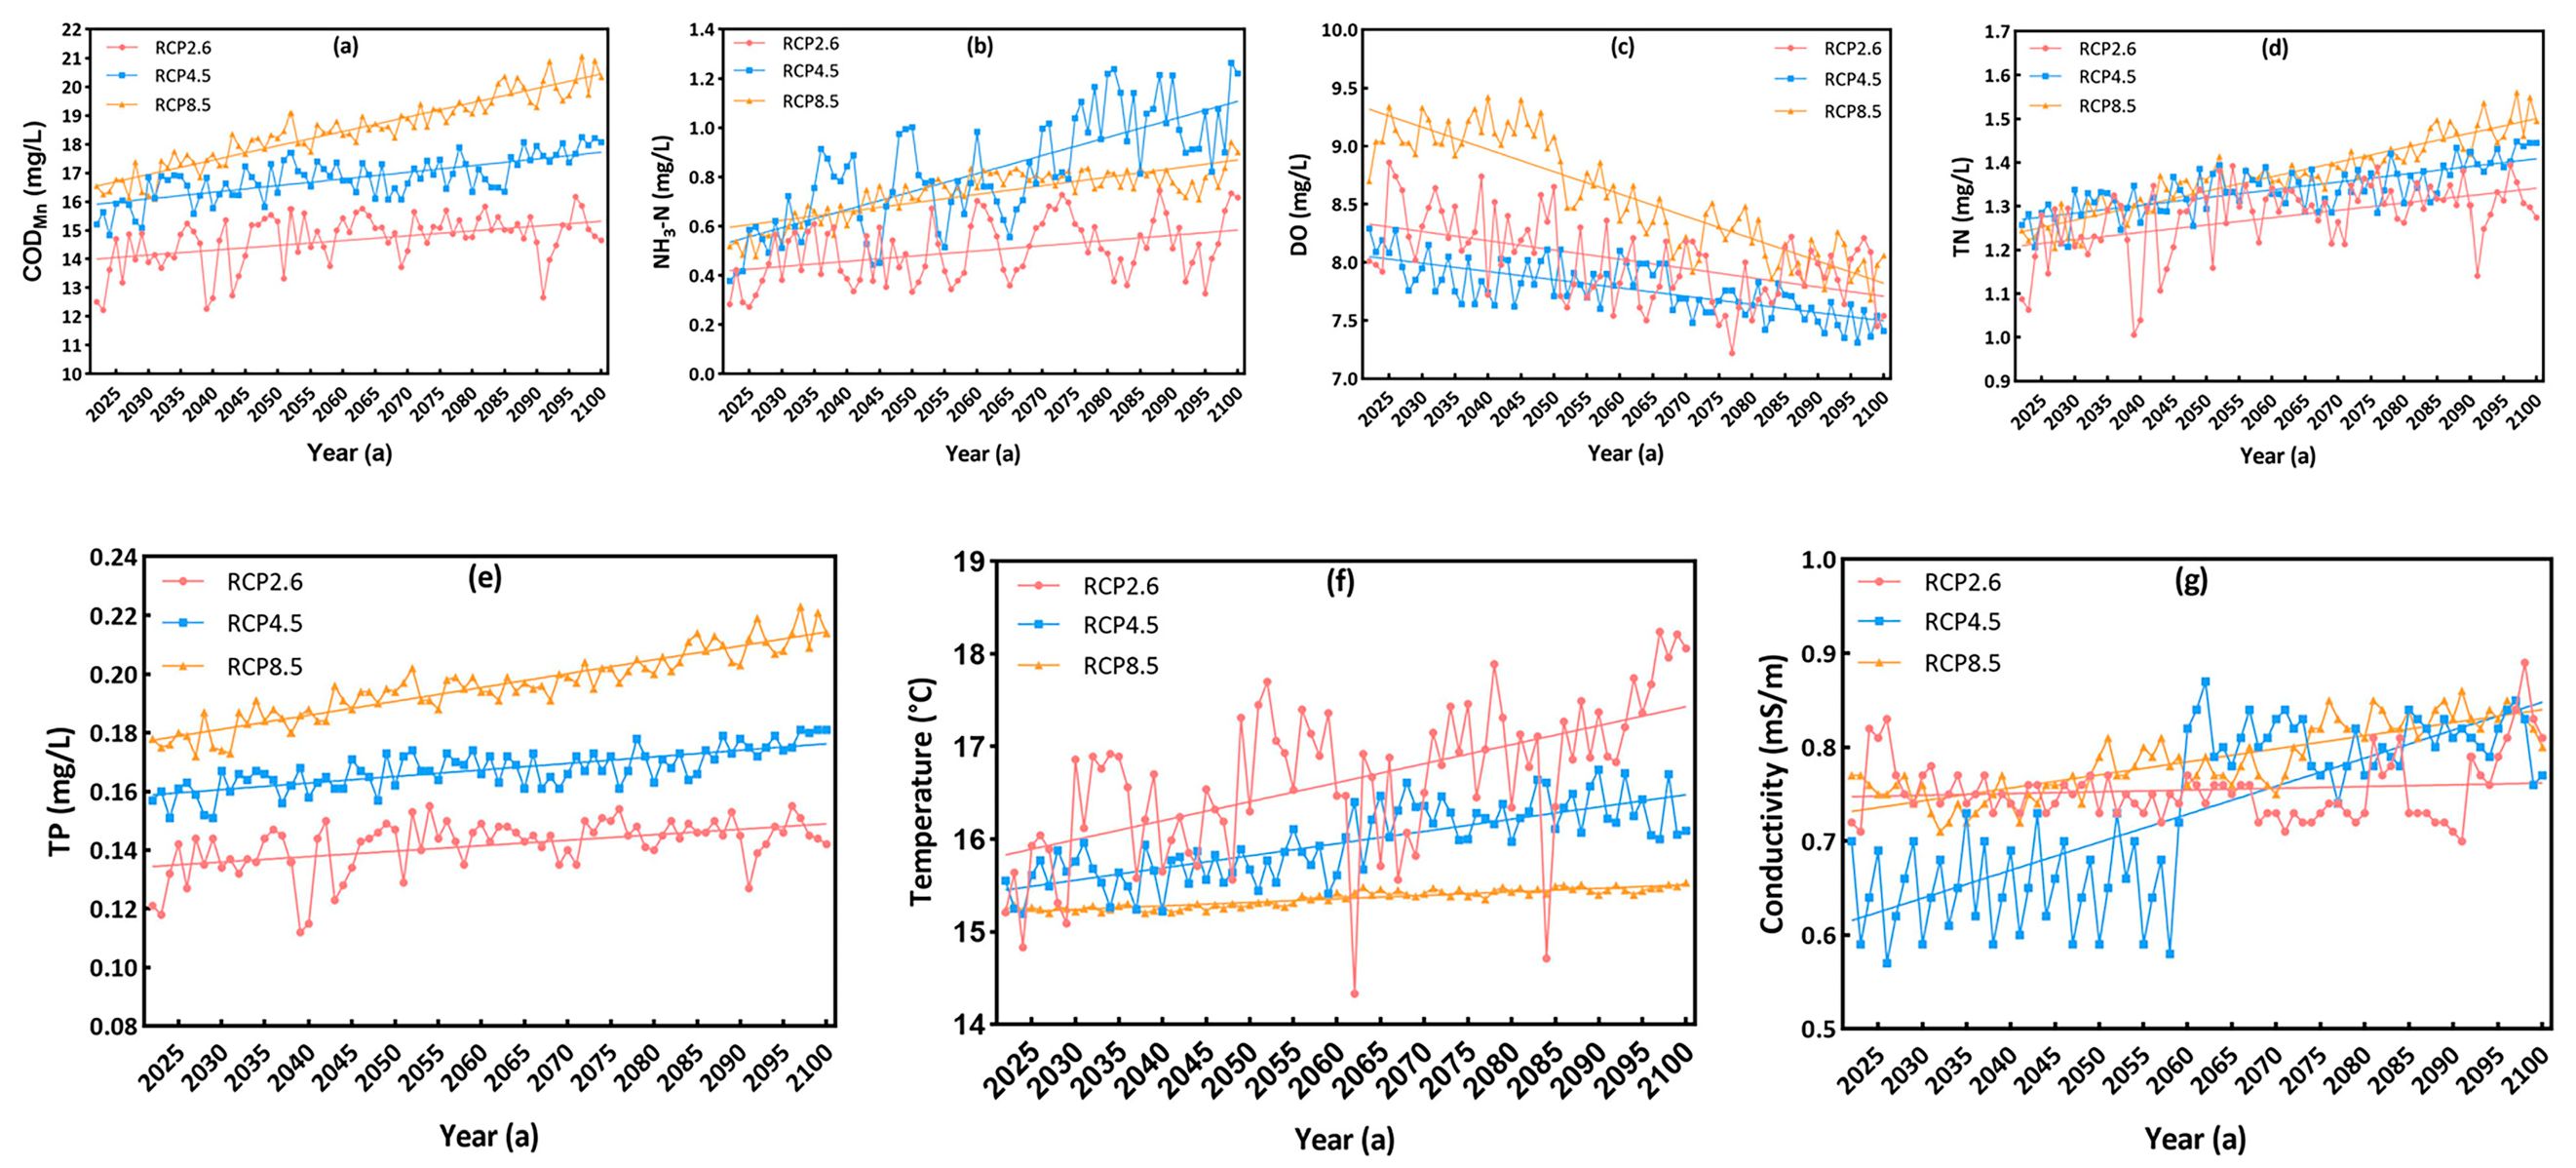
3.3. Analysis of Water Quality Change Trend of Typical Wetlands in the Source Region of the Yangtze River under Future Climate Scenarios

3.3.1. Change Trend Analysis of CODMn under Future Climate Scenarios

Figure 6a and Table 8, line (a) show the inter-annual variation trend of CODMn in wetland water in the source region of the Yangtze River under three RCP climate scenarios from 2022 to 2100 and the linear relationship between different climate scenarios. The fluctuation range of CODMn in wetland water is the smallest, which is 3.960 mg/L under RCP2.6, and the largest, which is 6.117 mg/L under RCP8.5, and the fluctuation range is RCP8.5 > RCP4.5 > RCP2.6. In the future, CODMn in wetland water will show an obvious linear growth trend. In the RCP2.6 scenario, CODMn in wetland water is mainly characterized by inter-annual oscillation. In the RCP4.5 scenario, CODMn in wetland water showed an upward trend at first, and a downward trend in the medium term. Under RCP8.5, the increase in CODMn in wetland water was gentle and shows an overall upward trend. Under the three situations, the overall rising trend was RCP8.5 > RCP4.5 > RCP2.6, significant changes in CODMn concentrations under three climate scenarios. Under the RCP2.6 scenario, CODMn reaches the lowest value in 2023, and the maximum value appears for the first time in 2096; under the scenarios of RCP4.5 and RCP8.5, the minimum value of CODMn appears in 2021 and the maximum value appears for the first time in 2097. CODMn in the wetland water body in the source region will continue to increase, and the water quality will gradually deteriorate.

3.3.2. Change Trend Analysis of NH3-N under Future Climate Scenarios

Figure 6b and Table 8, line (b) show the climate models of NH3-N in the wetland water body in the source region of the Yangtze River and the linear relationship between different scenarios under three RCP climate model scenarios from 2022 to 2100. Under the three scenarios, the fluctuation range of NH3-N content in the wetland water body is the smallest, which is 0.462 mg/L under RCP2.6 and the largest, which is 0.886 mg/L under RCP4.5, that is, the fluctuation range is RCP4.5 > RCP8.5 > RCP2.6.
It can be observed in Figure 6b that NH3-N in wetland water in the source region of the Yangtze River shows an obvious linear growth trend in the near future. Under the RCP2.6 scenario, NH3-N in wetland water shows an upward trend in the early, middle and late stages, and the rising rate in the initial stage is greater than that in the middle and late stage, showing an overall upward trend. In the RCP4.5 scenario, NH3-N in wetland water showed an upward trend at the beginning of this century and a downward trend in the middle and late stage. Under the RCP8.5 scenario, the growth rate of NH3-N at the beginning of this century is slightly higher than that in the middle and late of this century, showing an overall upward trend. Under the RCP4.5 scenario, the upward trend of NH3-N is more obvious, while under the RCP2.6 scenario, the upward trend is more stable, that is, the overall upward trend is RCP4.5 > RCP8.5 > RCP2.6, with a significant difference (p < 0.05). In the RCP2.6 scenario, NH3-N will reach the lowest value in 2025; the highest value will appear for the first time in 2088 and again in 2099. In the RCP4.5 scenario, NH3-N will reach the lowest value in 2022 and the maximum value first will appear in 2099. In the RCP8.5 scenario, NH3-N will reach the lowest value in 2022, and the maximum value also will appear in 2099 for the first time. NH3-N in wetland water in the source region of the Yangtze River will continue to increase.

3.3.3. Analysis of DO Change Trend under Future Climate Scenario

Figure 6c and Table 8, line (c) indicate the inter-annual variation trend of DO in the wetland water body in the source region of the Yangtze River and the linear relationship between different scenarios under three RCP climate model scenarios from 2022 to 2100. The fluctuation ranges of the three climate scenarios are: RCP8.5 > RCP2.6 > RCP4.5.
In the future, the content of DO in wetland water in the source region of the Yangtze River will show an obvious linear downward trend. Under the RCP2.6 scenario, DO in the wetland water body shows a downward trend in the initial stage; the decline rate in the initial stage is greater than that in the middle stage, and there is an upward trend in the late stage, which shows a downward trend as a whole. Under the RCP4.5 scenario, DO in the wetland water showed a downward trend at the beginning, middle and late of this century. Under the RCP8.5 scenario, DO in the wetland water body increased at the beginning of this century and decreased in the middle and late of this century, while the decline in the middle is slightly larger, showing a downward trend as a whole. Under the three scenarios, the downward tendency of DO was RCP8.5 > RCP2.6 > RCP4.5, with a significant difference (p < 0.05). Under the RCP2.6 scenario, DO reaches the highest value in 2025 and the lowest value appears for the first time in 2077. Under the RCP4.5 scenario, DO reaches the highest value in 2022 and the lowest value appears for the first time in 2096. Under the RCP8.5 scenario, DO reaches the highest value in 2040, and the lowest value first will appear in 2098. DO in the wetland water body in the source region will still decline.

3.3.4. Analysis of the Change Trend of TN under Future Climate Scenarios

The inter-annual variation trend of TN in the wetland water body in the source region of the Yangtze River under the three RCPs climate model scenarios from 2022 to 2100 and the linear relationship between different scenarios are shown in Figure 6d and Table 8, line (d). The lowest fluctuation range of TN content in wetland water is 0.261 mg/L under RCP4.5, and the largest fluctuation range is 0.441 mg/L under RCP8.5.
In the future, TN in wetland water will show an obvious linear growth trend. Under the RCP2.6 scenario, TN in wetland the water body shows an upward trend in the early stage, a downward trend in the middle and late stage, and the decline range in the late stage is greater than that in the middle stage, and the overall trend is upward. Under the scenario of RCP4.5, TN in wetland water show an upward trend in the early and late stages of this century, and the upward range in the late stage is greater than that in the early stage. Under the RCP8.5 scenario, the growth rate of TN at the beginning of this century is slightly higher than that in the middle and late of this century, showing an overall upward trend. In the RCP8.5 scenario, the rising trend of TN is the most obvious. While in the RCP2.6 scenario, the rising trend is the gentlest. The overall rising trend is RCP8.5 > RCP4.5 > RCP2.6, with a significant difference (p < 0.05). Under the RCP2.6 scenario, TN reaches the lowest value in 2039, and the maximum value appears for the first time in 2096. Under the scenarios of RCP4.5 and RCP8.5, TN reached the lowest value in 2022, and the maximum value appeared for the first time in 2097. In the future, TN in the wetland water body in the source region will continue to rise.

3.3.5. Analysis of TP Change Trend under Future Climate Scenarios

Figure 6e and Table 8, line (e) show the inter-annual variation trend of TP in the wetland water body in the source region of the Yangtze River and the linear relationship between different scenarios under three RCP climate model scenarios from 2022 to 2100. The response of TP in the water body to climate change is complex. Under the three scenarios, the inter-annual fluctuation of TP in the wetland water body in the source region is different. The fluctuation range of TP content in the wetland water body is the smallest, which is 0.033 mg/L under RCP4.5 and the largest, which is 0.063 mg/L under RCP8.5, that is, the fluctuation range is RCP8.5 > RCP2.6 > RCP4.5.
It can be seen from Figure 6e that TP in wetland water showed an obvious linear growth trend at the beginning of the twenty-second century. Under the scenario of RCP2.6, TP in the wetland water body has an upward prospect in the initial stage, a downward prospect in the middle and late stage, and a greater decline in the late stage than in the middle stage, which is an upward prospect as a whole. Under the scenario of RCP4.5, TP in wetland water has the prospect of rising in the early and late stage of this century, and the rising range is large in the late stage. Under the RCP8.5 scenario, the growth rate of TP at the beginning of this century is slightly higher than that in the middle and late of this century. Under the RCP8.5 scenario, the rising trend of TP is obvious. While under the RCP2.6 scenario, the rising trend is relatively stable, that is, RCP8.5 > RCP4.5 > RCP2.6; the difference is very significant. In the RCP2.6 scenario, TP reaches the lowest value in 2038, and the maximum value appears for the first time in 2050. In the RCP4.5 and RCP8.5 scenarios, TP reaches the lowest value in 2022, and the maximum value appears for the first time in 2097. However, in the RCP4.5 scenario, the maximum value appears again in 2099 and 2100. In the future, TP in the wetland water body in the source region of the Yangtze River will continue to rise.

3.3.6. Analysis of Temperature Trends in Future Climate Scenarios

According to Figure 6f and the Table 8, line (f), the lowest fluctuation range of wetland water temperature is 0.35 °C under RCP8.5, and the largest range of fluctuation is about 4 °C according to RCP2.6.
In the future, the wetland water temperature will show a linear growth trend. Under the RCP2.6 scenario, the water temperature of the wetland shows an upward trend in the early and late stages, and a downward trend in the middle stage, and the increase in the early stage is slightly larger than that in the late stage, which is an upward trend on the whole. Under the RCP4.5 scenario, the water body temperature of wetland in the early, middle and late stages of this century shows an upward trend, with a large increase in the middle stage, and an overall upward trend. Under the scenario of RCP8.5, the rising range of wetland water body temperature in the middle of this century is slightly larger than that in the later and early stages, and generally shows an upward trend. The rising trend of wetland water temperature under RCP2.6 is the most obvious, and the rising trend of wetland water temperature under RCP8.5 is relatively stable, with a significant difference (p < 0.05). Under the RCP2.6 scenario, the wetland water body temperature reaches the lowest value in 2054, and the maximum value first appears in 2096. Under the RCP4.5 scenario, the wetland water body temperature reaches the lowest value in 2023, and the maximum value first appears in 2090. Under the RCP8.5 scenario, the wetland water body temperature reaches the lowest value in 2022 and the highest value in 2100. The water temperature of wetland will continue to increase, and the water quality may gradually deteriorate.

3.3.7. Change Trend Analysis of Water Conductivity under Future Climate Scenarios

Figure 6g and Table 8, line (g) show the inter-annual variation trend of wetland water conductivity in the source region of the Yangtze River and the linear relationship between different scenarios under three RCP climate model scenarios from 2022 to 2100. The lowest fluctuation amplitude of wetland water conductivity is 0.15 mS/m under RCP8.5, and the largest fluctuation amplitude is 0.30 mS/m under RCP4.5.
In the future, the conductivity of wetland water will show a linear growth trend, but the growth trend is not obvious (p > 0.05). Under the RCP2.6 scenario, the conductivity of the wetland water body shows a downward trend in the initial and middle stages; the downward range in the initial stage is greater than that in the middle stage, and the upward trend in the late stage, which is an upward trend as a whole. Under the RCP4.5 scenario, the conductivity of the wetland water body showed an upward trend at the beginning, middle and late stages of this century, with a large increase in the middle term. Under the RCP8.5 scenario, the increase in wetland water conductivity in the middle of this century is slightly greater than that in the later period. But the increase is very small. In the early period, it is a downward trend and an overall upward trend. In the RCP 8.5 scenario, the conductivity of wetland water increased significantly, while in the RCP2.6 scenario, the upward trend was relatively stable, and the difference was significant (p < 0.05). Under the RCP 2.6 scenario, the conductivity of the wetland water body reaches the lowest value in 2022 and 2091, and the maximum value first appears in 2098. Under the RCP4.5 scenario, the conductivity of the wetland water body reaches the lowest value in 2026, and the maximum value first appears in 2062. This causes a jump in conductivity in 2060–2065 due to the rapid increase in water temperature in 2060–2065. Under the RCP8.5 scenario, the conductivity of the wetland water body reaches the lowest value in 2032 and maximum value in 2091. The water conductivity of the wetland will show an upward trend, but the growth trend is not obvious (p > 0.05), which has little impact on water quality.

4. Discussion

This study shows that the water quality of typical wetlands in the source region of the Yangtze River from 2016 to 2021 is excellent and basically not disturbed by human activities, which is consistent with the research results of Liu et al. [38] and Zhao et al. [39]. The source region of the Yangtze River is sparsely populated, with less agricultural land and a relatively low degree of industrialization. Relatively few pollutants enter the water body through precipitation impact, atmospheric sedimentation, or sewage discharge.
From 2016 to 2021, the annual variation of NH3-N, DO, TN, and TP concentrations in the wetland water body of the source region of the Yangtze River in the dry season (It refers to the period when the surface water flow in the basin is depleted and relies mainly on groundwater to recharge the water source.) > flat season (It refers to the period when the river is at normal water level.) > abundant season (It refers to the period when the river water flow is mainly recharged by rainfall or snowmelt.), which is basically consistent with the research results of Su [40] on the runoff variation characteristics and variation trend of the source region of the Yangtze River in nearly 60 years (1956–2012) and Yan [41] on the variation characteristics of wetlands in different source regions of the three rivers from 1975 to 2007. And the results are basically consistent with the consequences of Zhao [42] and others in the study of surface water quality in the source regions of the three rivers in Qinghai Province from 2005 to 2013. This may be due to the large rainfall in the wet season. Due to the influence of precipitation, there are relatively few pollutants discharged into the water by atmospheric sedimentation and sewage, and the water itself has a good self-purification capacity [43]. From 2016 to 2021, the water quality of the wetland is relatively good, which is related to the grassland enclosure, reduction of over grazing and strengthening of ecological environment protection in the source region of the Yangtze River in recent years.
The water quality of different monitoring points is evaluated by the Bayesian evaluation method, and the overall water quality of the source region of the Yangtze River is comprehensively evaluated by the Yao Zhiqi evaluation method [36]. The evaluation results intuitively and comprehensively show the change in water quality of typical wetlands in the source region of the Yangtze River and have received excellent results. This study also found that monitoring point 3 had most of the class II water quality from 2016 to 2021. Through analysis, it was found that monitoring point 3 had a low altitude (3500 m), was situated in a densely populated region, and was close to the highway. There were animals grazing around monitoring point 3. At the same time, there were wild animal activities in this region, which was greatly affected by human activities, resulting in slightly poor wetland water quality. The water quality of monitoring point 9 is mostly Class I water during the monitoring period, which was related to the fact that the monitoring point is located at the edge of Cocosili Nature Reserve. The monitoring point has a high altitude (4692 m), less interference from human activities, and less pollution from surrounding point sources and non-point sources, leading to better water quality of the wetland.
Hassanjabbar, et al. [44] used GCMS climate models and artificial neural networks (ANNs) to study the response of the flow regime and water quality indicators to climate change. The results show that global climate change will have a negative impact on water quality in the future. Liu [45] and Fang [46] simulated and analyzed the response of hydrology and water quality of the Changlejiang basin and Dahuofang basin to climate by using A2 and B2 emission scenarios and the SWAT hydrological model. Under the GCMS climate model, the concentration of TP increased and decreased, but overall, it showed an upward trend.
In this study, RCP2.6, RCP4.5, and RCP8.5 scenarios under the CMIP5 climate model are coupled with the SWAT hydrological model to predict the change trend in TN and TP concentrations in wetland water in the source region of the Yangtze River in the future (2022–2100). The results show that the concentrations of TN and TP in wetland water in the source region of the Yangtze River are increasing. It shows that future climate change will have a negative impact on water quality.
At present, relevant studies have used multi-mode sets to simulate and evaluate the future temperature or precipitation in the source region of the Yangtze River but there are generally 4–14 model sets, which are analyzed and compared under single or two future emission scenarios. At the same time, most of the existing studies focus on the middle of the 21st century, and the time scales of temperature and precipitation series are short, which makes the data simulation accuracy not high, resulting in a significant increase in the uncertainty of temperature or precipitation change prediction [47]. In this study, the simulation results of 21 models in the CMIP5 model were used to predict the change of wetland water quality in the source region of the Yangtze River, and more models were adopted to overcome the uncertainty of prediction caused by a single model or fewer models [48]; and the prediction results were more reliable, providing scientific support for the protection of wetlands in the source region of the Yangtze River under climate change.

5. Conclusions

(1) From 2016 to 2021, the concentrations of CODMn, NH3-And, and TN in typical wetland water bodies in the source region of the Yangtze River showed a downward trend; temperature and dissolved oxygen concentration generally showed an upward trend. The inter-annual fluctuation range of water conductivity and total phosphorus (TP) is not obvious. The changes in CODMn, temperature, and conductivity in the year are abundant season > flat season > dry season, and the changes of DO, NH3-And, and TN concentration in the year are dry season > flat season > abundant season. Overall, the water quality of typical wetlands in the source region of the Yangtze River is better in the wet season.
(2) According to the Bayesian evaluation method, the water quality of the nine monitoring stations in the source region of the Yangtze River is Class II in 2016 and 2019, and most of the stations in other years are Class I. According to Yao Zhiqi’s evaluation method, the water quality is Class II from 2016 to 2019. The two evaluation methods show that the overall water quality has obviously improved since 2019.
(3) In the future period, TN, TP, CODMn, NH3-N, and temperature in the wetland water in the source region of the Yangtze River will continue to rise; the changes of DO will continue to decline. In the forthcoming period (2022–2100), the wetland water quality in the source region of the Yangtze River will gradually deteriorate, and the wetland protection work is an urgent necessity.
(4) In the future period, the water quality of wetlands in the source region of the Yangtze River is gradually deteriorating, and wetland management becomes an urgent task. The source region of the Yangtze River should continuously improve the strategy to cope with climate change, strengthen the research capacity of ecological and environmental resources in the source region of the Yangtze River, and increase the control of greenhouse gas emissions; further, improve the information sharing mechanism and enhance the capacity of water resources optimization.

Author Contributions

Conceptualization, X.Z. (Xiuzhi Zhang) and X.Q.; methodology, Y.W. and S.Z.; software, Y.M. and X.Z. (Xiaojing Zheng); validation, W.B. and X.Z. (Xiaoyan Zhang); formal analysis, B.Y. and Y.G.; resources, S.L. and Z.W.; data curation, C.J. and Y.Q.; writing—original draft preparation, S.L. and J.L.; writing—review and editing, J.S. and J.L.; visualization, H.Q. and L.Q.; project administration, J.S. and S.L.; funding acquisition, J.S. and S.L. All authors have read and agreed to the published version of the manuscript.

Funding

Supported by the National Natural Science Funds Fund (No.31760147); project of the Qing Hai Science & Technology Department (No.2023-HZ-802); project of the Qing Hai Science & Technology Department (No.2021-ZJ-926); project of the Qing Hai Science & Technology Department (No.2020-ZJ-763); project of the Qing Hai Science & Technology Department (No.2019-HZ-809).

Institutional Review Board Statement

Not applicable.

Informed Consent Statement

Not applicable.

Data Availability Statement

Not applicable.

Conflicts of Interest

The authors declare no conflict of interest.

References

  1. Sun, J.; Liu, G.; Yuan, X. Alternative stable state and its evaluation in wetland reconstruction based on landscape design. Sci. Total Environ. 2023, 857, 159642. [Google Scholar] [CrossRef] [PubMed]
  2. Mogomotsi, P.K.; Mogomotsi, G.E.; Dipogiso, K.; Phonchi-Tshekiso, N.D.; Stone, L.S.; Badimo, D. An Analysis of Communities’ Attitudes Toward Wildlife and Implications for Wildlife Sustainability. Trop. Conserv. Sci. 2020, 13, 194008292091560. [Google Scholar] [CrossRef]
  3. Mao, Q.; Xu, L.; Wu, R. Evolutionary game of stakeholders’ behavioral strategies in wetland ecosystems from the vulnerability perspective. Environ. Sci. Pollut. Res. 2023, 30, 43419–43439. [Google Scholar] [CrossRef] [PubMed]
  4. Rahimi, M.; Zarei, M.; Keshavarzi, B.; Golshani, R.; Zafarani, S.G.G. Water quality stress to Amirkalayeh Wetland, Northern Iran. Environ. Monit. Assess. 2023, 195, 49. [Google Scholar] [CrossRef] [PubMed]
  5. Let, M.; Pal, S. Socio-ecological well-being perspectives of wetland loss scenario: A review. J. Environ. Manag. 2023, 326, 116692. [Google Scholar] [CrossRef]
  6. Watzinger, A.; Hager, M.; Reichenauer, T.; Soja, G.; Kinner, P. Unravelling the process of petroleum hydrocarbon biodegradation in different filter materials of constructed wetlands by stable isotope fractionation and labelling studies. Biodegradation 2021, 32, 343–359. [Google Scholar] [CrossRef]
  7. Li, G.; Xiao, K.; Wang, Q.; Zhang, Y.; Li, H. The Regulating Role of Meteorology in the Wetland-Air CO2 Fluxes at the Largest Shallow Grass-Type Lake on the North China Plain. Water 2023, 15, 139. [Google Scholar] [CrossRef]
  8. Tang, Y.; Li, Q.; Zuo, W.; Wang, J. Applicability analysis of Nemeiro index method in water quality assessment of Beidaihe National Wetland Park. Environ. Eng. 2019, 37, 195–199+189. [Google Scholar]
  9. Trevathan-Tackett, S.M.; Kepfer-Rojas, S.; Engelen, A.H.; York, P.H.; Ola, A.; Li, J.; Kelleway, J.J.; Jinks, K.I.; Jackson, E.L.; Adame, M.F.; et al. Ecosystem type drives tea litter decomposition and associated prokaryotic microbiome communities in freshwater and coastal wetlands at a continental scale. Sci. Total Environ. 2021, 782, 146819. [Google Scholar] [CrossRef]
  10. Chasmer, L.; Lima, E.M.; Mahoney, C.; Hopkinson, C.; Montgomery, J.; Cobbaert, D. Shrub changes with proximity to anthropogenic disturbance in boreal wetlands determined using bi-temporal airborne lidar in the Oil Sands Region, Alberta Canada. Sci. Total. Environ. 2021, 780, 146638. [Google Scholar] [CrossRef]
  11. Unigwe, C.O.; Egbueri, J.C. Drinking water quality assessment based on statistical analysis and three water quality indices (MWQI, IWQI and EWQI): A case study. Environ. Dev. Sustain. 2023, 25, 686–707. [Google Scholar] [CrossRef]
  12. Mu, X.; Zhang, S.; Lv, X.; Ma, Y.; Zhang, Z.; Han, B. Water flow and temperature drove epiphytic microbial community shift: Insight into nutrient removal in constructed wetlands from microbial assemblage and co-occurrence patterns. Bioresour. Technol. 2021, 332, 125134. [Google Scholar] [CrossRef] [PubMed]
  13. Qiu, J.; Shen, Z.; Xie, H. Drought impacts on hydrology and water quality under climate change. Sci. Total Environ. 2023, 858, 159854. [Google Scholar] [CrossRef]
  14. Daba, M.H.; You, S. Assessment of climate change impacts on river flow regimes in the upstream of A wash Basin, Ethiopia: Based on IPCC fifth assessment report (AR5) climate change scenarios. Hydrology 2020, 7, 98. [Google Scholar] [CrossRef]
  15. Satriagasa, M.C.; Tongdeenok, P.; Kaewjampa, N. Assessing the Implication of Climate Change to Forecast Future Flood Using SWAT and HEC-RAS Model under CMIP5 Climate Projection in Upper Nan Watershed, Thailand. Sustainability 2023, 15, 5276. [Google Scholar] [CrossRef]
  16. Malede, D.A.; Alamirew, T.; Andualem, T.G. Integrated and Individual Impacts of Land Use Land Cover and Climate Changes on Hydrological Flows over Birr River Watershed, Abbay Basin, Ethiopia. Water 2022, 15, 166. [Google Scholar] [CrossRef]
  17. Singh, V.; Karan, S.K.; Singh, C.; Samadder, S.R. Assessment of the capability of SWAT model to predict surface runoff in open cast coal mining areas. Environ. Sci. Pollut. Res. 2023, 30, 40073–40083. [Google Scholar] [CrossRef] [PubMed]
  18. Zeng, F.; Ma, M.G.; Di, D.R.; Shi, W.Y. Separating the impacts of climate change and human activities on runoff: A review of method and application. Water 2020, 12, 2201. [Google Scholar] [CrossRef]
  19. Kibii, J.K.; Kipkorir, E.C.; Kosgei, J.R. Application of Soil and Water Assessment Tool (SWAT) to Evaluate the Impact of Land Use and Climate Variability on the Kaptagat Catchment River Discharge. Sustainability 2021, 13, 1802. [Google Scholar] [CrossRef]
  20. Pandey, V.P.; Dhaubanjar, S.; Bharati, L.; Thapa, B.R. Hydrological response of Chamelia watershed in Mahakali Basin to climate change. Sci. Total Environ. 2018, 650, 365–383. [Google Scholar] [CrossRef]
  21. Li, C.; Fang, H. Assessment of climate change impacts on the streamflow for the Mun River in the Mekong Basin, Southeast Asia: Using SWAT model. Catena 2021, 201, 105199. [Google Scholar] [CrossRef]
  22. Camera, C.; Bruggeman, A.; Zittis, G.; Sofokleous, I.; Arnault, J. Simulation of extreme rainfall and streamflow events in small Mediterranean watersheds with a one-way-coupled atmospheric–hydrologic modelling system. Nat. Hazards Earth Syst. Sci. 2020, 20, 2791–2810. [Google Scholar] [CrossRef]
  23. Zhang, X.; Dong, Q.; Costa, V.; Wang, X. A hierarchical Bayesian model for decomposing the impacts of human activities and climate change on water resources in China. Sci. Total Environ. 2019, 665, 836–847. [Google Scholar] [CrossRef] [PubMed]
  24. Dubois, E.; Larocque, M.; Brunner, P. Impact of land cover changes on Long-Term Regional-Scale groundwater recharge simulation in cold and humid climates. Hydrol. Process. 2023, 37, e14810. [Google Scholar] [CrossRef]
  25. Song, X.; Zhu, Z.; Xi, X.; Zhang, G.; Wang, H. The Characteristics of Runoff Process Structure Changes under the Influence of Climate Change and Human Activities and the Decomposition of Contribution Rate of Impact Factors. Geofluids 2021, 2021, 6673217. [Google Scholar] [CrossRef]
  26. Zheng, W.; Yang, X.; Cheng, X.; Wang, Y.; Zhang, M. Prediction of main hydrological processes in the upper reaches of the Yangtze River based on CMIP5 and VIC models. Hydrology 2018, 38, 48–53. [Google Scholar]
  27. Su, Z.; Lin, L.; Chen, Y.; Hu, H. Understanding the distribution and drivers of PM2.5concentrations in the Yangtze River Delta from 2015 to 2020 using Random Forest Regression. Environ. Monit. Assess. 2022, 194, 284. [Google Scholar] [CrossRef]
  28. Gao, Y.; Chen, J.; Luo, H.; Wang, H. Prediction of hydrological responses to land use change. Sci. Total Environ. 2020, 708, 134998. [Google Scholar] [CrossRef]
  29. Sun, L.; Wang, Y.Y.; Zhang, J.Y.; Yang, Q.L.; Bao, Z.X.; Guan, X.X.; Guan, T.S.; Chen, X.; Wang, G.Q. Impact of environmental change on runoff in a transitional basin: Tao River Basin from the Tibetan Plateau to the Loess Plateau, China. Adv. Clim. Chang. Res. 2020, 10, 214–224. [Google Scholar] [CrossRef]
  30. Qiao, F.; Fu, G.; Xu, X.Q.; An, L.; Lei, K.; Zhao, J.; Hao, C. Assessment of Water Conservation Function in the Three-River Headwaters Region. Environ. Sci. Res. 2018, 31, 1010–1018. [Google Scholar]
  31. Li, J.M.; Shanrenqianjie; Yang, Y.; Qi, X.; Ha, Y.; Wang, Y.; He, Y.; Li, Y.; Lu, S. Effects of climate change on soil moisture in the source region of the Yangtze River. J. Yunnan Univ. 2022, 44, 775–784. [Google Scholar]
  32. Yan, X.; Zhou, Y.J.; Yao, S.M. River geomorphology and water-sediment characteristics in the source region of the Yangtze River. J. Yangtze River Sci. Res. Inst. 2019, 36, 10–15. [Google Scholar]
  33. Han, D.; Pan, B.; Zhao, G.; Zhu, P.; Wang, H.; Li, R. Phytoplankton community structure and distribution characteristics in the source region of the Yangtze River. Resour. Environ. Yangtze Basin 2019, 28, 2621–2631. [Google Scholar]
  34. Si, J.; Li, J.; Yang, Y.; Qi, X.; Li, J.; Liu, Z.; Li, M.; Lu, S.; Qi, Y.; Jin, C.; et al. Evaluation and Prediction of Groundwater Quality in the Source Region of the Yellow River. Water 2022, 14, 3946. [Google Scholar] [CrossRef]
  35. Maity, B.; Mallick, S.K.; Das, P.; Rudra, S. Comparative analysis of groundwater potentiality zone using fuzzy AHP, frequency ratio and Bayesian weights of evidence methods. Appl. Water Sci. 2022, 12, 63. [Google Scholar] [CrossRef]
  36. Yao, Z. Environmental Health, 3rd ed.; People’s Health Publishing: Beijing, China, 1994. [Google Scholar]
  37. Zadeh, F.K.; Nossent, J.; Woldegiorgis, B.T.; Bauwens, W.; van Griensven, A. A fast and effective parameterization of water quality models. Environ. Model. Softw. 2022, 149, 105331. [Google Scholar] [CrossRef]
  38. Liu, M.; Zhao, L.; Li, Q.; Zou, J.; Hu, Y.; Zhang, Y.; Xu, P.; Wu, Z.; Deng, W.; Tao, J. Chemical characteristics and main ion sources of main rivers in the source area of the yangtze river. China Environ. Sci. 2021, 41, 1243–1254. [Google Scholar]
  39. Zhao, Z.; Liu, L.; Wang, Z.; Zhang, Y.; Li, L.; Liu, F. Dynamic Changes of Plateau Wetlands in the Damqu River Basin, Yangtze River Source Region, China, 1988–2015. Wetlands 2020, 40, 1409–1424. [Google Scholar] [CrossRef]
  40. Su, Z.; Chen, W. Analysis of runoff variation characteristics and trend in the source region of the Yangtze River in recent 60 years. China Agron. Bull. 2016, 32, 166–171. [Google Scholar]
  41. Yan, Y.; Xu, H.; Xin, Y.; Liu, G.; Liu, J.; Wang, Y. Response Regularity of Wetland Area Changing According to Climate Changes in the 3-river Source Area from 1975 to 2007. Bull. Surv. Mapp. 2015, S2, 5–10. [Google Scholar]
  42. Zhao, H.; Cao, G.; Jiang, G. Study on water quality change of typical wetlands in Sanjiangyuan area of Qinghai Province. J. Panzhihua Univ. 2015, 32, 18–21. [Google Scholar]
  43. Meng, X.; Chen, H.; Li, Z.; Zhao, L.; Zhou, B.; Lv, S.; Deng, M.; Liu, Y.; Li, G. A review of studies on climate change and its environmental impacts in the source region of the Three Rivers. Plateau Meteorol. 2020, 39, 1133–1143. [Google Scholar]
  44. Hassanjabbar, A.; Nezaratian, H.; Wu, P. Climate change impacts on the flow regime and water quality indicators using an artificial neural network (ANN): A case study in Saskatchewan, Canada. J. Water Clim. Chang. 2022, 13, 3046–3060. [Google Scholar] [CrossRef]
  45. Liu, M.; Jun, L. Response of river hydrology and water quality to climate change in Changle River Watershed, Eastern China. Acta Sci. Circumstantiae 2015, 35, 108–117. [Google Scholar]
  46. Fang, S. Research on Water Quality Response of Dawafang Reservoir under Climate Change. Rural. Econ. Sci. Technol. 2018, 29, 43–44. [Google Scholar]
  47. Eyring, V.; Bock, L.; Lauer, A.; Righi, M.; Schlund, M.; Andela, B.; Arnone, E.; Bellprat, O.; Brötz, B.; Caron, L.P.; et al. Earth System Model Evaluation Tool (ESMValTool) v2. 0–an extended set of large-scale diagnostics for quasi-operational and comprehensive evaluation of Earth system models in CMIP. Geosci. Model Dev. 2020, 13, 3383–3438. [Google Scholar] [CrossRef]
  48. Kong, H.; Li, G.; Sun, L. Uncertainty in the prediction of precipitation changes in the middle and lower reaches of the Yangtze River under the RCP8.5 scenario. J. Univ. Sci. Technol. China 2020, 50, 1003–1012. [Google Scholar]
Figure 1. The source region of the Yangtze River.
Water 15 01612 g001
Figure 2. Water quality prediction method flow chart.
Water 15 01612 g002
Figure 3. Comparison of periodic and validation period determination coefficients for the source region of the Yangtze River rate. (a) is the rate periodic volume; (b) is the validation period volume.
Water 15 01612 g003
Figure 4. Analysis on inter-annual variation of water quality of typical wetlands in the source region of the Yangtze River.
Water 15 01612 g004
Figure 5. Analysis on annual variation of water quality of typical wetlands in the source region of the Yangtze River. (a) changes in CODMn, DO, and temperature of typical wetlands during the year; (b) changes in ammonia nitrogen, TN, TP, and conductivity of typical wetlands during the year.
Water 15 01612 g005
Figure 6. Trends in chemical and physical parameters in wetland water from 2022 to 2100 under three RCP scenarios; (a) CODMn (mg/L); (b) NH3-N (mg/L); (c) DO (mg/L); (d) TN (mg/L); (e) TP (mg/L); (f) Temperature (°C); (g) Conductivity (mS/m).
Water 15 01612 g006
Table 1. Wetlands in the source region of the Yangtze River were chosen for continuous observation.
Serial NumberMonitoring PointsLongitudeLatitudeElevation
Point 1Wetland at 30,846 km of provincial highway96°32.962′33°12.426′4235 m
Point 2Longbao Lake Wetland91°19.378′33°33.672′4216 m
Point 3Batang River Wetland Park97°14.004′32°58.94620323500 m
Point 4Wetland 1 on the way from Longbao town to Zhiduo96°10.876′33°24.006′4489 m
Point 5Longbao Lake Zhiduo wetland 293°46.475′33°76.500′4325 m
Point 6Wetland 1 on the way from qumalai to unfrozen spring95°32.950′34°30.709′4342 m
Point 7Wetland 2 on the way from qumalai to unfrozen spring94°25.610′35°00.963′4363 m
Point 8Wetland 3 on the way from qumalai to unfrozen spring94°05.155′35°03.776′4515 m
Point 9Wetland on the way from Yanshiping to Tuotuo River92°03.782′34°38.346′4692 m
Table 2. Environmental quality standards for surface water (units of mg/L).
ClassifyClass IClass IIClass IIIClass IVClass V
Dissolved oxygen≤7.5≤6≤5≤3≤2
Ammonia nitrogen≤0.15≤0.5≤1.0≤1.5≤2.0
Total nitrogen≤0.2≤0.5≤1.0≤1.5≤2.0
Total phosphorus≤0.02≤0.1≤0.2≤0.3≤0.4
Potassium permanganate index≤2≤4≤6≤10≤15
Table 3. Sensitivity analysis of parameters of SWAT model.
Parameter NameSensitive Value
ALPHA-BF
(Baseflow attenuation coefficient)
0.369
GWQMN
(Shallow aquifer water storage threshold)
0.272
ESCO
(Soil evaporation compensation factor)
0.101
SOL-K
(Saturated water conductivity of soil layer)
0.064
REVAPMN
(Shallow groundwater re-evaporation coefficient)
0.059
CH-K2
(Effective hydraulic conductivity of the main riverbed)
0.032
SOL-AWC
(Effective water capacity of soil layer)
0.030
CN2
(SCS runoff curve number)
0.022
Table 4. SWAT model parameter calibration range and final result.
Parameter NameRate RangeRate Constant Value
ALPHA-BF0.2–10.79
GWQMN0–50001564.7
ESCO0.76–0.780.76
SOL-K10–8041
REVAPMN0–500430
CH-K2110–125115
SOL-AWC0–0.250.21
CN235–9062
Table 5. The basic information about 21 CMIP5 global climate model.
ModelResearch InstitutionResolution
Beijng Climate Center Climate System Model version 1 (BCC-CSM1-1)BBC, China Meteorological Administration, China128 × 64
Bejing Normal University Earth System Model (BNU-ESM)The College of Global Change and Earth System Science (GCESS), BNU, China128 × 64
Canadian Earth System Model version 2 (CanESM2)Canadian Centre for Climate Modelling and Analysis, Canada128 × 64
The Community Climate System Model version 4 (CCSM4)National Center for Atmospheric Research, USA288 × 192
Centre National de Recherches Meteorologiques Climate Model version 5 (CNRM-CM5)CNRM/Centre Europeen de Recherche et Formation Avancees en Calcul Scientifque, France256 × 128
Commonwealth Scientific and Industrial Research Organization Mark Climate Model version 3.6 (CSIRO-MK3-6-0)CSIRO in collaboration with Queensland Climate Change Centre of Excellence, Australia192 × 96
Flexible Global Ocean - Atmosphere-Land System Model-grid version 2 (FGOALS-g2)State Key Laboratory of Numerical Modeling for Atmospheric Sciences and Geophysical Fluid Dynamics, Institute of Atmospheric Physics, Chinese Academy of Sciences, and Tsinghua University, China128 × 60
The First Institution of Oceanography Earth System Model (FIO-ESM)FIO, State Oceanic Administration (SOA), Qingdao, China128 × 64
Geophysical Fluid Dynamics Laboratory Climate Model version 3 (GFDL-CM3)GFDL, National Oceanic and Atmospheric Administration. USA144 × 90
Geophysical Fluid Dynamics Laboratory Earth System Model version 2 with Generalized Ocean Layer Dynamics (GOLD) code base (GFDL-ESM2G)GFDL, National Oceanic and Atmospheric Administration, USA144 × 90
Geophysical Fluid Dynamics Laboratory Earth System Model version 2 with Modular Ocean Model version 4.1 (GFDL-ESM2M)GFDL, National Oceanic and Atmospheric Administration, USA144 × 90
Goddard Institute for Space Studies Model E version 2 with Hycoml ocean model (GISS-E2-H)GISS, National Aeronautics and Space Administration, USA144 × 90
Goddard Institute for Space Studies Model E version 2 with Russell ocean model (GISS-E2-R)GISS, National Aeronautics and Space Administration, USA144 × 90
Met Office Hadley Centre Global Environment Models version 2 with the new atmosphere-ocean component model (HadGEM2-AO)Jointly with Met Office Hadley Centre and National Institute of Meteorological Research (NIMR). Korea Meteorological
Administration (KMA), Seoul, South Korea
192 × 145
Institut Pierre Simon Laplace Climate Model 5A-Low Resolution (IPSL-CM5A-LR)IPSL, France96 × 96
Model for Interdisciplinary Research on
-Climate- Earth System, version 5 (MIROC5)
Atmosphere and Ocean Research Institute (AORI), National Institute for Environmental Studies (NIES) Japan Agency for Marine-Earth Science and Technology, Kanagawa (JAMSTEC), Japan256 × 128
Model for Interdisciplinary Research on Climate- Earth System (MIROC-ESM)JAMSTEC, AORI, and NIES, Japan128 × 64
Atmospheric Chemistry Coupled Version of Model for Interdisciplinary Research on Climate- Earth System (MIROC-ESM-CHEM)JAMSTEC, AORI, and NIES, Japan128 × 64
Max-Planck Institute Earth System Model-Low Resolution (MPI-ESM-LR)MPI for Meteorology, Germany192 × 96
Meteorological Research Institute Coupled General Circulation Model version 3 (MRI-CGCM3)MRI, Japan320 × 160
The Norwegian Earth System Model version I with Intermediate Resolution (NorESM1-M)Norwegian Climate Centre, Norway144 × 96
Table 6. Water quality assessment results of typical wetlands in the source region of the Yangtze River by Bayesian method from 2016 to 2021.
YearsEvaluation Grade & p Value
Point 1Point 2Point 3Point 4Point 5Point 6Point 7Point 8Point 9
2016IIIIIIIIIIIIIIII
0.100.140.150.120.100.130.130.150.12
2017IIIIIIIIIII
0.130.140.140.160.160.140.150.130.14
2018IIIIIIIIIII
0.120.140.150.160.140.160.160.140.15
2019IIIIIIIIIIIIIIIII
0.150.140.130.120.120.130.130.130.06
2020IIIIIIIIIIII
0.160.140.150.130.160.130.140.150.16
2021IIIIIIIII
0.140.120.130.160.140.130.130.130.15
Table 7. Water quality evaluation results of surface water in the source region of the Yangtze River from 2016 to 2021 by Yao Zhiqi method.
Index201620172018201920202021
X1.211.130.961.561.110.92
Y0.960.860.920.940.420.43
P1.080.980.931.210.680.62
Note: Where X is the highest value of the ratio of each measured value to the standard value; where Y is the mean value of the ratio of each measured value to the standard value. When p value is smaller, the water quality is better.
Table 8. Linear relationship of chemical and physical parameters in wetland water under three RCPs scenarios from 2022 to 2100.
Parameters RCP2.6RCP4.5RCP8.5
(a)CODMnLinear relationshipy = 0.0177x − 21.918y = 0.0247x − 34.111y = 0.0515x − 87.604
R20.20920.51010.8784
(b)NH3-NLinear relationshipy = 0.0022x − 4.125y = 0.0074x − 14.532y = 0.0036x − 6.7464
R20.17370.56760.6613
(c)DOLinear relationshipy = − 0.0079x + 24.358y = −0.0071x + 22.331y = −0.0187x + 47.108
R20.27860.51430.7868
(d)TNLinear relationshipy = 0.0018x − 2.3438y = 0.0019x − 2.485y = 0.0034x − 5.702
R20.24710.55120.849
(e)TPLinear relationshipy = 0.0002x − 0.26y = 0.0002x − 0.3107y = 0.0005x − 0.8137
R20.24650.54840.8469
(f)TemperatureLinear relationshipy = 0.022x − 28.728y = 0.0133x − 11.45y = 0.0038x + 7.4801
R20.35260.59820.8182
(g)ConductivityLinear relationshipy = 0.0002x + 0.2857y = 0.0029x − 5.3411y = 0.0014x − 2.052
R20.02340.60820.713
Note: RCP2.6 represents the lowest greenhouse gas emissions and emission concentrations; RCP4.5 represents the decline in the use of some non-renewable fossil energy sources, such as coal, and the significant reduction in greenhouse gas emissions due to the use of clean energy; RCP8.5 is the highest greenhouse gas emission concentration without climate policy intervention.
Disclaimer/Publisher’s Note: The statements, opinions and data contained in all publications are solely those of the individual author(s) and contributor(s) and not of MDPI and/or the editor(s). MDPI and/or the editor(s) disclaim responsibility for any injury to people or property resulting from any ideas, methods, instructions or products referred to in the content.

