Article

Acid Mine Drainage Discrimination Using Very High Resolution Imagery Obtained by Unmanned Aerial Vehicle in a Stone Coal Mining Area

1
Northwest Engineering Corporation Limited, Power China Group, Xi’an 710065, China
2
Shaanxi Union Research Center of University and Enterprise for River and Lake Ecosystems Protection and Restoration, Xi’an 710065, China
3
Xi’an Key Laboratory of Clean Energy Digital Technology, Xi’an 710065, China
4
Shaanxi Province Water Conservancy Development Survey and Hanjiang to Weihe River Water Diversion Project Coordination Center, Xi’an 710004, China
5
School of Resources Engineering, Xi’an University of Architecture and Technology, Xi’an 710055, China
*
Authors to whom correspondence should be addressed.
Water 2023, 15(8), 1613; https://doi.org/10.3390/w15081613
Submission received: 28 March 2023 / Revised: 11 April 2023 / Accepted: 18 April 2023 / Published: 20 April 2023
(This article belongs to the Special Issue Mine and Water)

Abstract

:
Mining of mineral resources exposes various minerals to oxidizing environments, especially sulfide minerals, which are decomposed by water after oxidation and make the water in the mine area acidic. Acid mine drainage (AMD) from mining can pollute surrounding rivers and lakes, causing serious ecological problems. Compared with traditional field surveys, unmanned aerial vehicle (UAV) technology has advantages in terms of real-time imagery, security, and image accuracy. UAV technology can compensate for the shortcomings of traditional technology in mine environmental surveys and effectively improve the implementat ion efficiency of the work. UAV technology has gradually become one of the important ways of mine environmental monitoring. In this study, a UAV aerial photography system equipped with a Red, Green, Blue (RGB) camera collected very-high-resolution images of the stone coal mining area in Ziyang County, northwest China, and classified the very-high-resolution images by support vector machine (SVM), random forest (RF), and U-Net methods, and detected the distribution of five types of land cover, including AMD, roof, water, vegetation, and bare land. Finally, the accuracy of the recognition results was evaluated based on the land-cover map using the confusion matrix. The recognition accuracy of AMD using the U-Net method is significantly better than that of SVM and RF traditional machine-learning methods. The results showed that a UAV aerial photography system equipped with an RGB camera and the depth neural network algorithm could be combined for the competent detection of mine environmental problems.

1. Introduction

Acid mine drainage (AMD) is an environmental phenomenon caused by mining, which may be related to mining activities that artificially expose a large amount of sulfide minerals to the weathering conditions of the earth’s surface and form low-pH water under the chemical reaction process involving oxygen, water, and microorganisms. AMD has been defined in previous studies as the process of oxidation of sulfide minerals to form low-pH drainage water [1]. This acidic water with toxic elements could significantly influence the health of natural ecosystems and the survival of aquatic organisms. The main areas affected by AMD are generally rivers, lakes, estuaries, and coastal waters. The formation of AMD always occurs during a long period taking from years to decades, and its environmental impact could last for centuries [2]. Therefore, this environmental problem requires long-term monitoring and sustained remediation. In order to monitor the spatial distribution and intensity of AMD pollution, some efforts have been made, mainly with systematic sampling and laboratory analysis of surface water and sediments. Then, interpolation results are scattered to draw pollution distribution and evaluation maps [3,4]. However, this method is suitable for scientific research and detailed investigation, which require high test results. It is time-consuming, expensive, and covers limited spatial scale for the daily monitoring work of local environmental regulatory authorities.
In many metallic and coal mines of the United States, China, and Russia, the oxidative breakdown of iron-containing sulfide minerals releases ferrous iron and the energy that microbes depend on for survival [5,6,7]. The ferrous iron continues to be oxidized to ferric iron and produces more sulfuric acid [8,9]. The solubility of ferric iron at near-neutral pH is low, at which point iron hydroxide solids are rapidly formed. Iron hydroxide precipitation can be regarded as evidence for the presence of AMD [2]. It also has the characteristic of adsorbing toxic metals from AMD. The alteration of ferrous iron can produce a series of secondary minerals such as goethite, hematite, and jarosite, which usually appear orange [10]. The pH value plays a crucial role in secondary mineral precipitation, where goethite forms at a pH of between 2 and 12, and hematite forms at a pH of between 7 and 9 [11,12]. The jarosite usually produces at a low pH value (between 1 and 3) [13]. A group of secondary mineral products appears orange to red in color, according to their high concentrations of ferric iron. This characteristic has been previously known as a gossan, a significant remote-sensing detection marker for ore exploration [14,15,16,17].
Previous studies have proved that remote-sensing technology facilitates many environmental monitoring efforts [18,19,20]. Multispectral and hyperspectral sensors have been widely used due to the obvious reflectance variation of minerals such as hematite and goethite in the visible to short-wave infrared region of the electromagnetic spectrum [21,22]. These studies are based on a wide range of spatial scales, which are determined by data-collection platforms including satellite remote-sensing technology for water source protection [23,24]. The indirect estimation of pH values of mine waste [25,26,27,28] and iron oxide precipitation on the riverbed mainly used aerial remote sensing [29]. Other studies have collected AMD minerals, performed spectroscopic tests indoors, and established a reference spectroscopic library of iron minerals [30,31]. A multi-rotor UAV carrying a hyperspectral sensor supplies images with both high spatial and high spectral resolution that is better than that of most satellite data [32]. However, hyperspectral and multispectral sensors are not suitable for routine monitoring due to their expensiveness and scarcity. At present, a multi-rotor UAV system with a Red, Green, Blue (RGB) color digital camera has been rapidly developed due to its low price and flexible application direction, and is widely used in land resources and in geological, environmental, and other industrial mapping. The application research of a UAV system with an RGB color digital camera in acid drainage investigation in mines has not been comprehensively discussed yet.
The purpose of this study is to collect aerial remote-sensing data from stone coal mines in Qinling Mountains by using a UAV system with an RGB color digital camera. Three methods, including support vector machine (SVM), random forest (RF), and U-Net methods, were used for acid mine drainage recognition and surface classification mapping. The results of the three methods are comparatively discussed and an efficient, economical method for acid mine drainage monitoring was developed. This study was proposed based on actual mine environmental investigation work, and provided a simple, inexpensive, and efficient environmental problem detection approach for the environmental authorities of local governments and mining companies.

2. Materials and Methods
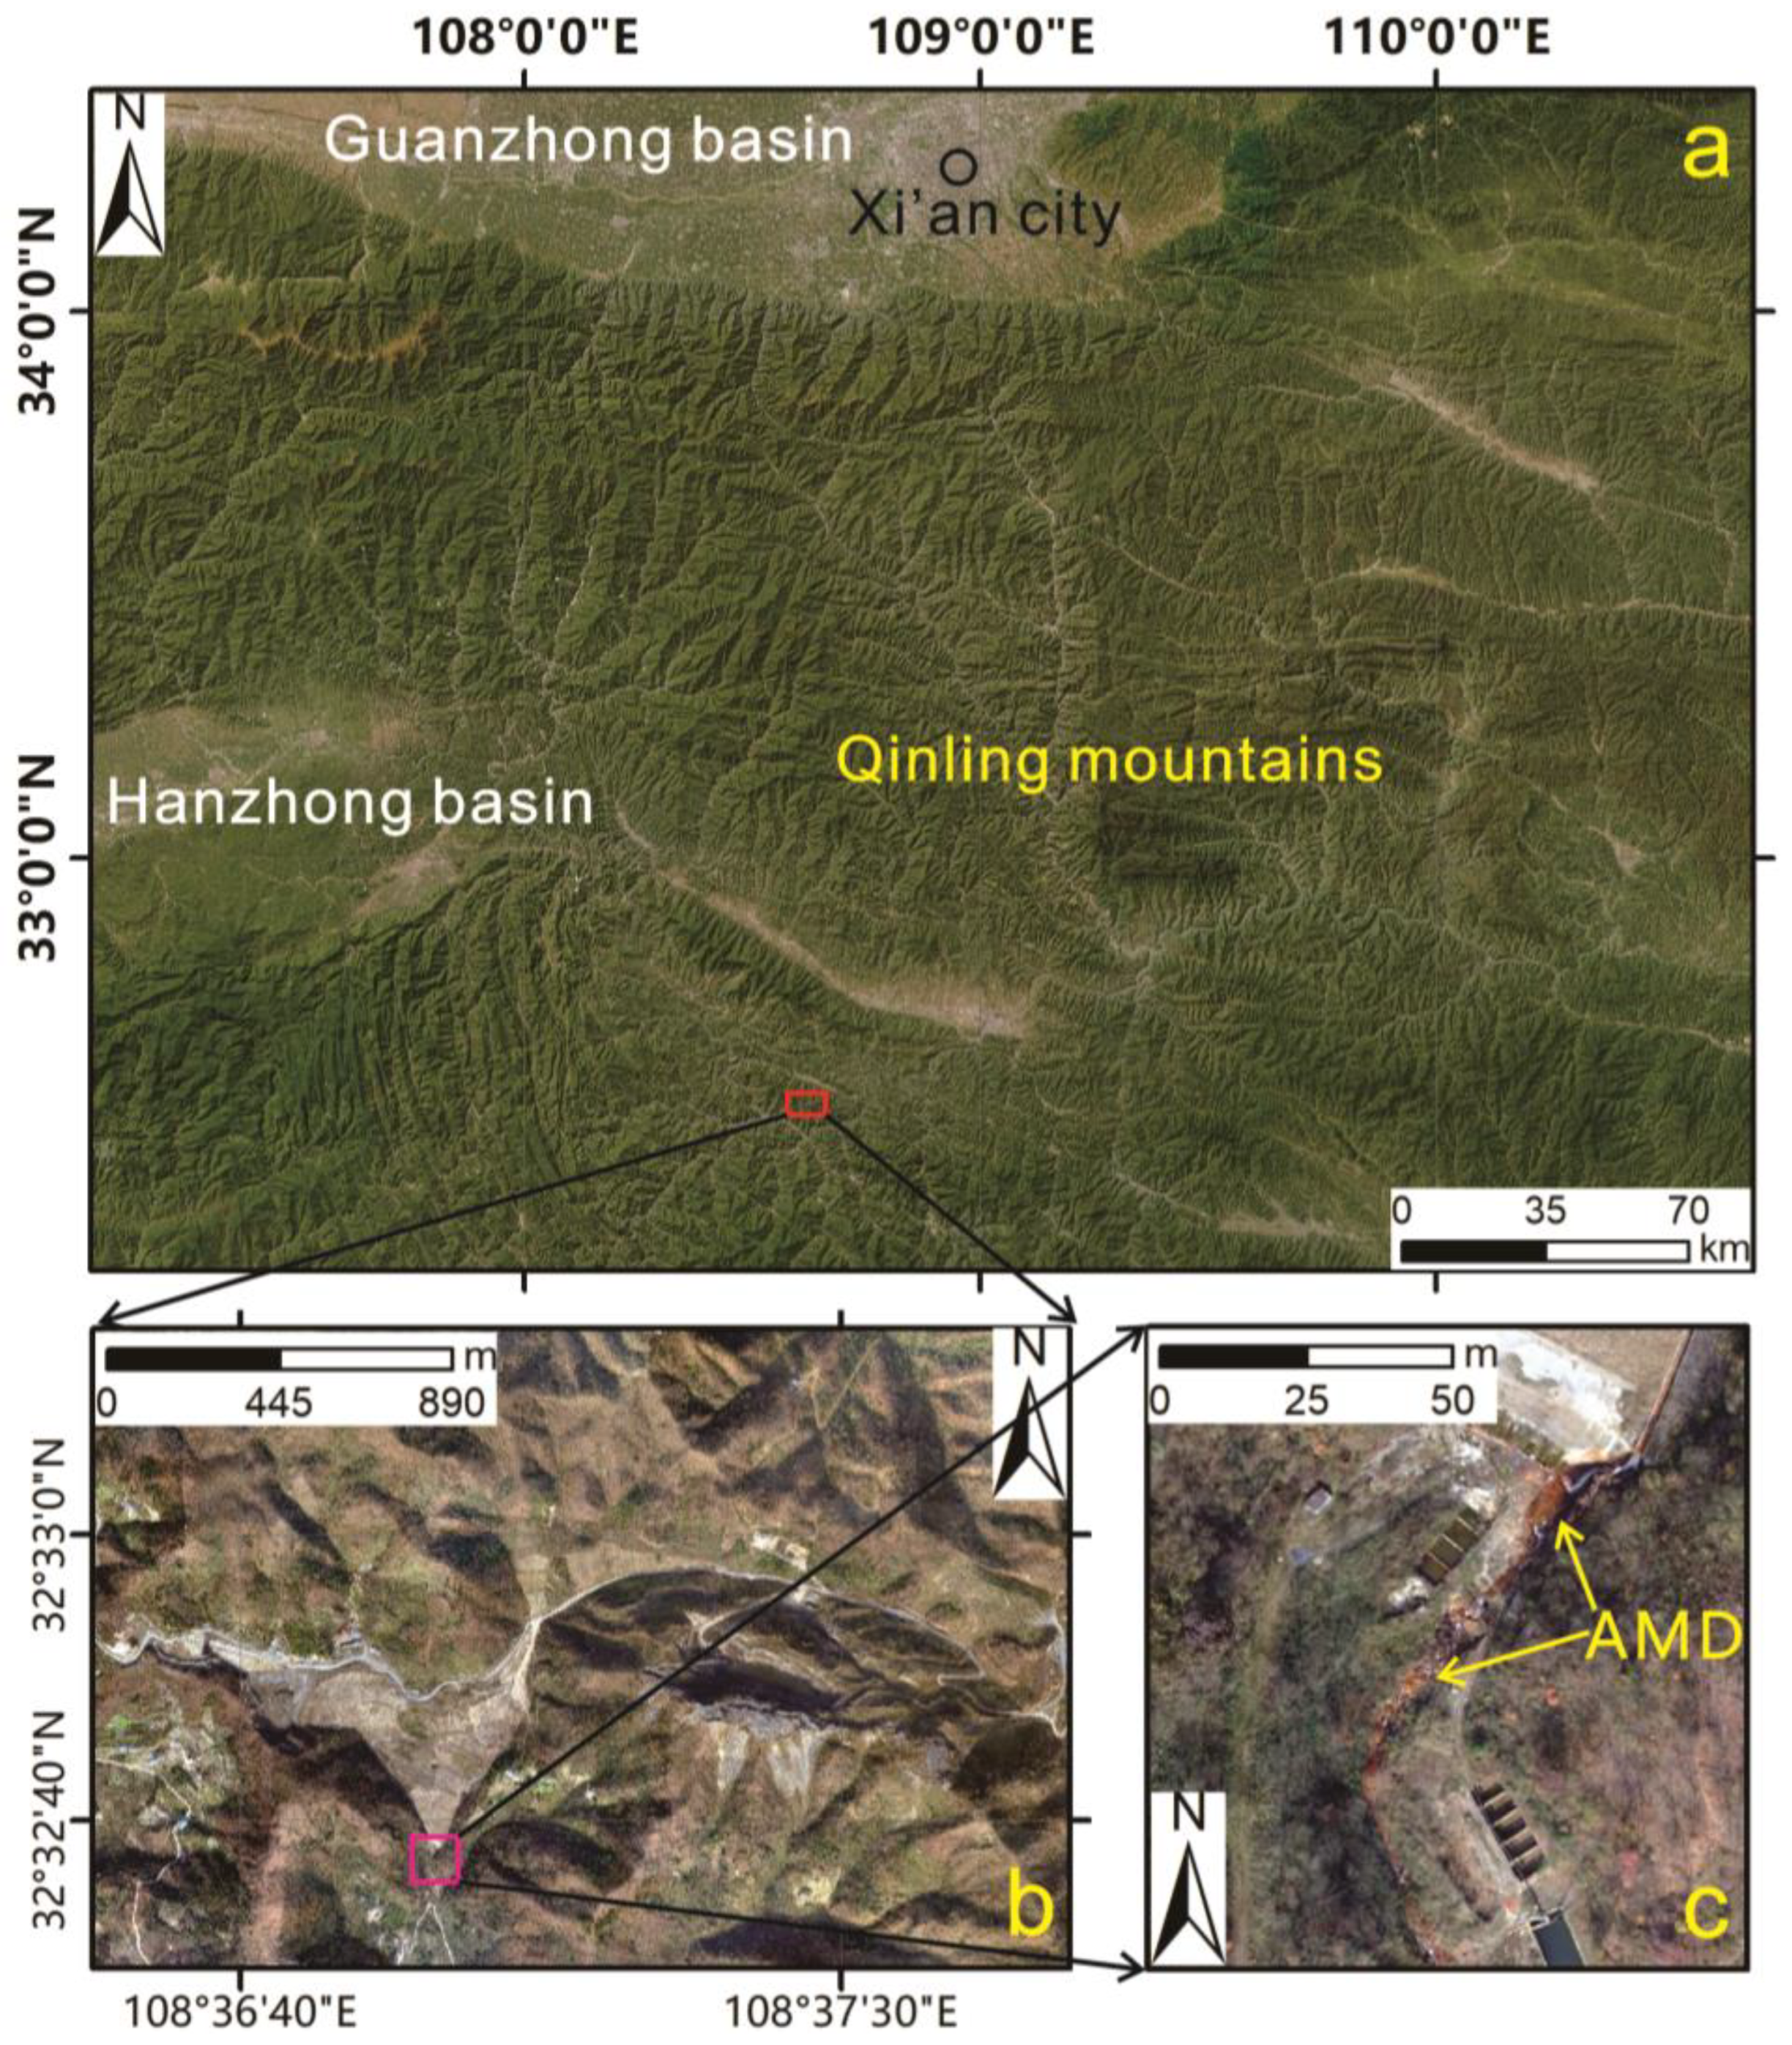
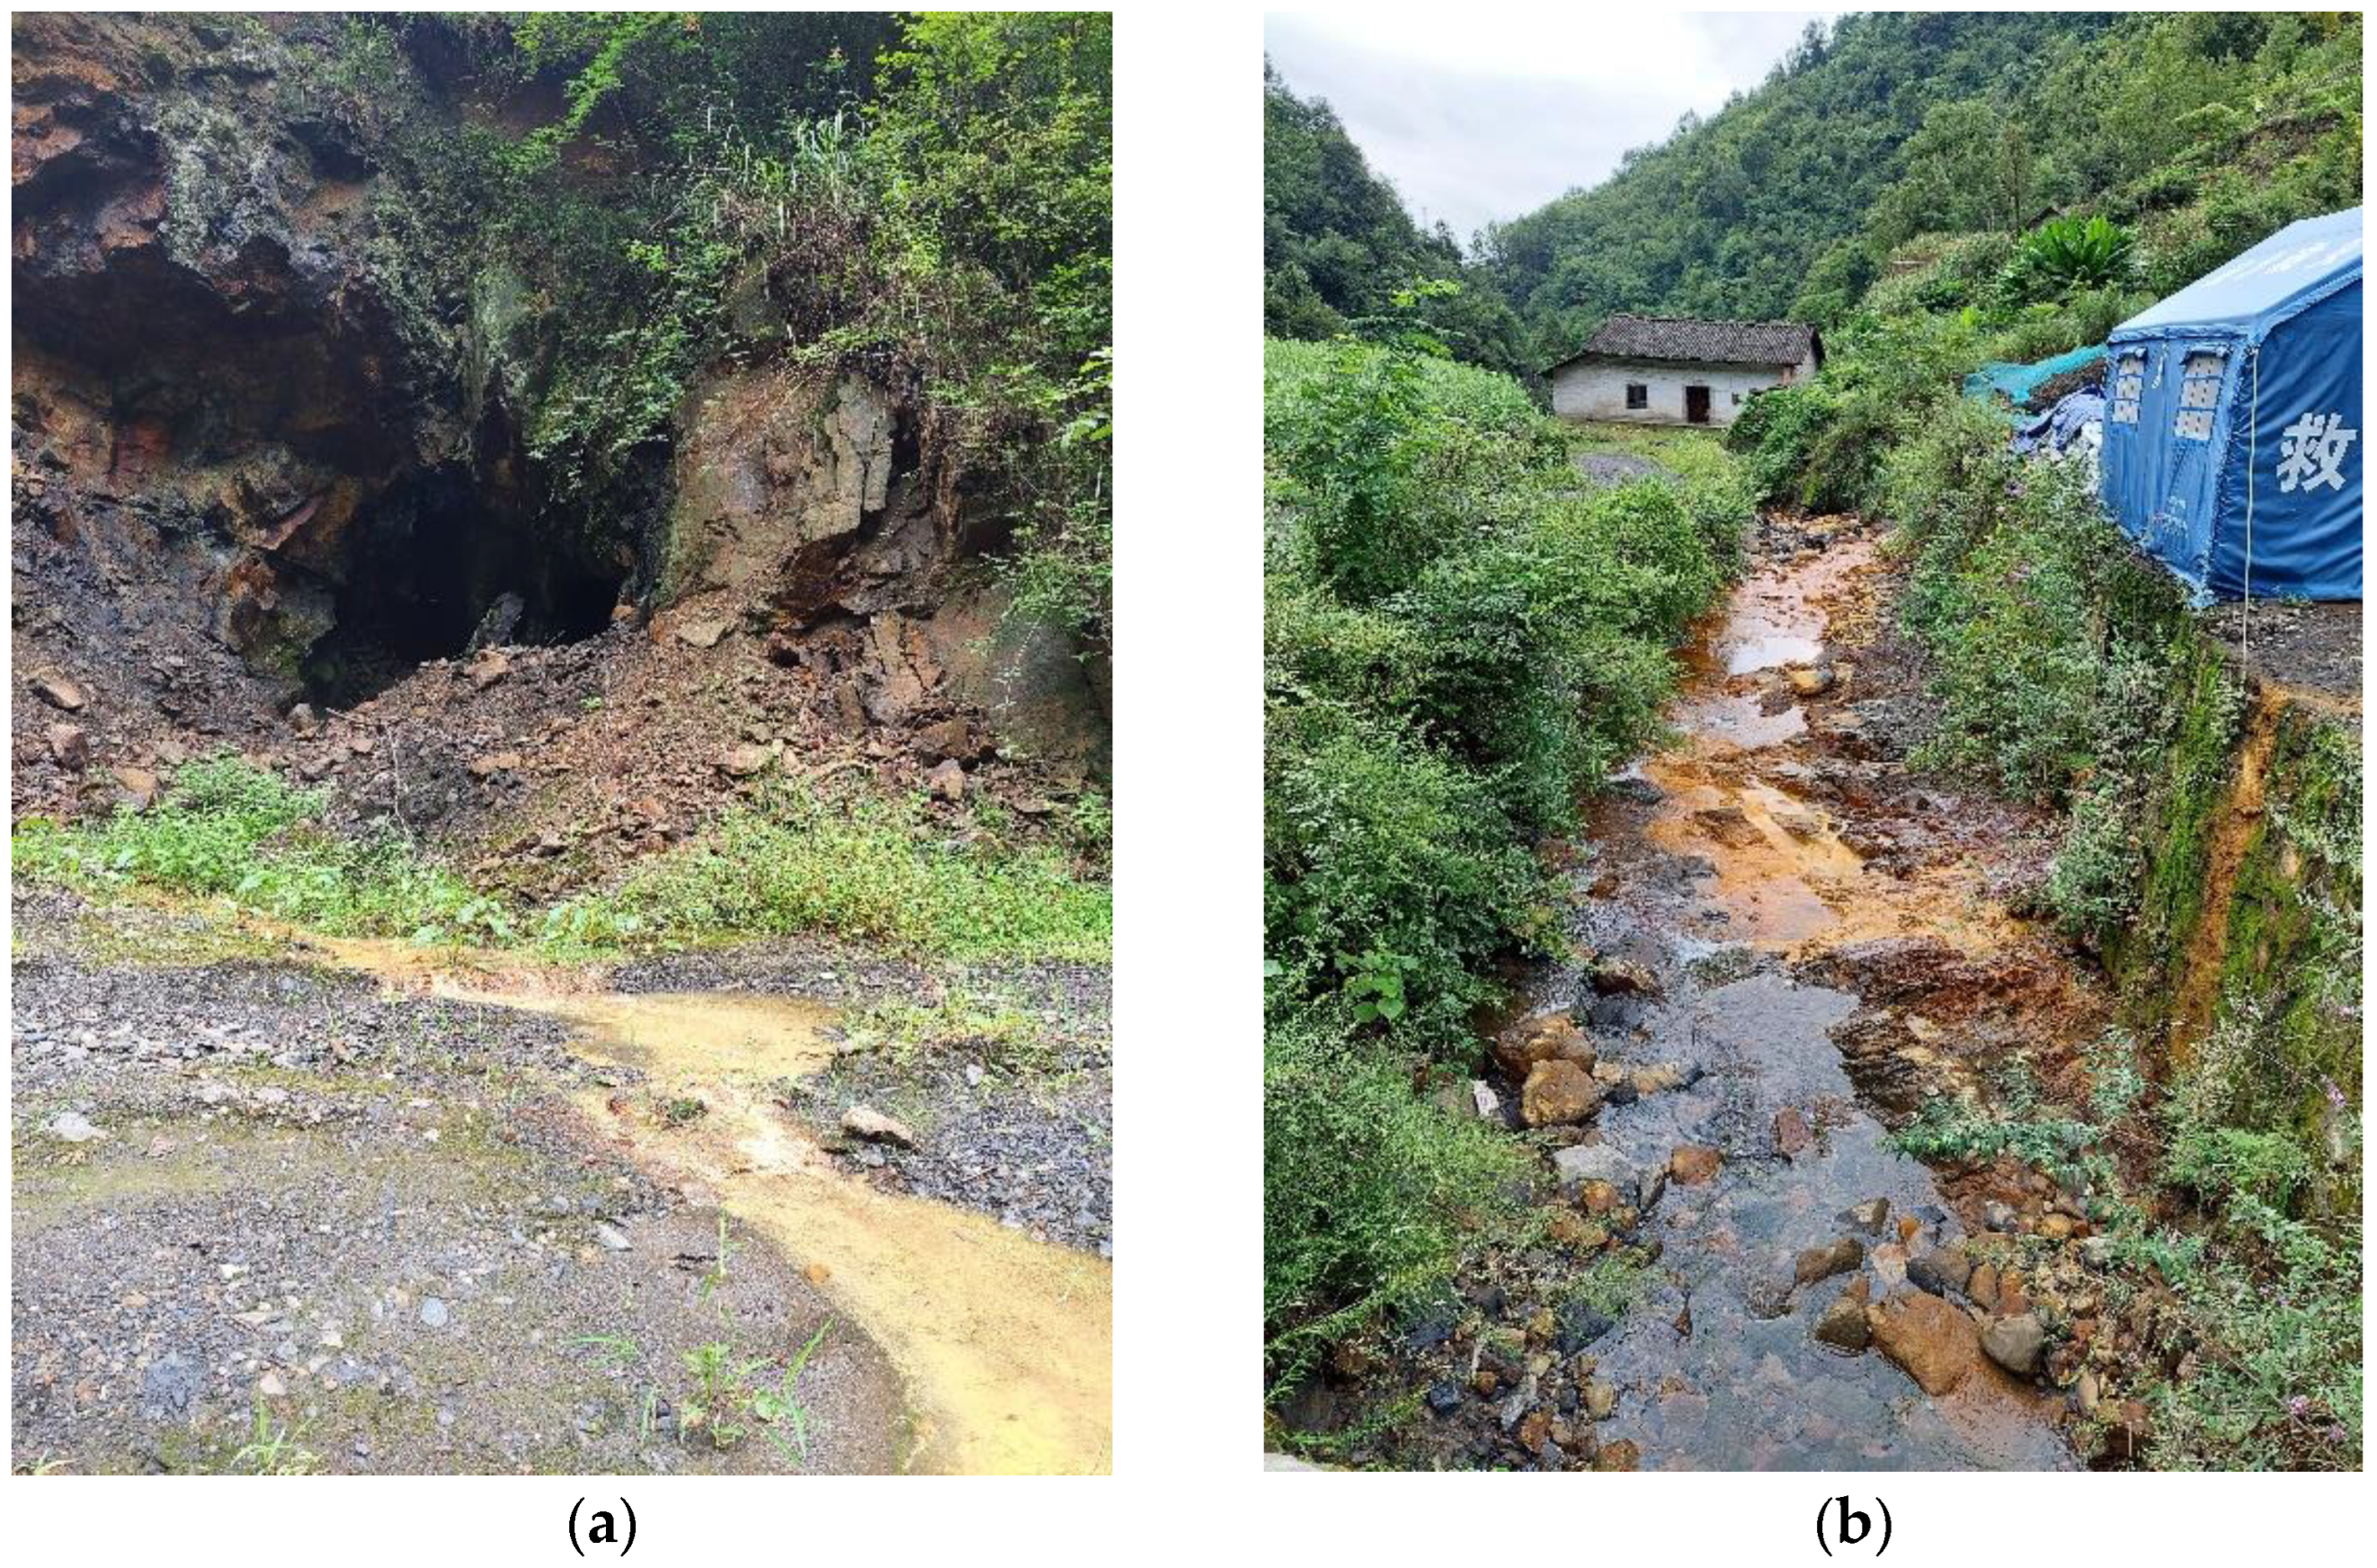
2.1. Study Area

The study area is located in the stone coal mining area of Qinling Mountains in Ziyang County, Shaanxi Province. The main ore-bearing strata in the mining area are the Upper Ordovician Lower Silurian Banjiuguan Formation, and the main lithology is a set of black carbonaceous slate with pyrite-rich trachyte [33]. The UAV imagery covered a relatively larger mining company named the Minghua Mining Industry Co., Ltd. The Minghua Mining Industry Co., Ltd. was established in the year of 2010 and produces 30,000 to 50,000 tons of ore annually. This company was shut down by the local government in 2017 due to its serious environmental problems. After nearly 8 years of exploitation in the mining area, a large amount of gangue piles had been stacked on the slope and in the valley, leaving a huge open pit. Under the effect of rainfall infiltration, oxidation occurs and a large amount of acid mine drainage (AMD) was directly discharged into the Xiaomi stream downstream from the mining area, forming an orange-colored river bed several kilometers long (Figure 1 and Figure 2). Xiaomi stream flows downward and inward to the Hanjiang River, bringing huge contamination danger to the regional water environment. At the same time, the Hanjiang River is an important water source for the South to North Water Transfer Project. The acid drainage of the stone coal mines endangers the water source safety of the water transfer project.

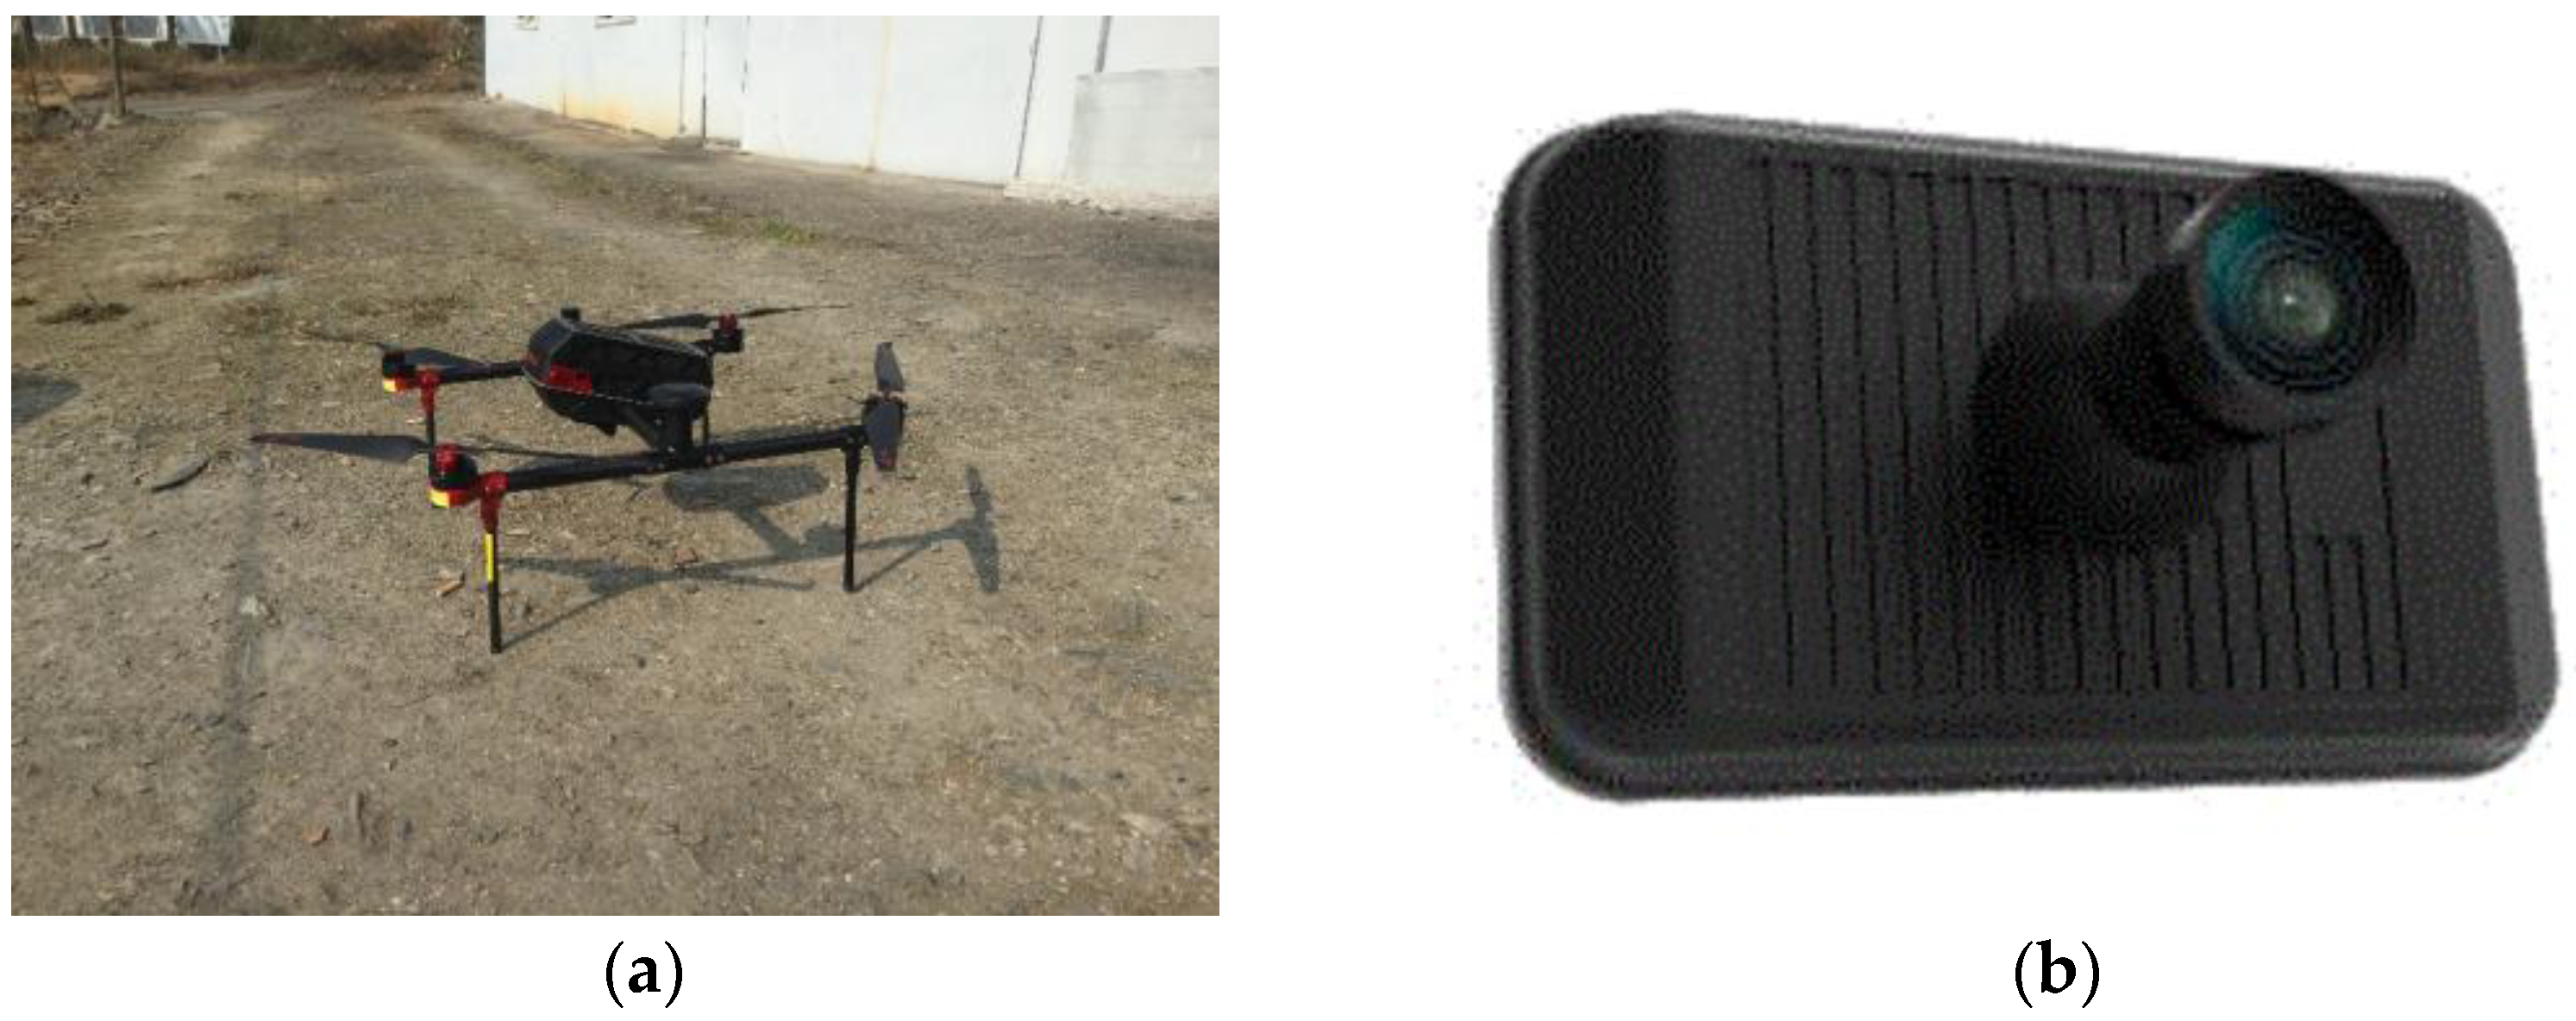
2.2. The UAV Aerial Photography System

The Feima D2000 UAV system (Shenzhen Feima Robotics Technology Co., Ltd., Shenzhen, China), which was used for image acquisition in this study, is a light, long-endurance, multi-rotor UAV system that can simultaneously meet the requirements of high-precision mapping, remote sensing, and video shooting (Figure 3a). An aerial survey module, tilt module, visible video module, thermal infrared video module, and thermal infrared remote-sensing module could optionally be carried and could obtain diversified data. The standard takeoff weight of the system is 2.8 kg, the standard load is 200 g, and the endurance is 74 min [34]. The whole system can be integrated into a work box after modular decomposition, which is convenient for carrying and transportation. Feima D2000 is equipped with high-precision differential GNSS card office, and the network RTK, PPK, and their fusion solution services are provided as standard [35]. This system is competent for 1:500 mapping without control points, supports high-precision POS-assisted aerial triangulation, and realizes phase-control-free application. The image size of the SONY a-6000 digital camera (Sony Group Corporation, Tokyo, Japan) equipped with Feima D2000 aerial survey system is 6000 × 4000 pixels and the lens focal length is 25 mm (Figure 3b) [36].
The flight time was selected from 12:00 to 14:00 on 4 December 2020, which is the best time for solar illumination. All aerial images were obtained through two flights. The flight adopts the ground-simulating flight mode, with a relative height of 200 m from the ground. The flight parameters were defined off the shelf (Table 1) and the preset flight range and route were imported into the remote controller before the flight.
In Table 2, the well-known UAV systems used in the AMD detection of mines in the recently published literature are listed. The UAV system used in this study has advantages of light weight and long duration.

2.3. Pre-Processing

This study used Context Capture software version 10.20.0.4117 (Bentley Engineering Software System Co., Ltd., Exton, PA, USA) to compute aerial triangulation of UAV aerial data. The software automatically generates digital surface model (DSM) by matching the same image points on the stereo relative and calculates the elevation of the ground points using the collinear equation. True digital orthophoto map (TDOM) is a resampling based on DSM to correct the geometric distortion of the original image. Since DSM contains elevation information of buildings, bridges, trees, and other ground objects, the resulting image not only corrects the terrain, but also corrects ground objects such as surface buildings, maintains the vertical angle of the surface landscape, and resolves the difficulties of splicing large-scale orthophoto images [37]. The geometric resolution of the UAV orthophoto images collected in this study is 6 cm × 6 cm. The map projection used CGCS2000 ellipsoidal and Gauss Kruger projection (Ministry of Natural Resources, Beijing, China). The true-color image contains three channels of red, green, and blue.

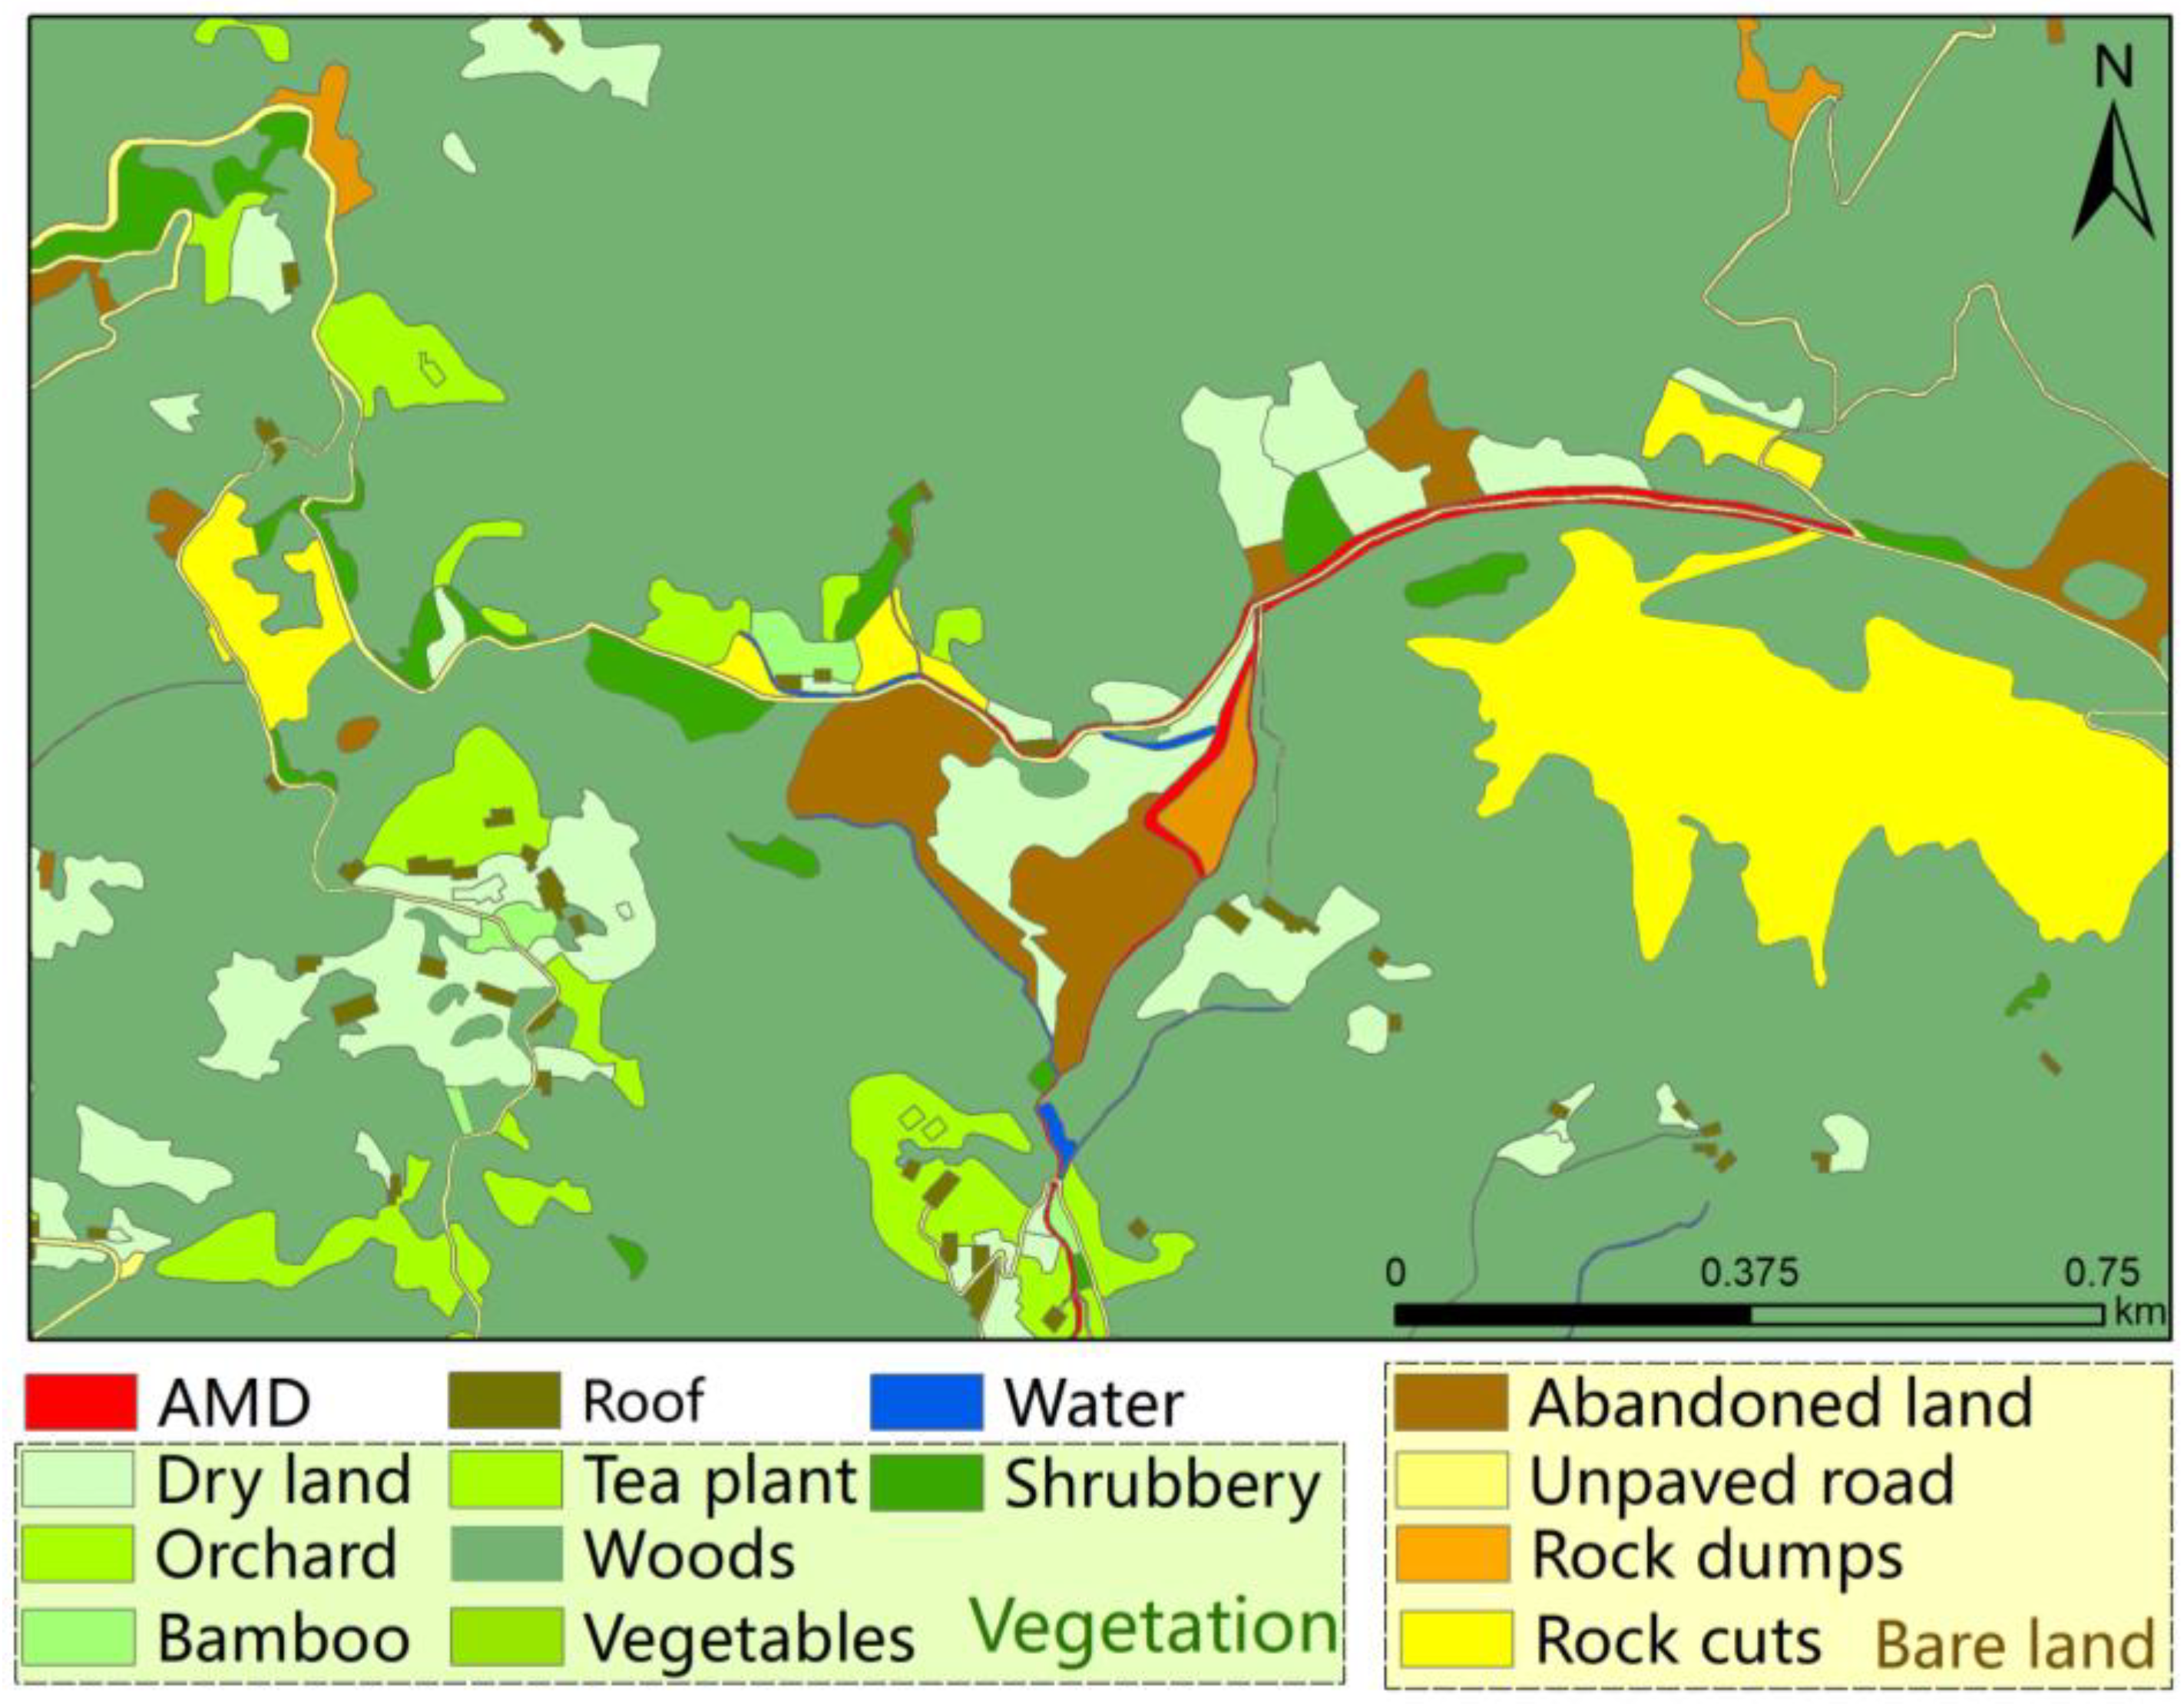
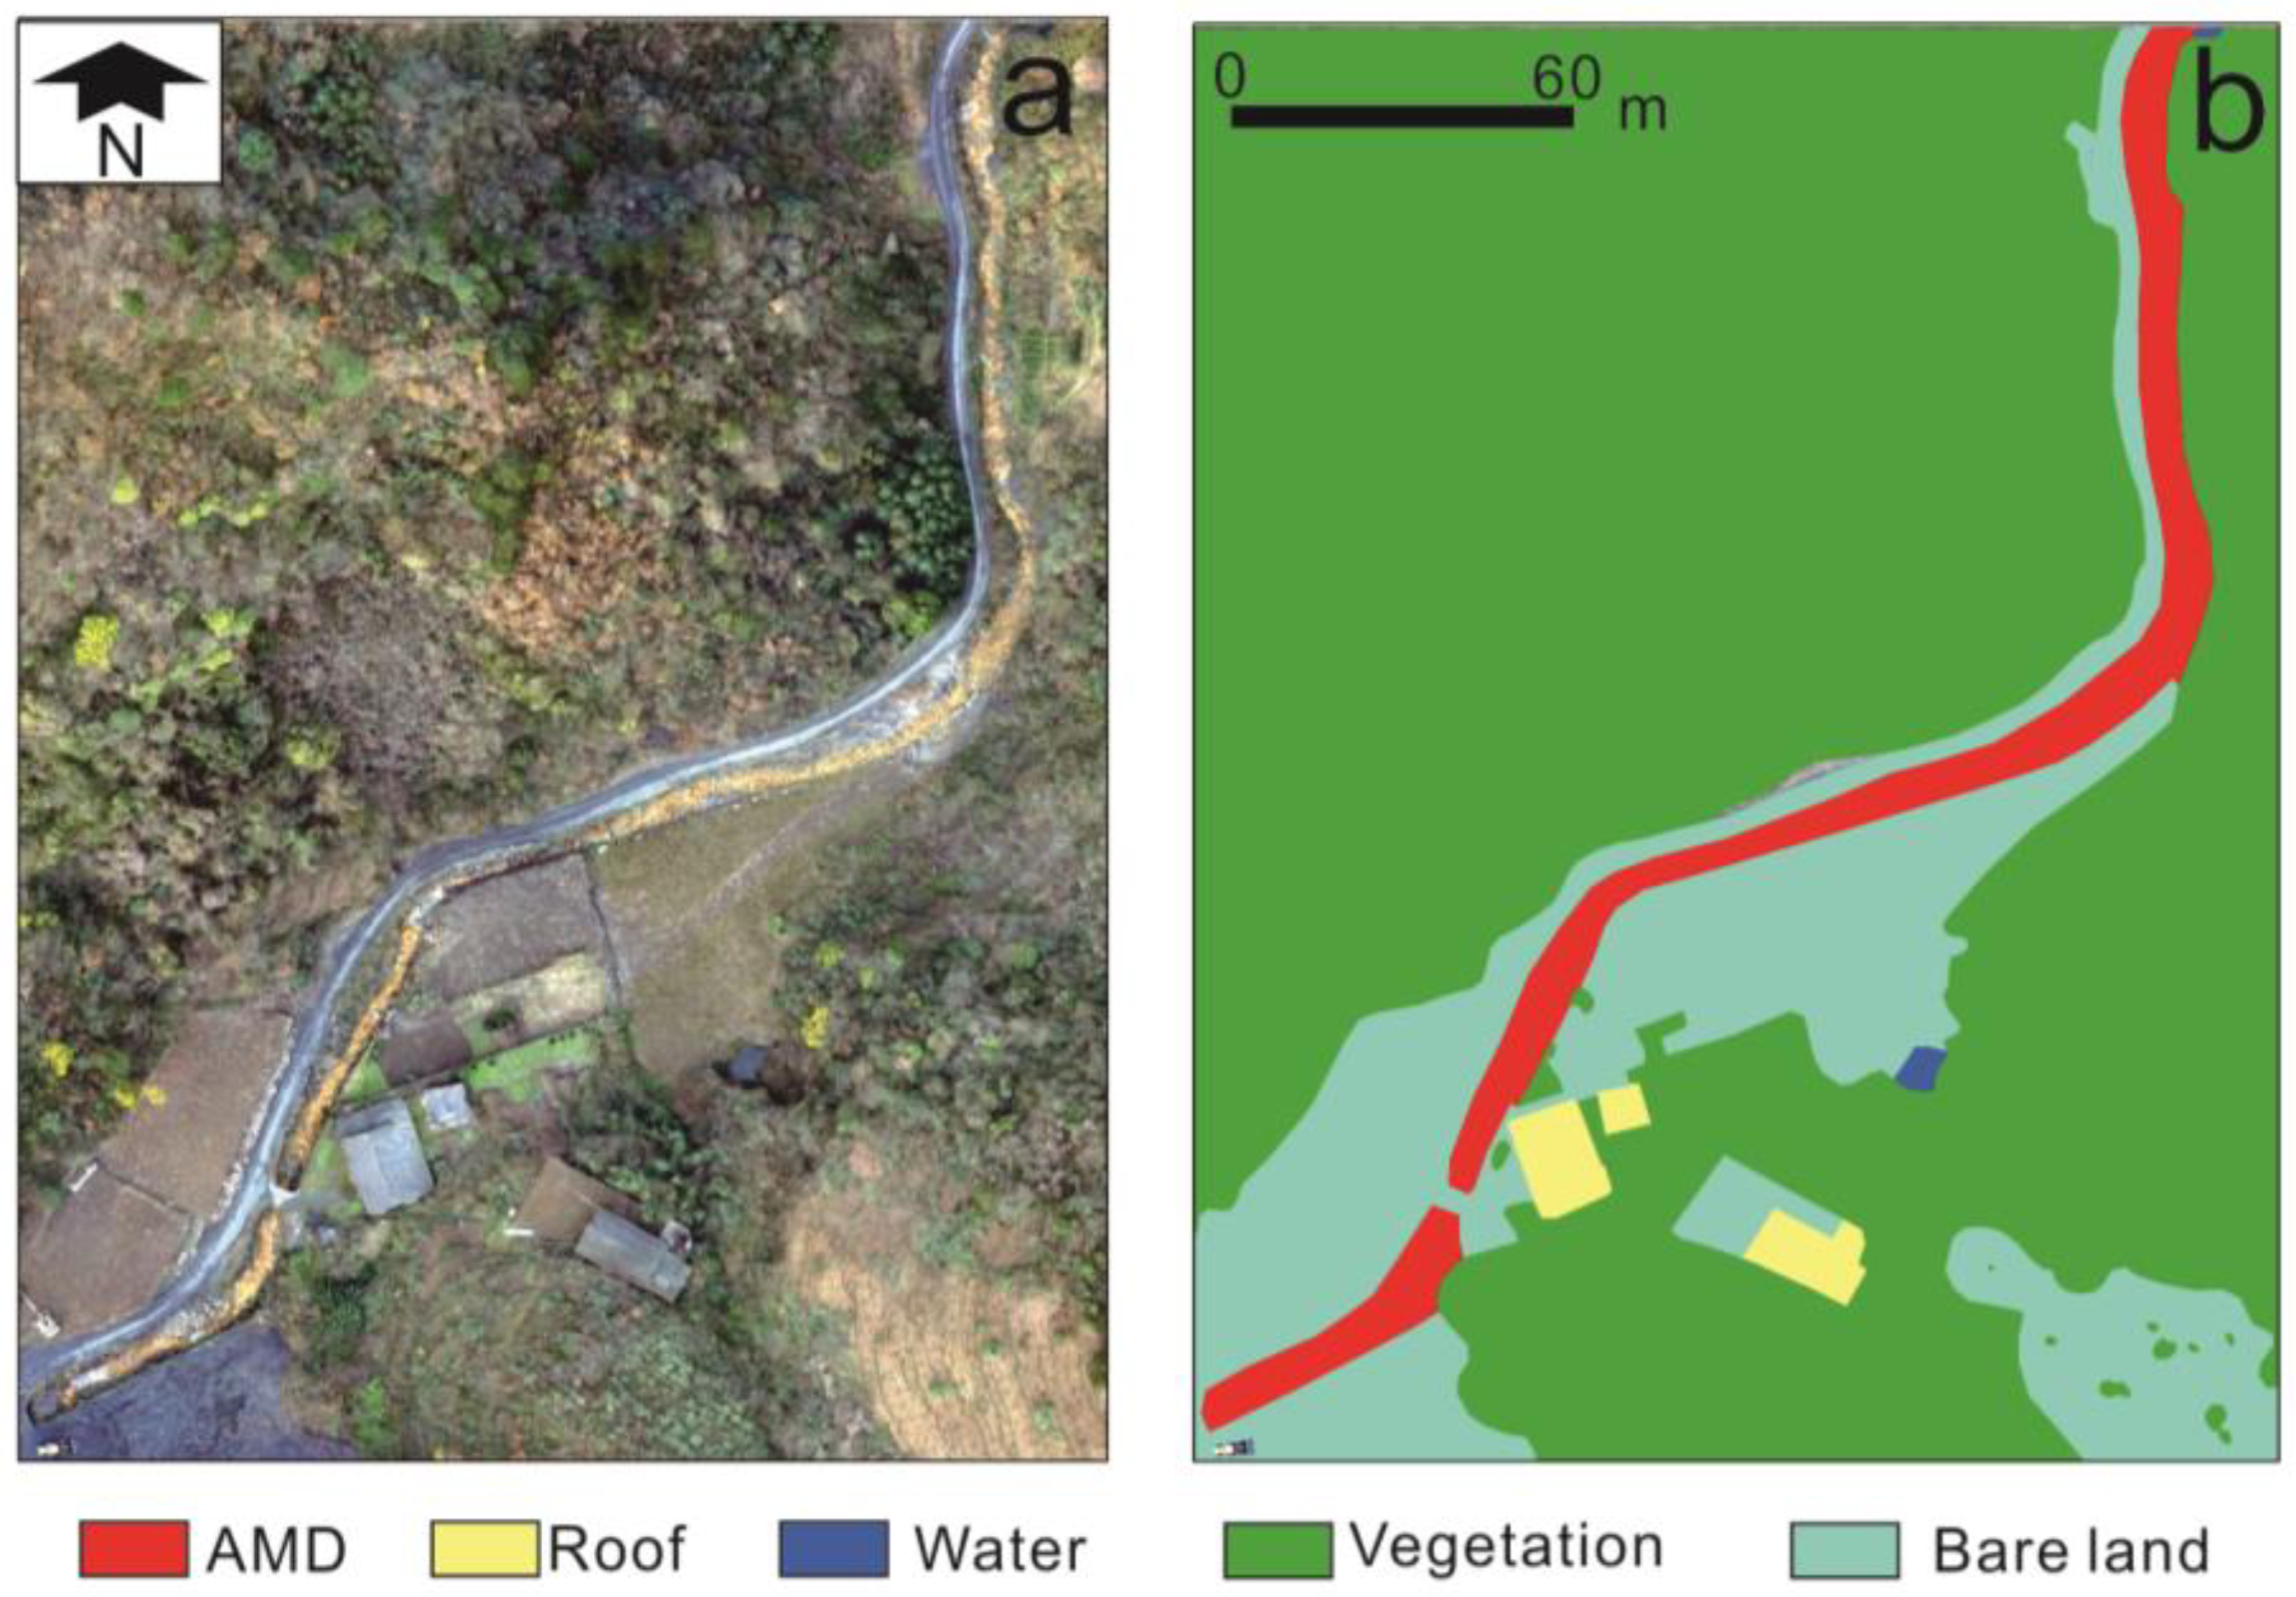
2.4. Ground Truth Data

This study collected the latest land-use map of the study area from Xi’an Geological Survey Center of China Geological Survey, and combined similar land types according to recent land cover. Since dry land, tea plant, shrubbery, orchard, woods, bamboo, and vegetables are all vegetation types, and abandoned land, unpaved road, rock dumps, and rock cuts are bare-ground types, a total of five land-cover types were displayed. The five surface-cover types of mine acid drainage, water body, roof, vegetation, and bare land are most accurately classified as the ground truth data (Figure 4).

2.5. Methods

2.5.1. Selection of Study Samples

The learning image is an aerial image taken by an unmanned aerial vehicle in the vicinity of the study area, covering an area of 87,680 km2 (Figure 5a). The learning image contains five types of land cover: AMD, roof, water, vegetation, and bare land (Figure 5b). These learning labels are interpreted by human visual interpretation according to the land-use-type map of the mining area. Because the roads in the mining area are non-paved and the surface is consistent with the bare-land type, the bare-land type includes traditional bare land and the roads in the mining area.

2.5.2. Support Vector Machine

This study used Support Vector Machine (SVM) to extract landslide information. This method is a machine-learning model algorithm based on statistical theory. This method uses optimization problem solving to determine the optimal classification hyperplane in the high-dimensional feature space of the data, which can deal with complex data classification problems [38,39,40]. SVM classifies by mapping the set of low-dimensional space vectors to the high-dimensional space vectors, and then constructs a kernel function, which minimizes the classification error and maximizes the generalization ability of the classifier [40].
The SVM optimal classification function expression is as follows:
S x = s i g n i = 1 n a i y i K x i , x j + b
In the formula, ai is a non-negative Lagrange multiplier; yi is the category; K(xi, xj) are kernel functions; b is the classification threshold.
At present, there are four kinds of kernels commonly used in SVM, mainly Sigmoid kernels, Polynomial kernels, Radial basis functions (RBF), and Linear kernels. In this study, the polynomial is 2nd-order polynomial and all the expressions of the core functions are as follows:
Linear kernel function is:
K x i , x j = x i T x j
Polynomial kernel function is:
K x i , x j = g x i T x j + r c
Radial basis function is:
K x i , x j = e x p g x i x j 2 , g > 0
Sigmoid kernel is:
K x i , x j = tanh g x i T x j + r
where, g > 0; c is a natural number, c = 2, r is hyperparameter.

2.5.3. Random Forest
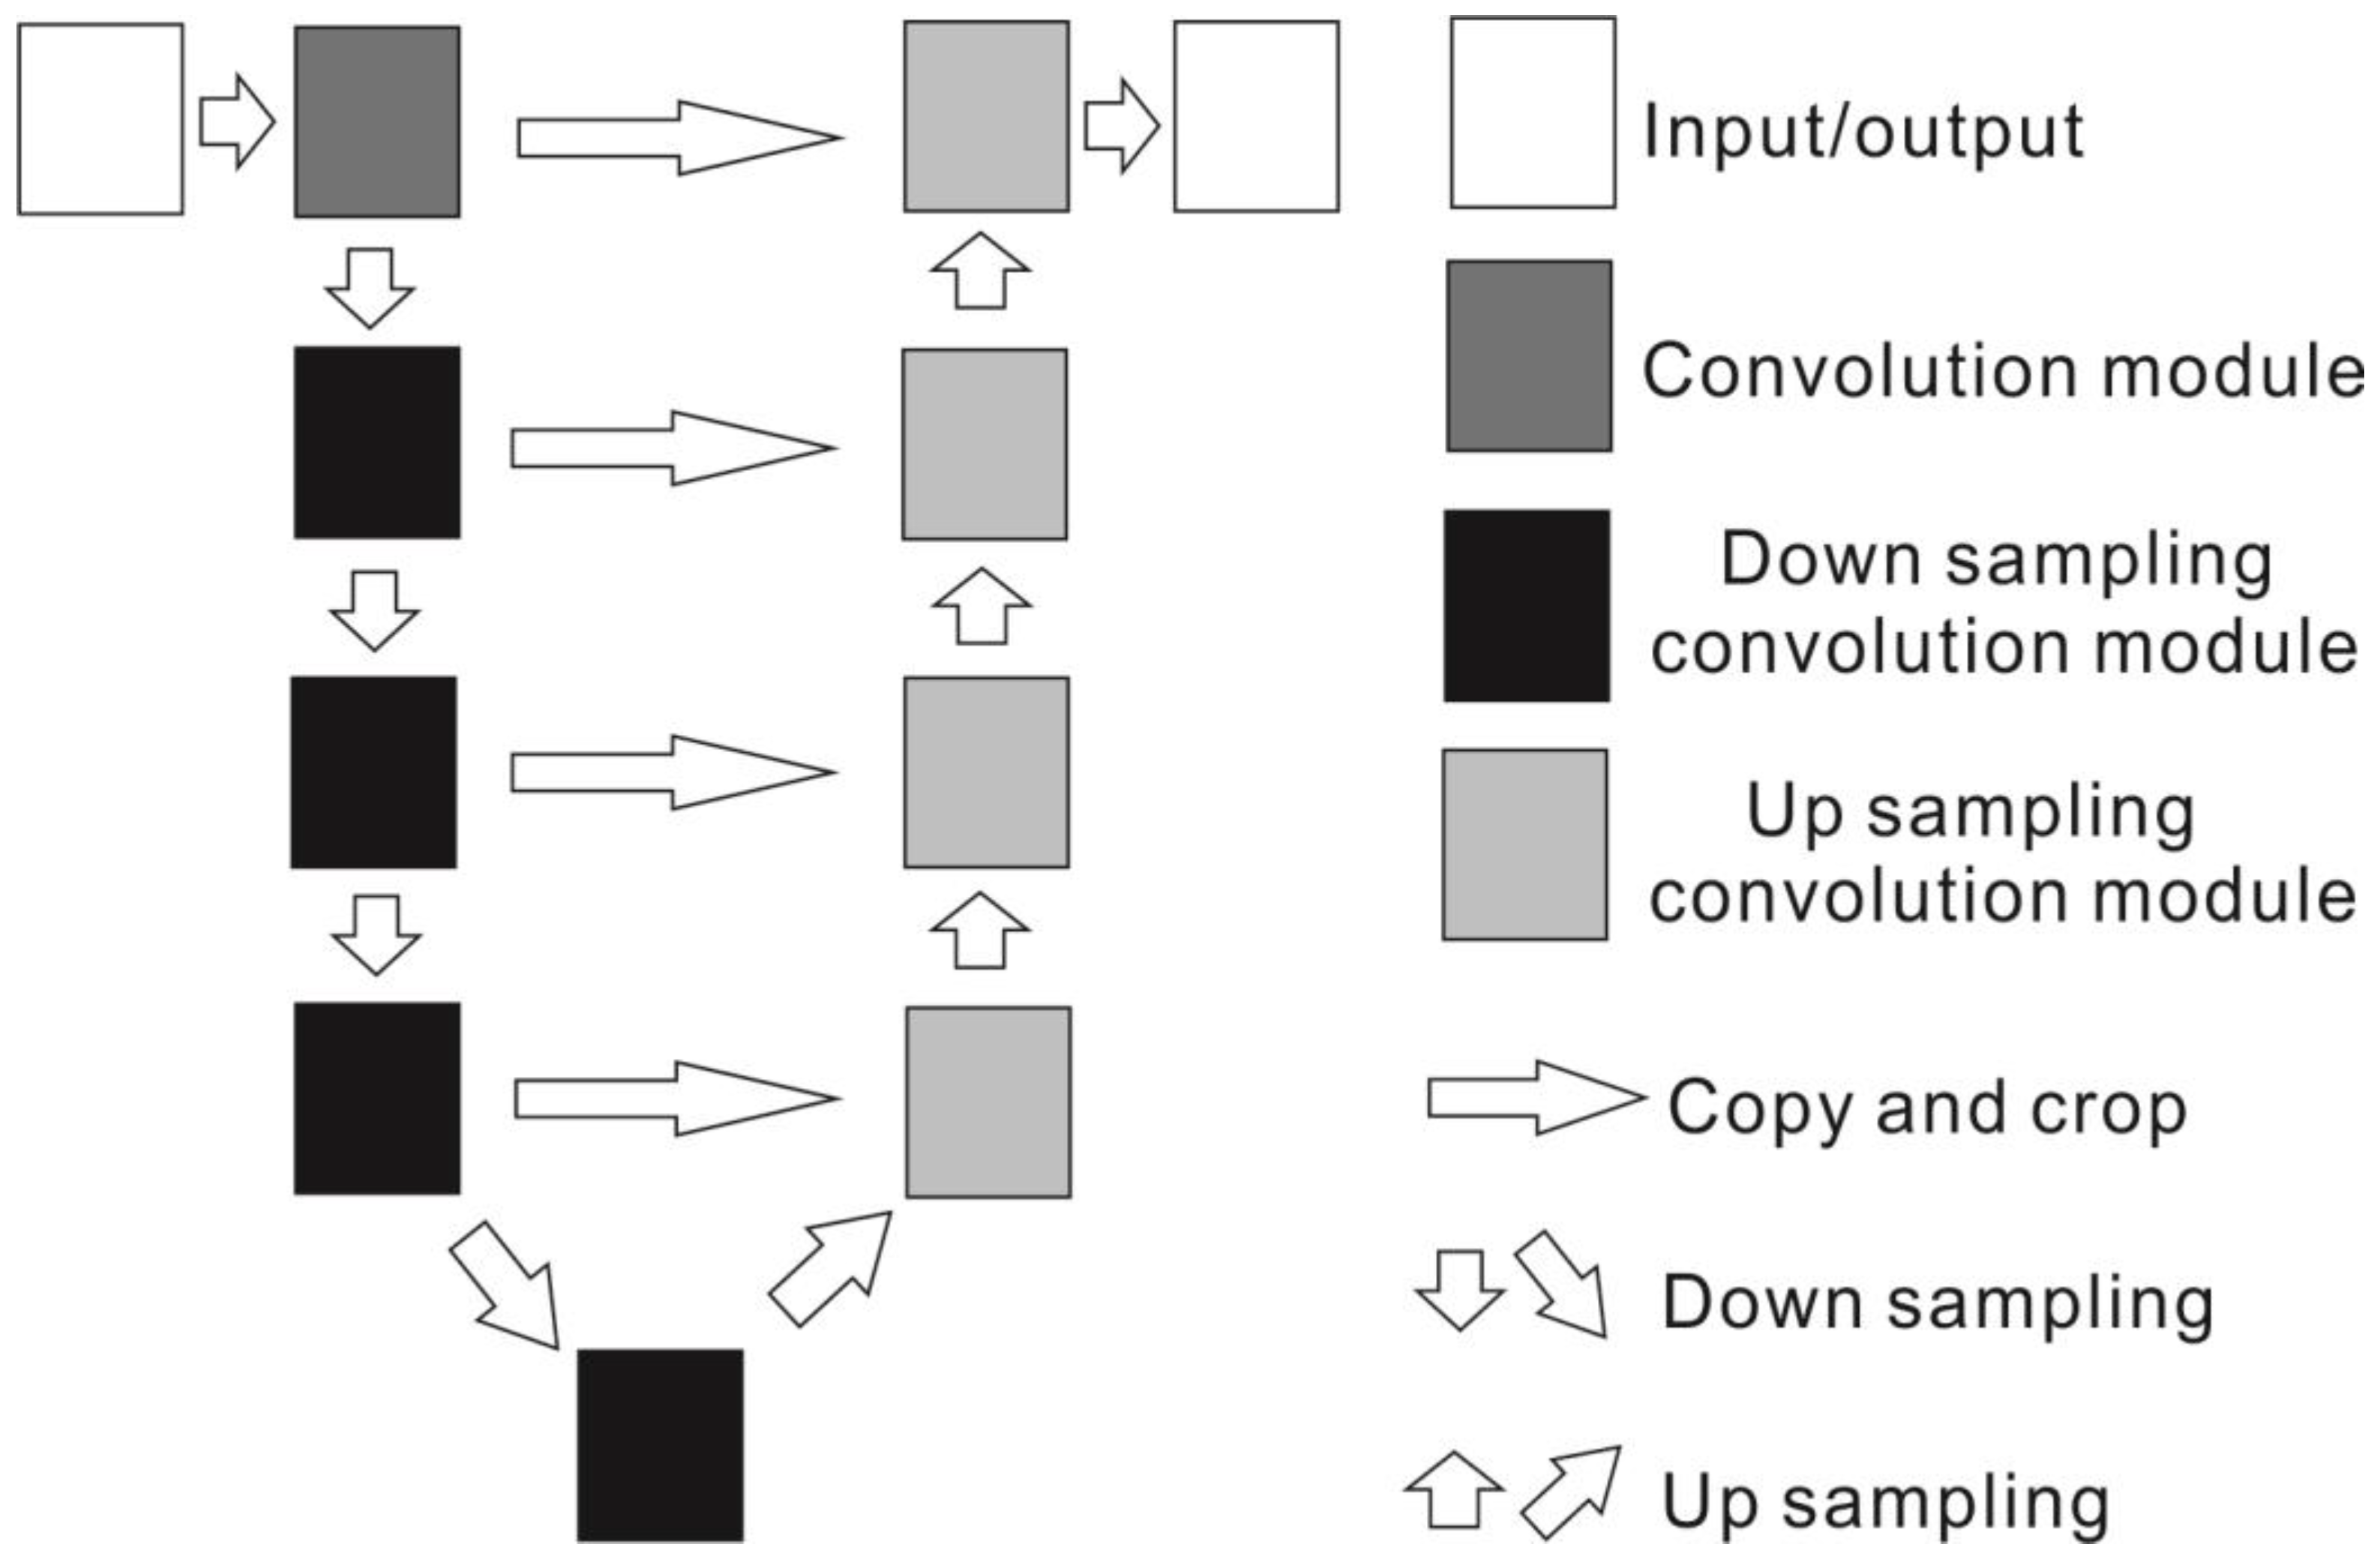
Random forest algorithm was originally proposed by Breiman as a machine-learning algorithm [41]. Random forest is a bagging-based decision tree method. Its core is the bagging algorithm. Given a training set D of size n, the bagging algorithm selects n’ size subsets Di in a number of m from the training set evenly, and playback (using self-service sampling) is used as a new training set. Using classification, regression, and other algorithms on this m training set, a number of m models can be obtained, and then bagging results can be obtained by averaging and majority votes. That is, given a training set X = X1, ..., Xn and target Y = Y1, ..., Yn, the bagging method repeats back (B times) samples from the training set and then trains the tree model on these samples. After the training, the prediction of the unknown sample X can be achieved by averaging the predictions of all the single regression trees on X [42].

2.5.4. U-Net

The U-Net network structure, proposed by Olaf Ronneberger, Philipp Fischer, and Thomas Brox at the IEEE International Symposium on Biomedical Imaging (ISBI) Competition 2015, is a U-shaped structure consisting of shrinking subnetworks and expanding subnetworks. Therefore it is named U-Net [43]. The structure of the U-Net network is shown in Figure 6. U-Net first extracts feature information by downsampling through convolution and pooling, and then fuses lower feature maps before upsampling and clipping through transposed convolution for accurate positioning. The U-Net method repeats this process until the output signature map is obtained, and then the segmented map is finished through the activation function.

2.5.5. Confusion Matrix
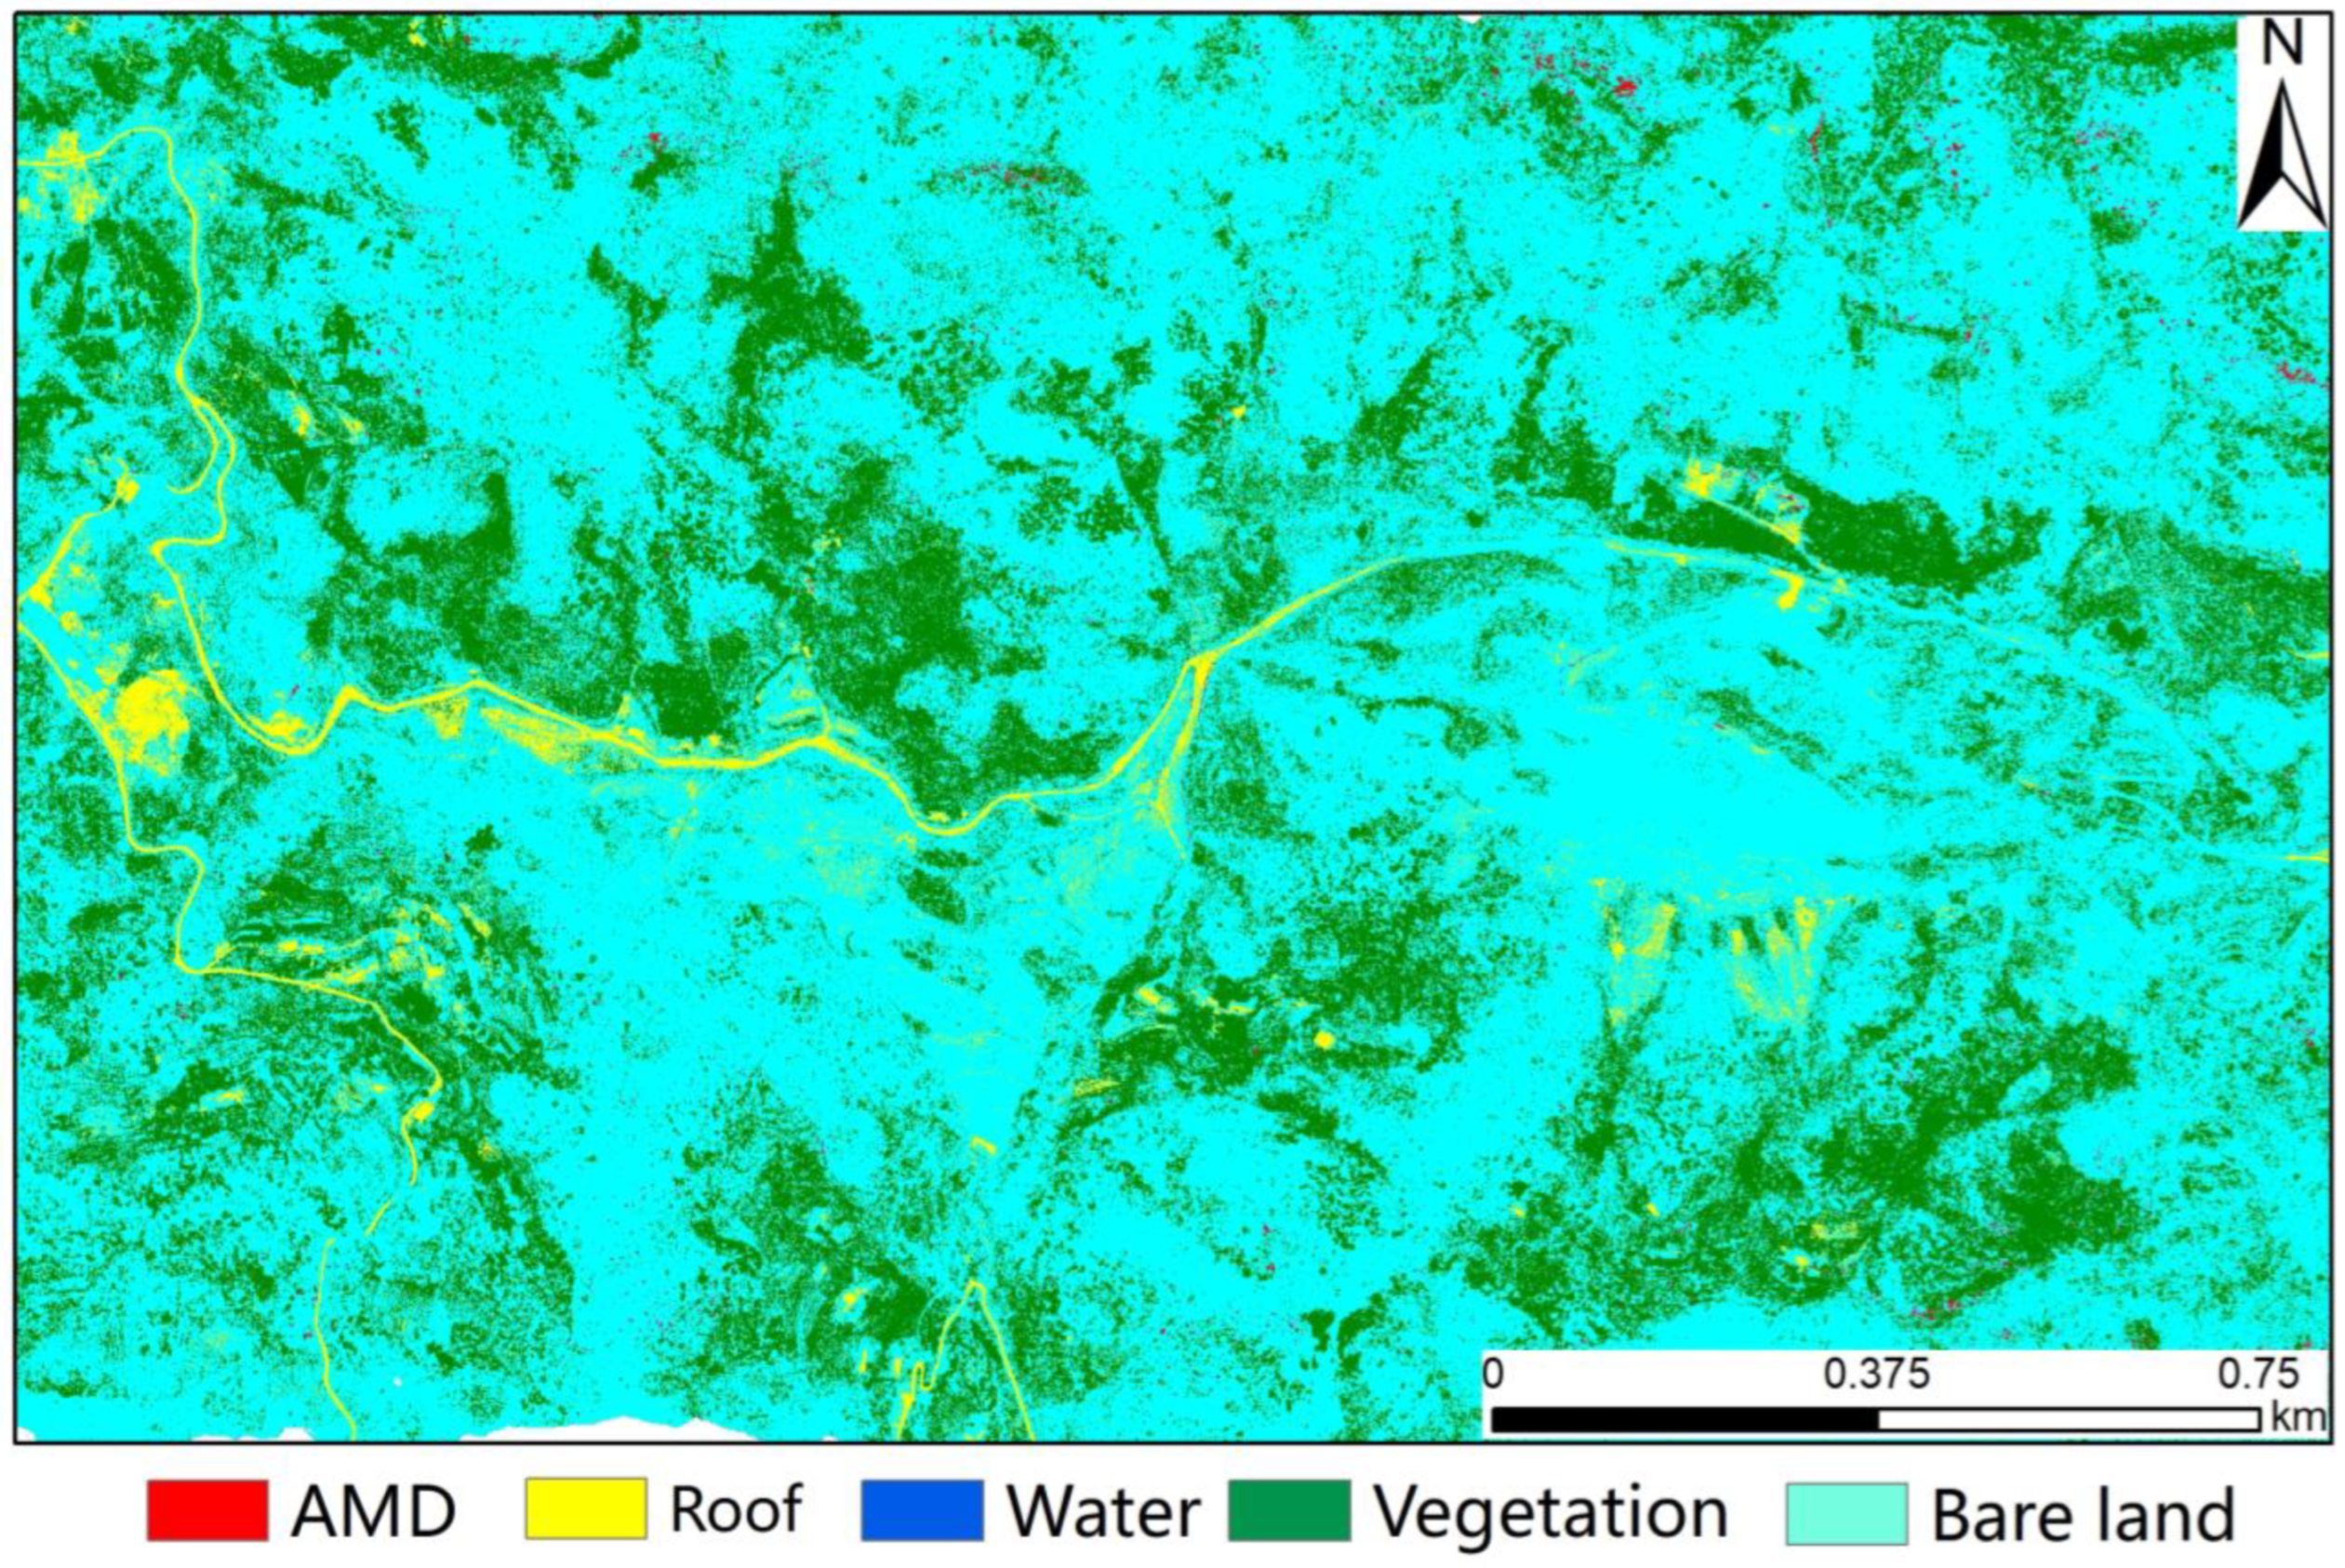
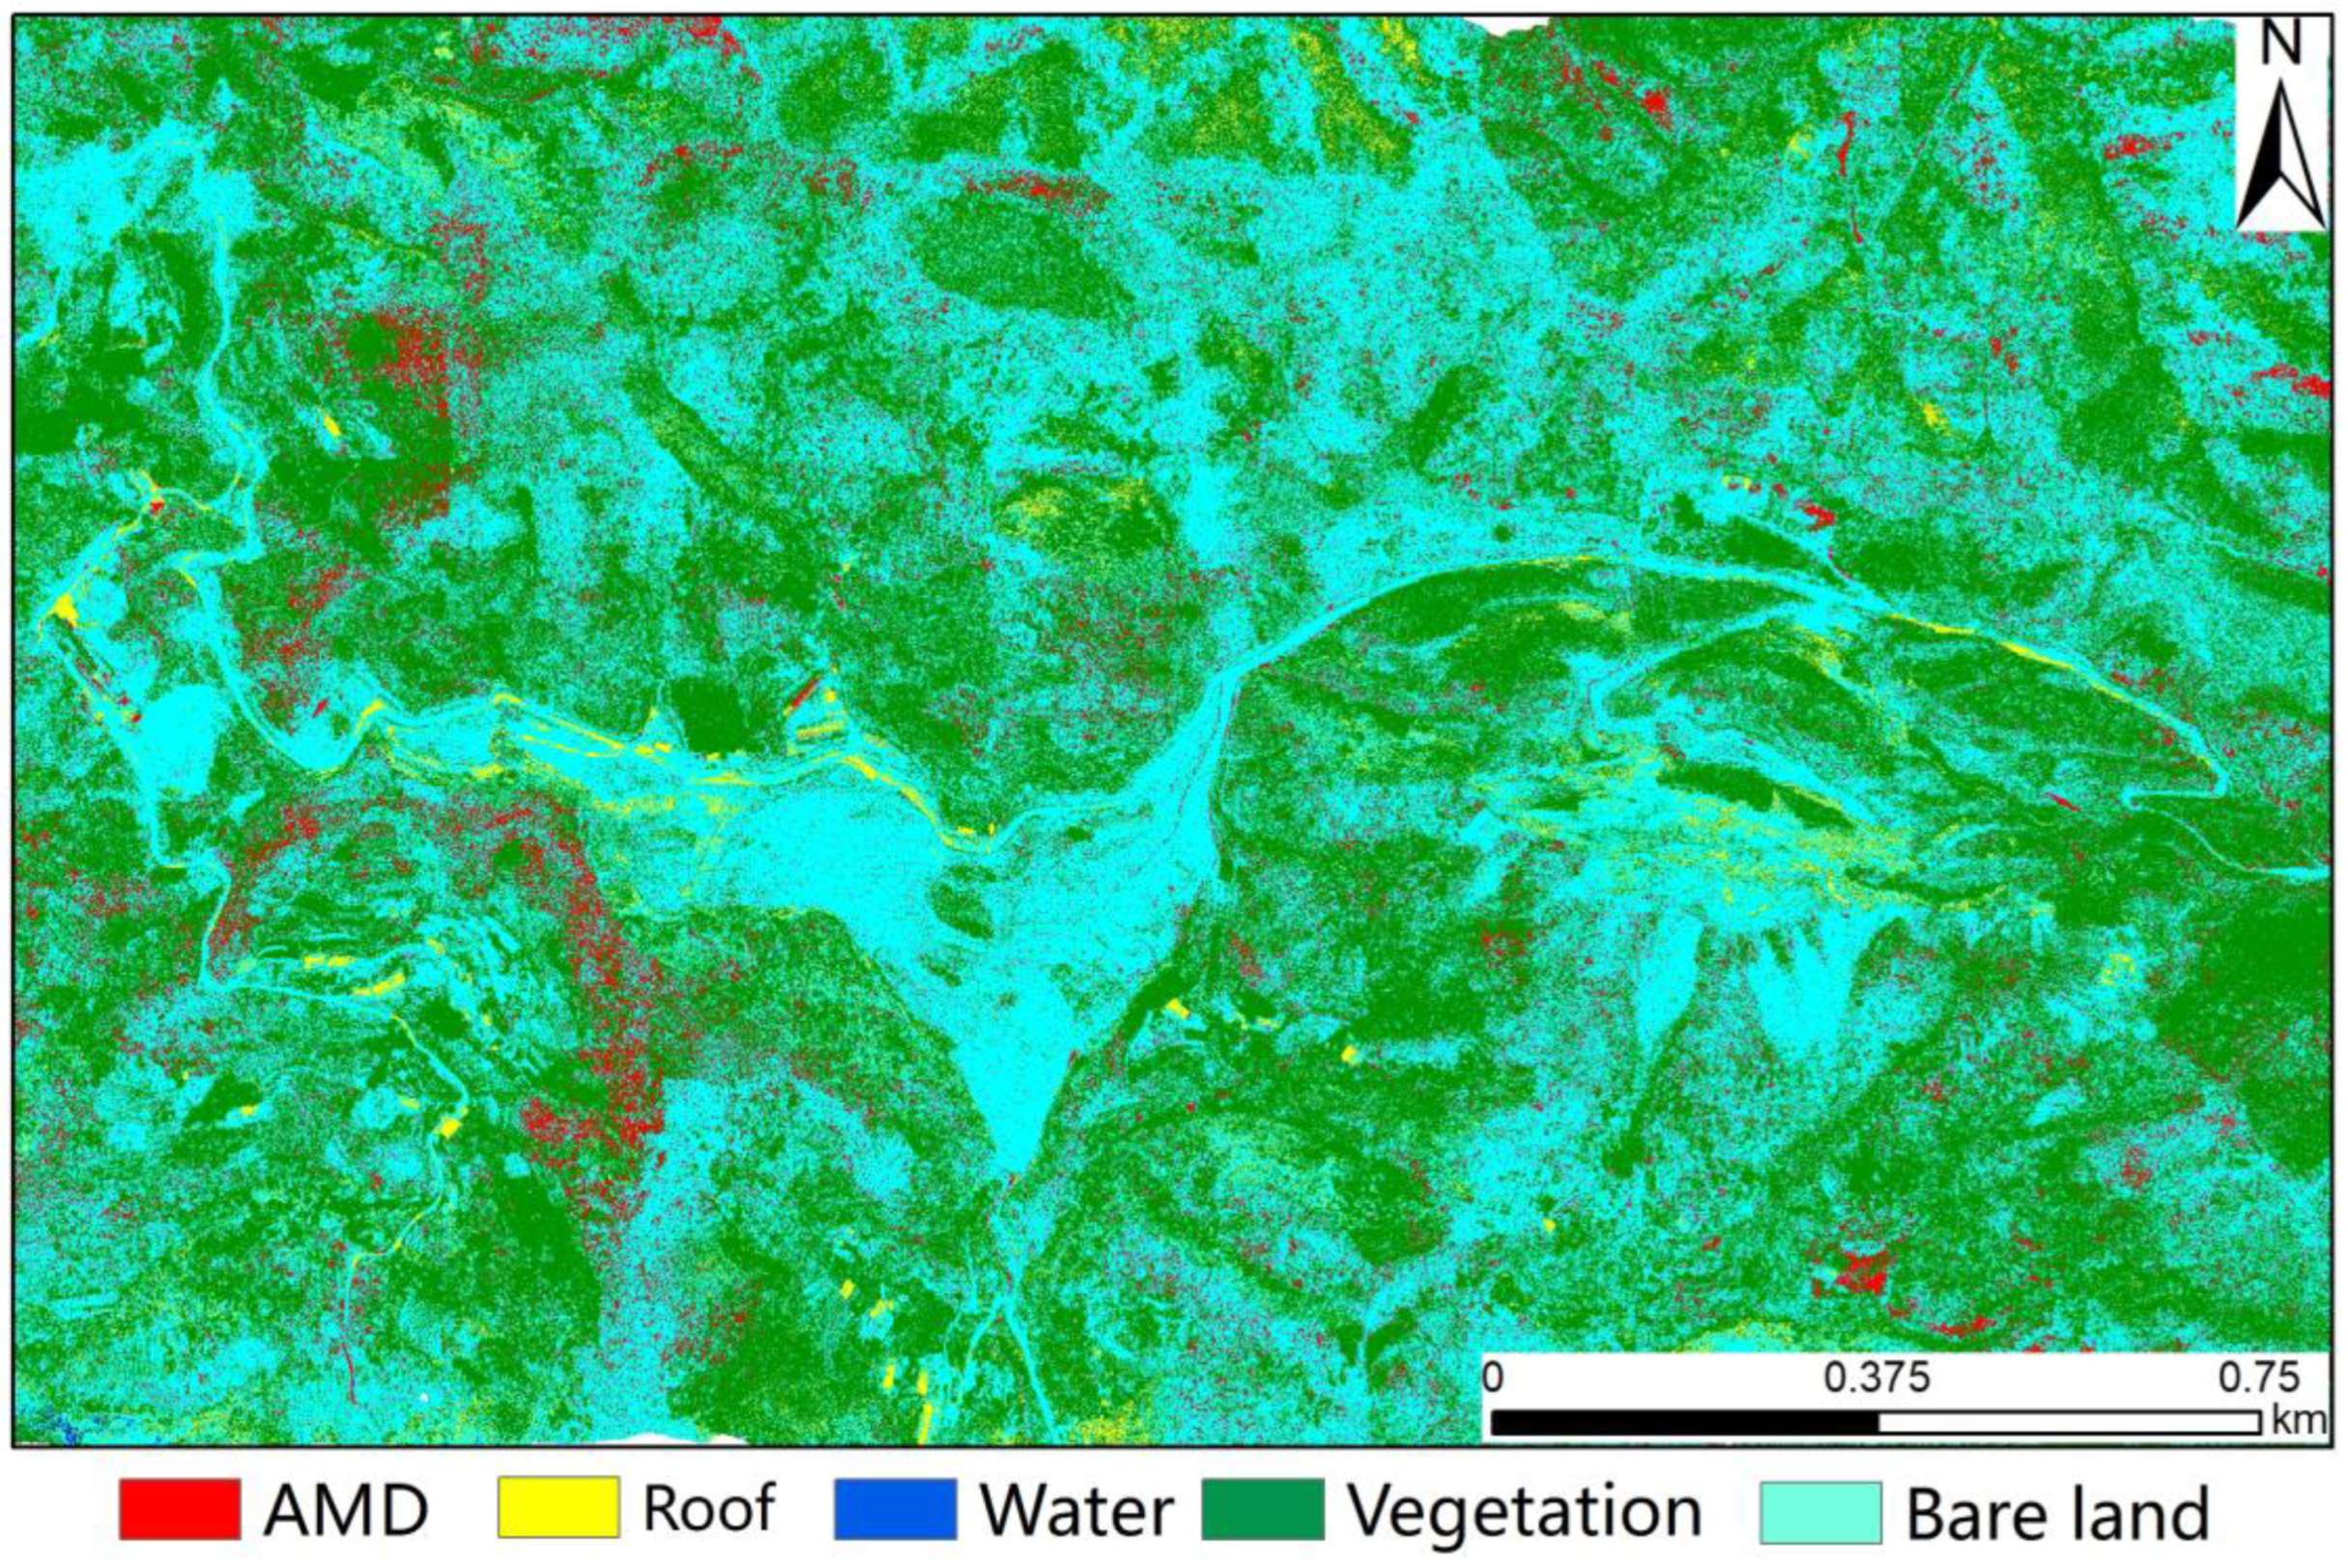
In this study, the confusion matrix method was used to evaluate the accuracies of AMD and land-cover classification in this mining area. The confusion matrix is calculated by comparing the location and category of each real pixel on the surface with the corresponding location and category in the classification image [44]. The evaluation includes overall accuracy and accuracy of each category. For AMD and other land-cover categories in mining area, the overall accuracy is the percentage produced by dividing the sum of the correct classification inspection points by the total selected inspection points. The accuracy of each category refers to the probability that the results of each classification are comparable with the actual reference data, to calculate the correct classification of each category.

3. Results

In general, all three methods have been used to classify RGB aerial images from UAVs effectively and have identified the distribution of AMD successfully. The SVM and RF methods classified all the pixels of the entire image, while the U-Net method classified some pixels poorly matched with the five types of land cover as unclassified. Among the SVM classification results, bare land covered the largest area (62.77% of the entire area) of the study area, followed by vegetation (22.39% of the entire area). Roof class contained threadiness such as non-paved roads in mining areas (Figure 7). AMD and water bodies were mainly distributed along ponds and streams in the study area with a small coverage percent of 0.14% (Figure 7). Because the study area is located in the Qinling Mountains, the earth’s surface is mainly covered with dense forest and vegetation. Therefore, the SVM classification results distorted the classification of vegetation and bare land. The results of RF method showed the largest distribution area is bare land (39.89% of the entire area) and followed by vegetation (38.99% of the entire area) (Figure 8). Most pixels of roof class were real roofs of buildings, a few were unpaved roads in the mining area. Unpaved roads in the mining area were mainly incorporated into bare-land class due to their similar color. AMD and water bodies were still distributed along ponds and rivers with a smaller area (5.84% of the entire area) in the results of the RF method (Figure 8). However, some of the vegetation distinguished by the SVM classification method were misclassified into the AMD category, possibly because some of the withered leaf color in autumn was close to the orange color of AMD. The U-Net method showed the largest vegetation area (39.54% of the entire area), followed by bare land (8.92% of the entire area). There were almost no misclassified mining roads in the roof class. Water bodies and AMD were still distributed along ponds and rivers with a smaller area in the result of the U-Net method (Figure 9). The distribution of U-Net classification results was better than that of the SVM and RF methods with fewer discrete classification points. This feature greatly improves the aesthetics of the next mapping step.
A small scale of the classification area was selected for detail comparisons among the results of the different methods and the classes (Figure 10a). Among the vegetation classification results of all the three methods, the SVM method mapped a smaller vegetation land cover than the other two methods (Figure 10b). The RF and the U-Net methods identified a similar vegetation distribution, but the RF vegetation recognition results are more discrete than those of the U-Net (Figure 10c,d). Among the bare-land classification results, the SVM method identified the largest bare-land area. Some vegetation pixels were misidentified as bare land, while some unpaved roads were also misclassified as roof by the SVM (Figure 10b). The RF method can more accurately identify bare land, and fewer areas of bare land were misclassified as roof (Figure 10c). The bare-land areas incorrectly identified by the U-Net method were mainly the road in the mining area and the surface of the mining gangue piles (Figure 10d). The formation of AMD in stone coal mines in the study area is due to the peeling off of rock and soil during open-pit mining, resulting in the exposure of fresh rock surfaces and loose mining gravel to an oxidative environment. Under the action of oxygen, atmospheric precipitation, and microorganisms, minerals such as pyrite (FeS) are oxidized to form sulfate-containing AMD. AMD flows downstream along the drainage channel built on the mining waste dump and forms a confluence into the Xiaomi stream, so acidic water in the study area is mainly distributed in the drainage channel and the Xiaomi stream of the mining area. As shown in Figure 10b, the AMD identified by the SVM method appeared intermittently along the drainage channel in the mining area. As shown in Figure 10c, the AMD identified by the RF method was more contiguous along drainage channels in mining areas, but withered leaves are also misidentified as AMD in vegetation areas. As shown in Figure 10d, the continuity of the AMD distribution identified by the U-Net method was close to RF, and there was no misclassification in vegetation areas.

4. Discussion

This study used SVM, RF, and U-Net models combined with land-use classification maps to identify AMD, bare land, roof, vegetation, and water bodies in a stone coal mine area in Ziyang county with over 6 cm high-resolution RGB images obtained using UAVs. The overall classification accuracies of the SVM, RF, and U-Net methods were 30.35%, 49.84%, and 56.26%, respectively, (Table 3, Table 4 and Table 5). Compared with traditional machine-learning classification methods such as RF and SVM, the U-Net method improves the classification accuracy by 6.42–25.91% using the same RGB image and the ground truth land-cover map. This result is in agreement with previous studies that applied the deep learning network model to remote-sensing land-use classification [45,46,47]. In this study, to form a reciprocity in data with traditional machine-learning classification methods, without too many manual steps to extract and select features [47,48], using 6 cm very-high-resolution UAV color images for AMD and mine land-cover classification, the overall classification accuracies of traditional machine-learning classification methods SVM and RF were lower than that of U-Net.
Among the confusion matrices of the five types of ground cover distinguished by the three methods, the AMD classification accuracy of the SVM method was the lowest at 13.60% and a large number pixels were misclassified into bare land (Table 3). The AMD classification accuracy of the RF method was 38.65%, and the misclassification was also mainly bare land (Table 4). The AMD classification accuracy of the U-Net method was 68.97% and the highest (Table 5). The classification accuracy of bare land by the SVM method was 70.85% (Table 3). The bare-land classification accuracy of the RF method was the highest at 77.43% (Table 4). The classification accuracy of bare land by the U-Net method was 49.80%, with the lowest classification accuracy, and a large number of pixels were marked as unclassified (Table 5). The vegetation classification accuracy of the SVM method was the lowest at 27.33% and many pixels were misclassified as bare land (Table 3). The precision of vegetation classification by the RF method was 47.85% (Table 4). The classification accuracy of bare land by the U-Net method was 57.50% and the highest (Table 5). The roof classification accuracy of the SVM method was the highest at 48.82% (Table 3). The roof classification accuracy of the RF method was the lowest at 42.53% with many pixels incorrectly classified as bare land (Table 4). The roof classification accuracy of the U-Net method was 44.35% and some pixels were classified as bare land (Table 5). The water classification accuracy of the SVM method was the lowest at 0.00%. In total 79.57% and 19.01% pixels of water were misclassified as bare land and vegetation, respectively, (Table 3). The roof classification accuracy of the RF method was 0.42% and the classification accuracy was also very low. Approximately 48.49% and 34.93% pixels of the roof were misclassified as bare land and vegetation (Table 4). The roof classification accuracy of the U-Net method was 42.51% and many pixels failed to be classified (Table 5). In some previous studies, the accuracy of RF land-cover classification is generally higher than that of SVM classification [49].
Meanwhile, due to the limitation of flight time and spectrum of the RGB images collected using UAVs, non-paved roads, open pits, and waste dumps of stone coal mines all belong to mining land. The color and texture of these cover types are similar to those of natural bare land, which results in failure to classify these similar land-cover types by machine-learning algorithm. However, along the pathway of AMD, the water bottom exhibited orange color due to the deposition of richer iron oxides on the water bottom. This color can be distinguished from most other objects and clean water bodies. Only some dry vegetation in autumn and winter show brown-red color which leads to incorrect classification of AMD identification. Therefore, follow-up research should consider the use of growing season images to refine other land-cover classifications for in-depth learning fine classification.
The data used in this study are true-color remote-sensing data with 6 cm very high spatial resolution of the UAV, which contains richer texture information. In particular, AMD performs a strong sense of granularity on the water bottom of the high-resolution UAV image, and the fine features of the water bottom of AMD are more significant. Extracting geometric texture features of AMD underwater stones combined with current edge information detection algorithm could better identify the distribution of AMD, which may provide direction for further research [50].

5. Conclusions

In this study, very-high-resolution images acquired by a UAV system with a spatial resolution of 6 cm were used to classify AMD and land-cover types in a stone coal mining area of Ziyang County. Two conventional machine-learning classification methods including SVM and RF, and additionally the currently emerging U-Net deep artificial neural network (DANN) method, were used. All three classification methods have successfully identified five land-cover types: AMD, roof, water, vegetation, and bare land. The overall classification accuracy of the SVM method is the lowest, and the U-Net method the highest. The identification results for AMD also resulted in the lowest classification accuracy of 13.60% for the SVM method and the highest identification accuracy of 68.97% for the U-Net method. The results illustrated the capability of a UAV system equipped with an RGB camera to perform its advantages of high resolution and fast data acquisition in mine environmental monitoring. The very-high-resolution imagery acquired by a UAV system could enable comparatively higher accuracy of AMD identification and mine environment investigation. In terms of identification algorithms, the DANN methods, especially U-Net, generally perform with higher classification accuracy than general machine-learning methods in the identification of environmental problems such as AMD. In addition, UAV systems equipped with RGB cameras are lighter and cheaper than those equipped with multispectral or hyperspectral sensors, and RGB color images are easier to process than multispectral and hyperspectral data. Therefore, the UAV systems and RGB color images are particularly suitable for monitoring mining environmental problems by mining corporations and local environmental protection administration with nonspecialist remote-sensing technology. In the next step, a serious attempt might be taken to improve U-Net or other DNN classification algorithms to achieve better precision in mining environmental surveys using UAV aerial photography systems with RGB color cameras.

Author Contributions

Conceptualization, X.K.; methodology, D.H.; software, Y.C.; validation, H.S. and M.Y.; formal analysis, X.Z.; investigation, M.Y.; writing—original draft preparation, M.Y.; writing—review and editing, M.Y.; supervision, H.L.; project administration, X.K.; funding acquisition, Y.C. All authors have read and agreed to the published version of the manuscript.

Funding

This research was funded by Natural Science Basic Research Program of Shaanxi (Program No. 2021JLM-57, 2021JLM-56 and 2021JM-350) and the APC was funded by Northwest Engineering Corporation Limited Major Science and Technology Projects, grant number XBY-ZDKJ-2020-08.

Data Availability Statement

The data presented in this study are available on request from the corresponding authors.

Acknowledgments

We are thankful to Xi’an Geological Survey Center of China Geological Survey for their provision of the land-use map. The authors would like to thank the reviewers for their very helpful and constructive reviews of this manuscript.

Conflicts of Interest

The authors declare no conflict of interest.

References

  1. Lottermoser, B. Mine Wastes; Springer: Berlin/Heidelberg, Germany, 2010; Volume 44, p. 085201. [Google Scholar]
  2. Liu, Q.; Chen, B.; Haderlein, S.; Gopalakrishnan, G.; Zhou, Y. Characteristics and environmental response of secondary minerals in AMD from Dabaoshan Mine, South China. Ecotoxicol. Environ. Saf. 2018, 155, 50–58. [Google Scholar] [CrossRef] [PubMed]
  3. Ferrier, G. Application of imaging spectrometer data in identifying environmental pollution caused by mining at Rodaquilar, Spain. Remote Sens. Environ. 1999, 68, 125–137. [Google Scholar] [CrossRef]
  4. Kemper, T.; Sommer, S. Estimate of heavy metal contamination in soils after a mining accident using reflectance spectroscopy. Environ. Sci. Technol. 2002, 36, 2742–2747. [Google Scholar] [CrossRef] [PubMed]
  5. Zvereva, V.P.; Frolov, K.R.; Lysenko, A.I. Formation of mine drainage in the Far Eastern region and its impact on the ecosphere and public health. Min. Sci. Technol. 2022, 7, 203–215. [Google Scholar] [CrossRef]
  6. Arefieva, O.; Nazarkina, A.V.; Gruschakova, N.V.; Skurikhina, J.E.; Kolycheva, V.B. Impact of mine waters on chemical composition of soil in the Partizansk Coal Basin, Russia. Int. Soil Water Conserv. Res. 2019, 7, 57–63. [Google Scholar] [CrossRef]
  7. Lazareva, E.; Myagkaya, I.; Kirichenko, I.; Gustaytis, M.; Zhmodik, S. Interaction of natural organic matter with acid mine drainage: In-situ accumulation of elements. Sci. Total Environ. 2019, 660, 468–483. [Google Scholar] [CrossRef]
  8. Banfield, J.F.; Welch, S.A. Microbial controls on the mineralogy of the environment. In Environmental Mineralogy; Vaughan, D.J., Wogelius, R.A., Eds.; Mineralogical Society of Great Britain and Ireland: London, UK, 2000; Volume 2, ISBN 978-963-463-133-0. [Google Scholar]
  9. Singer, P.C.; Stumm, W. Kinetics of the oxidation of ferrous iron. In Proceedings of the Second Symposium on Coal Mine Draiage Research, National Coal Association/Bituminous Coal Research, Pittsburgh, PA, USA, 14–15 May 1968; Wiley: New York, NY, USA, 1968; pp. 12–34. [Google Scholar]
  10. Bowles, J.F.W. Hydroxides. In Encyclopedia of Geology, 2nd ed.; Alderton, D., Elias, S.A., Eds.; Academic Press: Oxford, UK, 2021; pp. 442–451. ISBN 978-0-08-102909-1. [Google Scholar]
  11. Schwertmann, U. Effect of pH on the formation of goethite and hematite from ferrihy-drite. Clays Clay Miner. 1983, 31, 277–284. [Google Scholar] [CrossRef]
  12. Das, S.; Hendry, M.J.; Essilfie-Dughan, J. Transformation of two-line ferrihydrite to goethite and hematite as a function of pH and temperature. Environ. Sci. Technol. 2011, 45, 268–275. [Google Scholar] [CrossRef]
  13. Desborough, G.A.; Smith, K.S.; Lowers, H.A.; Swayze, G.A.; Hammarstrom, J.M.; Diehl, S.F.; Leinz, R.W.; Driscoll, R.L. Min-eralogical and chemical characteristics of some natural jarosites. Geochim. Cosmochim. Acta 2010, 74, 1041–1056. [Google Scholar] [CrossRef] [Green Version]
  14. Fraser, S. Discrimination and identification of ferric oxides using satellite thematic mapper data: A Newman case study. Int. J. Remote Sens. 1991, 12, 614–635. [Google Scholar] [CrossRef]
  15. Gopinathan, P.; Parthiban, S.; Magendran, T.; Al-Quraishi, A.M.F.; Singh, A.K.; Singh, P.K. Mapping of ferric (Fe3+) and ferrous (Fe2+) iron oxides distribution using band ratio techniques with aster data and geochemistry of Kanjamalai and Godumalai, Tamil Nadu, South India. Remote Sens. Appl. Soc. Environ. 2020, 18, 100306. [Google Scholar]
  16. Jackisch, R.; Lorenz, S.; Zimmermann, R.; Möckel, R.; Gloaguen, R. Drone-borne hyperspectral monitoring of acid mine drainage: An example from the Sokolov Lignite District. Remote Sens. 2018, 10, 385. [Google Scholar] [CrossRef] [Green Version]
  17. Mielke, C.; Boesche, N.K.; Rogass, C.; Kaufmann, H.; Gauert, C.; De Wit, M. Spaceborne mine waste mineralogy monitoring in South Africa, applications for modern push-broom missions: Hyperion/OLI and EnMAP/Sentinel-2. Remote Sens. 2014, 6, 6790–6816. [Google Scholar] [CrossRef] [Green Version]
  18. Chalkley, R.; Crane, R.A.; Eyre, M.; Hicks, K.; Jackson, K.-M.; Hudson-Edwards, K.A. A multi-scale feasibility study into acid mine drainage (AMD) monitoring using same-day observations. Remote Sens. 2023, 15, 76. [Google Scholar] [CrossRef]
  19. Bacova, D.; Khairutdinov, A.M.; Gago, F. Cosmic geodesy contribution to geodynamics monitoring. IOP Conf. Ser. Earth Environ. Sci. 2021, 906, 12074. [Google Scholar] [CrossRef]
  20. Golik, V.I.; Klyuev, R.V.; Martyushev, N.V.; Brigida, V.; Efremenkov, E.A.; Sorokova, S.N.; Mengxu, Q. Tailings utilization and zinc extraction based on mechanochemical activation. Materials 2023, 16, 726. [Google Scholar] [CrossRef]
  21. Swayze, G.A.; Smith, K.S.; Clark, R.N.; Sutley, S.J.; Pearson, R.M.; Vance, J.S.; Hageman, P.L.; Briggs, P.H.; Meier, A.L.; Singleton, M.J.; et al. Using imaging spectroscopy to map acidic mine waste. Environ. Sci. Technol. 2000, 34, 47–54. [Google Scholar] [CrossRef]
  22. Isgró, M.A.; Basallote, M.D.; Caballero, I.; Barbero, L. Comparison of UAS and sentinel-2 multispectral imagery for water quality monitoring: A case study for acid mine drainage affected areas (SW Spain). Remote Sens. 2022, 14, 4053. [Google Scholar] [CrossRef]
  23. Montero, I.C.; Brimhall, G.H.; Alpers, C.N.; Swayze, G.A. Characterization of waste rock associated with acid drainage at the Penn Mine, California, by ground-based visible to short-wave infrared reflectance spectroscopy assisted by digital map-ping. Chem. Geol. 2005, 215, 453–472. [Google Scholar] [CrossRef] [Green Version]
  24. Flores, H.; Lorenz, S.; Jackisch, R.; Tusa, L.; Contreras, I.C.; Zimmermann, R.; Gloaguen, R. UAS-based hyperspectral environmental monitoring of acid mine drainage affected waters. Minerals 2021, 11, 182. [Google Scholar] [CrossRef]
  25. Richter, N.; Staenz, K.; Kaufmann, H. Spectral unmixing of airborne hyperspectral data for baseline mapping of mine tailings areas. Int. J. Remote Sens. 2008, 29, 3937–3956. [Google Scholar] [CrossRef]
  26. Choe, E.; van der Meer, F.; van Ruitenbeek, F.; van der Werff, H.; de Smeth, B.; Kim, K.W. Mapping of heavy metal pollution in stream sediments using combined geo-chemistry, field spectroscopy, and hyperspectral remote sensing: A case study of the Rodalquilar mining area, SE Spain. Remote Sens. Environ. 2008, 112, 3222–3233. [Google Scholar] [CrossRef]
  27. Shang, J.; Morris, B.; Howarth, P.; Lévesque, J.; Staenz, K.; Neville, B. Mapping mine tailing surface mineralogy using hyperspectral remote sensing. Can. J. Remote Sens. 2009, 35, S126–S141. [Google Scholar] [CrossRef]
  28. Davies, G.E.; Calvin, W.M. Mapping acidic mine waste with seasonal airborne hyper-spectral imagery at varying spatial scales. Environ. Earth Sci. 2017, 76, 1–14. [Google Scholar] [CrossRef]
  29. Sares, M.; Hauff, P.; Peters, D.; Coulter, D. Characterizing sources of acid rock drain-age and resulting water quality impacts using hyperspectral remote sensing—Examples from the Upper Arkansas. In Proceedings of the Advanced Integration of Geospatial Technologies in Mining Reclamation, Atlanta, GA, USA, 7–9 December 2004. [Google Scholar]
  30. Crowley, J.; Williams, D.; Hammarstrom, J.; Piatak, N.; Chou, I.-M.; Mars, J. Spectral reflectance properties (0.4–2.5 μm) of secondary Fe-oxide, Fe-hydroxide, and Fe-sulphate-hydrate minerals associated with sulphide-bearing mine wastes. Geochem. Explor. Environ. Anal. 2003, 3, 219–228. [Google Scholar] [CrossRef]
  31. Davies, G.E.; Calvin, W.M. Quantifying iron concentration in local and synthetic acid mine drainage: A new technique using handheld field spectrometers. Mine Water Environ. 2016, 36, 299–309. [Google Scholar] [CrossRef]
  32. Booysen, R.; Gloaguen, R.; Lorenz, S.; Zimmermann, R.; Nex, P.A. Geological remote sensing. In Reference Module in Earth Systems and Environmental Sciences, 2nd ed.; Elsevier: Amsterdam, The Netherlands, 2020; Volume 64, pp. 267–274. [Google Scholar]
  33. Jia, Z.; Lv, T. Geological characteristics and stone-bearing coal analysis of dove formation in Shuanglong Area, Ankang City. Coal 2014, 23, 52–53. [Google Scholar]
  34. Liu, X.; Lian, X.; Yang, W.; Wang, F.; Han, Y.; Zhang, Y. Accuracy assessment of a UAV direct georeferencing method and impact of the configuration of ground control points. Drones 2022, 6, 30. [Google Scholar] [CrossRef]
  35. He, K.; Liu, B.; Hu, X.; Zhou, R.; Xi, C.; Ma, G.; Han, M.; Li, Y.; Luo, G. Rapid characterization of landslide-debris flow chains of geologic hazards using multi-method investigation: Case study of the Tiejiangwan LDC. Rock Mech. Rock Eng. 2022, 55, 5183–5208. [Google Scholar] [CrossRef]
  36. Liu, X.; Zhu, W.; Lian, X.; Xu, X. Monitoring mining surface subsidence with multi-temporal three-dimensional unmanned aerial vehicle point cloud. Remote Sens. 2023, 15, 374. [Google Scholar] [CrossRef]
  37. Zhao, Z. Researching on 3D modeling of small object with tilt photogrammetry and Context Capture. Digit. Technol. Appl. 2020, 38, 29–31. [Google Scholar]
  38. Mazzoni, D.; Garay, M.J.; Davies, R.; Nelson, D. An operational MISR pixel classifier using support vector machines. Remote Sens. Environ. 2007, 107, 149–158. [Google Scholar] [CrossRef]
  39. Zhang, R.; Ma, J. State of the art on remotely sensed data classification based on support vector machines. Adv. Earth Sci. 2009, 24, 555–562. [Google Scholar]
  40. Long, Y.; Qiao, W.; Sun, J. Change detection of remote sensing images in Datun Mining Area based on support vector machine. Geomat. Spat. Inf. Technol. 2020, 43, 107–115. [Google Scholar]
  41. Breiman, L. Random forests. Mach. Learn. 2001, 45, 5–32. [Google Scholar] [CrossRef] [Green Version]
  42. Zhang, J.; Yao, Y.; Cao, N. Prediction of whether precipitation based on decision tree. J. Geomat. 2017, 42, 107–109. [Google Scholar]
  43. Ronneberger, O.; Fischer, P.; Brox, T. U-net: Convolutional networks for biomedical image segmentation. Medical image computing and computer-assisted intervention–MICCAI 2015. In Proceedings of the 18th International Conference, Munich, Germany, 5–9 October 2015; Proceedings, Part III 18. Springer International Publishing: Berlin/Heidelberg, Germany, 2015; pp. 234–241. [Google Scholar]
  44. Ye, R.; Niu, R.; Zhang, L.; Yi, S. Mineral contents determination and accuracy evaluation based on classification of petrographic images. J. China Univ. Min. Technol. 2011, 40, 810–822. [Google Scholar]
  45. Fang, X.; Wang, G.; Yang, H.; Liu, H.; Yan, L. High resolution remote sensing image classification combining with mean-shift segmentation and fully convolution neural network. Laser Optoelectron. Prog. 2018, 55, 22802. [Google Scholar] [CrossRef]
  46. Cao, Q.; Zhong, Y.; Ma, A.; Zhang, L. Urban land use/land cover classification based on feature fusion fusing hyperspectral image and LiDAR data. In Proceedings of the IGARSS 2018—2018 IEEE International Geoscience and Remote Sensing Symposium, Valencia, Spain, 22–27 July 2018; IEEE: Piscataway Township, NJ, USA, 2018; pp. 8869–8872. [Google Scholar]
  47. Xia, M.; Cao, G.; Wang, G.; Shang, Y. Remote sensing image classification based on deep learning and conditional random fields. J. Image Graph. 2017, 22, 1289–1301. [Google Scholar]
  48. Pang, B.; Huang, Z.; Wu, Y.; Lu, Y. Mapping of impervious surface extraction of high resolution remote sensing imagery based on improved fully convolutional neural network. Remote Sens. Inf. 2020, 35, 47–55. [Google Scholar]
  49. Ma, L.; Fu, T.; Blaschke, T.; Li, M.; Tiede, D.; Zhou, Z.; Ma, X.; Chen, D. Evaluation of feature selection methods for object-based land cover mapping of unmanned aerial vehicle imagery using random forest and support vector machine classifiers. ISPRS Int. J. Geo-Inf. 2017, 6, 51. [Google Scholar] [CrossRef] [Green Version]
  50. Chen, H.; Bian, Z.; Zhao, X. Research on attribute morphological profiles based on multifeature ultra-high resolution remote sensing image classification. Geomat. Spat. Inf. Technol. 2019, 42, 115–119. [Google Scholar]
Figure 1. (a) Location of the stone coal mining area; (b) UAV image of the study area; (c) the Xiaomi stream polluted by AMD.
Water 15 01613 g001
Figure 2. (a) The AMD flows out of the mine portal; (b) the Xiaomi stream polluted by AMD.
Water 15 01613 g002
Figure 3. (a) The Feima UAV platform; (b) the SONY a-6000 digital camara.
Water 15 01613 g003
Figure 4. The latest land-use map of the stone coal mining area.
Water 15 01613 g004
Figure 5. (a) The UAV image of the training area; (b) the ground truth of the training area.
Water 15 01613 g005
Figure 6. The structure of the U-Net algorithm.
Water 15 01613 g006
Figure 7. The classification map of SVM method.
Water 15 01613 g007
Figure 8. The classification map of RF method.
Water 15 01613 g008
Figure 9. The classification map of U-Net method.
Water 15 01613 g009
Figure 10. The classification map of U-Net method.((a) the UAV image of the study area, (b) SVM classification, (c) RF classification, (d) U-Net classification).
Water 15 01613 g010
Table 1. The flight parameters of the aerial image acquisition.
ParameterValue
Flight altitude (above take-off)946 m
Ground resolution4 cm
Number of flights2
Flight duration50 min
Course overlap80%
Lateral overlap60%
Relative height314 m
Area covered3.3 km2
Table 2. The instrumental parameters of the UAV aerial photography systems.
ParameterFeima D2000DJI Matrice 210 V2 [19]Texo DSI [15]Tholeg THO-R-PX8 [21]
Duration60 min24 min30 min20 min
Sensor weigh200 g508.8 g680 g720 g
Cruise speed72 km/h61 km/h36 km/h40 km/h
Maximum relative height±1000 m±500 m±500 m±500 m
Table 3. The confusion matrix of the SVM results (%).
ClassBare LandVegetationAMDRoofWater
Unclassified0.010.010.000.000.00
Bare land70.8571.8775.4750.6379.57
Vegetation8.9127.332.340.3719.01
AMD0.150.5513.600.180.00
Roof20.080.258.5948.821.43
Water0.000.000.000.000.00
Total100.00100.00100.00100.00100.00
Note: Overall Accuracy = 30.35%.
Table 4. The confusion matrix of the RF results (%).
ClassBare LandVegetationAMDRoofWater
Unclassified0.010.010.000.000.00
Bare land77.4342.8047.4937.6148.49
Vegetation12.1847.8512.767.3634.93
AMD4.317.1538.6512.472.85
Roof6.062.161.0942.5313.30
Water0.010.030.000.040.42
Total100.00100.00100.00100.00100.00
Note: Overall Accuracy = 49.84%.
Table 5. The confusion matrix of the U-Net results (%).
ClassBare LandVegetationAMDRoofWater
Unclassified43.4437.9126.2837.3347.49
Bare land49.804.561.7616.751.62
Vegetation6.5857.502.971.512.46
AMD0.000.0068.970.005.91
Roof0.180.020.0144.350.00
Water0.000.010.000.0542.51
Total100.00100.00100.00100.00100.00
Note: Overall Accuracy = 56.26%.
Disclaimer/Publisher’s Note: The statements, opinions and data contained in all publications are solely those of the individual author(s) and contributor(s) and not of MDPI and/or the editor(s). MDPI and/or the editor(s) disclaim responsibility for any injury to people or property resulting from any ideas, methods, instructions or products referred to in the content.

