


Spatial-Temporal Characteristics of Spring Maize Drought in Songnen Plain, Northeast China

1
School of Architecture, Nanyang Institute of Technology, Nanyang 473004, China
2
School of Marxism, Nanyang Institute of Technology, Nanyang 473004, China
*
Author to whom correspondence should be addressed.
Water 2023, 15(8), 1618; https://doi.org/10.3390/w15081618
Submission received: 31 March 2023
/
Revised: 14 April 2023
/
Accepted: 16 April 2023
/
Published: 21 April 2023
(This article belongs to the Topic Hydrology and Water Resources in Agriculture and Ecology)
Abstract
:With the intensification of global warming, food production will face serious drought risk. In view of the insufficient applicability of the existing crop drought index, a standardized crop water deficit index (SCWDI) was constructed based on the construction idea of the standardized precipitation evapotranspiration index (SPEI) and the crop water deficit index (CWDI) in this study. On this basis, the spatial and temporal characteristics of spring maize drought in Songnen Plain were explored by the slope trend analysis and Morlet wavelet analysis methods. The results show the following: (1) Compared with the existing drought index, the SCWDI shows obvious advantages in drought monitoring of spring maize. (2) In the whole growth stage of spring maize, the change trend of SCWDI was small in the temporal series (−0.012/10a). Spatially, the drought trend of spring maize was mainly decreasing (−0.14~0/10a). The drought frequency of spring maize in each growth stage was mainly light drought in most regions. (3) The three main drought cycles of spring maize in Songnen Plain were 29 years, 10 years, and 4 years. In the next few years, the drought of spring maize in Songnen Plain was controlled by the first main cycle, and the drought years may increase, which should be prevented. The research was expected to provide technical support for crop drought monitoring and agricultural disaster prevention.
1. Introduction
Global warming is an obvious issue and the frequency and extent of extreme weather are also increasing [1,2,3,4,5,6,7]. Owing to its wide range and long duration, drought has become one of the most significant natural disasters facing humankind [8,9,10]. According to research and analysis, global economic losses caused by drought every year are incalculable, and the total number of people affected by drought has exceeded other natural disasters, affecting more than 120 countries and regions [11,12]. The United Nations report shows that the number and duration of global droughts have increased by 29% since 2000. The report estimates that, between 1998 and 2017 alone, global economic losses caused by drought amounted to USD 124 billion, and drought has affected at least 1.5 billion people [13]. Agriculture is more vulnerable to drought disasters because of its high sensitivity and vulnerability to drought [14]. According to statistics from the Food and Agriculture Organization of the United Nations, drought caused a huge loss of USD 29 billion in the global agricultural sector in 2005–2015 [15]. Some studies have shown that, if effective measures are not taken to deal with the risk of drought disasters, the area of global crop drought will increase significantly by the end of this century and food security will be seriously threatened [16,17]. At present, how to effectively reduce the loss of agricultural production caused by drought and further improve the ability of agriculture to resist risks have become key issues of urgent concern for countries and regions around the world [18,19].
In agricultural drought, the drought index plays an important role in reducing and preventing the adverse effects of drought on crops [20,21]. Owing to the long time and high precision of ground observation data, various types of drought indexes have been derived, which are widely used in agricultural drought monitoring, such as precipitation anomaly in percentage (Pa), relative moisture index (MI), standardized precipitation index (SPI), standardized precipitation evapotranspiration index (SPEI), crop water deficit index (CWDI), and crop water deficit abnormal index (CWDIa), among others [22]. However, owing to the different construction principles of each index, there are different applications in drought monitoring [23]. Pa and MI only consider the impact of drought on crops in the current period, but lack consideration of early precipitation, so accurate drought information may not be obtained in time, with poor sensitivity [24]. Under global warming, the rise in temperature has become one of the significant factors aggravating the drought process. However, Pa, MI, and SPI only consider precipitation, which may be inferior in some regional drought monitoring [25,26]. Although SPEI makes up for the disadvantages of SPI, it fails to take the crop coefficient into account when calculating the potential evapotranspiration and cannot accurately reflect the water deficit of crops [27,28,29]. CWDI and CWDIa consider the water demand characteristics of crops and can accurately evaluate the water status of crop growth in different growth stages in combination with the growth stage of crops [30,31]. However, the drought standards of CWDI and CWDIa in different regions are inconsistent, with poor universality [32]. In view of the shortcomings of the above drought indexes, how to modify it to improve its effectiveness and universality still needs further exploration.
Songnen Plain, located in Northeast China, is the most important grain-producing area in China. The cultivated land area of Songnen Plain accounts for more than 50% of the land area of Songnen Plain and about 8% of the total cultivated land area in China. It is a typical agricultural farming area [33,34]. The northeast region is one of the regions with the most significant temperature increases in China. Since the 21st century, the drought trend in the northeast region has become increasingly serious, posing a potential threat to the growth of maize, rice, soybean, and other major crops [35]. The main grain crops in Songnen Plain are spring maize, which accounts for 72.88% of the total grain output in the region [36,37]. The increase in drought frequency in the future will seriously threaten the stability of corn output in the region. Therefore, the prevention and mitigation of spring maize drought in Songnen Plain plays an important role in ensuring the sustainable stability of its agricultural economy and the national food security [38,39].
In view of the above analysis, the spatial and temporal characteristics of spring maize drought in Songnen Plain of Northeast China were analyzed on the basis of the revised crop drought index. The main objectives of this study were as follows: (1) to construct a new crop drought index and improve the applicability of crop drought index; (2) to compare the effect of the newly constructed drought index and other drought indexes in drought monitoring of spring maize; and (3) to investigate the spatio–temporal variations in spring maize drought in Songnen Plain based on the newly constructed drought index. It is expected that this study will provide ideas for the construction of crop drought indexes in the future, as well as provide a scientific basis and technical means for the prevention of crop drought in Songnen Plain of Northeast China.
2. Materials and Methods
2.1. Study Area
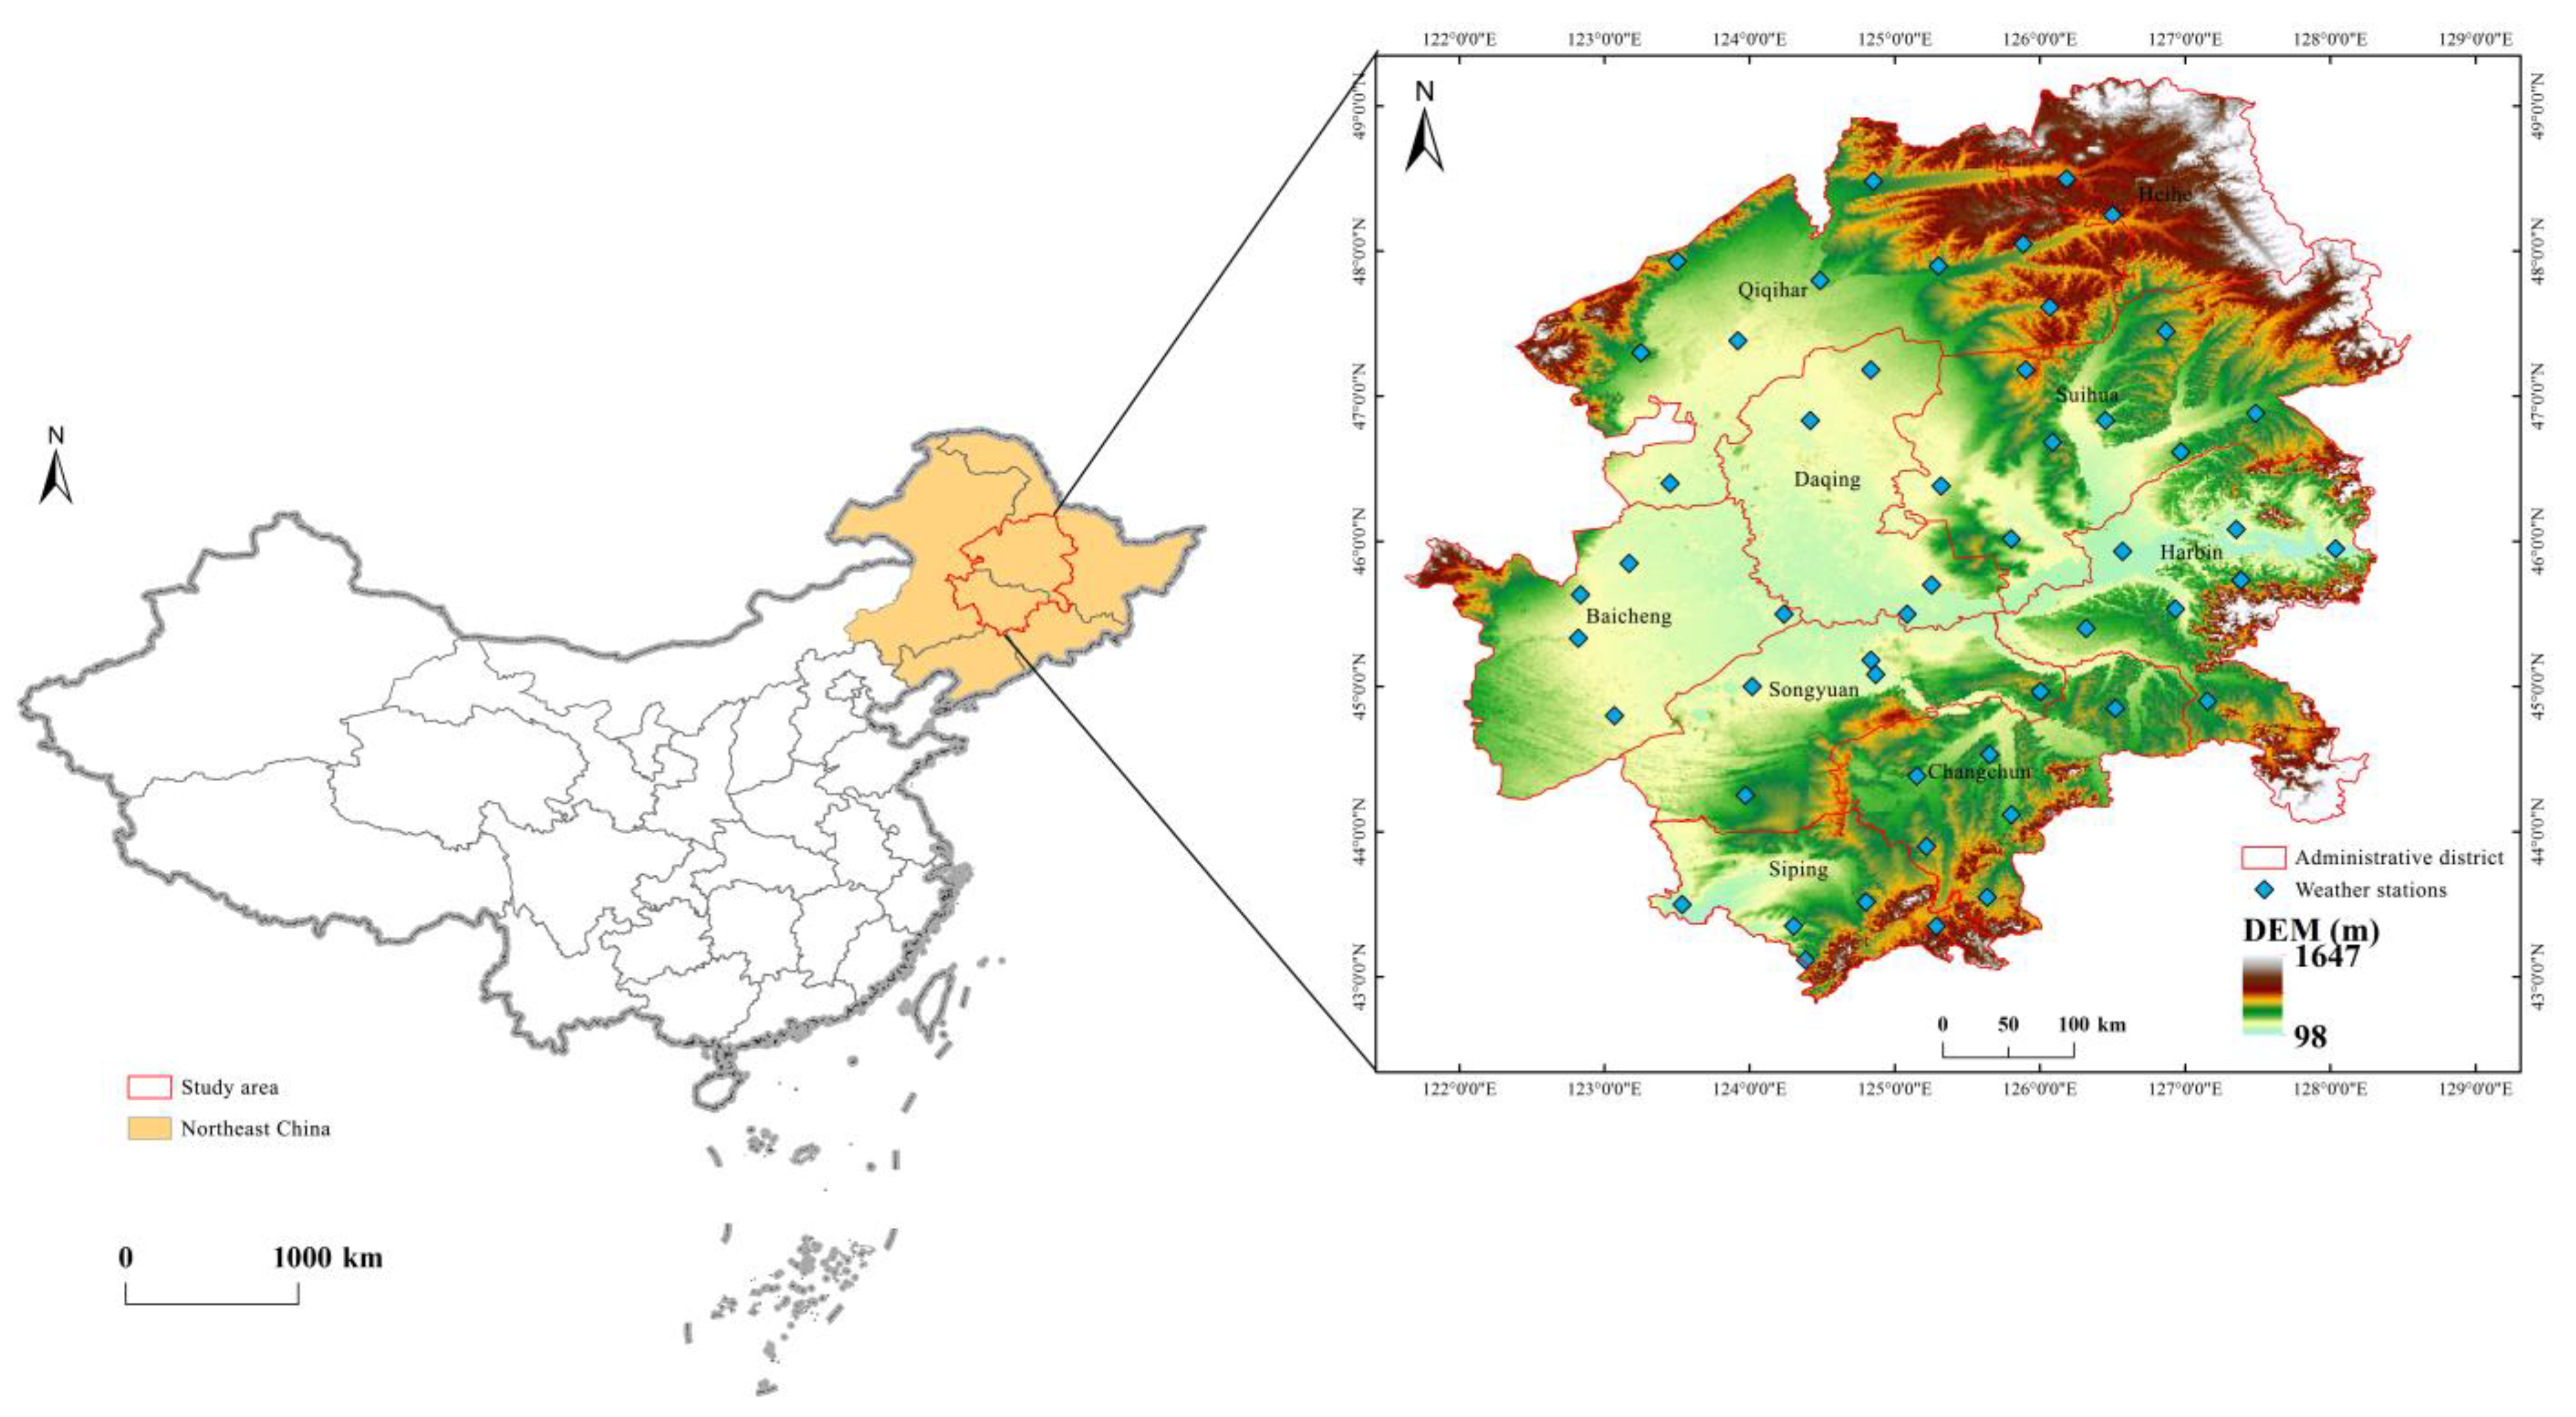
Songnen Plain (121°40′ E~128°30′ E, 42°50′ N~49°12′ N) is located in Northeast China [33]. It is a plain formed by the alluvial deposits of Songhua River and Nenjiang River. Together with Sanjiang Plain and Liaohe Plain, they form the three major plains in Northeast China. The total area of Songnen Plain is about 224,000 km2, including mainly the southwest of Heilongjiang Province and the northwest of Jilin Province (Figure 1). Songnen Plain belongs to a typical temperate continental monsoon climate, with four distinct seasons. Its average annual temperature is between 2 °C and 6 °C, showing a gradually increasing trend from north to south; the annual precipitation of the whole region is between 400 mm and 600 mm, showing a decreasing trend from southeast to northwest [40]. Songnen Plain has a high concentration of precipitation, which is common in summer, accounting for about 70% of the annual precipitation. This distribution of precipitation means that drought and flood disasters can form very easily. The cultivation method of crops in Songnen Plain is generally one crop per year. It is an important grain production area and commodity grain production base in China, and plays a pivotal role in the social and economic development of Northeast China [41].
2.2. Data and Processing
To calculate the drought index of spring maize, the daily meteorological data from 51 meteorological stations in Songnen Plain from 1981 to 2018 were obtained, and the data included average temperature, precipitation, average relative humidity, average pressure, sunshine hours, and average wind speed, among others. All data were from the China Meteorological Data Network (http://data.cma.cn/), accessed on 1 October 2022. The data have been repeatedly revised and supplemented by the China Meteorological Administration. For some missing data, linear interpolation is carried out in this study to improve the integrity and continuity of the data series to a certain extent [42].
In the study, the growth stage of spring maize was taken as the research period. Therefore, we obtained the growth stage data of spring maize from the agricultural meteorological station in the study area. According to the literature [43], five growth stages of spring maize were established, i.e., the sowing to seedling stage, the seedling to jointing stage, the jointing to heading stage, the heading to milk mature stage, and the milk mature to mature stage. For convenience of expression, we named the whole growth stage and the five growth stages A0, A1, A2, A3, A4, and A5, respectively. To verify the validity of the drought index, we also obtained the drought disaster data of spring maize in typical drought years in the study area. All data were also from the China Meteorological Data Network (http://data.cma.cn), accessed on 23 October 2022.
The normalized difference vegetation index (NDVI) can provide vegetation greenness information. When drought occurs, the value of NDVI will change, which better reflects the crop stress information. In the study, we obtained the MODIS NDVI data, which are provided by NASA (http://earthdata.nasa.gov), accessed on 11 November 2022 [44,45]. The vegetation condition index (VCI) was obtained through standardized processing, so as to test the validity of the drought index.
In addition, the administrative division data, DEM, and other basic data in the study were provided by the Data Center for Resources and Environmental Sciences, at the Chinese Academy of Sciences (http://www.resdc.cn/), accessed on 10 October 2022.
2.3. Methods
2.3.1. Construction of the SCWDI
Based on the construction principle of CWDI and SPEI, this study took the accumulated water deficit as the basic quantity and assumed that it follows the log-logistic probability function distribution of three parameters. Then, the accumulated water deficit was fitted and normalized and the standardized crop water deficit index (SCWDI) was constructed.
The specific calculation process was as follows:
Step 1: Calculate the water demand of crop in a growth stage. The formula is as follows:
where is crop water demand (mm); is the reference evapotranspiration (mm) [46,47]; and is the crop coefficient in a growth stage [48].
Step 2: Calculate the accumulated water deficit on a daily scale in a certain growth stage. The details are as follows:
where is the accumulated water deficit on the i-th day in a growth stage (mm); , , , , and are the water deficit (mm) of the i, i−1, i−2, i−3, and i−4 stages, respectively (i.e., the first 1–10 D, the first 11–20 D, the first 21–30 D, the first 31–40 D, and the first 41–50 D, respectively); and a, b, c, and d are weight coefficients, which are 0.3, 0.25, 0.2, 0.15, and 0.1, respectively. In the study, it was assumed that there is no irrigation in the study area and the influence of surface runoff and groundwater is ignored; that is, the crop water deficit is the difference between the accumulated water demand of crops and the accumulated precipitation.
Step 3: Establish the multi-year daily scale cumulative water deficit sequence of a certain growth stage, and set the cumulative water deficit () data sequence as follows: .
Step 4: Follow the principle of SPEI construction, use the log-logistic probability distribution function F(x) with three parameters to fit the data series, and finally carry out normal normalization.
Set the cumulative probability such that the fitting distribution function is greater than any value as P = 1 − F(x), then the standardized crop water deficit index (SCWDI) corresponding to a certain growth stage can be obtained:
where 2.515517, 0.802853, 0.010328, = 1.432788, = 0.189269, and = 0.001308. According to the SPEI drought grading standard [28], SCWDI can be divided into five grades, i.e., no drought (SCWDI < 0.5), light drought (0.5 < SCWDI ≤ 1), moderate drought (1 < SCWDI ≤ 1.5), severe drought (1.5 < SCWDI ≤ 2), and extreme drought (SCWDI > 2).
2.3.2. Morlet Wavelet Analysis
Wavelet analysis is based on various wavelet transforms. It is an analysis method with an adjustable time-domain window and frequency-domain window. In the analysis of climate change, wavelet analysis can fully show the variety of change information hidden in the time series and predict the future change trend [55]. In recent years, wavelet analysis has been widely used in the analysis and prediction of drought periodicity [56]. In the study, Morlet wavelet transform was used to analyze the periodicity of drought, which is mainly realized by matlab2016 software.
2.3.3. Other Methods
In the study, the ANUSPLIN interpolation method was used for the spatial interpolation of the drought indexes in the study area [57]. The Pearson correlation coefficient (R) was calculated to study the relationships among the drought indexes. The changes in drought in spring maize were analyzed by the slope trend analysis method [58,59,60].
3. Results
3.1. Applicability Analysis of the SCWDI
3.1.1. Feasibility of SCWDI Construction
The SCWDI was constructed on the premise that the cumulative crop water deficit follows the three-parameter log-logistic function distribution. Whether or not the cumulative crop water deficit followed the log-logistic function distribution needs to be tested.
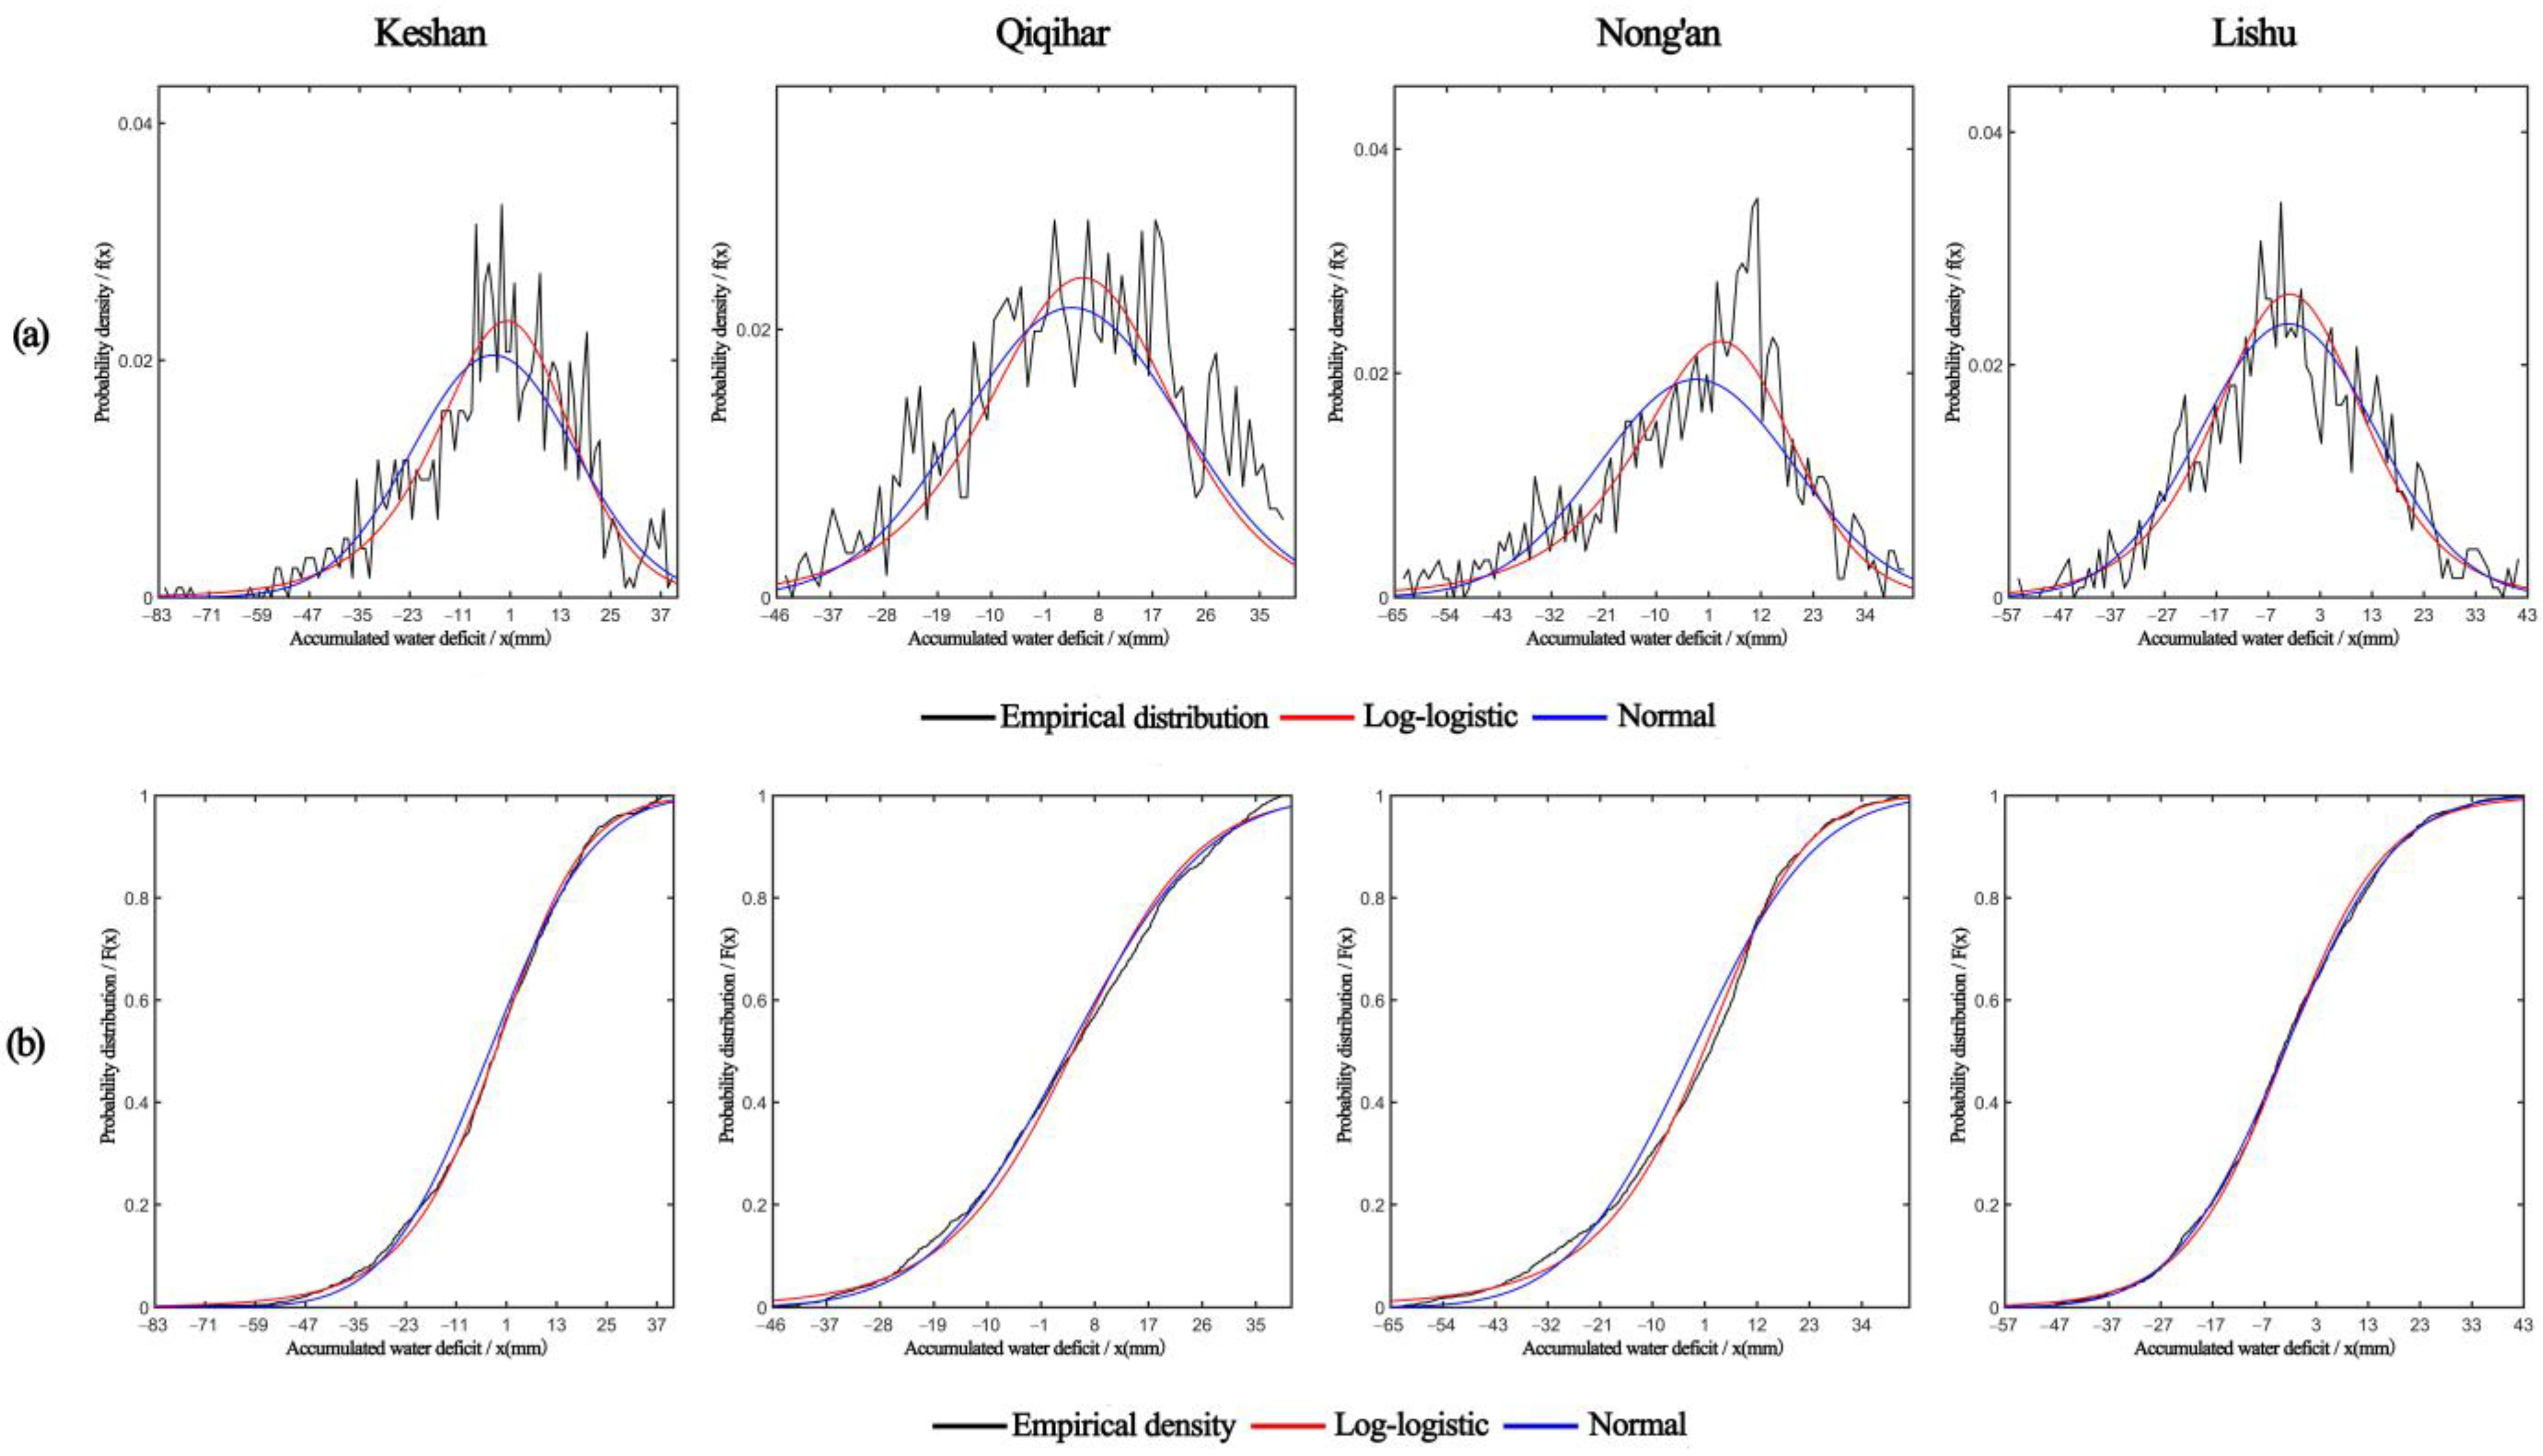
In this study, the empirical distribution was used as a reference and the normal distribution was used as a comparison to test whether the accumulated crop water deficit follows the log-logistic distribution. Taking the jointing to heading stage of spring maize as an example, we calculated the time series of the accumulated water deficit of spring maize in this stage (A3) at typical stations (Keshan station, Qiqihar station, Nong’an station, and Lishu station) in Songnen Plain. As the density curve of the actual data series can intuitively represent the data distribution, it was taken as an empirical density function. Then, by calculating the key parameters of the normal distribution and log-logistic distribution of the actual data series, the respective density curves were drawn (Figure 2a). We can see that the three-parameter log-logistic density curve is closer to the empirical density curve than the normal distribution density curve.
Similarly, from the distribution curve (Figure 2b), the coincidence degree of the three parameter Log-logistic distribution curve and the empirical distribution curve was relatively high. So the time series of cumulative crop water deficit of spring maize in Songnen Plain obeyed three parameter Log-logistic distribution, and it was feasible to fit and standardize it.
3.1.2. Comparison of Different Drought Indexes in Time Series
The commonly used drought indexes (Pa, MI, SPI, SPEI, CWDI, and CWDIa) in the study area from 1981 to 2018 were calculated to test the applicability of SCWDI. Among these indexes, SCWDI has the same meaning as CWDI and CWDIa. The larger the index value, the more serious the drought. However, it is opposite to the meaning of Pa, MI, SPI, and SPEI, that is, the smaller the index value, the more serious the drought.
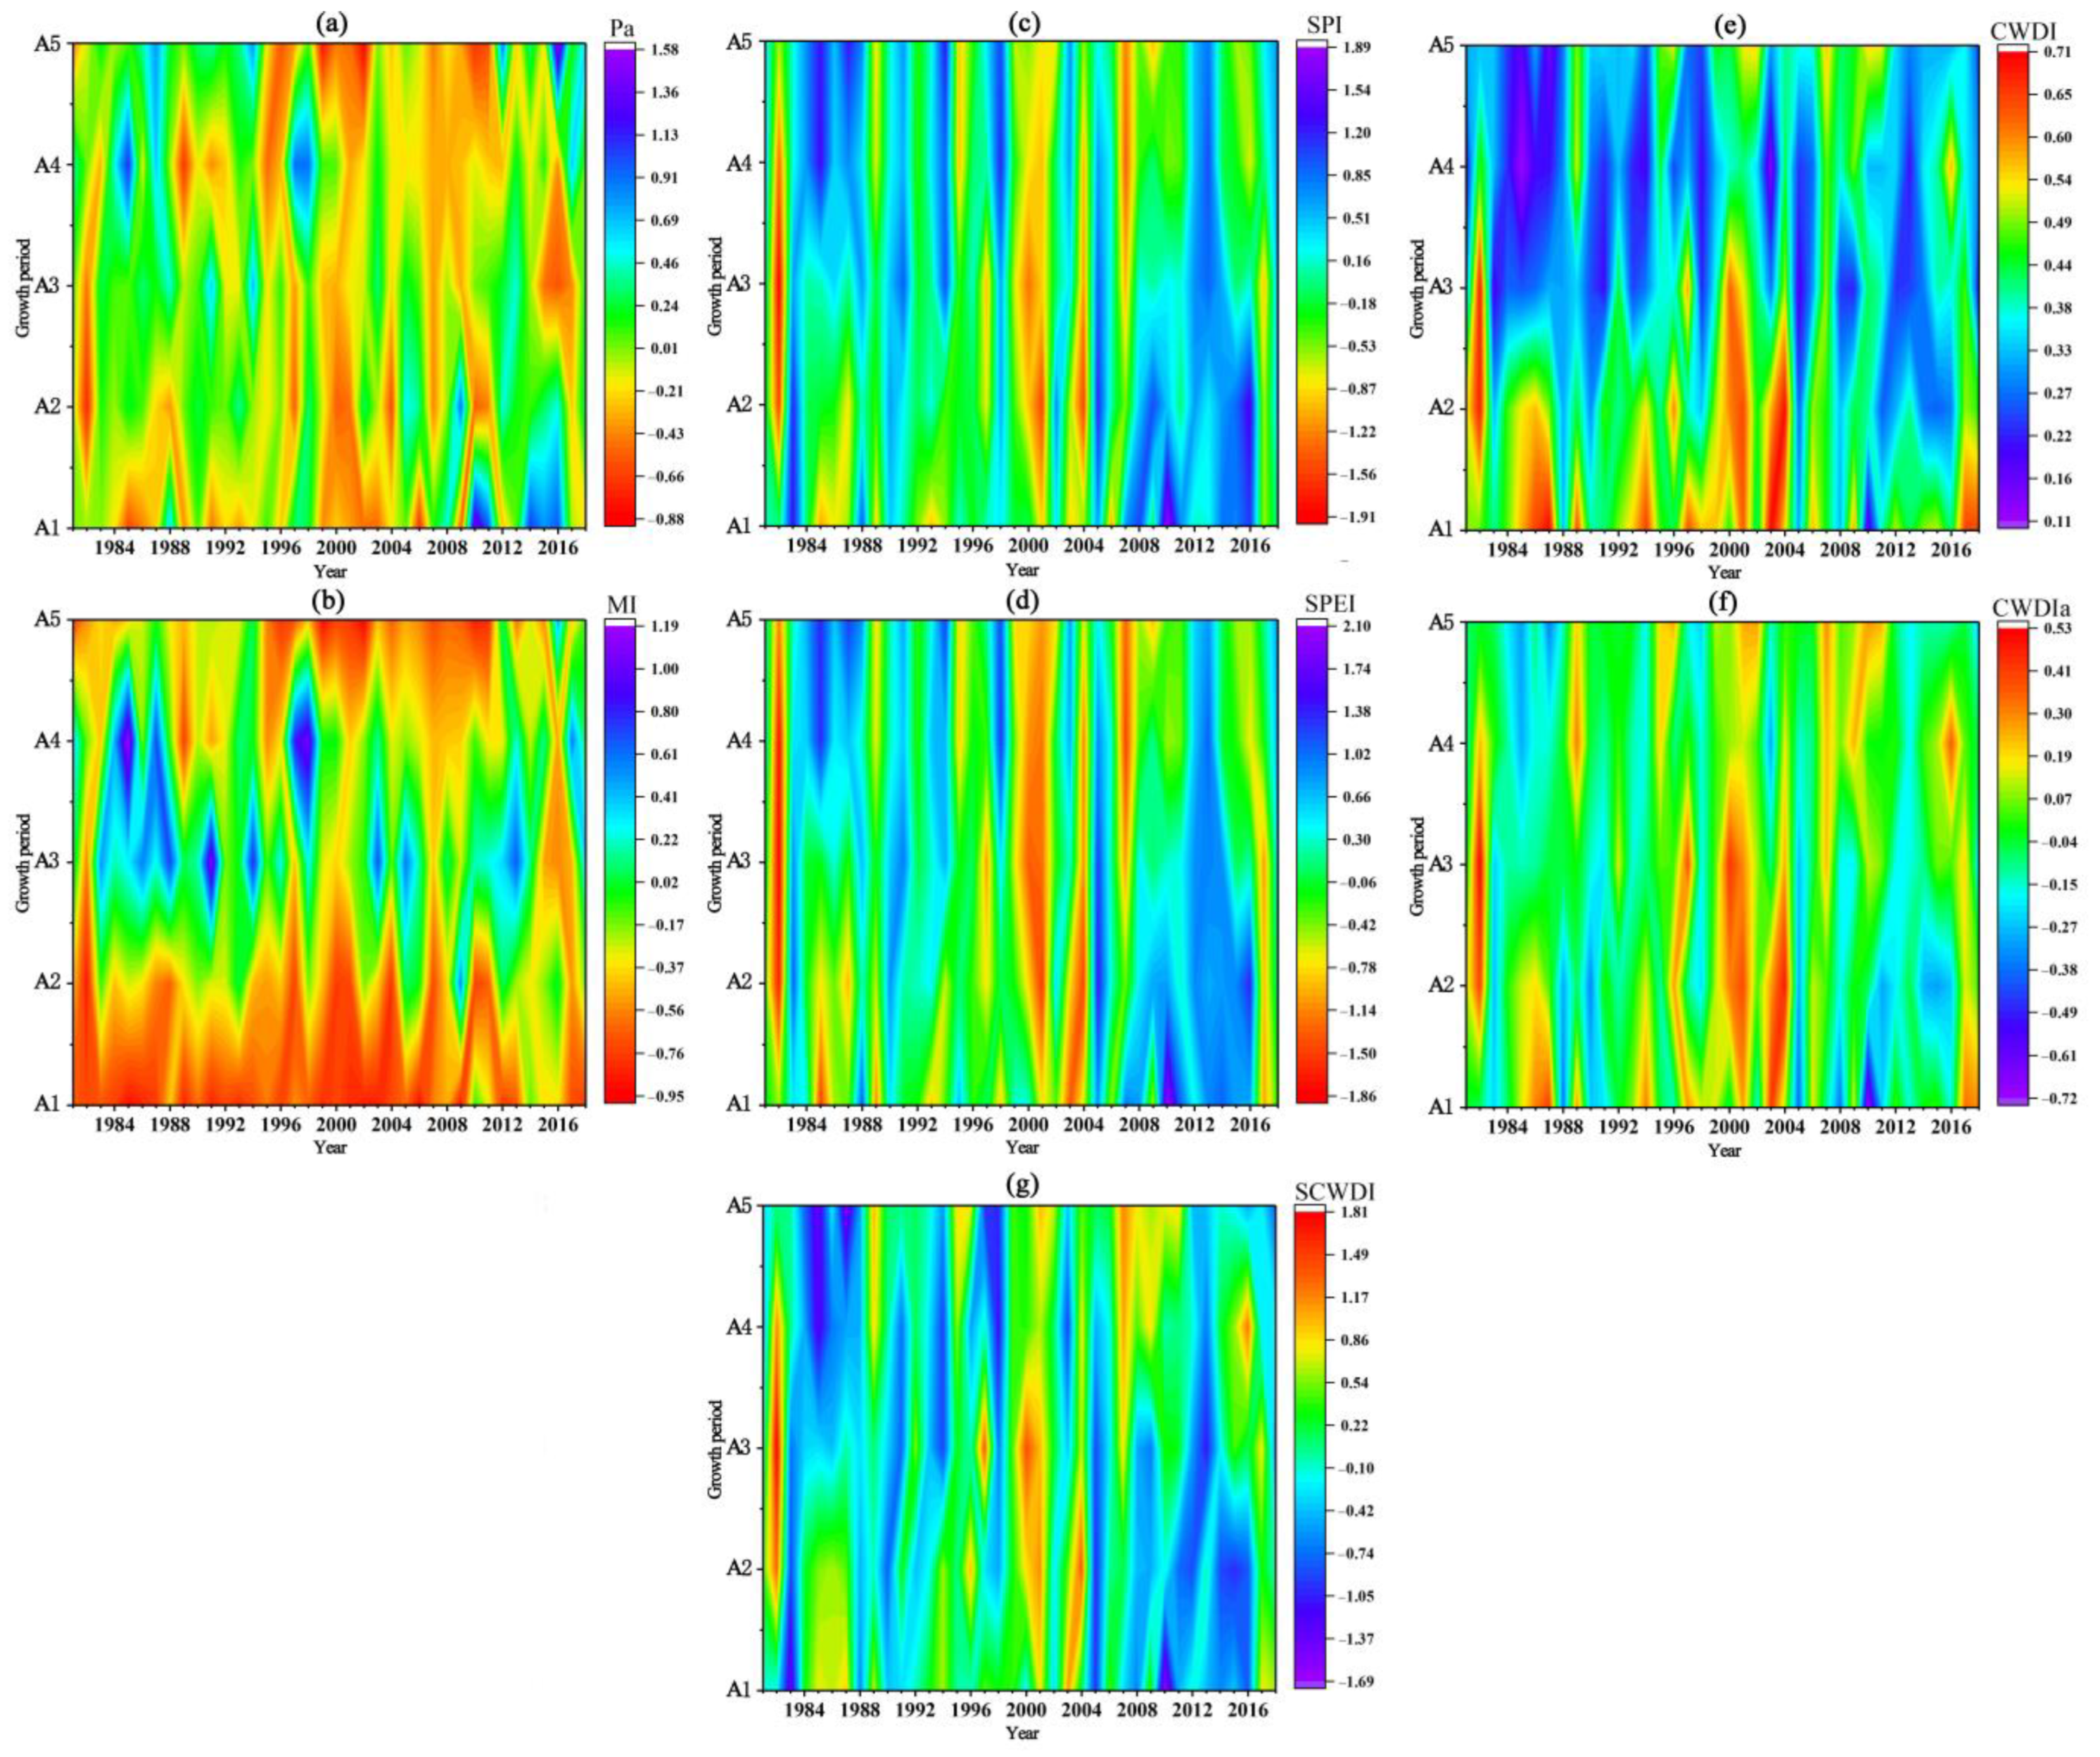
From the perspective of time series (Figure 3), although there were differences in each drought index, it can reflect the dry and wet state of spring maize in different years at various growth stages. The drought period shown by SCWDI was consistent with other drought indexes and can reflect the typical drought years, such as 1982, 1989, 2001, 2004, 2007, 2017, and so on. However, there were differences in the monitoring results of each index. In 1982, the drought severity period of spring maize reflected by SCWDI was consistent with that reflected by SPI and CWDIa; in 1989, it was consistent with the drought period reflected by MI, CWDI, and CWDIa; in 2001, it was consistent with the drought period reflected by CWDI and CWDIa; in 2004, it was basically consistent with other drought indexes except that it was different from MI; in 2007, it was consistent with the drought period reflected by SPI, SPEI and CWDIa; and in 2017, it was consistent with the drought period reflected by SPI and CWDIa. In general, the drought periods identified by SCWDI in the drought monitoring of spring maize can be consistent with the commonly used drought index.
3.1.3. Comparison of Different Drought Indexes in Space
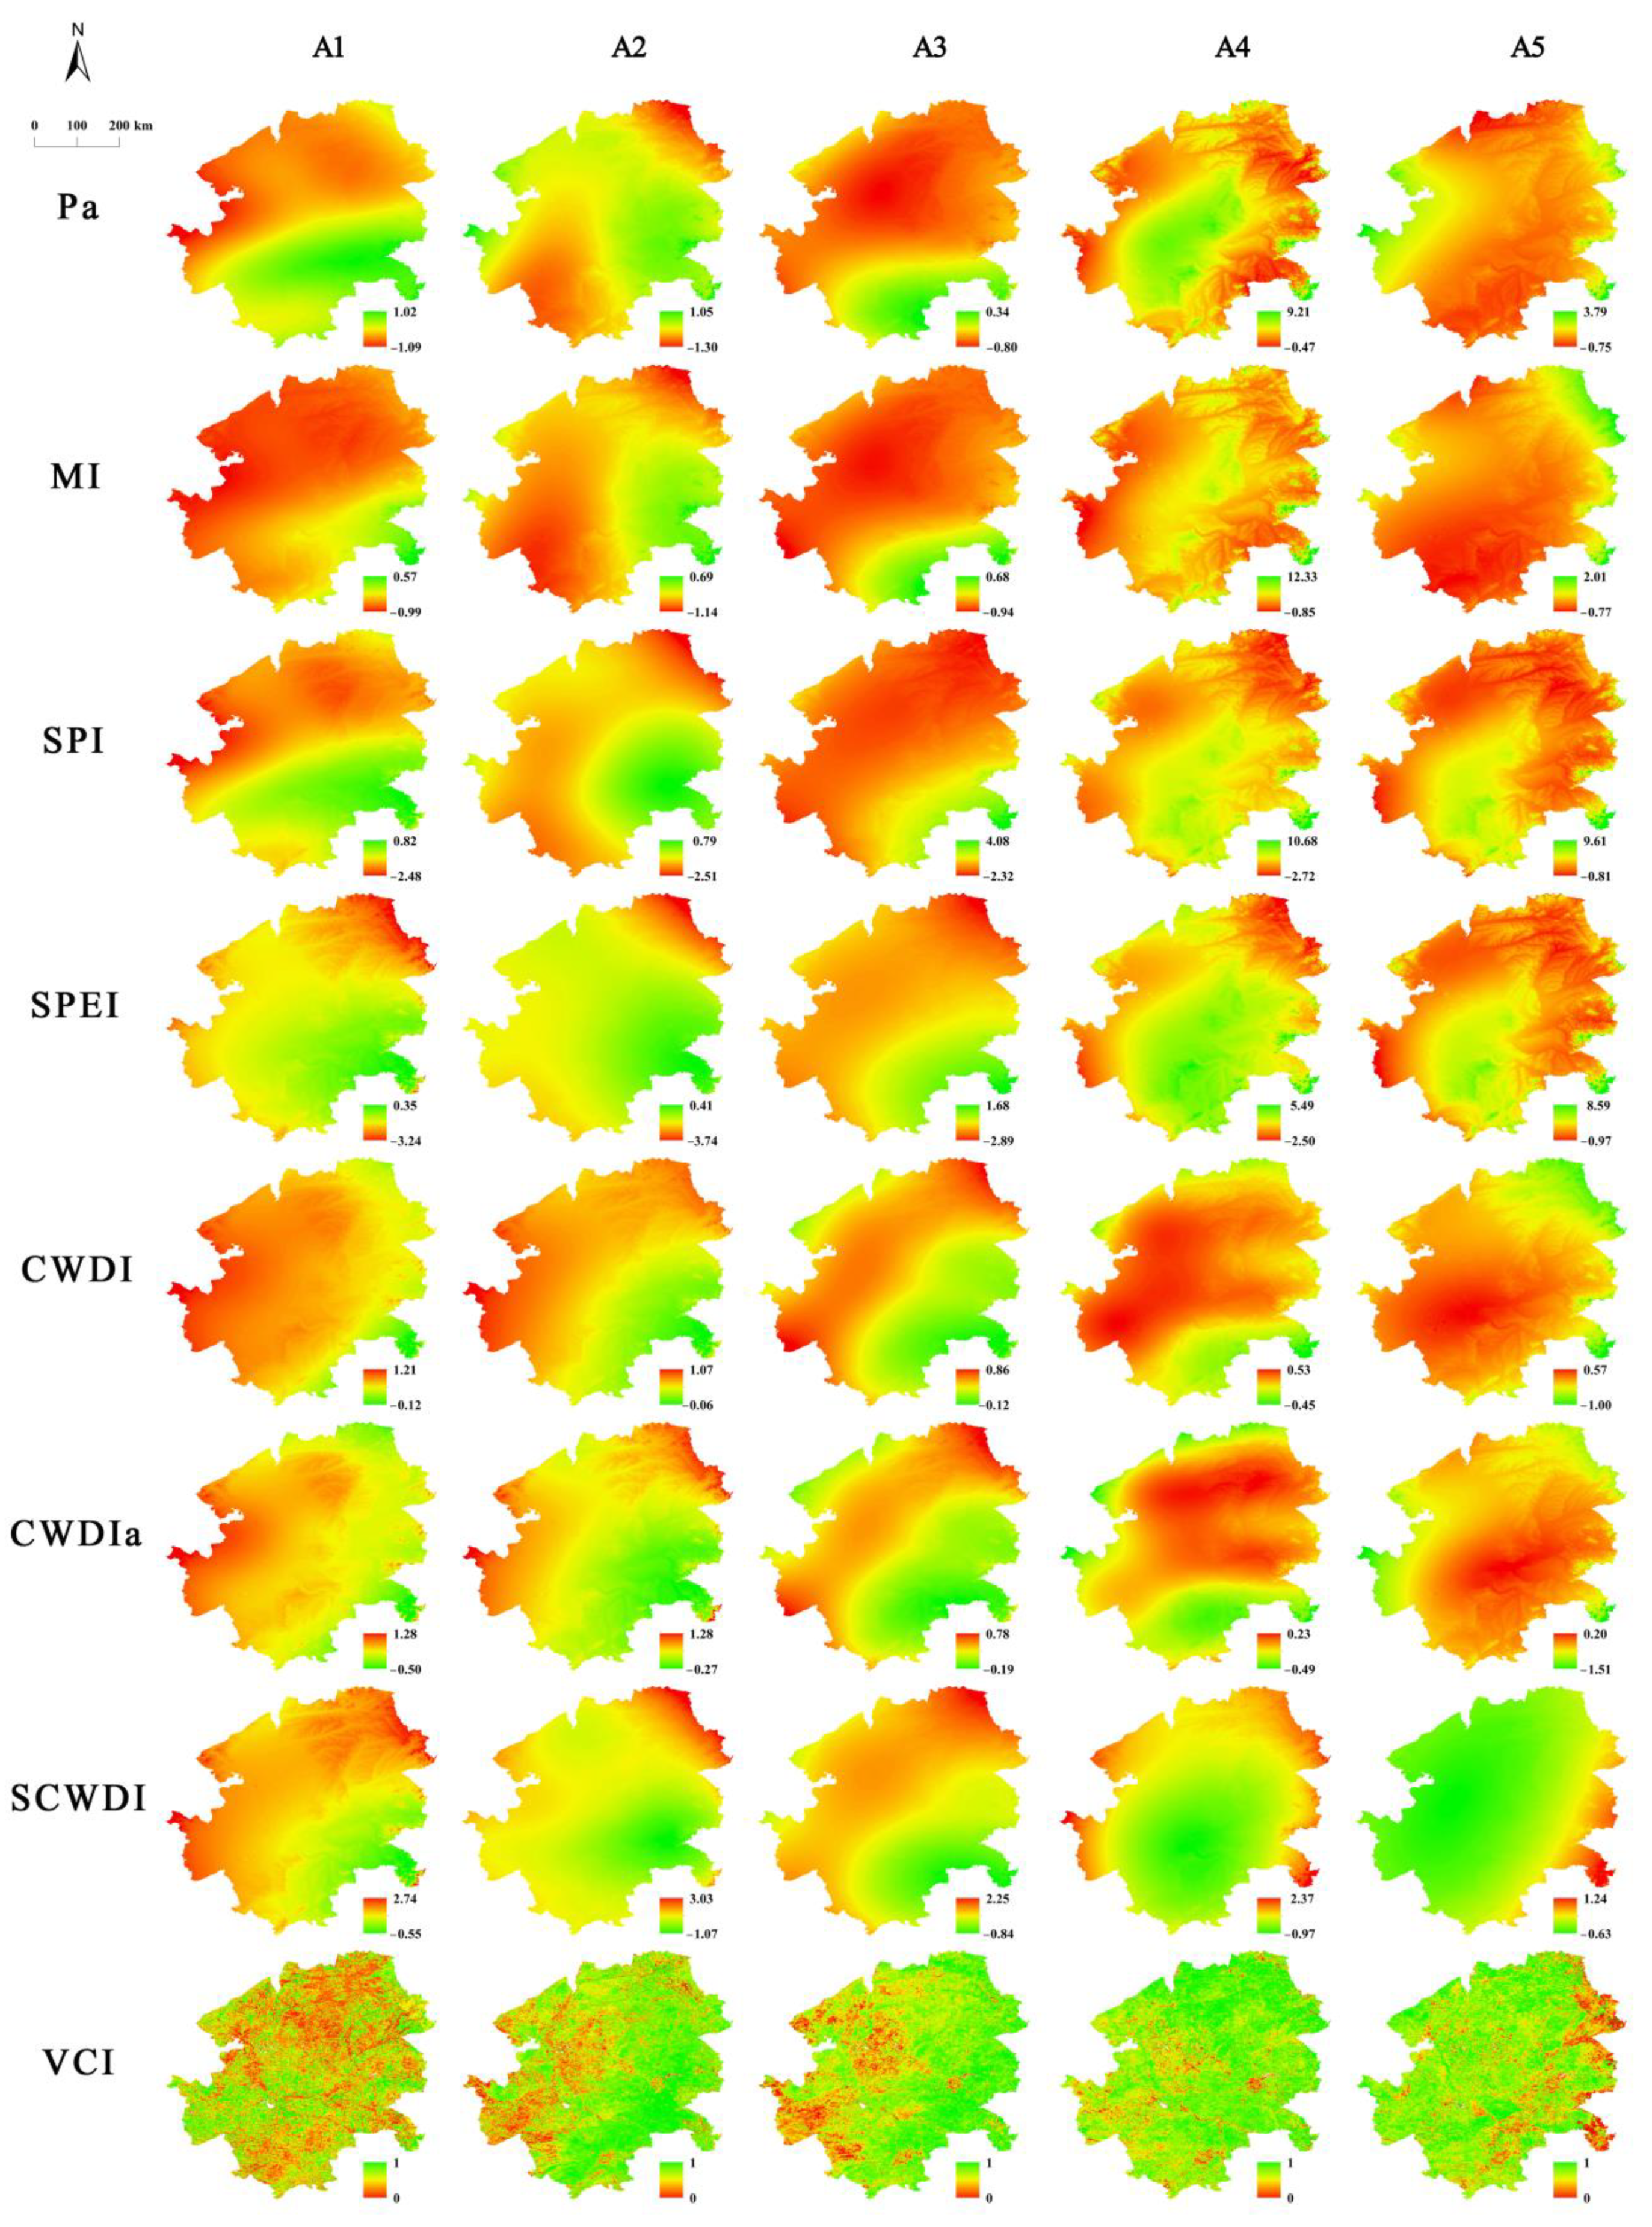
Taking the typical drought year 2007 as an example, the applicability of SCWDI was analyzed in space, and the growth state of spring maize during drought was characterized by the vegetation state index (VCI) (Figure 4). In the A1 stage, the vegetation index of spring maize was generally low, and the VCI may be low. The VCI in the northwest of Songnen Plain was relatively low and may be subject to drought stress. The drought distribution identified by Pa, SPI, SPEI, and SCWDI was similar to that of VCI. In the A2 stage, the VCI in the West and north of Songnen Plain was low, and the drought distribution identified by CWDIa and SCWDI was similar to that of VCI. In the A3 stage, the VCI in the west and north of Songnen Plain was low, and the drought distribution identified by SPEI, CWDI, CWDIa, and SCWDI was similar to that of VCI. In the A4 stage, the VCI in the east and west of Songnen Plain was low, and the drought distribution identified by SPI, SPEI, and SCWDI was similar to that of VCI. In the A5 stage, the VCI in the east of Songnen Plain was low, and only the drought distribution identified by SCWDI was similar to that of VCI. In general, compared with other drought indexes, SCWDI had a greater advantage in drought monitoring of spring maize at various growth stages.
3.2. Spatial and Temporal Variation in Spring Maize Drought in Songnen Plain
3.2.1. Temporal Variation in Spring Maize Drought
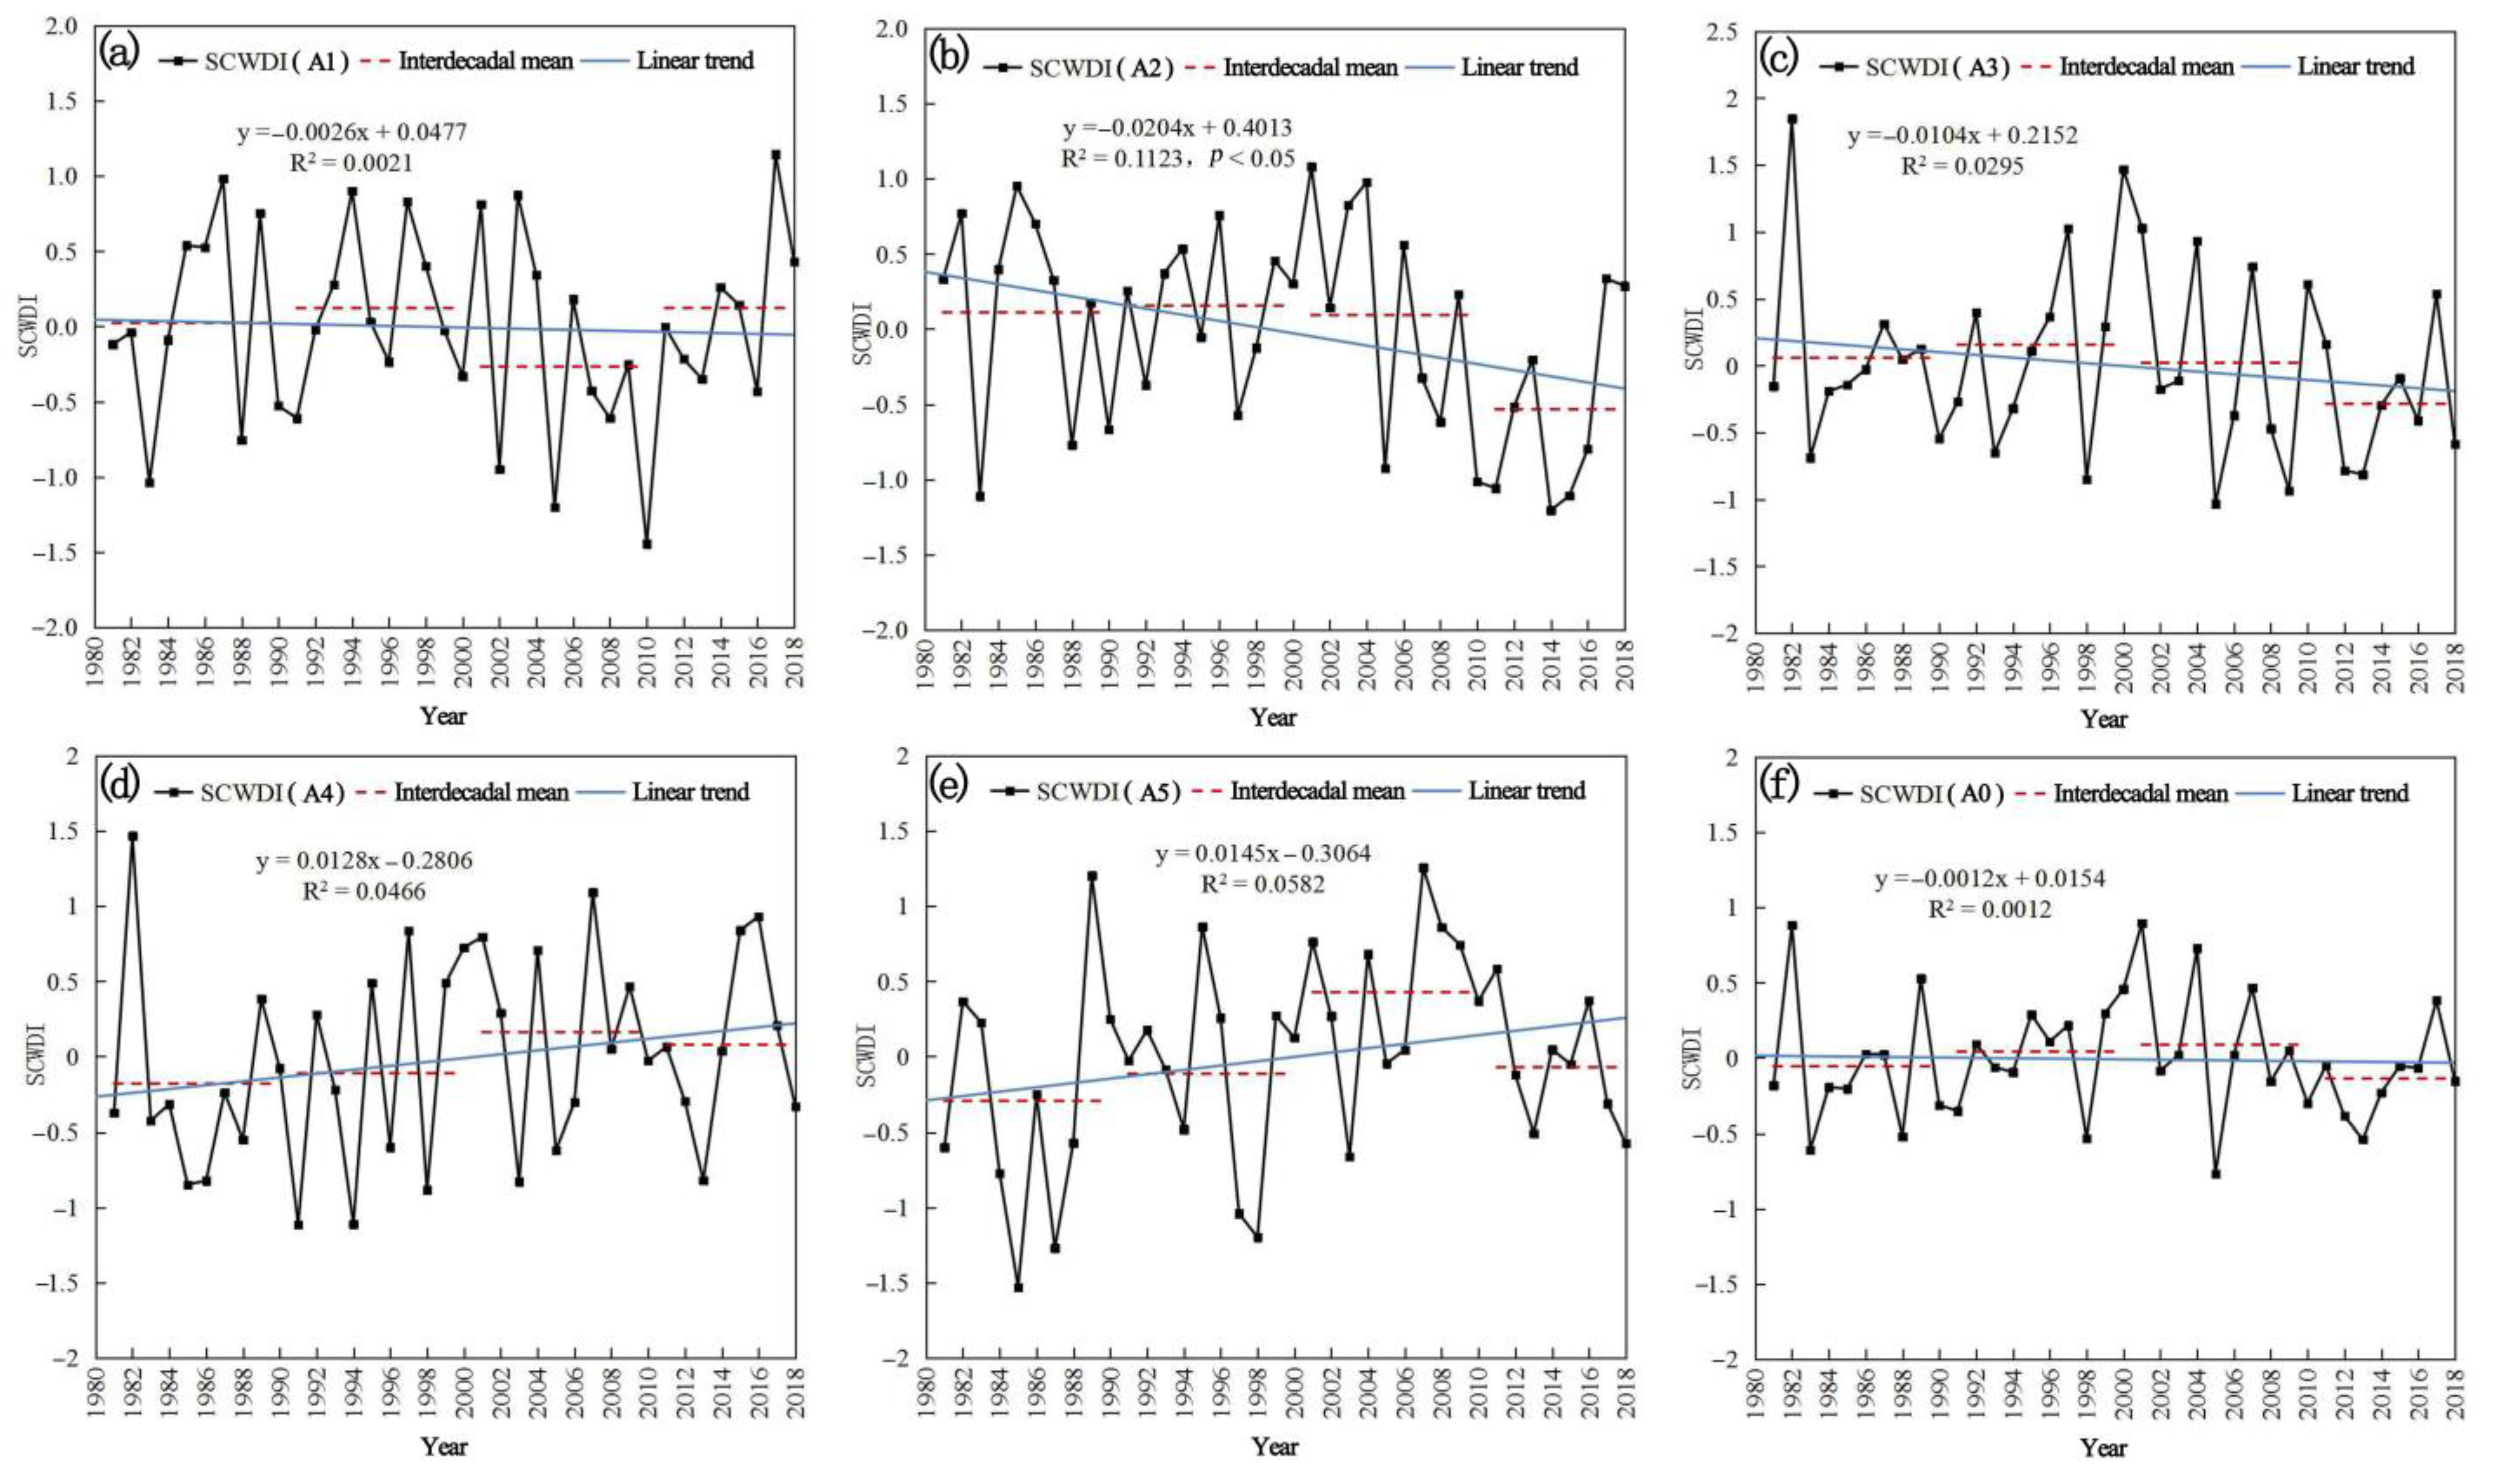
The temporal variation in spring maize drought at each growth stage in Songnen Plain from 1981 to 2018 was analyzed. In the A1 stage (Figure 5a), SCWDI also showed a decreasing trend (−0.026/10a), with a small range. The driest year was 2017. On the interdecadal scale, it showed a trend of first increasing, then decreasing, and then increasing. In the 2010s, there were many relatively dry years. In the A2 stage (Figure 5b), SCWDI showed a significant decreasing trend (−0.204/10a) (p < 0.05), and the driest year was 2001. On the interdecadal scale, SCWDI increased first and then decreased. The driest years were the mostly in the 1990s, and the drought has been relatively alleviated in recent years. In the A3 stage (Figure 5c), SCWDI showed a decreasing trend (−0.104/10a), and 1982 was the driest year; the change trend on the decadal scale was similar to that in the A2 stage. In the A4 and A5 stages (Figure 5d,e), the change trend of SCWDI was similar, showing an increasing trend (0.128/10a and 0.145/10a). In the A4 stage, the driest year was 1982 and, in the A5 stage, the driest year was 2007. On the interdecadal scale, SCWDI in both stages showed a trend of first increasing and then decreasing. The two stages in the 2000s showed relative drought, while the drought in recent years has been relatively alleviated. From 1981 to 2018, the drought index (SCWDI) of spring maize in the whole growth stage showed a decreasing trend with a small slope (−0.012/10a) (Figure 5f). The driest year was 1982. On the interdecadal scale, SCWDI showed a trend of first increasing and then decreasing. In the 2000s, it was relatively dry. In recent years, the drought of spring maize has been alleviated.
3.2.2. Spatial Variation in Spring Maize Drought
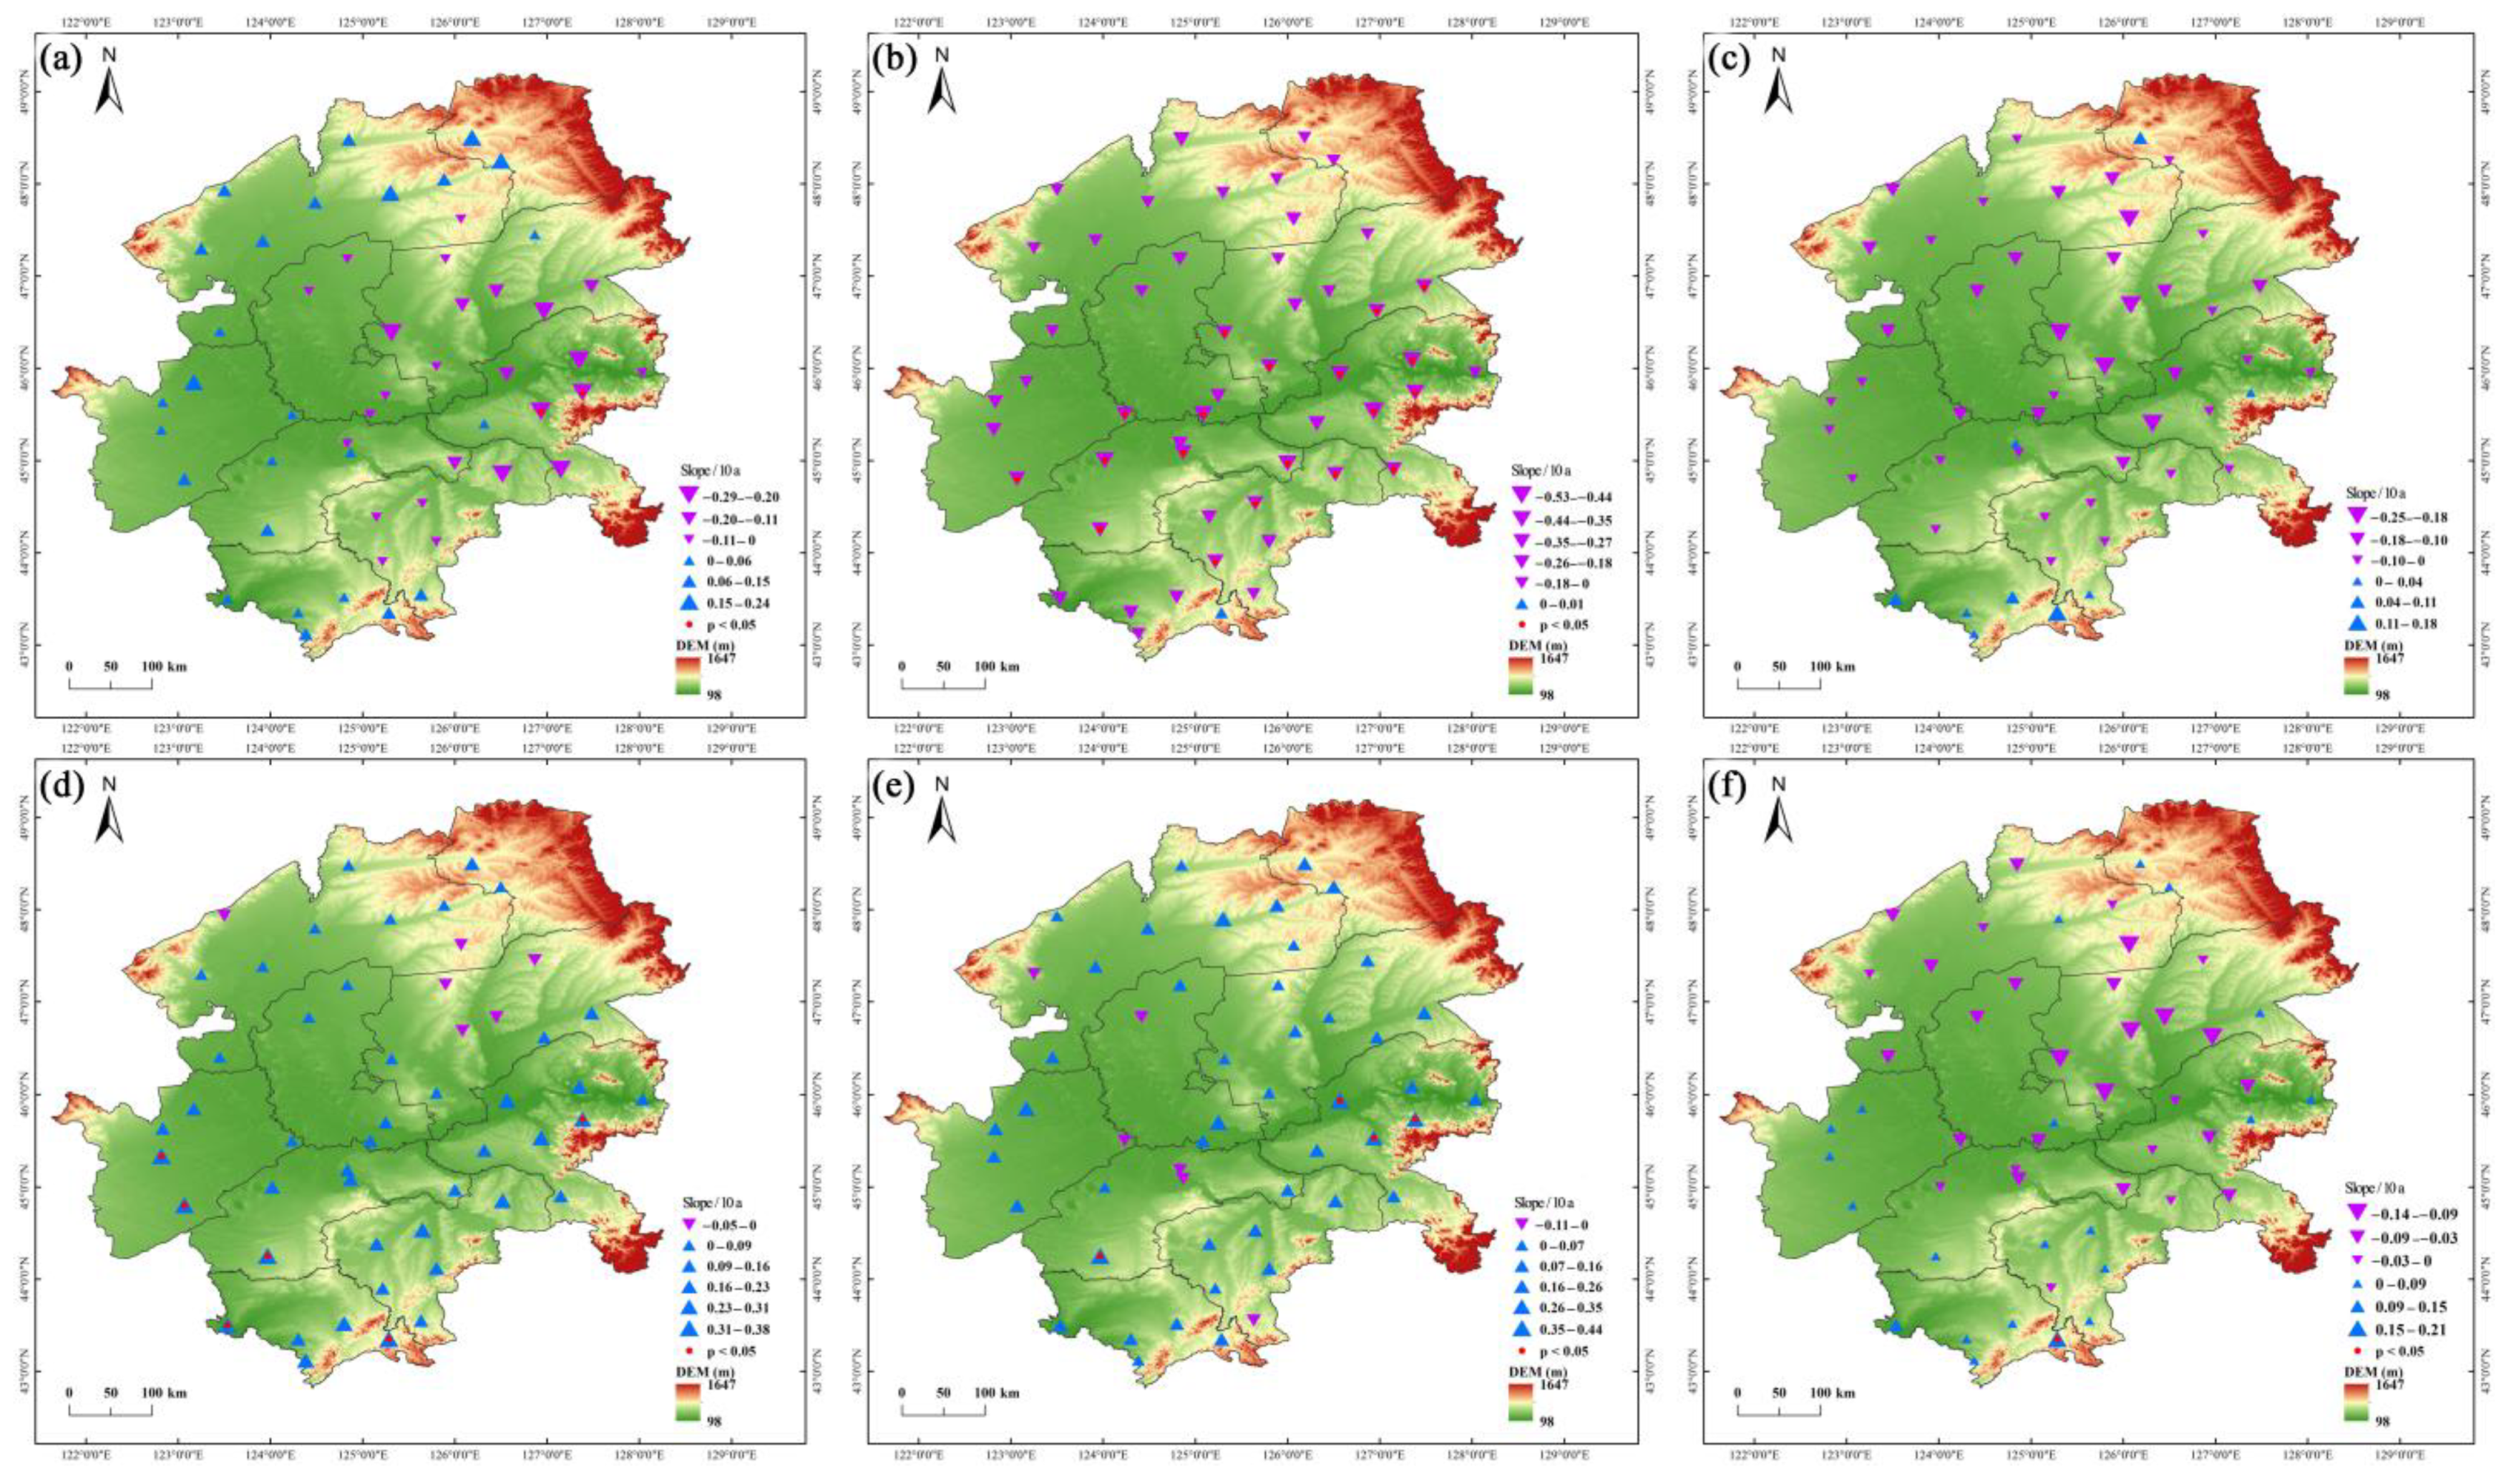
The drought characteristics of spring maize in Songnen Plain were analyzed in spatial. In the A1 stage (Figure 6a), the drought of spring maize in various regions of Songnen Plain showed an increasing trend (0~0.24/10a) or decreasing trend (−0.29~0/10a), of which the decreasing trend of drought was mainly distributed in Suihua City, Harbin City, and Changchun City, and the increasing trend of drought was mainly in other regions. In the A2 stage (Figure 6b), the drought of spring maize in the whole area of Songnen Plain showed a decreasing trend (−0.53~0/10a), and the significant areas were mainly distributed in the eastern and central parts of Songnen Plain. In the A3 stage (Figure 6c), the drought of spring maize in most areas of Songnen Plain showed a decreasing trend (−0.25~0/10a), and the increasing trend was mainly distributed in Siping City (0~0.18/10a). In the A4 stage (Figure 6d), the drought trend of spring maize in most areas of Songnen Plain mainly increased (0~0.45/10a), and a significant increase was distributed in the southwest. The drought of spring maize in the northwest of Suihua City showed a decreasing trend. In the A5 stage (Figure 6e), the drought trend of spring maize in most areas of Songnen Plain also increased (0~0.44/10a), and the drought reduction trend was sporadically distributed. In the whole growth stage (Figure 6f), the drought trend of spring maize in Songnen Plain was mainly decreasing (−0.14~0/10a), and the drought of spring maize in the south and southwest showed an increasing trend (0~0.21/10a).
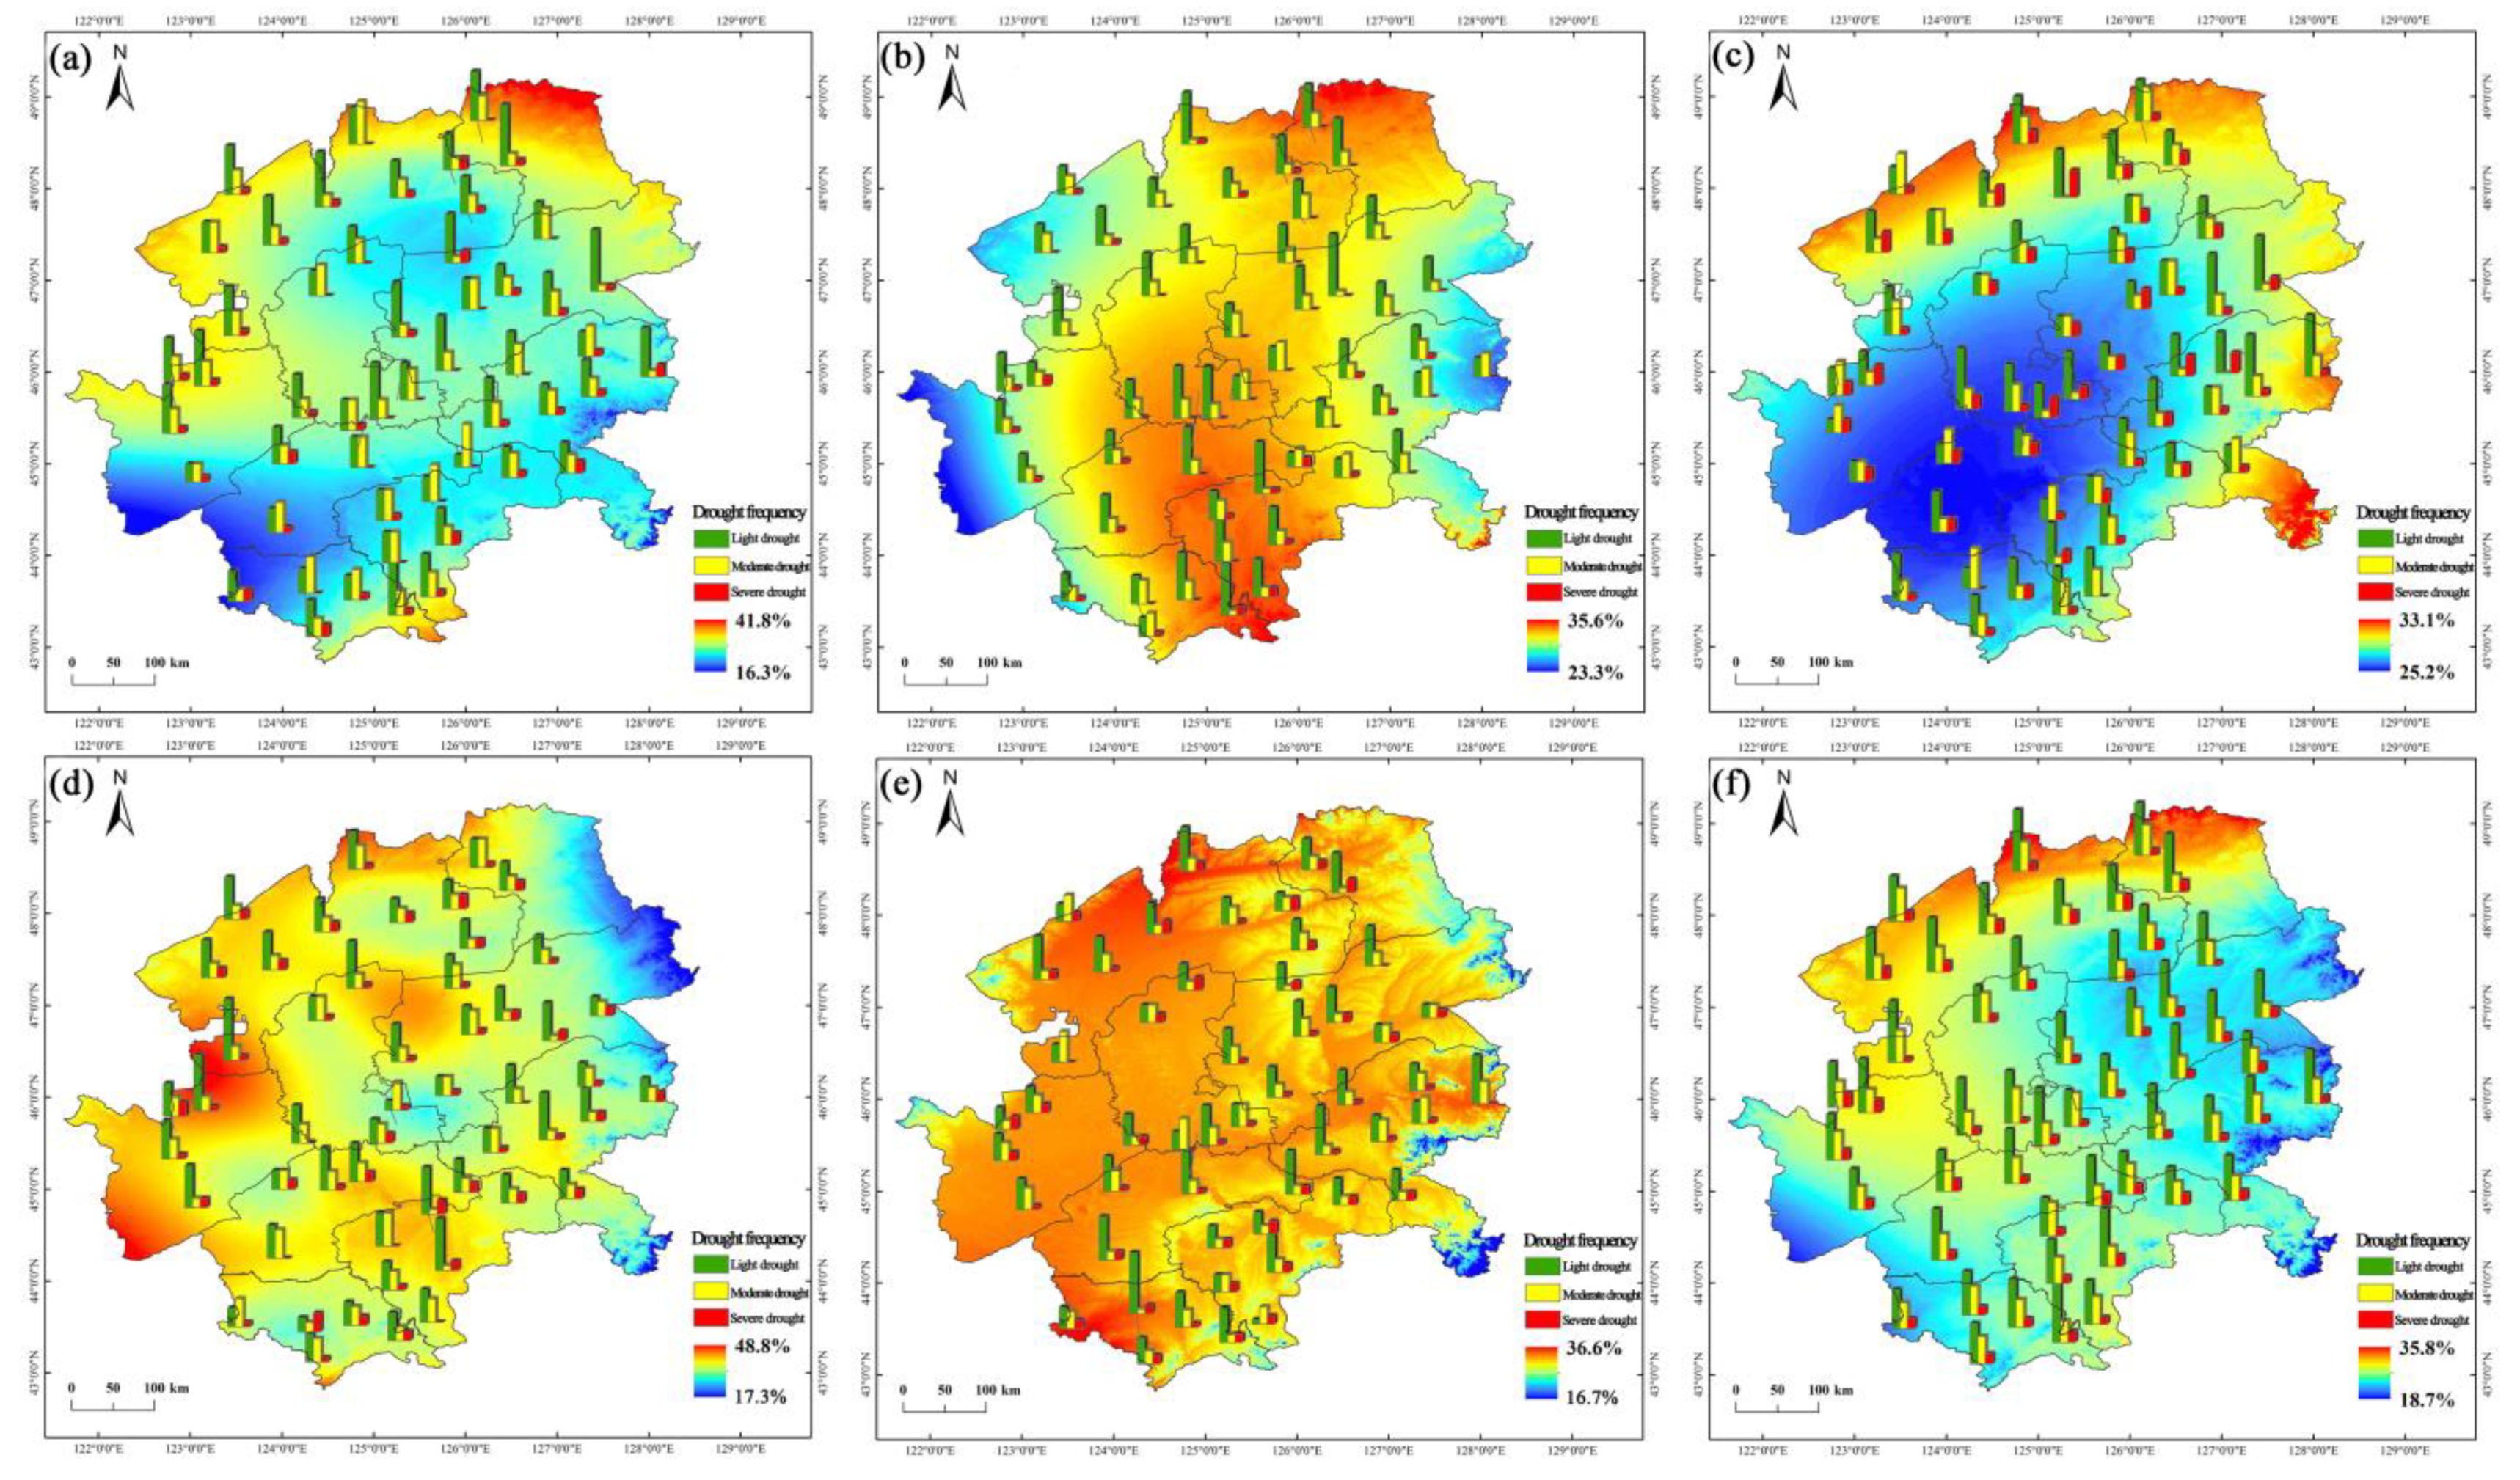
We also analyzed the spatial characteristics of drought frequency of spring maize in Songnen Plain. In the A1 stage (Figure 7a), the drought frequency range of spring maize in Songnen Plain was 16.3–41.8%, and the areas with high drought frequency were mainly distributed in the north and northwest. Most of the spring maize in Songnen Plain was dominated by light drought. The frequency of medium drought was relatively high in the central and southern regions, and the heavy drought was mainly distributed in the surrounding areas of Songnen Plain. In the A2 stage (Figure 7b), the drought frequency range of spring maize in Songnen Plain was 23.3–35.6%, and the drought frequency was high in most areas. The whole area of spring maize in Songnen Plain was dominated by light drought, while the frequency of medium drought was high in the central part and the heavy drought was mainly distributed in the west and east. In the A3 stage (Figure 7c), the drought frequency range of spring maize in Songnen Plain was 25.2–33.1%, and the areas with high drought frequency were mainly distributed in the northwest and east. In most areas of Songnen Plain, spring maize was mainly subject to light drought, and there were more areas with a relatively high frequency of medium drought and heavy drought. In the A4 stage (Figure 7d), the drought frequency range of spring maize in Songnen Plain was 17.3–48.8%, and the areas with high drought frequency were mainly distributed in the west. Songnen Plain was mainly characterized by light drought. There were many areas with relatively high moderate drought, and the frequency of heavy drought in the northwest and southeast was relatively high. In the A5 stage (Figure 7e), the drought frequency range of spring maize in Songnen Plain was 16.7–36.6%. The drought frequency in the whole region was relatively high, mainly light drought. The regions with a relatively high frequency of medium drought were mainly distributed in the middle, and the northern and southern regions had a relatively high frequency of heavy drought. In the whole growth stage (Figure 7f), the drought frequency range of spring maize in Songnen Plain was 18.7–35.8%, and the areas with a high drought frequency were mainly distributed in the northwest. Most areas of Songnen Plain were dominated by light drought. The frequency of moderate drought was relatively high in the central and southern regions and the frequency of severe drought was relatively high in the northwest and southeast.
3.3. Periodic Variation in Spring Maize Drought in Songnen Plain
Wavelet analysis can better show the time–frequency characteristics and periodicity of data series and is widely used in research. By analyzing the periodicity of spring maize drought, we can better understand the law of drought change and perform the corresponding disaster prevention and early warning measures. In this study, Morlet wavelet transform was used to analyze the drought of spring maize in the whole growth stage from 1981 to 2018 in Songnen plain to obtain the periodic characteristics of drought (Figure 8).
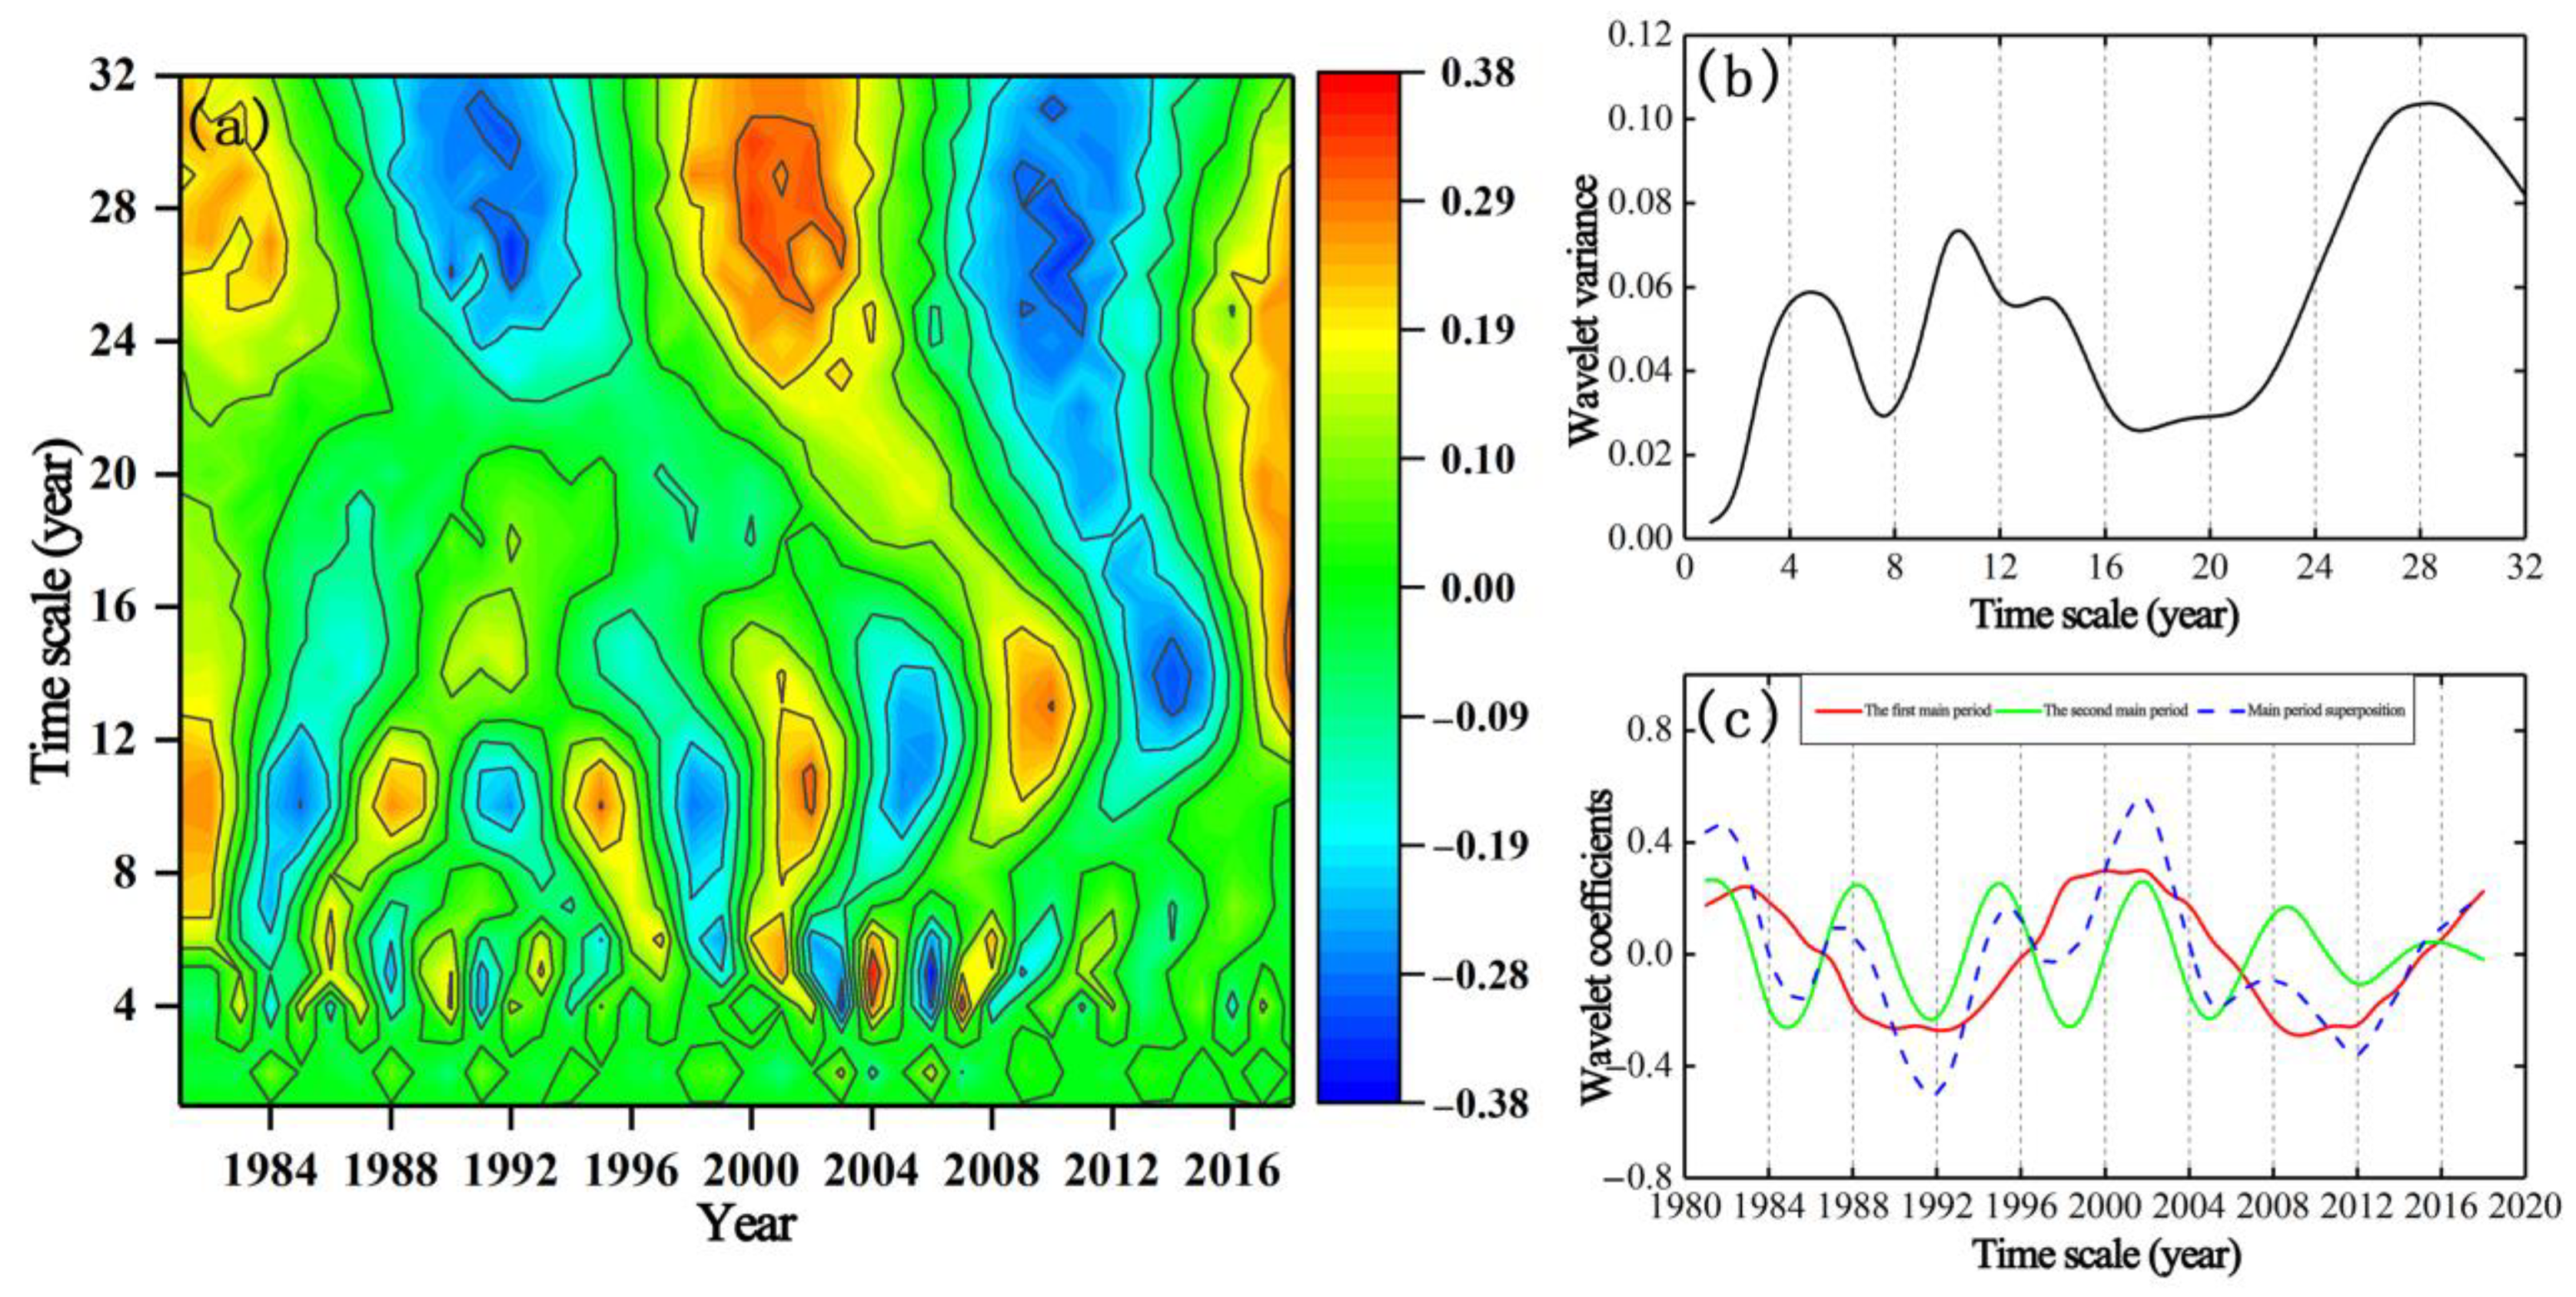
The strength of the drought signal was usually expressed by the size of the wavelet coefficient. In the contour of the wavelet coefficient, if the center was positive, the period was dry; if it was negative, the period was light. In the whole growth stage of spring maize, according to the contour map of the wavelet coefficient (Figure 8a), the drought of spring maize in Songnen Plain was obvious in three time scales of 4–6 years, 9–12 years, and 24–32 years. On the time scale of 24–32 years, some cycle centers were not completely closed, and the periodicity was obvious. Before 1986, in 1996–2006, and after 2015, the wavelet real part was positive, indicating that the drought of spring maize in Songnen Plain was more significant in this period. In 1987–1995 and 2007–2014, the wavelet real part was negative, indicating that the drought of spring maize in Songnen Plain was less significant in this period. On the time scale of 9–12 years, the periodic signal before 2012 was strong and the periodic signal after 2012 was weak. Before 2012, there were mainly five periods with more drought and four periods with less drought. On the time scale of 4–6 years, the periodic performance was unstable, with obvious performance during 1985–2012 and weak performance before 1985 and after 2012. The main time scale (i.e., the main period) was mainly determined from the maximum value of small wave variance. It can be seen that the three main time scales of drought in the whole growth period of spring maize in Songnen Plain were 29 years (the first main period), 10 years (the second main period), and 4 years (the third main period) (Figure 8b). In the study, the first two main cycles were often used to reflect the change in regional drought. By drawing the time–frequency diagram of the first main cycle and the second main cycle (Figure 8c), it can be seen that the first main cycle was periodic and stable, mainly experiencing two dry and wet cycles. After 2018, the third drought will be more significant than in previous years. The second main cycle was periodically stable before 2012 and then weakened. It experienced five dry and wet cycles in total. After 2018, there may be years with less drought. By superimposing the two main cycles, the two main cycles of 1981–1983, 2000–2003, and 2015–2017 fluctuated in positive phases, indicating that the drought was serious in these periods. The two main cycles of 1990–1993 and 2011–2014 fluctuated in negative phases, indicating that the drought was weak in these periods. From the drought cycle in recent years, the second main cycle of drought in the whole growth stage of spring maize in Songnen Plain was weakened, mainly controlled by the first main cycle, and the drought years may increase.
4. Discussion
The impact of drought on agricultural production is incalculable, and seriously restricts agricultural production and human life. Actively carrying out the monitoring and risk assessment of drought on agricultural production has important practical significance for reducing the loss from drought disasters and ensuring food security [39,41,52]. The commonly used drought index has played a great role in crop drought monitoring [22,24,28,31]. However, owing to the different construction principles, each index has different applicability in regional drought monitoring [32,52]. In this study, we can see that there were certain differences in analyzing the spatial and temporal changes in spring maize drought using different drought indexes. According to the previous analysis, the newly established index (SCWDI) was only consistent with some drought indexes in drought monitoring of spring maize. To further explore the relationship between SCWDI and common drought indexes (Pa, MI, SPI, SPEI, CWDI, and CWDIa), we calculated the correlation coefficient between SCWDI and common drought indexes in different growth stages of spring maize (Figure 9).
In the A1 stage (Figure 9a), the correlation coefficient between SCWDI and each index was above 0.67 and significantly correlated, among which the correlation coefficient with CWDI and CWDIa was the highest, and the correlation coefficient was 0.92. In the A2 stage (Figure 9b), SCWDI was significantly correlated with each index, and the correlation coefficient with CWDI was 0.97. In the A3 stage (Figure 9c), the correlation between SCWDI and each index was significant, and the correlation coefficient was high, among which the correlation with CWDI and CWDIa was the best, and the correlation coefficient was 0.92. In the A4 stage (Figure 9d), the correlation between SCWDI and each index was also significant, among which the correlation with CWDI and CWDIa was the best, and the correlation coefficient was 0.95. In the A5 stage (Figure 9e), the correlation between SCWDI and each index was significant, among which the correlation with CWDI and CWDIa was the best, and the correlation coefficient was 0.95. In the whole growth stage (Figure 9f), the correlation between SCWDI and each index was significant, and the correlation coefficient was high, of which the correlation with CWDI was the best, and the correlation coefficient was 0.98. From the above analysis, it can be seen that SCWDI has a good correlation with the commonly used drought indexes (Pa, MI, SPI, SPEI, CWDI, and CWDIa), which can comprehensively contain some information of each drought index and has great advantages in drought monitoring.
To further reflect the applicability of SCWDI in drought monitoring, we collected actual drought events in a typical drought year (2007) to verify the feasibility of SCWDI. According to the actual drought event records in 2007 (Table 1), in the A1 stage, light drought occurred in Zhaoyuan and Lishu, moderate drought occurred in Songyuan and Changling, and drought mainly occurred in the south of Songnen Plain, which was consistent with the description of SCWDI. In the A2 stage, light drought occurred in Zhaoyuan and Lishu, moderate drought occurred in Changling, and drought mainly occurred in the south of Songnen Plain, which was also consistent with the description of SCWDI. In the A3 stage, Qinggang, Yushu, and Shuangyang suffered light drought and Songyuan, Changling, and Lishu suffered moderate drought, and these areas also suffered drought in the drought distribution described by SCWDI. In the A4 stage, moderate drought occurred in Wudalianchi, Qianguo, Qing’an, Longjiang, Wuchang, and Suiling and severe drought occurred in fufu, Tailai, Songyuan, Zhaoyuan, and Changling. SCWDI showed that drought occurred in these areas. In the A5 stage, Wuchang suffered from light drought; Songyuan suffered from moderate drought; and Zhaoyuan, Changling, and Fuyu suffered from severe drought. In the drought distribution indicated by SCWDI, these regions all suffered from different degrees of drought. In general, SCWDI has certain applicability in drought monitoring of spring maize in Songnen Plain.
In practice, the process of crop drought is complex [4,48,52,53]. The drought index may have some shortcomings, but it can also play a certain role. Owing to the long time series and high accuracy of meteorological observation data, this study described more meteorological drought indexes, and soil relative humidity was also a commonly used agricultural drought monitoring index, which can also characterize the drought characteristics of crops [14]. Considering that the time and space of the soil relative humidity data in the existing area are not continuous, and it cannot well express the spatial and temporal characteristics of drought, it is rarely used in this study [61]. In future research, more applicable soil humidity data will be collected to further verify the applicability of the drought index constructed in this study.
5. Conclusions
In this study, a new crop drought index (SCWDI) was developed and its applicability was tested. On this basis, the spatial and temporal characteristics of spring maize drought in Songnen Plain were explored. The main findings were as follows:
- (1)
- It was feasible to construct the standardized crop water deficit index (SCWDI) by combining the ideas of CWDI and SPEI. Compared with the commonly used drought indexes (Pa, MI, SPI, SPEI, CWDI, and CWDIa), SCWDI had great advantages in drought monitoring of spring maize.
- (2)
- In the whole growth stage of spring maize, the change trend of SCWDI in Songnen Plain was small in the temporal series (−0.012/10a). Spatially, the drought trend of spring maize was mainly decreasing (−0.14~0/10a), while the drought of spring maize in the south and southwest showed an increasing trend (0~0.21/10a). The drought frequency of spring maize in each growth stage was mainly light drought in most regions. In the whole growth stage, the moderate drought frequency in the central and southern regions was relatively high and the severe drought frequency in the northwest and southeast was relatively high.
- (3)
- In terms of periodicity, in the whole growth stage of spring maize, the three main drought cycles in Songnen Plain were 29 years, 10 years, and 4 years. In the next few years, the drought of spring maize in Songnen Plain was controlled by the first main cycle, and the drought years may increase.
The drought monitoring of crops was very complicated. Our research improved the applicability of the drought index on the basis of the existing drought monitoring and provided ideas for the construction of the drought index in the future. As SCWDI had only been verified in Songnen Plain, its universal applicability still needs to be studied, and future work will be carried out in other regions.
Author Contributions
Conceptualization, Z.P.; methodology, Z.P.; formal analysis, B.W.; investigation, B.W.; writing—original draft preparation, Z.P.; writing—review and editing, B.W.; visualization, Z.P.; supervision, B.W. All authors have read and agreed to the published version of the manuscript.
Funding
This research was supported by the Key Scientific Research Projects of Colleges and Universities of Henan Province (grant number 23A170021), the Interdisciplinary Sciences Project of Nanyang Institute of Technology (grant number NGJC-2022-16), and the Doctoral Research Initiation Fund Program of Nanyang Institute of Technology (grant number NGBJ-2022-36).
Institutional Review Board Statement
Not applicable.
Informed Consent Statement
Not applicable.
Data Availability Statement
The data presented in this study are available upon request from the corresponding author.
Acknowledgments
We would like to thank the National Climatic Centre of the China Meteorological Administration for providing the climate database, the NASA official website for providing the MODIS NDVI data, and the Data Center for Resources and Environmental Sciences and the Chinese Academy of Sciences for providing basic data used in this study.
Conflicts of Interest
The authors declare no conflict of interest.
References
- IPCC. Climate Change 2014: Impacts, Adaptation, and Vulnerability; Cambridge University Press: Cambridge, UK, 2014. [Google Scholar]
- Ju, J.; Wu, C.; Yeh, J.F.; Dai, H.; Hu, B.X. Global precipitation-related extremes at 1.5 °C and 2 °C of global warming targets: Projection and uncertainty assessment based on the CESM-LWR experiment. Atmos. Res. 2021, 264, 105868. [Google Scholar] [CrossRef]
- Wu, J.; Han, Z.; Li, R.; Xu, Y.; Shi, Y. Changes of extreme climate events and related risk exposures in Huang-Huai-Hai river basin under 1.5–2 °C global warming targets based on high resolution combined dynamical and statistical downscaling dataset. Int. J. Climatol. 2021, 41, 1383–1401. [Google Scholar] [CrossRef]
- Chen, Q.; Qu, Z.; Ma, G.; Wang, W.; Dai, J.; Zhang, M.; Wei, Z.; Liu, Z. Humic acid modulates growth, photosynthesis, hormone and osmolytes system of maize under drought conditions. Agric. Water Manag. 2022, 263, 107447. [Google Scholar] [CrossRef]
- Xu, Y.; Zhao, Y.; Zhai, P. IPCC special report SRCCL’s new cognition and Enlightenment on climate change and food security. Res. Prog. Clim. Chang. 2020, 16, 13. [Google Scholar] [CrossRef]
- Liu, K.; Harrison, M.T.; Yan, H.; Liu, D.L.; Meinke, H.; Hoogenboom, G.; Wang, B.; Peng, B.; Guan, K.; Jaegermeyr, J.; et al. Silver lining to a climate crisis in multiple prospects for alleviating crop waterlogging under future climates. Nat. Commun. 2023, 14, 765. [Google Scholar] [CrossRef] [PubMed]
- Yang, P.; Zhang, S.; Xia, J.; Zhan, C.; Cai, W.; Wang, W.; Luo, X.; Chen, N.; Li, J. Analysis of drought and flood alternation and its driving factors in the Yangtze River Basin under climate change. Atmos. Res. 2022, 270, 106087. [Google Scholar] [CrossRef]
- Wan, W.; Zhao, J.; Popat, E.; Herbert, C.; Dll, P. Analyzing the Impact of Streamflow Drought on Hydroelectricity Production: A Global-Scale Study. Water Resour. Res. 2021, 57, e2020WR028087. [Google Scholar] [CrossRef]
- Zhou, S.; Wang, Y.; Li, Z.; Chang, J.; Guo, A.; Zhou, K. Characterizing spatio-temporal patterns of multi-scalar drought risk in mainland China. Ecol. Indic. 2021, 131, 108189. [Google Scholar] [CrossRef]
- Kamali, B.; Jahanbakhshi, F.; Dogaru, D.; Dietrich, J.; Nendel, C.; Aghakouchak, A. Probabilistic modeling of crop-yield loss risk under drought: A spatial showcase for sub-Saharan Africa. Environ. Res. Lett. 2022, 17, 024028. [Google Scholar] [CrossRef]
- Tian, F.; Wu, J.; Liu, L.; Leng, S.; Shen, Q. Exceptional Drought across Southeastern Australia Caused by Extreme Lack of Precipitation and Its Impacts on NDVI and SIF in 2018. Remote Sens. 2019, 12, 54. [Google Scholar] [CrossRef]
- Mishra, A.K.; Singh, V.P. A review of drought concepts. J. Hydrol. 2010, 391, 202–216. [Google Scholar] [CrossRef]
- Schwartz, C.; Ellenburg, W.L.; Mishra, V.; Mayer, T.; Griffin, R.; Qamer, F.; Matin, M.; Tadesse, T. A statistical evaluation of Earth-observation-based composite drought indices for a localized assessment of agricultural drought in Pakistan. Int. J. Appl. Earth Obs. Geoinf. 2022, 106, 102646. [Google Scholar] [CrossRef]
- Shang, Y.; Wang, J.; Wang, Z.; Hong, S.; Yun, S.U. Vulnerability Identification and Assessment of Agriculture Drought Disaster in China. Adv. Earth Sci. 2006, 21, 161–169. [Google Scholar] [CrossRef]
- Ha, T.V.; Huth, J.; Bachofer, F.; Kuenzer, C. A Review of Earth Observation-Based Drought Studies in Southeast Asia. Remote Sens. 2022, 14, 3763. [Google Scholar] [CrossRef]
- Chen, H.; Wang, J.; Huang, J. Policy support, social capital, and farmers’ adaptation to drought in China. Glob. Environ. Chang. 2014, 24, 193–202. [Google Scholar] [CrossRef]
- Kebede, A.; Kang, M.S.; Bekele, E. Advances in mechanisms of drought tolerance in crops, with emphasis on barley. Adv. Agron. 2019, 156, 265–314. [Google Scholar] [CrossRef]
- Wang, Q.; Yan, D.H.; Weng, B.S.; Feng, J.; Shi, X. Response to drought disaster in North America and their experiences to China. Arid Land Geogr. 2012, 35, 332–338. [Google Scholar] [CrossRef]
- Han, R.; Li, Z.; Li, Z.; Han, Y. Spatial–Temporal Assessment of Historical and Future Meteorological Droughts in China. Atmosphere 2021, 12, 787. [Google Scholar] [CrossRef]
- Yu, M.; Liu, X.; Wei, L.; Li, Q.; Zhang, J.; Wang, G. Drought Assessment by a Short-/Long-Term Composited Drought Index in the Upper Huaihe River Basin, China. Adv. Meteorol. 2015, 2016, 7986568. [Google Scholar] [CrossRef]
- Noureldeen, N.; Mao, K.; Mohmmed, A.; Yuan, Z.; Yang, Y. Spatiotemporal Drought Assessment over Sahelian Countries from 1985 to 2015. J. Meteorol. Res. 2020, 34, 104–118. [Google Scholar] [CrossRef]
- Xie, W.; Sheng, W.; Tang, W.; Rong, W.; Dai, J. Comparative Analysis on the Applicability of Drought Indexes in the Huaihe River Basin. J. Appl. Meteorol. Sci. 2014, 25, 176–184. [Google Scholar] [CrossRef]
- Sharafati, A.; Nabaei, S.; Shahid, S. Spatial assessment of meteorological drought features over different climate regions in Iran. Int. J. Climatol. 2020, 40, 1864–1884. [Google Scholar] [CrossRef]
- Han, H.Q.; Bai, Y.M.; Zhang, Y.J.; Chen, M.L. Comparative Study on Applicability of Four Drought Indexes in Guizhou Province. J. Qiannan Norm. Univ. Natl. 2019, 39, 45–49. [Google Scholar]
- Zhang, J.; Liu, Z.; Wang, J.; He, Y.; Luo, H. Construction and validation of comprehensive drought monitoring model in Southwest China. Trans. Chin. Soc. Agric. Eng. 2017, 33, 102–107. [Google Scholar] [CrossRef]
- Kalisa, W.; Zhang, J.; Igbawua, T.; Ujoh, F.; Ebohon, O.J.; Namugize, J.N.; Yao, F. Spatio-temporal analysis of drought and return periods over the East African region using Standardized Precipitation Index from 1920 to 2016. Agric. Water Manag. 2020, 237, 106195. [Google Scholar] [CrossRef]
- Begueria-Portugues, S.; Vicente-Serrano, S.M.; Angulo-Martínez, M.; López-Moreno, J.I.; Kenawy, A.E. The Standardized Precipitation-Evapotranspiration Index (SPEI): A multiscalar drought index. In Proceedings of the EMS Annual Meeting 2010, Zurich, Switzerland, 13–17 September 2010. [Google Scholar]
- Li, W.G.; Yi, X.; Hou, M.T.; Chen, H.L.; Chen, Z.L. Standardized precipitation evapotranspiration index shows drought trend in China. Chin. J. Eco-Agric. 2012, 5, 643–649. [Google Scholar] [CrossRef]
- Liu, X.; Wang, S.; Zhou, Y.; Wang, F.; Li, W.; Liu, W. Regionalization and Spatiotemporal Variation of Drought in China Based on Standardized Precipitation Evapotranspiration Index (1961–2013). Adv. Meteorol. 2015, 2015, 950262. [Google Scholar] [CrossRef]
- Hu, Z.; Wu, Z.; Islam, A.R.M.T.; You, X.; Zhang, X. Spatiotemporal characteristics and risk assessment of agricultural drought disasters during the winter wheat-growing season on the Huang-Huai-Hai Plain, China. Theor. Appl. Climatol. 2021, 143, 1393–1407. [Google Scholar] [CrossRef]
- Li, Y.; Li, H.; Wang, H.; Wang, Y. Spatiotemporal difference analysis of drought on wine grape in Ningxia based on crop water deficit index. J. Nat. Disasters 2014, 23, 203–211. [Google Scholar] [CrossRef]
- Mu, J.; Qiu, M.; Gu, Y.; Ren, J.; Liu, Y. Applicability of five drought indices for agricultural drought evaluation in Jilin Province, China. Ying Yong Sheng Tai Xue Bao = J. Appl. Ecol. 2018, 29, 2624–2632. [Google Scholar] [CrossRef]
- Yu, W.; Zhang, L.; Zhang, H.; Jiang, L.; Zhang, A.; Pan, T. Effect of farmland expansion on drought over the past century in Songnen Plain, Northeast China. J. Geogr. Sci. 2020, 30, 439–454. [Google Scholar] [CrossRef]
- Wang, Y.; Shen, X.; Jiang, M.; Lu, X. Vegetation Change and Its Response to Climate Change between 2000 and 2016 in Marshes of the Songnen Plain, Northeast China. Sustainability 2020, 12, 3569. [Google Scholar] [CrossRef]
- Zhou, Z.; Shi, H.; Fu, Q.; Li, T.; Liu, S. Assessing spatiotemporal characteristics of drought and its effects on climate-induced yield of maize in Northeast China. J. Hydrol. 2020, 588, 125097. [Google Scholar] [CrossRef]
- Jian-Zhai, W.U.; Zhang, J.; Zhang-Ming, G.E.; Xing, L.W.; Kong, F.T. Impact of climate change on maize yield in China from 1979 to 2016. J. Integr. Agric. 2021, 20, 289–299. [Google Scholar]
- Kang, L.; Zhang, H. Comprehensive study on agricultural drought situation in five major grain producing areas of China. Chin. J. Ecol. Agric. 2014, 22, 10. [Google Scholar] [CrossRef]
- Zhu, X.; Xu, K.; Liu, Y.; Guo, R.; Chen, L. Assessing the vulnerability and risk of maize to drought in China based on the AquaCrop model. Agric. Syst. 2021, 189, 103040. [Google Scholar] [CrossRef]
- Yin, X.; Olesen, J.E.; Wang, M.; Kersebaum, K.C.; Chen, H.; Baby, S.; Öztürk, I.; Chen, F. Adapting maize production to drought in the Northeast Farming Region of China. Eur. J. Agron. 2016, 77, 47–58. [Google Scholar] [CrossRef]
- Kang, H.; Na, X.; Zang, S. Evaluation of ecological service function of Songnen Plain Wetland from 1980 to 2010. Remote Sens. Land Resour. 2017, 29, 8. [Google Scholar]
- Qiao, S.; Zhang, L.; Yang, P.; Zhang, X. Analysis on the change of crop water content in the growing season of Songnen Plain from 2000 to 2012. Prog. Meteorol. Sci. Technol. 2015, 5, 66–69. [Google Scholar]
- Tang, W.; Liu, S.; Kang, P.; Peng, X.; Li, Y.; Guo, R.; Jia, J.; Liu, M.; Zhu, L. Quantifying the lagged effects of climate factors on vegetation growth in 32 major cities of China. Ecol. Indic. 2021, 132, 108290. [Google Scholar] [CrossRef]
- Ren, Z.; Liu, X.; Liu, J.; Chen, P. Study on the evolution of drought and flood trend of spring corn in Northeast China in recent 60 years. Chin. J. Ecol. Agric. 2020, 28, 12. [Google Scholar] [CrossRef]
- Wang, L.; Zhu, H.; Lin, A.; Zo, L.; Qin, W. Evaluation of the Latest MODIS GPP Products across Multiple Biomes Using Global Eddy Covariance Flux Data. Remote Sens. 2017, 9, 418. [Google Scholar] [CrossRef]
- Yang, Y.; Xiao, P.; Feng, X.; Li, H. Accuracy assessment of seven global land cover datasets over China. ISPRS J. Photogramm. Remote Sens. 2017, 125, 156–173. [Google Scholar] [CrossRef]
- Carmona, F.; Rivas, R.; Kruse, E. Estimating daily net radiation in the FAO Penman–Monteith method. Theor. Appl. Climatol. 2017, 129, 89–95. [Google Scholar] [CrossRef]
- Zhang, G.; Zhang, D.; Zhao, Y.; Tian, G.; An, W. Changes of surface moisture and dryness in Shanxi Province under the background of climate warming. Geogr. Arid Area 2020, 43, 9. [Google Scholar]
- Wang, L.; Wang, T.; Li, Q.; Wu, D.; Hu, Z.; Lu, Y.; Zhang, Y. Spatial and temporal characteristics of winter wheat drought in Henan Province Based on crop water deficit index. Jiangsu Agric. Sci. 2019, 47, 6. [Google Scholar] [CrossRef]
- Zarei, A.R.; Mahmoudi, M.R. Assessment of the effect of PET calculation method on the Standardized Precipitation Evapotranspiration Index (SPEI). Arab. J. Geosci. 2020, 13, 182. [Google Scholar] [CrossRef]
- Wu, Y.; Li, W.; Wang, W.; Quan, Q.; Chen, X.; Yin, H.; Zhou, Q.; Xu, K. Drought characteristics in Inner Mongolia Based on precipitation anomaly percentage. Study Arid Area 2019, 36, 10. [Google Scholar] [CrossRef]
- Wang, M.; Wang, X.; Huang, W.; Zhang, Y.; Ma, J. Spatial and temporal distribution characteristics of seasonal drought in Southwest China based on relative humidity index. Trans. Chin. Soc. Agric. Eng. 2012, 28, 9. [Google Scholar] [CrossRef]
- Li, C.; You, S.; Wu, Y.; Wang, Y. Application of improved crop water deficit index to drought disaster monitoring of spring maize in Northeast China. Trans. Chin. Soc. Agric. Eng. 2019, 35, 11. [Google Scholar]
- Pang, D.; Ren, C.; Wang, Y.; Cui, F.; Liu, H.; Tang, C. Construction and evaluation of maize water suitability index based on yield loss. J. Nat. Disasters 2020, 29, 10. [Google Scholar]
- Musonda, B.; Jing, Y.; Iyakaremye, V.; Ojara, M. Analysis of Long-Term Variations of Drought Characteristics Using Standardized Precipitation Index over Zambia. Atmosphere 2020, 11, 1268. [Google Scholar] [CrossRef]
- Nicolay, S.; Mabille, G.; Fettweis, X.; Erpicum, M. 30 and 43 months period cycles found in air temperature time series using the Morlet wavelet. Clim. Dyn. 2009, 33, 1117–1129. [Google Scholar] [CrossRef]
- Islam, A.R.M.T.; Islam, H.M.T.; Shahid, S.; Khatun, M.K.; Almoajel, A.M. Spatiotemporal nexus between vegetation change and extreme climatic indices and their possible causes of change. J. Environ. Manag. 2021, 289, 112505. [Google Scholar] [CrossRef] [PubMed]
- Guo, B.; Zhang, J.; Meng, X.; Xu, T.; Song, Y. Long-term spatio-temporal precipitation variations in China with precipitation surface interpolated by ANUSPLIN. Sci. Rep. 2020, 10, 81. [Google Scholar] [CrossRef] [PubMed]
- Li, P.; Wang, J.; Liu, M.; Xue, Z.; Liu, M. Spatio-temporal variation characteristics of NDVI and its response to climate on the Loess Plateau from 1985 to 2015. Catena 2021, 203, 105331. [Google Scholar] [CrossRef]
- Teshome, H.; Tesfaye, K.; Dechassa, N.; Tana, T.; Huber, M. Analysis of Past and Projected Trends of Rainfall and Temperature Parameters in Eastern and Western Hararghe Zones, Ethiopia. Atmosphere 2022, 13, 67. [Google Scholar] [CrossRef]
- Mondol, M.; Zhu, X.; Dunkerley, D.; Henley, B.J. Observed meteorological drought trends in Bangladesh identified with the Effective Drought Index (EDI). Agric. Water Manag. 2021, 255, 107001. [Google Scholar] [CrossRef]
- Řehoř, J.; Brázdil, R.; Trnka, M.; Fischer, M.; Balek, J.; Štěpánek, P.; Zahradníček, P.; Semerádová, D.; Bláhová, M. Effects of Climatic and Soil Data on Soil Drought Monitoring Based on Different Modelling Schemes. Atmosphere 2021, 12, 913. [Google Scholar] [CrossRef]
Figure 1.
The location of Songnen Plain in Northeast China and distribution of meteorological stations.
Figure 1.
The location of Songnen Plain in Northeast China and distribution of meteorological stations.

Figure 2.
Comparison of three function fitting curves of crop water deficit sequence: (a) density curves and (b) distribution curve.
Figure 2.
Comparison of three function fitting curves of crop water deficit sequence: (a) density curves and (b) distribution curve.

Figure 3.
Comparison of different drought indexes in time series: (a) Pa; (b) MI; (c) SPI; (d) SPEI; (e) CWDI; (f) CWDIa; and (g) SCWDI.
Figure 3.
Comparison of different drought indexes in time series: (a) Pa; (b) MI; (c) SPI; (d) SPEI; (e) CWDI; (f) CWDIa; and (g) SCWDI.

Figure 4.
Comparison of different drought indexes in space.

Figure 5.
Temporal variation characteristics of SCWDI in different growth stages of spring maize: (a) the sowing to seedling stage; (b) the seedling to jointing stage; (c) the jointing to heading stage; (d) the heading to milk mature stage; (e) the milk mature to mature stage; and (f) the whole growth stage.

Figure 6.
Spatial trend of SCWDI in different growth stages of spring maize: (a) the sowing to seedling stage; (b) the seedling to jointing stage; (c) the jointing to heading stage; (d) the heading to milk mature stage; (e) the milk mature to mature stage; and (f) the whole growth stage.
Figure 6.
Spatial trend of SCWDI in different growth stages of spring maize: (a) the sowing to seedling stage; (b) the seedling to jointing stage; (c) the jointing to heading stage; (d) the heading to milk mature stage; (e) the milk mature to mature stage; and (f) the whole growth stage.

Figure 7.
Spatial distribution of drought frequency in different growth stages of spring maize: (a) the sowing to seedling stage; (b) the seedling to jointing stage; (c) the jointing to heading stage; (d) the heading to milk mature stage; (e) the milk mature to mature stage; and (f) the whole growth stage.

Figure 8.
Periodicity characteristics of drought in the whole growth stage of spring maize in the Songnen Plain from 1981 to 2018: (a) the real part contour of wavelet coefficients; (b) wavelet variance; and (c) wavelet coefficients.
Figure 8.
Periodicity characteristics of drought in the whole growth stage of spring maize in the Songnen Plain from 1981 to 2018: (a) the real part contour of wavelet coefficients; (b) wavelet variance; and (c) wavelet coefficients.

Figure 9.
Correlation between SCWDI and the commonly used drought index in different growth stages of spring maize: (a) the sowing to seedling stage; (b) the seedling to jointing stage; (c) the jointing to heading stage; (d) the heading to milk mature stage; (e) the milk mature to mature stage; and (f) the whole growth stage.


Table 1.
Drought disasters of spring maize in Songnen Plain in typical drought years.
| Growth Stage | Drought Grade | Drought Range |
|---|---|---|
| A1 | Light drought | Zhaoyuan, Lishu |
| Moderate drought | Songyuan, Changling | |
| A2 | Light drought | Zhaoyuan, Lishu |
| Moderate drought | Changling | |
| A3 | Light drought | Qinggang, Yushu, Shuangyang |
| Moderate drought | Songyuan, Changling, Lishu | |
| A4 | Moderate drought | Wudalianchi, Qianguo, Qing’an, Longjiang, Wuchang, Suiling |
| Severe drought | Fuyu, Tailai, Songyuan, Zhaoyuan, Changling | |
| A5 | Light drought | Wuchang |
| Moderate drought | Songyuan | |
| Severe drought | Zhaoyuan, Changling, Fuyu |
Disclaimer/Publisher’s Note: The statements, opinions and data contained in all publications are solely those of the individual author(s) and contributor(s) and not of MDPI and/or the editor(s). MDPI and/or the editor(s) disclaim responsibility for any injury to people or property resulting from any ideas, methods, instructions or products referred to in the content. |
© 2023 by the authors. Licensee MDPI, Basel, Switzerland. This article is an open access article distributed under the terms and conditions of the Creative Commons Attribution (CC BY) license (https://creativecommons.org/licenses/by/4.0/).
Share and Cite
MDPI and ACS Style
Pei, Z.; Wu, B. Spatial-Temporal Characteristics of Spring Maize Drought in Songnen Plain, Northeast China. Water 2023, 15, 1618. https://doi.org/10.3390/w15081618
AMA Style
Pei Z, Wu B. Spatial-Temporal Characteristics of Spring Maize Drought in Songnen Plain, Northeast China. Water. 2023; 15(8):1618. https://doi.org/10.3390/w15081618
Chicago/Turabian StylePei, Zhifang, and Bin Wu. 2023. "Spatial-Temporal Characteristics of Spring Maize Drought in Songnen Plain, Northeast China" Water 15, no. 8: 1618. https://doi.org/10.3390/w15081618
Note that from the first issue of 2016, this journal uses article numbers instead of page numbers. See further details here.