
Influence of Biological Manganese Oxides on the Removal of Organic Matter and Ammonia in Micro-Polluted Source Water
by
 and
and
Lichao Nengzi
1,2,*,
Ying Jiang
3,
Zhirong Fang
3,
Qiyuan Hu
2,
Guanglei Qiu
1,* and
Haitao Li
3,* 1
School of Environment and Energy, South China University of Technology, Guangzhou 510006, China
2
Academy of Environmental and Economics Sciences, Xichang University, Xichang 615013, China
3
College of Resources and Environment, Xichang University, Xichang 615013, China
*
Authors to whom correspondence should be addressed.
Water 2023, 15(8), 1624; https://doi.org/10.3390/w15081624
Submission received: 23 March 2023
/
Revised: 18 April 2023
/
Accepted: 19 April 2023
/
Published: 21 April 2023
(This article belongs to the Special Issue Environmental Functional Materials for Water and Wastewater Treatment: Recent Advances and Challenges)
Abstract
:In order to improve the removal efficiency of refractory organic matters in micro-polluted source water, biological manganese oxides (BMOs) were generated in situ in the biological aerated filter (BAF) (BAF 2#), which could oxidize the refractory organic matters into biodegradable organic matters. CODMn and NH4+-N in the effluent of BAF 2# both stabilized on the 39th day, while CODMn and NH4+-N in the effluent of the control BAF (BAF 1#) stabilized on the 38th and 42nd days, respectively. In the steady phase, the removal rates of CODMn and NH4+-N in BAF 1# were 41.51% and 94.79%, respectively, while in BAF 2#, they were 54.52% and 95.55%, respectively. BMOs generated in BAF 2# evidently improved the efficiency of CODMn removal. With the increase in the influent Mn2+ in BAF 2#, the rate of CODMn removal was gradually improved to 63.60%, while the efficiency of NH4+-N removal was slightly improved, CODMn was evidently removed in each section of the filter layer, and ammonia was mainly removed in the 0~0.8 m layer of the filter. CODMn was evidently removed in each section of the filter layer, and NH4+-N was mainly removed in the 0~0.8 m layers of the filter. Biological CODMn, Mn2+, and NH4+-N removal all followed the first-order kinetic reaction. As the influent Mn2+ gradually increased from 0 to about 0.5, 1, and 2 mg/L, the efficiency of CODMn removal along the filter layer was significantly improved, but the efficiency of NH4+-N removal was slightly improved. The kinetic constant k of biological CODMn removal significantly increased, while the kinetic constant k of biological Mn2+ and NH4+-N removal gradually increased.
1. Introduction
With the use of great amounts of pesticides and fertilizers in industrial and agricultural production and the discharge of domestic sewage and industrial waste without strict treatment, the number of organic pollutants detected in surface water, including pesticides, chemical raw materials, medicines, personal care products, and endocrine disruptors, is increasing [1,2,3]. Among them, although the concentrations of many pollutants are low, they are difficult to biodegrade and are extremely harmful [4,5,6]. According to the 2020 “Communique on the State of China’s Ecological Environment”, the main pollutants of lakes, rivers, and reservoirs are organic compounds, including those containing NH4+ nitrogen. Permanganate index (CODMn) and NH4+-N are the main pollutants of rivers, lakes, and reservoirs. Some organic substances in micro-polluted source water are carcinogenic or even toxic to the human body [1,7]. In addition, in the process of chlorination, organic substances produce disinfectant byproducts, which are reproductive toxins and carcinogens [7,8,9]. If the ammonia nitrogen in micro-polluted source water cannot be effectively removed, it will enter the pipe network, posing a threat to human health [10]. When ammonia nitrogen in water is converted into nitrite nitrogen, it will have a strong carcinogenic effect when combined with protein in the human body. At the same time, nitrite nitrogen can be combined with hemoglobin in the human body and lead to hypoxia, especially in infants and young children, who are particularly sensitive to hypoxia caused by nitrite nitrogen [11]. Therefore, organic matter and ammonia nitrogen in micro-polluted source water must be efficiently removed.
Biological manganese oxides are produced following the oxidation of bivalent manganese using manganese-oxidizing bacteria [12] which have a large specific surface area and a strong oxidizing ability [13,14,15]. Using the strong oxidizing properties of biological manganese oxide, the refractory organic matter in slightly polluted source water can be catalytically oxidized into easily degradable organic matter, which can be further metabolized and degraded by microorganisms [16]. Biological manganese oxides are reduced to divalent manganese ions after the catalytic oxidation of organic matter, and the divalent manganese ions can be oxidized to high-valent manganese oxides using manganese-oxidizing bacteria, thus realizing the continuous catalytic oxidation of organic matter. Forrez et al. [17] found that the oxidative degradation rate of diclofenac using biological manganese oxide was much faster than the oxidative degradation rate of diclofenac using manganese dioxide produced via chemical methods. Biological manganese oxide was found to efficiently remove 14 drugs, including ibuprofen, triclosan, and ultravist solution [18]. Therefore, in this study, two biological aerated filter columns were assessed for the removal of organic matter and ammonia nitrogen, and biological manganese oxide was formed in the filter layer of one of the columns. The effect of biological manganese oxide on the use reduction in CODMn and ammonia nitrogen in the start-up process was investigated, and the changes in the CODMn and ammonia nitrogen removal efficiency with an increasing manganese concentration in the influent were also investigated.
2. Experimental Methods
2.1. Testing Device
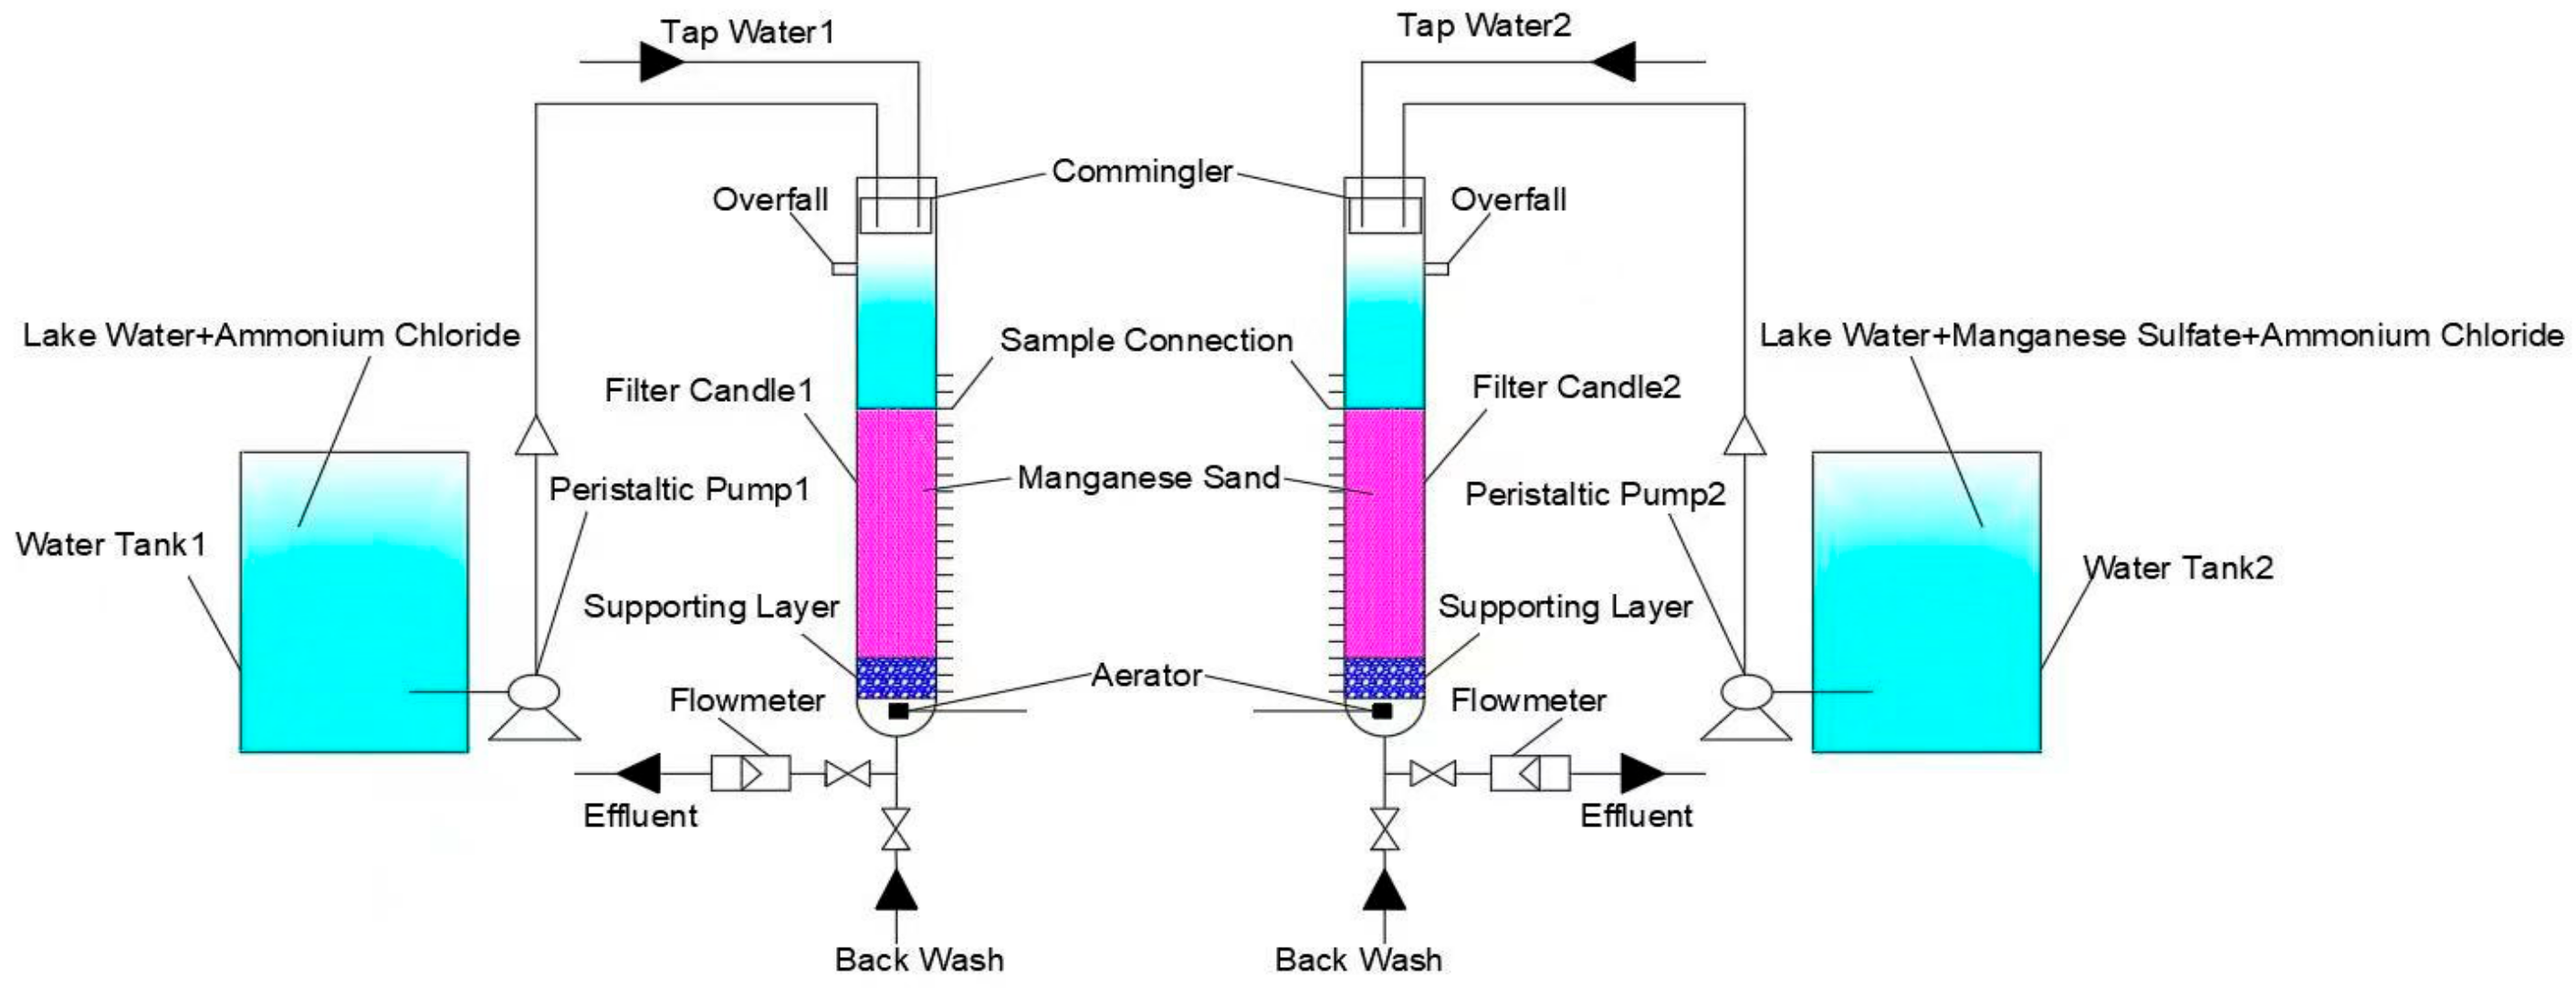
The #1 and #2 aeration biofilter systems are shown in Figure 1. The height and inner diameter of aeration biofilters #1 and #2 were 2.5 m and 0.1 m, respectively, and the filter material was quartz sand, with a particle size and thickness of 4~6 mm and 1.5 m, respectively. The upper parts of aeration biofilters #1 and #2 were equipped with mixers for mixing tap water with lake water + ammonium chloride and tap water with lake water + ammonium chloride + manganese sulfate. Aeration heads were installed at the bottom to provide dissolved oxygen. Water sampling ports were sequentially arranged at 0.1 m vertical intervals along the column layers of aeration biofilters #1 and #2. Water tanks 1 and 2 contained lake water + ammonium chloride and lake water + ammonium chloride + manganese sulfate, respectively, and the volume of both water tanks was 500 L.
2.2. Inlet Water Quality
The influent water of this experiment was simulated with micro-polluted source water, which was obtained by mixing lake water, manganese sulfate, ammonium chloride, and tap water based on certain proportions; the lake water was collected from an artificial lake on campus. The test water temperature was 18~25 °C, and the inlet water quality is shown in Table 1.
2.3. Test Methods
In this experiment, the #1 aerated biofilter was used as the control, and the effects of biological manganese oxide, generated after the oxidation of bivalent manganese in the influent, on the use reduction in CODMn and ammonia nitrogen were investigated in the start-up stage and the stages with increasing influent manganese concentration. The filter material of the #1 aeration biofilter was new quartz sand, and the influent water was prepared by mixing lake water + ammonium chloride and tap water in a mixer according to certain proportions. The upper 20 cm layer of the #2 aeration biofilter was quartz sand containing manganese-oxidizing bacteria, and the lower 130 cm layer was new quartz sand. The influent water was prepared by mixing lake water + ammonium chloride + manganese sulfate with tap water in a mixer, according to certain proportions. After the start-up stage, aerated biofilters #1 and #2 were inoculated twice a week for 3 weeks with sludge from a sewage treatment plant and sludge from lake water, with an inoculation amount of 2~3 L. When the removal rates of CODMn and ammonia nitrogen using aerated biofilters #1 and #2 were stable for approximately one month, the manganese concentration in the influent of aerated biofilter #2 was increased to approximately 1 mg/L. After the removal rates of CODMn and ammonia nitrogen had remained stable for one month, the manganese concentration in the influent water was again increased to approximately 2 mg/L. During the experiment, the dissolved oxygen concentration of aerated biofilters #1 and #2 was 2~3 mg/L, and the water temperature was 18~25 °C. In the start-up stage, the filtration rate of aerated biofilters #1 and #2 was 3 m/h, the backwashing intensity was 6~8 L/(s·m2), the backwashing time was 3 min, and the backwashing period was 14 days. In the stable stage, the backwashing intensity was 10 L/(s·m2), the backwashing time was 4 min, and the backwashing period was 10 days. Every day, the CODMn, ammonia nitrogen, manganese, and temperature levels in the inlet and outlet water of aerated biofilters #1 and #2 were recorded. The concentrations of CODMn, ammonia nitrogen, and manganese along the treatment path were measured twice a week.
2.4. Detection Methods
The pH was measured with a pH meter (HQ30d-HACH). DO was detected using a portable dissolved oxygen analyzer (Oxi 315i-WTW). COD, NH3-N, and manganese were detected in accordance with standard methods [19].
2.5. The Kinetics of Biological CODMn, NH4+-N, and Mn2+ Oxidation
The determination of the empty bed contact time (EBCT) was based on the following equation:
EBCT = filter bed (m)/linear velocity (m/h)
The CODMn, NH4+-N, and Mn2+ removal from the BAF was evaluated using the following equation:
where k is the rate constant, min−1.
After the separation of variables and integration of Equation (2), the following Equation (3) was obtained:
where [CODMn/NH4+-N/Mn2+]0 is the influent concentration and [CODMn/Mn2+]t is the concentration at the EBCT of t.
3. Results and Discussion
3.1. The Impact of Biological Manganese Oxide on CODMn and Ammonia Nitrogen
3.1.1. The Impact of Biological Manganese Oxide on the Use Reduction in CODMn
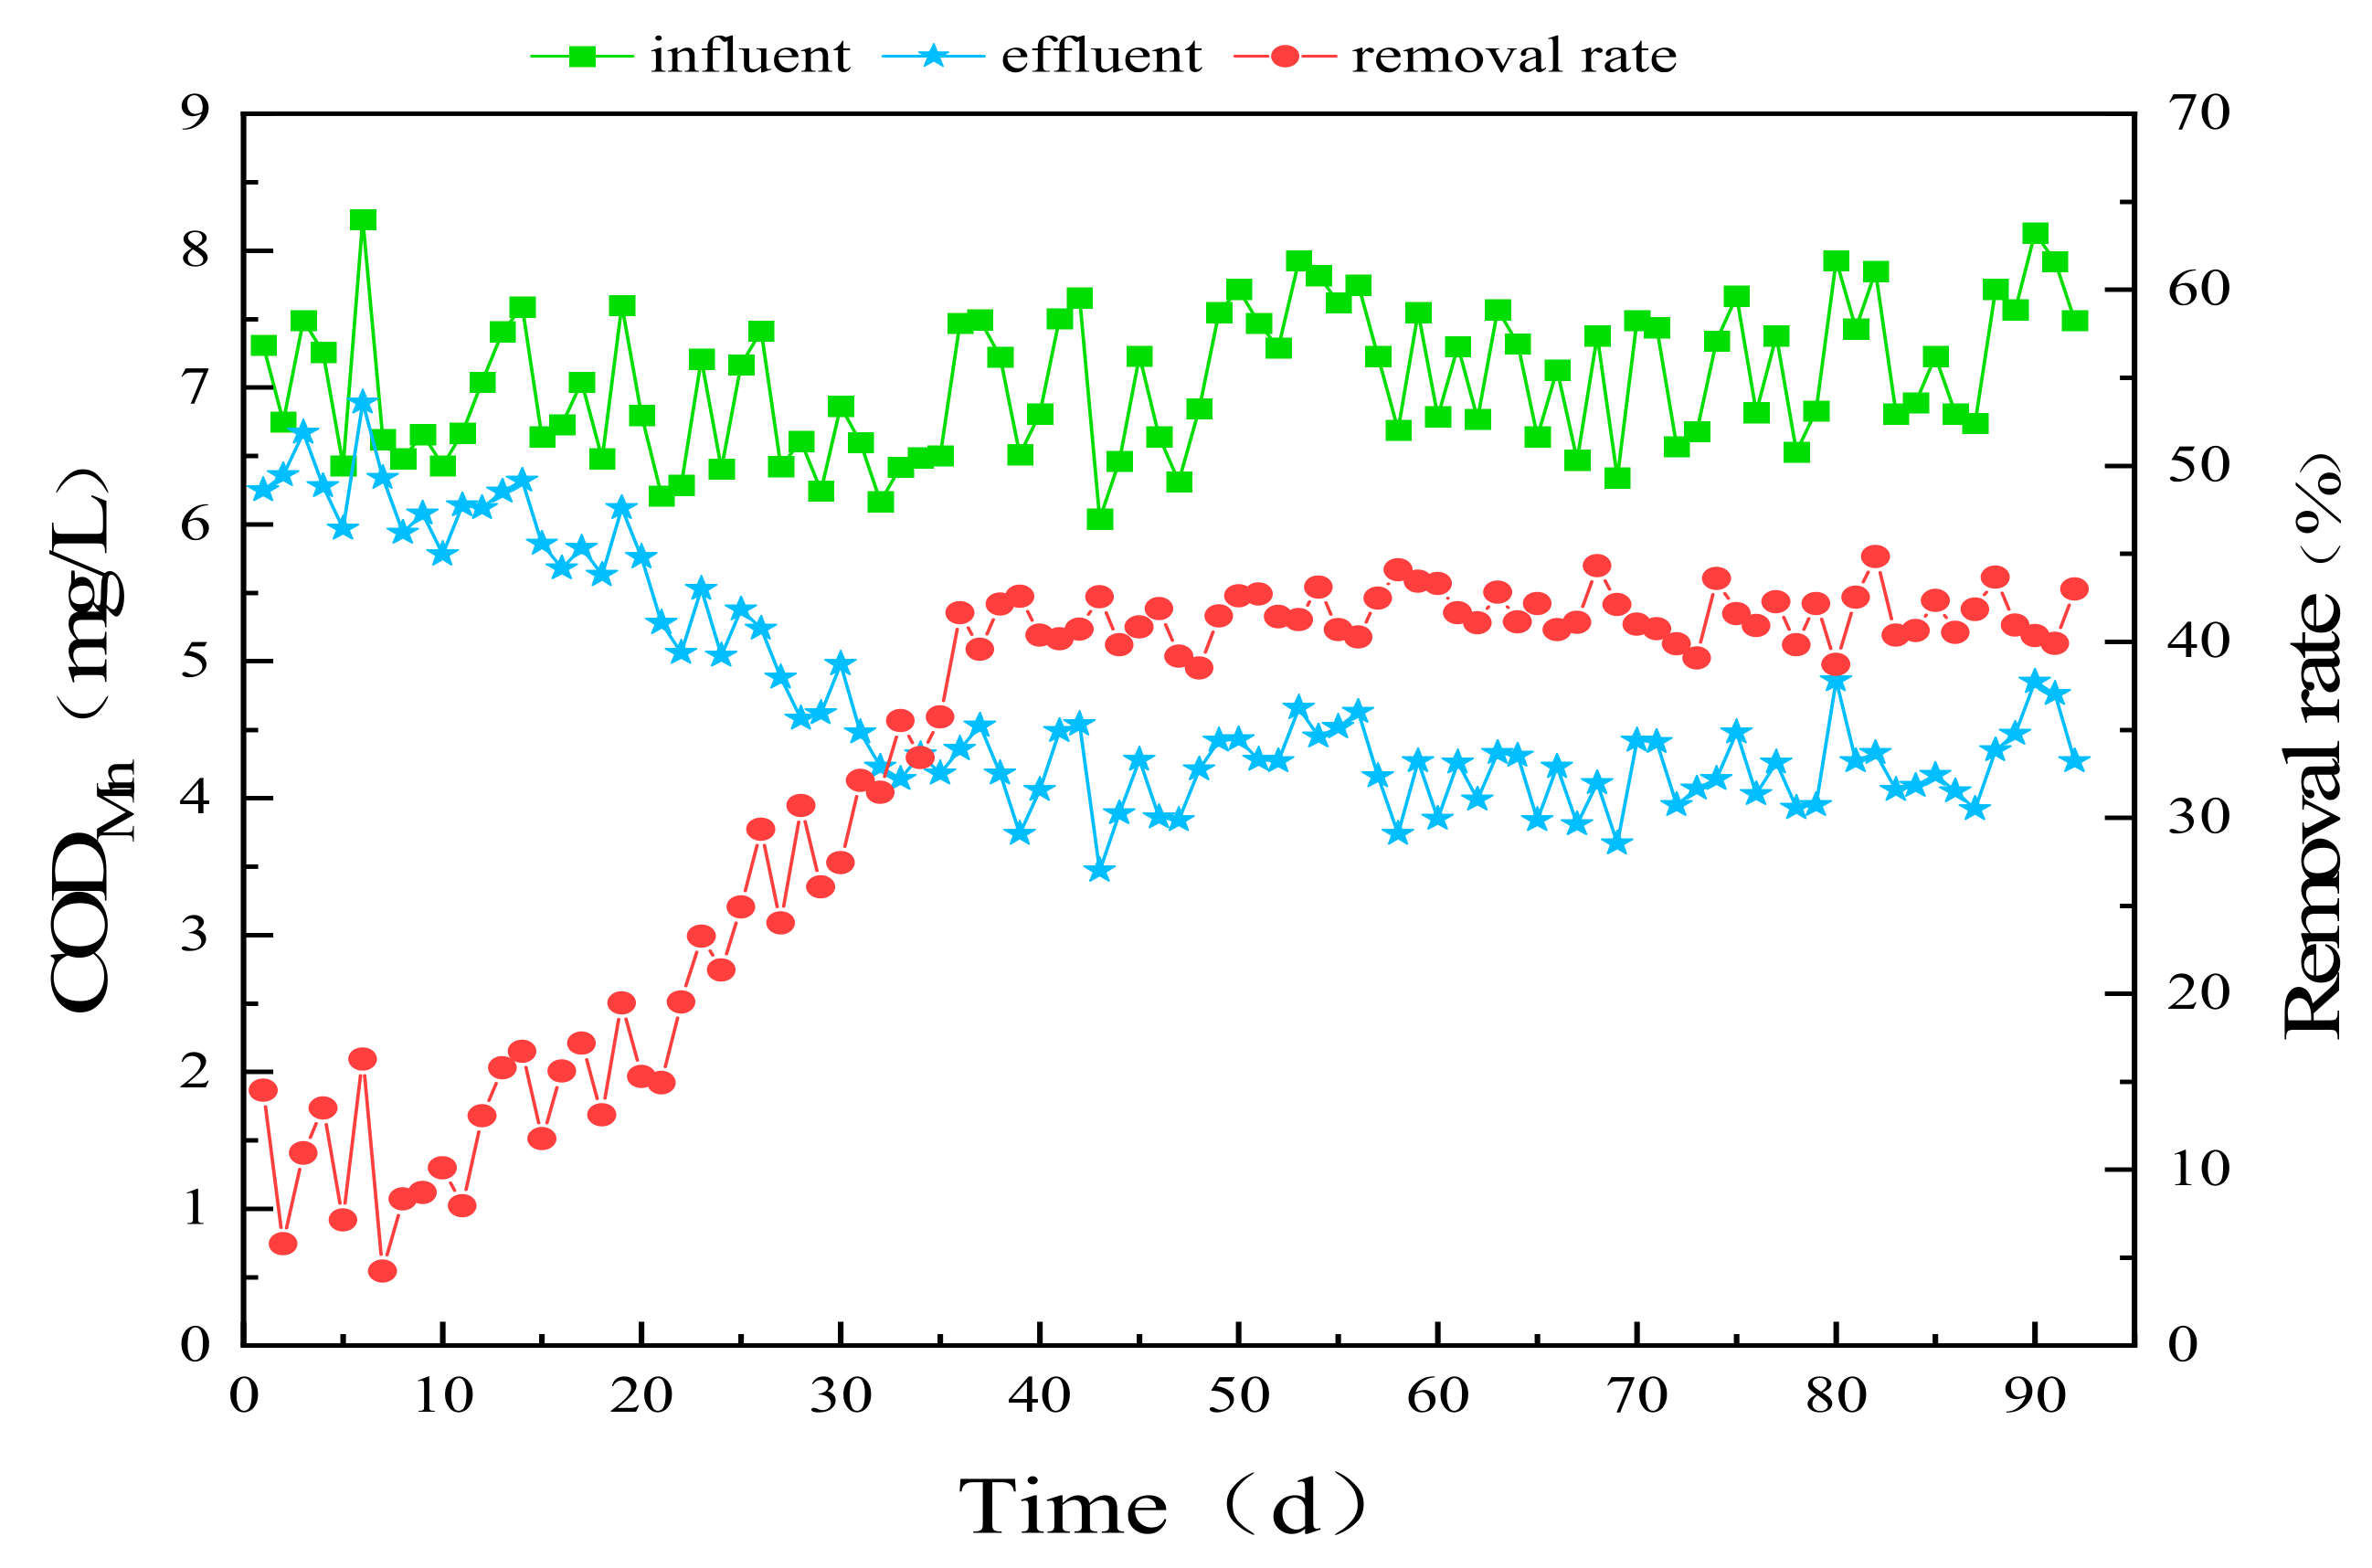
The removal effect of CODMn using the aerated biofilter #1 column in the start-up process is shown in Figure 2; the concentration of CODMn in the influent was approximately 7 mg/L. At the beginning, the removal rate of CODMn greatly fluctuated, but the removal rate was only approximately 10%. This was because new quartz sand was used in this experiment, and there was little heterotrophic bacteria-oxidizing organic matter in the filter layer. As the heterotrophic bacteria in the filter layer gradually adapted to the new environment, grew, and reproduced, and with the continuous inoculation of new sludge, the removal rate of CODMn gradually increased, starting on the 10th day. On the 38th day, CODMn decreased from 7.22 mg/L to 4.18 mg/L, and the removal rate of CODMn increased to 42.14% and then remained stable at approximately 40%. In the stable stage (38~92 days), the average concentration of CODMn in the effluent was 4.20 mg/L and the average removal rate was 41.51%.
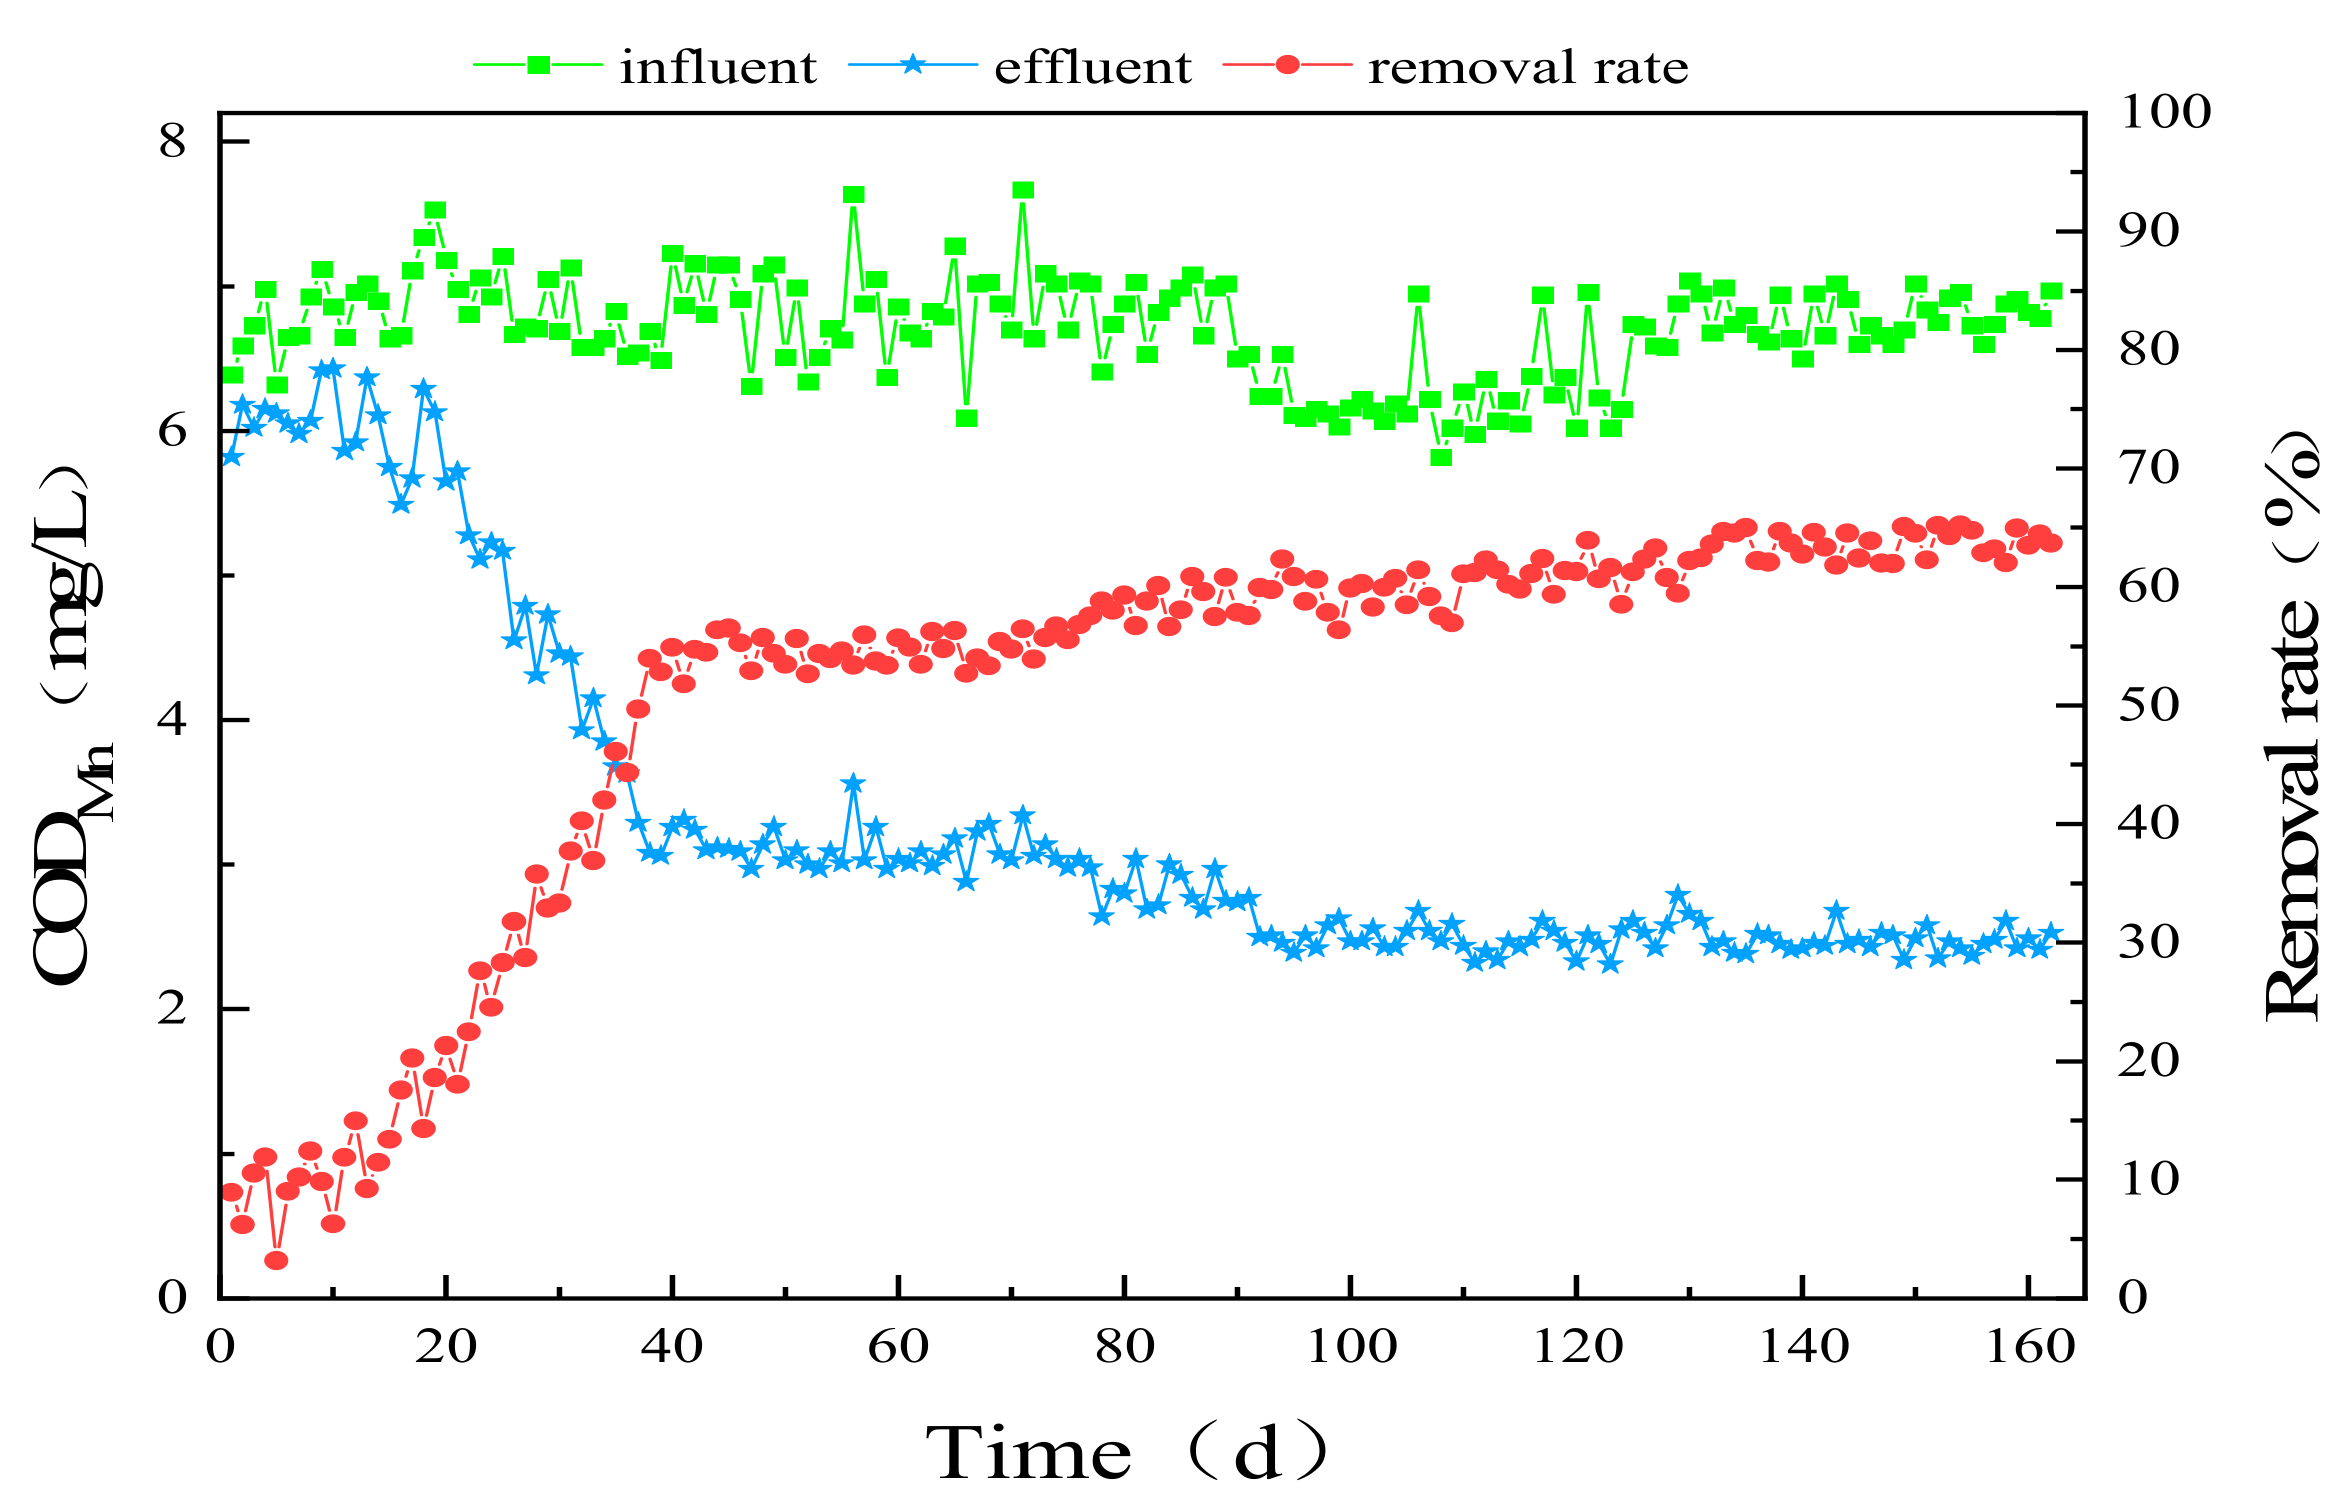
The removal effect of CODMn using aerated biofilter #2 in the start-up process is shown in Figure 3; the concentration of CODMn in the influent was slightly lower than that of aerated biofilter #2. At the initial stage, because the filter layer of aerated biofilter #2 lacked heterotrophic bacteria that oxidized the organic matter, the use reduction in CODMn was poor, and the removal rate was only approximately 10%, similar to that of aerated biofilter #1. Through continuous inoculation, domestication, and cultivation, the heterotrophic bacteria gradually grew and multiplied in the filter layer. As of the 10th day, the removal rate of CODMn began to gradually increase. The removal rate of CODMn began to notably increase, starting on the 20th day. On the 39th day, the effluent CODMn decreased to 3.06 mg/L, and the removal rate increased to 52.85% and then stabilized at approximately 54%; the removal effect was substantially better than that of aerated biofilter #1. Although the start-up time of aerated biofilter #1 was 38 days, which was one day less than that of aerated biofilter #2, the removal rate of the latter was considerably higher than that of the former. In the stable stage (39~70 days), the average concentration of CODMn in the effluent of aerated biofilter #2 was 3.11 mg/L, and the average removal rate was 54.52%. This was considerably better than the removal effect of aeration biofilter #1, indicating that the bivalent manganese in the influent of the aerated biofilter column is oxidized by the manganese-oxidizing bacteria, and that the biological manganese oxide produced after oxidation has a strong oxidizing ability [12] which could catalyze and oxidize the refractory organic matter in the influent into easily degradable organic matter, thus improving the removal effect of CODMn [20]. When the influent manganese concentration increased to about 1 mg/L and 2 mg/L on days 71 and 117, respectively, in the stable stage (82nd~116th days and 130~162 days), the average concentrations of CODMn in the effluent were 2.57 and 2.47 mg/L, and the average removal rates were 59.56% and 63.60%. When the concentration of manganese in the influent gradually increased from 0 mg/L to approximately 0.5, 1, and 2 mg/L, the average removal rates of CODMn increased by 13.01%, 5.04%, and 4.04%, respectively, and the removal effect of CODMn noticeably improved after the biological manganese oxide was produced in the filter layer. With an increasing concentration of bivalent manganese in the influent, the amount of biological manganese oxide in the filter layer notably increased, and the removal effect of CODMn was improved, but the removal rate of CODMn was limited.
3.1.2. The Effect of Biological Manganese Oxide on Ammonia Nitrogen Removal
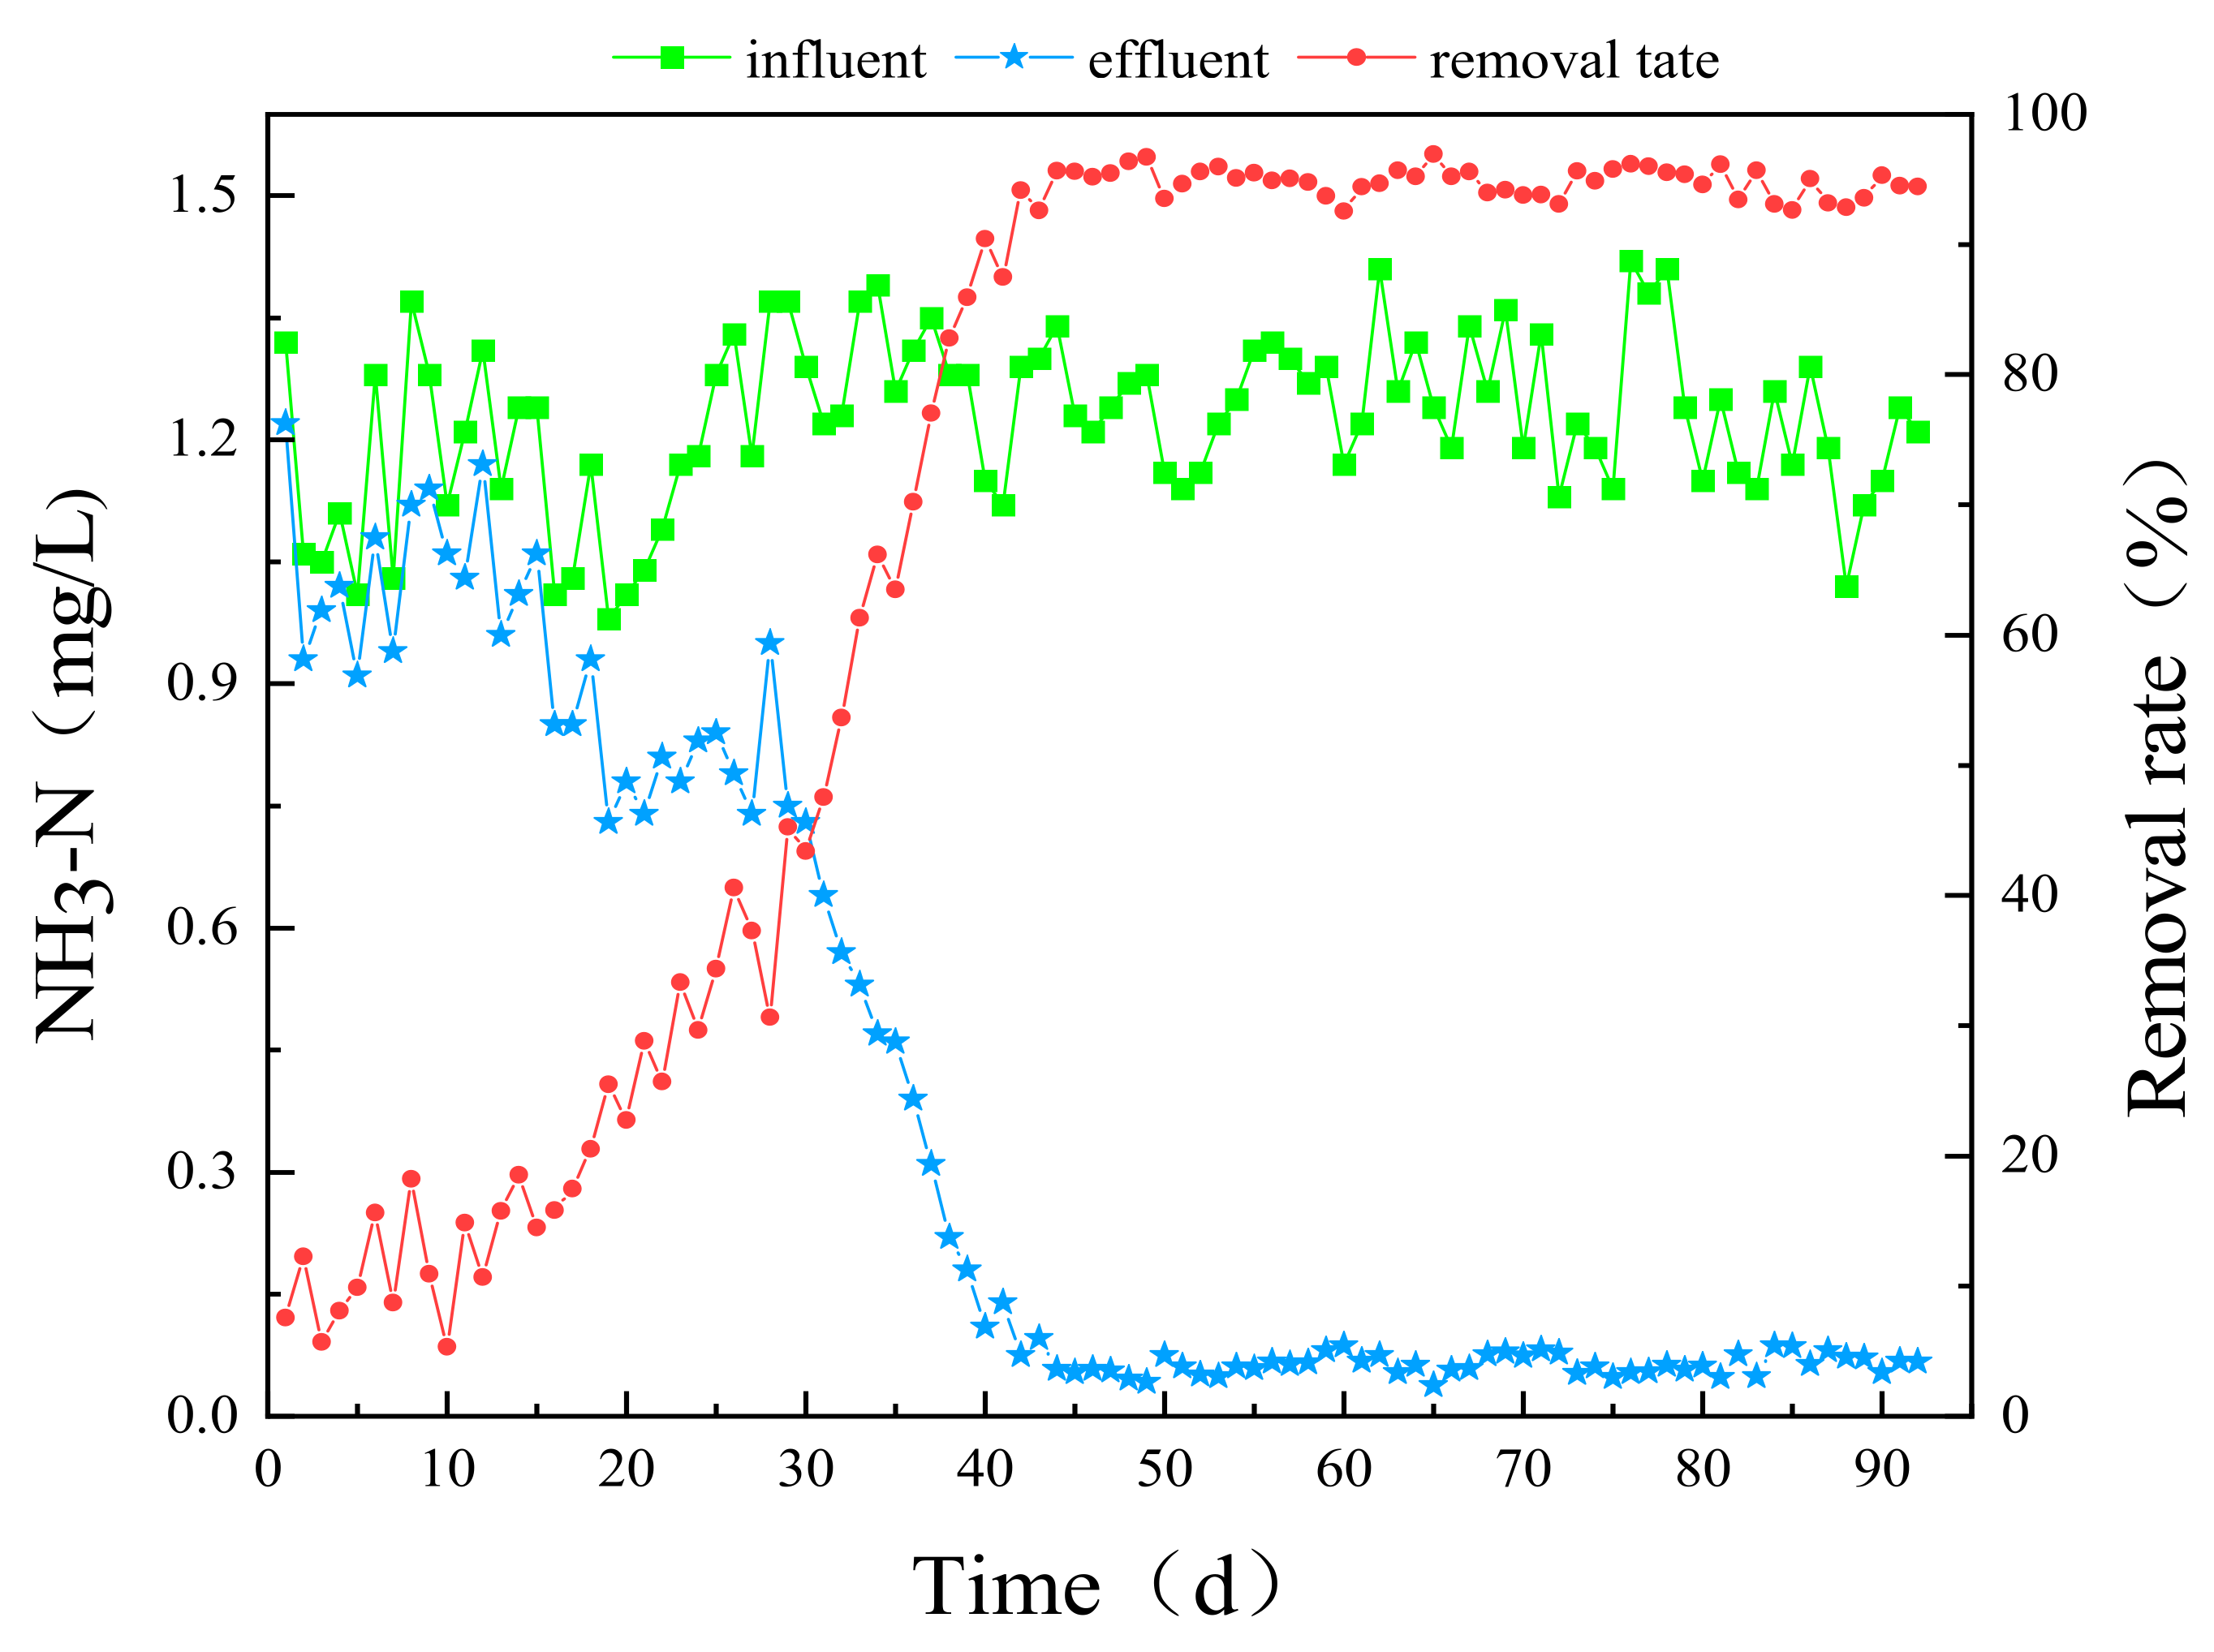
The removal effect of ammonia nitrogen using the #1 aerated biofilter column during the start-up stage is shown in Figure 4; the concentration of ammonia nitrogen in the influent was approximately 1.2 mg/L. The sludge inoculated with nitrifying bacteria originated from a sewage treatment plant and contained great amounts of nitrifying bacteria. The inoculated nitrifying bacteria grew and propagated rapidly after acclimation and culture in the #1 aerated biofilter column. Therefore, the ammonia nitrogen removal rate increased from approximately 8% to 15% at the initial stage; by day 15, it began to rise significantly. With the continuous growth and reproduction of nitrifying bacteria in the filter layer, when nitrifying bacteria accumulated to a certain degree (28th day), the ammonia nitrogen concentration of the effluent began to rapidly decrease. On the 42nd day, the ammonia nitrogen in the effluent decreased to below 0.1 mg/L, and the removal rate increased to 94.19%. After that, the ammonia nitrogen in the effluent fell below 0.1 mg/L. In the stable stage (from the 42nd day to the 92nd day), the average concentration of ammonia nitrogen in the effluent was 0.064 mg/L and the average removal rate was 94.79%. Aeration biofilter #1 had a good removal ability for ammonia nitrogen.
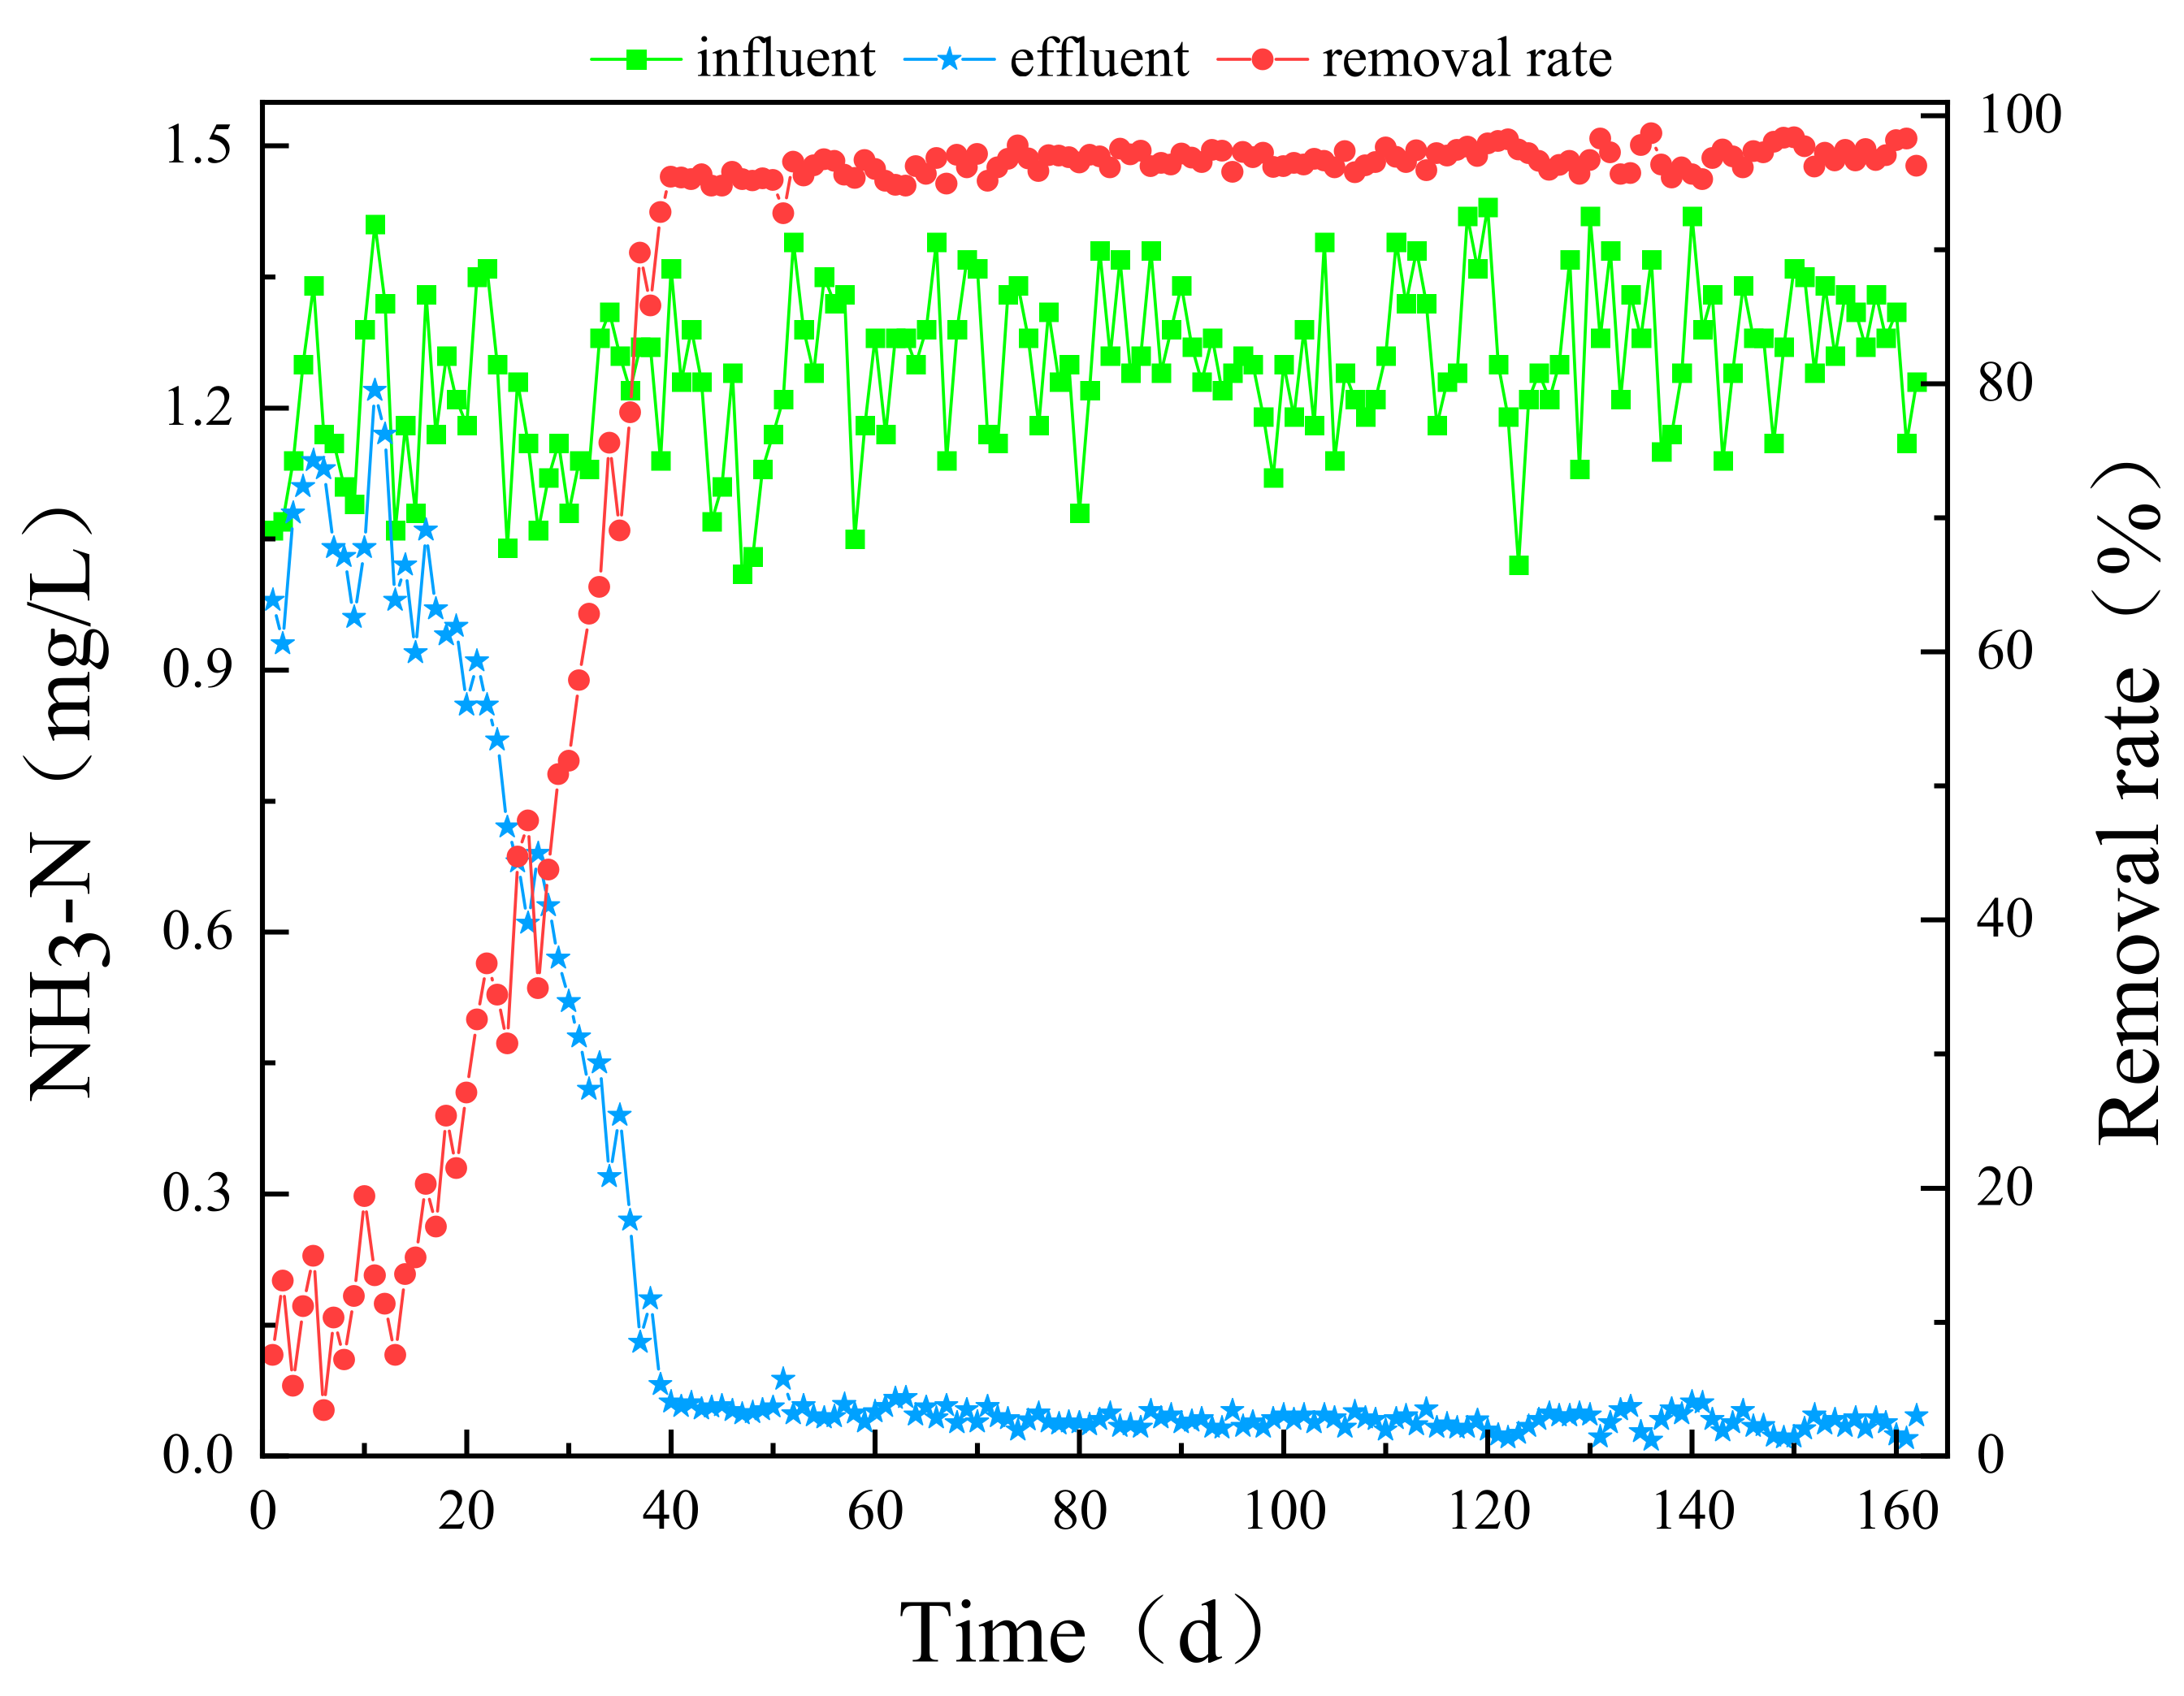
The ammonia nitrogen removal effect of aerated biofilter #2 during the start-up stage is shown in Figure 5, and the influent ammonia nitrogen concentration in the #2 aerated biofilter column is almost the same as that in the #1 aerated biofilter column. In the first 15 days of the start-up stage, the removal effect of ammonia nitrogen was poor, and the removal rate fluctuated greatly because this was the adaptation period for newly inoculated nitrifying bacteria. When the inoculated nitrifying bacteria entered the logarithmic growth period, the ammonia nitrogen in the effluent rapidly decreased, and the ammonia nitrogen removal rate correspondingly increased. On the 39th day, the ammonia nitrogen in the effluent decreased to 0.082 mg/L, and the removal rate increased to 92.81%. Compared with that in aerated biofilter #1, the time required for the ammonia nitrogen in the effluent to drop below 0.1 mg/L was shortened by 3 days, which indicates that the existence of biological manganese oxide can promote the nitrification of ammonia nitrogen. In the stable stage (from the 39th day to the 70th day), the ammonia nitrogen in the effluent was lower than 0.1 mg/L, the average concentration was 0.054 mg/L, and the average removal rate was 95.55%. The removal effect of ammonia nitrogen was considerably better than that of aerated biofilter #1, and the catalytic oxidation of biological manganese oxide could improve the removal effect of ammonia nitrogen. When the influent manganese concentration increased to 1 and 2 mg/L, the ammonia nitrogen in the effluent (82nd~116th day and 131st~162nd day) decreased to 0.041 and 0.038 mg/L and the ammonia nitrogen removal rate increased to 96.74% and 97.02%, respectively. The start-up period of ammonia nitrogen could be shortened after biological manganese oxide was generated in the filter layer of the aeration biofilter, the removal effect of ammonia nitrogen was improved, and the removal effect of ammonia nitrogen increased with the increase in influent manganese concentration.
3.1.3. The Removal Effect of Manganese Using the Aerated Aeration Biofilter #2 Column
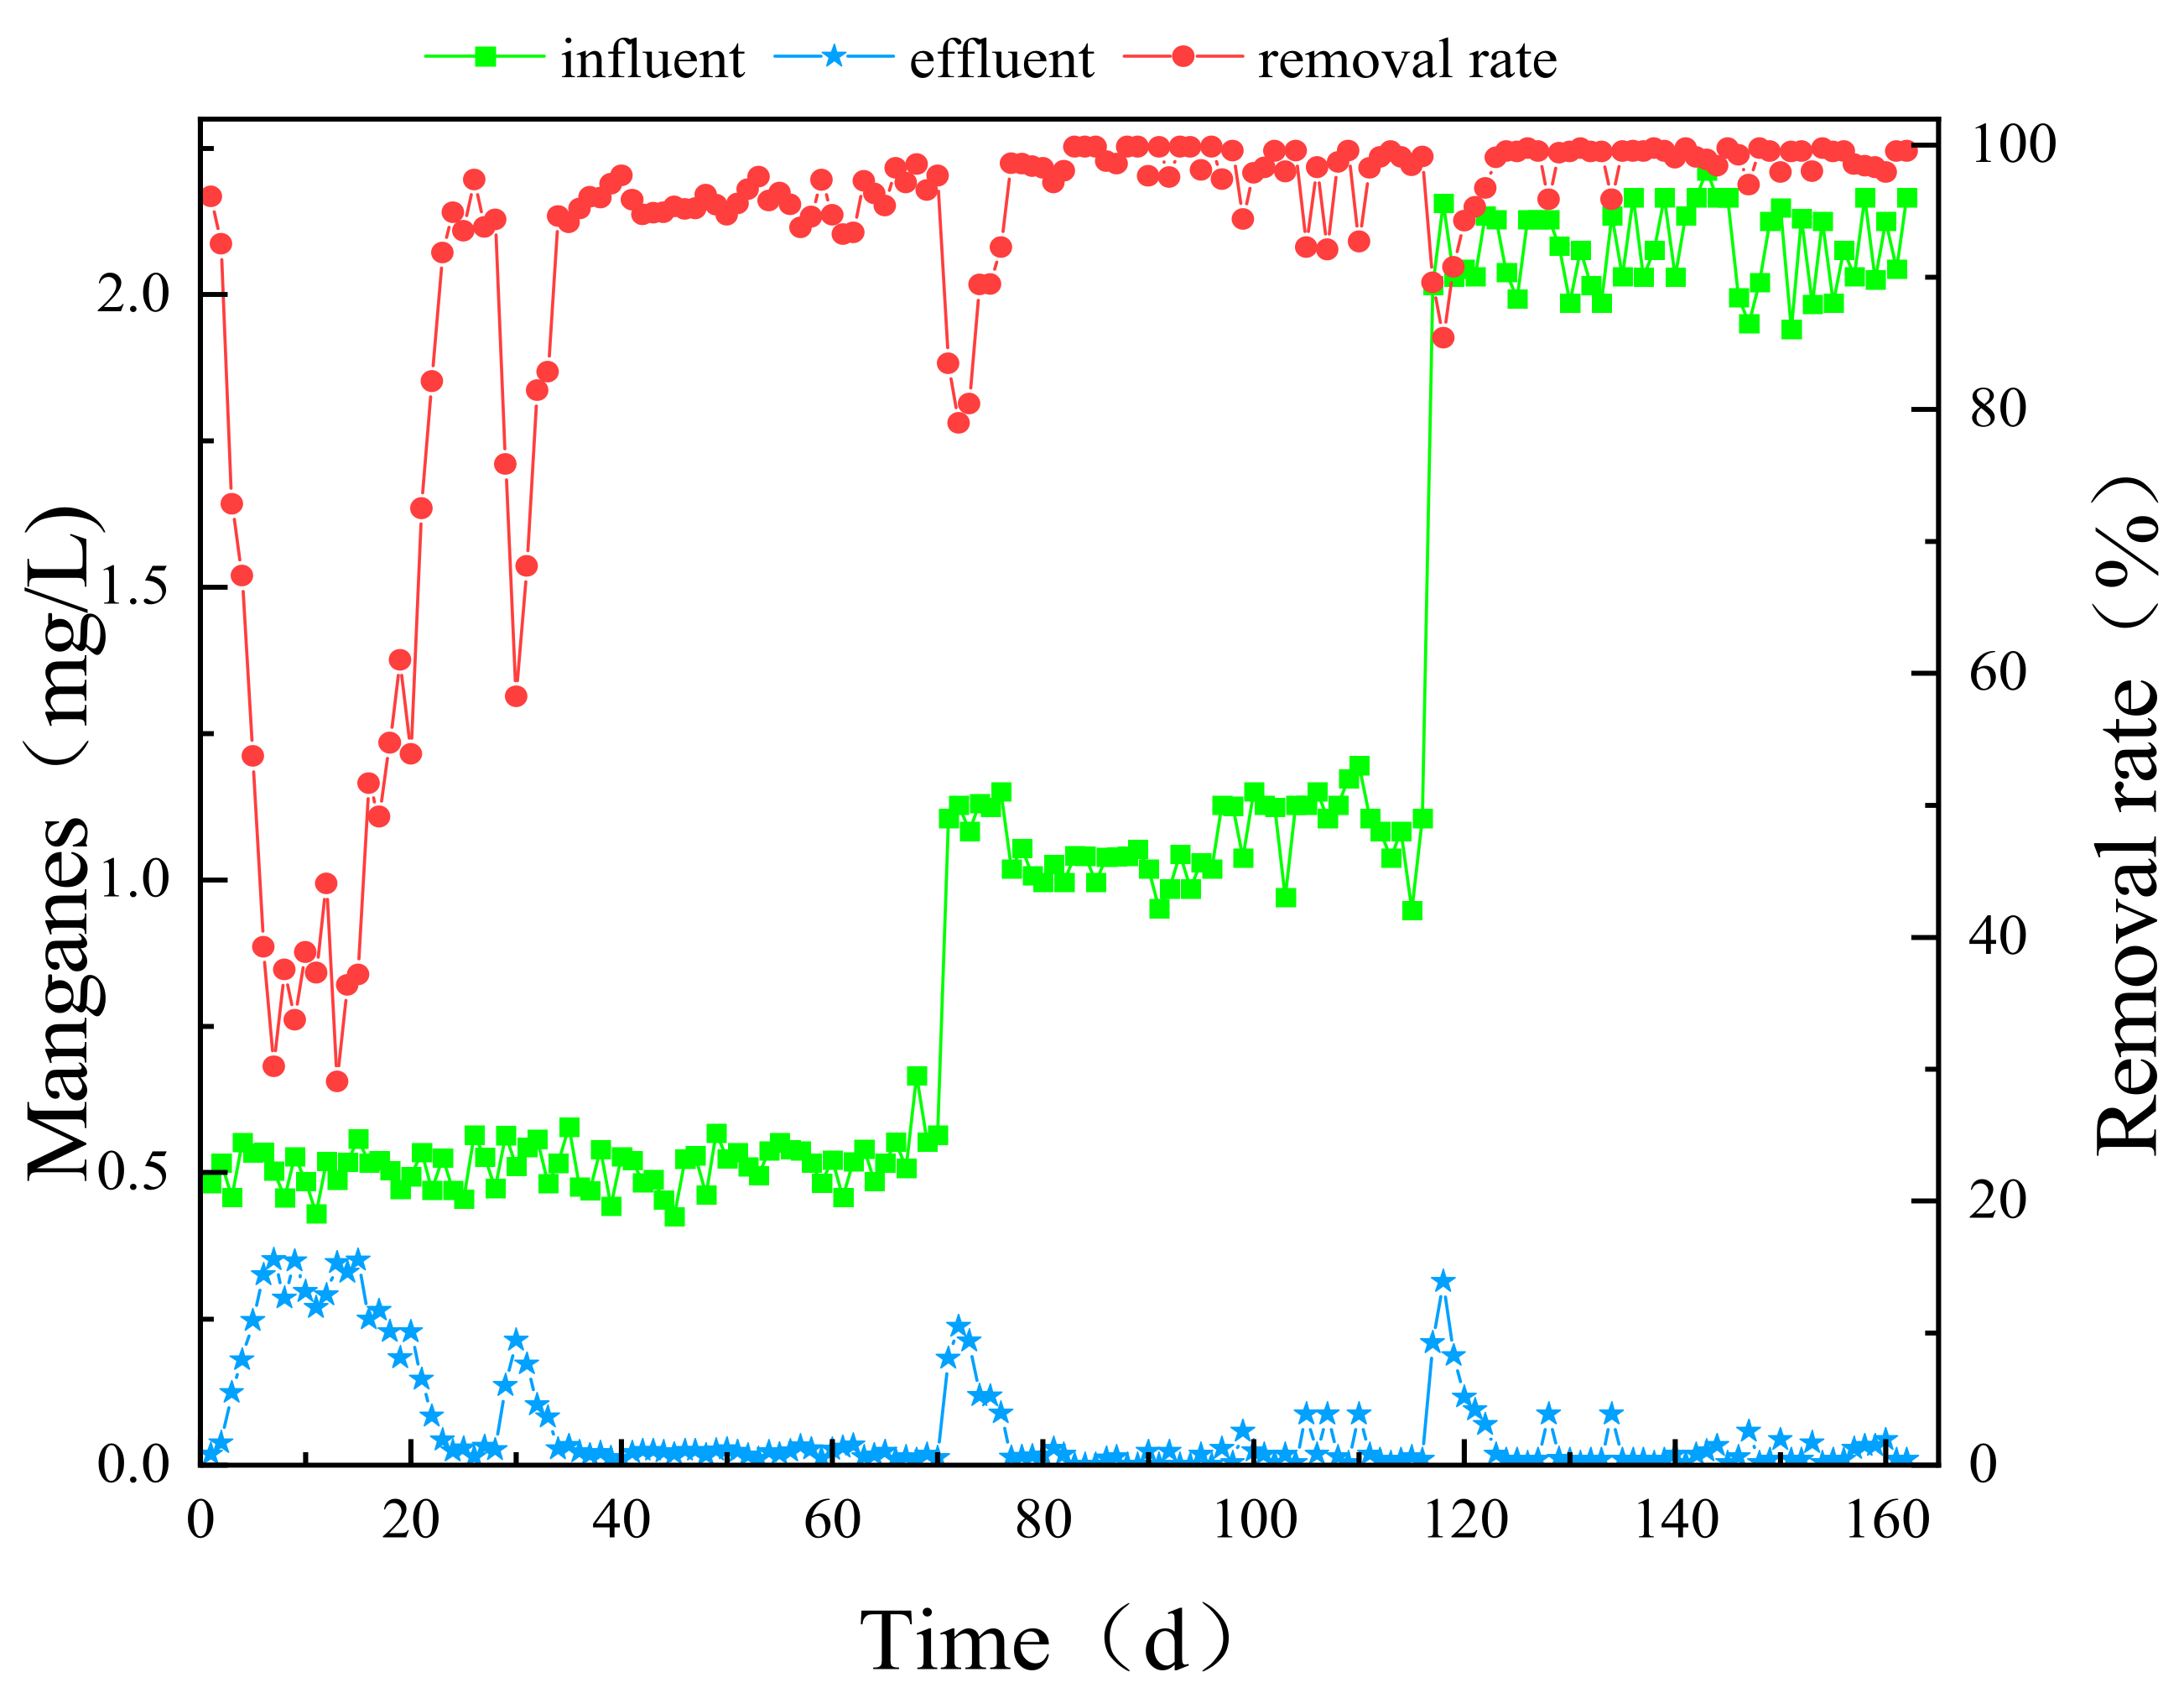
The removal effect of ammonia nitrogen using aerated biofilter column #2 during the start-up stage is shown in Figure 6; the manganese concentration of the influent water in this stage was approximately 0.5 mg/L. The concentration of manganese in the effluent was lower than 0.1 mg/L on the first and second day of the start-up stage. This was because aeration biofilter #2 was inoculated with 20 cm of mature filter material containing manganese-oxidizing bacteria, which could oxidize the divalent manganese in the influent, and the new quartz sand filter material had a certain adsorption capacity for manganese [21]. As the adsorption of manganese using the quartz sand increased the saturation and manganese-oxidizing bacteria had not yet adapted to the new environment, the manganese in the effluent notably increased. On the seventh day, the manganese in the effluent rose to 0.35 mg/L. After that, the manganese-oxidizing bacteria gradually adapted to the new environment, and the manganese concentration in the effluent fluctuated at approximately 0.3 mg/L. When the manganese-oxidizing bacteria in the filter layer entered the logarithmic growth period, the effluent manganese began to decline rapidly from the 15th day and decreased to less than 0.1 mg/L on the 22nd day, and the aeration biofilter had a good removal effect on the manganese. However, on the 29th day, the manganese content in the effluent increased to 0.14 mg/L; on the 30th day, it continued to increase to 0.21 mg/L, and then it dropped to below 0.1 mg/L on the 33rd day. This is because ammonia nitrogen is quickly nitrated and removed during this period, and the oxidation of ammonia nitrogen is divided into two stages. In the first stage, ammonia nitrogen is oxidized to nitrite nitrogen using ammonia-oxidizing bacteria, and, in the second stage, nitrite nitrogen is oxidized to nitrate nitrogen using nitrosating bacteria. The first step is faster than the second, which leads to the accumulation of nitrite nitrogen in the filter layer. The accumulation of nitrite nitrogen can affect the oxidation of divalent manganese using manganese-oxidizing bacteria [22,23]. As the manganese-oxidizing bacteria gradually adapted to the environment with nitrite nitrogen, the manganese content in the effluent dropped below 0.1 mg/L. When the concentration of manganese in the influent increased to approximately 1 or 2 mg/L, the ammonia nitrogen in the effluent increased, and the ammonia nitrogen in the effluent continued to increase the next day. This is because quartz sand filler has a certain adsorption capacity for manganese. With the rapid growth and reproduction of manganese-oxidizing bacteria in the filter layer, the manganese content in the effluent dropped below 0.1 mg/L after a few days.
3.2. Changes in and Kinetic Analysis of CODMn, Ammonia Nitrogen, and Manganese along the Filter Layers
3.2.1. Along-Filter Changes in CODMn and Kinetic Analysis
The removal effect of CODMn using aeration biofilters #1 and #2 in different stages is shown in Table 2. On the 86th day, the concentration of CODMn in the influent of aeration biofilter #1 was 6.81 mg/L, which decreased to 6.23 mg/L and 5.14 mg/L at 0.4 and 0.8 m, respectively. The removal amount of CODMn at 0~0.4 m (0.58 mg/L) was significantly less than that at 0.4~0.8 m (1.09 mg/L), possibly because the water intake is composed of tap water and lake water + ammonium chloride, and because the tap water contains a certain amount of residual chlorine, which will inhibit the growth of heterotrophic bacteria in the oxidized organic matter. Down the filter layers, the CODMn concentration gradually decreased, alongside the removal amount. On the 69th day, the concentration of CODMn in the influent of aeration biofilter #2 was 6.82 mg/L, and the removal amounts of CODMn in the 0~0.4 and 0.4~0.8 m layers of the filter were 0.92 mg/L and 1.38 mg/L, respectively. The amount of CODMn removed in the 0~0.4 m layer was significantly lower than that in the 0.4~0.8 m layer. The removal amounts in aeration biofilter #2 in the 0~0.4 and 0.4~0.8 m filter layers were significantly higher than the removal amount from the #1 aerated biofilter column on the 86th day. Down the filter layers, the concentration of CODMn on the 69th day was considerably lower than that on the 86th day, which indicates that after biological manganese oxide is formed in the filter layer, the biological manganese oxide can catalyze and oxidize the refractory organic matter in the influent into easily degradable organic matter that can then be used by heterotrophic bacteria. On the 101st and 159th days, the removal amounts in the 0~0.4 and 0.4~0.8 m layers of aerated filter #2 were 1.18, 1.26, 1.42, and 1.57 mg/L, respectively, and the removal amount in the 0~0.4 m layer considerably increased because heterotrophic bacteria gradually adapted to the influent water which contained residual chlorine. On the 101st day, the CODMn in the 0.4~0.8 m layer was slightly lower than that on the 69th day because the influent CODMn was low on the 101st day. From the 86th day of the #1 biofilter column to the 69th, 101st, and 159th days of the #2 biofilter column, the removal effect of CODMn along the route was gradually improved, which was attributed to the catalytic oxidation of biological manganese oxides in the filter layer.
The kinetic analysis of pollutants in water bodies is of great significance because it can establish the time needed to effectively remove specific pollutants, thus providing a basis for the selection of pollutant treatment units and methods [24]. In order to better guide the design of water plants containing CODMn and ammonia nitrogen micro-pollution sources, the kinetic characteristics of the removal of CODMn, ammonia nitrogen, and manganese using an aeration biofilter under different influent manganese concentrations were studied by assessing the simulated lake water containing CODMn and ammonia nitrogen. On the 86th day of treatment in aerated biofilter #1, and on the 69th, 101st, and 159th days of treatment in aerated biofilter #2, the biological removal of CODMn followed a first-order kinetic reaction (Table 3), with kinetic constant k values of 0.0194, 0.0297, 0.0323, and 0.0376 min−1, respectively, and half-reaction times t1/2 of 35.73, 23.34, 21.46, and 18.43 min, respectively. The half-reaction time t1/2 of the biological removal of CODMn was greatly shortened with an increasing manganese concentration in the influent. In the filter layer, the heterotrophic bacteria and biological manganese oxides matter corresponded to the oxidized organic matter, potentially effectively improving the removal effect of CODMn.
3.2.2. Changes in and Kinetic Analysis of Ammonia Nitrogen along the Treatment Path
The removal effects of ammonia nitrogen along aeration biofilters #1 and #2 at different stages are shown in Table 4. On the 86th day, the concentration of ammonia nitrogen in the influent of the #1 aeration biofilter was 1.29 mg/L. The amount of ammonia nitrogen decreased to 0.65, 0.28, and 0.16 mg/L at 0.4, 0.8, and 1.2 m of the filter layer. In the 0.4, 0.4–0.8 m, and 0.8~1.2 m layers of the filter, respectively, the removal amounts of ammonia nitrogen were 0.64, 0.37, and 0.12 mg/L, and were mainly removed in the 0~0.8 m layer of the filter. Down the filter layers, the amount of ammonia nitrogen removal gradually decreased, which was inconsistent with the removal amount of CODMn, indicating that nitrifying bacteria have strong adaptability to residual chlorine in the influent. On the 69th day, the concentration of ammonia nitrogen in the influent of aerated biofilter #2 was 1.37 mg/L, which was slightly higher than that on the 86th day. The removal amounts of ammonia nitrogen in the 0~0.4, 0.4~0.8, and 0.8~1.2 m layers were 0.79, 0.34, and 0.12 mg/L, respectively. Compared with the values taken on the 86th day, the removal amount of ammonia nitrogen in the 0~0.4 m layer notably increased, which indicates that the removal effect of ammonia nitrogen using the aerated biofilter was substantially improved after the biological manganese oxide was generated in the filter layer. On the 101st and 159th days, the removal amounts of ammonia nitrogen in the 0~0.4, 0.4~0.8, and 0.8~1.2 m layers of the #2 aeration biofilter were 0.70, 0.32, 0.088, 0.77, 0.35, and 0.087 mg/L, respectively. In this study, we found that the maximum removal was achieved in the 0–0.4 m section of the aeration biofilter. Compared with that on the 69th day, the removal amount in the 0.4~0.8 m layer was similar, but the removal amount in the 0.8~1.2 m layer was notably reduced. With a further increase in the manganese concentration in the influent, the removal effect of ammonia nitrogen along the treatment path did not substantially improve.
The concentration of ammonia nitrogen in the influent of this experiment was low, so the first-order kinetic model was used to fit the nitrification of ammonia nitrogen in different stages. The fitting results show that the biological removal of ammonia nitrogen in aerated biofilters #1 and #2 followed a first-order kinetic reaction, with kinetic constant K values of 0.1007, 0.1059, 0.1096, and 0.1162 min−1, and half-reaction time t1/2 values of 6.88, 6.55, 6.32, and 5.97 min, respectively (Table 5). With an increasing manganese concentration in the influent, the nitrification rate of ammonia nitrogen gradually increased, the kinetic constant K gradually increased, and the half-reaction time t1/2 was gradually shortened. We found that the existence of biological manganese oxide in the filter layer can improve the nitrification efficiency of ammonia nitrogen to a certain extent.
3.2.3. Changes in and Kinetic Characteristics of Manganese along the Treatment Pathway
The removal effect of manganese using aeration biofilters #1 and #2 in different stages is shown in Table 6. On the 69th, 101st, and 159th days, the concentrations of manganese in the influent were 0.55 mg/L, 1.13 mg/L, and 2.03 mg/L, respectively. With an increasing concentration of manganese in the influent, the concentration of manganese in the effluent decreased to below 0.05 mg/L. The removal amounts of manganese in the 0~0.4 m filter layer were 0.31 mg/L, 0.57 mg/L, and 0.72 mg/L, and the removal amounts of manganese increased in turn, which indicates that the aeration biofilter has a strong removal ability for manganese. On the 69th day and the 101st day, the removal amounts of manganese in the 0.4~0.8 m layer were 0.13 mg/L and 0.32 mg/L, respectively, which were considerably lower than those in the 0~0.4 m layer, but on the 159th day, the removal amount of manganese in the 0.4~0.8 m layer (0.77 mg/L) was close to that in the 0~0.4 m layer.
Several studies have shown that the biological removal of manganese in biofilter columns follows a first-order kinetic reaction [20,24,25]. In this study, the first-order kinetic model was used to fit the biological manganese removal data in different stages, and the results show that biological manganese removal in aerated biofilter #2 also conformed to the first-order kinetic reaction. On the 69th, 101st, and 159th days, the kinetic constants k of biological manganese removal were 0.114, 0.1579, and 0.1668 min−1, respectively (Table 7), and the half-reaction time t1/2 values were 6.08, 4.39, and 4.16 min, respectively. With an increasing manganese concentration in the influent, the kinetic constant K gradually increased, and the half-reaction time t1/2 gradually shortened. Compared with the literature [20,24,25], the kinetic constant K values in this study were smaller, and the half-reaction time t1/2 values were greater. For example, the K value reported by Cheng et al. [20] was 0.687, and the half-reaction time t1/2 was only 1.010 min, which is due to the smaller particle size of the filter media (0.8~1 mm). A smaller particle size leads to a larger specific surface area, more manganese-oxidizing bacteria becoming attached to the filter material, and a stronger manganese removal ability [26].
4. Conclusions
In the start-up stage, compared with aerated biofilter #1, the time required for the removal rate of CODMn in aerated biofilter #2 to reach the stable stage was prolonged by 1 day, but the removal rate of CODMn in the latter was increased by approximately 10%. The time for ammonia nitrogen in the effluent of aerated biofilter #2 to drop below 0.1 mg/L was shortened by 3 days. In the stable stage, compared with aerated biofilter #1, the removal rates of CODMn and ammonia nitrogen using aerated biofilter #2 increased by 13.01% and 0.76%, respectively. With a further increase in the manganese concentration in the influent, the removal rate of CODMn using aerated biofilter #2 further increased, and the removal rate of ammonia nitrogen slightly increased. The analysis along the way showed that CODMn was evidently removed in all sections of the filter layer, and the removal amount in the 0~0.4 m section was less than that in the 0.4~0.8 m section. Ammonia nitrogen was mainly removed in the 0~0.8 m section of the filter layer. With an increase in the manganese concentration in the influent, the biological manganese oxide produced in the filter layer can catalyze and oxidize the refractory organic matter in the influent into easily degradable organic matter and it can then be utilized by heterotrophic bacteria. The use reduction in CODMn along the way evidently increased with increasing influent manganese. The biological manganese oxide produced in the filter layer had a limited effect on the removal of ammonia nitrogen along the way. Kinetic analysis showed that the biological removal of CODMn, the nitrification of ammonia nitrogen, and the biological removal of manganese at different stages all conformed to a first-order kinetic reaction. As the manganese concentration in the influent gradually increased from 0 mg/L to approximately 0.5, 1, and 2 mg/L, the kinetic constant k of CODMn biological removal evidently increased, and the half-reaction time t1/2 was greatly shortened. The kinetic constant k of nitrification and biological manganese removal gradually increased, and the half-reaction time t1/2 gradually decreased.
Author Contributions
Formal analysis, Y.J.; Resources, H.L.; Data curation, Z.F. and Q.H.; Writing—original draft, L.N.; Writing—review & editing, G.Q. All authors have read and agreed to the published version of the manuscript.
Funding
This work was supported by the Science and Technology Plan to Focus on Research and Development in the Liangshan Prefecture (20ZDYF0113), a doctoral research project at Xichang University (YBZ202142), as well as the Science and Technology Project of the city of Xichang (JSYJ-2021-02).
Institutional Review Board Statement
Not applicable.
Informed Consent Statement
Not applicable.
Data Availability Statement
Data available in a publicly accessible repository that does not issue DOIs.
Conflicts of Interest
The authors declare no conflict of interest.
References
- Tröger, R.; Köhler, S.J.; Franke, V.; Bergstedt, O.; Wilberg, K. A case study of organic micropollutants in a major Swedish water source—Removal efficiency in seven drinking water treatment plants and influence of operational age of granulated active carbon filters. Sci. Total Environ. 2020, 706, 135680. [Google Scholar] [CrossRef]
- Alshorifi, F.T.; Ali, S.L.; Salama, R.S. Promotional Synergistic Effect of Cs–Au NPs on the Performance of Cs–Au/MgFe2O4 Catalysts in Catalysis 3,4-Dihydropyrimidin-2(1H)-Ones and Degradation of RhB Dye. J. Inorg. Organomet. Polym. Mater. 2022, 32, 3765–3776. [Google Scholar] [CrossRef]
- Bakry, A.M.; Alamier, W.M.; Salama, R.S.; El-Shall, M.S.; Awad, F.S. Remediation of water containing phosphate using ceria nanoparticles decorated partially reduced graphene oxide (CeO2-PRGO) composite. Surf. Interfaces 2022, 31, 102006. [Google Scholar] [CrossRef]
- Nasseh, N.; Arghavan, F.S.; Daglioglu, N.; Asadi, A. Fabrication of novel magnetic CuS/Fe3O4/GO nanocomposite for organic pollutant degradation under visible light irradiation. Environ. Sci. Pollut. Res. 2021, 28, 19222–19233. [Google Scholar] [CrossRef] [PubMed]
- Alshorifi, F.T.; Alswat, A.A.; Salama, R.S. Gold-selenide quantum dots supported onto cesium ferrite nanocomposites for the efficient degradation of rhodamine B. Heliyon 2022, 8, e09652. [Google Scholar] [CrossRef]
- Saleh, T.S.; Badawi, A.K.; Salama, R.S.; Mostafa, M.M.M. Design and Development of Novel Composites Containing Nickel Ferrites Supported on Activated Carbon Derived from Agricultural Wastes and Its Application in Water Remediation. Materials 2023, 16, 2170. [Google Scholar] [CrossRef]
- Al-Musawi, T.J.; Mazari Moghaddam, N.S.; Rahimi, S.M.; Amarzadeh, M.; Nasseh, N. Efficient photocatalytic degradation of metronidazole in wastewater under simulated sunlight using surfactant- and CuS-activated zeolite nanoparticles. J. Environ. Manag. 2022, 319, 115697. [Google Scholar] [CrossRef]
- Rahimi, M.S.; Panahi, A.H.; Moghaddam, S.M.N.; Allahyari, E.; Nasseh, N. Breaking down of low-biodegradation Acid Red 206 dye using bentonite/Fe3O4/ZnO magnetic nanocomposite as a novel photo-catalyst in presence of UV light. Chem. Phys. Lett. 2022, 794, 139480. [Google Scholar] [CrossRef]
- Carra, I.; Lozano, J.F.; Autin, O.; Bolton, J.R.; Jarvis, P. Disinfection by-product formation during UV/Chlorine treatment of pesticides in a novel UV-LED reactor at 285 nm and the mitigation impact of GAC treatment. Sci. Total Environ. 2020, 712, 136413. [Google Scholar] [CrossRef]
- Chen, Z.; Wang, X.; Chen, X.; Yang, Y.; Gu, X. Pilot study of nitrogen removal from landfill leachate by stable nitritation-denitrification based on zeolite biological aerated filter. Waste Manag. 2019, 12, 161–170. [Google Scholar] [CrossRef]
- Li, X.B. Pretreatment and Removal of Ammonia Nitronia from Micro-Polluted Water Source in North China. Master’s Thesis, Harbin Institute of Technology, Harbin, China, 2020. (In Chinese). [Google Scholar]
- Cheng, Q.; Li, D.; Li, X.K.; Zhang, X. Rapid Start-up of Biofilter Purifying Groundwater Containing High Concentrations of lron, Manganese and Ammonia Nitrogen. China Water Wastewater 2013, 29, 41–44. [Google Scholar]
- Bargar, J.R.; Fuller, C.C.; Marcus, M.A.; Brearley, A.J.; Perez De la Rosa, M.; Webb, S.M.; Caldwell, W.A. Structural Characterization of Terrestrial Microbial Mn Oxides from Pinal Creek, AZ. Geochim. Cosmochim. Acta 2009, 73, 889–910. [Google Scholar] [CrossRef]
- Webb, S.M.; Tebo, B.M.; Bargar, J.R. Structural Influences of Sodium and Calcium Ions on the Biogenic Manganese Oxides Produced by The Marine Bacillus Sp., Strain SG-1. Geomicrobiol. J. 2005, 22, 181–193. [Google Scholar] [CrossRef]
- Villalobos, M.; Lanson, B.; Manceau, A.; Toner, B.; Sposito, G. Structural Model for the Biogenic Mn Oxide Produced by Pseudomonas putida. Am. Mineral. 2006, 91, 489–502. [Google Scholar] [CrossRef]
- Yang, J. Performance and Mechanism of the Oxidation of Typical Organic Pollutants by Nanoscale Hydrous Manganese Dioxide. Ph.D. Thesis, Harbin Institute of Technology, Harbin, China, 2013. (In Chinese). [Google Scholar]
- Forrez, I.; Carballa, M.; Verbeken, K.; Vanhaecke, L.; Schlüsener, M.; Ternes, T.; Boon, N.; Verstraete, W. Diclofenac Oxidation by Biogenic Manganese Oxides. Environ. Sci. Technol. 2010, 44, 3449–3454. [Google Scholar] [CrossRef]
- Forrez, I.; Carballa, M.; Fink, G.; Wick, A.; Hennebel, T.; Vanhaecke, L.; Ternes, T.; Boon, N.; Verstraete, W. Biogenic Metals for the Oxidative and Reductive Removal of Pharmaceuticals, Biocides and Iodinated Contrast Media in a Polish Membrane Bioreactor. Water Res. 2011, 45, 1763–1773. [Google Scholar] [CrossRef]
- APHA. Standard Methods for the Examination of Water and Wastewater, 21st ed.; American Public Health Association: Washington, DC, USA; American Water Works Association: Denver, CO, USA; Water Environment Federation: Alexandria, VA, USA, 2005. [Google Scholar]
- Cheng, Q.; Liu, Z.; Huang, Y.; Li, F.; Nengzi, L.; Zhang, J. Influence of temperature on CODMn and Mn2+ removal and microbial community structure in pilot-scale biofilter. Bioresour. Technol. 2020, 316, 123968. [Google Scholar] [CrossRef]
- Cheng, Q.; Yu, J.; Nengzi, L.; Zhang, X.; Guo, J.; Xin, X.; Zhang, J. Effects of ammonia on efficiency of iron, manganese and ammonia removal in biological purifying filter. Chin. J. Environ. Eng. 2016, 10, 6371–6377. [Google Scholar]
- Cheng, Q.; Nengzi, L.; Xu, D.; Guo, J.; Yu, J. Influence of nitrite on the removal of Mn(II) using pilot-scale biofilters. J. Water Reuse Desalination 2017, 7, 264–271. [Google Scholar] [CrossRef]
- Cheng, Q.; Nengzi, L.; Xu, D.; Yu, J.; Wang, X.; Zhang, J. Simultaneous Removal of lron, Manganese, Ammonia and Turbidity from Groundwater Using Two-stage Biofilters. China Water Wastewater 2016, 32, 50–54. [Google Scholar]
- Katsoyiannis, I.A.; Zouboulis, A.I. Biological treatment of Mn(II) and Fe(II) containing groundwater: Kinetic considerations and product characterization. Water Res. 2004, 38, 1922–1932. [Google Scholar] [CrossRef] [PubMed]
- Cai, Y.; Li, D.; Liang, Y.W.; Luo, Y.; Zeng, H.; Zhang, J. Effective start-up biofiltration method for Fe, Mn, and ammonia removal and bacterial community analysis. Bioresour. Technol. 2015, 176, 149–155. [Google Scholar] [CrossRef] [PubMed]
- Abu Hasan, H.; Abdullah, S.R.S.; Kamarudin, S.K.; Kofli, N.T.; Anuar, N. Kinetic evaluation of simultaneous cod, ammonia and manganese removal from drinking water using a biological aerated filter system. Sep. Purif. Technol. 2014, 130, 56–64. [Google Scholar] [CrossRef]
Figure 1.
A schematic diagram of the systems with aeration biofilters #1 and #2.

Figure 2.
CODMn use reduction in aeration biofilter #1.

Figure 3.
CODMn use reduction in aeration biofilter #2.

Figure 4.
Ammonia use reduction in aeration biofilter #1.

Figure 5.
Ammonia use reduction in aeration biofilter #2.

Figure 6.
Manganese use reduction in aeration biofilter #2.


Table 1.
A schematic diagram of aeration biofilters #1 and #2.
| Item | CODMn (mg/L) | NH4+-N (mg/L) | Mn (mg/L) | pH | |
|---|---|---|---|---|---|
| Intake water quality | range | 5.82~8.23 | 0.98~1.42 | 0.42~2.21 | 6.79~7.94 |
| average value | 6.83 | 1.24 | 1.12 | 7.28 | |
Table 2.
Variations in CODMn along the filter layer at different stages.
| Filter Layer Thickness (m) | CODMn (mg/L) | |||
|---|---|---|---|---|
| #1/86 Days | #2/69 Days | #2/101 Days | #2/159 Days | |
| 0 | 6.81 | 6.88 | 6.22 | 6.91 |
| 0.4 | 6.23 | 5.96 | 5.04 | 5.49 |
| 0.8 | 5.14 | 4.58 | 3.78 | 3.92 |
| 1.2 | 4.47 | 3.71 | 2.95 | 2.87 |
| 1.5 | 4.05 | 3.07 | 2.47 | 2.42 |
Table 3.
Linear regression analysis of biological CODMn removal at different stages.
| Filter/Time | Kinetic Constant k (min−1) | Half-Reaction Time t1/2 (min) | Formula | R2 |
|---|---|---|---|---|
| #1–86 days | 0.0194 | 35.73 | y = −0.0194x + 0.0511 | 0.992 |
| #2–69 days | 0.0297 | 23.34 | y = −0.0297x + 0.0861 | 0.998 |
| #2–101 days | 0.0323 | 21.46 | y = −0.0323x + 0.0360 | 0.998 |
| #2–159 days | 0.0376 | 18.43 | y = −0.0376x + 0.0521 | 0.995 |
Table 4.
Variations in ammonia along the filter layer at different stages.
| Filter Layer Thickness (m) | Ammonia Nitrogen (mg/L) | |||
|---|---|---|---|---|
| #1–86 Days | #2–69 Days | #2–101 Days | #2–159 Days | |
| 0 | 1.29 | 1.37 | 1.19 | 1.28 |
| 0.4 | 0.65 | 0.58 | 0.49 | 0.51 |
| 0.8 | 0.28 | 0.24 | 0.17 | 0.16 |
| 1.2 | 0.16 | 0.12 | 0.082 | 0.073 |
| 1.5 | 0.064 | 0.053 | 0.042 | 0.038 |
Table 5.
Linear regression analysis of biological ammonia removal at different stages.
| Time | Kinetic Constant k (min−1) | Half-Reaction Time t1/2 (min) | Formula | R2 |
|---|---|---|---|---|
| #1–86 days | 0.1007 | 6.88 | y = −0.1007x + 0.1383 | 0.981 |
| #2–69 days | 0.1059 | 6.55 | y = −0.1059x − 0.0070 | 0.994 |
| #2–101 days | 0.1096 | 6.32 | y = −0.1096x − 0.0762 | 0.994 |
| #2–159 days | 0.1162 | 5.97 | y = −0.1162x − 0.0792 | 0.992 |
Table 6.
Variations in manganese along the filter layer at different stages.
| Filter Layer Thickness (m) | Manganese (mg/L) | ||
|---|---|---|---|
| 69 Days | 101 Days | 159 Days | |
| 0 | 0.55 | 1.13 | 2.03 |
| 0.4 | 0.24 | 0.56 | 1.30 |
| 0.8 | 0.11 | 0.24 | 0.53 |
| 1.2 | 0.051 | 0.049 | 0.12 |
| 1.5 | 0.019 | 0.019 | 0.034 |
Table 7.
Linear regression analysis of the biological manganese removal at different stages.
| Time | Kinetic Constant k (min−1) | Half-Reaction Time t1/2 (min) | Formula | R2 |
|---|---|---|---|---|
| #2–69 days | 0.114 | 6.08 | y = −0.114x + 0.1819 | 0.983 |
| #2–101 days | 0.1579 | 4.39 | y = −0.1579x + 0.713 | 0.987 |
| #2–159 days | 0.1668 | 4.16 | y = −0.1668x + 1.0812 | 0.982 |
Disclaimer/Publisher’s Note: The statements, opinions and data contained in all publications are solely those of the individual author(s) and contributor(s) and not of MDPI and/or the editor(s). MDPI and/or the editor(s) disclaim responsibility for any injury to people or property resulting from any ideas, methods, instructions or products referred to in the content. |
© 2023 by the authors. Licensee MDPI, Basel, Switzerland. This article is an open access article distributed under the terms and conditions of the Creative Commons Attribution (CC BY) license (https://creativecommons.org/licenses/by/4.0/).
Share and Cite
MDPI and ACS Style
Nengzi, L.; Jiang, Y.; Fang, Z.; Hu, Q.; Qiu, G.; Li, H. Influence of Biological Manganese Oxides on the Removal of Organic Matter and Ammonia in Micro-Polluted Source Water. Water 2023, 15, 1624. https://doi.org/10.3390/w15081624
AMA Style
Nengzi L, Jiang Y, Fang Z, Hu Q, Qiu G, Li H. Influence of Biological Manganese Oxides on the Removal of Organic Matter and Ammonia in Micro-Polluted Source Water. Water. 2023; 15(8):1624. https://doi.org/10.3390/w15081624
Chicago/Turabian StyleNengzi, Lichao, Ying Jiang, Zhirong Fang, Qiyuan Hu, Guanglei Qiu, and Haitao Li. 2023. "Influence of Biological Manganese Oxides on the Removal of Organic Matter and Ammonia in Micro-Polluted Source Water" Water 15, no. 8: 1624. https://doi.org/10.3390/w15081624
Note that from the first issue of 2016, this journal uses article numbers instead of page numbers. See further details here.