


Performance of Sand and Mixed Sand–Biochar Filters for Treatment of Road Runoff Quantity and Quality
by
 , , and
Harri Koivusalo
1,*,
Maria Dubovik
2,
Laura Wendling
2, 
Eero Assmuth
3,
Nora Sillanpää
1,3 and
Teemu Kokkonen
1 1
Department of Built Environment, Aalto University School of Engineering, P.O. Box 15200, FI-00076 Aalto, Finland
2
VTT Technical Research Centre of Finland, P.O. Box 1000, FI-02044 Espoo, Finland
3
Sitowise, Linnoitustie 6 D, FI-02600 Espoo, Finland
*
Author to whom correspondence should be addressed.
Water 2023, 15(8), 1631; https://doi.org/10.3390/w15081631
Submission received: 7 March 2023
/
Revised: 18 April 2023
/
Accepted: 19 April 2023
/
Published: 21 April 2023
(This article belongs to the Special Issue Urban Stormwater Control, Utilization, and Treatment)
Abstract
:Nature-based solutions and similar natural water retention measures to manage urban runoff are often implemented by cities in order to reduce runoff peaks, catch pollutants, and improve sustainability. However, the performance of these stormwater management solutions is relatively rarely assessed in detail prior to their construction, or monitored and evaluated following implementation. The objective of this study was to investigate the field-scale performance of road runoff filters with respect to the management of stormwater quantity and quality. This study synthesizes data from two intensive measurement surveys after the construction of sand and biochar-amended road runoff filters. The filters were able to strongly control the runoff volume and shape of the hydrograph. The long-term retention was about half that of the water inflow, and a hydrographic analysis showed the significant but strong event-size-dependent detention of runoff in both the sand and the sand–biochar filters. The biochar amendment in the filter showed no clear hydrological impact. The pollutant attenuation of the implemented road runoff filters was modest in comparison with that observed under controlled conditions. The impact of the biochar layer on the effluent water quality was observed as the levels of phosphorous, organic carbon, K, Ca and Mg in the sand–biochar filter effluent increased in comparison with the sand filter.
1. Introduction
Stormwater management is key to sustainable landscape design, and nature-based solutions (NBSs) and other natural water retention measures (NWRMs) are being advocated to treat stormwaters and mitigate the disturbance caused by construction to the local water cycle [1]. NBSs and NWRMs can be implemented in either a distributed or centralized configuration within a given catchment in order to increase the retention and detention of urban runoff, but are typically viewed as “decentralized” water treatment solutions that are complementary to existing urban water management infrastructure. Ecological engineering-based stormwater management approaches are referred to as low-impact development (LID), sustainable urban drainage (SUD), and water-sensitive urban design (WSUD) in different contexts [1,2], but all of these terms encompass aim to restore the natural hydrological functions that are compromised in urbanized areas. The main disruption to the natural hydrologic cycle in the built environment is caused by the construction of impervious and nearly impervious surfaces, together with modern engineered surface and subsurface stormwater drainage and conveyance systems [3]. In addition to changes to the surface water runoff quantity and its temporal dynamics, urban construction leads to substantial changes in the quality of runoff, resulting in surface runoff that is characterized by its potential to pose an ecological risk to various degrees and to deteriorate the ecological integrity of receiving habitats [4,5].
The control of water quality has become a common motivation for the implementation of NBSs and NWRMs. Multiple studies have demonstrated the impact of various NBSs, NWRMs and other decentralized stormwater management approaches on improving the quality of urban stormwater [6,7,8], including the removal of nutrients and metals [9,10]. In addition to improved water quantity and quality management, NBS and NWRM actions provide multiple benefits, such as improvements in the local amenity values, biodiversity, and air quality [1,11] through the delivery of ecosystem services. Cities across the world are actively implementing NBSs and NWRMs, both in newly developed and existing built environments.
Systems such as NBSs and NWRMs that promote infiltration can be effective for peak runoff and volume control, yet their retention capacity under cold climatic conditions is not well understood. Kõiv-Vainik et al. [1] reviewed evidence regarding the hydrological performance of NBSs and NWRMs when aiming to control stormwater runoff across climatic zones. In their data [1], the missing information was clearest for the water retention and pollutant removal efficiency of an NWRM solution. While the implementation of these systems is expanding, their performance in actual field conditions is rarely investigated. This is true in particular for the solution in which the inflow into and the outflow from these systems are difficult to measure or sample. Shahzad et al. [12] studied the performance of curbside infiltration systems when used as a distributed solution and measured the urban catchment outflow in order to detect the hydrological impact of the system. They found a relatively modest impact on the runoff due to the limited storage volume, relative to the catchment scale; however, the study illustrated the potential for NBS and NWRM systems to control runoff in a real-life setting. The spatial planning of NBSs and NWRMs in conjunction with overall catchment management schemes is necessary in order to appropriately locate and scale NBSs and NWRMs to optimize their performance when implemented in urban environments [13].
A range of natural and engineered materials are used in the NBSs and NWRMs utilized for stormwater filtration, including organic and inorganic media, and mixtures thereof; this is in order to provide a chemically reactive surface area and enable the effective mitigation of both particulate and dissolved pollutants in filtered stormwater [14,15]. Sand and gravel are commonly used to ensure a high infiltration capacity. To improve the treatment performance, sand may be mixed with other materials, such as biochar products. The performance and impacts of the NBSs and NWRMs, with respect to pollutant attenuation at a local catchment scale, are often not well understood, and this dearth of knowledge regarding their performance and impact is particularly notable at scales larger than the local catchment and in the longer term.
Biochar is increasingly used as a substrate material in stormwater treatment due to its affordability and the availability of feedstock [16,17]. A product of pyrolysis, biochar has a unique carbon structure, large surface area, and greater pore volume than soils; thus, it is widely used as a soil amendment as it promotes water retention and the availability of micronutrients [1,18]. For stormwater treatment applications, this increased water retention capacity and storage is expected to improve the detention of stormwater in the system [19]. The most notable benefits of biochar are related to its more efficient treatment of pollutants in stormwater particularly metals [16]. The physicochemical properties of biochar, such as its cation exchange capacity and surface area, vary and depend on the type and characteristics of the biomass feedstock and production process, including the pyrolysis temperature and residence time [20]. Biochar-amended stormwater filters are gaining popularity, yet there remains a need to gather additional evidence concerning their performance under a range of field conditions in urban environments [17].
The treatment efficiency of NBSs and NWRMs for managing water quality has been widely studied under both controlled laboratory-scale and field conditions. Laboratory experiments have demonstrated the efficient functioning of materials for treating polluted runoff with non-vegetated filters or biofilters [21]. The removal rates for metals exceed 90% in controlled conditions; this removal typically occurs in the top layers of the filter [22,23,24,25]. Filtration and biofiltration systems for stormwater treatment have been extensively studied (e.g., [26,27,28]), including those using varying filter media [29,30,31] with and without vegetation [24,32]. With respect to biochar-amended filter media, there appears to be little difference in the nutrient release from fresh or aged biochars, although the difference is substantial between various feedstocks (e.g., wood and grass), and high- and low-temperature biochars [33]. Biochar has additionally been studied for other NBS/NWRM applications, such as green roofs [34,35].
When using the reactive media, the removal is notably efficient for particulate-bound metals through filtration or pre-sedimentation, whereas the removal of dissolved forms is lesser and is governed to a large extent by sorption in the filter [36]. The removal of nutrients varies and is typically most effective for sediment-bound fractions, such as particulate-bound phosphorous and ammonium, which are retained through physical entrapment. Dissolved fractions of nitrogen and phosphate in influent stormwater are attenuated through a range of biogeochemical reactions and under some conditions, the filter material may act as a source of dissolved nutrients, depending on the properties of the media. Although the pH of influent stormwaters is relatively constant with time, varying moisture conditions within the filter and variations in the oxidative reductive potential are significant factors that control the filter behavior [21]. The leaching of nutrients from stormwater filters may be relatively elevated after dry periods. Nitrogen retention may be achieved by sustaining high levels of moisture for denitrification processes. The presence of vegetation improves the hydraulic functioning of filters, whilst the performance of vegetated filters is relatively better in wet conditions compared with their performance during dry cycles [21,24]. The presence of vegetation has additionally been attributed to enhanced pollutant immobilization [37]. Field studies have highlighted the varying performance of filters under the conditions of highly dynamic storm runoff generation and variable pollutant concentrations. Laboratory studies often use a higher influent concentration than that which occurs under field conditions, which may lead to discrepancies between laboratory and field results, and an overestimation of the leaching of metals [36].
In the long term, the accumulation of contaminants in stormwater treatment filters is noted, yet the capacity is typically high for the retention of metals. Rommel et al. [36] studied the fate of heavy metals retained in sediments, the filter cake trapped by the treatment process, and the filter media itself in a road runoff treatment system 2.75 years after its construction. They noted a higher accumulation of metals in the sediment and the filter cake than in the filter media. Similarly, Jones and Davis [38] observed the accumulation of lead, copper, and zinc in a bioretention cell filter media over a 4-year period. Al-Ameri et al. [25] studied the metal concentration in tens of biofilters and observed no significant increases in the filter media metal concentrations, other than elevated levels in the surface layer, after 7–8 years of operation. Al-Ameri et al. [25] noted that the density of urban land use and the presence of industrial areas within the local catchment are key factors in controlling the influent water quality and thus affect the long-term capacity of the filters.
The large number of existing solutions that have been constructed but not monitored present a largely unexploited source of information about NBS and NWRM performance and impact. Assmuth et al. [39] addressed the benefits of NWRM designs that aim to facilitate the monitoring of the solution’s performance through repeated field surveys. There is a need for data at broader spatial and temporal scales regarding the performance of NBSs and NWRMs under field conditions in order to improve their designs, address maintenance needs, and identify changes in the performance of the systems over time.
The motivation of this study was to provide evidence on the hydrological and water quality management performance of typical nature-based stormwater filters, and highlight some pitfalls in the practical implementation of NBSs and NWRMs. Our objective was to gather and compile repeated survey data at the field sites and to assess the filter performance in terms of controlling the storm runoff quantity and attenuation of pollutants in road runoff. The NWRM systems examined included a sand filter and a sand–biochar filter that were designed by an environmental engineering consultancy and implemented by the city of Vantaa in Finland. Both filters were constructed so as to support repeated monitoring and to obtain field data about their performance with respect to water quantity and quality management and its changes over time. The comparison between the two filters aimed to evaluate the role of the biochar mixture with regard to stormwater treatment from hydrological and water quality perspectives. The water quality parameters examined included sediments, nutrients, and metals. The performance of the NBS and NWRM-type filters was examined in the light of existing knowledge regarding typical stormwater filter behavior as reported in controlled experiments.
2. Materials and Methods
2.1. Site Description and Data
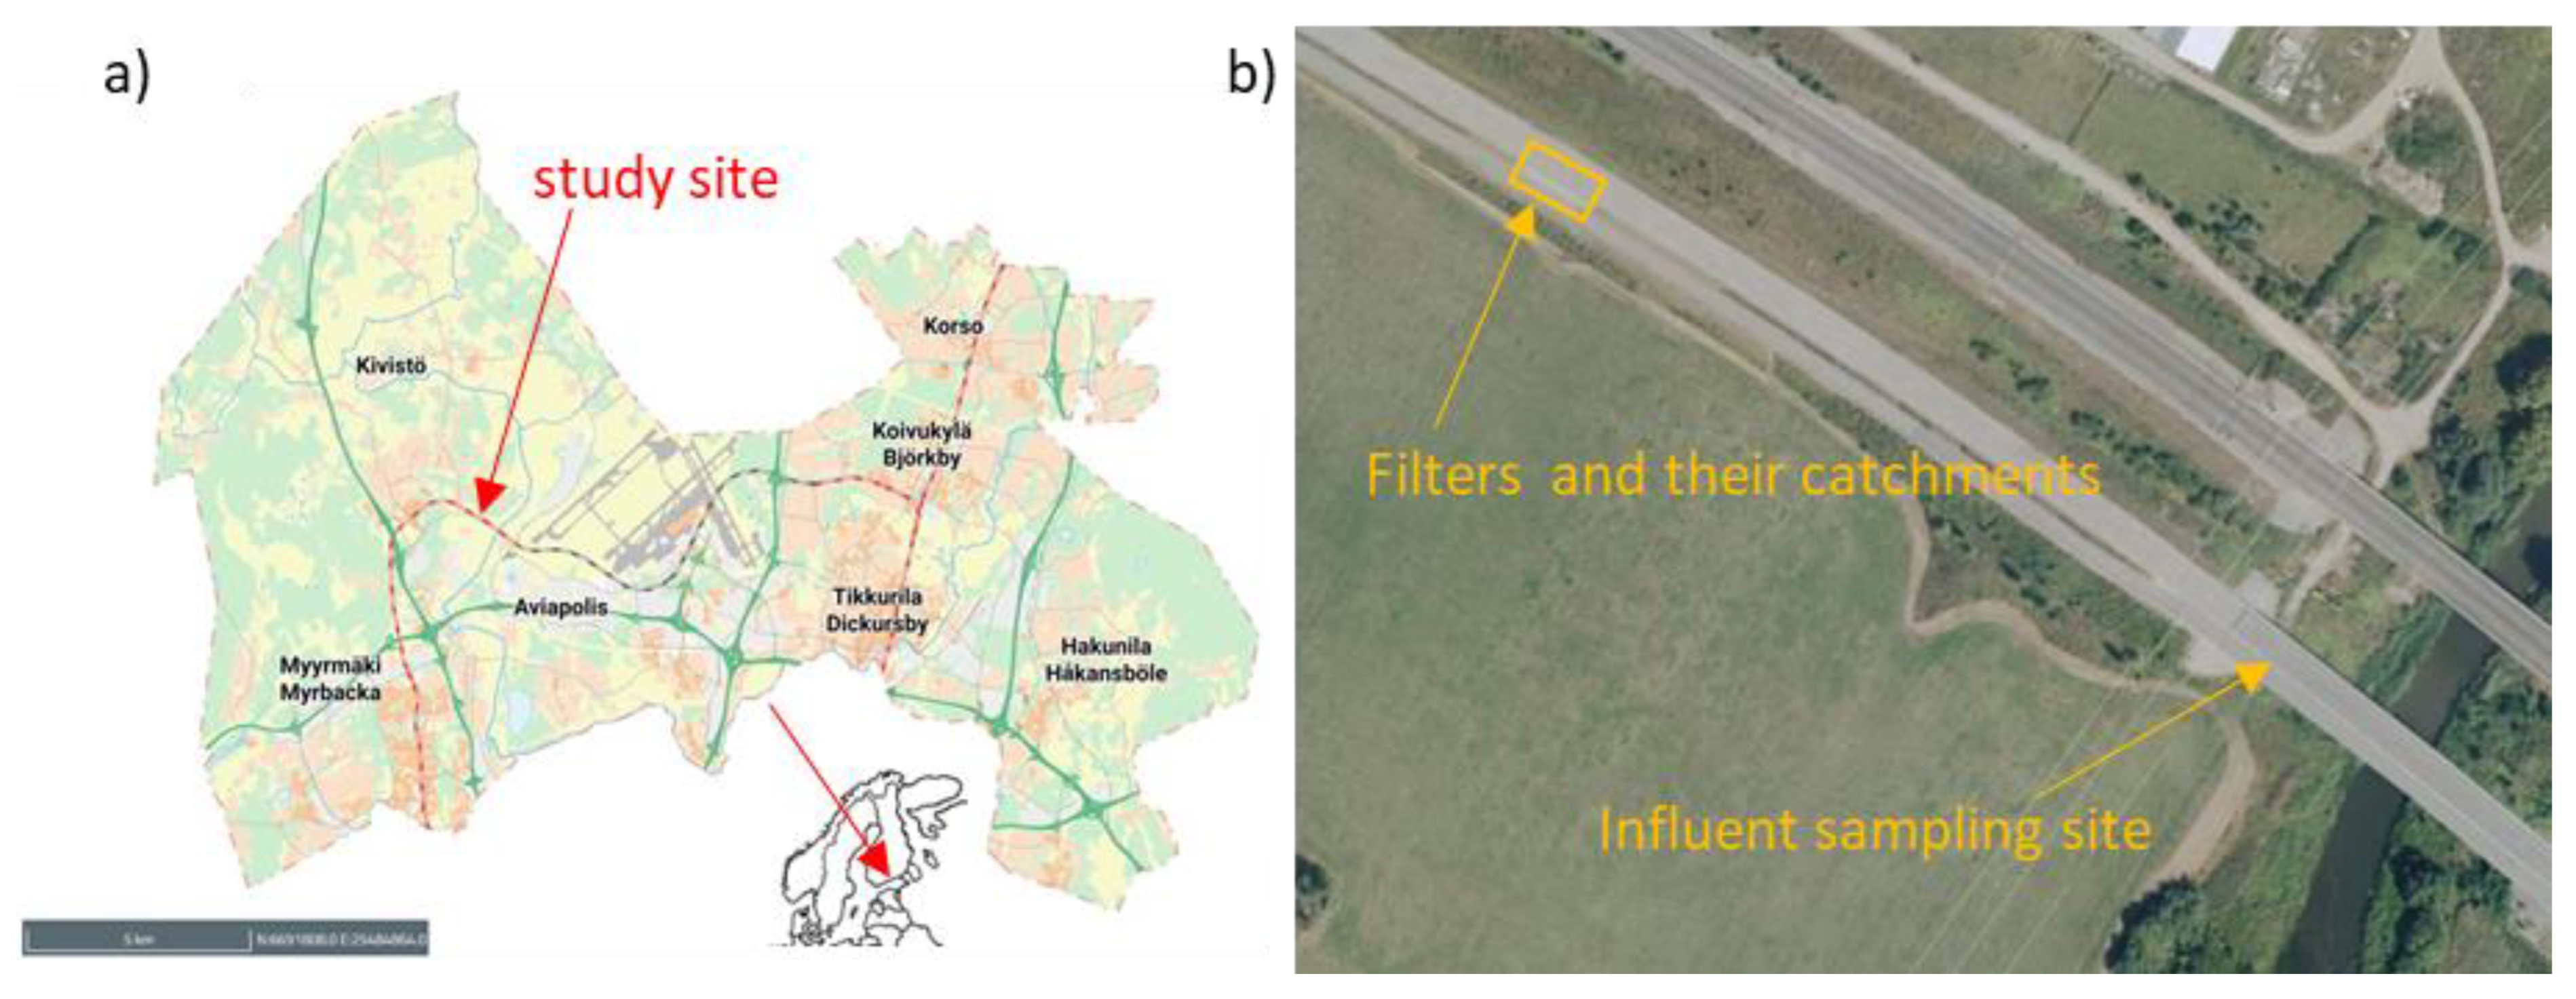
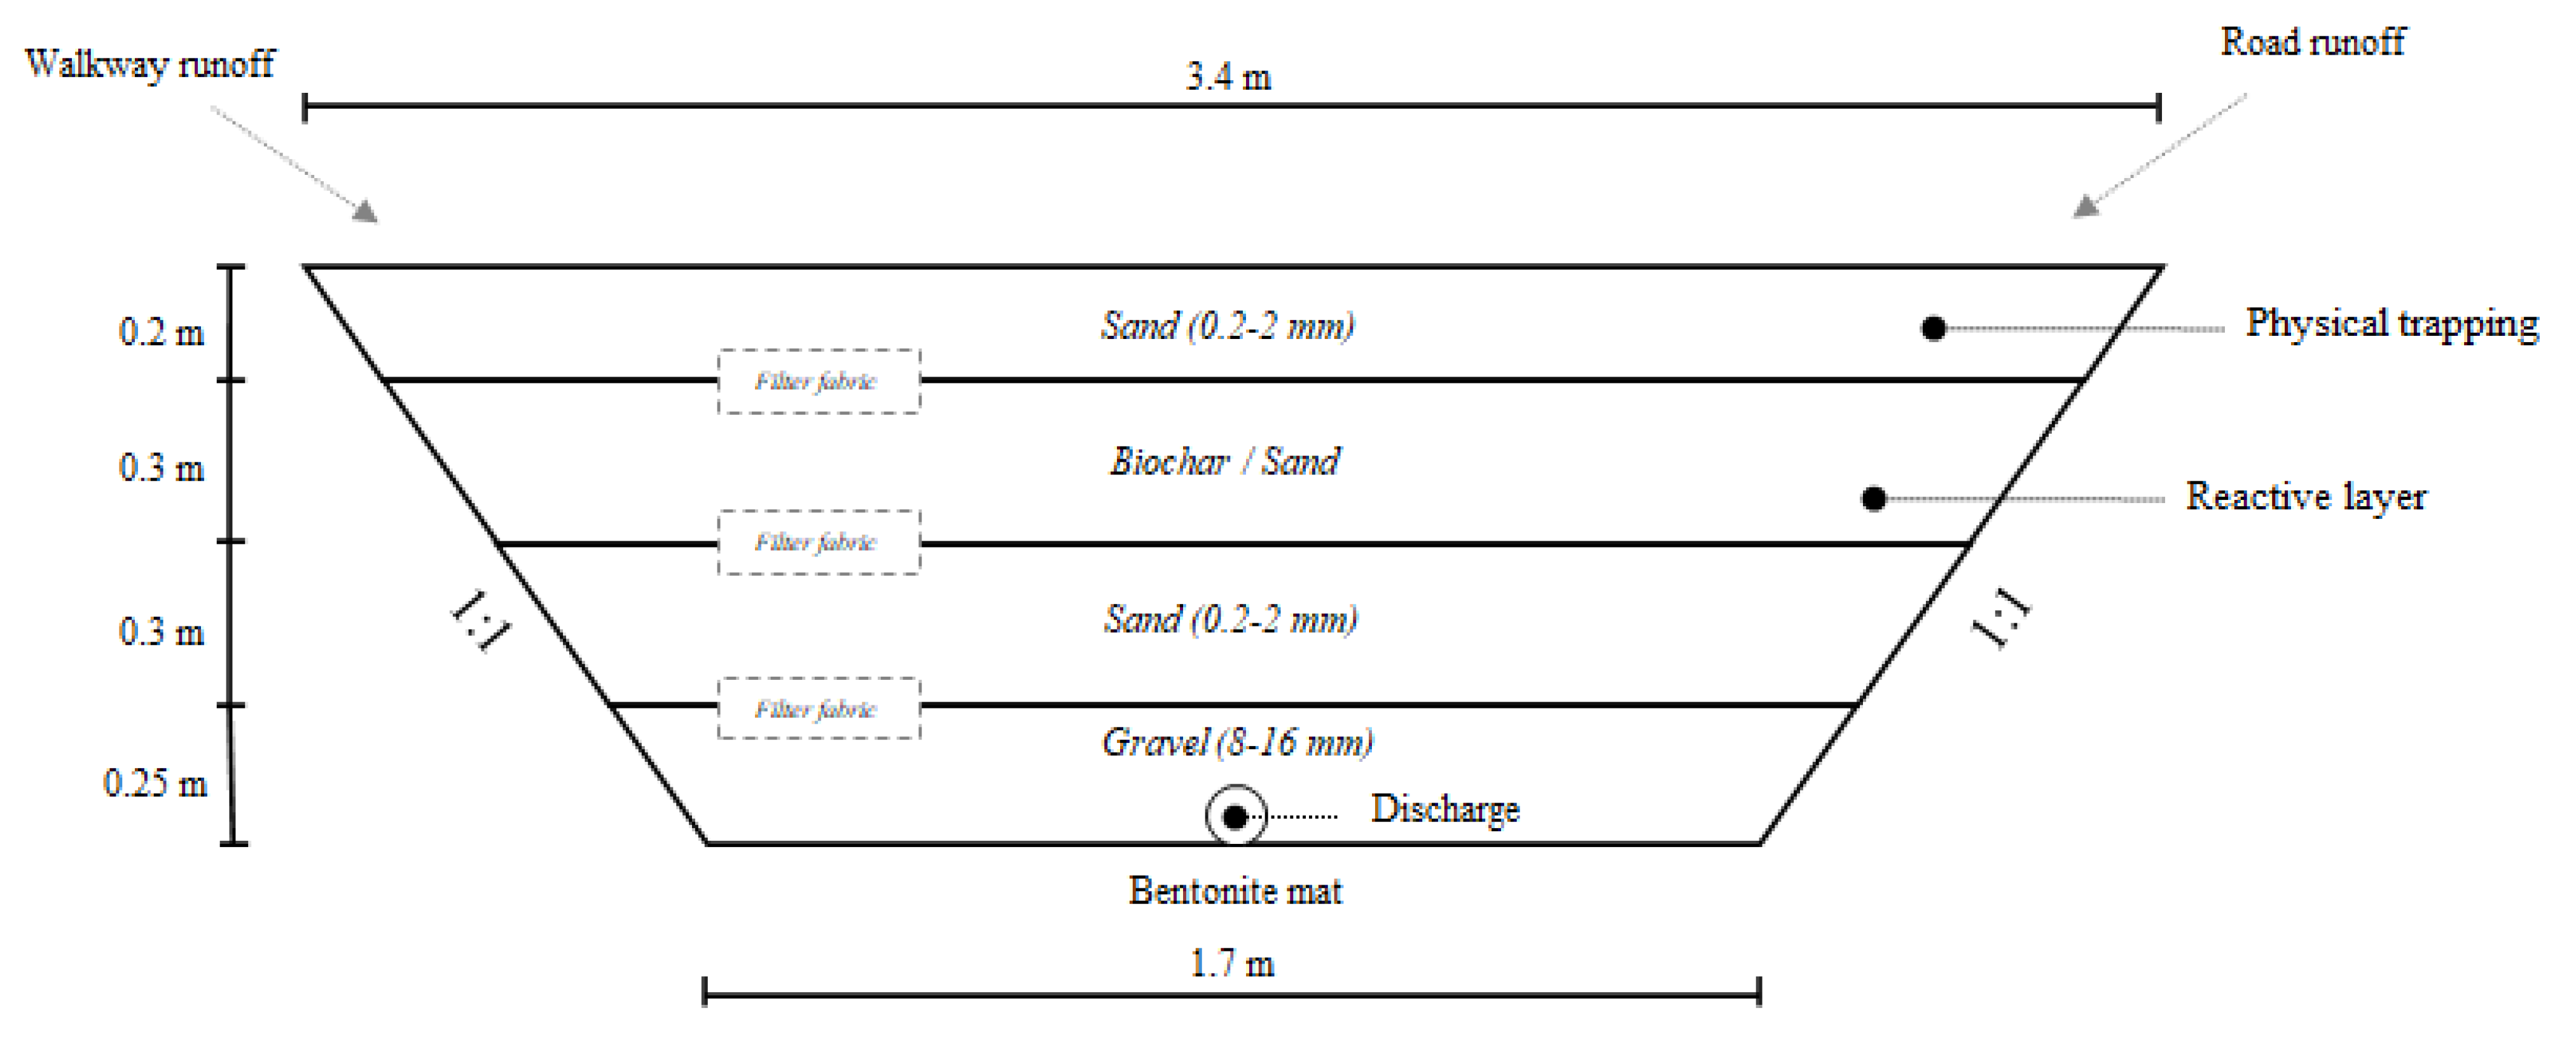
The present study builds upon the two measurement surveys of 2017 and 2019 at road runoff filter sites along the Tikkurilantie road in the city of Vantaa, Southern Finland (60.314° N, 24.884° E, Figure 1a). The climate in the study region is characterized by distinct seasons with warm summers and cold, wet winters. The annual mean air temperature and precipitation in the years of 2017 and 2019 were 6.1 and 6.9 °C, and 806 and 810 mm, respectively. Two filters were constructed between a vehicle road and a light traffic road. The annual average daily traffic load at the site was 7610 vehicles, with approximately 16% of this comprising heavy weight traffic [40]. The local speed limit was 60 km/h. One of the filters was constructed with sand and the other with sand including a layer of mixed, powdered birch biochar (Figure 2). The bottom and the sides of the filters were lined with a bentonite mat to isolate them from the surrounding soils. The filters were constructed in January 2017. Each filter had a size of 3.4 × 10 m2 × depth of 1.4 m, and the filters each served a catchment area of approximately 100 m2 (Figure 1b). The filters were a part of the sequence of road runoff filters along the Tikkurilantie road. The runoff from the paved road sections by the sides of the filters flowed onto the filters as overland flow. The bentonite mat was installed as close to the edge of the road asphalt cover as possible in order to catch runoff in the filters. The biochar material in one filter was manufactured from birch (Betula spp.) by RPK Hiili Oy using pyrolysis. The volumetric fraction of the biochar layer was about 30% of the total filter volume. The washed sand used as the construction material consisted of light gneiss (54%), reddish granite (27%), and dark mica slate (19%), with no iron, sulfur compounds or limestone.
The layer structure of the filters is detailed in Table 1, illustrating that the 300 mm biochar layer in one filter is the main difference between the two stormwater treatment filters. Subsurface drains were installed at the bottom of the filters and the drain waters were discharged into an open ditch located along the light traffic way. The drainage outlets were equipped with discharge measurement devices. The discharge measurement system used in in 2017 was a Diehl Hydrus (DN 50 mm) ultrasonic water meter and that used in 2019 was a HyQuest Solutions’ tipping bucket flow gauge TB0.5L. In addition, the flow was manually measured at the time of the water sampling. The discharge gauge in 2017 was not able to measure all the low flows, because the gauge measured zero discharge until the rising flow exceeded ca. 50 l/h and triggered the flow sensor, which then recorded the flow recession down to 2 l/s. The automated measurements in 2017 were combined with manual flow observations to estimate the event discharge patterns of the filter drain outflow.
The site was set up with two IM523 rain gauges (Metos), adjusted for a resolution of 0.2 mm. The stormwater inflow from the road surfaces to the filters was assumed to resemble the surface runoff discharge from the traffic road and light traffic way over a bridge at a distance of 250 m from the filters (Figure 1b). Sampling of the surface runoff was conducted at the outlet of the vertical drainage pipes under the bridge.
The influent and effluent water quality was studied using sampling data from three rainfall events in June–July 2017 and from three events in September–October 2019. The first measurement survey occurred 6–7 months and the second survey occurred 2 years and 8–9 months after the construction of the filters. The water samples were gathered manually during the surveys. The influent water samples under the bridge were taken during rainfall events, whereas the filter discharge samples were taken over a longer period that extended beyond the rainfall events; this was due to a delay in the flow through the filters.
The studied variables are listed in Table 2 and they include the concentration of the sediments, nutrients, and metals, as well as other variables that are commonly used to characterize the chemical composition of stormwater. The number of influent samples was 10–17 in 2017 and 5–10 in 2019 for each event. The filter discharge samples numbered 11–15 in 2017 and 10 in 2019 per event. However, in 2017, not all variables listed in Table 2 were measured for all the collected samples.
2.2. Hydrological Analyses
Short-term concentrated measurement surveys were launched to gather hydrological and water quality data on the influent and effluent waters of the filters during rainfall events. The surveys were initiated when the weather forecast indicated that intense rainfall was expected on the study site. The rainfall discharge events of the sampling surveys were determined by defining the start of the event, which was based on the measured increase in rainfall, and the end of the event, which was based on the flow recession decreasing back to the pre-event level. The event characteristics were defined in terms of the rainfall depth and peak intensity, discharge depth and peak intensity, time to peak discharge from rainfall peak, and runoff coefficient.
The discharge response to rainfall was studied via an analysis of the instantaneous unit hydrograph (IUH), following [41,42]. Fitting the IUH to flow events provides a quantitative and visual measure of event flashiness, i.e., how quickly and with what type of recession the filter responds to a rainfall event. IUHs were identified for all events in both filters in order to facilitate their comparison. The IUH ordinate as a function of time t and the mean transit time tm was determined as follows:
where α is the shape parameter, β is the scale parameter, and Γ(α) is the gamma function. The IUH parameters were optimized for each rainfall-runoff event by optimizing α and β concurrently with the effective rainfall of each time step when rainfall had a value greater than zero. Effective rainfall was the share of the precipitation that produced filter discharge. The optimization was conducted with the shuffled complex evolution method (SCE-UA) of [43]. The sum of the squared error between the computed and observed filter discharge values was the optimization criterion to be minimized. The IUH ordinates for a rainfall-runoff event are identifiable as long as there is a sufficient amount of event runoff data over the time periods with no rainfall.
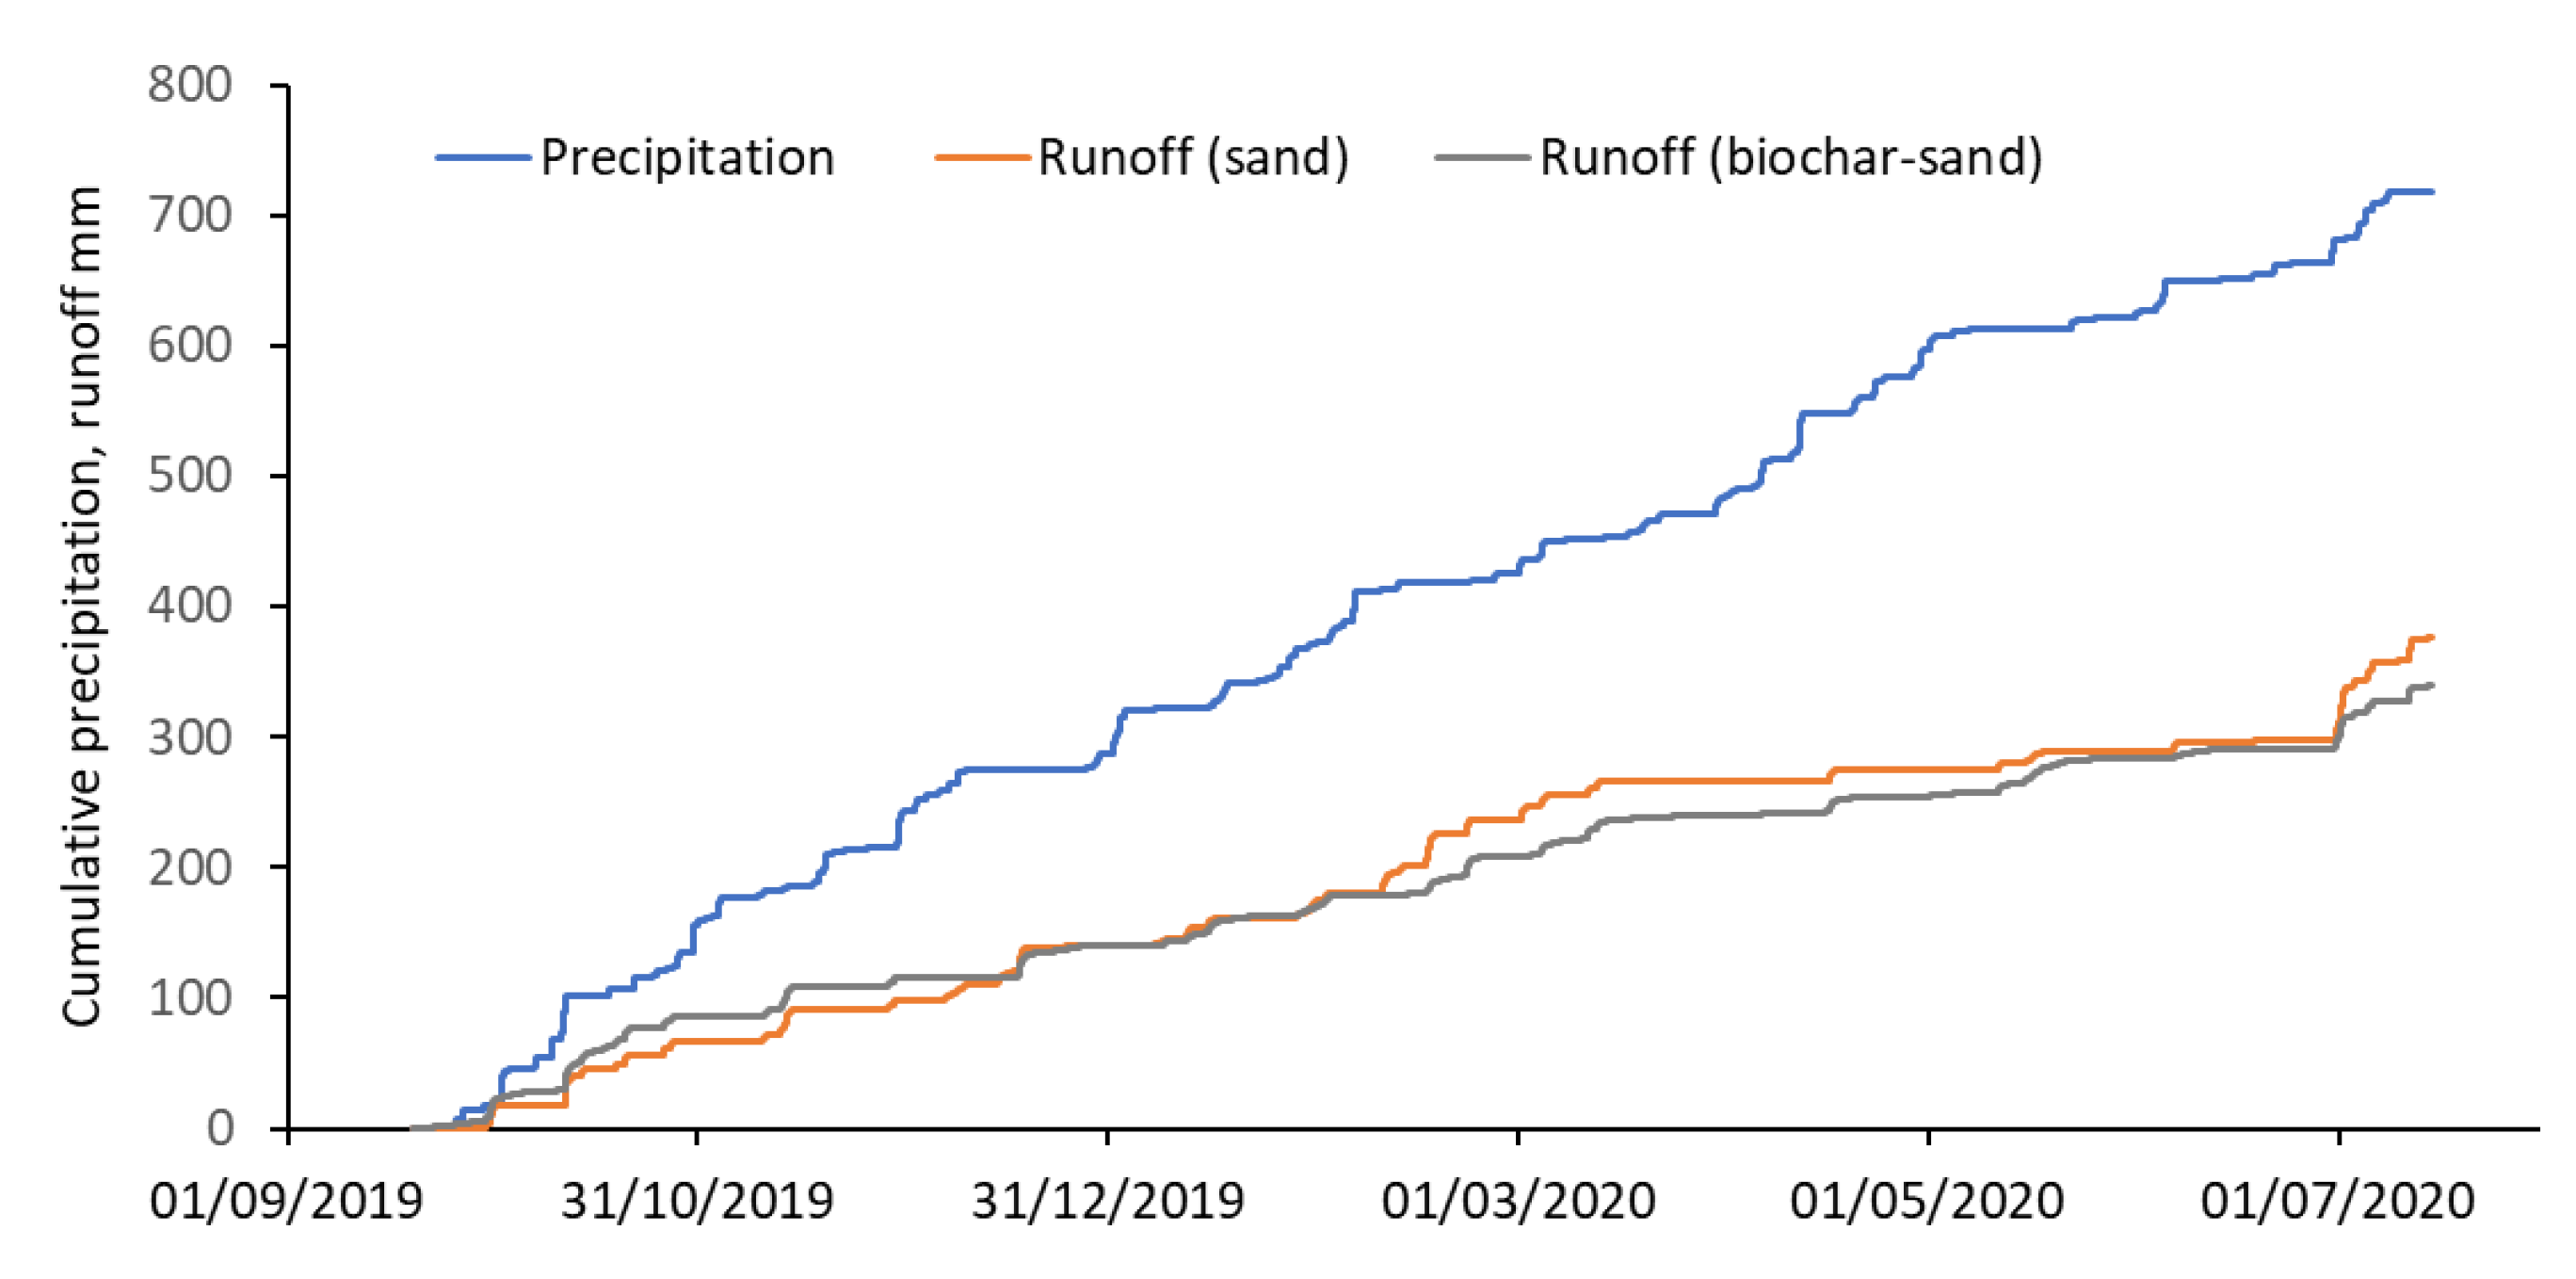
In order to compare the hydrological behavior of the two filters, the seasonal precipitation and discharge values were plotted from September 2019 to July 2020, when measurements were available. The winter of 2019–2020 was exceptionally mild and the filters were only infrequently affected by snow and freezing conditions, which facilitated the continuation of the rainfall and outflow measurements throughout the winter.
2.3. Analysis of Water Quality Data
The water quality data were studied to detect the differences between the sand and mixed sand–biochar filters, and between the surveys of the years 2017 and 2019. The surveys in 2017 represented conditions about half a year after the filter construction and the survey in 2019 represented the conditions ca. 2 years after the first survey. The analysis tools were selected to first visualize the relative difference between the influent and filter discharge water quality. Median concentrations of elements and pollutants were calculated and the scaled values for each concentration were computed as follows:
where ci is the median concentration of the studied variable at source i, ci,rel is the scaled concentration at source i, and cmax is the maximum median concentration of the sources. The three sources were (1) influent stormwater, (2) sand filter discharge, and (3) sand–biochar filter discharge. To highlight the largest relative changes between the source water quality levels for different variables, the differences in the median source concentrations were ranked from the largest to smallest values.
The scaled concentration values were also studied using event mean concentration estimates cem,i, which were computed as follows:
where ci,j is the concentration of sample j for source i, jmax is the number of samples for an event, and qi,j is the flow weight of sample j for the source i. The flow weights were computed using the block method [44]. The time block for sample i at time ti starts at time (ti + ti-1)/2 and ends at (ti+1 + ti)/2. The flow weight for sample i is the average flow over the time block. The event mean concentration values were subsequently scaled following Equation (3) in order to visualize the changes between the effluent and filter discharge quality.
3. Results
3.1. Discharge Response to Rainfalls
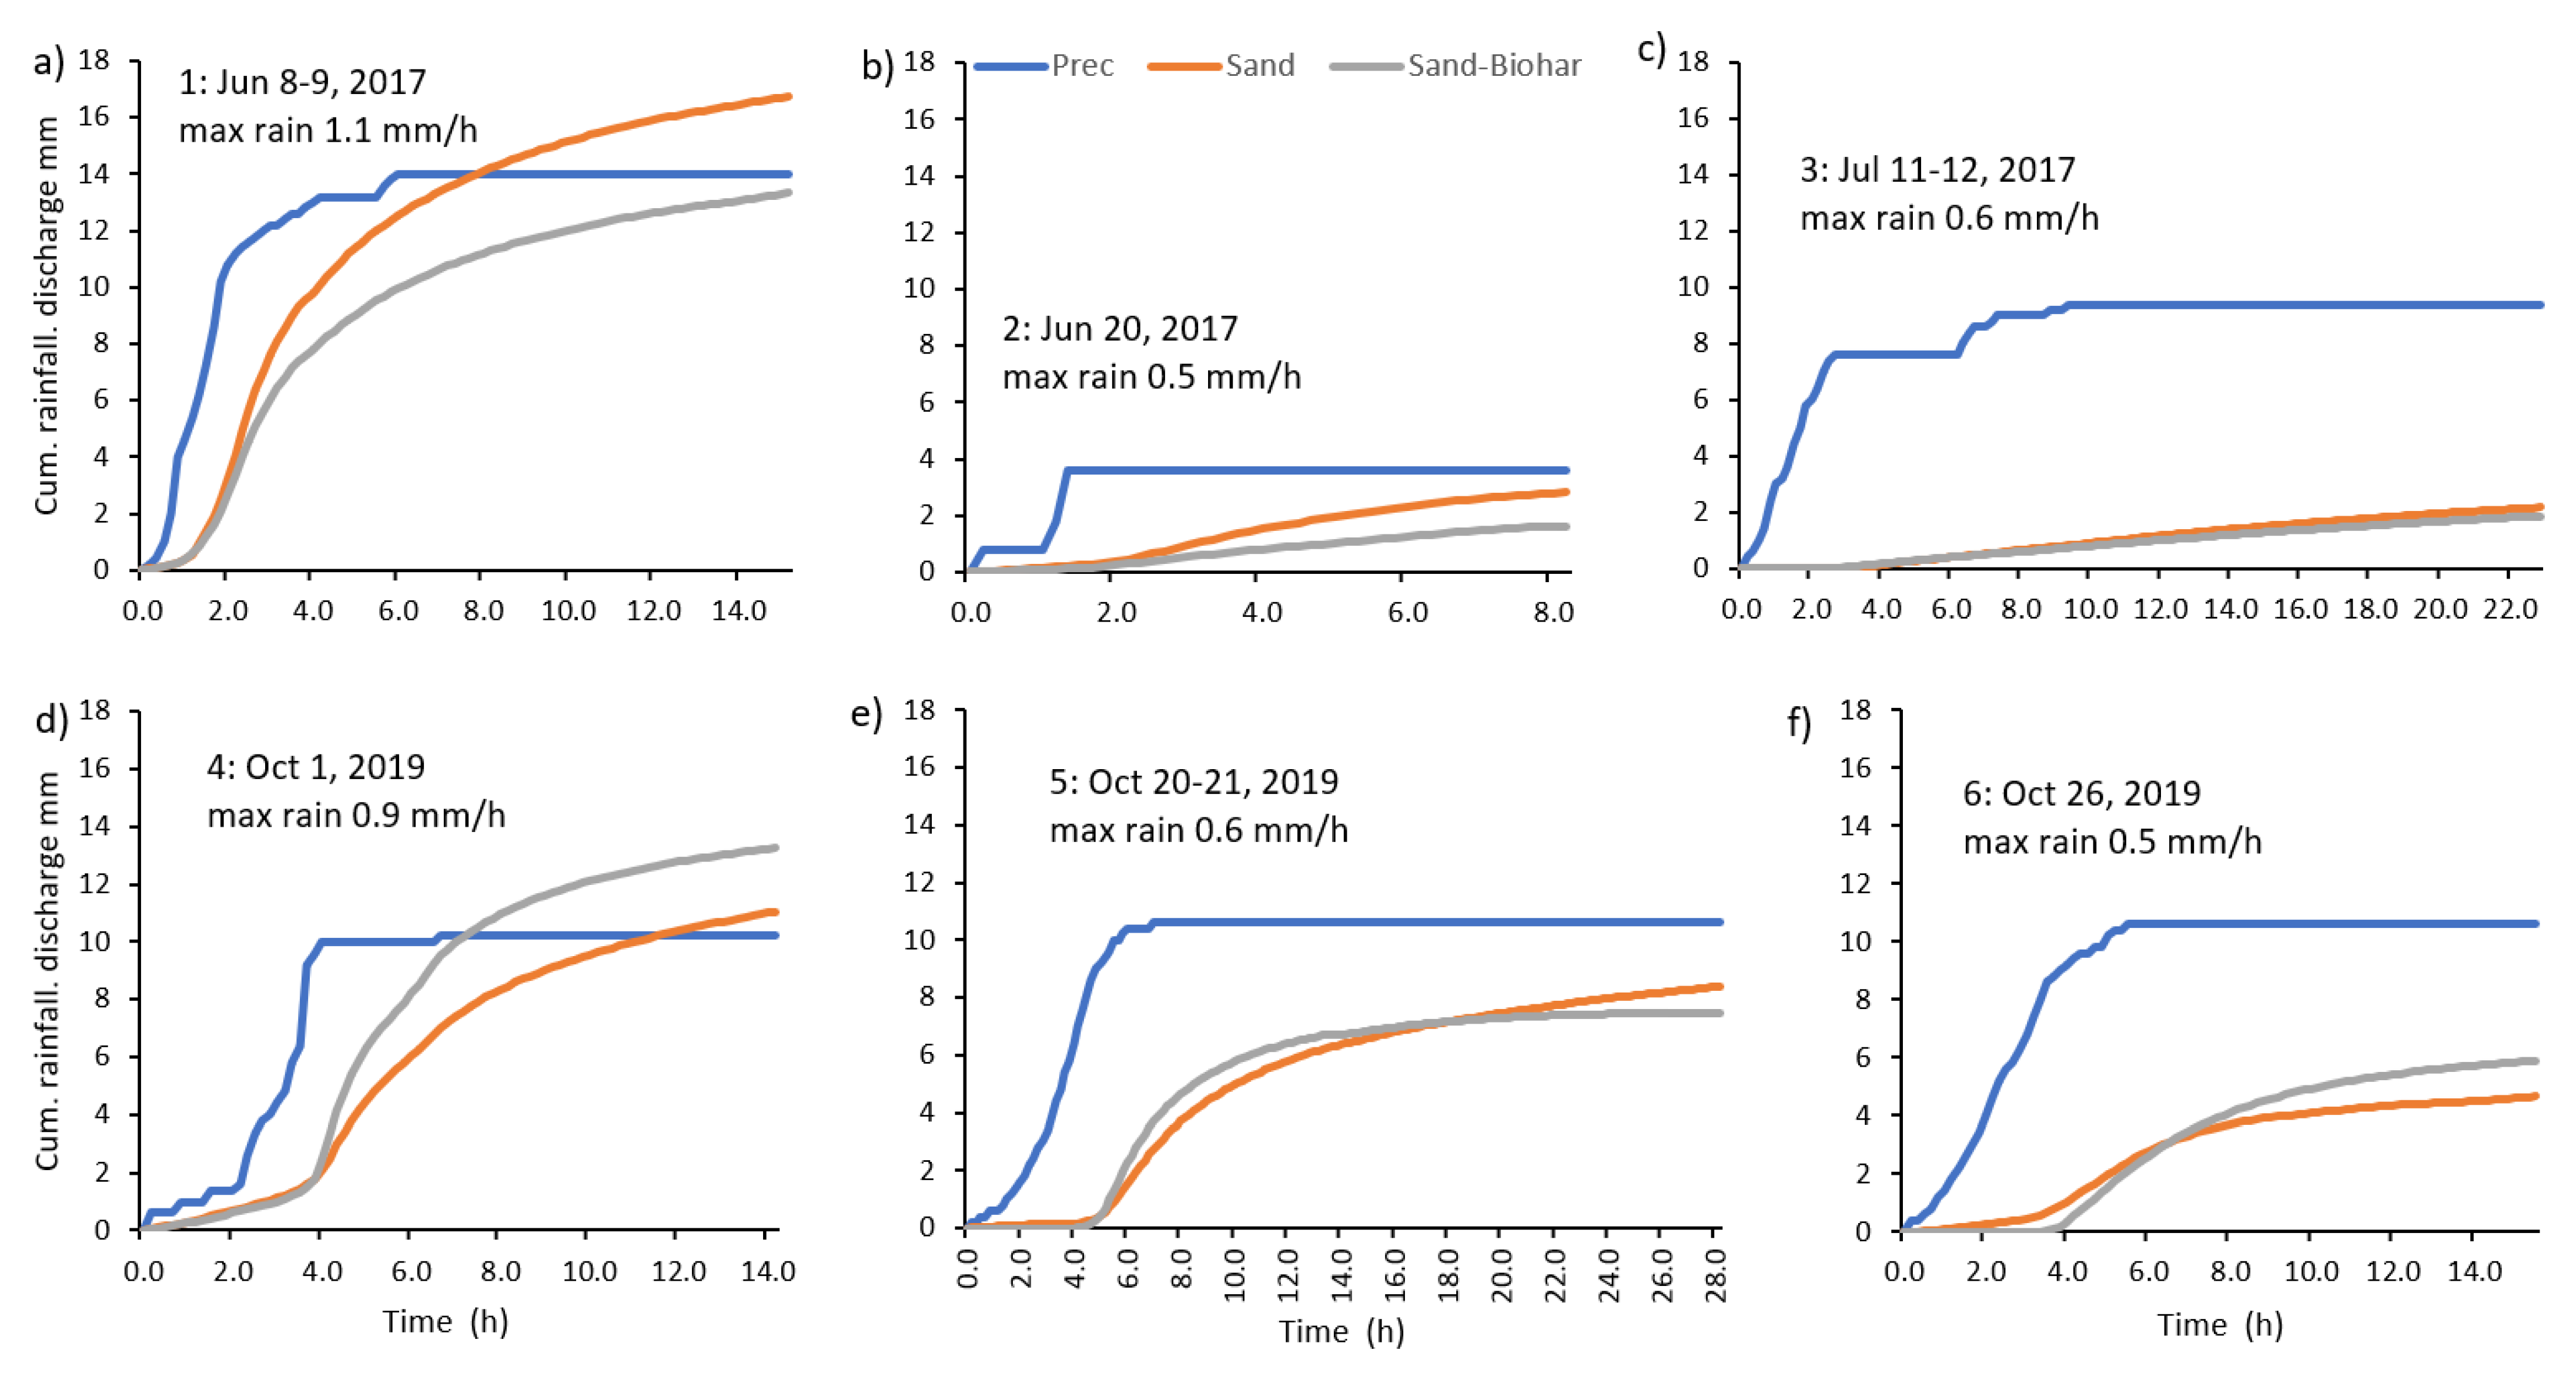
Figure 3 summarizes the hydrological characteristics of the events in terms of accumulated rainfall and drain discharge. The first studied summer rainfall event in June 2017 occurred during an episode of intermittent rainfalls. The highest rainfall event with a maximum intensity of 1.1 mm/h led to a clear response in the filter discharges. The cumulative runoff in event 1 exceeded the precipitation due to the high antecedent moisture caused by the small rainfall preceding event 1. The other two studied events (events 2–3 in Figure 3) had clearly lower rainfall intensities and they occurred without major preceding rainfalls. The events measured in autumn 2019 were similar in terms of the total event rainfall volumes, but the rainfall intensity was higher for event 4 than for the last two events, which was again reflected in the higher generation of drain discharge from the filters. The magnitude of the accumulated discharge is an indication of the initial moisture status of the filters and the rainfall amount. The difference between the sand filter and the sand–biochar filter was not systematic. In 2017, the sand filter produced a higher outflow for all events, but in 2019, the sand–biochar filter showed a faster response and a slower recession than the sand filter.
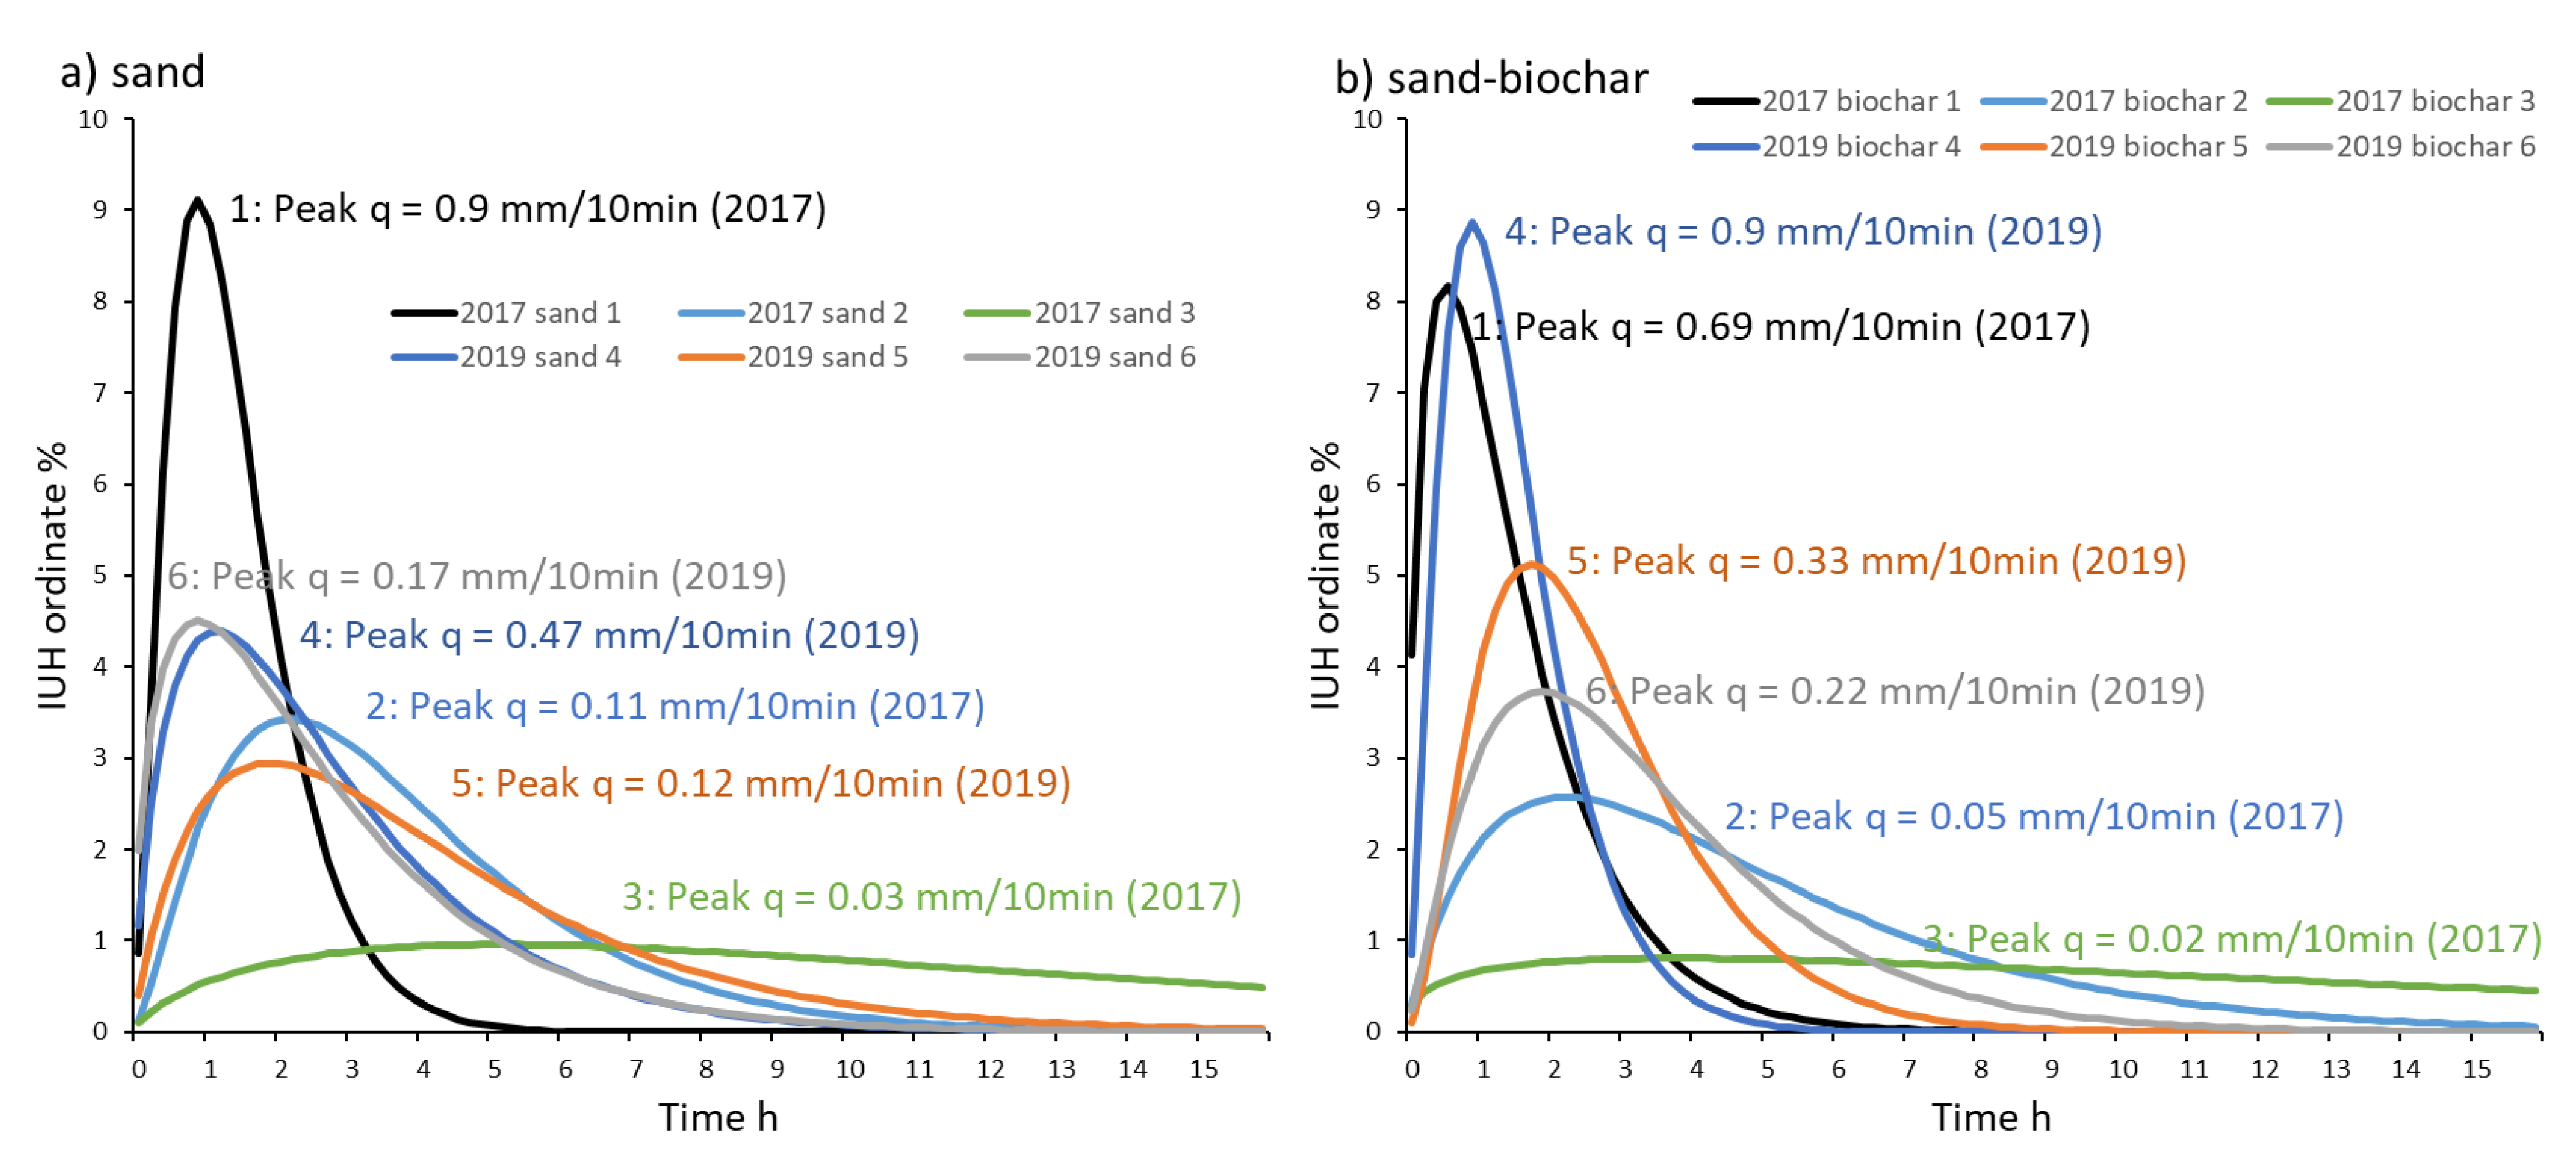
The dynamics of the filters were quantified in terms of the IUHs visualized in Figure 4, and the parameter values of the IUHs are listed in Table 3. The events with the highest peak discharge values show the flashiest shapes in the IUH, which is seen in particular for the sand filter in event 1 and for the sand–biochar filter in events 1 and 4, which have a peak discharge that is higher than 0.6 mm/10 min. The July event 3 with the lowest peak discharge represents the least flashy shape, with a flat response to rainfall. The rest of the events have more similar IUH shapes, which are more consistently becoming flatter as the peak discharge value decreases for the events in the sand–biochar filter compared to the sand filter.
The mean transit times (Table 3) for the flashiest IUHs are 1.4–1.5 h, which increase strongly for the low-peak events. Clearly, the size of the discharge event controls the shape of the hydrograph and the transit times. The shape parameter β increases strongly with a decreasing peak value, expanding the IUH forward with time. A comparison between the IUHs from the sand and sand–biochar filters shows no strong difference. The flattest IUHs have slightly longer transit times for the biochar–sand filter than for the sand filter.
The continuous data from autumn 2019 to summer 2020 reveal the long-term water balance of the filters (Figure 5). The runoff coefficients are 47% for the biochar–sand filter and 53% for the sand filter. The discharge for the sand filter is most of the time (77%) higher than that for the biochar filter, but the difference in the runoff accumulation is not systematic. In the short-term and event scales (Figure 2), the runoff coefficients vary widely due to the small size of the catchment and the relatively long retention of small flows in the filters. The runoff coefficient does not show clear seasonal changes, except for the fact that the runoff is low in April and high in July compared with the measured precipitation. It should be noted that evaporation demand, which has a strong seasonal pattern at the site, is not the only factor that causes the retention of water in the filters. Part of the water influx from the road area infiltrates into the ground and does not end up in the subsurface drainpipe of the filters.
3.2. Discharge Water Quality
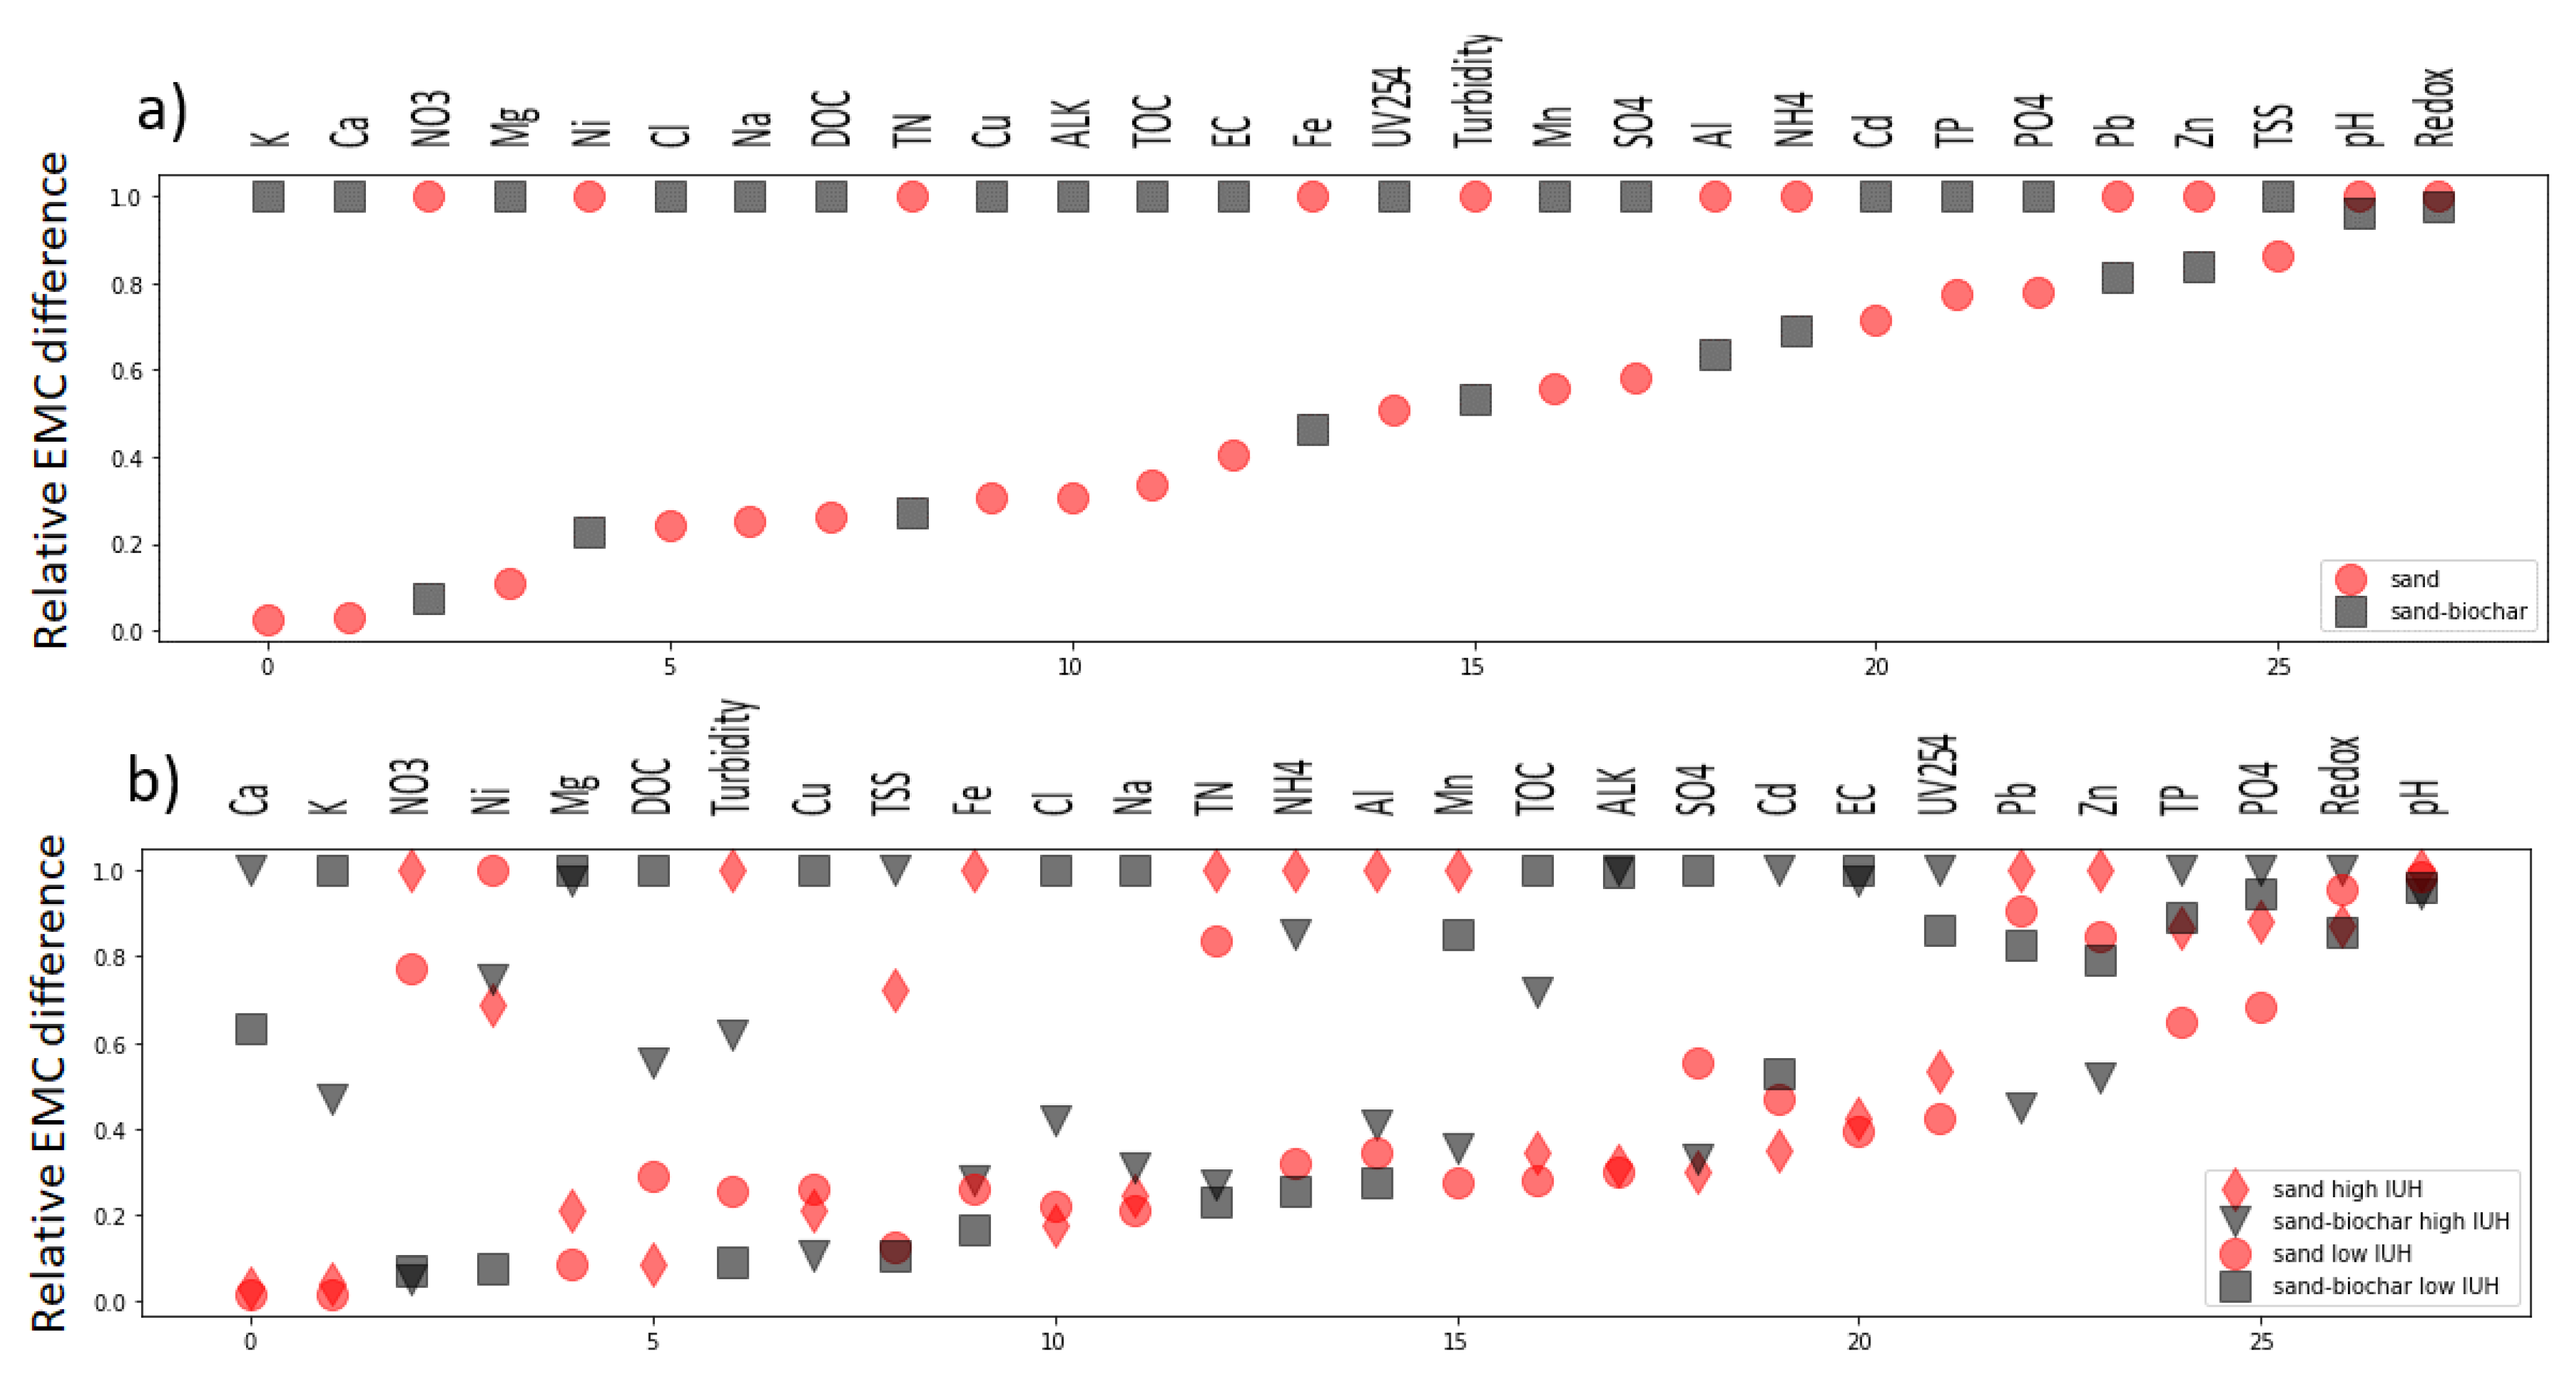
The water quality is firstly presented to highlight the differences in the event mean concentrations (EMC) between the sand and sand–biochar filters for all studied events (Figure 6a). For most of the measured variables, the sand–biochar filter discharge had higher EMCs than the sand filter. The sand filter had clearly higher values for nitrogen (NO3, TN), for some metals (Ni, Fe), and for turbidity. The sand–biochar filters had higher EMCs for alkali and earth metals (K, Ca, Mg), for Cl and Na, and for organic matter (DOC, TOC).
The largest two events, 1 and 4, showed a more peaky hydrograph shape in the IUH analysis of Figure 4, but the flashy events did not stand systematically out in the comparison of the filter water quality (Figure 6b). The highest EMC differences were similar for events of different sizes, but for Ni, the difference was reduced for flashy events compared to flat events. In the events with peaky IUHs, the sand filter showed the most systemically high EMC values for NO3, turbidity, Fe, TN, NH4, Al, and Mn. The turbidity and TSS were at an elevated level for both filters during the flashier events.
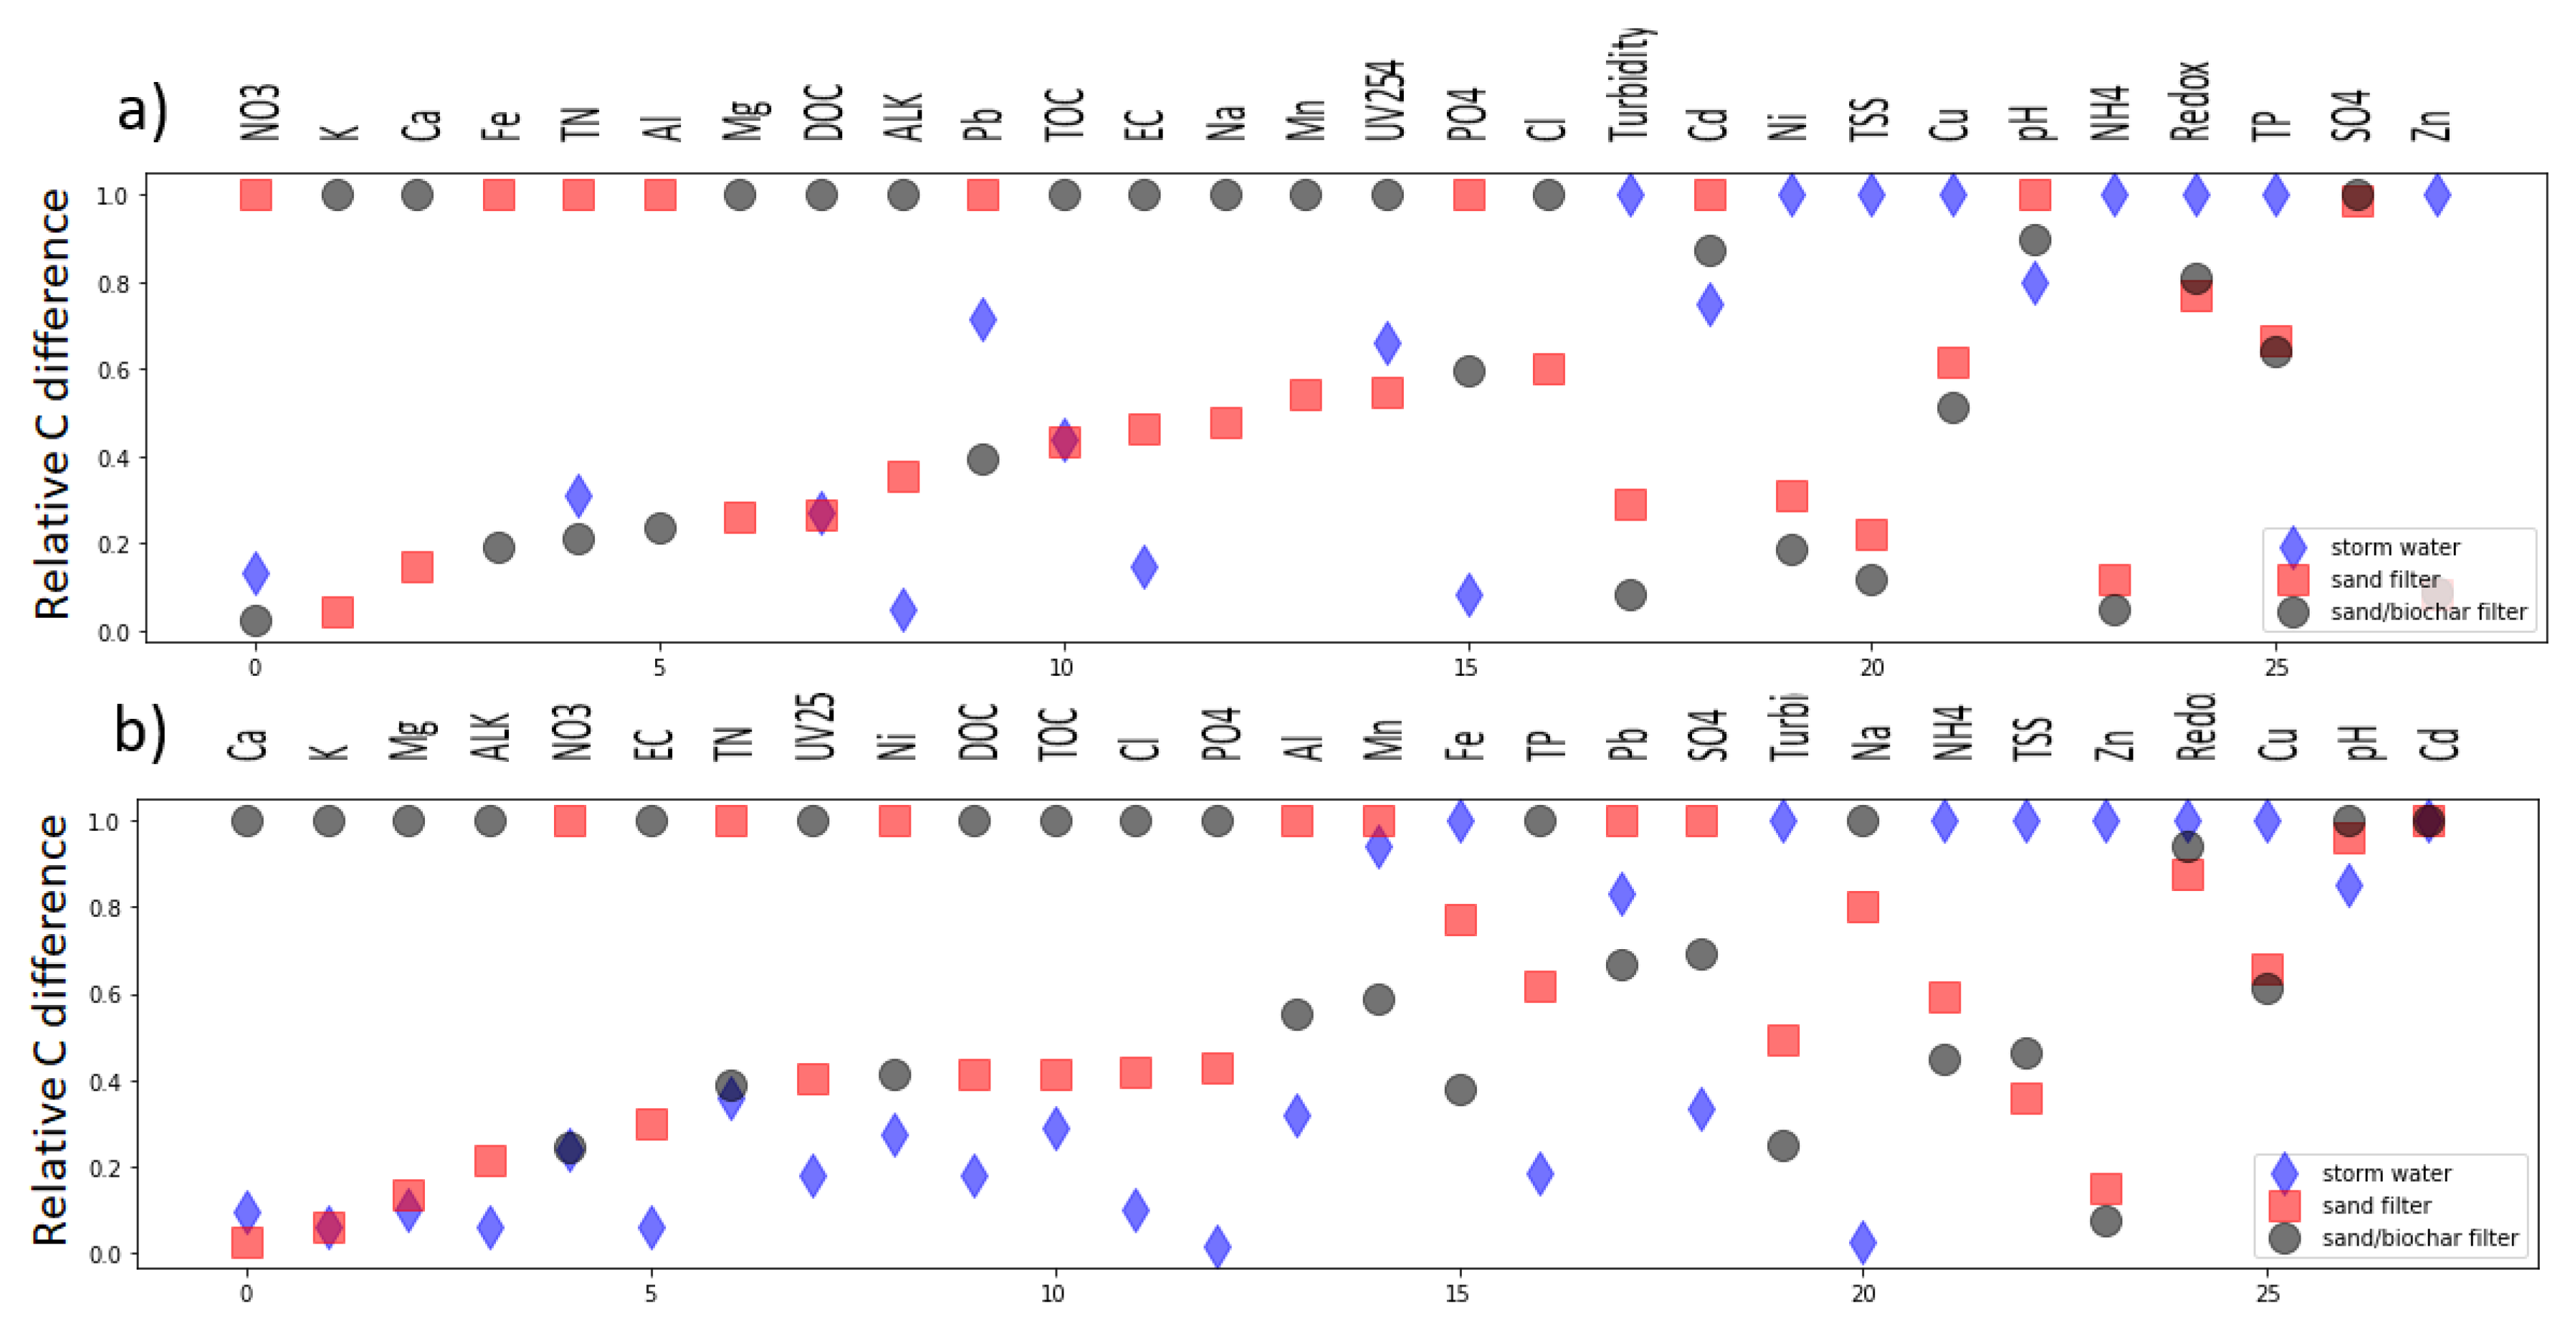
The scaled median concentrations for the sand and sand–biochar filters are separately presented for the data measured in 2017 and in 2019 in Figure 7. The comparison shows that the stormwater influent concentrations were higher than the effluent for only a few variables in both years, and that the influent concentrations in autumn 2019 were mostly lower than the concentrations of the filter effluents. The influent concentrations were higher than the effluent concentration for turbidity, TSS, and Zn for both years. The data of 2017 did not include all variables, but the available data (e.g., Figure 8) show that the influent water quality in the 2017 summer events was more polluted than that of the autumn events in 2019.
The relative concentrations of the sand and sand–biochar filters (Figure 7) showed a difference that was higher than 50% (98...53%) in 2017 in the following order of decreasing difference: NO3, K, Ca, Fe, TN, Al, Mg, DOC, alkalinity, Pb, TOC, and electric conductivity. For 2019, differences above 50% (97…57%) were detected for Ca, K, Mg, alkalinity, electric conductivity, TN, UV254, Ni, DOC, TOC, Cl, and PO4. The sand filter showed a clearly higher median concentration than the biochar filter for NO3, Fe, TN, Al, and Pb in 2017, but only for NO3, Ni, and TN in 2019. For a large number of variables in 2019, the median concentrations of the effluents became higher in the sand–biochar than those in the sand filter. When moving from 2017 to 2019, the largest changes in the filter effluent differences were seen for PO4, TP, Ni, and Mn. PO4 was at a higher level for the sand filter in 2017 but became higher for the sand–biochar filter in 2019. A large difference between the filters stayed generally the same from 2017 to 2019 for K, TOC, Mg, and Ca.
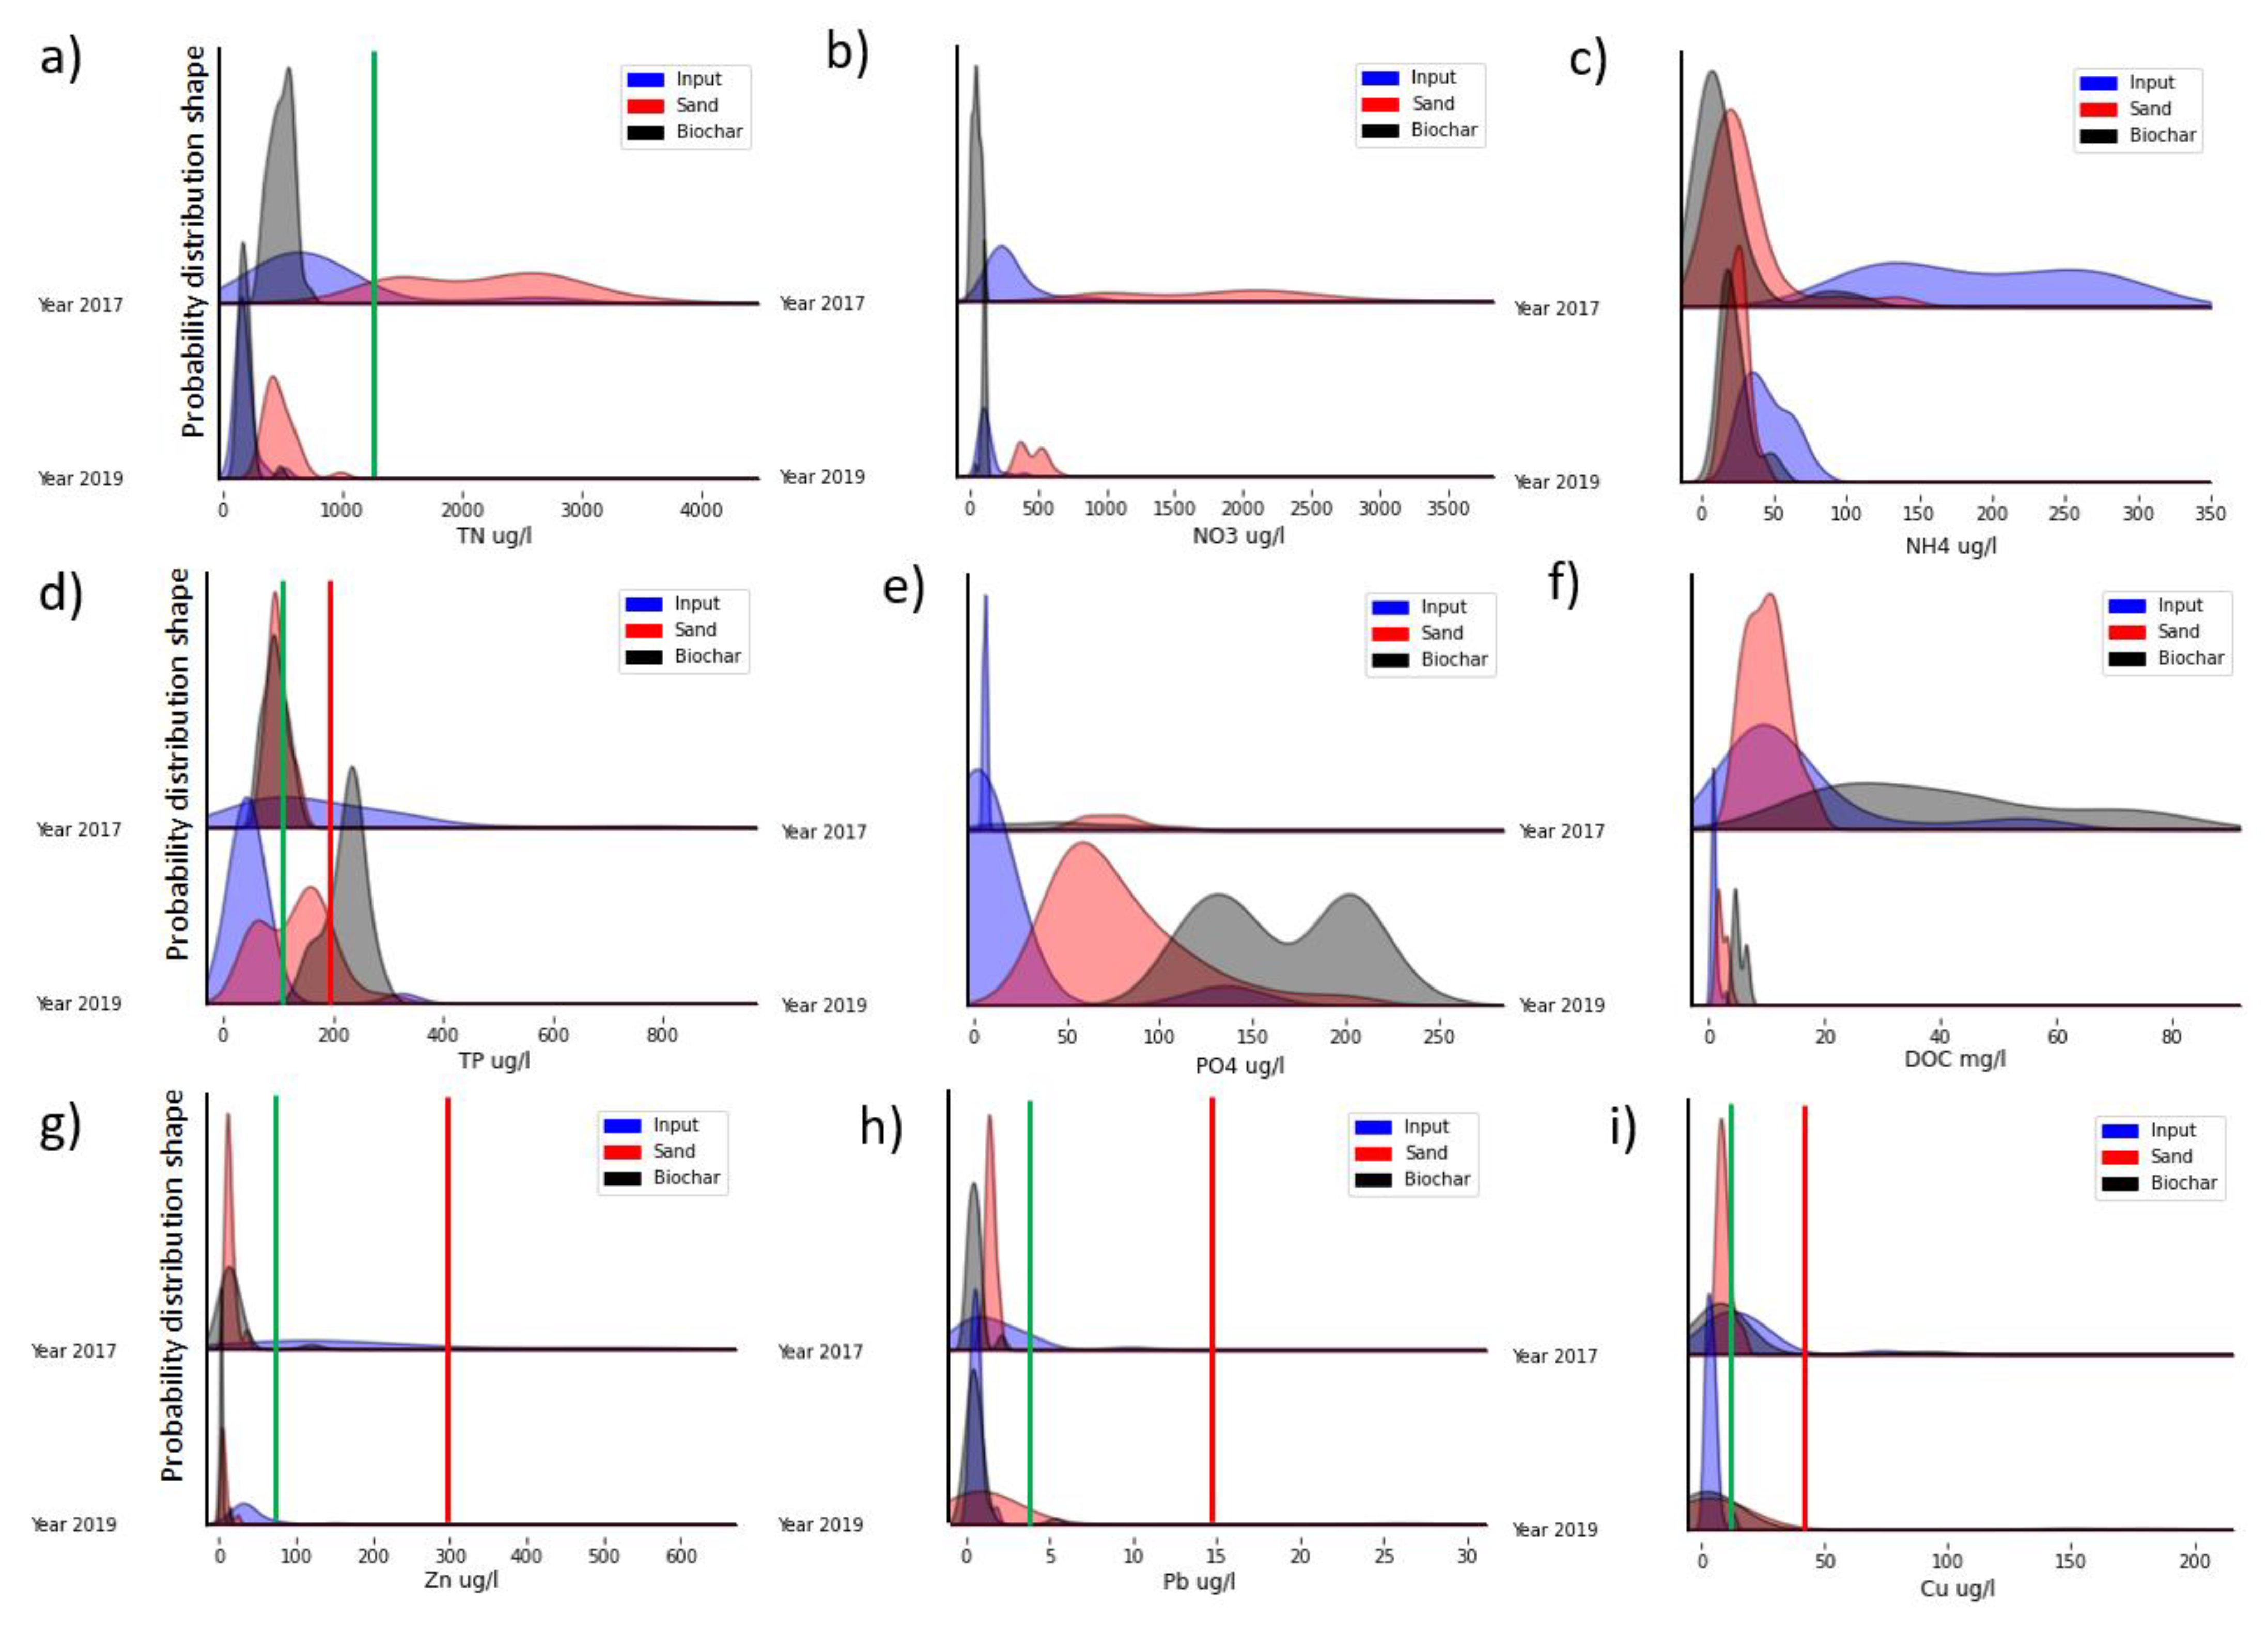
Figure 8 presents examples of the distributions of nutrients, DOC and selected metals for the years 2017 and 2019. The limits used by the Stockholm water authorities [45] are presented for the total nitrogen, phosphorous and metals Zn, Pb, and Cu. The distributions for the nitrogen concentration exhibited a sporadic behavior in the influent, with higher values in the 2017 summer events compared to the autumn 2019 events. The total N concentration for the sand filter exceeded the lower threshold marked in Figure 8a. The nitrogen concentration in the sand filter exceeded the concentration in the sand–biochar filter, but the difference decreased with time for the total N and NO3. The phosphorous concentrations partly overlapped between the filters, showing increased P concentrations in 2019 compared to 2017. When compared against the Stockholm water limits [45], the total P concentrations clearly exceeded the upper threshold for the biochar–sand filter in 2019. Both filters showed clearly higher DOC concentrations in 2017 compared to 2019, and the DOC levels were higher for the sand–biochar filter than for the sand filter. The concentrations of metals occasionally exceeded the lower threshold for Zn, Pb and Cu. The differences between the filters and between the years were not distinctive. The aggregated distributions of all studied variables for stormwater influent and the two filters are plotted as box plot distributions in Figure S1.
4. Discussion
The current results demonstrate that the filters had a strong influence on the surface runoff in terms of runoff detention, which increased with a decreasing event magnitude. The flattening shape of the IUH with peak discharge is characteristic of the hydrological response to excess rainfall that has been observed in catchments of different sizes [41]. The events with the highest peak discharge values showed high runoff coefficients, with the total discharge exceeding the event precipitation volume. The discharge during these events was influenced by the pre-event water stored in the filter. The flattening shape of the IUH with decreased peak discharge demonstrated how the detention in the filters mixed the rainfall waters and exhibited a long recession of small flows after the cessation of rainfall. The water balance of the filters over multiple events suggested a retention of water due to some evaporation and infiltration into the soil around the filters. The measurements over a period of 10 months demonstrated runoff coefficients in the order of 50%, revealing that a large share of water influx is evaporated or infiltrated. The biochar mix was expected to increase the water storage capacity of NWRM [19], but in Vantaa, the hydrological behavior of the two filters was similar, suggesting that the presence of biochar did not strongly influence the management of the stormwater quantity.
The increasing flashiness of the IUH with the event peak indicates how an increase in the drainage area and a corresponding increase in the stormwater inflow lead to a lower mean transit time and a shorter detention time in the filter. The filter-to-catchment area ratio was in the order of 0.34, which is large compared to the typical ratios, such as 0.001–0.29, which was reported for 29 biofilter solutions in Australia by [25]. A capture ratio of the studied filters, i.e., the contributing area divided by the NWRM area, was 2.9, causing filters to show a strong detention impact on road runoff.
Previous research has demonstrated filtration to be an efficient means to remove particle-bound heavy metals in stormwater [22,23,24]. In Tikkurilantie, the removal was the clearest for TSS, Zn, and Cu, but the removal efficiency did not reach as high levels as those reported in laboratory studies [14]. The reason was the highly variable concentration levels in the influent stormwater, which were mostly moderately low (Figure S1). Forced sorption experiments use higher and typically constant influent concentrations [14]. In addition, laboratory studies have standardized exposure times, whereas flow rates in real environments can be higher and thus the residence time is lower.
Stormwater filters have been widely reported to achieve the effective net removal of total P when phosphorous is primarily bound to particles [14,24,46]. Reactive filter materials reach moderate levels of dissolved PO4 removal [14], but the leaching of PO4 from the filters has been reported to be an issue in some cases [24]. For N, NH4 is typically retained, while the filters commonly act as a source of NO3 leaching [23,24]. The Tikkurilantie filters showed the consistent removal of NH4, but less so for total N and P. P leaching in 2019 reflected the presence of the biochar layer in one of the filters. Among the variables, the biochar’s impact on water quality was most clearly shown in P and PO4, as well as DOC and TOC. The filters showed clear differences in some of the alkali and earth metals, suggesting that the base sand material of the filters is likely heterogeneous. The filters were found to retain sediment and sediment-bound substances, even though the concentrations for most of the studied variables were higher in the filter discharge than in the stormwater influent. The properties of biochar and its performance in water treatment are affected by its production methods, such as the type of feedstock used and the pyrolysis temperature [16,33,47]. The biochar type in Tikkurilantie was characterized by the leaching of labile P and DOC [14]. Increases of K, Ca and Mg are to be expected, as these cations are leached from the biochar matrix as the mineral and entrained ash dissolves.
The water quality and quantity measurements from the Tikkurilantie were combined to discuss the pollutant load in the filtered water and to set the load to the context of the available studies conducted in northern urban areas [48,49,50]. The filter runoff from 2019–2020 was multiplied with the median concentration of the surveys in 2017 and 2019 for TP, TN, TSS, Cu, Pb and Zn, which are the variables prescribed with threshold concentrations in Swedish guidelines [45]. The comparison is summarized in Table 4, where the reference data were grouped to show the annual loads of the high-density (imperviousness >50%) and low-density (<20%) catchments for nutrients [48,49] and metals [48,50]. The range found in the developing area had been measured in a residential catchment, where the imperviousness increased from 2% to 37% during its development [49]. The influent loads to the filters were at the level of high-density urban areas in the 2017 data but dropped to the low-density range in 2019, reflecting the fact that these surveys were carried out during summer storms (2017) and the autumn rain period (2019). The retention of TSS and metals in both filters was effective and reduced the influent load, which was similar or higher than that reported for high-density urban areas. The TN load for the 2017 data was elevated in both filters. The sand filter TN load was comparable to load range reported for developing areas, reflecting the initially high potential of the TN load soon after filter construction. While the estimated TP load in the influent was higher for 2017 than 2019, the biochar effluent TP load increased from 2017 to 2019 and remained in a level comparable to high-density urban areas.
One question arises about the optimality of the Tikkurilantie filter location. The Tikkurilantie filters are located at a site in which the contributing area produces pollutant loads that are comparable to densely constructed urban areas, even though the road is not heavily used (Table 4). The traffic load of the road is in the order of 7600 vehicles per day, whereas roads with a density exceeding 30000 vehicles per day have been reported to have deleterious impacts upon the receiving surface water bodies [51]. The Tikkurilantie filters would be more suited to larger capture ratios, i.e., larger contributing areas, as the filter area is recommended to be in the order of 2–5% of the catchment [23]. However, the winter freezing conditions complicate the implementation of a high capture ratio because the surface runoff must be drained away from the road surface as quickly as possible, and the collection of road runoff from a larger road area should be performed outside of the traffic area.
Nature-based stormwater treatment systems should be designed in order to support repeated performance measurements by sampling, and preferably by flow gauging as well. The Tikkurilantie data from 2017 and 2019 demonstrated that the filter discharge quality and treatment performance, e.g., for nutrients, change with time. The mechanisms of these changes are not entirely known or well documented; therefore, repeated surveys are necessary to provide information regarding the life cycle and maintenance needs of the filters. Jeon et al. [46] gathered monitoring data from a roadside infiltration trench over a period of 8 years and they found that annual maintenance was needed in order to avoid a reduction in the infiltration capacity and treatment performance. It is evident that the filtration of stormwater at times of sustained runoff generation and limited source area concentration leads to the filters being rather a source than a sink for common water quality constituents. Care should be taken in the selection of filter materials, their composition and their long-term performance under variable environmental conditions [14].
5. Conclusions
The field surveys performed in order to assess the operational road runoff filters in the northern city of Vantaa demonstrated the clear impacts of filters on the detention and retention of storm runoff. The filters flattened the flashy response of storm runoff to rainfall, and the detention impact increased as the peak flow decreased. The biochar volume of ca. 30% in the filter did not have a clear influence on runoff control compared to the 100% sand filter. From a water quality point of view, the filters were able to remove most metals, sediments, and sediment-bound constituents, even though the performance of the filters was less efficient than expected based upon the results of pollutant retention experiments conducted under controlled conditions. The sand filter acted as a source of nutrient pollution, including of total N, NO3 and PO4. The observed impact of this particular birch biochar layer on the effluent water quality was a net increase in the organic carbon, K, Ca and Mg concentrations. In the last survey, the birch biochar filter exhibited an increase in phosphorous in the filter effluent relative to the influent concentrations.
The design of NBSs and NWRMs should support repeated measurement surveys of their performance in order to gather information regarding the success of these solutions across varying conditions. Lessons learned regarding the construction of nature-based filters for stormwater management include the need to carefully plan their installation at an optimal location in order to achieve the desired impact on stormwater pollutant loads, the need for the expert technical implementation of filters to mitigate the potential for water bypass flows, and the selection of suitable materials to limit pollutant load generation throughout the filter lifecycle. The preparation of NBS and NWRM stormwater filters that help conduct measurement surveys of influent and effluent waters is a desirable design aspect to consider, in order to increase the volume of empirical evidence regarding stormwater filter performance.
Supplementary Materials
The following supporting information can be downloaded at: https://www.mdpi.com/article/10.3390/w15081631/s1, Figure S1: The box plots of the stormflow influent, sand filter effluent, and sand–biochar filter effluent data. The green and red vertical lines refer to the lower and higher threshold of stormwater concentration in [45].
Author Contributions
Conceptualization, H.K., M.D., E.A., N.S. and T.K.; Data curation, H.K. and E.A.; Formal analysis, H.K.; Methodology, H.K., E.A. and T.K.; Resources, H.K.; Visualization, H.K.; Writing—original draft preparation, H.K.; Writing—review and editing, H.K., M.D., L.W., N.S. and T.K.; Project administration, H.K. and L.W.; Funding acquisition, H.K and L.W. All authors have read and agreed to the published version of the manuscript.
Funding
This research was funded by the Academy of Finland (326787), EU Water JPI-EviBAN project (Evidence-based assessment of NWRM for sustainable water management).
Institutional Review Board Statement
Not applicable.
Informed Consent Statement
Not applicable.
Data Availability Statement
The stormwater event quantity and quality dataset is deposited to Zenodo open access repository https://doi.org/10.5281/zenodo.7842839.
Acknowledgments
We acknowledge the experimental field work and measurement surveys performed by Andrew Said. We also thank Ambika Khadka and Ville Rinta-Hiiro for comments on the study settings.
Conflicts of Interest
The authors declare no conflict of interest.
References
- Kõiv-Vainik, M.; Kill, K.; Espenberg, M.; Uuemaa, E.; Teemusk, A.; Maddison, M.; Palta, M.M.; Török, L.; Mander, Ü.; Scholz, M.; et al. Urban stormwater retention capacity of nature-based solutions at different climatic conditions. Nat.-Based Solut. 2022, 2, 100038. [Google Scholar] [CrossRef]
- Fletcher, T.D.; Shuster, W.; Hunt, W.F.; Ashley, R.; Butler, D.; Arthur, S.; Trowsdale, S.; Barraud, S.; Semadeni-Davies, A.; Bertrand-Krajewski, J.-L.; et al. SUDS, LID, BMPs, WSUD and more—The evolution and application of terminology surrounding urban drainage. Urban Water J. 2015, 12, 525–542. [Google Scholar] [CrossRef]
- Guan, M.; Sillanpää, N.; Koivusalo, H. Modeling and assessment of hydrological changes in a developing urban catchment. Hydrol. Proc. 2015, 29, 2880–2894. [Google Scholar] [CrossRef]
- Marsalek, J.; Rochfort, Q.; Brownlee, B.; Mayer, T.; Servos, M. An exploratory study of urban runoff toxicity. Water Sci. Technol. 1999, 39, 33–39. [Google Scholar] [CrossRef]
- Müller, A.; Österlund, H.; Marsalek, J.; Viklander, M. The pollution conveyed by urban runoff: A review of sources. Sci. Total Environ. 2020, 709, 136125. [Google Scholar] [CrossRef]
- Pennino, M.J.; McDonald, R.I.; Jaffe, P.R. Watershed-scale impacts of stormwater green infrastructure on hydrology, nutrient fluxes, and combined sewer overflows in the mid-Atlantic region. Sci. Total Environ. 2016, 565, 1044–1053. [Google Scholar] [CrossRef]
- Bedan, E.S.; Clausen, J.C. Stormwater runoff quality and quantity from traditional and low impact development watersheds. J. Am. Water Resour. Assoc. 2009, 45, 998–1008. [Google Scholar] [CrossRef]
- Hopkins, K.G.; Loperfido, J.V.; Craig, L.S.; Noe, G.B.; Hogan, D.M. Comparison of sediment and nutrient export and runoff characteristics from watersheds with centralized versus distributed stormwater management. J. Environ. Manag. 2017, 203, 286–298. [Google Scholar] [CrossRef]
- Smith, J.S.; Winston, R.J.; Wituszynski, D.M.; Tirpak, R.A.; Boening-Ulman, K.M.; Martin, J.F. Effects of watershed-scale green infrastructure retrofits on urban stormwater quality: A paired watershed study to quantify nutrient and sediment removal. Ecol. Eng. 2023, 186, 106835. [Google Scholar] [CrossRef]
- Stagge, J.H.; Davis, A.P.; Jamil, E.; Kim, H. Performance of grass swales for improving water quality from highway runoff. Water Res. 2012, 46, 6731–6742. [Google Scholar] [CrossRef] [PubMed]
- Lähde, E.; Khadka, A.; Tahvonen, O.; Kokkonen, T. Can We Really Have It All?—Designing Multifunctionality with Sustainable Urban Drainage System Elements. Sustainability 2019, 11, 1854. [Google Scholar] [CrossRef]
- Shahzad, H.; Myers, B.; Boland, J.; Hewa, G.; Johnson, T. Stormwater runoff reduction benefits of distributed curbside infiltration devices in an urban catchment. Water Res. 2022, 215, 118273. [Google Scholar] [CrossRef]
- Kumar, S.; Guntu, R.K.; Agarwal, A.; Villuri, V.G.K.; Pasupuleti, S.; Kaushal, D.R.; Gosian, A.K.; Bronstert, A. Multi-objective optimization for stormwater management by green-roofs and infiltration trenches to reduce urban flooding in central Delhi. J. Hydrol. 2022, 606, 127455. [Google Scholar] [CrossRef]
- Wendling, L.; Loimula, K.; Korkealaakso, J.; Kuosa, H.; Iitti, H.; Holt, E. StormFilter Material Testing Summary Report—Performance of Stormwater Filtration Systems. Research Report VTT-R-05980-17. 2017. Available online: https://cris.vtt.fi/ws/files/20239863/VTT_R_05980_17.pdf (accessed on 6 March 2023).
- Li, C.; Widlak, R.; Zalewski, M. Stormwater Gravel-Peat Infiltration Filter—An Ecohydrological Technology with Good Urban Design. Ecohydrol. Hydrobiol. 2021, 21, 555–563. [Google Scholar] [CrossRef]
- Ouedraogo, A.S.; Fu, G.Y.; Yunus, A.I. Treatment of highway stormwater runoff using sustainable biochar: A review. J. Environ. Eng. 2023, 149, 03122005. [Google Scholar] [CrossRef]
- Biswal, B.K.; Vijayaraghavan, K.; Tsen-Tieng, D.L.; Balasubramanian, R. Biochar-based bioretention systems for removal of chemical and microbial pollutants from stormwater: A critical review. J. Hazard. Mater. 2022, 422, 126886. [Google Scholar] [CrossRef] [PubMed]
- Hussain, M.; Farooq, M.; Nawaz, A.; Al-Sadi, A.M.; Solaiman, Z.M.; Alghamdi, S.S.; Ammara, U.; Ok, Y.S.; Siddique, K.H.M. Biochar for crop production: Potential benefits and risks. J. Soils Sediments 2017, 17, 685–716. [Google Scholar] [CrossRef]
- Mai, Y.; Huang, G. Hydrology and rainfall runoff pollutant removal performance of biochar-amended bioretention facilities based on field-scale experiments in lateritic red soil regions. Sci. Total Environ. 2021, 761, 143252. [Google Scholar] [CrossRef]
- Tomczyk, A.; Sokołowska, Z.; Boguta, P. Biochar physicochemical properties: Pyrolysis temperature and feedstock kind effects. Rev. Environ. Sci. Biotechnol. 2020, 19, 191–215. [Google Scholar] [CrossRef]
- Blecken, G.-T.; Zinger, Y.; Deletić, A.; Fletcher, T.D.; Viklander, M. Influence of intermittent wetting and drying conditions on heavy metal removal by stormwater biofilters. Water Res. 2009, 43, 4590–4598. [Google Scholar] [CrossRef]
- Davis, A.P.; Shokouhian, M.; Sharma, H.; Minami, C.; Winogradoff, D. Water Quality Improvement through Bioretention: Lead, Copper, and Zinc Removal. Water Environ. Res. 2003, 75, 73–82. [Google Scholar] [CrossRef] [PubMed]
- Hatt, B.E.; Fletcher, T.D.; Deletic, A. Treatment Performance of Gravel Filter Media: Implications for Design and Application of Stormwater Infiltration Systems. Water Res. 2007, 41, 2513–2524. [Google Scholar] [CrossRef] [PubMed]
- Hatt, B.E.; Fletcher, T.D.; Deletic, A. Hydraulic and pollutant removal performance of fine media stormwater filtration systems. Environ. Sci. Technol. 2008, 42, 2535–2541. [Google Scholar] [CrossRef]
- Al-Ameri, M.; Hatt, B.; Le Coustumer, S.; Fletcher, T.; Payne, E.; Deletic, A. Accumulation of heavy metals in stormwater bioretention media: A field study of temporal and spatial variation. J. Hydrol. 2018, 567, 721–731. [Google Scholar] [CrossRef]
- Hatt, B.E.; Fletcher, T.D.; Deletic, A. Hydrologic and pollutant removal performance of stormwater biofiltration systems at the field scale. J. Hydrol. 2009, 365, 310–321. [Google Scholar] [CrossRef]
- Zhang, K.; Liu, Y.; Deletic, A.; McCarthy, D.T.; Hatt, B.E.; Payne, E.G.I.; Chandrasena, G.; Li, Y.; Pham, T.; Jamali, B.; et al. The impact of stormwater biofilter design and operational variables on nutrient removal-a statistical modelling approach. Water Res. 2021, 188, 116486. [Google Scholar] [CrossRef]
- Afrooz, A.N.; Boehm, A.B. Effects of submerged zone, media aging, and antecedent dry period on the performance of biochar-amended biofilters in removing fecal indicators and nutrients from natural stormwater. Ecol. Eng. 2017, 102, 320–330. [Google Scholar] [CrossRef]
- Li, Y.; Deletic, A.; McCarthy, D.T. Copper-zeolite integrated stormwater biofilter for nutrient removal–the impact of intermittent wetting and drying conditions. Blue-Green Syst. 2020, 2, 352–363. [Google Scholar] [CrossRef]
- Zhang, M.; Song, G.; Gelardi, D.L.; Huang, L.; Khan, E.; Mašek, O.; Parikh, S.J.; Ok, Y.S. Evaluating biochar and its modifications for the removal of ammonium, nitrate, and phosphate in water. Water Res. 2020, 186, 116303. [Google Scholar] [CrossRef]
- Segismundo, E.Q.; Kim, L.H.; Jeong, S.M.; Lee, B.S. A laboratory study on the filtration and clogging of the sand-bottom ash mixture for stormwater infiltration filter media. Water 2017, 9, 32. [Google Scholar] [CrossRef]
- Payne, E.G.; Pham, T.; Cook, P.L.; Fletcher, T.D.; Hatt, B.E.; Deletic, A. Biofilter design for effective nitrogen removal from stormwater–influence of plant species, inflow hydrology and use of a saturated zone. Water Sci. Technol. 2014, 69, 1312–1319. [Google Scholar] [CrossRef] [PubMed]
- Mukherjee, A.; Zimmerman, A.R. Organic carbon and nutrient release from a range of laboratory-produced biochars and biochar–soil mixtures. Geoderma. 2013, 193, 122–130. [Google Scholar] [CrossRef]
- Liao, W.; Drake, J.; Thomas, S.C. Biochar granulation, particle size, and vegetation effects on leachate water quality from a green roof substrate. J. Environ. Manage. 2022, 318, 115506. [Google Scholar] [CrossRef] [PubMed]
- Kuoppamäki, K.; Lehvävirta, S. Mitigating nutrient leaching from green roofs with biochar. Landsc. Urban Plan. 2016, 152, 39–48. [Google Scholar] [CrossRef]
- Rommel, S.H.; Stinshoff, P.; Helmreich, B. Sequential extraction of heavy metals from sorptive filter media and sediments trapped in stormwater quality improvement devices for road runoff. Sci. Total Environ. 2021, 782, 146875. [Google Scholar] [CrossRef]
- Kuoppamäki, K.; Hagner, M.; Valtanen, M.; Setälä, H. Using biochar to purify runoff in road verges of urbanised watersheds: A large-scale field lysimeter study. Watershed Ecol. Environ. 2019, 1, 15–25. [Google Scholar] [CrossRef]
- Jones, P.S.; Davis, A.P. Spatial accumulation and strength of affiliation of heavy metals in bioretention media. J. Environ. Eng. 2013, 139, 479–487. [Google Scholar] [CrossRef]
- Assmuth, E.; Sillanpää, N.; Wendling, L.; Koivusalo, H. Impact of Biochar on Treatment Performance of Roadside Sand Filters—Field Monitoring and Geochemical Modelling. In Proceedings of the New Trends in Urban Drainage Modelling, the 11th International Conference on Urban Drainage Modelling, UDM 2018, Palermo, Italy, 23–26 September 2018; pp. 79–84. [Google Scholar]
- Assmuth, E. Performance of Roadside Filtration Systems in the Treatment of Stormwater. Master’s Thesis, Aalto University School of Engineering, Espoo, Finland, 5 February 2018. Available online: https://aaltodoc.aalto.fi/handle/123456789/30076 (accessed on 11 January 2023).
- Kokkonen, T.; Koivusalo, H.; Karvonen, T.; Croke, B.; Jakeman, A. Exploring streamflow response to effective rainfall across event magnitude, temporal and spatial scales. Hydrol. Process. 2004, 18, 1467–1486. [Google Scholar] [CrossRef]
- Sillanpää, N.; Koivusalo, H. Urban development impacts on runoff event characteristics and unit hydrographs across warm and cold seasons in high latitudes. J. Hydrol. 2015, 521, 328–340. [Google Scholar] [CrossRef]
- Duan, Q.; Sorooshian, S.; Gupta, V. Effective and efficient global optimization for conceptual rainfall–runoff models. Water Resour. Res. 1992, 28, 1015–1031. [Google Scholar] [CrossRef]
- Westerlund, C.; Viklander, M.; Bäckström, M. Seasonal variations in road runoff quality in Luleå, Sweden. Water Sci. Technol. 2003, 48, 93–101. [Google Scholar] [CrossRef] [PubMed]
- Stockholm Vatten, A.B. Klassificering Av Dagvatten Och Recipienter Samt Riktlinjer För reningskrav- del 2, Dagvattenklassificering. 2001. Available online: https://www.stockholmvattenochavfall.se/globalassets/pdfer/rapporter/dagvatten/dagvattenklassificeringdel2.pdf (accessed on 11 January 2023). (In Swedish).
- Jeon, M.; Guerra, H.B.; Choi, H.; Kim, L.-H. Long-Term Monitoring of an Urban Stormwater Infiltration Trench in South Korea with Assessment Using the Analytic Hierarchy Process. Water 2022, 14, 3529. [Google Scholar] [CrossRef]
- Kaya, D.; Croft, K.; Pamuru, S.T.; Yuan, C.; Davis, A.P.; Kjellerup, B.V. Considerations for evaluating innovative stormwater treatment media for removal of dissolved contaminants of concern with focus on biochar. Chemosphere 2022, 307, 135753. [Google Scholar] [CrossRef]
- Valtanen, M.; Sillanpää, N.; Setälä, H. The effects of urbanization on runoff pollutant concentrations, loadings and their seasonal patterns under cold climate. Wat. Air Soil Poll. 2014, 225, 1977. [Google Scholar] [CrossRef]
- Sillanpää, N. Effects of Suburban Development on Runoff Generation and Water Quality. Doctoral Dissertation, Aalto University Publication Series, Espoo, Finland, 2013; p. 160. [Google Scholar]
- Taka, M.; Sillanpää, N.; Niemi, T.; Warsta, L.; Kokkonen, T.; Setälä, H. Heavy metals from heavy land use? Spatio-temporal patterns of urban runoff metal loads. Sci. Total Environ. 2022, 817, 152855. [Google Scholar] [CrossRef]
- Ellis, J.B.; Revitt, D.M.; Llewellyn, N. Transport and the environment: Effects of organic pollutants on water quality. Water Environ. J. 1997, 11, 170–177. [Google Scholar] [CrossRef]
Figure 1.
The location of Tikkurilantie filters in the city of Vantaa in Southern Finland (a) and the layout of the study site (b).
Figure 1.
The location of Tikkurilantie filters in the city of Vantaa in Southern Finland (a) and the layout of the study site (b).

Figure 2.
Cross-section of the sand and sand–biochar filter.

Figure 3.
Cumulative rainfall and cumulative discharge of the sand and sand–biochar filter during events 1–3 (a–c) in the 2017 surveys and events 4–6 (d–f) in the 2019 surveys. The maximum rainfall intensity (max rain) is also shown.
Figure 3.
Cumulative rainfall and cumulative discharge of the sand and sand–biochar filter during events 1–3 (a–c) in the 2017 surveys and events 4–6 (d–f) in the 2019 surveys. The maximum rainfall intensity (max rain) is also shown.

Figure 4.
Instantaneous unit hydrographs of events 1–3 in 2017 and events 4–6 in 2019 measured in sand (a) and sand–biochar (b) filters. The peak discharge (q) is the measured highest 10 min value during an event.
Figure 4.
Instantaneous unit hydrographs of events 1–3 in 2017 and events 4–6 in 2019 measured in sand (a) and sand–biochar (b) filters. The peak discharge (q) is the measured highest 10 min value during an event.

Figure 5.
Cumulative precipitation at the site, and runoff from the drainage areas of the two filters from 19 September 2019 to 15 July 2020.
Figure 5.
Cumulative precipitation at the site, and runoff from the drainage areas of the two filters from 19 September 2019 to 15 July 2020.

Figure 6.
The relative differences in the averaged event mean concentrations (EMC) for sand and sand–biochar filters (a), and the relative differences shown separately for peaky events 1 and 4 (high IUH) and for flat events 2,3,5, and 6 (low IUH) in sand and sand–biochar filters (b). The differences in the EMCs are ranked from the largest range in EMCs to the smallest.

Figure 7.
Relative median concentration (C) differences between stormwater influent, sand filter effluent, and sand–biochar filter effluent for 2017 data (a) and 2019 data (b). The relative concentration is the median concentration divided by the maximum concentration of the influent and effluent concentrations. The variables are ranked from the highest relative difference to the smallest relative difference between the two filter effluents.

Figure 8.
Distributions of TN (a), NO3 (b), NH4 (c), TP (d), PO4 (e), DOC (f), Zn (g), Pb (h), and Cu (i) for 2017 and 2018 in stormwater influent, sand filter effluent, and sand–biochar filter effluent. The green and red vertical lines refer to the Stockholm Water values [45] of the lower and upper thresholds, respectively.


Table 1.
The layers and material properties of the filters (modified from [40]).
Table 1.
The layers and material properties of the filters (modified from [40]).
| Depth from Surface [m] | Sand Filter | Sand–Biochar Filter |
|---|---|---|
| 0–0.2 | Sand 0.2–2 mm | Sand 0.2–2 mm |
| 0.2 | Filter fabric | |
| 0.2–0.5 | Sand 0.2–2 mm | Birch biochar |
| 0.5 | Filter fabric | |
| 0.5–0.8 | Sand 0.2–2 mm | Sand 0.2–2 mm |
| 0.8 | Filter fabric | Filter fabric |
| 0.8–1.25 | Gravel 8–16 mm | Gravel 8–16 mm |
| 1.25 | Bentonite mat | Bentonite mat |
| 1.25–1.4 | Sub-Base KaM 0–32 mm | Sub-Base KaM 0–32 mm |
Table 2.
The studied water quality variables. The total number of samples for survey A in 2017 (xa-ya-za) and survey B in 2019 (xb-yb-zb) are given in parentheses. Letters x, y, and z refer to the sand filter, sand–biochar filter, and stormwater influent, respectively. The analyses were conducted following Finnish Standards Association SFS-ISO methods.
| Variable (xa-ya-za, xb-yb-zb) | Variable (xa-ya-za, xb-yb-zb) |
|---|---|
| Total N (38-40-44, 30-30-25) | Cd (17-18-16, 30-30-25) |
| NH4 (26-36-16, 30-30-25) | Cu (17-18-16, 30-30-25) |
| NO3 (38-40-44, 30-30-25) | Pb (17-18-16, 30-30-25) |
| TP (38-40-44, 30-30-25) | Ni (17-18-16, 30-30-25) |
| PO4 (38-40-44, 30-30-25) | Zn (17-18-16, 30-30-25) |
| TOC (38-40-44, 30-30-25) | Mn (4-4-0, 30-30-25) |
| DOC (26-26-44, 30-30-25) | Si (4-4-0, 30-30-25) |
| Alkalinity (38-40-44, 30-30-25) | Fe (4-4-0, 30-30-25) |
| Electrical cond. (38-40-44, 30-30-25) | Ca (4-4-0, 30-30-25) |
| Turbidity (38-40-44, 30-30-25) | Mg (4-4-0, 30-30-25) |
| TSS (38-40-44, 20-20-20) | K (4-4-0, 30-30-25) |
| UV absorbance (38-40-44, 30-30-25) | Al (4-4-0, 30-30-25) |
| Redox pot. (38-40-44, 30-30-25) | Cl (4-4-0, 30-30-25) |
| SO4 (4-4-0, 30-30-25) | Na (4-4-0, 30-30-25) |
Table 3.
IUH model parameter values α and β and transit time tm (in hours) for the studied runoff events. The events are ordered based on the decreasing IUH peak value (see Figure 3).
Table 3.
IUH model parameter values α and β and transit time tm (in hours) for the studied runoff events. The events are ordered based on the decreasing IUH peak value (see Figure 3).
| Sand | Biochar | ||||||
|---|---|---|---|---|---|---|---|
| Event | α | β | tm (h) | Event | α | β | tm (h) |
| 1 | 2.68 | 0.53 | 1.43 | 4 | 2.65 | 0.55 | 1.47 |
| 6 | 1.51 | 1.78 | 2.68 | 1 | 1.59 | 0.92 | 1.47 |
| 4 | 1.74 | 1.58 | 2.75 | 5 | 3.00 | 0.88 | 2.64 |
| 2 | 2.46 | 1.52 | 3.73 | 6 | 2.29 | 1.47 | 3.37 |
| 5 | 1.88 | 2.19 | 4.13 | 2 | 1.90 | 2.49 | 4.73 |
| 3 | 1.69 | 7.42 | 12.56 | 3 | 1.33 | 11.39 | 15.21 |
Table 4.
Comparison of annual load estimates of total P (TP), total N (TN), TSS, Cu, Zn and Pb (mg/m2/a, g/m2/a for TSS) using median concentrations of the two surveys (2017 and 2019) and measured discharge from 2019–2020. The reference loads for nutrients [48,49] and metals [48,50] include ranges for high-density, low-density, and developing small urban catchments.
| Sand Filter | Biochar Filter | Influent | High Density | Low Density | Developing Area | |
| TP 2017 | 44 | 38 | 126 | 36–108 | 7–40 | 50–115 |
| TP 2019 | 66 | 96 | 38 | |||
| TN 2017 | 1046 | 200 | 620 | 230–1300 | 180–800 | 1400–6000 |
| TN 2019 | 205 | 71 | 140 | |||
| TSS 2017 | 13 | 6 | 113 | 22–58 | 2–17 | 41–72 |
| TSS 2019 | 4 | 5 | 24 | |||
| Cu 2017 | 4.1 | 3.1 | 12.7 | 2.8–14.5 | 0.9–2.7 | |
| Cu 2019 | 1.1 | 0.9 | 3.1 | |||
| Zn 2017 | 6 | 5 | 127 | 12–60 | 2–14 | |
| Zn 2019 | 2 | 1 | 30 | |||
| Pb 2017 | 0.6 | 0.2 | 0.9 | 0.4–2.4 | 0.1–0.5 | |
| Pb 2019 | 0.3 | 0.2 | 0.4 |
Disclaimer/Publisher’s Note: The statements, opinions and data contained in all publications are solely those of the individual author(s) and contributor(s) and not of MDPI and/or the editor(s). MDPI and/or the editor(s) disclaim responsibility for any injury to people or property resulting from any ideas, methods, instructions or products referred to in the content. |
© 2023 by the authors. Licensee MDPI, Basel, Switzerland. This article is an open access article distributed under the terms and conditions of the Creative Commons Attribution (CC BY) license (https://creativecommons.org/licenses/by/4.0/).
Share and Cite
MDPI and ACS Style
Koivusalo, H.; Dubovik, M.; Wendling, L.; Assmuth, E.; Sillanpää, N.; Kokkonen, T. Performance of Sand and Mixed Sand–Biochar Filters for Treatment of Road Runoff Quantity and Quality. Water 2023, 15, 1631. https://doi.org/10.3390/w15081631
AMA Style
Koivusalo H, Dubovik M, Wendling L, Assmuth E, Sillanpää N, Kokkonen T. Performance of Sand and Mixed Sand–Biochar Filters for Treatment of Road Runoff Quantity and Quality. Water. 2023; 15(8):1631. https://doi.org/10.3390/w15081631
Chicago/Turabian StyleKoivusalo, Harri, Maria Dubovik, Laura Wendling, Eero Assmuth, Nora Sillanpää, and Teemu Kokkonen. 2023. "Performance of Sand and Mixed Sand–Biochar Filters for Treatment of Road Runoff Quantity and Quality" Water 15, no. 8: 1631. https://doi.org/10.3390/w15081631
Note that from the first issue of 2016, this journal uses article numbers instead of page numbers. See further details here.