
Web-Based Platforms for Landslide Risk Mitigation: The State of the Art


1
Research Institute for Geo-Hydrological Protection (IRPI), Italian National Research Council (CNR), Corso Stati Uniti 4, 35127 Padova, Italy
2
Department of Information Engineering, University of Padova, 35131 Padova, Italy
*
Author to whom correspondence should be addressed.
Water 2023, 15(8), 1632; https://doi.org/10.3390/w15081632
Submission received: 10 March 2023
/
Revised: 14 April 2023
/
Accepted: 20 April 2023
/
Published: 21 April 2023
(This article belongs to the Section Hydrogeology)
Abstract
:Web-based platforms (WBPs) are online spaces where the user can interrogate and analyze data series gathered in quasi-real time from monitoring network/s. These online tools are increasingly used by government agencies, local authorities, contractors, and researchers for visualization, management, control, and analysis of monitoring data. In the risk mitigation framework, WBPs must incorporate specific tools and functions to be integral to non-structural mitigation activities. This is particularly important for the mitigation of landslide-related hazards, that sometimes are challenging to address with structural solutions. The state-of-the-art paper considers the evolution of WBPs for risk mitigation from a pioneering research topic of a decade ago to the current applications that are sometimes comprised within commercial packages. First, we describe what nowadays represents the WBP requirements regarding usability and data visualization for proper data communication. Next, tools for data management and solution regarding interoperability and data analysis are discussed. Lastly, considerations on data filtering in the context of alert and alarm triggering are presented. To be a reasonable alternative to structural mitigation works, non-structural solutions such as monitoring for alarm triggering or early warning must be dependable and stable. We have synthesized the fundamental requirements of monitoring networks devoted to risk mitigation with the expression “5 Rs”: robustness, redundancy, reliability, resilience, and responsiveness.
1. Introduction
In the past decade, web-based platforms (WBPs), which gather data from monitoring networks in order to present them online, have switched topic from a broad tool used in both academia and the private sector to a niche area of research [1].
A web-based platform, according to our definition, is an online space where the user can interrogate and analyze data series gathered in quasi-real time from monitoring network(s). Following this definition, web-based platforms differentiate by means of web-Geospatial Information Systems (GIS), since web-GIS are more focused on the geospatial information content associated with the data (either static or dynamic) rather than on the measurement data/quality of specific sensors in quasi-real time. In any case, the challenge is to collect and synthesize data in a standard format so that users, researchers, and stakeholders can readily access it via the Internet [2].
It cannot be stressed enough how the entirety of the evolution of web-based platforms has been possible because information and communication technology (ICT) has taken giant leaps in the last thirty years, as already pointed out in 2005 by Culshaw [3]) These improvements encompass storage and data management, analysis methods, computational power, and internet protocols [4]. However, the need for a proper framework to organize, analyze, and share data increases concurrently when the amount of information gathered increases [5,6] as might occur for complex monitoring systems. In fact, a fundamental feature of up-to-date web platforms is that they should be easily scalable, enabling the rapid addition of new sensors with different time bases and allowing for redundancy.
Most monitoring techniques have undergone continuous advancements in hardware and software platforms, improving the quality and significance of data collection, real-time processing, and user interfaces [7]. As the technical possibilities grow along with the production of lighter and cheaper instruments [8], the focus needs to be moved to data management. Large amounts of data need to be handled and interpreted appropriately, even considering the integration between remote sensing data (from unmanned aerial vehicles or satellites) and in situ measurements [9]. When implementing a new monitoring network, it is, therefore, necessary to provide the stakeholder with the tools to accurately manage data combined and derived from different instruments on the same site [10]. Nevertheless, making data available on interactive web systems is not just a matter of access. Yes, data may be easily consulted and seen everywhere, but may also be shared, compared, and analyzed with the tools implemented in the web platform [11]. Embedded algorithms can, for example, support identifying events or thresholds that can trigger an alert [12,13]. Collecting all data in a unique repository is also fundamental for the application of machine learning techniques [12] and for alert/alarm purposes.
Some private companies now offer web tools to retrieve, interrogate, and somewhat analyze data from state-of-the-art instruments, such as GeoMoS Now® by Leica [14] or T4D® by Trimble [15]. However, some of these systems are proprietary and cannot integrate sensors from other firms. This is usually not a problem for monitoring systems that rely only on topographic data, but becomes an issue when other monitoring sensors, such as piezometers and inclinometers, are integrated into the web platform. There is a specific need in the market, both in the public and the private sectors, for these tools. In fact, some private companies have recently developed a business specifically designing web-based platforms as ready-to-use products for monitoring purposes. Among them is Vista data Vision (https://vistadatavision.com (accessed on 17 March 2023)), which has been used for integrating remote sensing data with ground-based sensors [9], and the Geoguard web platforms by GReD (https://www.g-red.eu/geoguard/ (accessed on 17 March 2023)), which have been used to monitor landslides [16] and to assess the structural health of bridges [17].
2. Monitoring for Risk Mitigation, the 5 Rs, and Why Web Platforms Can Help
To mitigate landslide risk, two options should be considered: structural and non-structural mitigation measures [18]. Structural approaches have been widely used in the past because they allow for the management of landslide-related risk by acting directly on the hazard. However, these solutions are costly, impactful to the landscape, and subject to incremental damage due to aging. On the other hand, non-structural mitigation measures include policies such as relocations, trainings for the exposed population, and monitoring. The main aim of these measures is to reduce the risk without physically interfering with the hazardous process [19].
Non-structural measures have the advantage of, in general, minor impacts, as well as overall costs that are usually lower [20]. In the authors’ experience, a well-structured monitoring system for triggering alerts and alarms, maintained and updated for a decade, costs roughly a twentieth of the average structural mitigation solution in mortar and steel for a medium-sized landslide. Comprehensive cost–benefit analyses have been carried out for flood risk management regarding the effectiveness of structural vs. non-structural mitigation solutions. These studies concur that non-structural approaches are more cost-effective [21,22] Therefore, in purely economic terms, non-structural solutions are preferable in most conditions [23].
The downsides of non-structural mitigation measures are the continued necessity of maintenance and updating of the system, the dependence on the compliance of the exposed population, and the need for experts that can interpret the data and retrofit the alert mechanism [24]. Moreover, non-structural methods cannot protect immovable or exposed elements, such as buildings and infrastructure, from hazards. Still, they can support the assessment of the damage status of the monitored structure by integrating data from structural health monitoring systems [25].
In this context, monitoring systems specifically designed for landslide usually serve as proxies for risk reduction, either as non-structural mitigation systems for alert/alarm purposes or as tools to gather information and, thus, reduce uncertainty for the design of effective and efficient structural countermeasures. In both cases, it is likely that the landslide object is too large (contraindicating structural approaches due to extensiveness) and/or with a peculiar dynamic and/or several elements at risk, thus requiring a complex and extended monitoring network composed of different types of sensors [20].
For risk mitigation purposes, there are two main questions that need to be addressed through the analysis of time-series monitoring data: (i) the identification of the triggering factors that induce increased activity in the landslide, and, concurrently, (ii) distinguishing ordinary activity of the landslide from paroxysmal activity [26,27]. Both of these steps require reliable monitoring data with long-term acquisition. Long-term acquisition is fundamental for time-series analysis as it allows for the identification of sensors that better represent the dynamic of the investigated phenomena. In fact, it may be that not every sensor is placed in the right spot, especially for large-scale landslides. However, having all the data easily accessible on one platform allows for a more precise and rapid identification of the more informative sensors [28]. Moreover, long-term monitoring provides more chances to intercept extreme meteo-climatic events triggering paroxysmal activities of the landslide under investigation, which are highly informative from the point of view of whole hazard assessment [29].
Nevertheless, extracting data from monitoring is only the first part of the process. Data need to be safely stored, continuously checked, and made usable—otherwise they will only sit in a desk drawer (or in a computer file), inaccessible, useless, and forgotten. Risk mitigation monitoring networks should be, concurrently, robust, redundant, reliable, resilient, and responsive (the 5 Rs). In this framework, WBPs are an essential tool both for accessibility and for ensuring the 5 Rs.
With WBPs, data are collected, stored, and matched on a single server-side framework (physical or cloud-based) located outside the hazardous area, warranting robustness. As a result, data are not lost in case of a paroxysmal event or in the event of power supply failures.
WBPs ensure redundancy by integrating different types of sensors monitoring the same hazardous phenomenon. Reliability follows directly from redundancy, as comparing data from different data sources with user-guided or algorithm-based filtering of data allows local errors in the time series to be detected, notified, and, if needed, removed. The WBP should, in fact, allow the user to assess the goodness of the measure and how it compares with other time series.
Well-designed WBPs should also be resilient by automatically adapting if data from a monitoring device are lost, avoiding complex data management, and always allowing for high-quality data visualization.
Lastly, the WBP should be responsive in two ways: data-to-user and user-to-data. First of all, naturally, WBPs should provide an easy-to-use support system for decision makers to interact with a continuously updated and usable system. Tools for data analysis should be present. However, secondly, and of no lesser importance, the remote user interface should allow for regular maintenance of and direct access to the instruments for calibration and synchronization. It is, in fact, fundamental to include a tool that allows for the modification of the acquisition time of the sensors in the case of increased activity of the phenomenon of interest (i.e., due to adverse meteo-climatic conditions). This option should be implemented in order to be both manually and automatically activated in the function of imposed thresholds.
3. Usability and Data Visualization
Who will access our WBP? This is the first question that should be addressed while designing the platform’s homepage. Will stakeholders access the page? Will the exposed population do so? Will it be a working tool only for research and practitioners?
The website could be made accessible only to specific users and protected by passwords, or completely open, depending on the needs of the types of users. In any case, one should always remember that data (in particular, large amounts of data) are usually difficult to communicate and read to local authorities and the general public [30], especially when they carry an emotional dimension, as everything related to risk does. In this case, some data might be left open to the public with read-only access, while the entirety of the database and tools might be available only to registered users.
Some types of WBPs could be designed to allow data to be gathered using crowdsourcing tools [31]. However, the question of whether webpages open to the public should allow for simple interactive data analysis must be evaluated case by case as a function of the level of risk, the peculiar dynamic of the landslide, and possible legal impediments [32]. Farfetched “analysis” from non-experts could spread like fire on social media and cause alarm or even panic [33]. On the other hand, engaging those more exposed to risks related to the dynamics of the landslide process and allowing them to know and understand what is being accomplished through monitoring could generate secondary, but no less critical, risk mitigation in the form of risk awareness [34]. In addition, on this basis, situational awareness can be more easily achieved during a crisis [35], aiding in the overall disaster response and the recovery process.
In any case, whether the user group is composed of a tiny group of practitioners or the whole population, the first key target for a well-functioning WBP should be usability. Usability is one of web applications’ most important quality factors [36]. Following the ISO definition, “usability is the extent to which a product can be used by specified users to achieve specified goals with effectiveness, efficiency, and satisfaction in a specified context of use” (ISO 9241-11, 2018 [37]). WBPs should be targeted to be user-friendly and useful, helping users to work easily and efficiently with data. The fact that user interfaces are a form of communication in themselves [38] cannot be stressed enough. For this reason, WBPs should always be designed to work properly on mobile devices or, at least, to provide a user experience comparable to that offered by the standard website.
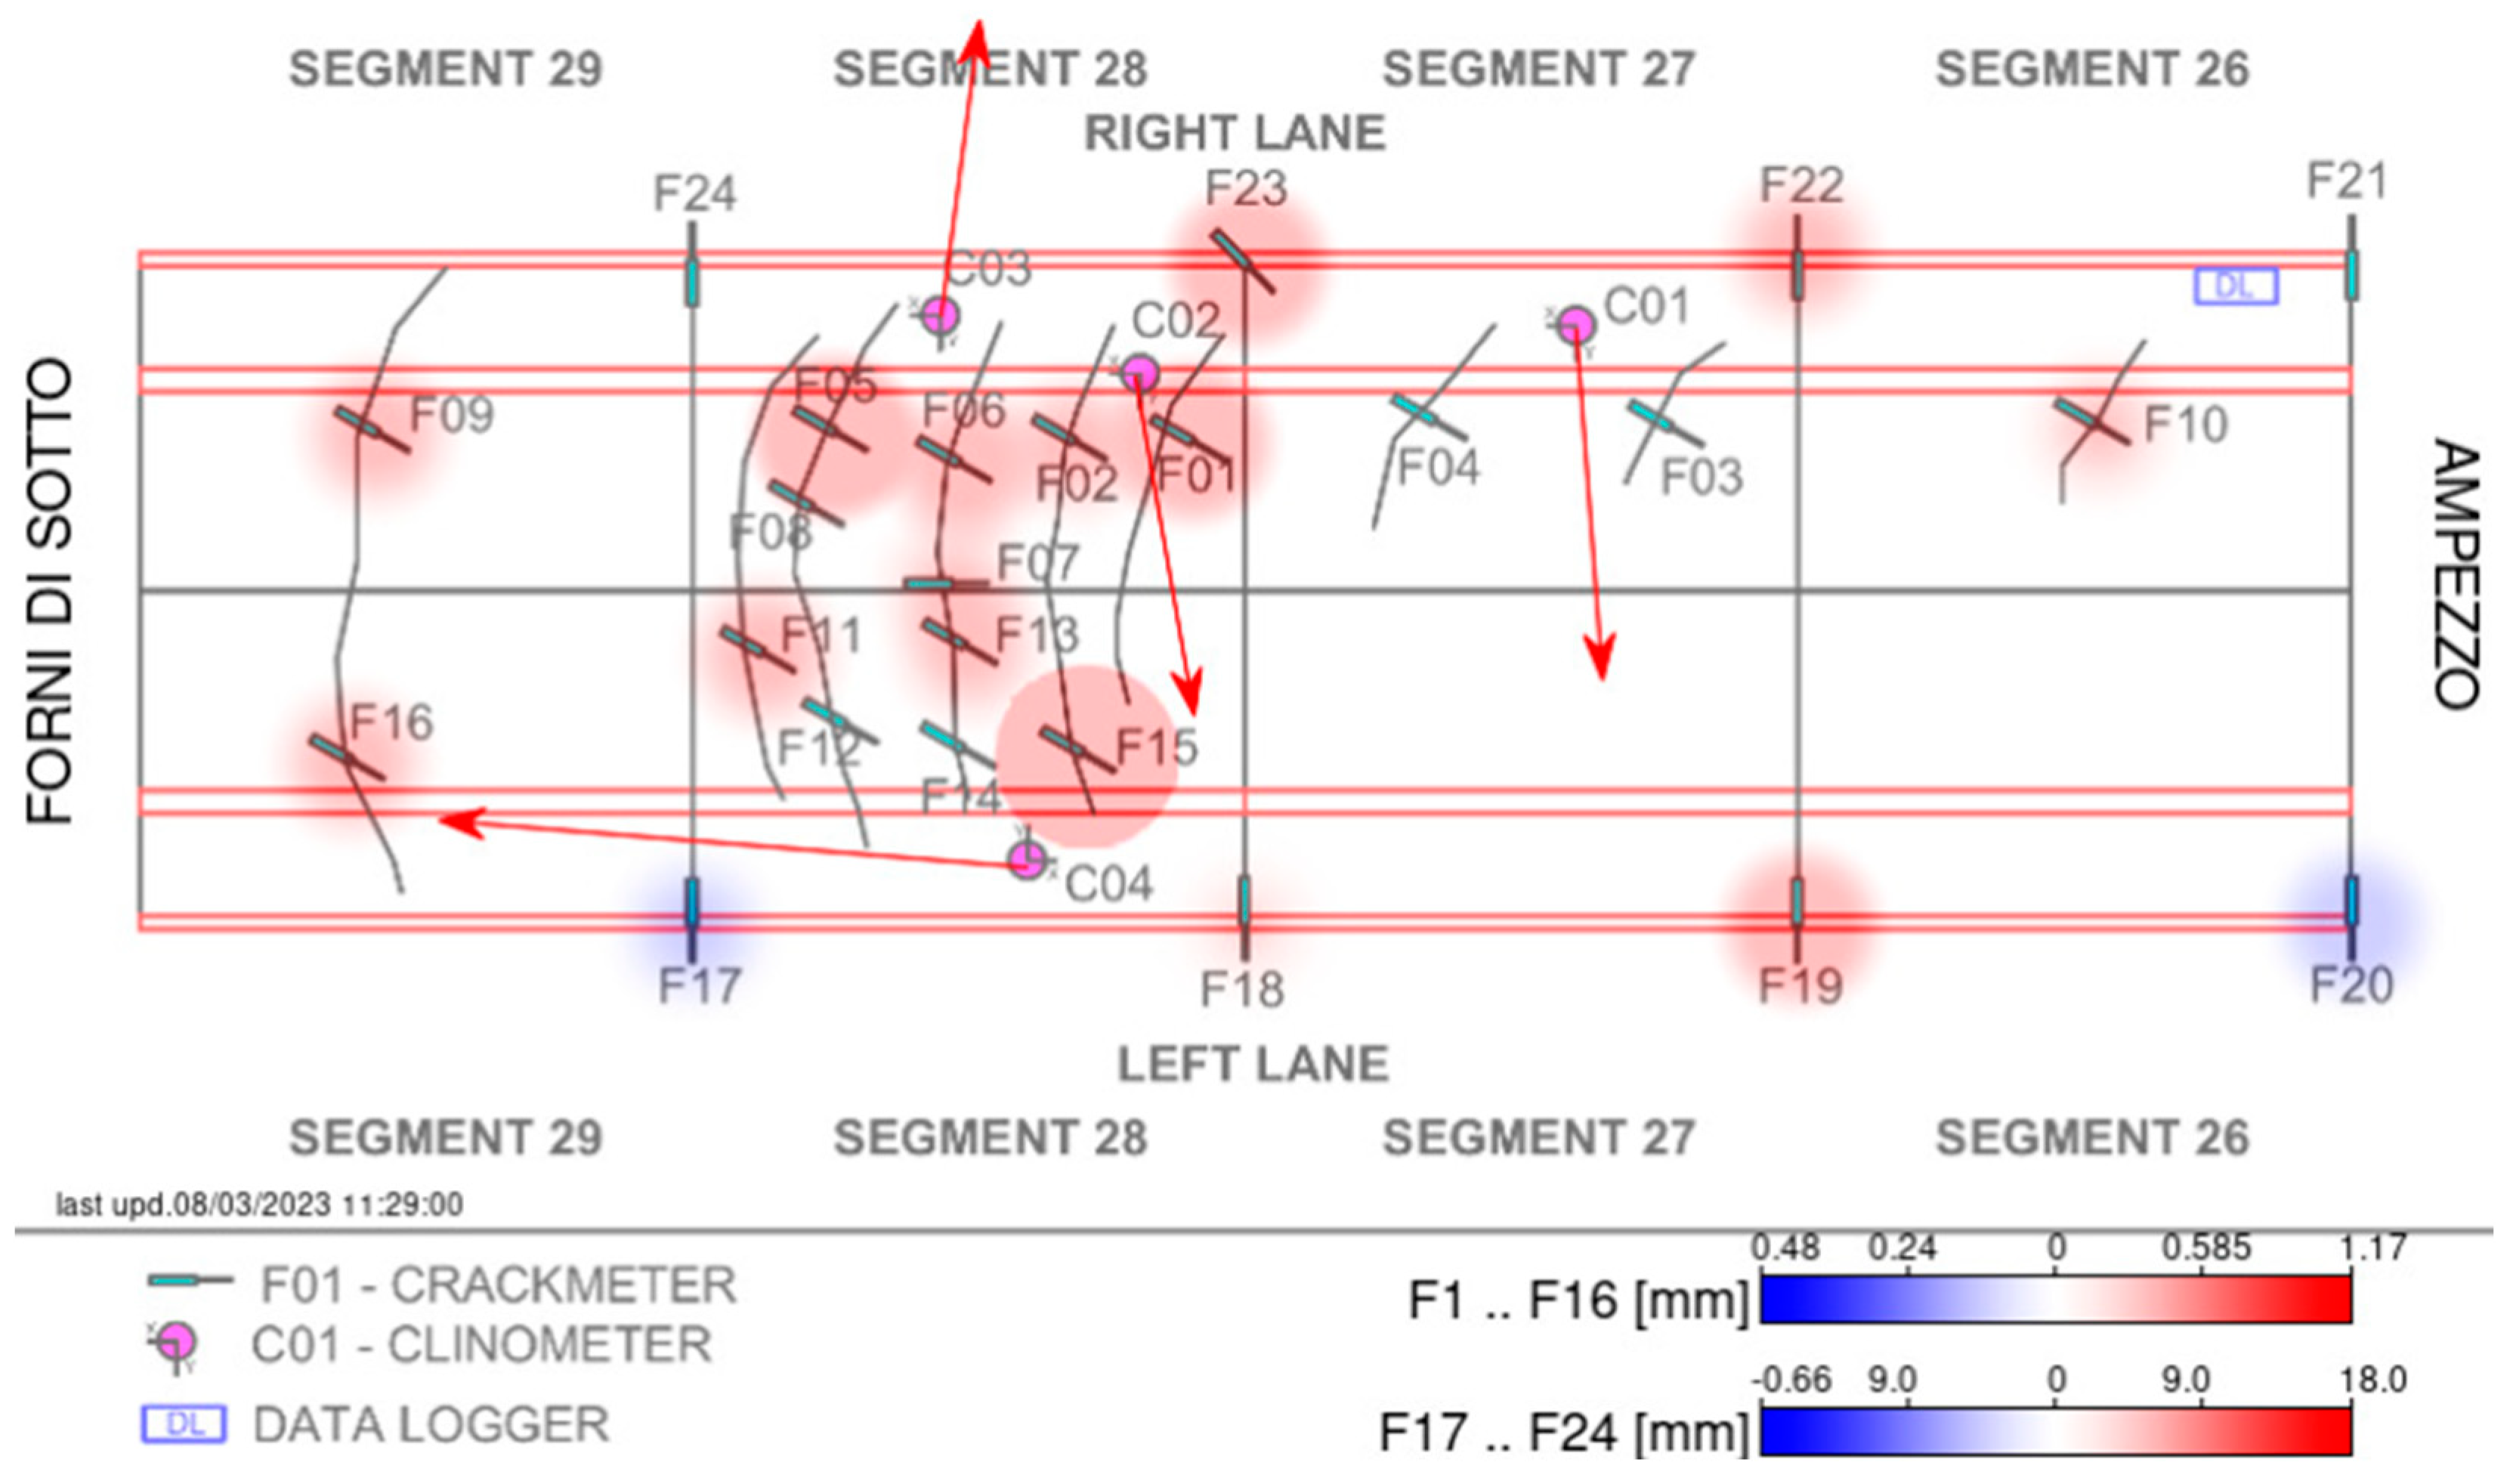
When monitoring a landslide or a structure subject to landslides, displacements are one of the main measured quantities. Graphs should be easy to read to improve usability, drawing from rooted communication codes [39]. For example, heat maps are a typology of auto-explicable graphs that highlight attention zones, usually with increasingly strong reddish colors while lesser quantities are indicated in more pastel tones [40]. One usage of this approach is shown in Figure 1, in which the entities of displacement, recorded in crackmeters, monitoring the damage within a tunnel subject to landslides are drawn in reddish colors for positive (crack opening) and in blue for negative quantities (crack closing). In any case, when choosing the color palette for heat maps and all other figures, colorblind friendliness should be assessed [41]. For example, if using the typical traffic light color palette to communicate hazards (green, no hazard/little hazard; yellow, medium hazard; red, high hazard), there are specific adjustments that need to be made in order to ensure proper communication with individuals affected by colorblindness [42].
Another feature that needs to be considered is synthesis, in addition to the fast communication of information through images [43]. On the web platform’s homepage, a small set of figures, or ideally just one, should be available that can summarize all the chief parameters and data to provide a gestaltic impression of the general state of the landslide and of the monitoring equipment. In general, data should be presented both in graphs and in zoomable maps, along with dynamic infographics that provide immediacy to the content and a significant communicative impact [44].
4. Data Management
We define data management as the incorporation, storage, organization, and preservation of the data generated and gathered by a web-based platform. The goal of the data management process, which combines several distinct tasks, is to guarantee that the data stored in the platform are reliable, accessible, and updated. Moreover, effective data management is essential to provide resiliency against changes in the scenario (e.g., needs for additional sensors, changes in the sampling period, failure of the sensors, etc.), and to support the decision-making process.
Data, in this sense, can be leveraged to improve additional survey initiatives, remediation operations, and life-saving measures, all with the aim of boosting the knowledge and the alert responsiveness. Yet, poor data management may cause the monitoring action to struggle with inconsistent datasets and data quality issues, which can make proper and reliable analysis difficult or, worse, provide inaccurate results.
Data processing, storage, and rules regarding the formatting and utilization of data in the platform are covered by different aspects comprising the entire data management process, for both operational and analytical data. We define the operational data as the data produced on a daily basis by the sensors and collected by the platform. On the contrary, the analytical data are the aggregated information to be digested and analyzed for the platform, which are used to make decisions.
The first stage should be designing the data architecture, especially when a significant amount of data is expected to be handled. This step includes an outline for data management and the deployment of the corresponding database. If needed, it may also include the deployment of additional data platforms, including specific solutions to fit particular applications (e.g., data platforms of proprietary sensor solutions). The most popular platforms for storing monitoring data are, of course, databases. A database includes a set of organized data that can be accessed, changed, and controlled. These are utilized for both operational and, more critically, analytical data. As a result, database administration is a crucial aspect of data management. When databases are set up, performance monitoring and tweaking must be performed to ensure acceptable response times to database queries that users execute in order to access the data stored within them.
At the same time, database administration is a crucial aspect of data management. When databases are set up, it is essential to monitor their performance. Further tuning may be needed to ensure adequate response times to database queries requesting to access the stored data stored. Additional administrative duties include applying software updates and security patches; database design, setup, installation, and updates; data security; and database backup and recovery. Additional aspects of data privacy and protection, such as the general data protection regulation (GDPR) [45], may be also considered.
The preferred technology used to deploy and maintain databases is the so-called database management system (DBMS). A DBMS is a piece of software that serves as an interface between the databases it manages and the database administrators (DBAs), end users, and applications that use them. File systems and cloud services are two alternatives to legacy databases that store data in ways other than the tabular relations used in relational databases. These solutions provide greater flexibility in terms of the types of data that may be stored and how the data are displayed. On the contrary, they are not well suited for managing complex operations on data.
Among the core data management functions, we have the data governance, which establishes policies and procedures to ensure data consistency; data quality management, which aims to fix data errors and inconsistencies; and master data management (MDM), which creates a common set of reference data on a variety of topics. Finally, we have the data modeling, which provides a description of the connections between data elements and the flow of data through the system; and data integration, which combines data from various data sources, for both operational and analytical purposes.
As per the operational data, with these functions, it should be possible to support custom requests, e.g., increasing sampling frequency during critical periods. Moreover, each instrument should have specific modules with sensors and loggers to fully implement a flexible data integration process. In this way, new instruments may be easily integrated into the platform when sensors become defective or damaged or when additional devices are deployed. In addition, the platform, at database level and in the analytical operation mode, should be integrated with specific routines capable of detecting malfunctioning sensors and triggering alerts to the platform manager via SMS, Telegram, or email.
The customizable and flexible structure of the platform can be considered a primary requirement in the management of the overall system.
5. Interoperability with Other Data Sources
Integrating data from different sources in the database requires an additional framework of software and routines to deal with the specific format of the data source. In the simplest scenario, it may be possible to rely on standard functions offered by specific software sensors. Unfortunately, however, in general, these routines represent an additional software layer on top of the DBMS.
Therefore, an operative WBP should be able to integrate heterogeneous data and services from several providers through separate application programming interfaces (API), which are software intermediaries that allow two applications to talk to each other. This structure is, per se, modular, and additional routines are to be integrated when new types of data sources are required to be added.
In this way, interactive maps from both commercial providers and open, meteorological data in quasi-real time, as well as several other data sources, could be added in order to multiplicate the platform’s capabilities and provide a holistic tool with all the information necessary for data analysis in a single location.
Effective interoperability relies on the proper documentation of the data to be integrated. For example, it may be necessary to know the structure of proprietary databases or storage solutions of sensors to properly extract and integrate the data in the platform database. Please note that this step may require some reverse engineering effort. A more reliable and efficient way of obtaining such information is by the metadata accompanying the data itself, but these are not usually provided or well-compiled.
6. Tools for Data Analysis, Interpretation, and Alarm/Alert Triggering
Continuous monitoring provides time-series data. WBPs showing time series are currently widely diffused, especially for meteo-climatic data. They usually rely on public libraries for data plotting, such as dygraphs (JavaScript) and D3 (either JavaScript or Python). However, most platforms do not allow users to interact with the data or perform any type of analysis.
For landslide-related studies, time-series analysis is fundamental for the identification of patterns of activity of a landslide and the recognition of triggering factors. Several techniques have been proposed to predict the temporal occurrence of landslides at the slope-scale [46,47] or to characterize the dynamics of a large-scale landslide [48]. In this paper, however, we do not address the pros and cons of different methods; instead, we focus on how a well-structured WBP could support data analysis, especially if performed by users who are not numerically inclined.
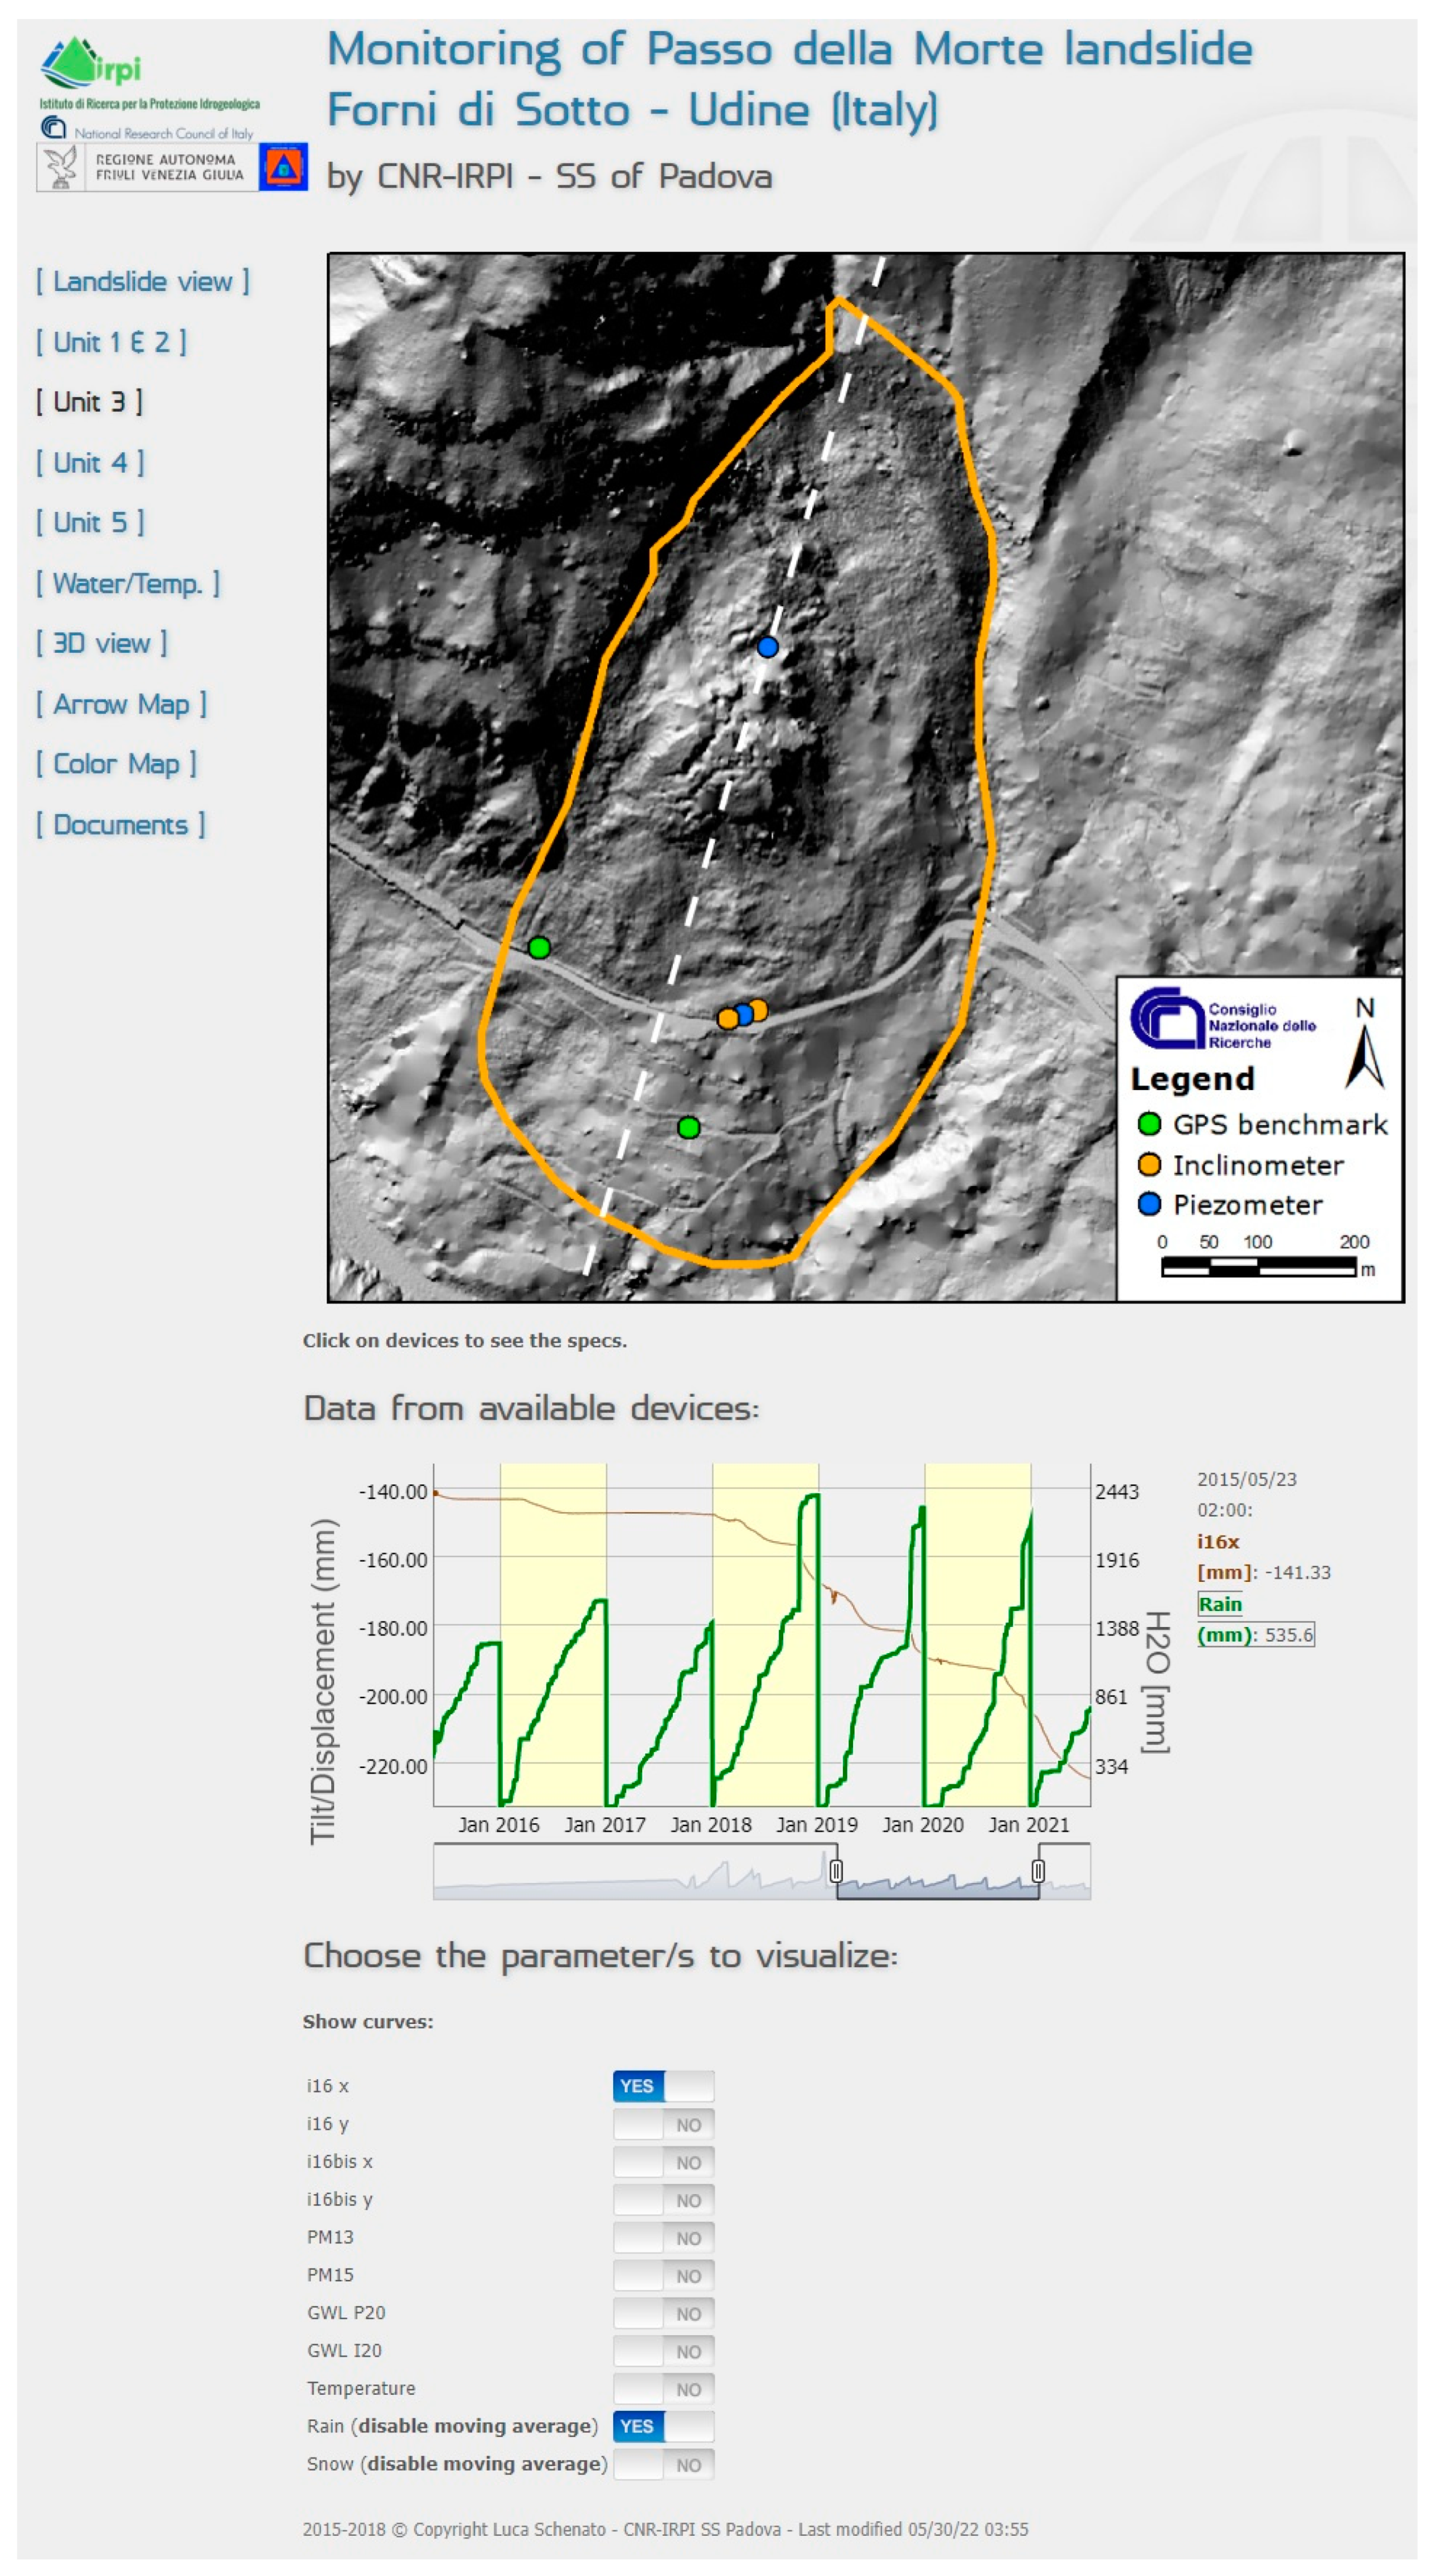
WBPs generally provide displacements (either superficial or along the slip surface) vs. time graphs. However, it is also essential to associate the displacement data with accumulated rainfall, temperature, and any other likely forcing element, to check, at first only visually, for correlations between signals (Figure 2). In fact, piezometers are usually present in monitoring systems for landslide mitigation (pore pressure transducers). Variations in the pore pressure and/or the water table might affect slope stability [49,50]. However, to detect the activity of a landslide of velocity class 1 to 4 [51], some kind of displacement measurement is required, at least in the first phases of the analysis, to calibrate a custom model that is based on the variations in the water table for the specifically investigated landslide [52,53]. This can also work using other variables, such as temperature [54] and water flow [55].
Another aspect that should be present is the possibility to select the time window of analysis in order to find data focused on intense meteo-climatic events and/or landslide accelerations. Concurrently, it might be useful to allow a simple linear regression analysis to be produced for the purpose of estimating the rate of displacements over time. This tool also helps, when data are affected by errors, to filter them in a simple and user-friendly way.
Data filtering can and should be implemented in the platform, but with some caution. Both filtered and unfiltered data should be available to the expert user, while some simplified and filtered versions can be left open to the general public. Unfiltered data might help to detect hardware malfunctions or to heuristically identify a pattern that was not accounted for while implementing the filtering algorithm. This could happen, for example, when setting a filter (or an alarm) that considers previous data in order to define a “standard mode” of the observed phenomenon, such as running average-based methods [53] or statistical methods [56,57,58], or methods based on the analysis of first or second-order derivatives [28,59,60]. For slow-moving landslides with plastic behavior, doing so could be reasonable. However, if some fragile, sudden deformation occurs, these data filtering methods could risk obliterating the signal despite its significance. It is, therefore, of the utmost importance that data filtering is constantly checked, informed, and calibrated, especially when data are used for alert/alarm triggering. This also applies, conversely, to numerical methods for addressing the issue of missing data through inference. If a decision is made to populate the dataset with simulated data, it should be clearly indicated in the graphical outputs of the WBP.
General alert/alarm triggering is an optional feature in a WBP, and a very delicate one, as it directly concerns public safety. It can be set up as a simple threshold overcoming calibration, for example, on the rate of displacement and cumulated rainfall, or it can be based on more complex algorithms. For site-specific monitoring systems, alert/alarm triggering usually requires a training period to understand the behavior of the landslide under different conditions and to define a dynamic model for the landslide [61,62]. Suppose a correlation is found and the hypothesis is tested and validated numerically. In that case, it is possible to include this model in the data management procedure alerts that signal the event that requires attention to a specific user group [63]. This could be performed by SMS, Telegram, email, or other messaging tools. In any case, from a programming point of view, the communication of the alert/alarm can be issued analogously with that of a malfunctioning sensor.
7. Conclusions
Web-based platforms (WBPs) are becoming fundamental tools for the non-structural mitigation of landslide-related risks. Non-structural mitigation measures will become more and more widespread as the technical capabilities of monitoring devices and their reliability improve and their costs gradually decrease. In fact, from a purely economic point of view, non-structural mitigation approaches are generally much cheaper than works of construction. However, the lack of confidence regarding their robustness and resilience has generally been an obstacle to implementing these kinds of “soft” mitigation solutions. This can be overcome through improving the quality of monitoring sensors and by integrating data in a well-designed WBP with proper data management, API integration, and analysis tools.
Lastly, WBPs can and should also be tools used to interface with the exposed population through specifically designed web pages. The use of the WBP can operate in two directions. Firstly, it can facilitate the collection of data through crowdsourcing, such as uploading images to demonstrate the activity of the landslide: for example, small clasts on the road. Secondly, by involving populations more vulnerable to the risks and educating them about the monitoring process, an additional, but equally important, risk reduction strategy can be created by raising risk awareness. Moreover, this can lead to improved situational awareness during a crisis, which can enhance the effectiveness of disaster response and recovery efforts.
Author Contributions
Conceptualization, G.B., L.S. and G.M.; writing—original draft preparation, G.B. and L.S.; writing—review and editing G.B., L.S. and G.M. All authors have read and agreed to the published version of the manuscript.
Funding
This research received no external funding.
Data Availability Statement
Not available.
Conflicts of Interest
The authors declare no conflict of interest.
References
- Frigerio, S.; Schenato, L.; Bossi, G.; Cavalli, M.; Mantovani, M.; Marcato, G.; Pasuto, A. A Web-Based Platform for Automatic and Continuous Landslide Monitoring: The Rotolon (Eastern Italian Alps) Case Study. Comput. Geosci. 2014, 63, 96–105. [Google Scholar] [CrossRef]
- Lan, H.X.; Martin, C.D.; Froese, C.R.; Kim, T.H.; Morgan, A.J.; Chao, D.; Chowdhury, S. A Web-Based GIS for Managing and Assessing Landslide Data for the Town of Peace River, Canada. Nat. Hazards Earth Syst. Sci. 2009, 9, 1433–1443. [Google Scholar] [CrossRef]
- Culshaw, M.G. From Concept towards Reality: Developing the Attributed 3D Geological Model of the Shallow Subsurface. Q. J. Eng. Geol. Hydrogeol. 2005, 38, 231–284. [Google Scholar] [CrossRef]
- Bernard, L.; Mäs, S.; Müller, M.; Henzen, C.; Brauner, J. Scientific Geodata Infrastructures: Challenges, Approaches and Directions. Int. J. Digit. Earth 2013, 7, 613–633. [Google Scholar] [CrossRef]
- Jaboyedoff, M.; Ornstein, P.; Rouiller, J.-D. Design of a Geodetic Database and Associated Tools for Monitoring Rock-Slope Movements: The Example of the Top of Randa Rockfall Scar. Nat. Hazards Earth Syst. Sci. 2004, 4, 187–196. [Google Scholar] [CrossRef]
- Malet, J.P.; Ulrich, P.; Déprez, A.; Masson, F.; Lissak, C.; Maquaire, O. Continuous Monitoring and Near-Real Time Processing of GPS Observations for Landslide Analysis: A Methodological Framework. In Landslide Science and Practice: Volume 2: Early Warning, Instrumentation and Monitoring; Springer: Berlin/Heidelberg, Germany, 2013; pp. 201–209. [Google Scholar]
- Liu, Q.; Lu, G.; Huang, J.; Bai, D. Development of Tunnel Intelligent Monitoring and Early Warning System Based on Micro-Service Architecture: The Case of AnPing Tunnel. Geomat. Nat. Hazards Risk 2020, 11, 1404–1425. [Google Scholar] [CrossRef]
- Baroň, I.; Supper, R. Application and Reliability of Techniques for Landslide Site Investigation, Monitoring and Early Warning—Outcomes from a Questionnaire Study. Nat. Hazards Earth Syst. Sci. 2013, 13, 3157–3168. [Google Scholar] [CrossRef]
- Guilhot, D.; del Hoyo, T.M.; Bartoli, A.; Ramakrishnan, P.; Leemans, G.; Houtepen, M.; Salzer, J.; Metzger, J.S.; Maknavicius, G. Internet-of-Things-Based Geotechnical Monitoring Boosted by Satellite InSAR Data. Remote Sens. 2021, 13, 2757. [Google Scholar] [CrossRef]
- Carri, A.; Valletta, A.; Cavalca, E.; Savi, R.; Segalini, A. Advantages of IoT-Based Geotechnical Monitoring Systems Integrating Automatic Procedures for Data Acquisition and Elaboration. Sensors 2021, 21, 2249. [Google Scholar] [CrossRef]
- Karunarathne, S.M.; Dray, M.; Popov, L.; Butler, M.; Pennington, C.; Angelopoulos, C.M. A Technological Framework for Data-Driven IoT Systems: Application on Landslide Monitoring. Comput. Commun. 2020, 154, 298–312. [Google Scholar] [CrossRef]
- Deng, L.; Smith, A.; Dixon, N.; Yuan, H. Machine Learning Prediction of Landslide Deformation Behaviour Using Acoustic Emission and Rainfall Measurements. Eng. Geol. 2021, 293, 106315. [Google Scholar] [CrossRef]
- Huang, J.; Huang, R.; Ju, N.; Xu, Q.; He, C. 3D WebGIS-Based Platform for Debris Flow Early Warning: A Case Study. Eng. Geol. 2015, 197, 57–66. [Google Scholar] [CrossRef]
- Bąk, M. The Use of Automatic Measurement Techniques in the Geotechnical Monitoring System of PGE GiEK S.A., KWB Turów Branch. Int. J. Coal Sci. Technol. 2022, 9, 1–12. [Google Scholar] [CrossRef]
- Wessels, S.; Dixon, R. Geotechnical Data Aggregation and Visualisation Supporting Informed Risk Management: The One-Stop Geotech Shop. In Proceedings of the Slope Stability 2020: 2020 International Symposium on Slope Stability in Open Pit Mining and Civil Engineering, Online, 12–14 May 2020; pp. 703–712. [Google Scholar] [CrossRef]
- Šegina, E.; Peternel, T.; Urbančič, T.; Realini, E.; Zupan, M.; Jež, J.; Caldera, S.; Gatti, A.; Tagliaferro, G.; Consoli, A.; et al. Monitoring Surface Displacement of a Deep-Seated Landslide by a Low-Cost and near Real-Time GNSS System. Remote Sens. 2020, 12, 3375. [Google Scholar] [CrossRef]
- Caldera, S.; Barindelli, S.; Sansò, F.; Pardi, L. Monitoring of Structures and Infrastructures by Low-Cost GNSS Receivers. Appl. Sci. 2022, 12, 12468. [Google Scholar] [CrossRef]
- Dai, F.C.; Lee, C.F.; Ngai, Y.Y. Landslide Risk Assessment and Management: An Overview. Eng. Geol. 2002, 64, 65–87. [Google Scholar] [CrossRef]
- Lei, Y.; Huang, J.; Cui, Y.; Jiang, S.-H.; Wu, S.; Ching, J. Time Capsule for Landslide Risk Assessment. Georisk Assess. Manag. Risk Eng. Syst. Geohazards 2023, 1–22. [Google Scholar] [CrossRef]
- Popescu, M.E.; Sasahara, K. Engineering Measures for Landslide Disaster Mitigation. Landslides-Disaster Risk Reduct. 2009, 609–631. [Google Scholar] [CrossRef]
- Son, C.H.; Baek, J.I.; Ban, Y.U.; Ha, S.R. The Effects of Mitigation Measures on Flood Damage Prevention in Korea. Sustainability 2015, 7, 16866–16884. [Google Scholar] [CrossRef]
- Schröter, K.; Ostrowski, M.; Velasco, C.; Torres, D.S.; Nachtnebel, H.P.; Kahl, B.; Beyene, M.; Rubin, C.; Gocht, M. First Crue Era-Net Common Call Effectiveness and Efficiency of Non-Structural Flood Risk Management Measures; Bundesministerium für bildung und Forschung, Minsterio de educación y ciencia, Darmstadt University of Technology-IHWP, Universitat Politècnica de Catalunya-GRAHI-UPC, University of Natural Resources and Applied Life Science (BOKU), Pro Aqua-Water & Finance: London, UK, 2009. [Google Scholar]
- Lacasse, S.; Kalsnes, B.; Vaciago, G.; Choi, Y.J.; Lam, A. A Web-Based Tool for Ranking Landslide Mitigation Measures. In Proceedings of the 18th International Conference on Soil Mechanics and Geotechnical Engineering: Challenges and Innovations in Geotechnics, ICSMGE, Paris, France, 2–6 September 2013; Volume 3. [Google Scholar]
- Vaciago, G. The SafeLand Compendium of Landslide Risk Mitigation Measures. Landslide Sci. Pract. Risk Assess. Manag. Mitig. 2013, 6, 683–689. [Google Scholar]
- Bossi, G.; Schenato, L.; Marcato, G. Structural Health Monitoring of a Road Tunnel Intersecting a Large and Active Landslide. Appl. Sci. 2017, 7, 1271. [Google Scholar] [CrossRef]
- Barla, M.; Antolini, F. An Integrated Methodology for Landslides’ Early Warning Systems. Landslides 2016, 13, 215–228. [Google Scholar] [CrossRef]
- Pecoraro, G.; Calvello, M.; Piciullo, L. Monitoring Strategies for Local Landslide Early Warning Systems. Landslides 2019, 16, 213–231. [Google Scholar] [CrossRef]
- Fujisawa, K.; Marcato, G.; Nomura, Y.; Pasuto, A. Management of a Typhoon-Induced Landslide in Otomura (Japan). Geomorphology 2010, 124, 150–156. [Google Scholar] [CrossRef]
- Federico, A.; Popescu, M.; Elia, G.; Fidelibus, C.; Internò, G.; Murianni, A. Prediction of Time to Slope Failure: A General Framework. Environ. Earth Sci. 2012, 66, 245–256. [Google Scholar] [CrossRef]
- Giordan, D.; Wrzesniak, A.; Allasia, P. The Importance of a Dedicated Monitoring Solution and Communication Strategy for an Effective Management of Complex Active Landslides in Urbanized Areas. Sustainability 2019, 11, 946. [Google Scholar] [CrossRef]
- Ekker, R.; Kværne, K.; Os, A.; Humstad, T.; Wartiainen, A.; Eide, V.; Hansen, R.K. RegObs-Public Database for Submitting and Sharing Observations. In Proceedings of the Proceeding the International Snow Science Workshop, Grenoble-Chamonix Mont-Blanc, France, 7–11 October 2013. [Google Scholar]
- Piovesan, F.; Di Torino, P. Beyond Standards and Regulations: Obstacles to Local Open Government Data Initiatives in Italy and France. Soc. Dyn. Open Data 2017, 35. [Google Scholar] [CrossRef]
- Bustillos Ardaya, A.; Evers, M.; Ribbe, L. What Influences Disaster Risk Perception? Intervention Measures, Flood and Landslide Risk Perception of the Population Living in Flood Risk Areas in Rio de Janeiro State, Brazil. Int. J. Disaster Risk Reduct. 2017, 25, 227–237. [Google Scholar] [CrossRef]
- Krgli, I.K.; Devoli, G.; Colleuille, H.; Boje, S.; Sund, M.; Engen, I.K. The Norwegian Forecasting and Warning Service for Rainfall- and Snowmelt-Induced Landslides. Nat. Hazards Earth Syst. Sci. 2018, 18, 1427–1450. [Google Scholar] [CrossRef]
- Harrison, S.E.; Johnson, P.A. Crowdsourcing the Disaster Management Cycle. Int. J. Inf. Syst. Crisis Response Manag. 2016, 8, 17–40. [Google Scholar] [CrossRef]
- Offutt, J. Quality Attributes of Web Software Applications. IEEE Softw. 2002, 19, 25–32. [Google Scholar] [CrossRef]
- ISO 9241-11:2018-Ergonomics of Human-System Interaction—Part 11: Usability: Definitions and Concepts. Available online: https://www.iso.org/standard/63500.html (accessed on 17 March 2023).
- McKay, E. UI Is Communication; Elsevier Inc.: Amsterdam, The Netherlands, 2013; ISBN 9780123969804. [Google Scholar]
- Berger, C.R.; Roloff, M.E.; Ewoldsen, D.R. The Handbook of Communication Science, 2nd ed.; Sage Publications: Thousand Oaks, CA, USA, 2010; pp. 1–575. [Google Scholar]
- MacEachren, A.M. How Maps Work: Representation, Visualization, and Design; Guilford Press: New York, NY, USA, 1995; p. 513. [Google Scholar]
- Michailidou, E.; Eraslan, S.; Yesilada, Y.; Harper, S. Automated Prediction of Visual Complexity of Web Pages: Tools and Evaluations. Int. J. Hum. Comput. Stud. 2021, 145, 102523. [Google Scholar] [CrossRef]
- Engeset, R.V.; Pfuhl, G.; Orten, C.; Hendrikx, J.; Hetland, A. Colours and Maps for Communicating Natural Hazards to Users with and without Colour Vision Deficiency. Int. J. Disaster Risk Reduct. 2022, 76, 103034. [Google Scholar] [CrossRef]
- Reinecke, K.; Yeh, T.; Miratrix, L.; Mardiko, R.; Zhao, Y.; Liu, J.; Gajos, K.Z. Predicting Users’ First Impressions of Website Aesthetics with a Quantification of Perceived Visual Complexity and Colorfulness. In Conference on Human Factors in Computing Systems—Proceedings; Guilford Press: New York, NY, USA, 2013; pp. 2049–2058. [Google Scholar] [CrossRef]
- Iadanza, C.; Trigila, A.; Starace, P.; Dragoni, A.; Biondo, T.; Roccisano, M. IdroGEO: A Collaborative Web Mapping Application Based on REST API Services and Open Data on Landslides and Floods in Italy. ISPRS Int. J. Geo-Inf. 2021, 10, 89. [Google Scholar] [CrossRef]
- Murphy, J.F.A. The General Data Protection Regulation (GDPR). Ir. Med. J. 2018, 111, 747. [Google Scholar] [PubMed]
- Tehrani, F.S.; Calvello, M.; Liu, Z.; Zhang, L.; Lacasse, S. Machine Learning and Landslide Studies: Recent Advances and Applications. Nat. Hazards 2022, 114, 1197–1245. [Google Scholar] [CrossRef]
- Intrieri, E.; Carlà, T.; Gigli, G. Forecasting the Time of Failure of Landslides at Slope-Scale: A Literature Review. Earth Sci. Rev. 2019, 193, 333–349. [Google Scholar] [CrossRef]
- Titti, G.; Mantovani, M.; Bossi, G. Detecting Change of Patterns in Landslide Displacements Using Machine Learning, an Example Application. Underst. Reducing Landslide Disaster Risk 2021, 6, 215–221. [Google Scholar] [CrossRef]
- Di, B.; Stamatopoulos, C.A.; Stamatopoulos, A.C.; Liu, E.; Balla, L. Proposal, Application and Partial Validation of a Simplified Expression Evaluating the Stability of Sandy Slopes under Rainfall Conditions. Geomorphology 2021, 395, 107966. [Google Scholar] [CrossRef]
- Zhang, L.L.; Zhang, J.; Zhang, L.M.; Tang, W.H. Stability Analysis of Rainfall-Induced Slope Failure: A Review. Proc. Inst. Civ. Eng.-Geotech. Eng. 2015, 164, 299–316. [Google Scholar] [CrossRef]
- Hungr, O.; Leroueil, S.; Picarelli, L. The Varnes Classification of Landslide Types, an Update. Landslides 2014, 11, 167–194. [Google Scholar] [CrossRef]
- Davies, O.; Rouainia, M.; Glendinning, S.; Cash, M.; Trento, V. Investigation of a Pore Pressure Driven Slope Failure Using a Coupled Hydro-Mechanical Model. Eng. Geol. 2014, 178, 70–81. [Google Scholar] [CrossRef]
- Macciotta, R.; Hendry, M.; Martin, C.D. Developing an Early Warning System for a Very Slow Landslide Based on Displacement Monitoring. Nat. Hazards 2016, 81, 887–907. [Google Scholar] [CrossRef]
- Ma, J.; Tang, H.; Hu, X.; Bobet, A.; Yong, R.; Ez Eldin, M.A.M. Model Testing of the Spatial–Temporal Evolution of a Landslide Failure. Bull. Eng. Geol. Environ. 2017, 76, 323–339. [Google Scholar] [CrossRef]
- Catelan, F.T.; Bossi, G.; Marcato, G. Self-Sustaining Landslide Mitigation Strategy through Long-Term Monitoring. Water 2022, 14, 3824. [Google Scholar] [CrossRef]
- Rodriguez, J.; Deane, E.; Hendry, M.T.; Macciotta, R.; Evans, T.; Gräpel, C.; Skirrow, R. Practical Evaluation of Single-Frequency DGNSS for Monitoring Slow-Moving Landslides. Landslides 2021, 18, 3671–3684. [Google Scholar]
- Yang, W.; Wang, Y.; Wang, Y.; Ma, C.; Ma, Y. Retrospective Deformation of the Baige Landslide Using Optical Remote Sensing Images. Landslides 2020, 17, 659–668. [Google Scholar] [CrossRef]
- Cai, J.; Liu, G.; Jia, H.; Zhang, B.; Wu, R.; Fu, Y.; Xiang, W.; Mao, W.; Wang, X.; Zhang, R. A New Algorithm for Landslide Dynamic Monitoring with High Temporal Resolution by Kalman Filter Integration of Multiplatform Time-Series InSAR Processing. Int. J. Appl. Earth Obs. Geoinf. 2022, 110, 102812. [Google Scholar] [CrossRef]
- Su, Y.; Fu, J.; Duan, G. Landslide Displacement Prediction Based on Multivariate LSTM Model. Int. J. Environ. Res. Public Health 2023, 20, 1167. [Google Scholar] [CrossRef]
- Xu, Q.; Peng, D.; Zhang, S.; Zhu, X.; He, C.; Qi, X.; Zhao, K.; Xiu, D.; Ju, N. Successful Implementations of a Real-Time and Intelligent Early Warning System for Loess Landslides on the Heifangtai Terrace, China. Eng. Geol. 2020, 278, 105817. [Google Scholar] [CrossRef]
- Bossi, G.; Marcato, G. Planning Landslide Countermeasure Works through Long Term Monitoring and Grey Box Modelling. Geosciences 2019, 9, 185. [Google Scholar] [CrossRef]
- Springman, S.M.; Thielen, A.; Kienzler, P.; Friedel, S. A Long-Term Field Study for the Investigation of Rainfall-Induced Landslides. Geotechnique 2013, 63, 1177. [Google Scholar] [CrossRef]
- Smarsly, K.; Georgieva, K.; König, M. An Internet-Enabled Wireless Multi-Sensor System for Continuous Monitoring of Landslide Processes. IACSIT Int. J. Eng. Technol. 2014, 6, 520. [Google Scholar] [CrossRef]
Figure 1.
A screenshot of WBP, developed by the authors for the Italian National Road Authority (A.N.A.S.). It concerns the structural health monitoring system for a tunnel damaged by a landslide [25]. Ampezzo and Forni di Sotto are two municipalities in northeast Italy. The figure shows positive displacements in red and negative displacements in blue, recorded in crackmeters. The arrows show the vector components from another type of sensor, clinometers. In a single image, all the instruments installed in this tunnel segment are shown together to provide a full impression of the status of the structure.

Figure 2.
A screenshot of WBP, developed by the authors for a monitoring site in Northern Italy (Passo della Morte, Forni di Sotto, UD). Graphics are interactive and allow for the superimposition of different data from different sensors and for the graph time window to be defined dynamically. On this page, for example, both cumulated rain and snow cover can be associated with data from in-place inclinometers and/or piezometers.

Disclaimer/Publisher’s Note: The statements, opinions and data contained in all publications are solely those of the individual author(s) and contributor(s) and not of MDPI and/or the editor(s). MDPI and/or the editor(s) disclaim responsibility for any injury to people or property resulting from any ideas, methods, instructions or products referred to in the content. |
© 2023 by the authors. Licensee MDPI, Basel, Switzerland. This article is an open access article distributed under the terms and conditions of the Creative Commons Attribution (CC BY) license (https://creativecommons.org/licenses/by/4.0/).
Share and Cite
MDPI and ACS Style
Bossi, G.; Schenato, L.; Marcato, G. Web-Based Platforms for Landslide Risk Mitigation: The State of the Art. Water 2023, 15, 1632. https://doi.org/10.3390/w15081632
AMA Style
Bossi G, Schenato L, Marcato G. Web-Based Platforms for Landslide Risk Mitigation: The State of the Art. Water. 2023; 15(8):1632. https://doi.org/10.3390/w15081632
Chicago/Turabian StyleBossi, Giulia, Luca Schenato, and Gianluca Marcato. 2023. "Web-Based Platforms for Landslide Risk Mitigation: The State of the Art" Water 15, no. 8: 1632. https://doi.org/10.3390/w15081632
Note that from the first issue of 2016, this journal uses article numbers instead of page numbers. See further details here.