
Hydrochemical Characteristics of Groundwater and Their Significance in Arid Inland Hydrology


1
College of Water Sciences, Beijing Normal University, Beijing 100875, China
2
Dang River Water Resources Management Bureau, Jiuquan 735000, China
3
School of Water Resources and Environment, China University of Geosciences, Beijing 100083, China
*
Author to whom correspondence should be addressed.
Water 2023, 15(9), 1641; https://doi.org/10.3390/w15091641
Submission received: 16 February 2023
/
Revised: 8 March 2023
/
Accepted: 16 March 2023
/
Published: 23 April 2023
Abstract
:Phreatic groundwater hydrochemistry is important for sustainable water utilization and ecological stability in arid regions. Based on the test data from collected water samples, this study explored the phreatic groundwater recharge, hydrochemical evolution, and quality of the Sugan Lake Basin using hydrogeochemical, isotopic, and multivariate statistical analyses. The stable isotopic results showed that the phreatic groundwater in the alluvial fan, plain, and wetland areas of the basin generally originated from modern water, and the phreatic groundwater in the piedmont was mainly recharged by paleowater under low-temperature conditions. Carbonate is the dominant mineral in the regional rock weathering process. Phreatic groundwater in the piedmont is controlled by mineral dissolution and cation exchange; however, phreatic groundwater in other areas of the basin is significantly affected by river infiltration. This indicates that the hydrochemical regime of phreatic groundwater is sensitive to natural river flow without disturbing human activity. Class I–V groundwater samples accounted for 2.86%, 25.71%, 34.29%, 14.29%, and 22.86%, respectively. Total dissolved solids, total hardness, sulfate, chloride, nitrite, Na, Fe, Hg, and Cr VI are important factors that determine groundwater quality. This study deepens the understanding of phreatic groundwater hydrochemical characteristics and hydrologic cycles in the Sugan Lake Basin and provides background values of hydrochemistry without human interference for further study in arid inland basins.
1. Introduction
Water resources in arid regions are of great concern because of their scarcity and increasing importance for domestic, agricultural, and industrial use [1,2,3]. Groundwater and surface water in arid and semi-arid regions play key roles in maintaining fragile riparian [4,5], oases [6], and aquatic ecosystems [7]. The hydrochemical characteristics of the regional groundwater provide evidence to explain its sources, flows, and regimes. However, the chemical composition of groundwater is easily affected by utilization activities such as irrigation [8], water diversion canals [9], and pumping in multilayer wells [10]. Therefore, it is crucial to analyze the influence of control mechanisms such as human activities, climate, and geochemistry [11,12,13] on hydrochemistry. The study of hydrochemistry can help us understand the groundwater cycle and provide a basis for water quality evaluation, sustainable utilization, and ecological protection.
Over the past few decades, numerous studies on the hydrochemistry of arid basins have been conducted worldwide [14,15], such as the Murray Basin in Australia [16], Salar de Atacama Basin in Chile [17], and Michigan Basin in the US [18]. Furthermore, some research on groundwater hydrochemistry has been performed in northwest China, such as the catchments of the Shule River [19], the Manas River [20], and the Shiyang River [8], which helped with water supply, mining, and ecological restoration. Nevertheless, most of the focus areas were located in regions with intensive human activities. Basins without human interference are usually located in harsh climates and resource-poor regions, with scarce survey data and literature. In Northwest China, water facilities in arid basins have been extensively constructed. They have changed the surface water–groundwater interactions and the hydrochemistry of groundwater for a long time [21,22]. Thus, background values of groundwater hydrochemistry in an undisturbed basin are very sparse. Uncertainty remains regarding the influences of natural and anthropogenic factors on groundwater hydrochemistry. It leads to an insufficient comprehension about the hydrochemical regime of groundwater and limits the understanding of the “ecological water requirement” [23,24].
The Sugan Lake Basin is a typical arid closed basin in northwest China that is adjacent to the economic and cultural center of the Belt and Road initiative. The basin faces the prospect of exploiting water resources to meet water demand for economic development. Therefore, several hydrogeological surveys have been conducted in the Sugan Lake Basin to explore the distribution and quality of the water resources [25]. In addition to the stratigraphic data revealed by exploration boreholes [26], the hydrochemical and stable isotopic data of the groundwater and surface water were recorded. Yang et al. used a numerical simulation method to preliminarily explore the groundwater cycle of the Sugan Lake Basin [25]. Xiang et al. conducted an analysis of common indicators in the groundwater of the Sugan Lake Basin [27] but lacked a comprehensive study on the recharge sources and evolution process. An integrated approach using graphic methods, ion ratio coefficients, multivariate analysis, and stable isotopes is typically applied in research on groundwater recharge, regional hydrochemical regimes, and their control mechanisms. The applicability of these methods for hydrochemical studies in arid inland basins has been widely verified [28,29,30].
The objectives of this study are to (1) confirm the sources of groundwater recharge, (2) identify the hydrochemical characteristics and their significance in arid land hydrology, and (3) evaluate groundwater quality and make recommendations for future water resource utilization. This study contributes to further research on surface water-groundwater interactions. Moreover, this study provides a reference for the study of other arid inland basins where water resources have not been extensively developed.
2. Materials and Methods
2.1. Study Area
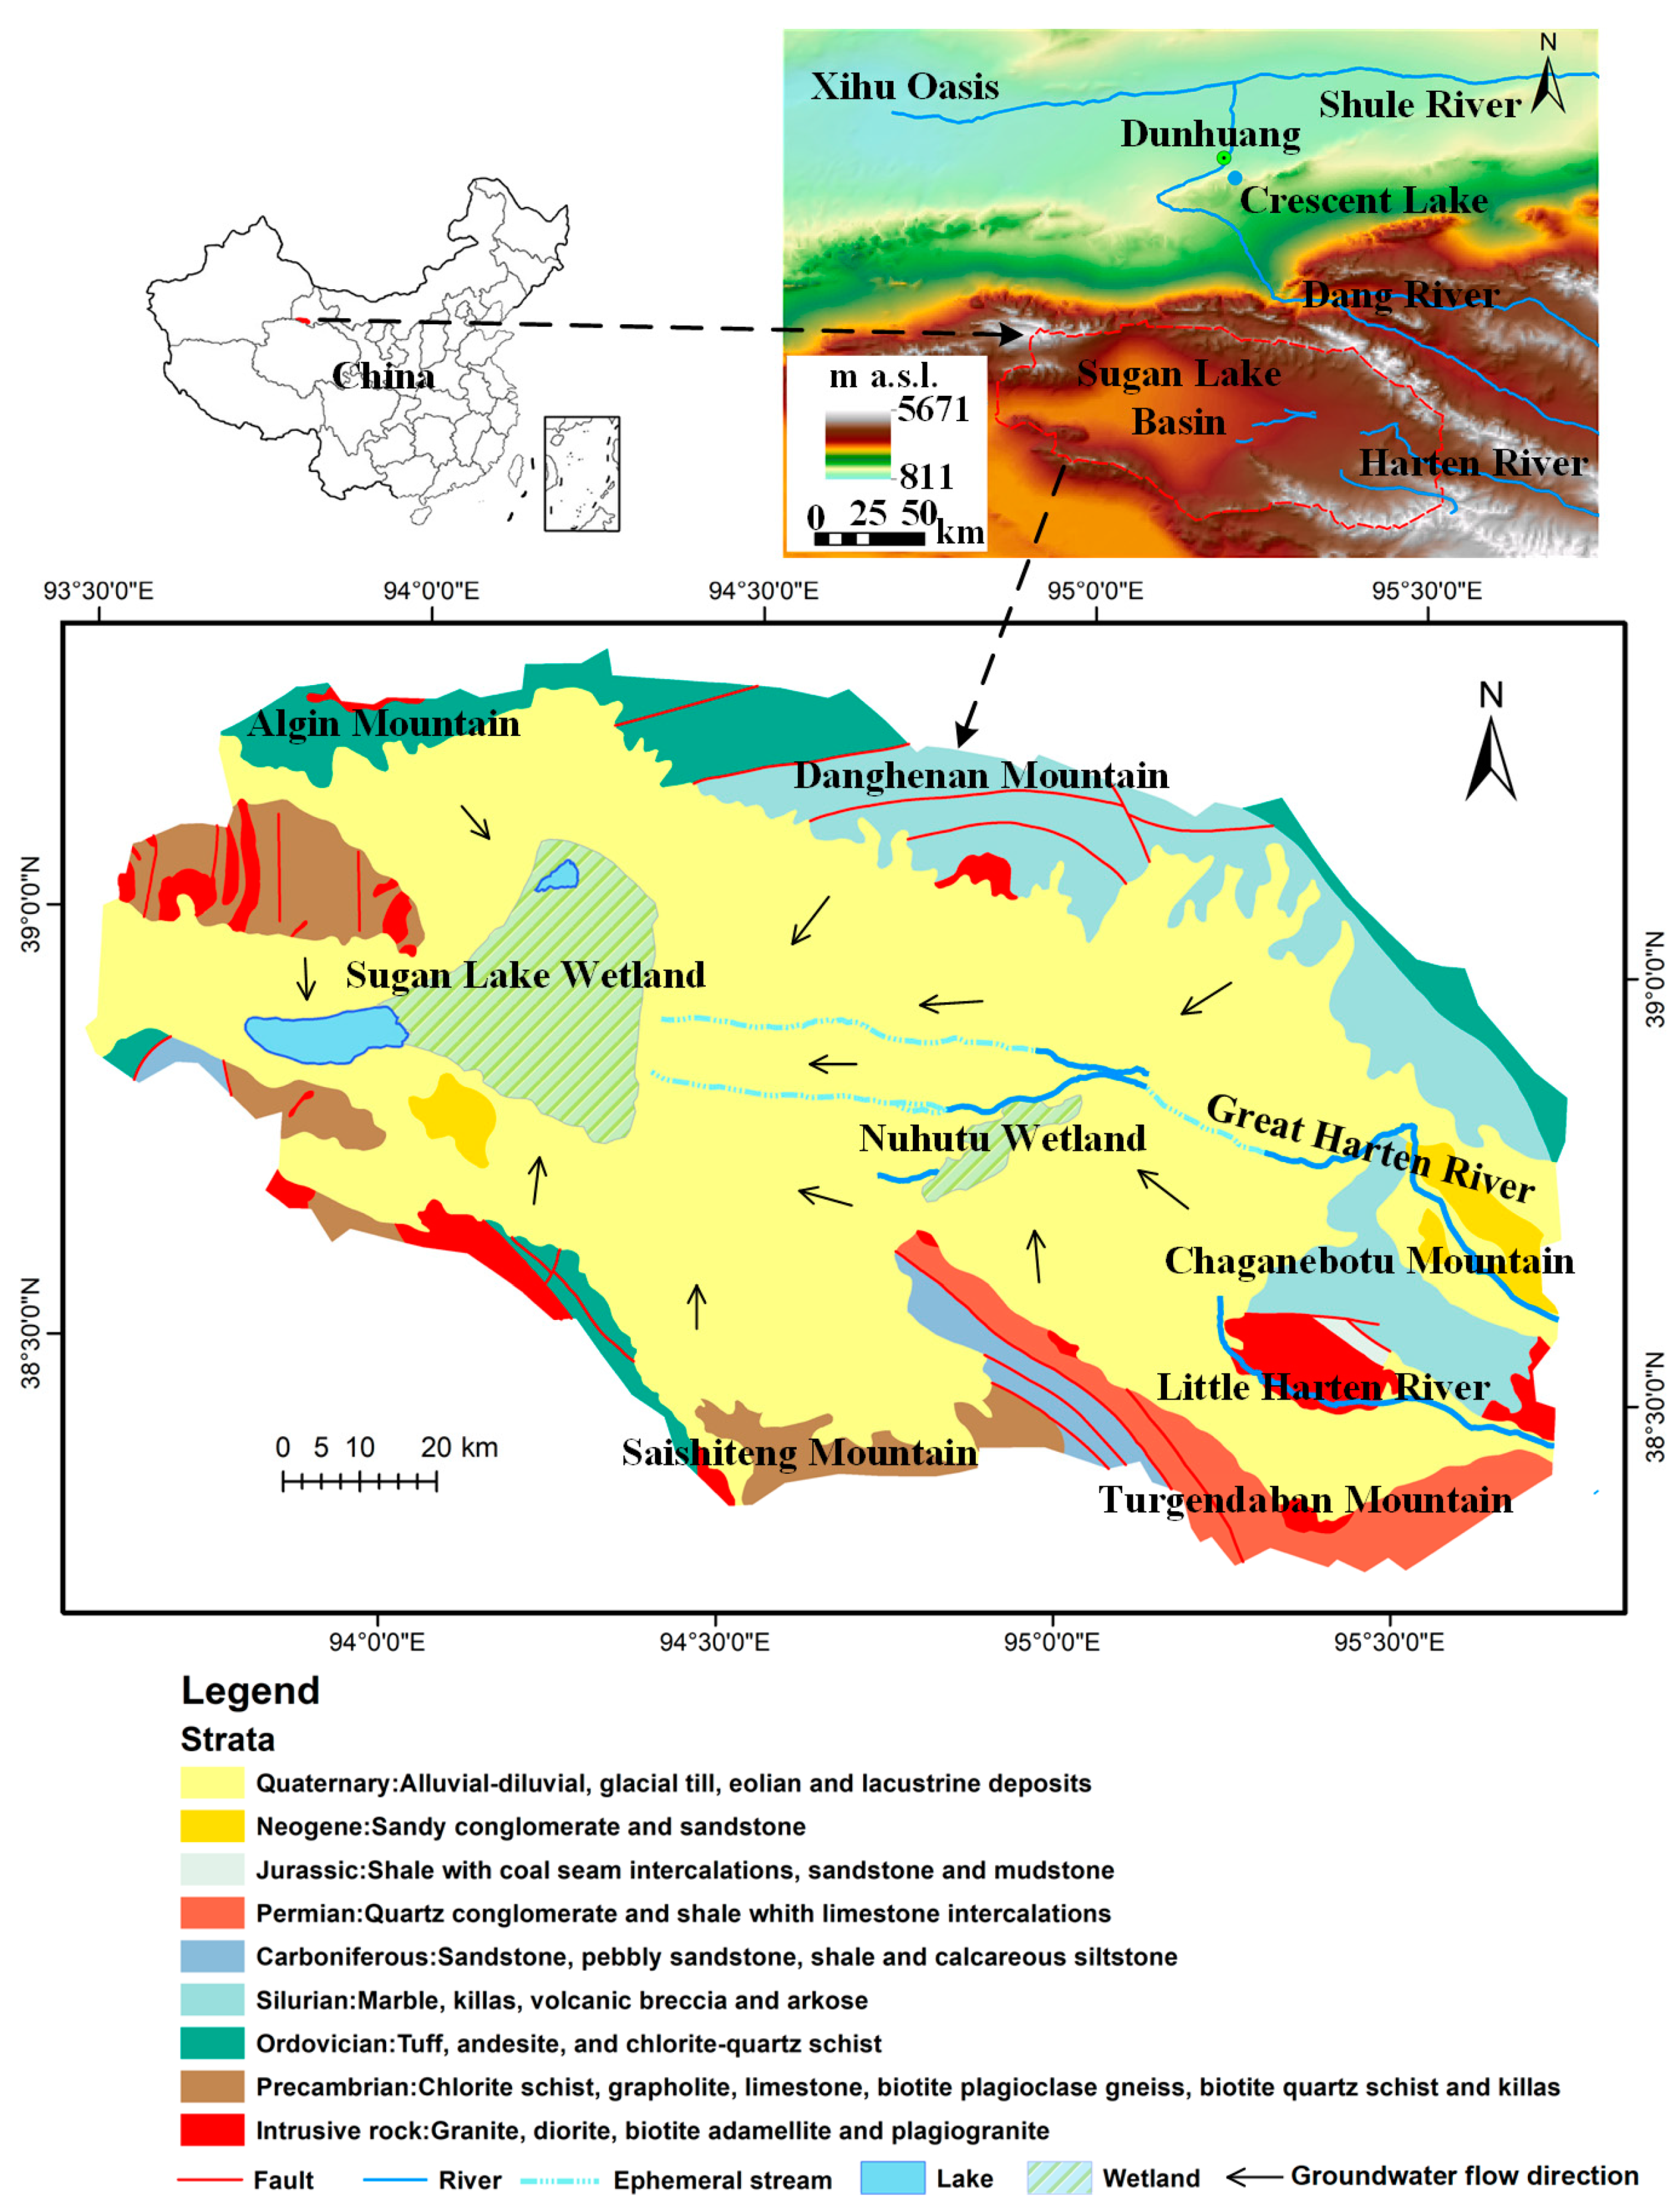
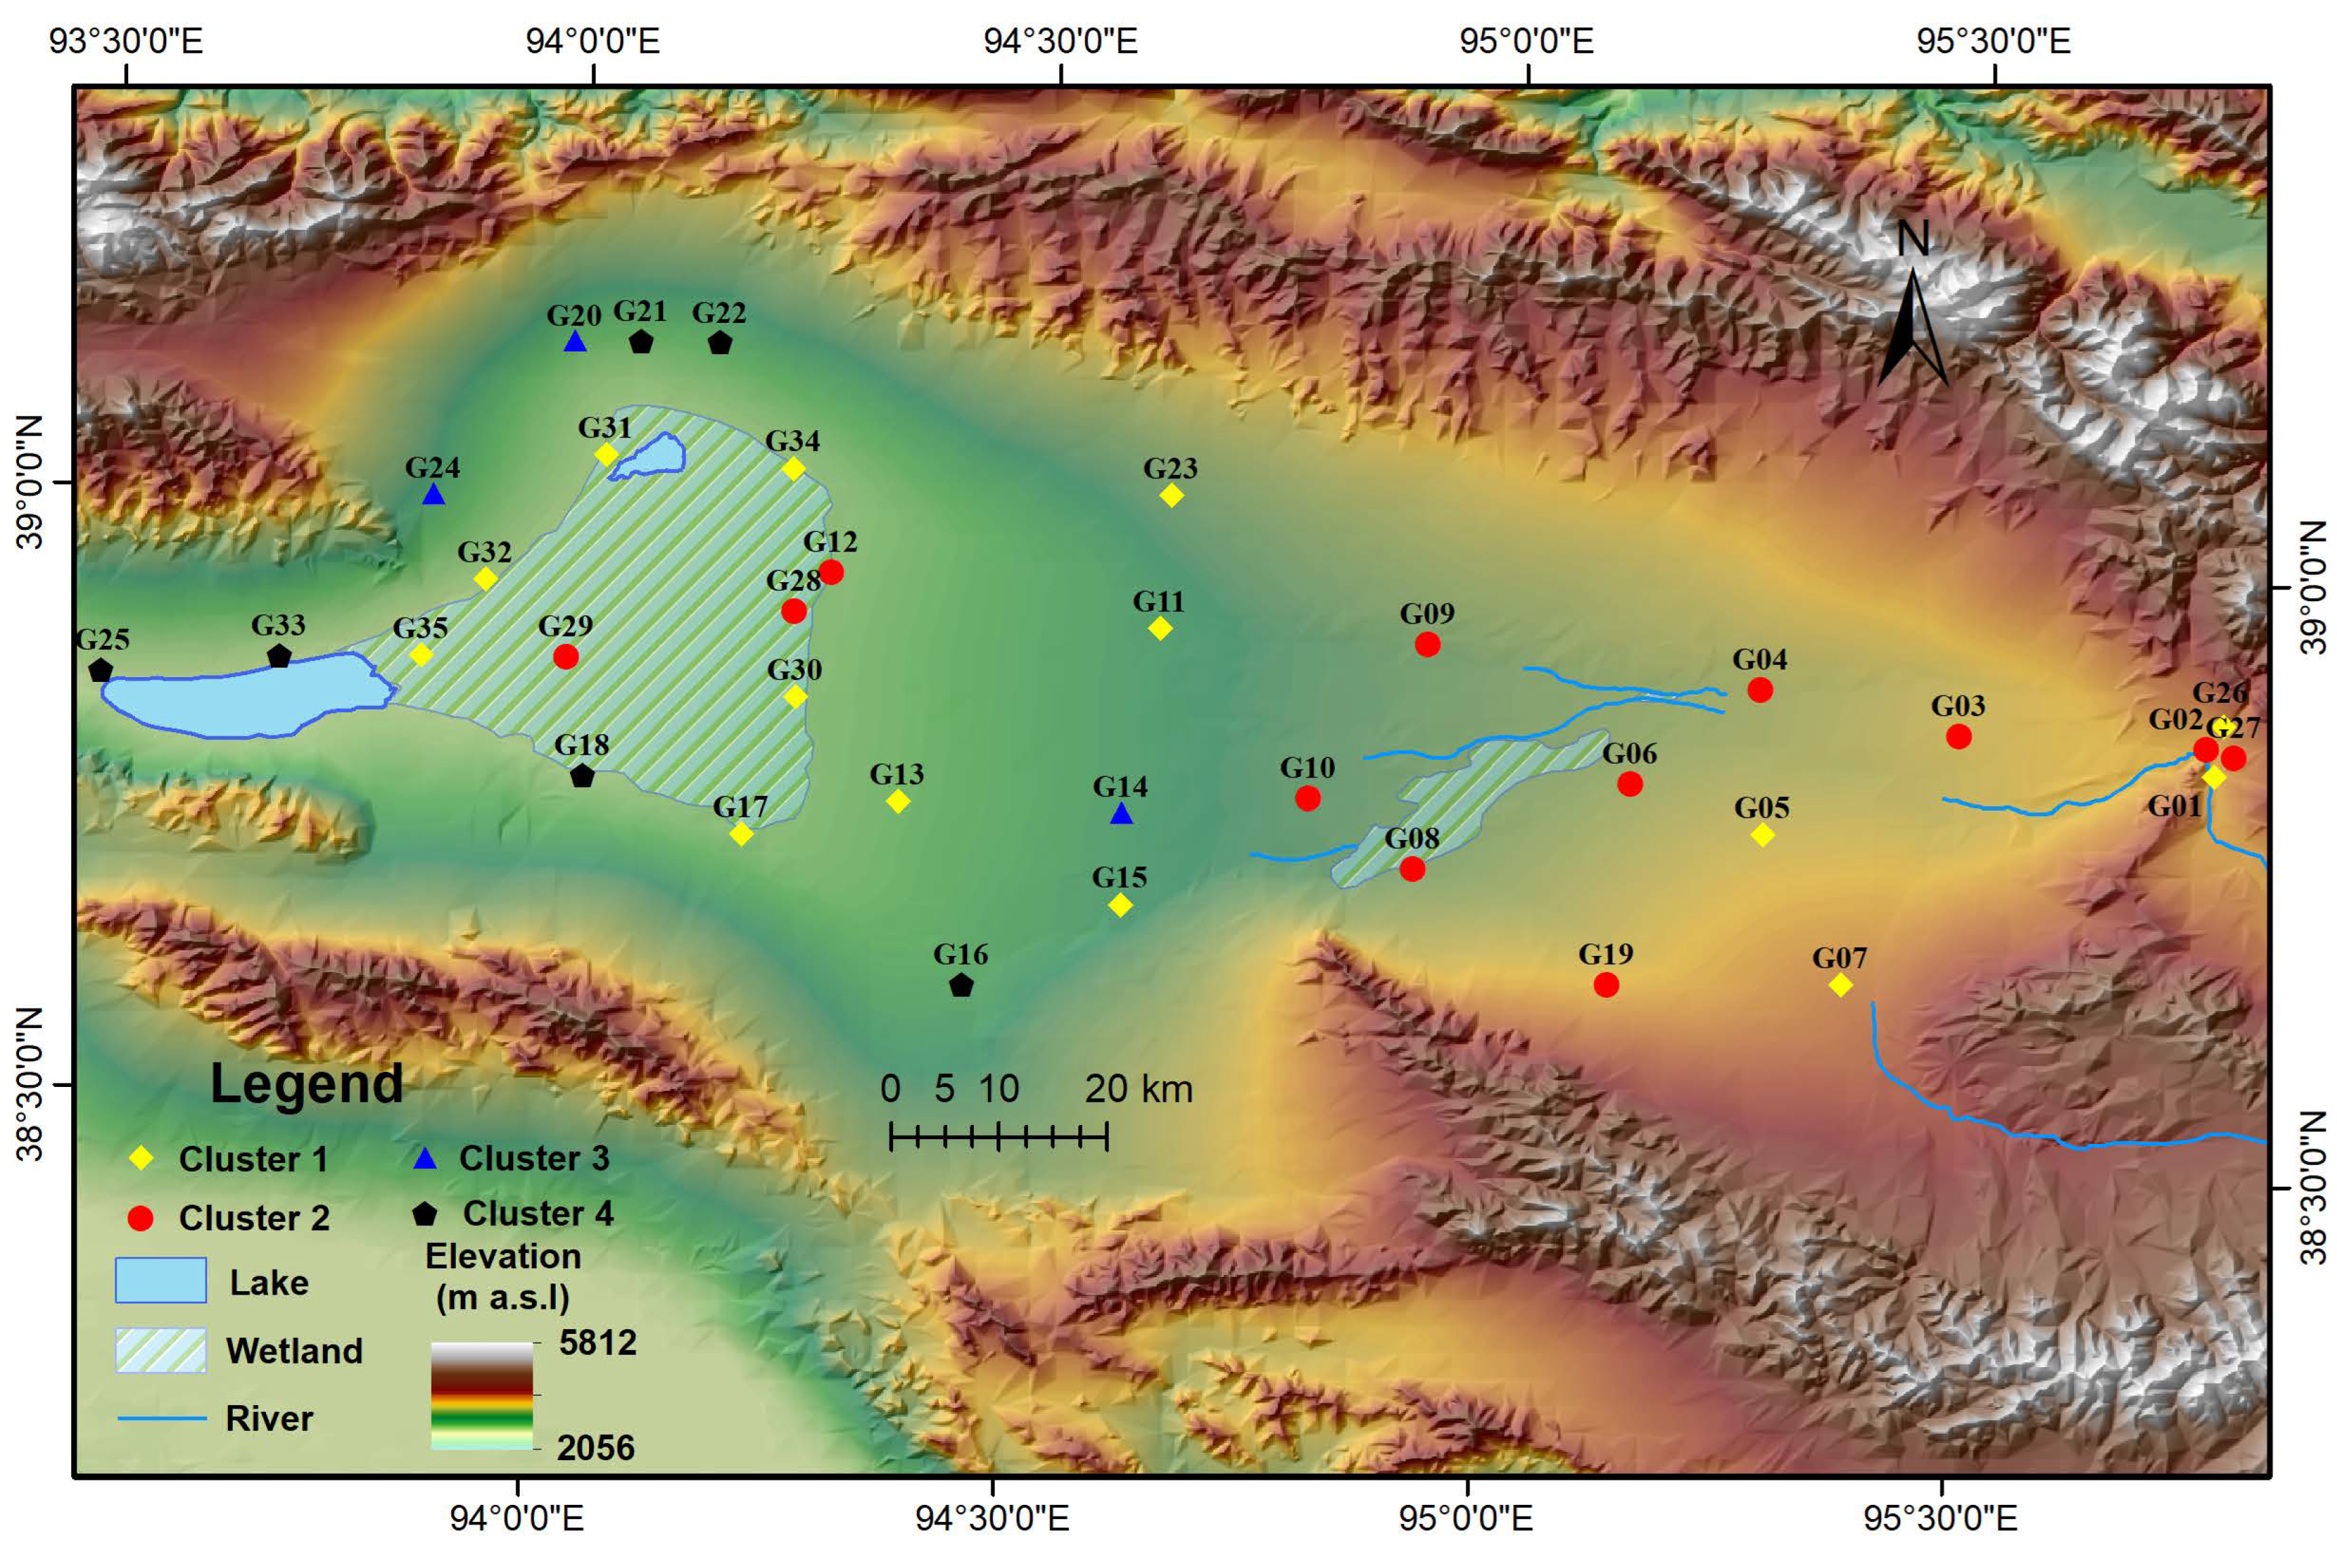
The Sugan Lake Basin is located on the west side of the Qilian Mountains (38°40′–39°10′ N, 93°40′–95°30′ E) in northwest China (Figure 1). It is composed of mountains, valleys, diluvial fans, piedmonts, and swampy geomorphic units with a total area of 2.01 × 10⁴ km2. The basin is surrounded by the Algin, Danghenan, Saishiteng, and Turgendaban Mountains. According to the Second Chinese Glacier Inventory datasets (http://www.ncdc.ac.cn/, access date: 20 January 2023), there are 350 glaciers in the basin, and ice covers an area of 317.35 km2. Affected by the alpine climate, the average annual temperature in the basin is −0.9 °C to 3.0 °C, and rainfall is low and mostly occurs from June to October. The average annual rainfall in the upper reaches of the basin exceeds 120 mm, with only 40 mm in the lower reaches. The potential evaporation is greater than 2000 mm/a. The two rivers are developed in the high-altitude mountains of the eastern basin (the Great Harten River and the Little Harten River), with a total drainage area of 7.29 × 10³ km2. In the dry season, the rivers break off at the alluvial fan and can flow across the basin into the Sugan Lake Wetland during the rainy season. The average annual runoffs of the two rivers were 2.98 × 10⁸ m3/a and 0.66 × 10⁸ m3/a, respectively. The Nuhutu and Sugan Lake wetlands, which are located in the middle and western parts of the basin, respectively, were natural pastures of local nomads. The Chinese government has proposed a series of environmental protection plans to maintain ecosystem stability. The Sugan Lake Wetland was designated as a natural reserve in 1982, and agricultural and husbandry activities have been limited since 2017. Transportation is the primary human activity in the study area. Culverts were built to facilitate the passage of rivers and wild animals along the north-south expressway.
2.2. Sampling
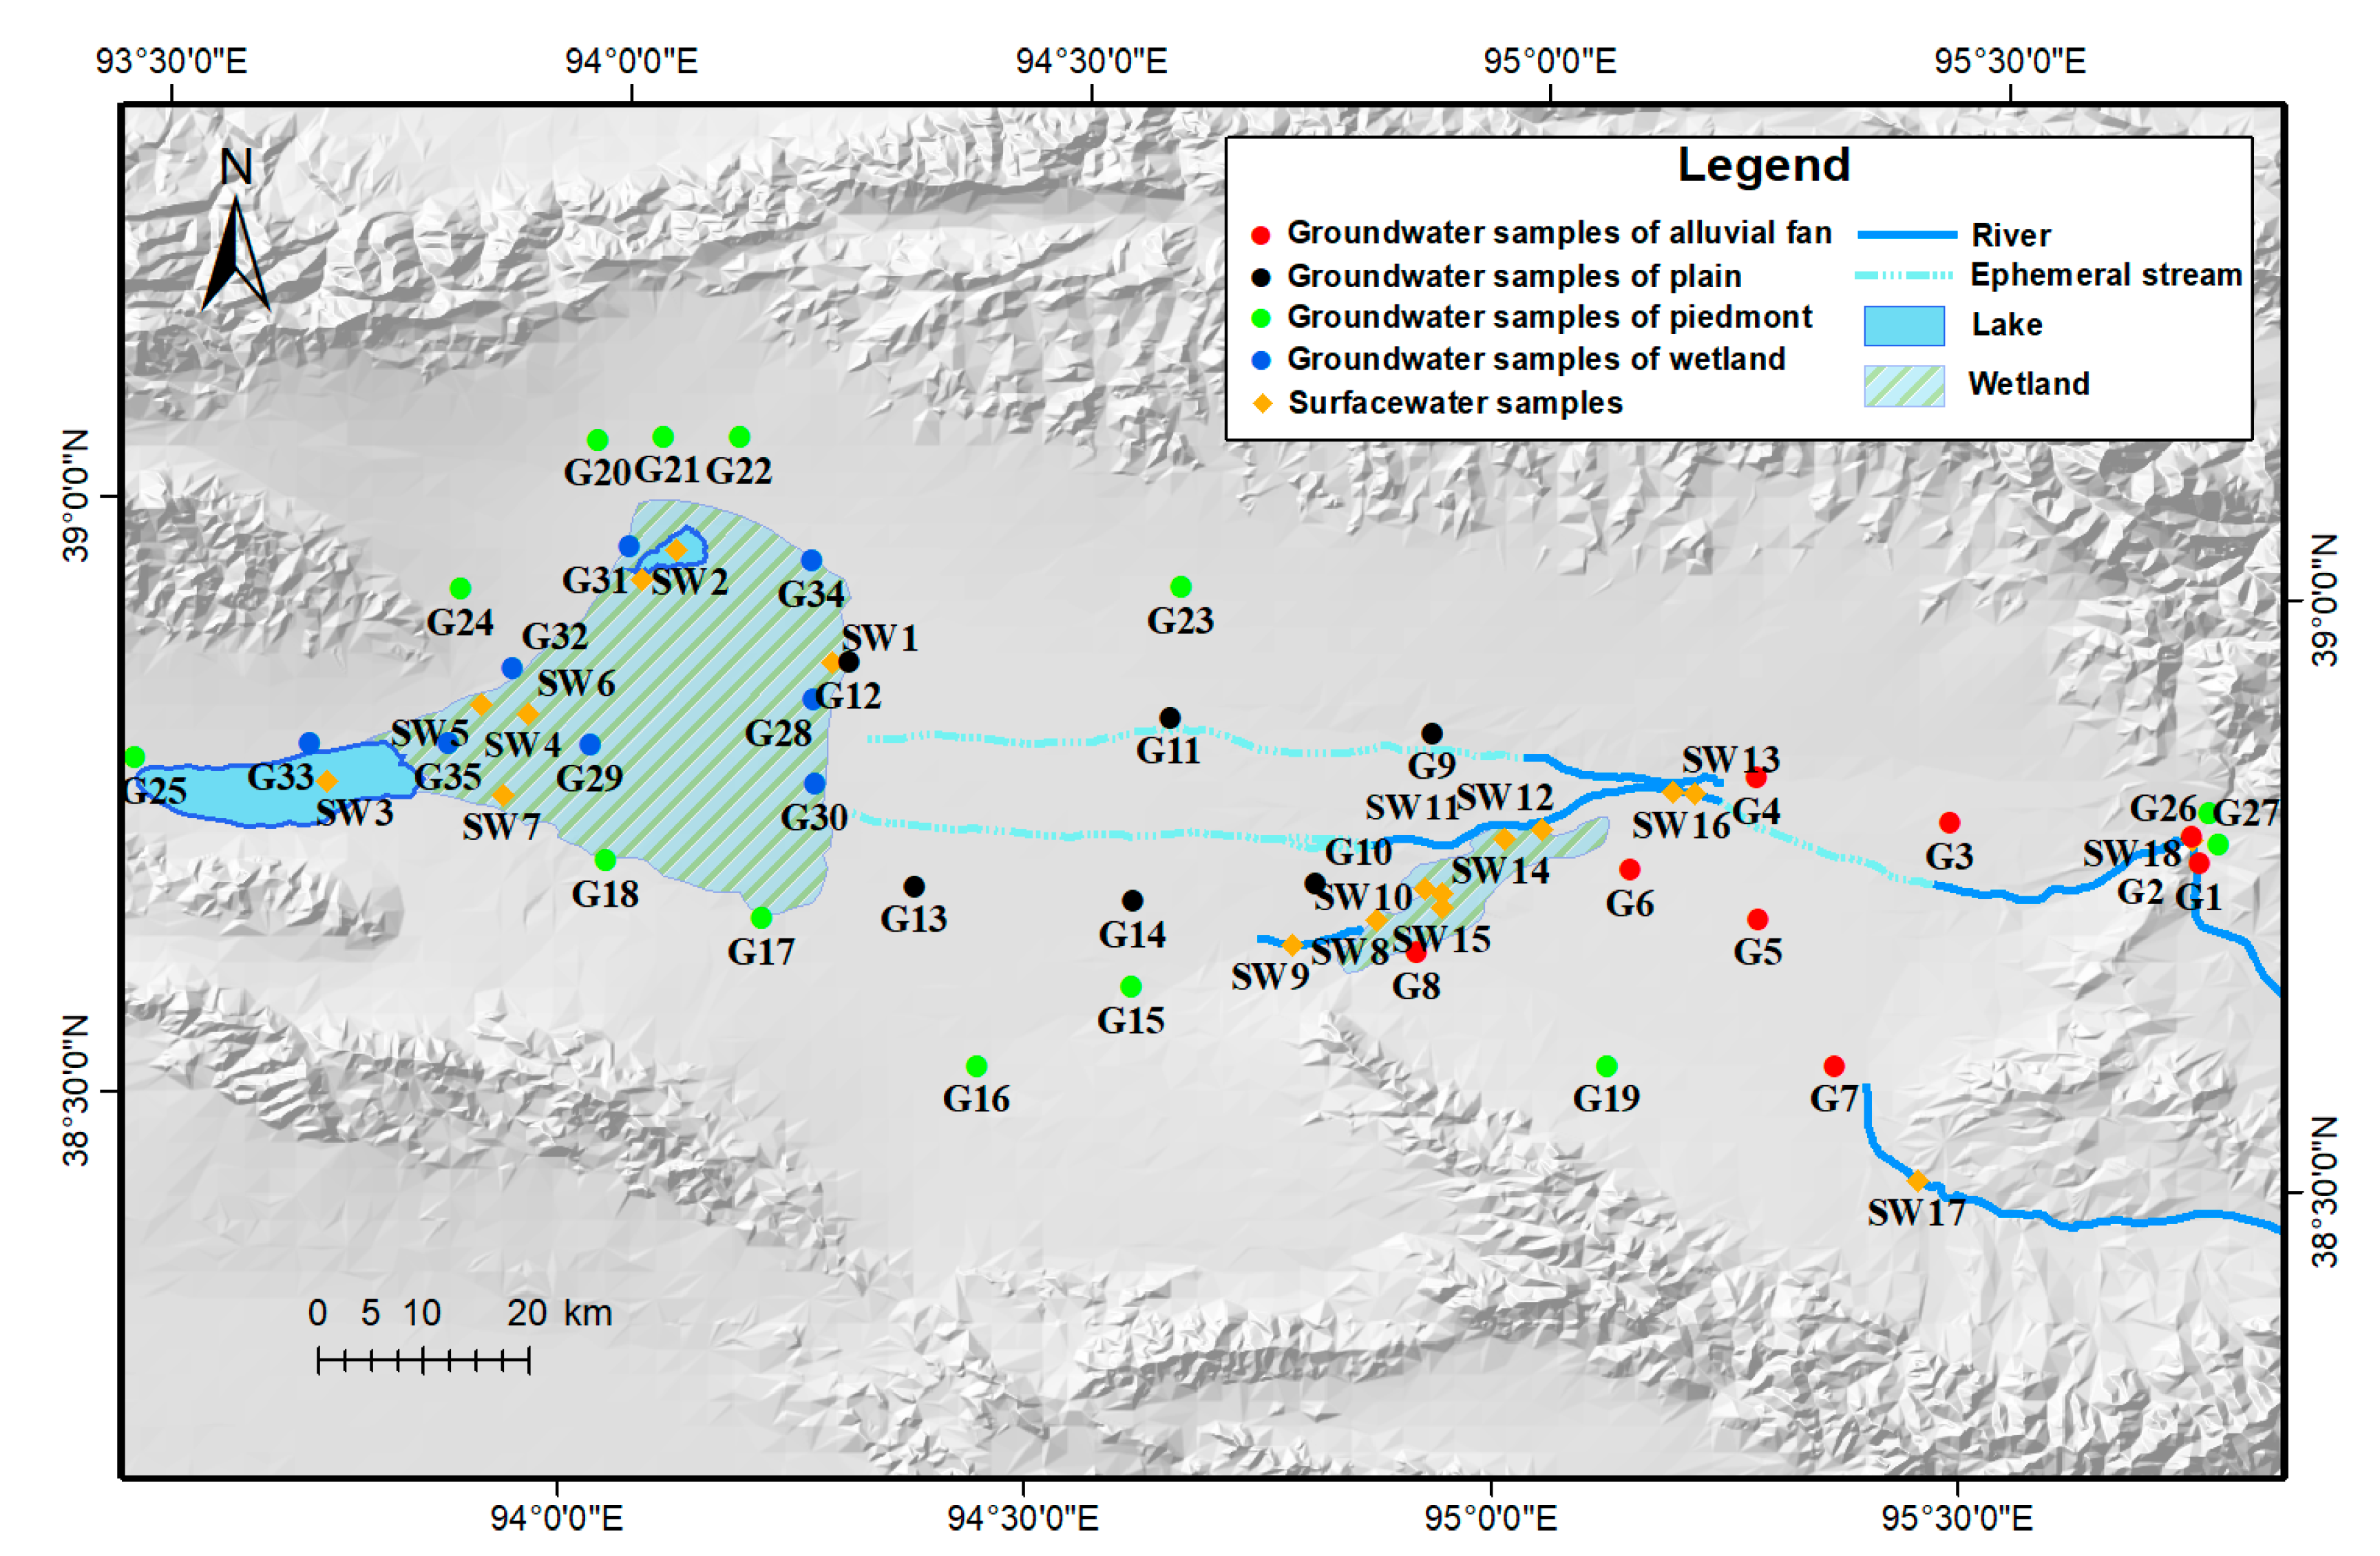
The field sampling period was from August to September 2016 and 2018. A total of 86 water samples with the tested ion concentrations were collected in this study, of which 35 phreatic-groundwater samples were collected from 35 wells (G1–G35). As shown in Figure 2, the sampling sites were divided into alluvial fan (G1–G8), plain (G9–G14), piedmont (G15–G27), and wetland (G28–G35). A total of 51 surface water samples were collected from 16 sampling sites (SW1–SW16). Meanwhile, 47 samples of hydrogen and oxygen isotopic samples were collected from rainwater, glacial meltwater, rivers, lakes, and wells. The sampling method complies with Chinese standards of “Methods for Testing Groundwater Quality” (DZ/T0064-93 standard). The polyethylene plastic bottles were rinsed three times with sampling water before sampling and then sealed and refrigerated. The samples were tested at the Water Pollution Detection and Control Center of the Gansu Provincial Bureau of Geology and Mineral Exploration, China. The samples were analyzed for major ions (Na+, K+, Ca2+, Mg2+, HCO3−, SO42−, Cl−, NO3−, NO2−, and F–), heavy metals, and trace elements (Fe, Cu, Zn, Mn, Pb, Ni, Cd, As, Se, Hg, and Cr Ⅵ); and the total dissolved solids (TDS) and total hardness (TH) were calculated. The balance errors of ions for all water samples were less than the upper error limit value of 5%.
2.3. Analytical Methods
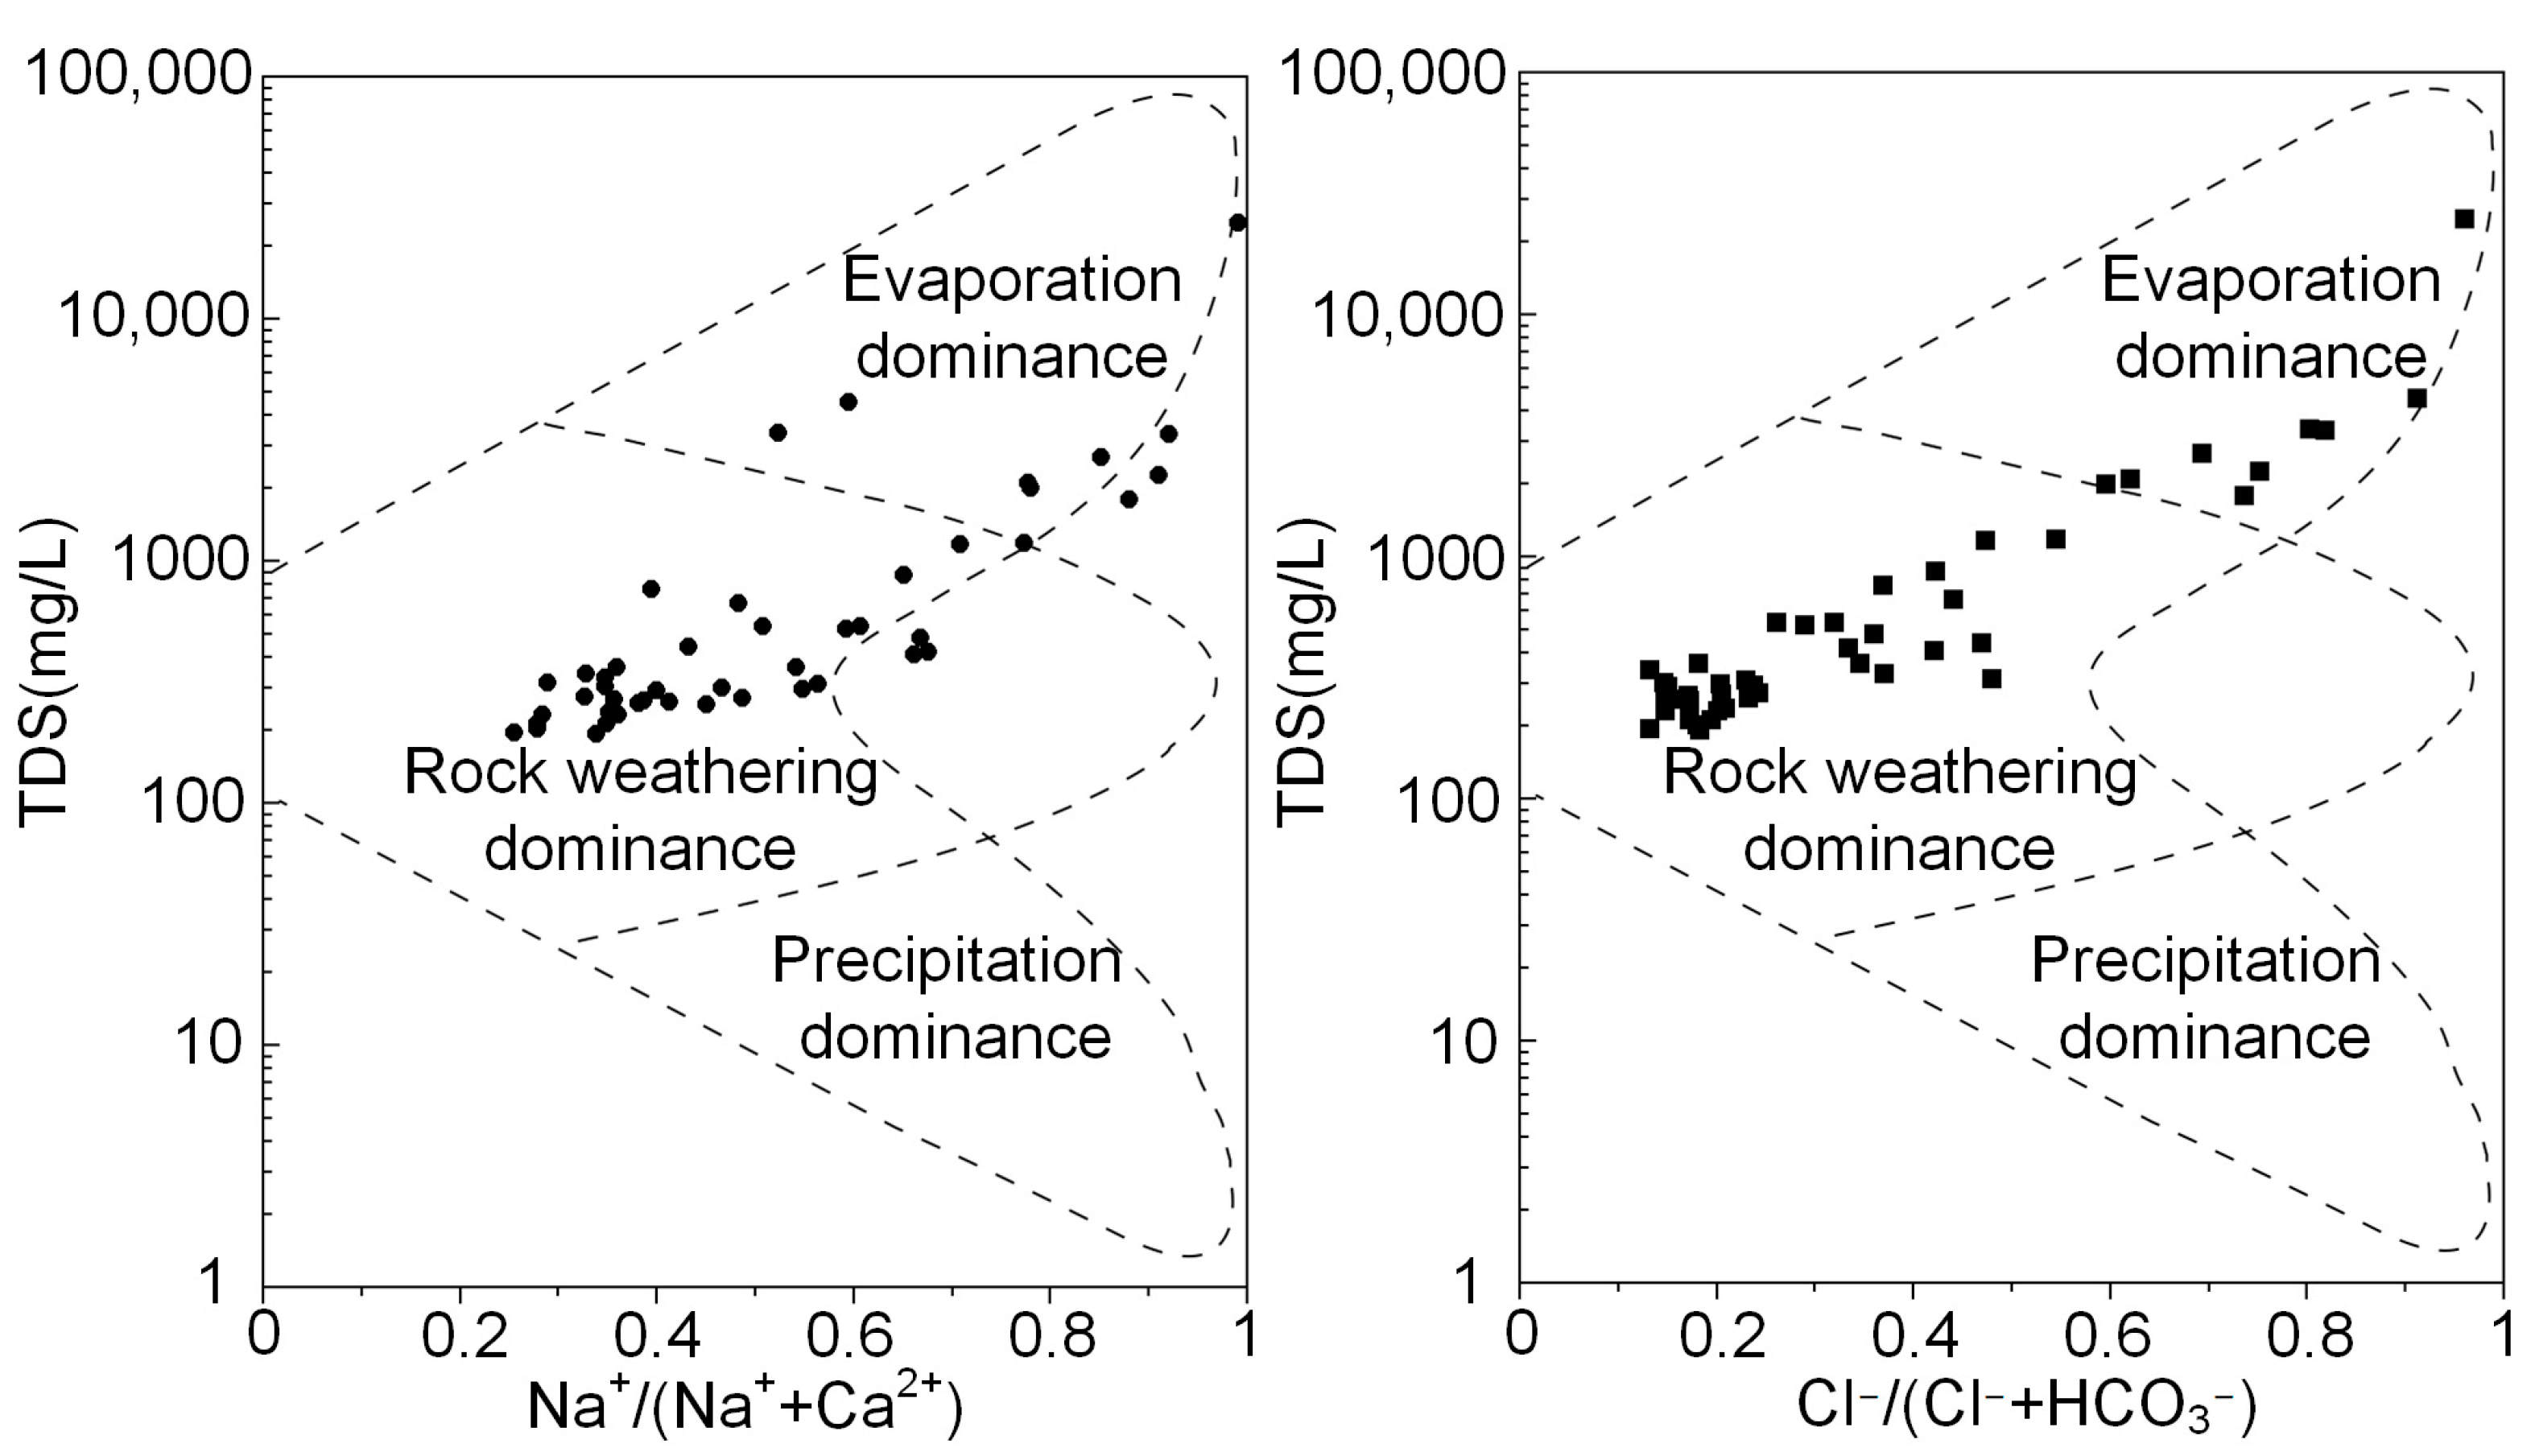
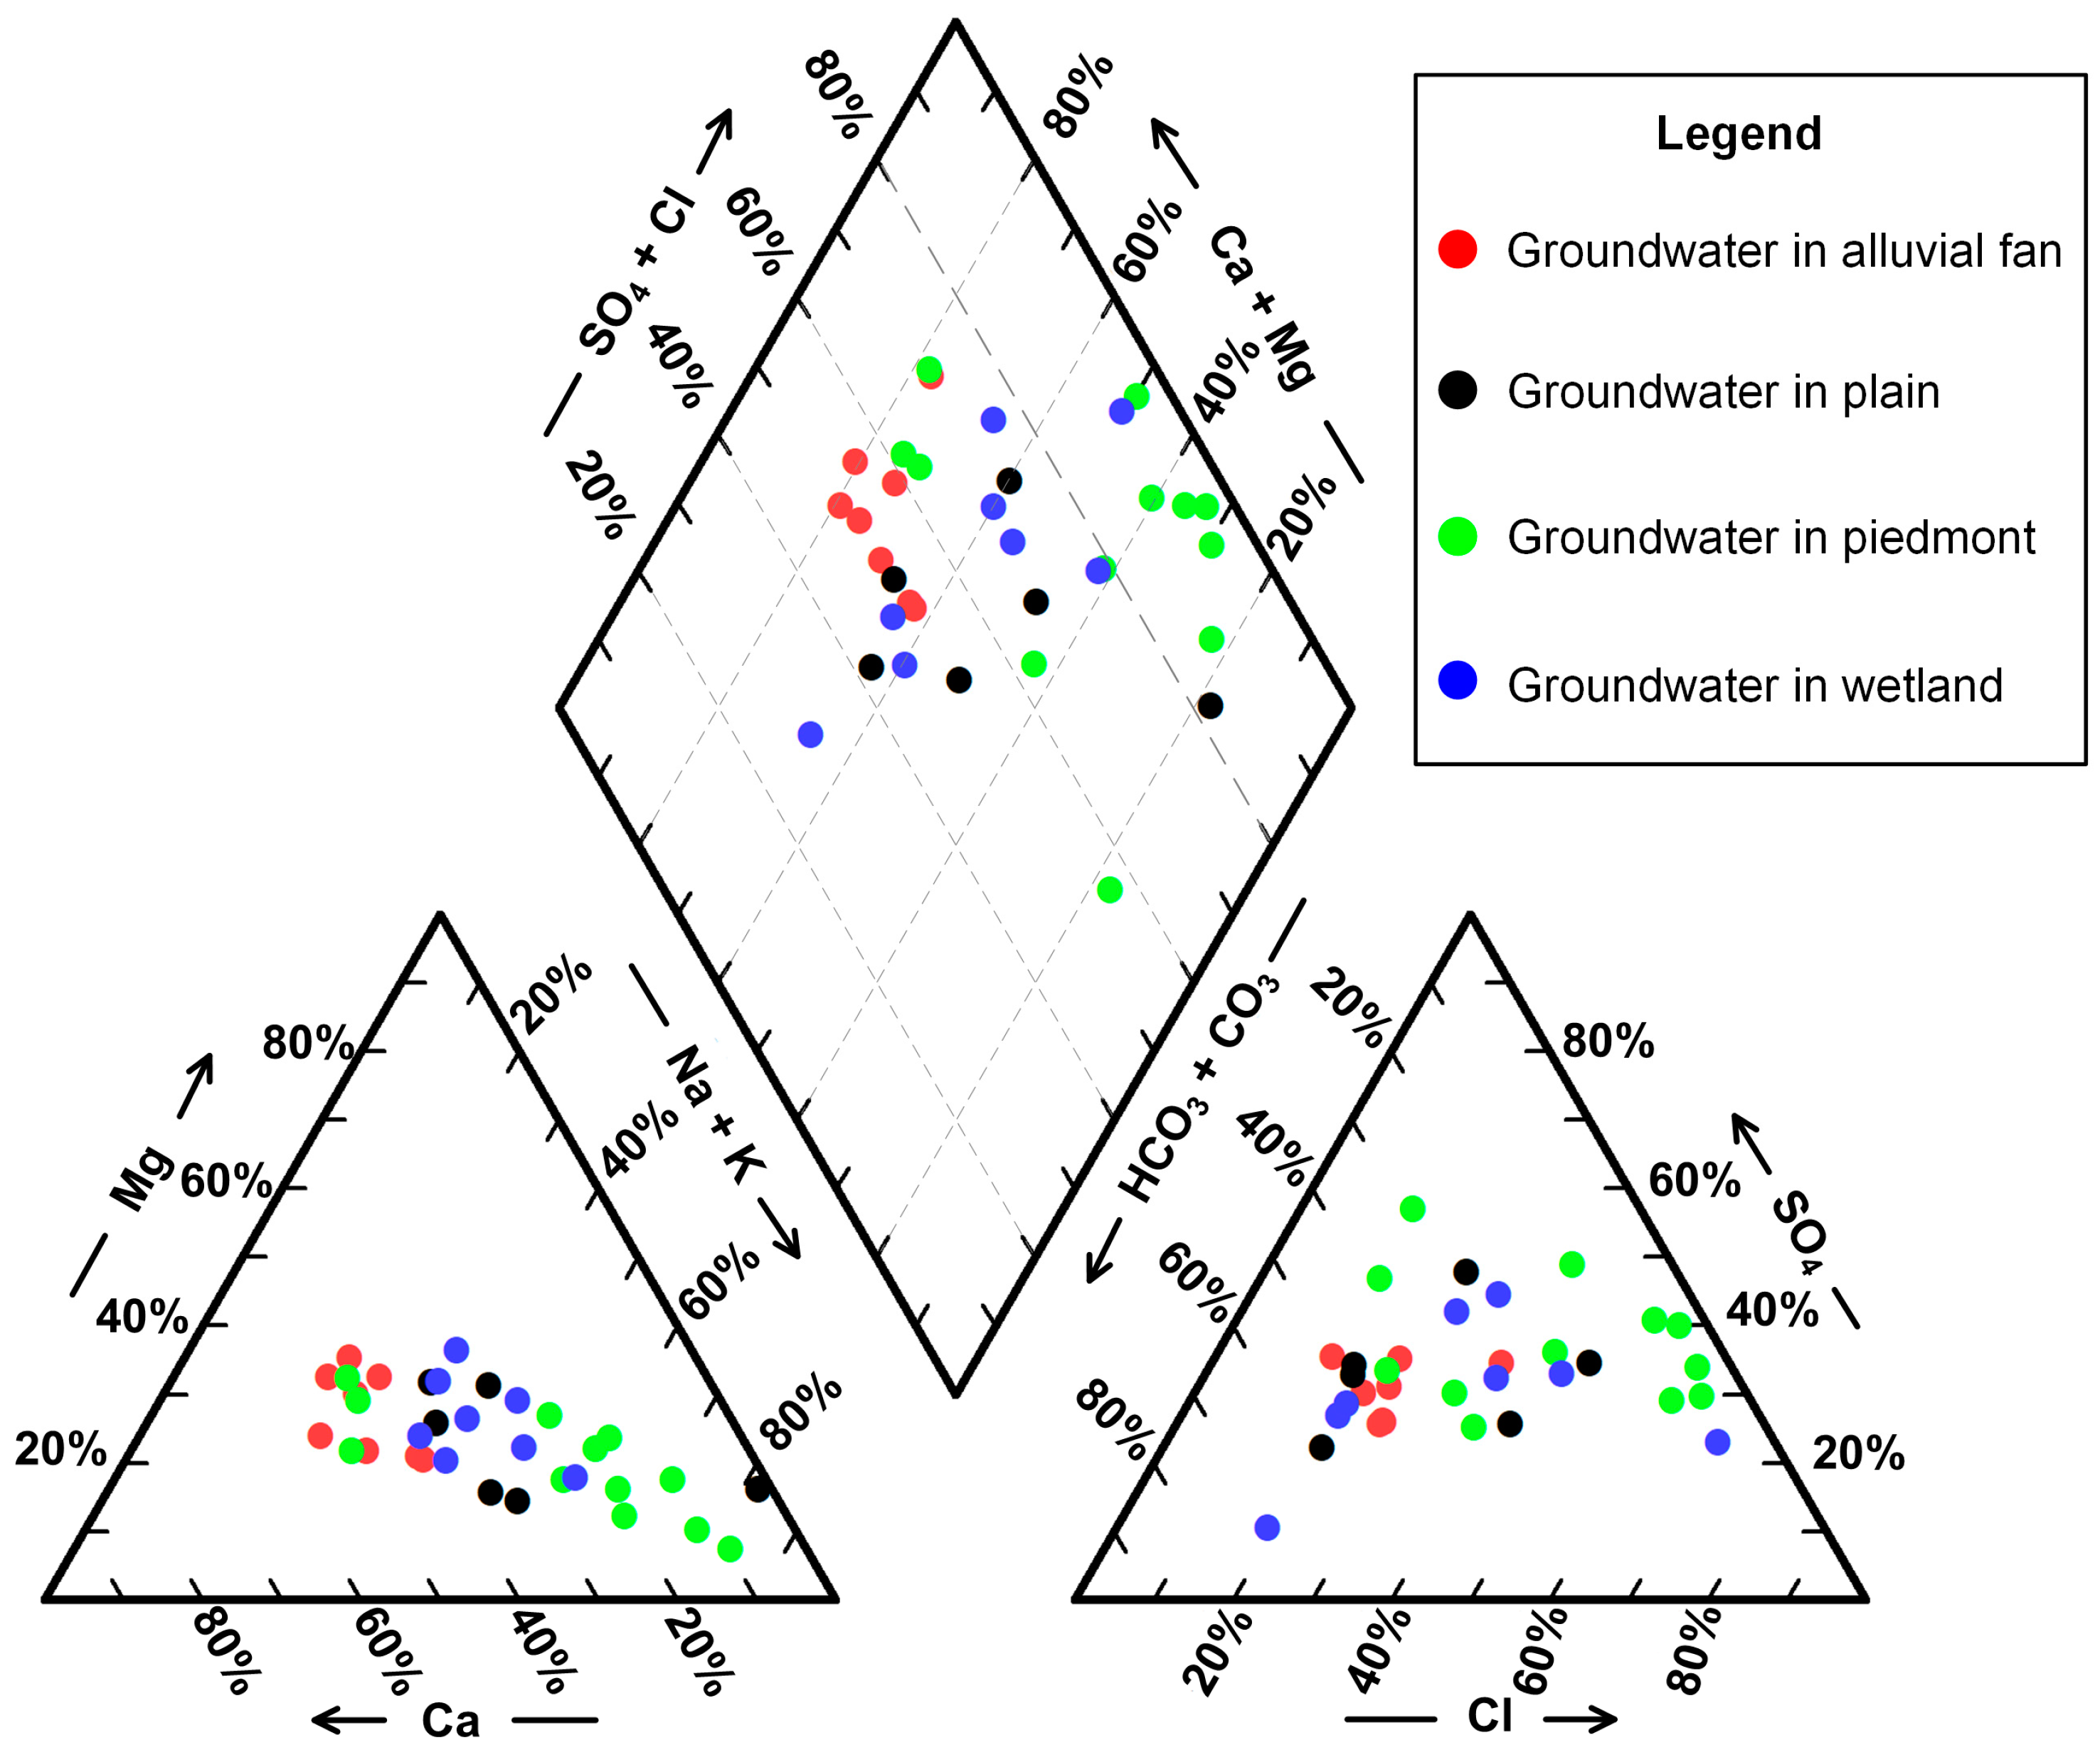
A Gibbs diagram was applied to reveal the dominant mechanisms of the dissolved substances in the surface water: precipitation, rock weathering, and evaporation [31]. Piper diagrams have been widely used in hydrogeochemical studies to illustrate the chemical characteristics and variations in groundwater. In this study, Gibbs diagrams, Piper diagrams, and descriptive statistics were used to describe general pictures of surface water and groundwater hydrochemistry. 2H and 18O isotopes were used to identify the sources of groundwater and the relationship between surface water and groundwater. Unary linear regression was used to fit 2H and 18O data, and the fitting method has little effect on the results. The meteoric water line of northwest China was used as the Local Meteoric Water Line (LMWL) in the study area. This reflects the ratio characteristics of stable hydrogen and oxygen isotopes in the arid region of northwest China [32], and the Global Meteoric Water Line (GMWL) was used as a reference line [33].
To reveal the geochemical processes of groundwater, the ionic ratio method was applied to the chemical data to analyze the spatial variation trends of the ion composition in the study area. Multivariate Statistical Analyses, including Principal Component Analysis (PCA) and Hierarchical Cluster Analysis (HCA) [34], can help the understanding of the interrelation between groundwater samples by correlations of chemical variables. PCA can effectively reduce the dimensions of variables, thus reducing the difficulty of analyzing the hydrochemical influencing factors with less information loss [35,36]. HCA was used to directly classify the samples according to the similarity of the chemical variables. The acceptability of the dataset for PCA was evaluated using Kaiser–Meyer–Olkin (KMO) and Bartlett’s sphericity tests [37], which were performed using SPSS (IBM Corp., Armonk, NY, USA).
3. Results
3.1. Hydrochemistry of Surface Water and Groundwater
The data of surface water samples from the Sugan Lake Basin are shown in Table 1, where the maximum and average concentrations of Na+ were the highest for cations at 6105.00 mg/L and 275.13 mg/L, respectively. The maximum and average concentrations of Cl− and SO42− were the highest among all the anions, with values of 8260.00 mg/L and 422.46 mg/L, respectively. The minimum and average pH values were 7.39 and 8.23, respectively, indicating a weakly alkaline environment. The TDS ranged from 193.00 mg/L to 24,840.00 mg/L, and the maximum value of TDS was sampled from the center of the Great Sugan Lake, whereas the minimum value was from the upper reaches of the Great Harten River. Coefficient of variation (CV) is the percentage of standard deviation divided by the mean. The largest CV of all ions is Cl− of 333.56%, while the CV of HCO3− was only 40.09%. pH had the lowest CV (4.28%).
As shown in the Gibbs diagram (Figure 3), most of the surface water samples are located in the “Rock weathering dominance” zone of the diagram, and others are located in the “Evaporation dominance” zone. The river water samples were mostly located in the middle part of Figure 3. The TDS of the river samples changed little from the upper reach to the middle reach, whereas the values of Na+/(Na+ + Ca2+) and Cl−/(Cl− + HCO3−) slightly increased. Along the river flow path, the distribution of water samples extended slightly from the middle to the right. Lakes and streams in the lower basin have higher salinity than river water, and most of them are located in the upper right of Figure 3. Some water samples even exceed the range of the three types. After complex and long-term hydrogeochemical processes, groundwater can be scattered over areas with medium and high TDS levels, as shown in Figure 3 [38]. Thus, it can be assumed that the increased proportion of Na+ in surface water originates mainly from groundwater recharge.
In groundwater, Na+ has the highest mean and maximum concentration (142.31 mg/L and 669.40 mg/L, respectively) among all cations. The highest mean value of all the anions was observed for Cl− at 194.02 mg/L (Table 2). The NO3− concentration in groundwater ranges from 0.50 mg/L to 36.17 mg/L, which is smaller than that in surface water (from 0.50 mg/L to 68.75 mg/L), but higher on mean value (8.90 mg/L vs. 6.71 mg/L). As with surface water, all groundwater samples are weakly alkaline, and the minimum and mean pH values are 7.73 and 8.14, respectively. The TDS of groundwater samples ranged from 197.00 mg/L to 2691.00 mg/L, with an average value of 687.97 mg/L. The CV showed that the differences in indices in the groundwater samples were smaller than those in the surface water. The ions with strong variability were Na+, K+, and SO42−, whereas the rest had moderate or weak variability. The CVs of SO42− and pH are 129.09% and 2.63%, respectively, showing the strongest and the weakest variation.
The Piper diagram (Figure 4) illustrates the hydrochemical characteristics of groundwater. Samples of alluvial fan fall in the upper left part of the diamond diagram, showing that Ca2+ + Mg2+, and Mg2+ account for 60% to 80%, and less than 40% of total cations, respectively. Anions are dominated by CO32− + HCO3−, which accounts for more than 40%. In the pain zone, the proportion of Ca2+ + Mg2+ content in groundwater decreased, and the proportion of Na+ + K+ increased to over 30%. Most of the groundwater samples from piedmont are located in the right part of the diamond diagram, indicating that the proportion of CO32− + HCO3− content in groundwater is less than 40% of all anions. Because of the large variation in each ion concentration in the piedmont and wetland, the distribution of the samples in Figure 4 is relatively discrete.
3.2. Ratios of Stable Oxygen and Hydrogen Isotope
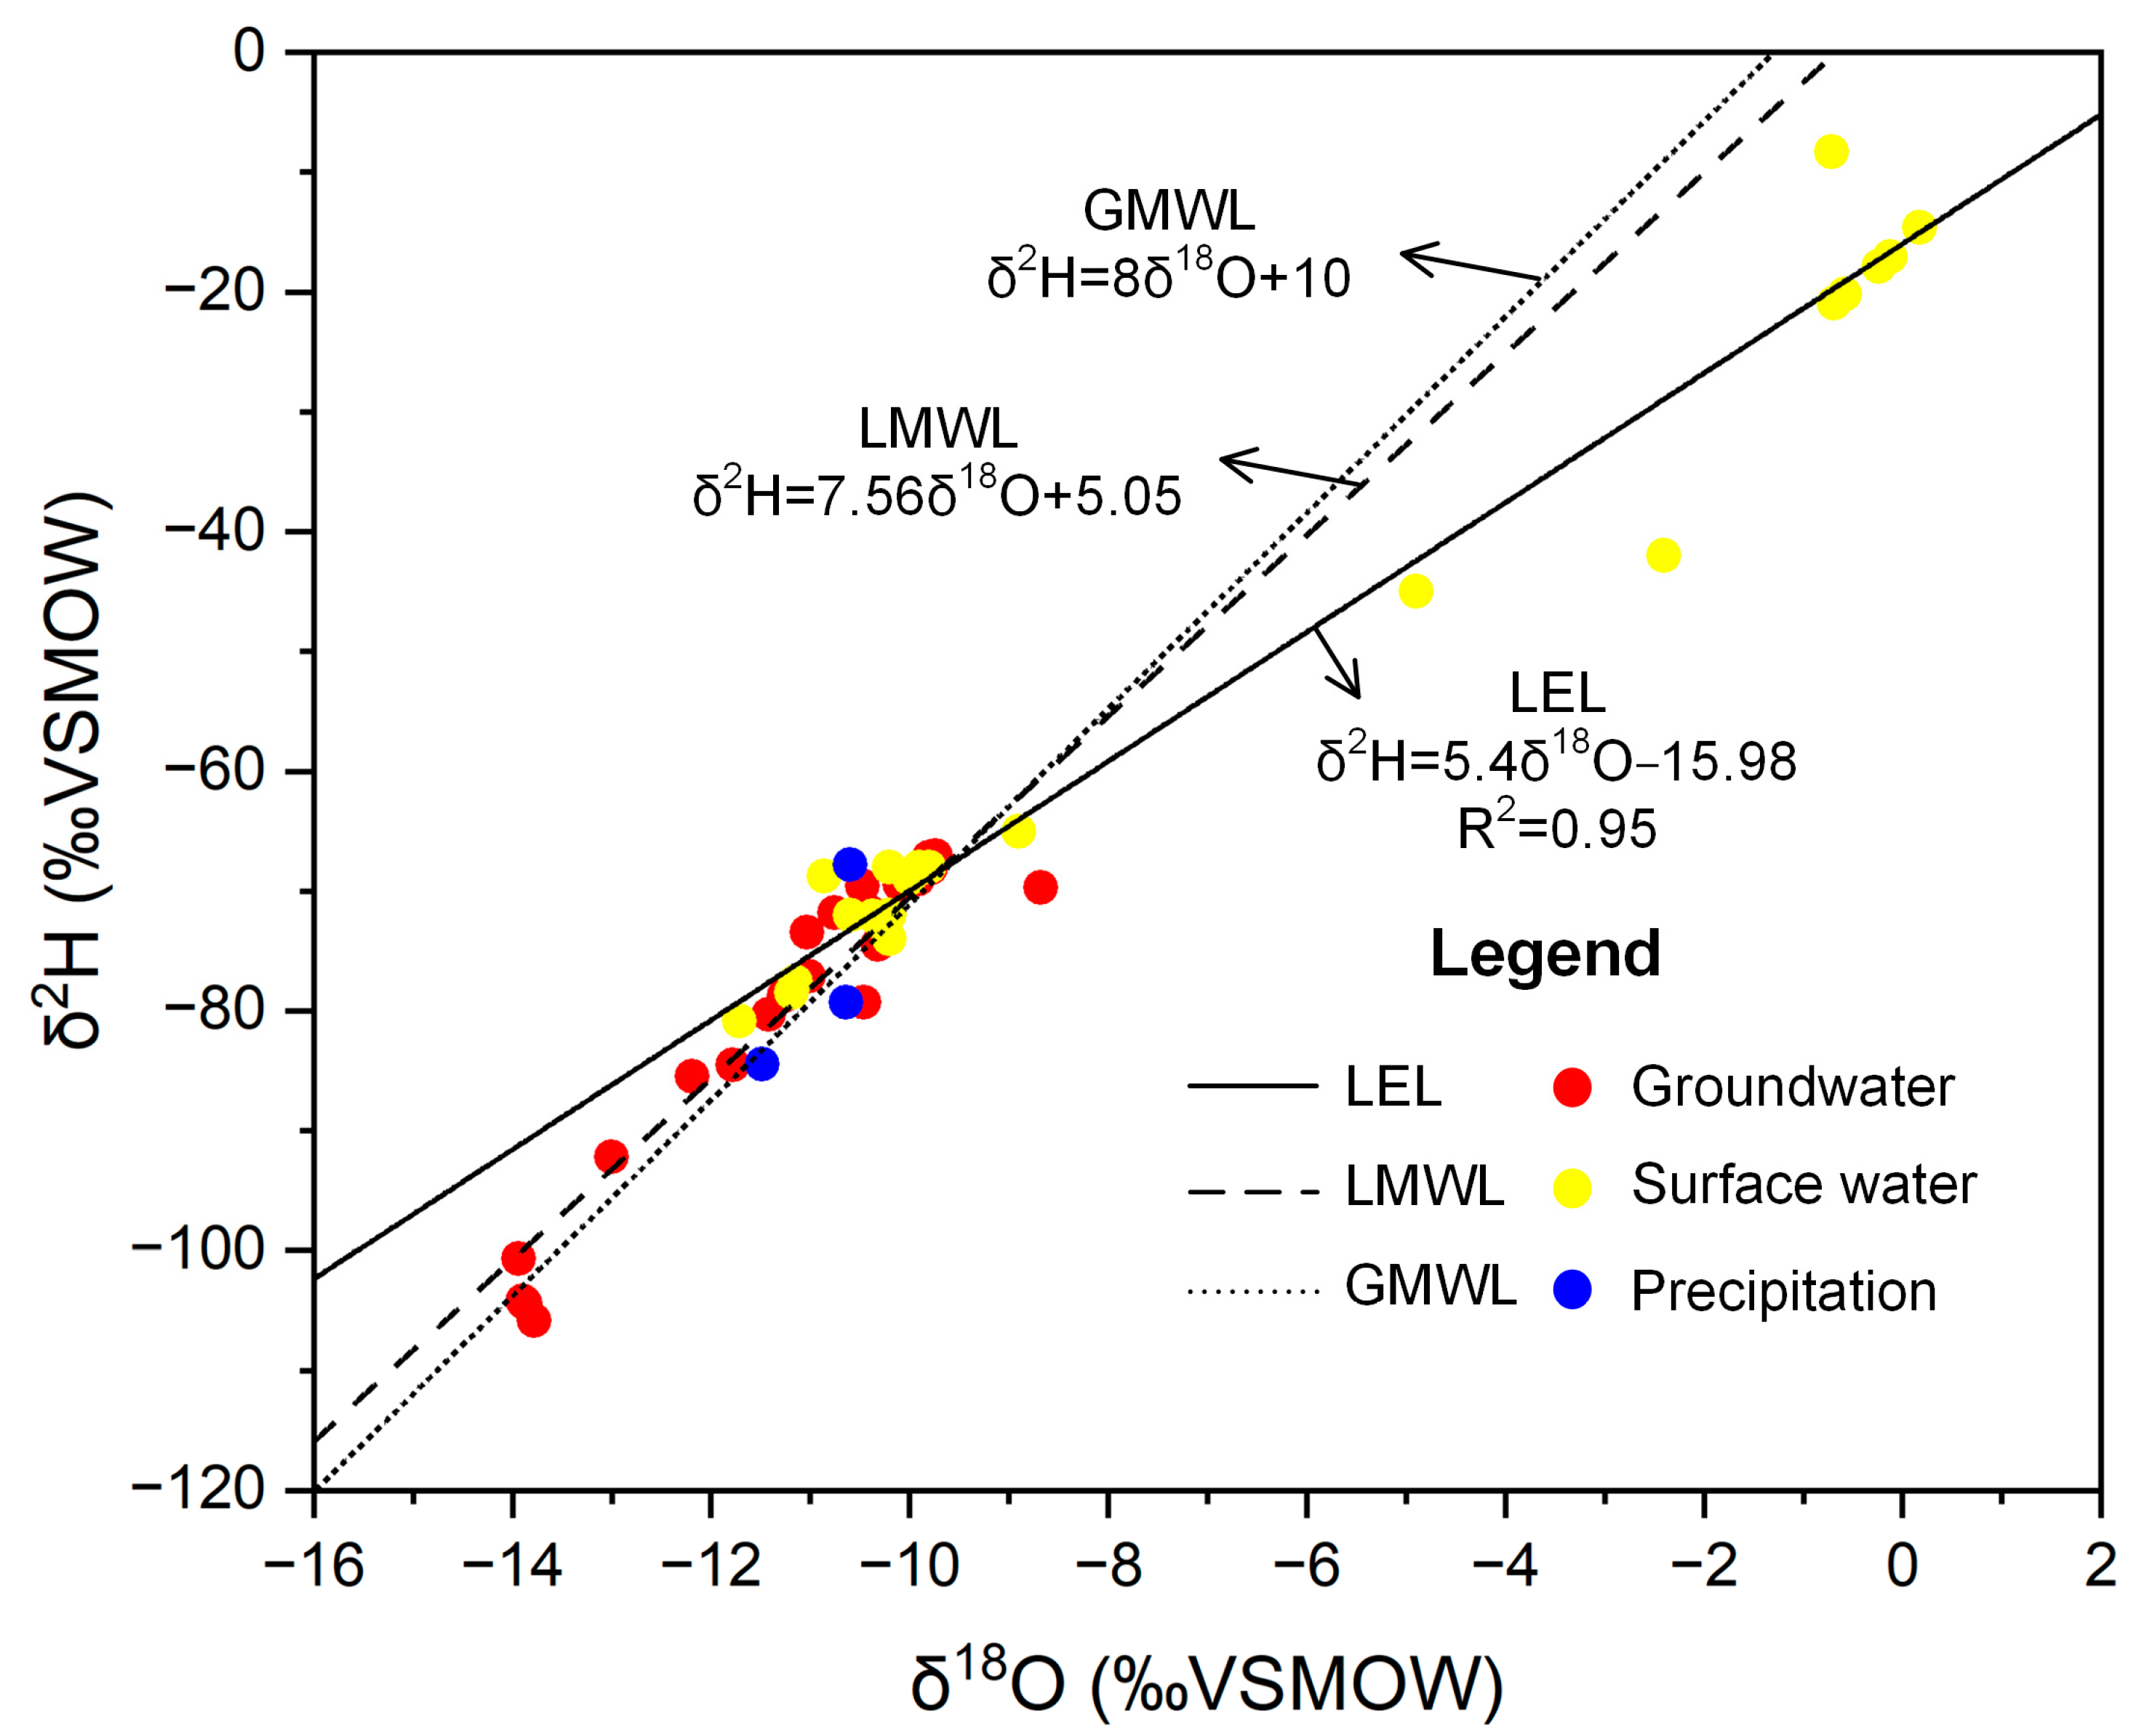
The local evaporation lines (LEL, δ2H = 5.4δ18O−15.98, R2 = 0.95) of stable isotopes of hydrogen and oxygen were formed by fitting the results of water samples from the lake and river (Figure 5). The precipitation samples included one rainfall sample and two glacial snowmelt samples. The δ18O and δ2H contents of rainfall (δ18O = −8.9‰, δ2H = −40‰) are higher than that of meltwater, meaning the thermal and altitudinal fractionation is obvious. The isotopic contents of rivers lie between those of precipitation and snowmelt. The isotope concentration of the surface water in lakes and wetlands were higher than those in other water samples because of strong evaporation above the LEL. The groundwater samples were located near the LMWL, whereas the stable isotope concentration of the piedmont zone were lower than those of the rainfall and snowmelt samples. This indicates that the groundwater originated generally from atmospheric precipitation, although the groundwater in the piedmont was recharged by ancient meteoric precipitation in a lower-temperature environment [39]. The stable isotope contents of groundwater in the alluvial fans, plains, and rivers were similar, suggesting a close relationship between rivers and groundwater. As a result of evaporation, the concentration of δ18O and δ2H increases in shallow groundwater in some wetland areas. No obvious isotope exchange was observed in groundwater.
3.3. Hydrogeochemical Processes Based on Ionic Ratios
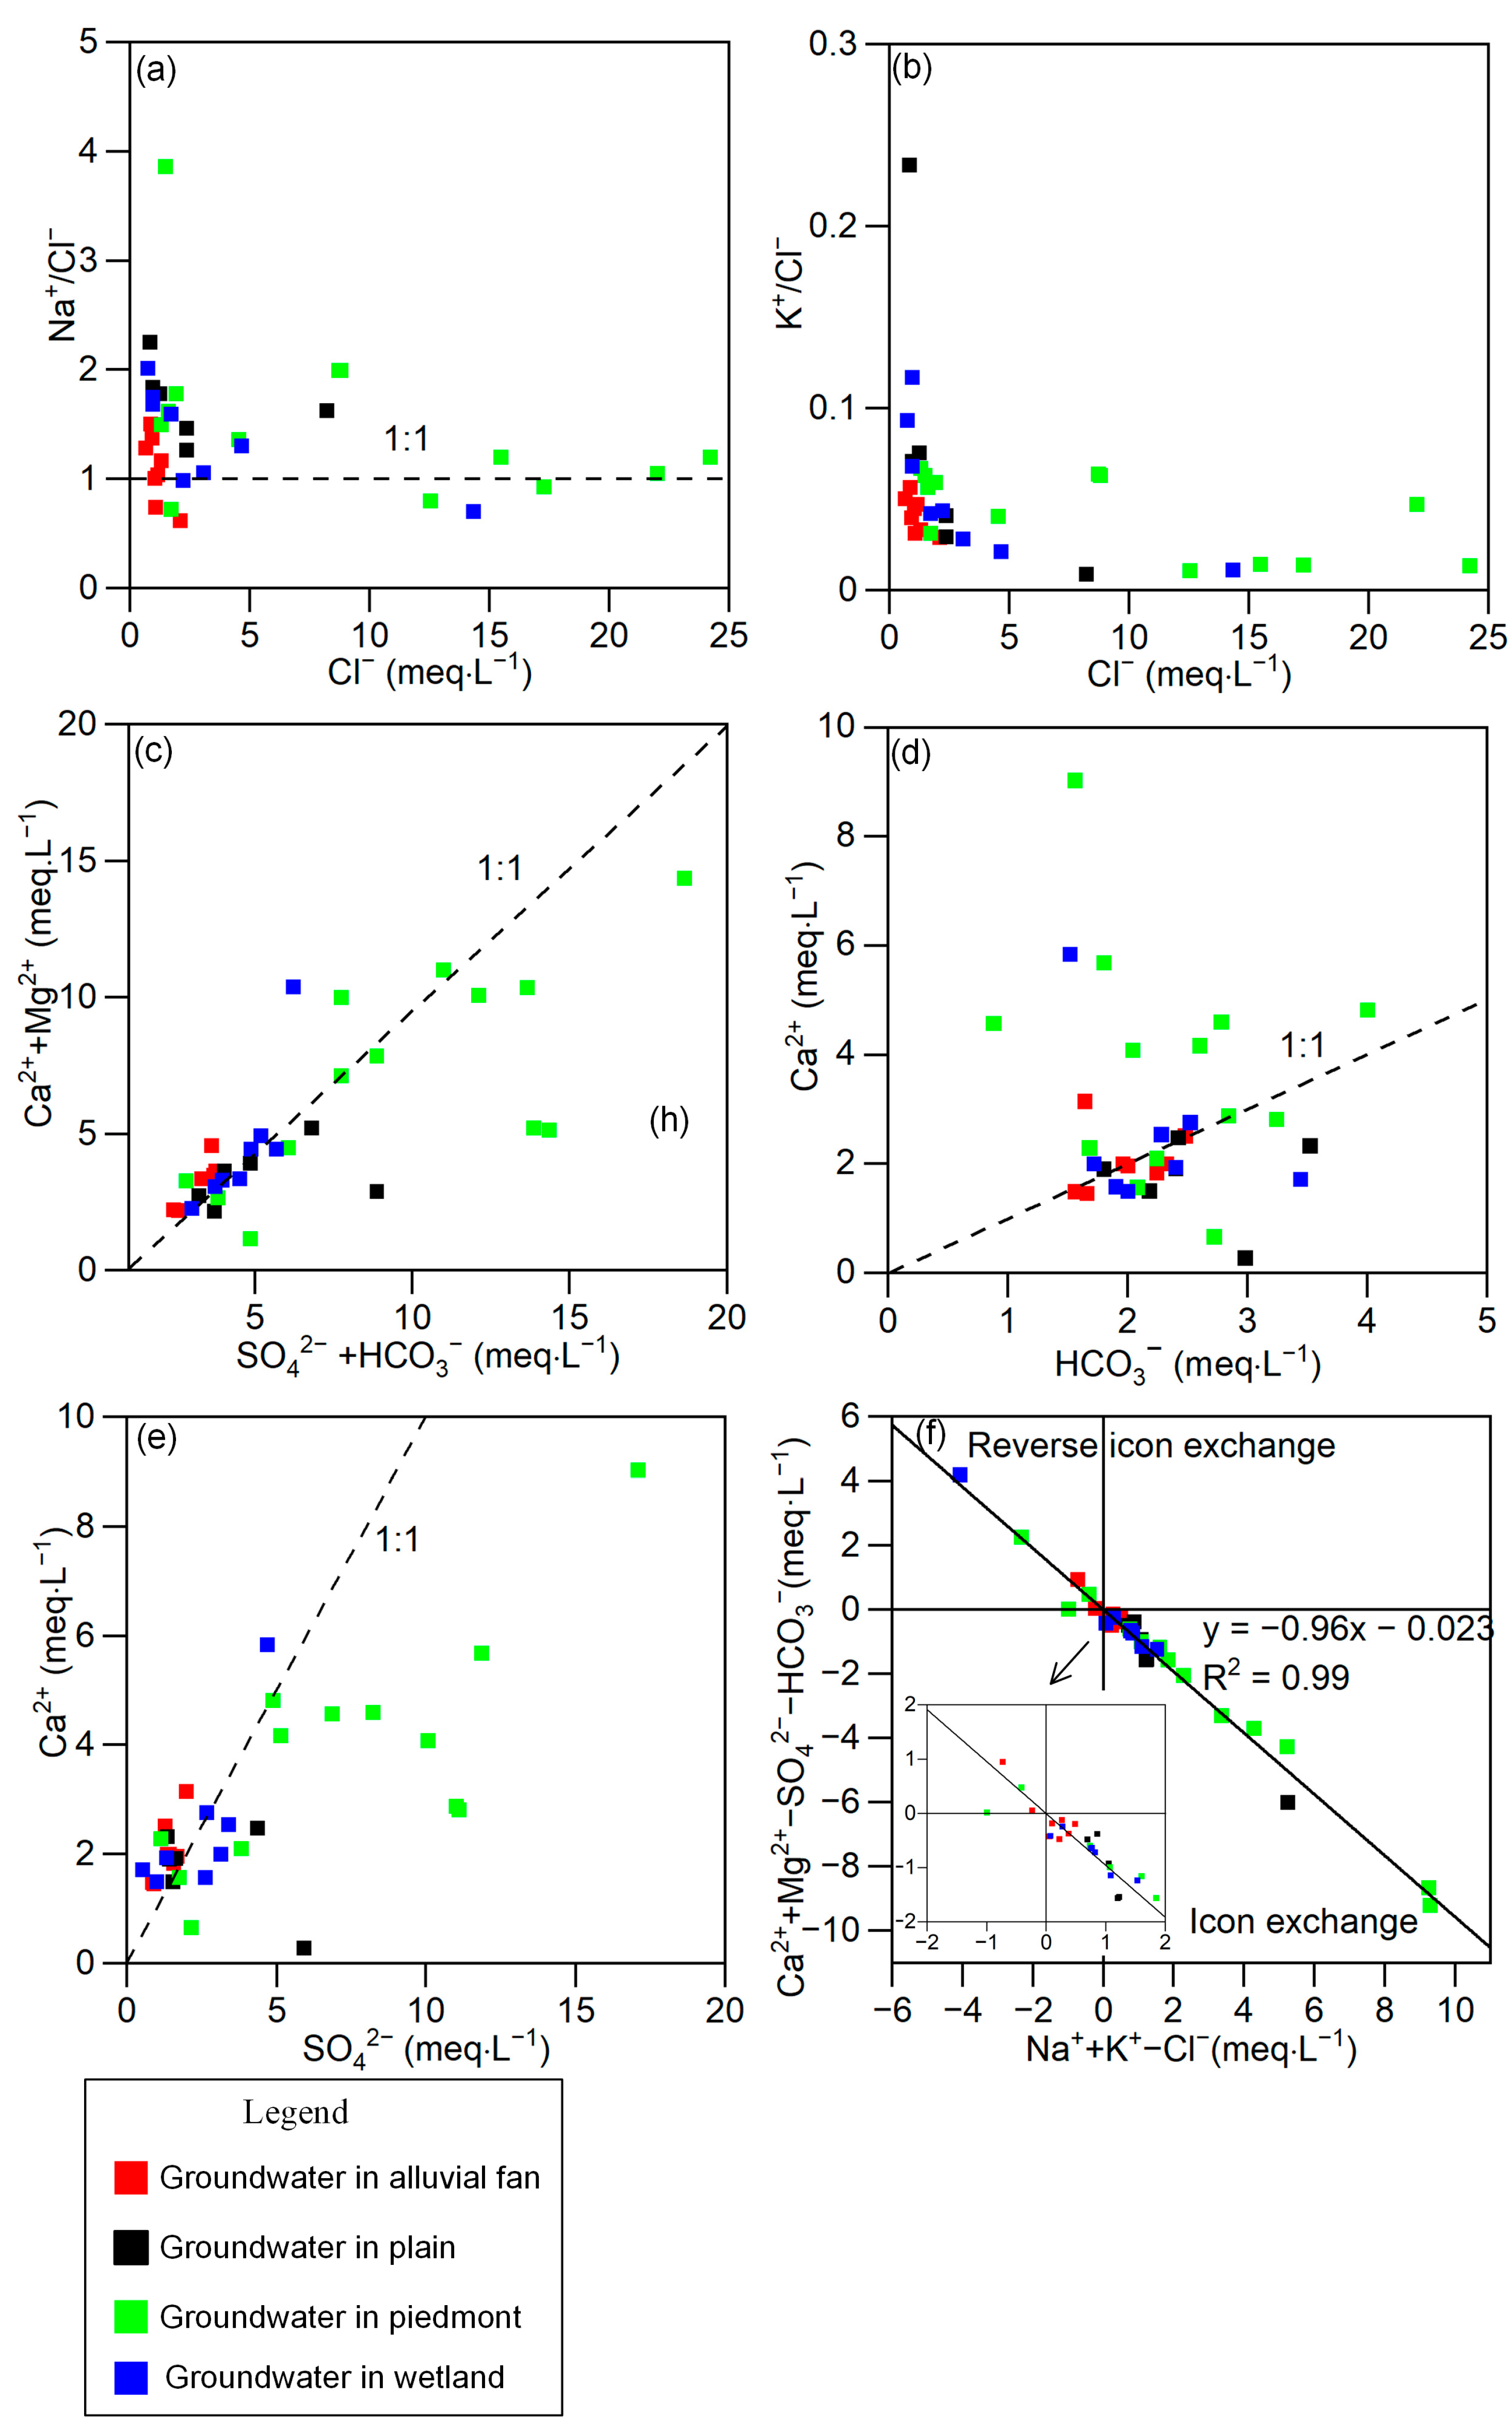
The 1:1 line in the plot of Na+ vs. Cl− represents the potential dissolution line of halite (Figure 6a). A few samples from the piedmont and wetland were located near the line, indicating that Na+ was mainly changed by geochemical processes in other regions. The slope of the regression line in the plot of Na+ + K+ − Cl− vs. Ca2+ + Mg2+ − SO42− − HCO3− is −0.96 (Figure 6f), suggesting that the cation exchange plays an important role in groundwater chemistry [14]. Particularly in piedmonts and wetlands, Ca2+ in the groundwater is largely exchanged for Na+ absorbed on the mineral surface [40,41]. However, the distribution of low- and moderate-salinity samples from the alluvial fan and plain show a poor correlation, as shown in Figure 6f, demonstrating that Na+ mainly originates from rock weathering. In the alluvial fan with the lowest TDS, silicate-incongruent weathering with a long reaction time was more likely to contribute to the Na+ of the groundwater (Equation (1)). In addition to silicate weathering, congruent dissolution of mirabilite (Na2SO4) also occurred in the plain. During the dissolution of mirabilite (Equation (2)), Na+ and SO42− in the groundwater increased, which promoted the precipitation of other sulfates or cation exchange to form high Na/Ca-type groundwater, such as G14. The plot of K+ vs. Cl− showed that the concentration of K+ in the alluvial fan, plain, and partial wetlands exhibited an upward trend (Figure 6b). However, the correlation between K+ and Cl− in groundwater is weak (regression equation: y = 0.021x + 0.0494, R2 = 0.45), and the content of K+ is higher than that of aerosols [7], indicating that the increased K in groundwater in the basin comes from the dissolution of silicates (e.g., potassium feldspar − Equation (3) and biotite − Equation (4)) rather than sylvite.
2NaAlSi3O8 + 2H2CO3 + 9H2O = Al2Si2O5(OH)4 + 2Na+ + 2HCO3− + 4H4SiO4
Na2SO4 = 2Na+ + SO42−
2KAlSi3O8 + 2H2CO3 + 9H2O = Al2Si2O5(OH)4 + 2K+ + 2HCO3− + 4H4SiO4
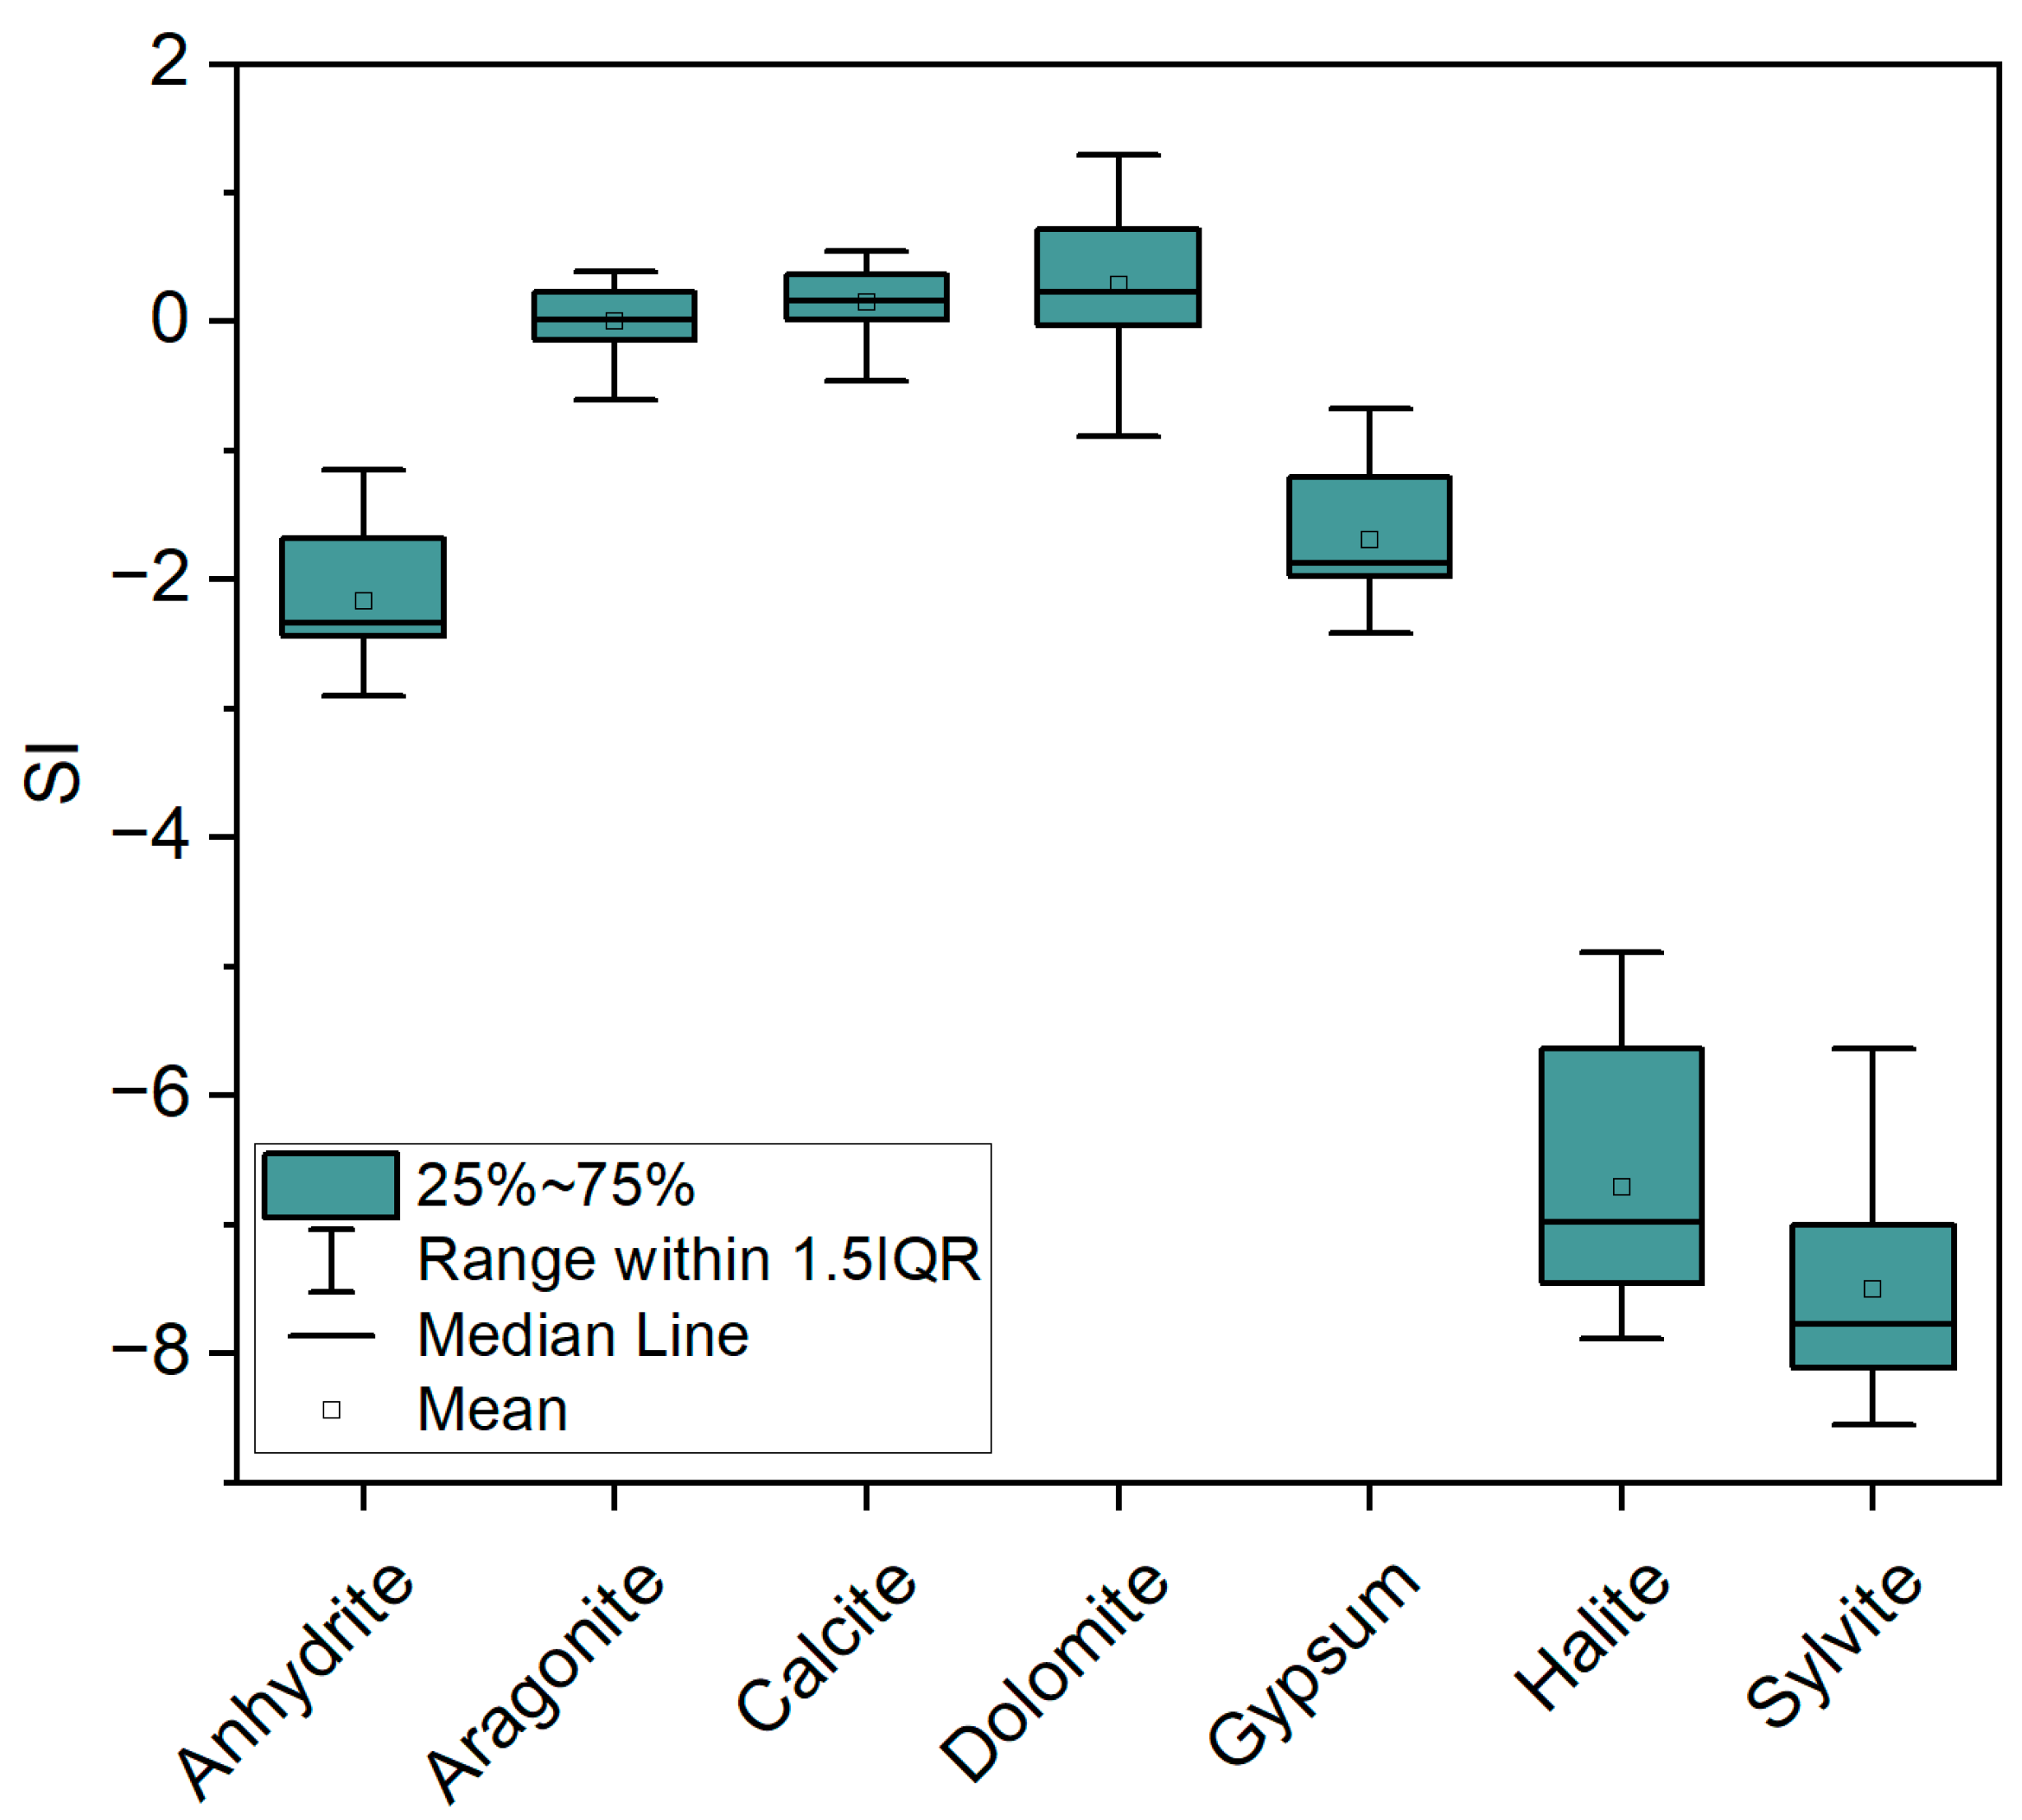
The distribution of samples near the 1:1 line in Figure 6c indicates that the Ca2+, Mg2+, HCO3−, and SO42− are derived from the simple dissolution of calcite, dolomite, and gypsum. When the sample is located below the line, it indicates silicate dissolution or cation exchange. When it is above the line, it indicates the dissolution of carbonates and sulfates or an inverse cation exchange process [42,43,44]. The groundwater of the alluvial fan was situated above the 1:1 line (Figure 6c), and the equivalent ratio of Ca2+/HCO3− was close to 1:1 (Figure 6d), indicating that calcite was the main dissolved mineral in this area. Similarly, the weathering of calcite, dolomite, and gypsum occurred in the plains, piedmonts, and wetlands because some of the samples from these zones were close to the 1:1 line in Figure 6d,e. Groundwater in the entire basin is in equilibrium with calcite, aragonite, and dolomite (Figure 7), which also proves that carbonate is an important source of Ca2+ and Mg2+ in groundwater. As mentioned above, mirabilite dissolution and the cation exchange process both lead to a decrease in Ca2+ + Mg2+; therefore, some samples in the plain, piedmont, and wetland are distributed in the lower right of the middle line in Figure 6c.
3.4. Multivariate Statistical Analyses
3.4.1. Principle Component Analysis
PCA is used for a dataset when the KMO value is greater than 0.5, and the significance of Bartlett’s test is 0.00 [45]. Table 3 summarizes the results of the PCA, including the total variance explanation and the rotated component matrix. Two main factors with eigenvalues larger than 1 explained 90.98% of the variance in the total dataset, implying that few mechanisms affected the hydrochemical types in the Sugan Lake Basin. Factor 1 explains 69.65% of the total variance, and the loadings for Mg2+, Na+, K+, HCO3−, SO42− and Cl− are considerable. The loadings reflect the process of cation exchange and water-rock interactions dominated by carbonate, silicate, and sulfate dissolution during groundwater evolution. The variance contribution of Factor 2 was 23.02%, with positive loadings for Ca2+, NO3− and negative loadings for HCO3−. Factor 2 reflects the impact of the biological nitrogen conversion process, which results in a decrease in the alkalinity of groundwater.
3.4.2. Hierarchical Cluster Analysis
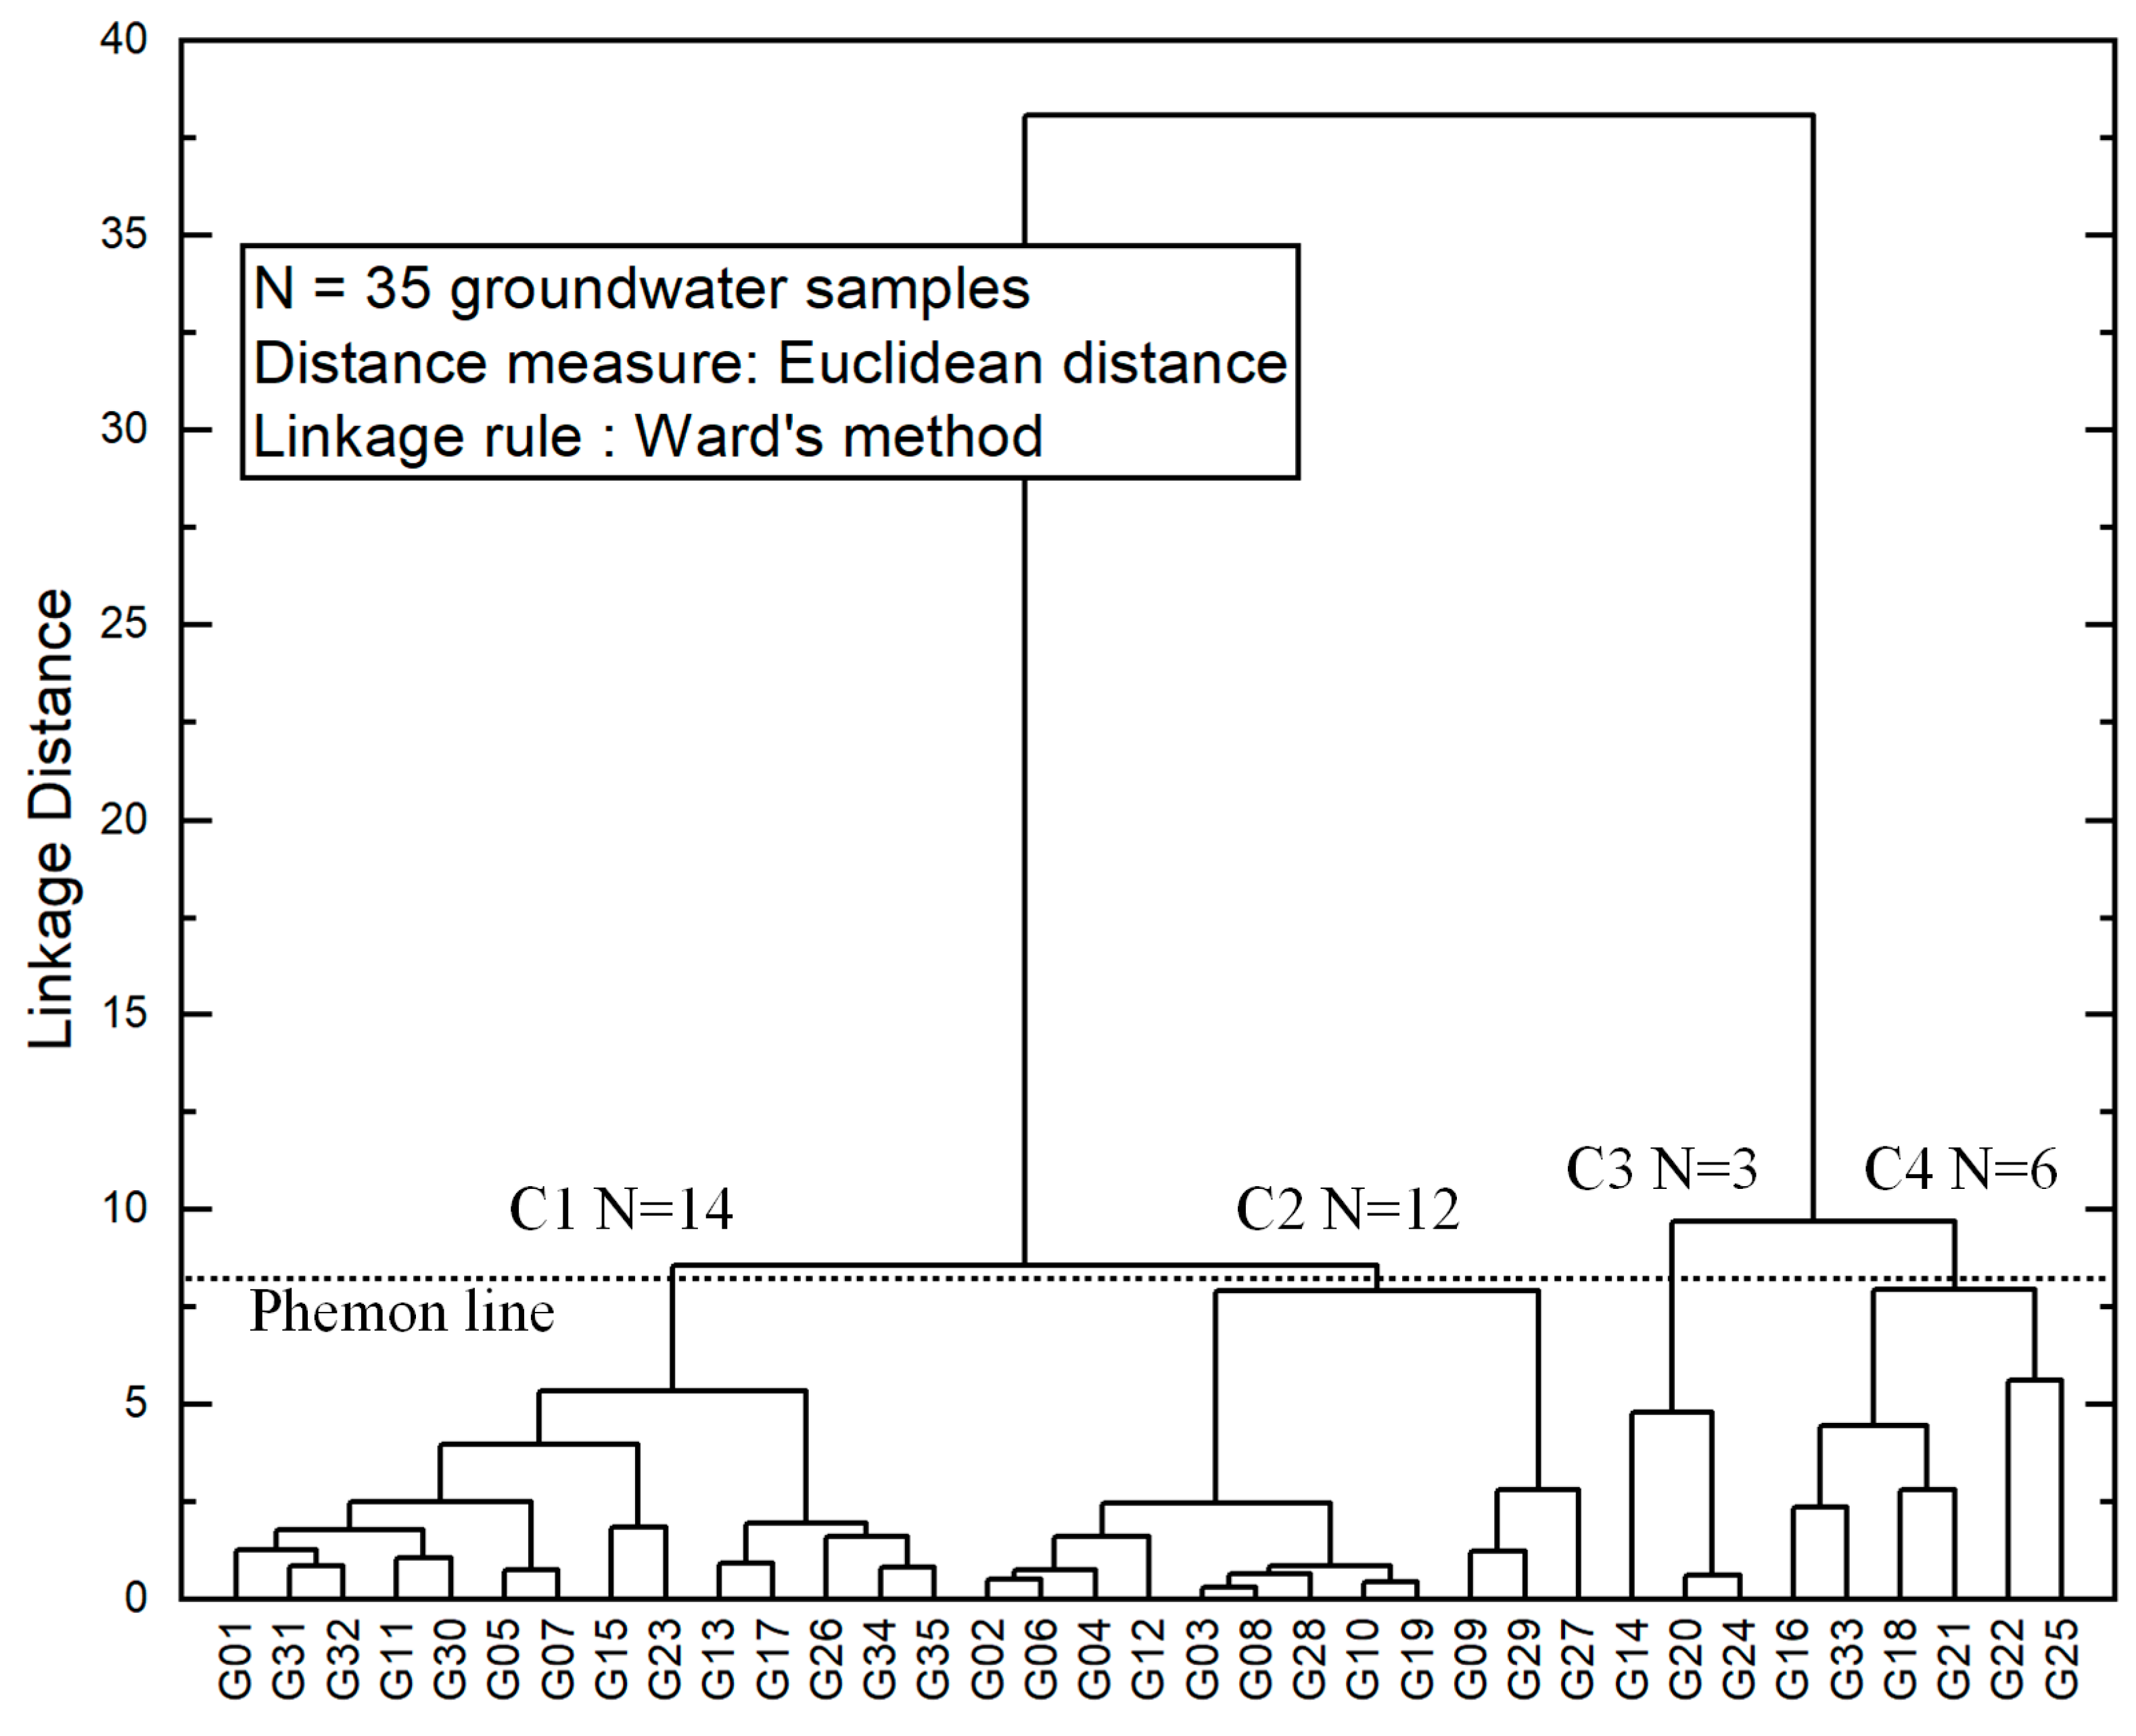
In this study, semi-objective cluster classification [46], which used a visual method for the linkage distance of samples in the dendrogram was applied (Figure 8), and the number of clusters was adjusted by moving the phenon line position up or down. During this process, it is important to maintain a distinct difference between clusters without overclassification. The phenon lines were set at a linkage distance of approximately 8; thus, the groundwater samples were divided into four clusters: C1–C4. The distribution of each cluster sample is shown in Figure 9.
The linkage distances of the dendrogram indicate the similarity levels between clusters. C1 and C2 were linked at low linkage distances and were distributed in alluvial fans, plains, and wetlands. Groundwater types C1 and C2 showed multi-ion proportion equilibrium types, such as HCO3 · SO4 · Cl–Ca and HCO · SO4–Ca · Na, with moderate and low TDS. The groundwater type has similar characteristics to river water, indicating that surface water-groundwater interactions have a significant impact on groundwater hydrochemistry. C3 and C4 were highly similar and distributed in the piedmont zone or the junction between the piedmont and wetland with high salinity. Because the groundwater depths in the piedmont are all greater than the maximum evaporation depth, the salt enrichment phenomenon of C3 and C4 indicates that the water-rock interaction is the dominant factor affecting the hydrochemical characteristics. The samples from C3 showed significant enrichment in Na+ and SO42−, which was attributed to the geochemical process of mirabilite dissolution. The samples of C4 are the groundwater type of Cl · SO4–Na, which is usually formed by the process of multi-mineral dissolution and cation exchange.
4. Discussion
4.1. Hydrochemistry Evolution of Surface Water
The results of δ2H and δ18O show that rivers originate mainly from meteoric water, including precipitation and glacier-snow meltwater. Underground runoff in mountainous regions formed by the infiltration of glacier-snow meltwater and precipitation eventually flows into the river owing to the steep terrain of the valley. In this process, the TDS and Ca2+ concentrations in the water increase, controlled by evaporation and carbonate dissolution [47]. Thus, all river samples are located in the “Rock weathering dominance” range of the Gibbs diagram (Figure 3), indicating that groundwater contributes a bigger amount in river runoff than direct meteoric water recharge.
The ion concentrations in the middle and upper reaches of the main watercourse are consistent; however, differences exist between the reaches near the Nuhutu Wetland. The values of Na+/(Na+ + Ca2+) and Cl−/(Cl− + HCO3−) are slightly increased, which is reflected in Figure 3 as the extension of the surface water towards the right or upper-right part of the diagram along the flow path. Infiltration of limited rainfall cannot effectively form surface water flow because the surface soil of alluvial fans and plains is dry with high vertical permeability, and most rainfall evaporates before reaching the aquifer [14,48]. This indicates that rainwater with high ratios of Na+/(Na+ + Ca2+) and Cl−/(Cl− + HCO3−) was not the source of increased Na+ and Cl− in the middle reach [31]. The δ2H and δ18O concentrations show a strong correlation between surface water and groundwater in the middle reach (Figure 5), revealing that groundwater supplies the river in various reaches. Specifically, the increases in TDS and Na+ in SW14 and SW15 indicate that evaporite dissolution influenced groundwater input [49]. However, the only increase in Na+ in SW9 suggests that surface water is more likely to be formed by groundwater that passes through strata containing silicates and carbonates [50]. Figure 7 shows that the groundwater of the Sugan Lake Basin was in equilibrium with carbonate. Due to strong evaporation conditions, the evaporation-crystallization process of CaCO3 likely occurs after groundwater overflows into surface water. This process also leads to the increases in Na+/(Na+ + Ca2+) and Cl−/(Cl− + HCO3−) with the decreases in Ca+ and HCO3− [38]. Therefore, the driving factors of the hydrochemical characteristics of surface water are evaporation and surface water-groundwater interactions.
The enriched δ2H and δ18O of surface water in wetlands indicate that evaporation plays an important part in hydrochemistry (Figure 5). In the lowlands of arid basins, the high evaporation from shallow groundwater and open water leads to salinity accumulation in groundwater and surface water [51]. Inland lakes, especially, lose water but leave behind the salinity brought by rivers and groundwater due to strong evaporation conditions, resulting in numerous salt lakes [17,51,52]. Nevertheless, groundwater seeps form many streams in wetlands, and their hydrochemistry is not only based on the chemical components of groundwater but is also related to connectivity and the saline-alkali soil distribution [53]. Due to the significant annual variance of river runoff in arid basins, the salinity and chemical composition of surface water and groundwater in the lowlands change seasonally [54]. The increase in river infiltration reduces the water salinity in the downstream basin [55]. Thus, in the core area of the wetland, the TDS of the sample can be the same as that of the upper river (TDS < 300 mg/L, HCO3–Ca · Na type), for example, samples from SW6, whereas the TDS of adjacent surface water bodies is greater than 2000 mg/L (Cl · SO4–Na type), suggesting that river flooding during the rainy season is a considerable source for wetlands and lakes. The CVs of all components in the surface water were greater than those in the groundwater (Table 1 and Table 2). However, the water salinity of the Sugan Lake Basin is lower than that of the adjacent basins [17,54,55,56]. The current data are insufficient to explain whether the phenomenon is a result of the inherent water cycle or climate change.
4.2. Mechanisms Controlling Hydrochemistry of Groundwater
In the alluvial fan and plain zones, the congruent and incongruent dissolution of minerals is the main source of groundwater chemical composition. The available data show that the incongruent dissolved minerals are aragonite, calcite, dolomite, and feldspar, whereas the congruent dissolved mineral is mirabilite. Mineral dissolution increased the total dissolved solids (TDS) and Na+ concentrations and decreased the Ca2+ + Mg2+ concentration along the flow path. Meanwhile, HCO3− is the majority anion through the process (Figure 6). There are two explanations for the small distribution range of the Na–SO4 type groundwater in the plains zone. First, river infiltration downstream dilutes the ion concentration of the groundwater. Second, the uplift near the Nuhutu Wetland blocks the groundwater flow downstream.
In the piedmont zone, aquifers are composed of poorly sorted diluvial and glacial sediments with low permeability (Figure 1); thus, groundwater flows slowly. Groundwater salinity accumulates continuously during prolonged water–rock interactions. In addition to the dissolved minerals in alluvial fans and plains, the saturation coefficients of gypsum, halite, and sylvite were higher in the piedmont. However, they were unsaturated in groundwater, indicating that gypsum, halite, and sylvite were scarce in the strata. The piedmont sediments revealed by the boreholes mainly contained metasandstone, gneiss, and granite and were filled with sand and silt. Thus, cation exchange is the other controlling mechanism in the piedmont zone because of abundant clay mineral resources and sufficient reaction time.
In the eastern and middle parts of the Sugan Lake Wetland, G28, G29, and G30 are the HCO3–Ca · Mg · Na type groundwater with TDS less than 300 mg/L, which is the same as the river water in the middle reaches. In the marginal area of the wetland near the piedmont (G31–G35), the hydrochemical type of groundwater varied greatly, and the TDS was lower than that of the upstream piedmont groundwater. Therefore, the hydrochemistry is mainly controlled by the mixing of lateral runoff and river infiltration. The average concentration of NO3− in the wetland samples was significantly higher than that in other regions, which is consistent with the PCA results. Considering the strict ecological protection measures implemented in recent years, the increased NO3− in wetland areas is more likely from biological sources than from agricultural activities, as previously thought [27].
Mineral dissolution and cation exchange are the two important sources of groundwater in the Sugan Lake Basin. Water-rock interactions not only provide dissolved substances in groundwater but also leave marks in different flow paths due to aquifers in different regions with various physical and chemical properties. However, the HCA results revealed that river infiltration is also a critical factor affecting the hydrochemical characteristics of groundwater, especially in the Sugan Lake Wetland. It is the end of the groundwater flow path and the groundwater depths of sampling sites ranged from 0.70 m to 5.05 m. The isotopic results and hydrochemistry of the wetland groundwater showed that the groundwater was almost unaffected by geochemical processes and intense evaporation. This indicates that, compared with neighboring inland basins [14,56], the regeneration rate of groundwater in the wetland is faster; therefore, salts and isotopes cannot accumulate effectively. Due to limited rainfall, it could be confirmed that river flooding significantly affects the hydrochemistry characteristics of groundwater, and the level of impact depends on the distance from the river.
Hydrogen and oxygen isotope results revealed two sources of meteoric water in the aquifers of the basin. Combined with the chemical results, it can be inferred that there are two main groundwater flow patterns in the Sugan Lake Basin. The first is that groundwater originates from the mountainous area of the eastern basin at a high altitude and is recharged by modern meteoric precipitation, including river water and glacial meltwater. The groundwater flows from east to west and mutually transforms into surface water; eventually, both feed into inland lakes. Secondly, the groundwater in the piedmont is mostly recharged by ancient precipitation and slowly flows down along the topographic slope from the mountains around the basin. Groundwater hydrochemistry in Pattern 1 is mainly affected by surface water infiltration, although water-rock interaction is a dominant factor of groundwater hydrochemistry in Pattern 2. The groundwater types in Pattern 1 are mainly HCO3–Ca · Mg · Na and HCO3 · SO4 · Cl–Ca, whereas the major water type in Pattern 2 is Cl · SO4–Na.
4.3. Groundwater Quality and Water Resource Development Potential
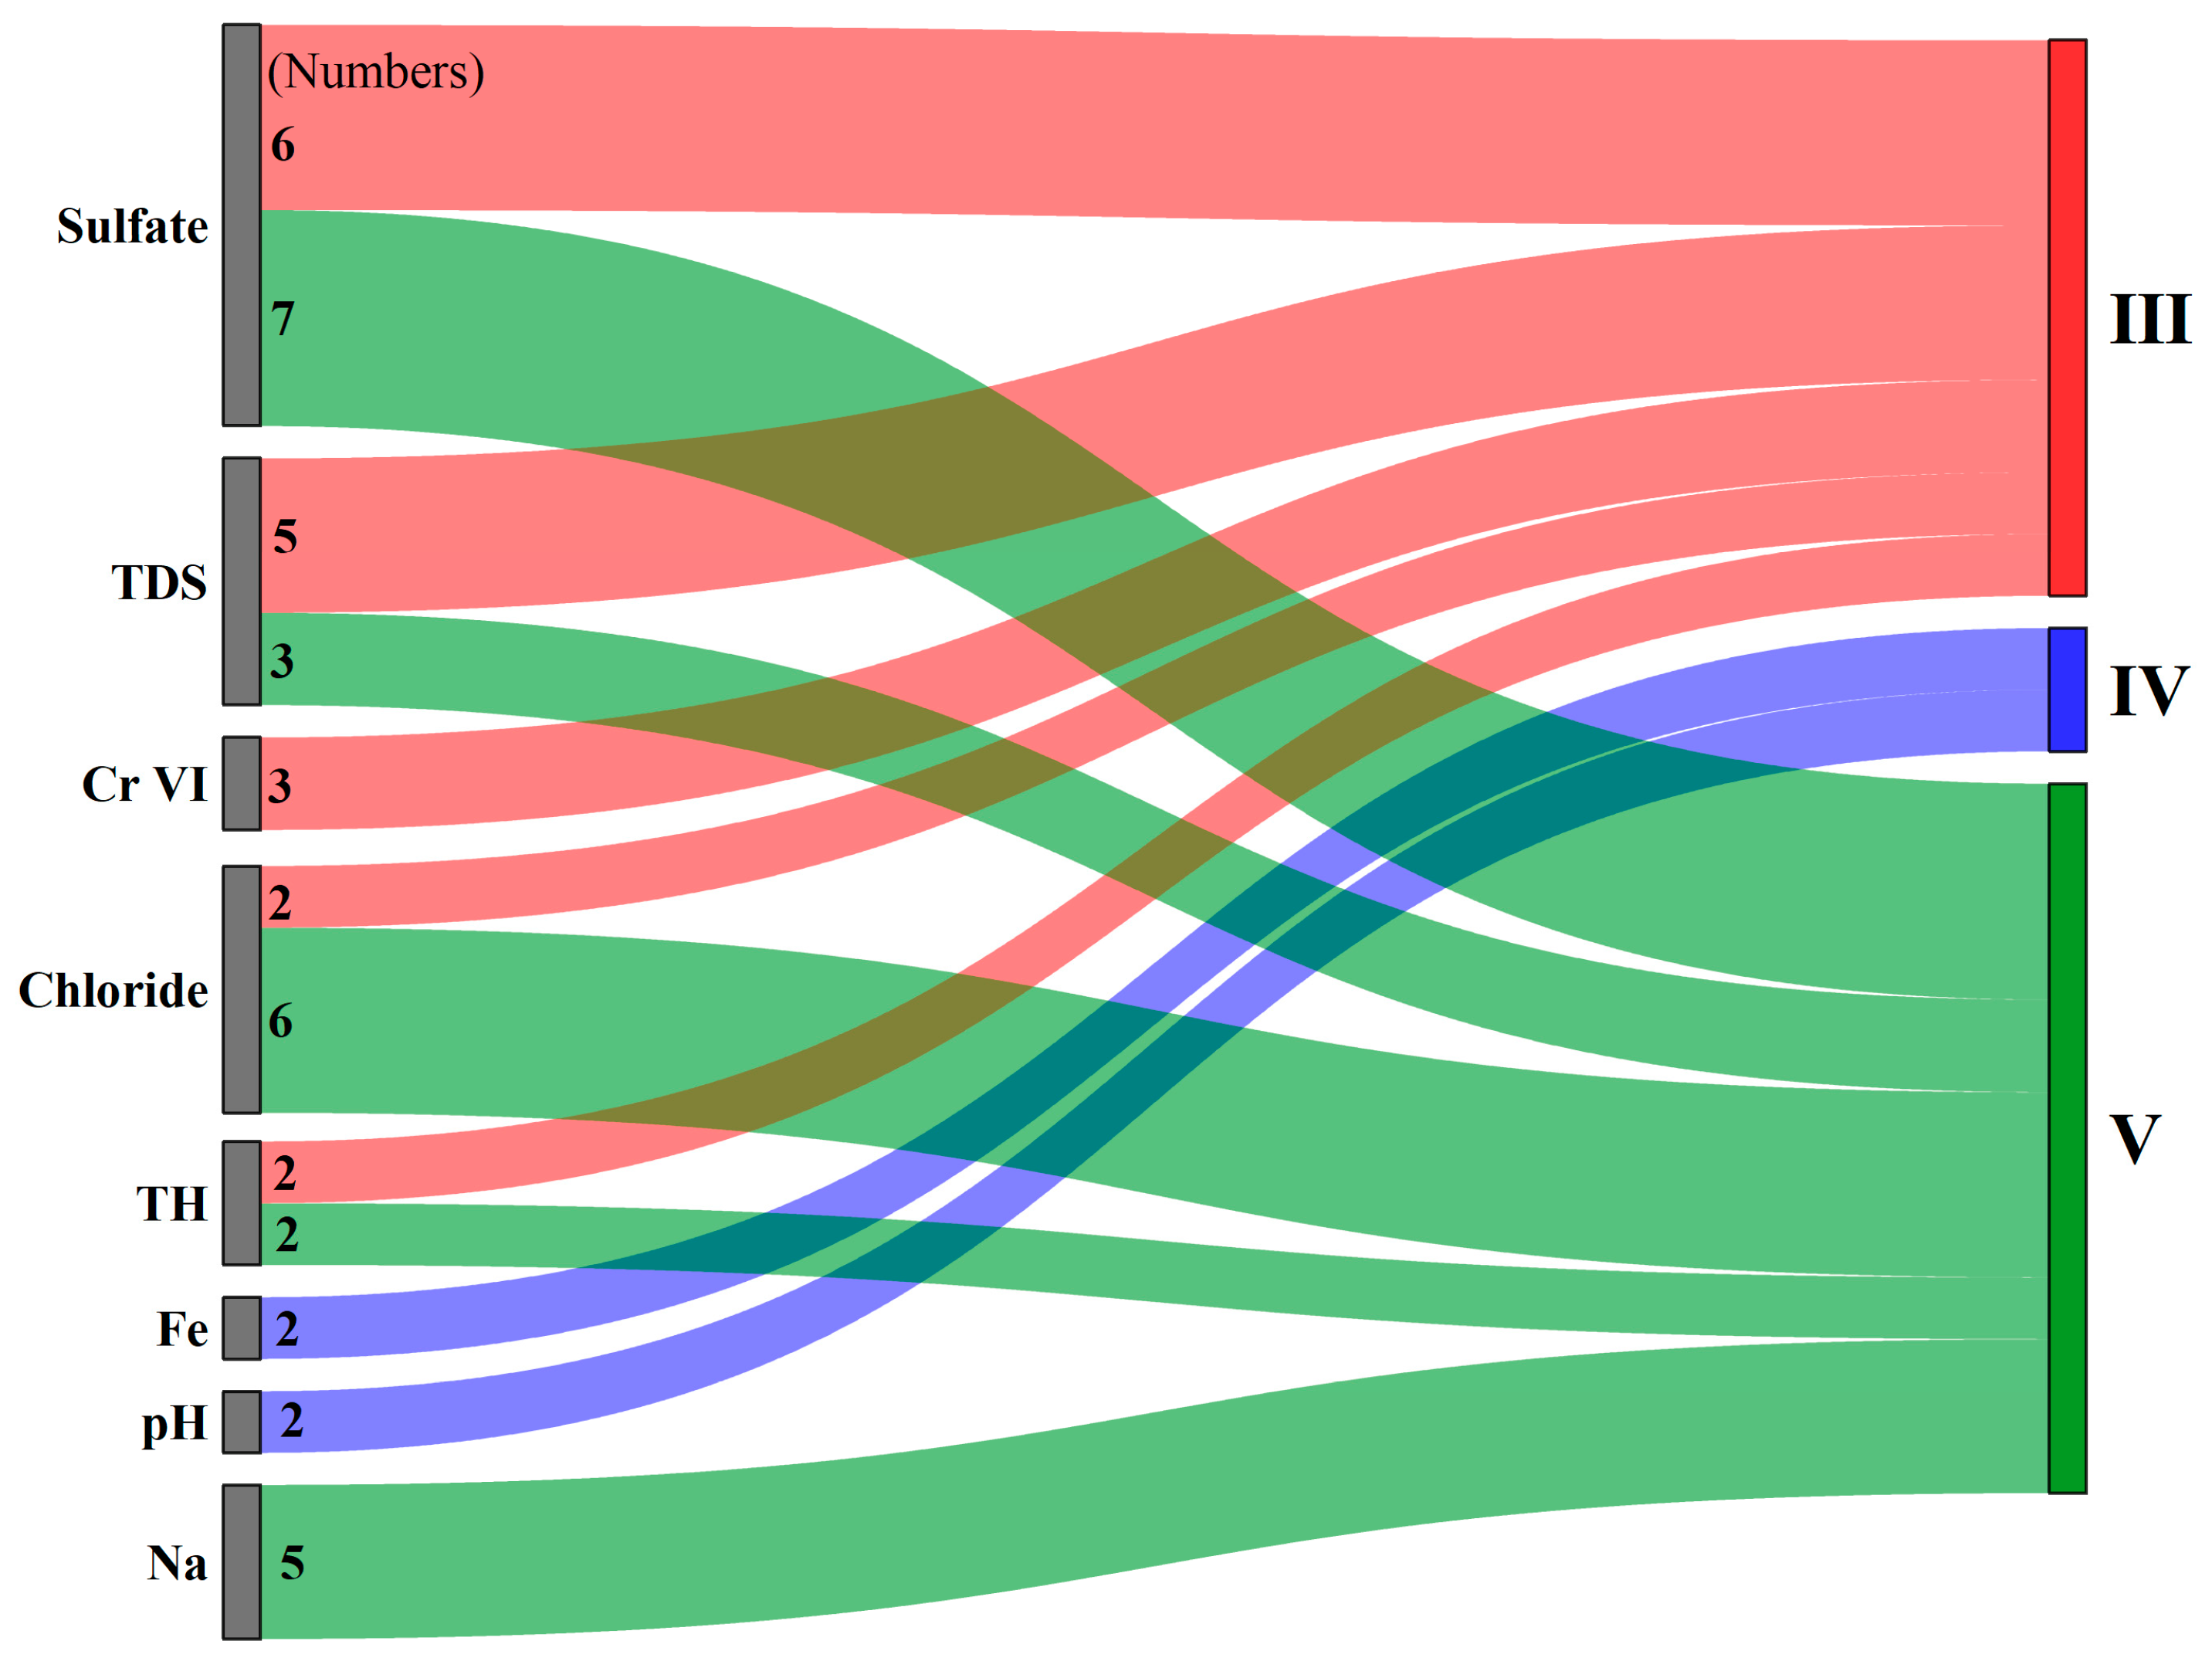
Groundwater quality evaluation is the basis for groundwater resource development and guides its utilization [57]. In this study, the Chinese groundwater quality standard “GB/T 14848-2017” was selected [58], and a single-factor evaluation method was used in accordance with the standard. All 20 evaluation factors and the evaluation results of the groundwater quality are shown in Table 4. Class I–V groundwater samples accounted for 2.86%, 25.71%, 34.29%, 14.29%, and 22.86%, respectively. The decisive factors of the single-factor evaluation for each sample were accumulated and presented in Figure 10. It illustrates that sulfate and chloride at the highest frequency had the greatest impact on the groundwater quality in Class III–V. The numbers of Na, chloride, TDS, and TH appear more frequently in Class Ⅴ; Fe and Cr Ⅵ are critical factors for groundwater evaluation in Class III and IV. In general, more than half of the groundwater is suitable for domestic, agricultural, and industrial purposes, and high-quality groundwater is widely distributed in alluvial fans, plains, and wetlands. Most of the groundwater quality in the piedmont zone is poor, especially in the western piedmont of Algin Mountain and Saishiteng Mountain, which have the worst groundwater quality.
The domestic water demand within the Sugan Lake Basin is low and concentrated in the Sugan Lake wetland and adjacent roads. Owing to the seasonal nature of the downstream river, groundwater extraction from wetlands or plains is a reliable way to meet the water demand. The groundwater in the eastern wetland and plain was of good quality and regeneration capacity. However, groundwater exploitation in wetlands lowers groundwater levels because of the poor storage capacity of aquifers. Groundwater pollution is caused by the infiltration of surface water and the leaching of salts from surface saline-alkali soil. Thus, groundwater in the plain zone is more suitable for exploitation, which hardly affects the groundwater evolution process. The diversion of high-quality surface water resources in the upper reaches of rivers is more effective for large-scale development. Many studies have shown that the exploitation and utilization of river water in the upper reaches of arid basins may lead to a significant reduction or even disappearance of downstream river flow, thus causing ecological degradation. It is inferred that river flooding is the mechanism controlling the surface water and groundwater hydrochemistry in wetlands, which noticeably affects oasis vegetation growth. Therefore, quantifying the effects of seasonal stream infiltration on soil and shallow groundwater salinity is a key issue at the regional scale, as well as the feasibility of large-scale development and its ecological response requires further study.
5. Conclusions
In this study, detailed chemical compositions and stable hydrogen and oxygen isotopic data of groundwater and surface water were used to analyze groundwater sources and hydrochemical characteristics in different regions of the Sugan Lake Basin. The control mechanisms of groundwater hydrochemistry were identified. Finally, the groundwater quality and its potential for water resource development were evaluated. The main conclusions are as follows.
- The groundwater in the alluvial fan and plain zone and river water originates from the eastern mountains of the Sugan Lake Basin, which are mainly recharged by modern meteoric precipitation. During river flow from east to west, groundwater is closely connected to the river. The stable isotopes and chemical compositions of the groundwater near the river channel were the same as those of the river water, even in the lowest part of the basin. In this flow pattern, the surface water–groundwater interaction is the control mechanism for the surface water and groundwater hydrochemistry.
- Groundwater in the piedmont is mainly recharged by ancient meteoric precipitation that formed in a colder environment. The groundwater flow rate in this region is relatively low. Water–rock interaction is the control mechanism of the chemical composition of groundwater, including mineral weathering and cation exchange processes. Although the results showed that silicate and evaporite minerals, such as mirabilite and gypsum, are the sources of ions in groundwater, the carbonate in groundwater is in equilibrium, whereas sulfate and chloride are unsaturated in all groundwater samples. Thus, carbonate is the dominant mineral in regional rock weathering processes.
- Compared to the nearby arid inland watershed, the evolution of the hydrochemical characteristics and salinity of the surface and groundwater are atypical. The salinity of shallow groundwater in the Sugan Lake Basin is relatively low, especially in the endorheic lake wetlands. The spatial variation in the chemical characteristics of surface water was greater than that of groundwater. A difference exists in the high-salinity stream and closed inland lakes in the wetland zone caused by intense evaporation, whereas the variation in river water samples is inconspicuous. In general, it can be concluded that natural river flooding in summer causes the water circulation rate in the Sugan Lake Basin to be faster than that in other basins with intensive human activities. Controlling the hydrochemical regime and contours of water salinity in the basin is of great significance.
- Class I to Class V groundwater samples accounted for 2.86%, 25.71%, 34.29%, 14.29%, and 22.86%, respectively. Class I and Class II groundwater were basically the same as the samples of C2 in the HCA, which were distributed near river channels. The poorest-quality groundwater is in C3 and C4, which are located in the Piedmont zone. Sulfate, TH, and nitrite in most of the groundwater samples exceeded the upper limit, leading to very little Class II groundwater, while sulfate, chloride, and Na were dominant indicators in poor-quality groundwater. Only a few heavy metals and trace elements concentrations of samples exceeded the upper limit of Class II standards; they are Fe, Hg, and Cr VI.
This study enhances the understanding of groundwater hydrochemistry by showing that the hydrochemical regime is highly sensitive to natural river flow without disturbing human activities. The groundwater quality was also evaluated to develop a rational and sustainable water use plan. Thus, this is a useful case study for further research on surface water–groundwater interactions, ecology, and the influence of climate change.
Author Contributions
Conceptualization, Z.Y. and L.H.; methodology, Z.Y.; software, Z.Y.; investigation, H.M., Z.Y., and L.H.; data curation, H.M.; writing—original draft preparation, Z.Y.; writing—review and editing, L.H. and W.Z.; visualization, Z.Y.; supervision, L.H. All authors have read and agreed to the published version of the manuscript.
Funding
This research was funded by the National Natural Science Foundation of China, grant number No. U2167211 and 41831283.
Institutional Review Board Statement
Not applicable.
Informed Consent Statement
Not applicable.
Data Availability Statement
The data presented in this study are available on request from the corresponding author.
Acknowledgments
We thank the Institute of Geo-Environmental Monitoring in the Gansu Province of China and Tsinghua University for their help and support with fundamental data.
Conflicts of Interest
The authors declare no conflict of interest.
References
- Wada, Y.; van Beek, L.P.H.; van Kempen, C.M.; Reckman, J.; Vasak, S.; Bierkens, M.F.P. Global depletion of groundwater resources. Geophys. Res. Lett. 2010, 37, L20402. [Google Scholar] [CrossRef]
- Liu, J.; Yang, H.; Gosling, S.N.; Kummu, M.; Flörke, M.; Pfister, S.; Hanasaki, N.; Wada, Y.; Zhang, X.; Zheng, C. Water scarcity assessments in the past, present, and future. Earth’s Future 2017, 5, 545–559. [Google Scholar] [CrossRef] [PubMed]
- Yin, X.; Feng, Q.; Zheng, X.; Wu, X.; Zhu, M.; Sun, F.; Li, Y. Assessing the impacts of irrigated agriculture on hydrological regimes in an oasis-desert system. J. Hydrol. 2021, 594, 125976. [Google Scholar] [CrossRef]
- Wang, Z.; Wang, W.; Zhang, Z.; Hou, X.; Zhitong, M.; Chen, B. River-groundwater interaction affected species composition and diversity perpendicular to a regulated river in an arid riparian zone. Glob. Ecol. Conserv. 2021, 27, e01595. [Google Scholar] [CrossRef]
- Wang, Z.; Wang, W.; Zhang, Z.; Hou, X.; Duan, L.; Yao, D. Assessment of the effect of water-table depth on riparian vegetation along the middle and lower reaches of the manasi river, northwest China. Hydrogeol. J. 2021, 29, 579–589. [Google Scholar] [CrossRef]
- Li, D.; Li, X.; He, X.; Yang, G.; Du, Y.; Li, X. Groundwater dynamic characteristics with the ecological threshold in the northwest China oasis. Sustainability 2022, 14, 5390. [Google Scholar] [CrossRef]
- Arthington, A.H.; Balcombe, S.R. Extreme flow variability and the ‘boom and bust’ ecology of fish in arid-zone floodplain rivers: A case history with implications for environmental flows, conservation and management. Ecohydrology 2011, 4, 708–720. [Google Scholar] [CrossRef]
- Zhang, W.; Zhu, G.; Qiu, D.; Liu, Y.; Sang, L.; Lin, X.; Ma, H.; Zhao, K.; Xu, Y. Effects of agricultural activities on hydrochemistry in the shiyang river basin, CHINA. Environ. Sci. Pollut. Res. 2022, 30, 12269–12282. [Google Scholar] [CrossRef]
- Liu, Z.; Feng, S.; Zhang, D.; Han, Y.; Cao, R. Effects of precipitation, irrigation, and exploitation on groundwater geochemical evolution in the people’s victory canal irrigation area, China. Appl. Water Sci. 2022, 13, 1. [Google Scholar] [CrossRef]
- Zhang, Z.; Jiang, X.; Wang, X.; Wan, L.; Wang, J. Why mixed groundwater at the outlet of open flowing wells in unconfined-aquifer basins can represent deep groundwater: Implications for sampling in long-screen wells. Hydrogeol. J. 2019, 27, 409–421. [Google Scholar] [CrossRef]
- Khanoranga; Khalid, S. An assessment of groundwater quality for irrigation and drinking purposes around brick kilns in three districts of balochistan province, pakistan, through water quality index and multivariate statistical approaches. J. Geochem. Explor. 2019, 197, 14–26. [Google Scholar] [CrossRef]
- Bouchez, C.; Cook, P.G.; Partington, D.; Simmons, C.T. Comparison of surface water-groundwater exchange fluxes derived from hydraulic and geochemical methods and a regional groundwater model. Water Resour. Res. 2021, 57, e2020WR029137. [Google Scholar] [CrossRef]
- Bussi, G.; Whitehead, P.G.; Gutiérrez-Cánovas, C.; Ledesma, J.L.J.; Ormerod, S.J.; Couture, R.-M. Modelling the effects of climate and land-use change on the hydrochemistry and ecology of the river wye (wales). Sci. Total Environ. 2018, 627, 733–743. [Google Scholar] [CrossRef]
- Xiao, Y.; Shao, J.; Frape, S.K.; Cui, Y.; Dang, X.; Wang, S.; Ji, Y. Groundwater origin, flow regime and geochemical evolution in arid endorheic watersheds: A case study from the qaidam basin, northwestern China. Hydrol. Earth Syst. Sci. 2018, 22, 4381–4400. [Google Scholar] [CrossRef]
- Lowenstein, T.K.; Risacher, F. Closed basin brine evolution and the influence of ca–cl inflow waters: Death valley and bristol dry lake california, qaidam basin, China, and salar de atacama, chile. Aquat. Geochem. 2009, 15, 71–94. [Google Scholar] [CrossRef]
- Cartwright, I.; Weaver, T.R.; Simmons, C.T.; Fifield, L.K.; Lawrence, C.R.; Chisari, R.; Varley, S. Physical hydrogeology and environmental isotopes to constrain the age, origins, and stability of a low-salinity groundwater lens formed by periodic river recharge: Murray basin, australia. J. Hydrol. 2010, 380, 203–221. [Google Scholar] [CrossRef]
- Munk, L.A.; Boutt, D.F.; Hynek, S.A.; Moran, B.J. Hydrogeochemical fluxes and processes contributing to the formation of lithium-enriched brines in a hyper-arid continental basin. Chem. Geol. 2018, 493, 37–57. [Google Scholar] [CrossRef]
- Petts, D.C.; Saso, J.K.; Diamond, L.W.; Aschwanden, L.; Al, T.A.; Jensen, M. The source and evolution of paleofluids responsible for secondary minerals in low-permeability ordovician limestones of the michigan basin. Appl. Geochem. 2017, 86, 121–137. [Google Scholar] [CrossRef]
- Guo, X.; Feng, Q.; Liu, W.; Li, Z.; Wen, X.; Si, J.; Xi, H.; Guo, R.; Jia, B. Stable isotopic and geochemical identification of groundwater evolution and recharge sources in the arid shule river basin of northwestern China. Hydrol. Process. 2015, 29, 4703–4718. [Google Scholar] [CrossRef]
- Wang, J.; Liang, X.; Liu, Y.; Jin, M.; Knappett, P.S.K.; Liu, Y. Hydrogeochemical evolution along groundwater flow paths in the manas river basin, northwest China. Groundwater 2019, 57, 575–589. [Google Scholar] [CrossRef]
- Wang, W.; Wang, Z.; Hou, R.; Guan, L.; Dang, Y.; Zhang, Z.; Wang, H.; Duan, L.; Wang, Z.F. Modes, hydrodynamic processes and ecological impacts exerted by river–groundwater transformation in junggar basin, China. Hydrogeol. J. 2018, 26, 1547–1557. [Google Scholar] [CrossRef]
- Wang, X.; Li, Z.; Jiang, C. Run-off analyses using isotopes and hydrochemistry in yushugou river basin, eastern tianshan mountains. J. Earth Syst. Sci. 2017, 126, 86. [Google Scholar] [CrossRef]
- Pan, Q.; Zhang, C.; Guo, S.; Sun, H.; Du, J.; Guo, P. An interval multi-objective fuzzy-interval credibility-constrained nonlinear programming model for balancing agricultural and ecological water management. J. Contam. Hydrol. 2022, 245, 103958. [Google Scholar] [CrossRef] [PubMed]
- Huang, F.; Ochoa, C.G.; Chen, X. Assessing environmental water requirement for groundwater-dependent vegetation in arid inland basins by combining the copula joint distribution function and the dual objective optimization: An application to the turpan basin, China. Sci. Total Environ. 2021, 799, 149323. [Google Scholar] [CrossRef] [PubMed]
- Yang, Z.; Hu, L.; Sun, K. The potential impacts of a water transfer project on the groundwater system in the sugan lake basin of China. Hydrogeol. J. 2021, 29, 1485–1499. [Google Scholar] [CrossRef]
- Zhang, X.; Zhang, C.; Feng, W.; Zhu, R.; Chen, Z.; Zhao, K.; Zhang, B. Geometry and control factors of distributive fluvial system around the sugan lake basin. Acta Geol. Sin. 2019, 93, 2947–2959. [Google Scholar]
- Xiang, J.; Zhou, J.; Yang, J.; Huang, M.; Feng, W.; Li, Q.; Xue, D.; Zhao, Y.; Zhu, G. Applying multivariate statistics for identification of groundwater chemistry and qualities in the sugan lake basin, northern qinghai-tibet plateau, China. J. Mt. Sci. 2020, 17, 448–463. [Google Scholar] [CrossRef]
- Huang, T.; Ma, B.; Pang, Z.; Li, Z.; Li, Z.; Long, Y. How does precipitation recharge groundwater in loess aquifers? Evidence from multiple environmental tracers. J. Hydrol. 2020, 583, 124532. [Google Scholar] [CrossRef]
- Vrzel, J.; Solomon, D.K.; Blažeka, Ž.; Ogrinc, N. The study of the interactions between groundwater and sava river water in the ljubljansko polje aquifer system (slovenia). J. Hydrol. 2018, 556, 384–396. [Google Scholar] [CrossRef]
- Yang, Q.; Mu, H.; Wang, H.; Ye, X.; Ma, H.; Martín, J.D. Quantitative evaluation of groundwater recharge and evaporation intensity with stable oxygen and hydrogen isotopes in a semi-arid region, northwest China. Hydrol. Process. 2018, 32, 1130–1136. [Google Scholar] [CrossRef]
- Gibbs, R.J. Mechanisms controlling world water chemistry. Science 1970, 170, 1088–1090. [Google Scholar] [CrossRef] [PubMed]
- Ma, J.; Ding, Z.; Edmunds, W.M.; Gates, J.B.; Huang, T. Limits to recharge of groundwater from tibetan plateau to the gobi desert, implications for water management in the mountain front. J. Hydrol. 2009, 364, 128–141. [Google Scholar] [CrossRef]
- Craig, H. Isotopic variations in meteoric waters. Science 1961, 133, 1702–1703. [Google Scholar] [CrossRef] [PubMed]
- Wang, J.; Liang, X.; Ma, B.; Liu, Y.; Jin, M.; Knappett, P.S.K.; Liu, Y. Using isotopes and hydrogeochemistry to characterize groundwater flow systems within intensively pumped aquifers in an arid inland basin, northwest China. J. Hydrol. 2021, 595, 126048. [Google Scholar] [CrossRef]
- Yang, Q.; Li, Z.; Ma, H.; Wang, L.; Martín, J.D. Identification of the hydrogeochemical processes and assessment of groundwater quality using classic integrated geochemical methods in the southeastern part of ordos basin, China. Environ. Pollut. 2016, 218, 879–888. [Google Scholar] [CrossRef]
- Pant, R.R.; Zhang, F.; Rehman, F.U.; Wang, G.; Ye, M.; Zeng, C.; Tang, H. Spatiotemporal variations of hydrogeochemistry and its controlling factors in the gandaki river basin, central himalaya nepal. Sci. Total Environ. 2018, 622–623, 770–782. [Google Scholar] [CrossRef]
- Castillo, J.L.U.; Leal, J.A.R.; Cruz, D.A.M.; Martínez, A.C.; Celestino, A.E.M. Identification of the dominant factors in groundwater recharge process, using multivariate statistical approaches in a semi-arid region. Sustainability 2021, 13, 11543. [Google Scholar] [CrossRef]
- Marandi, A.; Shand, P. Groundwater chemistry and the gibbs diagram. Appl. Geochem. 2018, 97, 209–212. [Google Scholar] [CrossRef]
- Zhang, C.; Zhang, W.; Cheng, D.; Yang, N.; Hou, X.; Li, H.; Zhang, X.; Ayyamperumal, R. Hydrochemical characteristics and paleoclimate changes recorded from sugan lake on the northern boundary of tibetan plateau since mid-holocene. Catena 2022, 217, 106527. [Google Scholar] [CrossRef]
- Liu, Y.; Jin, M.; Wang, J. Insights into groundwater salinization from hydrogeochemical and isotopic evidence in an arid inland basin. Hydrol. Process. 2018, 32, 3108–3127. [Google Scholar] [CrossRef]
- Hussin, N.H.; Yusoff, I.; Tahir, W.Z.W.M.; Mohamed, I.; Ibrahim, A.I.N.; Rambli, A. Multivariate statistical analysis for identifying water quality and hydrogeochemical evolution of shallow groundwater in quaternary deposits in the lower kelantan river basin, malaysian peninsula. Environ. Earth Sci. 2016, 75, 1081. [Google Scholar] [CrossRef]
- Dogramaci, S.; Skrzypek, G.; Dodson, W.; Grierson, P.F. Stable isotope and hydrochemical evolution of groundwater in the semi-arid hamersley basin of subtropical northwest australia. J. Hydrol. 2012, 475, 281–293. [Google Scholar] [CrossRef]
- Ma, B.; Jin, M.; Liang, X.; Li, J. Groundwater mixing and mineralization processes in a mountain–oasis–desert basin, northwest China: Hydrogeochemistry and environmental tracer indicators. Hydrogeol. J. 2018, 26, 233–250. [Google Scholar] [CrossRef]
- Krishnaraj, S.; Murugesan, V.; Vijayaraghavan, K.; Sabarathinam, C.; Paluchamy, A.; Ramachandran, M. Use of hydrochemistry and stable isotopes as tools for groundwater evolution and contamination investigations. Geosciences 2011, 1, 16–25. [Google Scholar] [CrossRef]
- Zhang, H.; Cheng, S.; Li, H.; Fu, K.; Xu, Y. Groundwater pollution source identification and apportionment using pmf and pca-apca-mlr receptor models in a typical mixed land-use area in southwestern China. Sci. Total Environ. 2020, 741, 140383. [Google Scholar] [CrossRef]
- Güler, C.; Thyne, G.D.; McCray, J.E.; Turner, K.A. Evaluation of graphical and multivariate statistical methods for classification of water chemistry data. Hydrogeol. J. 2002, 10, 455–474. [Google Scholar] [CrossRef]
- Hu, Y.; Ma, R.; Wang, Y.; Chang, Q.; Wang, S.; Ge, M.; Bu, J.; Sun, Z. Using hydrogeochemical data to trace groundwater flow paths in a cold alpine catchment. Hydrol. Process. 2019, 33, 1942–1960. [Google Scholar] [CrossRef]
- Ma, J.; He, J.; Qi, S.; Zhu, G.; Zhao, W.; Edmunds, W.M.; Zhao, Y. Groundwater recharge and evolution in the dunhuang basin, northwestern China. Appl. Geochem. 2013, 28, 19–31. [Google Scholar] [CrossRef]
- Sahib, L.Y.; Marandi, A.; Schüth, C. Strontium isotopes as an indicator for groundwater salinity sources in the kirkuk region, Iraq. Sci. Total Environ. 2016, 562, 935–945. [Google Scholar] [CrossRef]
- Edmunds, W.M.; Cook, J.M.; Darling, W.G.; Kinniburgh, D.G.; Miles, D.L.; Bath, A.H.; Morgan-Jones, M.; Andrews, J.N. Baseline geochemical conditions in the chalk aquifer, berkshire, U.K.: A basis for groundwater quality management. Appl. Geochem. 1987, 2, 251–274. [Google Scholar] [CrossRef]
- Zheng, M.; Tang, J.; Liu, J.; Zhang, F. Chinese saline lakes. Hydrobiologia 1993, 267, 23–36. [Google Scholar] [CrossRef]
- Bowler, J.M.; Huang, Q.; Kezao, C.; Head, M.J.; Baoyin, Y. Radiocarbon dating of playa-lake hydrologic changes: Examples from northwestern China and central Australia. Palaeogeogr. Palaeoclimatol. Palaeoecol. 1986, 54, 241–260. [Google Scholar] [CrossRef]
- Yapiyev, V.; Sagintayev, Z.; Inglezakis, V.J.; Samarkhanov, K.; Verhoef, A. Essentials of Endorheic Basins and Lakes: A Review in the Context of Current and Future Water Resource Management and Mitigation Activities in Central Asia. Water 2017, 9, 798. [Google Scholar] [CrossRef]
- Zhou, X.; Fang, B.; Wan, L.; Cao, W.; Wu, S.; Feng, W. Occurrence of soluble salts and moisture in the unsaturated zone and groundwater hydrochemistry along the middle and lower reaches of the Heihe River in northwest China. Environ. Geol. 2006, 50, 1085–1093. [Google Scholar] [CrossRef]
- Xiao, J.; Jin, Z.D.; Wang, J.; Zhang, F. Hydrochemical characteristics, controlling factors and solute sources of groundwater within the Tarim River Basin in the extreme arid region, NW Tibetan Plateau. Quat. Int. 2015, 380–381, 237–246. [Google Scholar] [CrossRef]
- Sun, Z.; Ma, R.; Wang, Y.; Hu, Y.; Sun, L. Hydrogeological and hydrogeochemical control of groundwater salinity in an arid inland basin: Dunhuang basin, northwestern China. Hydrol. Process. 2016, 30, 1884–1902. [Google Scholar] [CrossRef]
- Tian, Y.; Wen, Z.; Cheng, M.; Xu, M. Evaluating the water quality characteristics and tracing the pollutant sources in the yellow river basin, China. Sci. Total Environ. 2022, 846, 157389. [Google Scholar] [CrossRef] [PubMed]
- GB/T 14848-2017; Standard for Groundwater Quality. Standardization Administration of the People’s Republic of China: Beijing, China, 2017.
Figure 1.
Location of the study area and lithological distribution map.

Figure 2.
Sampling sites of groundwater and surface water. The groundwater of alluvial fan, plain, piedmont, and wetland are represented by red, black, green, and blue, respectively.
Figure 2.
Sampling sites of groundwater and surface water. The groundwater of alluvial fan, plain, piedmont, and wetland are represented by red, black, green, and blue, respectively.

Figure 3.
Gibbs diagram of surface water hydrochemistry.

Figure 4.
Piper diagram of groundwater hydrochemistry.

Figure 5.
The plot of δ2H versus δ18O content with linear regression equations. The Local Meteoric Water Line (LMWL) was defined by Ma et al. [32], and the Meteoric Water Line (GMWL) was defined by Craig [33].

Figure 6.
Ionic relationship in groundwater. (a) Na+/Cl− vs. Cl−, (b) K+/Cl− vs. Cl−, (c) Ca2+ + Mg2+ vs. SO42− + HCO3−, (d) Ca2+ vs. HCO3−, (e) Ca2+ vs. SO42−, (f) Na+ + K+ − Cl− vs. Ca2+ + Mg2+ − SO42− − HCO3−.
Figure 6.
Ionic relationship in groundwater. (a) Na+/Cl− vs. Cl−, (b) K+/Cl− vs. Cl−, (c) Ca2+ + Mg2+ vs. SO42− + HCO3−, (d) Ca2+ vs. HCO3−, (e) Ca2+ vs. SO42−, (f) Na+ + K+ − Cl− vs. Ca2+ + Mg2+ − SO42− − HCO3−.

Figure 7.
Box chart of saturation index of minerals in groundwater. (The Inter-Quartile Range (IQR) equals high quartile minus low quartile).
Figure 7.
Box chart of saturation index of minerals in groundwater. (The Inter-Quartile Range (IQR) equals high quartile minus low quartile).

Figure 8.
Dendrogram of the HCA of groundwater samples.

Figure 9.
Distribution of groundwater samples of four clusters in the Sugan Lake Basin.

Figure 10.
The Sankey diagram of decisive factors’ contributions in groundwater quality evaluation (Class III, IV and V).
Figure 10.
The Sankey diagram of decisive factors’ contributions in groundwater quality evaluation (Class III, IV and V).


Table 1.
Summary statistics of quality in surface water samples.
| Index | Max. | Min. | Mean | CV (%) |
|---|---|---|---|---|
| Ca2+ (mg/L) | 557.80 | 28.10 | 78.15 | 126.66 |
| Mg2+ (mg/L) | 1605.00 | 9.30 | 74.99 | 313.07 |
| Na+ (mg/L) | 6105.00 | 10.20 | 275.13 | 328.47 |
| K+ (mg/L) | 165.40 | 0.60 | 11.27 | 221.51 |
| HCO3− (mg/L) | 373.40 | 92.70 | 190.17 | 40.09 |
| Cl− (mg/L) | 8260.00 | 14.20 | 365.57 | 333.56 |
| SO42− (mg/L) | 8039.00 | 37.50 | 422.46 | 287.68 |
| NO3− (mg/L) | 68.75 | 0.50 | 6.71 | 212.73 |
| TDS (mg/L) | 24,840.00 | 193.00 | 1341.67 | 274.25 |
| pH | 8.96 | 7.39 | 8.23 | 4.28 |
Table 2.
Summary statistics of quality in groundwater samples.
| Index | Max. | Min. | Mean | CV (%) |
|---|---|---|---|---|
| Ca2+ (mg/L) | 180.90 | 5.60 | 54.96 | 62.33 |
| Mg2+ (mg/L) | 77.80 | 6.20 | 27.66 | 70.91 |
| Na+ (mg/L) | 669.40 | 18.10 | 142.31 | 118.91 |
| K+ (mg/L) | 40.70 | 1.30 | 6.03 | 128.52 |
| HCO3− (mg/L) | 244.10 | 53.70 | 138.42 | 28.57 |
| Cl− (mg/L) | 820.40 | 24.50 | 194.02 | 98.06 |
| SO42− (mg/L) | 858.70 | 23.40 | 177.21 | 129.09 |
| NO3− (mg/L) | 36.17 | 0.50 | 8.90 | 92.08 |
| TDS (mg/L) | 2691.00 | 197.00 | 687.97 | 90.94 |
| pH | 8.67 | 7.73 | 8.14 | 2.63 |
Table 3.
Extraction sums of squared loadings and rotated component matrix.
| Factor | Extraction Sums of Squared Loadings | Rotated Component Matrix | |||||||||||
|---|---|---|---|---|---|---|---|---|---|---|---|---|---|
| Sum | % of Variance | Cumulative (%) | Ca2+ | Mg2+ | Na+ | K+ | HCO3− | SO42− | Cl− | NO3− | TDS | pH | |
| 1 | 6.96 | 69.96 | 69.96 | 0.35 | 0.97 | 0.95 | 0.94 | 0.88 | 0.96 | 0.94 | 0.08 | 0.95 | −0.13 |
| 2 | 2.30 | 23.01 | 90.98 | 0.71 | 0.11 | 0.28 | 0.15 | −0.21 | 0.22 | 0.27 | 0.94 | 0.26 | 0.01 |
Table 4.
Results of single factor water quality analysis method.
| I | II | III | IV | V | ||||||
|---|---|---|---|---|---|---|---|---|---|---|
| No. | % | No. | % | No. | % | No. | % | No. | % | |
| TH | 8 | 22.86 | 19 | 54.29 | 2 | 5.71 | 4 | 11.43 | 2 | 5.71 |
| TDS | 12 | 34.29 | 9 | 25.71 | 5 | 14.29 | 6 | 17.14 | 3 | 8.57 |
| Sulfate | 4 | 11.43 | 16 | 45.71 | 6 | 17.14 | 2 | 5.71 | 7 | 20.00 |
| Chloride | 14 | 40.00 | 10 | 28.57 | 2 | 5.71 | 3 | 8.57 | 6 | 17.14 |
| Fluoride | 34 | 97.14 | 0 | 0.00 | 0 | 0.00 | 1 | 2.86 | 0 | 0.00 |
| Nitrate | 22 | 62.86 | 10 | 28.57 | 3 | 8.57 | 0 | 0.00 | 0 | 0.00 |
| Nitrite | 31 | 88.57 | 3 | 8.57 | 1 | 2.86 | 0 | 0.00 | 0 | 0.00 |
| Na | 23 | 65.71 | 3 | 8.57 | 0 | 0.00 | 4 | 11.43 | 5 | 14.29 |
| Fe | 29 | 82.86 | 2 | 5.71 | 2 | 5.71 | 2 | 5.71 | 0 | 0.00 |
| Cu | 35 | 100.00 | 0 | 0.00 | 0 | 0.00 | 0 | 0.00 | 0 | 0.00 |
| Zn | 32 | 91.43 | 3 | 8.57 | 0 | 0.00 | 0 | 0.00 | 0 | 0.00 |
| Mn | 34 | 97.14 | 0 | 0.00 | 0 | 0.00 | 1 | 2.86 | 0 | 0.00 |
| Pb | 35 | 100.00 | 0 | 0.00 | 0 | 0.00 | 0 | 0.00 | 0 | 0.00 |
| Ni | 35 | 100.00 | 0 | 0.00 | 0 | 0.00 | 0 | 0.00 | 0 | 0.00 |
| Cd | 35 | 100.00 | 0 | 0.00 | 0 | 37.14 | 0 | 0.00 | 0 | 0.00 |
| As | 34 | 97.14 | 0 | 0.00 | 1 | 2.86 | 0 | 0.00 | 0 | 0.00 |
| Se | 35 | 100.00 | 0 | 0.00 | 0 | 0.00 | 0 | 0.00 | 0 | 0.00 |
| Hg | 34 | 97.14 | 0 | 0.00 | 0 | 0.00 | 0 | 0.00 | 1 | 2.86 |
| Cr Ⅵ | 26 | 74.29 | 3 | 8.57 | 6 | 17.14 | 0 | 0.00 | 0 | 0.00 |
| pH | 33 | 94.29 | 0 | 0.00 | 0 | 0.00 | 2 | 5.71 | 0 | 0.00 |
| Result | 1 | 2.86 | 9 | 25.71 | 12 | 34.29 | 5 | 14.29 | 8 | 22.86 |
Disclaimer/Publisher’s Note: The statements, opinions and data contained in all publications are solely those of the individual author(s) and contributor(s) and not of MDPI and/or the editor(s). MDPI and/or the editor(s) disclaim responsibility for any injury to people or property resulting from any ideas, methods, instructions or products referred to in the content. |
© 2023 by the authors. Licensee MDPI, Basel, Switzerland. This article is an open access article distributed under the terms and conditions of the Creative Commons Attribution (CC BY) license (https://creativecommons.org/licenses/by/4.0/).
Share and Cite
MDPI and ACS Style
Yang, Z.; Hu, L.; Ma, H.; Zhang, W. Hydrochemical Characteristics of Groundwater and Their Significance in Arid Inland Hydrology. Water 2023, 15, 1641. https://doi.org/10.3390/w15091641
AMA Style
Yang Z, Hu L, Ma H, Zhang W. Hydrochemical Characteristics of Groundwater and Their Significance in Arid Inland Hydrology. Water. 2023; 15(9):1641. https://doi.org/10.3390/w15091641
Chicago/Turabian StyleYang, Zhengqiu, Litang Hu, Haiyan Ma, and Wang Zhang. 2023. "Hydrochemical Characteristics of Groundwater and Their Significance in Arid Inland Hydrology" Water 15, no. 9: 1641. https://doi.org/10.3390/w15091641
Note that from the first issue of 2016, this journal uses article numbers instead of page numbers. See further details here.