
Oxygen and pCO2 in the Surface Waters of the Atlantic Southern Ocean in 2021–2022
by
 , , and
Natalia A. Orekhova
1,*,
Sergey K. Konovalov
1,
Alexander A. Polukhin
2 and
Anna M. Seliverstova
2 1
Marine Hydrophysical Institute, Russian Academy of Sciences (FRC MHI), 299011 Sevastopol, Russia
2
Shirshov Institute of Oceanology, Russian Academy of Sciences (IO RAS), 117997 Moscow, Russia
*
Author to whom correspondence should be addressed.
Water 2023, 15(9), 1642; https://doi.org/10.3390/w15091642
Submission received: 6 March 2023
/
Revised: 14 April 2023
/
Accepted: 21 April 2023
/
Published: 23 April 2023
(This article belongs to the Section Oceans and Coastal Zones)
Abstract
:The carbon dioxide concentration in the atmosphere has progressively risen since pre-industrial times. About one-third of the anthropogenically generated CO2 is absorbed by the waters of the World Ocean, whereas the waters of the Southern Ocean take up about 40% of this CO2. The concentrations of oxygen and carbon dioxide dissolved in seawater are sensitive to climate changes, transferring anthropogenic pressures with consequences for the biogeochemical cycles in the World Ocean. The Southern Ocean is a key region for the exchange of oxygen and carbon between the surface water and the atmosphere and for their transfer with cold water masses to the deep layers of the Ocean. In this paper, we discuss the dynamics of the carbon dioxide partial pressure (pCO2) and dissolved oxygen (O2) in the surface waters of the Atlantic Southern Ocean based on data collected during the 87th cruise of the R/V “Academik Mstislav Keldysh”. The study area includes the Bransfield Strait, Antarctic Sound, the Powell Basin, the Weddell, and Scotia Seas. We have analyzed the spatial distribution of pCO2 and oxygen for the areas of transformation of water masses and changes in biogeochemical processes. In the zone of Scotia and Weddell Seas, we have observed an increase in pCO2 and a decrease in oxygen concentrations at the transect from the Weddell Sea at 56° W to the Powell Basin. From the Antarctic Sound to the Bransfield Strait, a decrease in oxygen saturation and an increase in pCO2 has been traced. The surface waters of the Bransfield Strait have revealed the greatest variability of hydrochemical characteristics due to a complex structure of currents and intrusions of different water masses. In general, this area has been characterized by the maximum pCO2, while the surface waters are undersaturated with oxygen. The variability of the AOU/ΔpCO2 (w-a) ratio has revealed a pCO2 oversaturation and an O2 undersaturation in the waters of the Bransfield Strait. It is evidence of active organic carbon decomposition as the major controlling process. Yet, photosynthesis is the major biogeochemical process in the studied areas of the Weddell and Scotia seas, and their waters have been undersaturated with pCO2 and oversaturated with O2. As it comes from the analysis of the distribution and correlation coefficients of AOU and the sea-air gradient of pCO2 with other physical and biogeochemical properties, the predominance of the biotic processes to the dynamics of O2 and pCO2 in the surface water layer has been demonstrated for the studied areas. Yet, there is evidence of additional sources of CO2 not associated with the production and destruction processes of organic matter.
1. Introduction
The carbon dioxide (CO2) concentration in the atmosphere has risen by 40% from 280 to over 400 ppm since pre-industrial times [1,2,3]. It is associated with changes in the climate and natural cycles [1,2,4,5,6,7,8,9,10,11,12,13], emphasizing the importance of studying the World Ocean. The World Ocean absorbs about one-third of the anthropogenically generated CO2 released into the atmosphere [1]. The pCO2 is rising in the surface seawater at a rate similar to the mole fraction of CO2 in the atmosphere [2]. The increasing CO2 concentration in the surface waters has already resulted in decreasing pH values [14,15] and an increase in the rate of production and oxidation of organic matter [16]. This leads to a transformation of biogeochemical cycles [17] as well as changes in the redox properties [14] and conditions for the existence of marine biota [17]. Global climate changes and changes in CO2 are also bound to changes in oceanic O2 concentrations. This is because of the decreasing oxygen solubility at higher temperatures and the enhancement of water column stratification, restricting the ventilation of subsurface waters with atmospheric oxygen and leading to a decline in oxygen in the World Ocean [2].
The Southern Ocean (SO) is known to serve as a mediator in regulating the global climate due to its significant ability to uptake anthropogenic CO2 [1,2,4,5,6,7,9,10,11,12,13]. The current atmospheric CO2 concentration would be about 50% higher if it were not absorbed by the Southern Ocean [5]. Yet, its waters absorb up to 40% of the additional anthropogenic CO2 from the atmosphere [2,9,10,11,12,13], slowing the growth of atmospheric CO2 and, therefore, the rate of climate change [1,4,5,6,7].
At the same time, the role of the SO in absorbing the CO2 from the atmosphere has not been fully clarified [12], though it is obvious that its waters are a sink for the atmospheric CO2. According to some studies [10], in the last 20 years, the absorption capacity of the SO has been decreasing, however, significant spatial and temporal variabilities in biological, chemical, and thermohaline characteristics [12] make it difficult to accurately assess these changes. The limited number of direct measurements in the SO due to harsh conditions for on-sea studies also makes it difficult to quantify changes in the absorption capacity of the SO. Yet, the waters of the SO, in addition to regulating CO2 fluxes, play an important role in the circulation of waters of the World Ocean and biogeochemical cycles, including oxygen [2,8,18]. The SO is an area of significant transformation of water mass, deep water formation, and interbasin exchange [8].
In addition to physical factors, the dynamics of oxygen and CO2 are governed by biogeochemical processes, mainly photosynthesis and organic matter mineralization (Equation (1)), which biologically link oxygen and CO2 production and utilization [2].
(CH2O)106(NH3)16H3PO4 + 138O2 ↔ 106CO2 + 122H2O + 16HNO3 + H3PO4
The consumption of oxygen for organic matter oxidation leads to its exhaustion and the production of CO2 (reaction 1, from left to right). With a significant excess of organic matter, a rise in oxygen deficiency and water acidification is possible [12,14].
When oxygen production occurs because of photosynthesis (reaction 1, from right to left), CO2 is consumed, supporting its deficit in the upper layer of the waters and the sink of CO2 from the atmosphere. Photosynthesis is usually observed when a supply of nutrients and sufficient illumination are available. Though the Southern Ocean is characterized by high nutrient concentrations [12,19], significant primary production is not typical here [19,20].
The partial pressure of carbon dioxide (pCO2) is proportional to the concentration of carbon dioxide in water. Values of pCO2 in the surface waters, where CO2 is exchanged between the water and the atmosphere, are also determined by seasonal changes in temperature and biogeochemical processes, including calcification (Equations (1)–(3)):
CO2 (gas) ↔ CO2 (aq) ↔ CO2 (aq) + H2O ↔ H+ + HCO3− ↔ 2H+ + CO32−
Ca2+ + CO32− ↔ CaCO3 (s)
Since the oxygen concentration in the water mass depends on where and when it was last in contact with the atmosphere and on the imprints of biological processes (mainly oxygen consumption) during the time elapsed since then, the SO circulation and the magnitude of organic matter export and consumption would, thus, be expected to play a significant role in determining the ocean’s oxygen distributions as well. The results of Keller et al. [8] suggest that the SO biological processes, particularly organic carbon oxidation, reduce the ocean’s oxygen concentration, mainly in the deep ocean, by 14 to 19%.
Our previous studies have revealed that waters in this region are not always undersaturated with carbon dioxide or oversaturated with oxygen [21]. The situation may be reversed and demonstrate that waters in this region may become the source of carbon dioxide and the sink for oxygen. Thus, the SO is a key area for oxygen and carbon exchange between the surface water and the atmosphere and their subsequent transfer with the cold-water masses to the deep layers of the Ocean. This makes the studies of oxygen and CO2 dissolved in seawater important due to their impact on and sensitivity to climate changes, increasing anthropogenic pressures on and consequences for biogeochemical cycles in the World Ocean.
Based on the foregoing, climate-mediated changes in the Southern Ocean biogeochemistry over the coming decades are very likely to impact primary production, sea-air CO2 exchange, and ecosystem functioning within and beyond this vast and critically important ocean region. The SO plays a major role in modulating the Earth’s climate over seasonal-to-millennial timescales by taking up the atmospheric carbon dioxide (CO2) via biological and solubility pump processes and by releasing CO2 from the deep ocean. Anthropogenic climate changes affect the Southern Ocean’s biogeochemical cycling directly through the oceanic uptake of CO2 and the resulting ocean acidification and indirectly via its effect on sea–ice dynamics, glacial meltwater inputs, and winds and ocean physics [9].
As a part of studies of the Southern Ocean, this work is aimed to study the influence of physical and biogeochemical processes on the spatial variations in pCO2 and oxygen saturation in the surface waters of the Atlantic Southern Ocean, including the Bransfield Strait, Antarctic Sound, the Powell Basin, the Weddell, and Scotia Seas during the Austral Summer of 2021–2022.
2. Materials and Methods
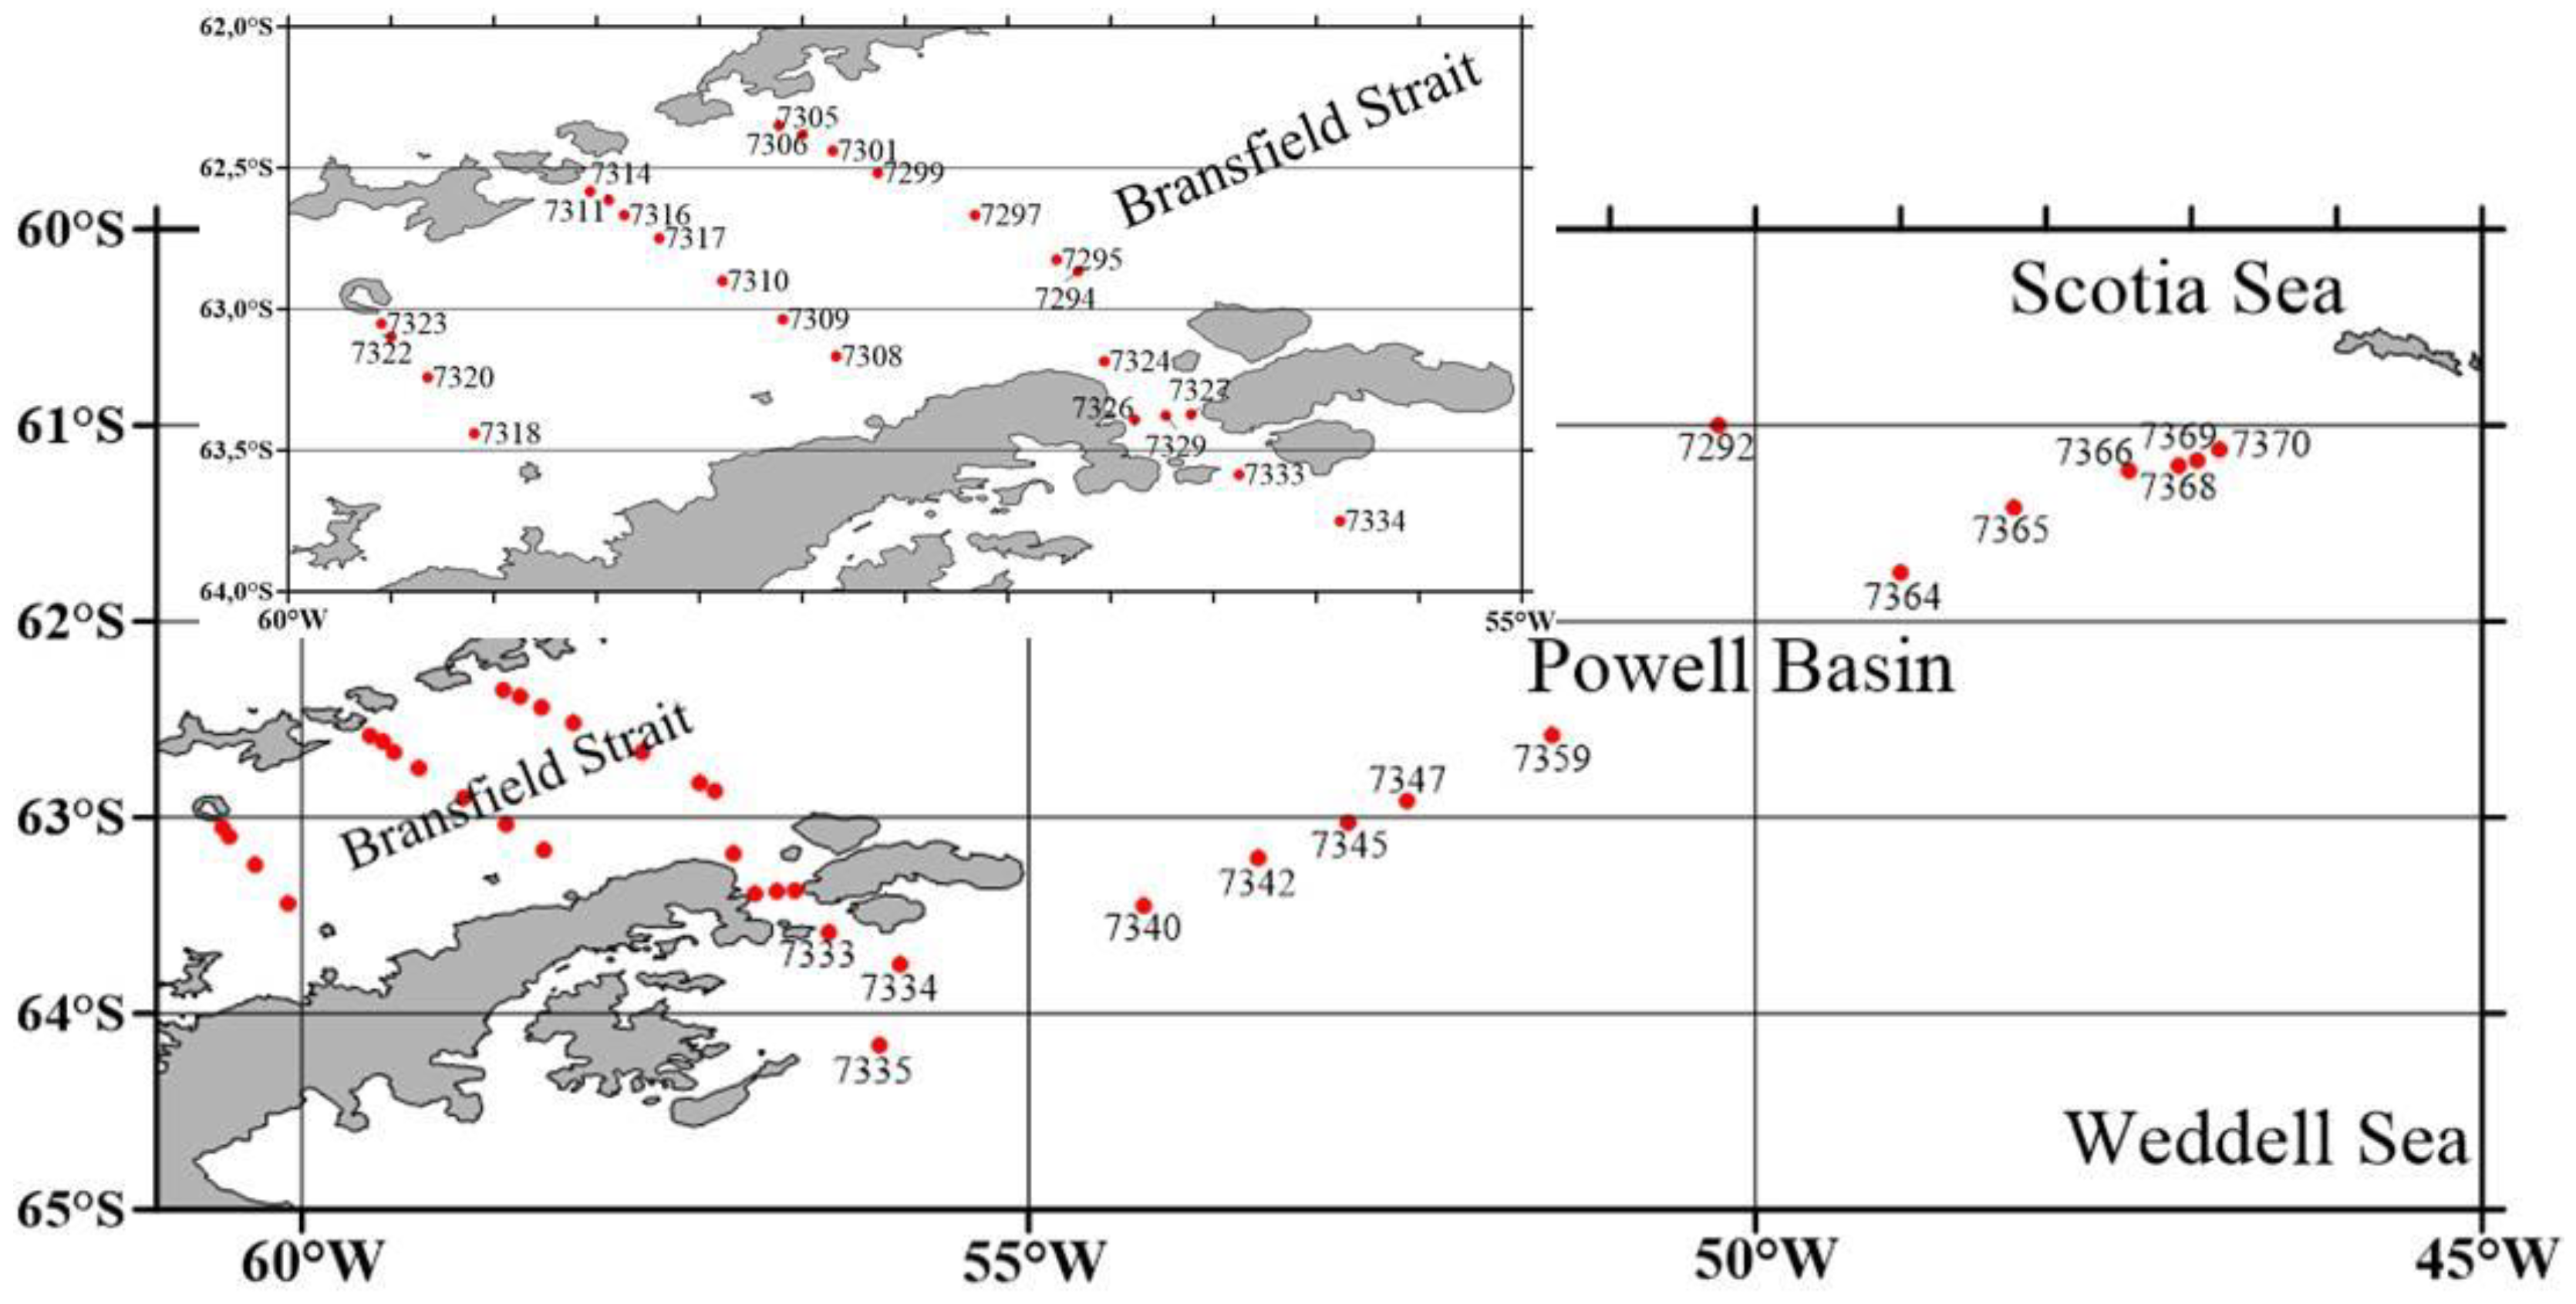
Data were collected during the 87th cruise of the R/V “Academik Mstislav Keldysh” during the Austral Summer of 2021–2022. The areas of work investigated in the Atlantic Southern Ocean included the Bransfield Strait, Antarctic Sound, the Powell Basin, and the Weddell and Scotia Seas (Figure 1). According to [22,23,24,25,26,27], the upper layer of the water in the studied area is under the influence of the Bellingshausen, Weddell, and Scotia seas, as well as the waters of the Southern branch of the Antarctic Circumpolar Current (ACC), forming the fronts of the thermohaline characteristics in the boundary currents [23,27]. In the northwestern part of the Weddell Sea, there is an intensive flow of crushed ice and icebergs, which supports the low and even negative values of water temperatures [23,24]. The melting ice provides an additional input of reactive iron, which is a limiting factor for primary production in this region [22].
The thermohaline characteristics of the Scotia Sea are subject to spatial and temporal dynamics and are largely determined by the influence of the waters of the Weddell Sea in the southeastern part and closer to the South Orkney Islands by the waters of the Southern branch of the ACC [27].
The water was sampled with a CTD 911 rosette of 24 5-l Niskin bottles from the surface water layer at a depth of 0–9 m. The sea surface temperature (SST) and salinity data were obtained with a SeaBird 911. The water samples were used in biogeochemical analyses (e.g., oxygen, pH, and alkalinity). Additionally, the pCO2 in the atmosphere near the surface of the seawater (10 m above the sea surface) and in the surface waters (3–9 m below the sea surface) was measured using a Li-Cor Li-7000 DP instrument.
The dissolved oxygen concentration was determined using Winkler’s method [28,29]. After the Niskin bottles reached a deck, water samples for oxygen analysis were collected into 125 mL calibrated borosilicate glass bottles and fixed immediately. To prevent gas exchange, samples were fixed with 1 mL of MnCl2 and 1 mL of NaI-NaOH, then the flasks were stoppered and shaken. They were then acidified using sulfuric acid, and the liberated iodine was titrated with a sodium thiosulfate solution using an automated photometric Metrohm 655 Dosimat burette endpoint detector. The oxygen concentrations were calculated according to [29]. This technique allowed for obtaining results with an accuracy of ±0.010 mL·L−1 (±0.4 μM).
The Apparent Oxygen Utilization (AOU), which is the difference between the observed oxygen concentration and the oxygen concentration at 100% saturation of water, was calculated.
where [O2]* is the oxygen solubility concentration (mL·L−1) calculated as a function of the in situ temperature and salinity and one atmosphere of total pressure. The [O2]* values were calculated according to the equations proposed by Weiss [30], and [O2] is the measured oxygen concentration (mL·L−1).
AOU = [O2]* − [O2],
The pH was measured in an NBS scale using HANNA HI 2210 equipment, and calibration was performed according to the instructions with the HANNA buffer solutions (4.01, 6.86 and 9.18). The samples were installed into a thermostat at 20 °C before measurement.
The values of pCO2 in the surface water were determined directly by applying a flow-through system with a continuous flow and a cylinder-type equilibrator (10 cm in diameter and 250 cm in height) filled with plastic balls and with an enclosed headspace. The water flow was 3.7–4.0 L·min−1. The renewal time was 3–5 min. After the equilibration and dehydration, the CO2 mole fraction in dry air (xCO2) was measured with a Li-Cor spectrometer (Li-7000 DP). The Li-Cor was calibrated daily, using pure argon (0 ppm) and a gas mixture with a CO2 molar fraction of 440 ppm. The error of determination is 1% [31]. The pCO2 was converted from a corrected xCO2 based on the barometric pressure measured by the Li-7000 detector [32]. To calculate the in situ pCO2, the saturated water vapor pressure was accounted [33].
Air pCO2 was determined at every station using the same equipment and dehydration system. The air was taken from the bow of the vessel at 10 m above the water’s surface to avoid contamination. The air pCO2 data were corrected to 100% humidity at the sea surface temperature and sea surface salinity [32].
Data on the distribution of oxygen and pCO2 aimed to study and identify the main factors and processes (physical, biological, chemical, and their combination) that determine their dynamics and the mechanism of possible changes in the ecosystem under climate changes and the observed increase in atmospheric CO2.
3. Results
We will discuss the dynamics of pCO2 and dissolved oxygen (O2) in the surface waters based on the data collected during the 87th cruise of the R/V “Academik Mstislav Keldysh” by comparing the spatial distribution of pCO2 and O2 for the areas of transformation of water masses and ongoing biogeochemical processes. The thermohaline characteristics influence the hydrochemical characteristics of the waters, one of which is oxygen and carbon dioxide. Temperature and salinity affect the solubility of these gases and the dynamics of water masses influence on its vertical and horizontal transport [2]. The dynamics of oxygen consumption and changes in the concentration of carbon dioxide make it possible to value organic matter production as well as the deconstruction processes and their intensity.
The results discussed in this paper are given in the Table 1.
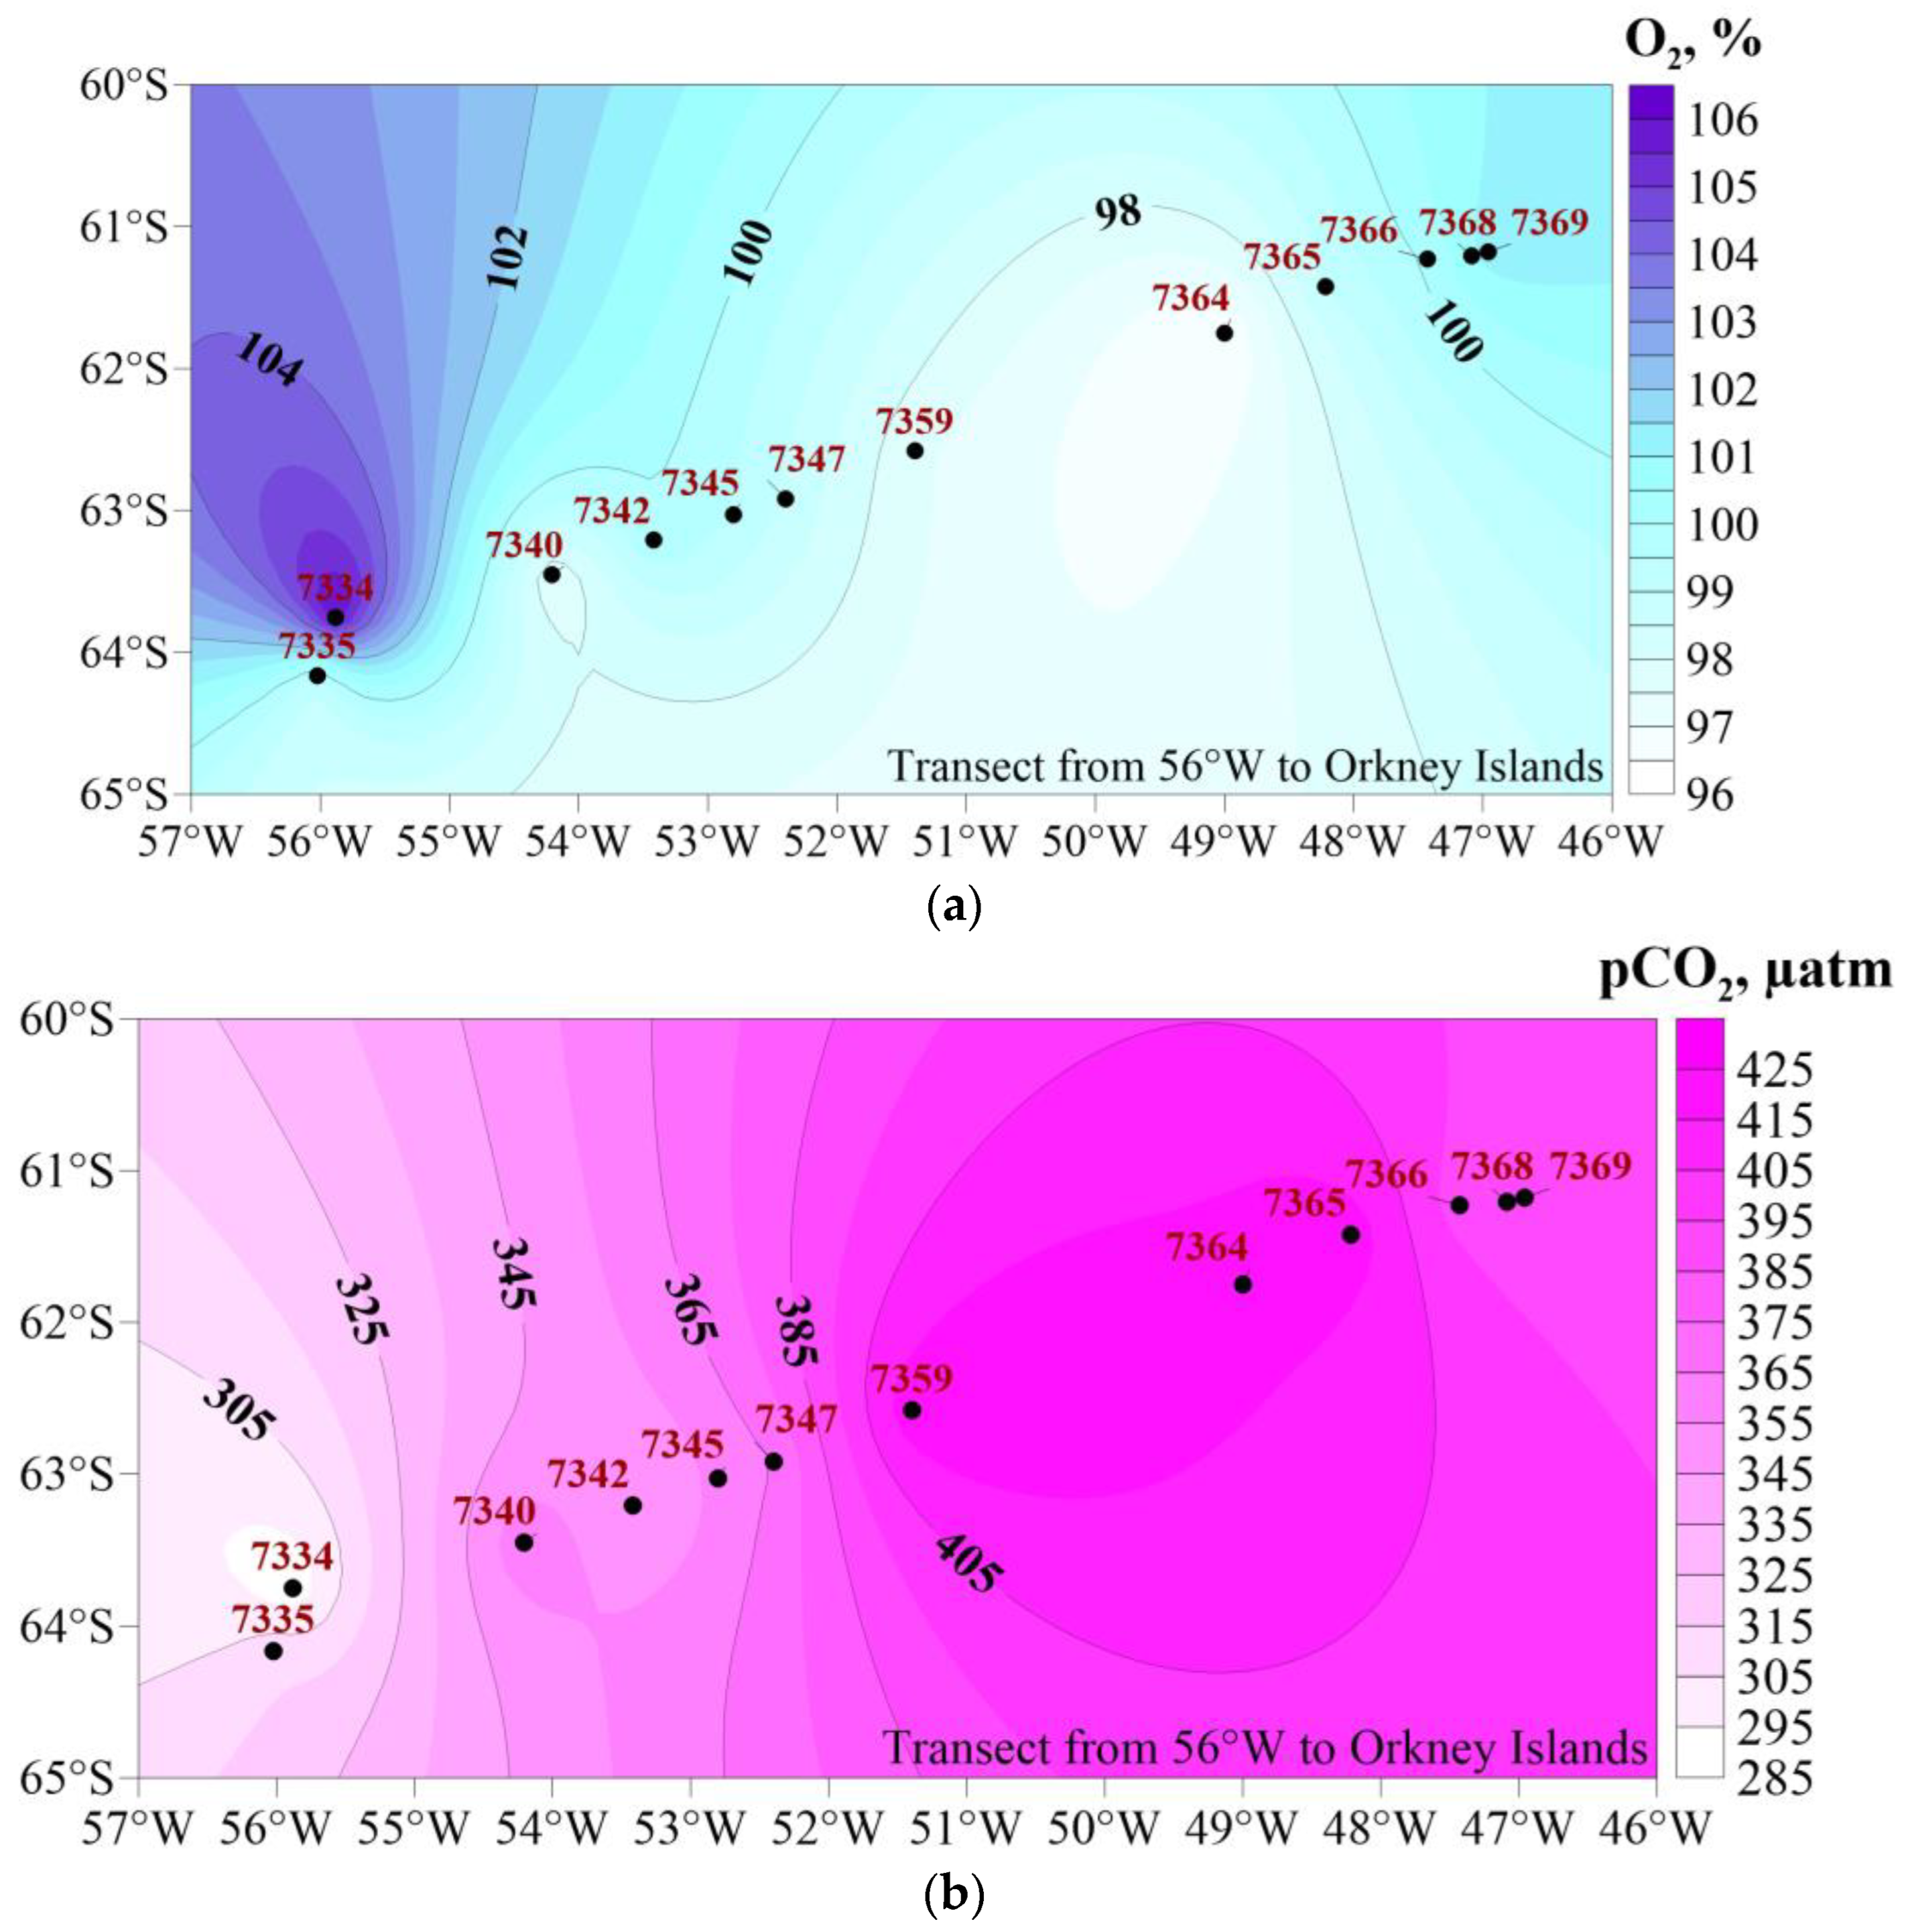
On the transect from 56° W to the north-east to the Orkney Islands (Figure 1), the temperature of the surface water increased from −0.6 °C at 56° W in the area of the maximum chlorophyll a (according to satellite data) to above +1 °C in the area of the Orkney Islands. For the cold and salty waters of the Weddell Sea at 56° W, the highest oxygen concentrations (up to 106% sat.) and the lowest values of pCO2 (~300 µatm) were traced (Table 1, Figure 2a,b). This indicates the predominance of photosynthesis. In the central part of the Powell Basin (st. 7359, 7364, 7365, Figure 1), the opposite pattern was observed—the highest and closest to the atmospheric values of pCO2 (~420 µatm) and the lowest oxygen (about 96–97% sat.) concentrations, whereas the temperature increased by 0.79–1.10 °C and the salinity topped 34.38–34.46. We explain this by the transformation of waters and the change in the predominant biogeochemical process from photosynthesis to organic matter oxidation.
The waters of the Weddell Sea typically make their way to the northeast and through the Antarctic Sound into the Bransfield Strait further along the northeast coast of the Antarctic Peninsula.
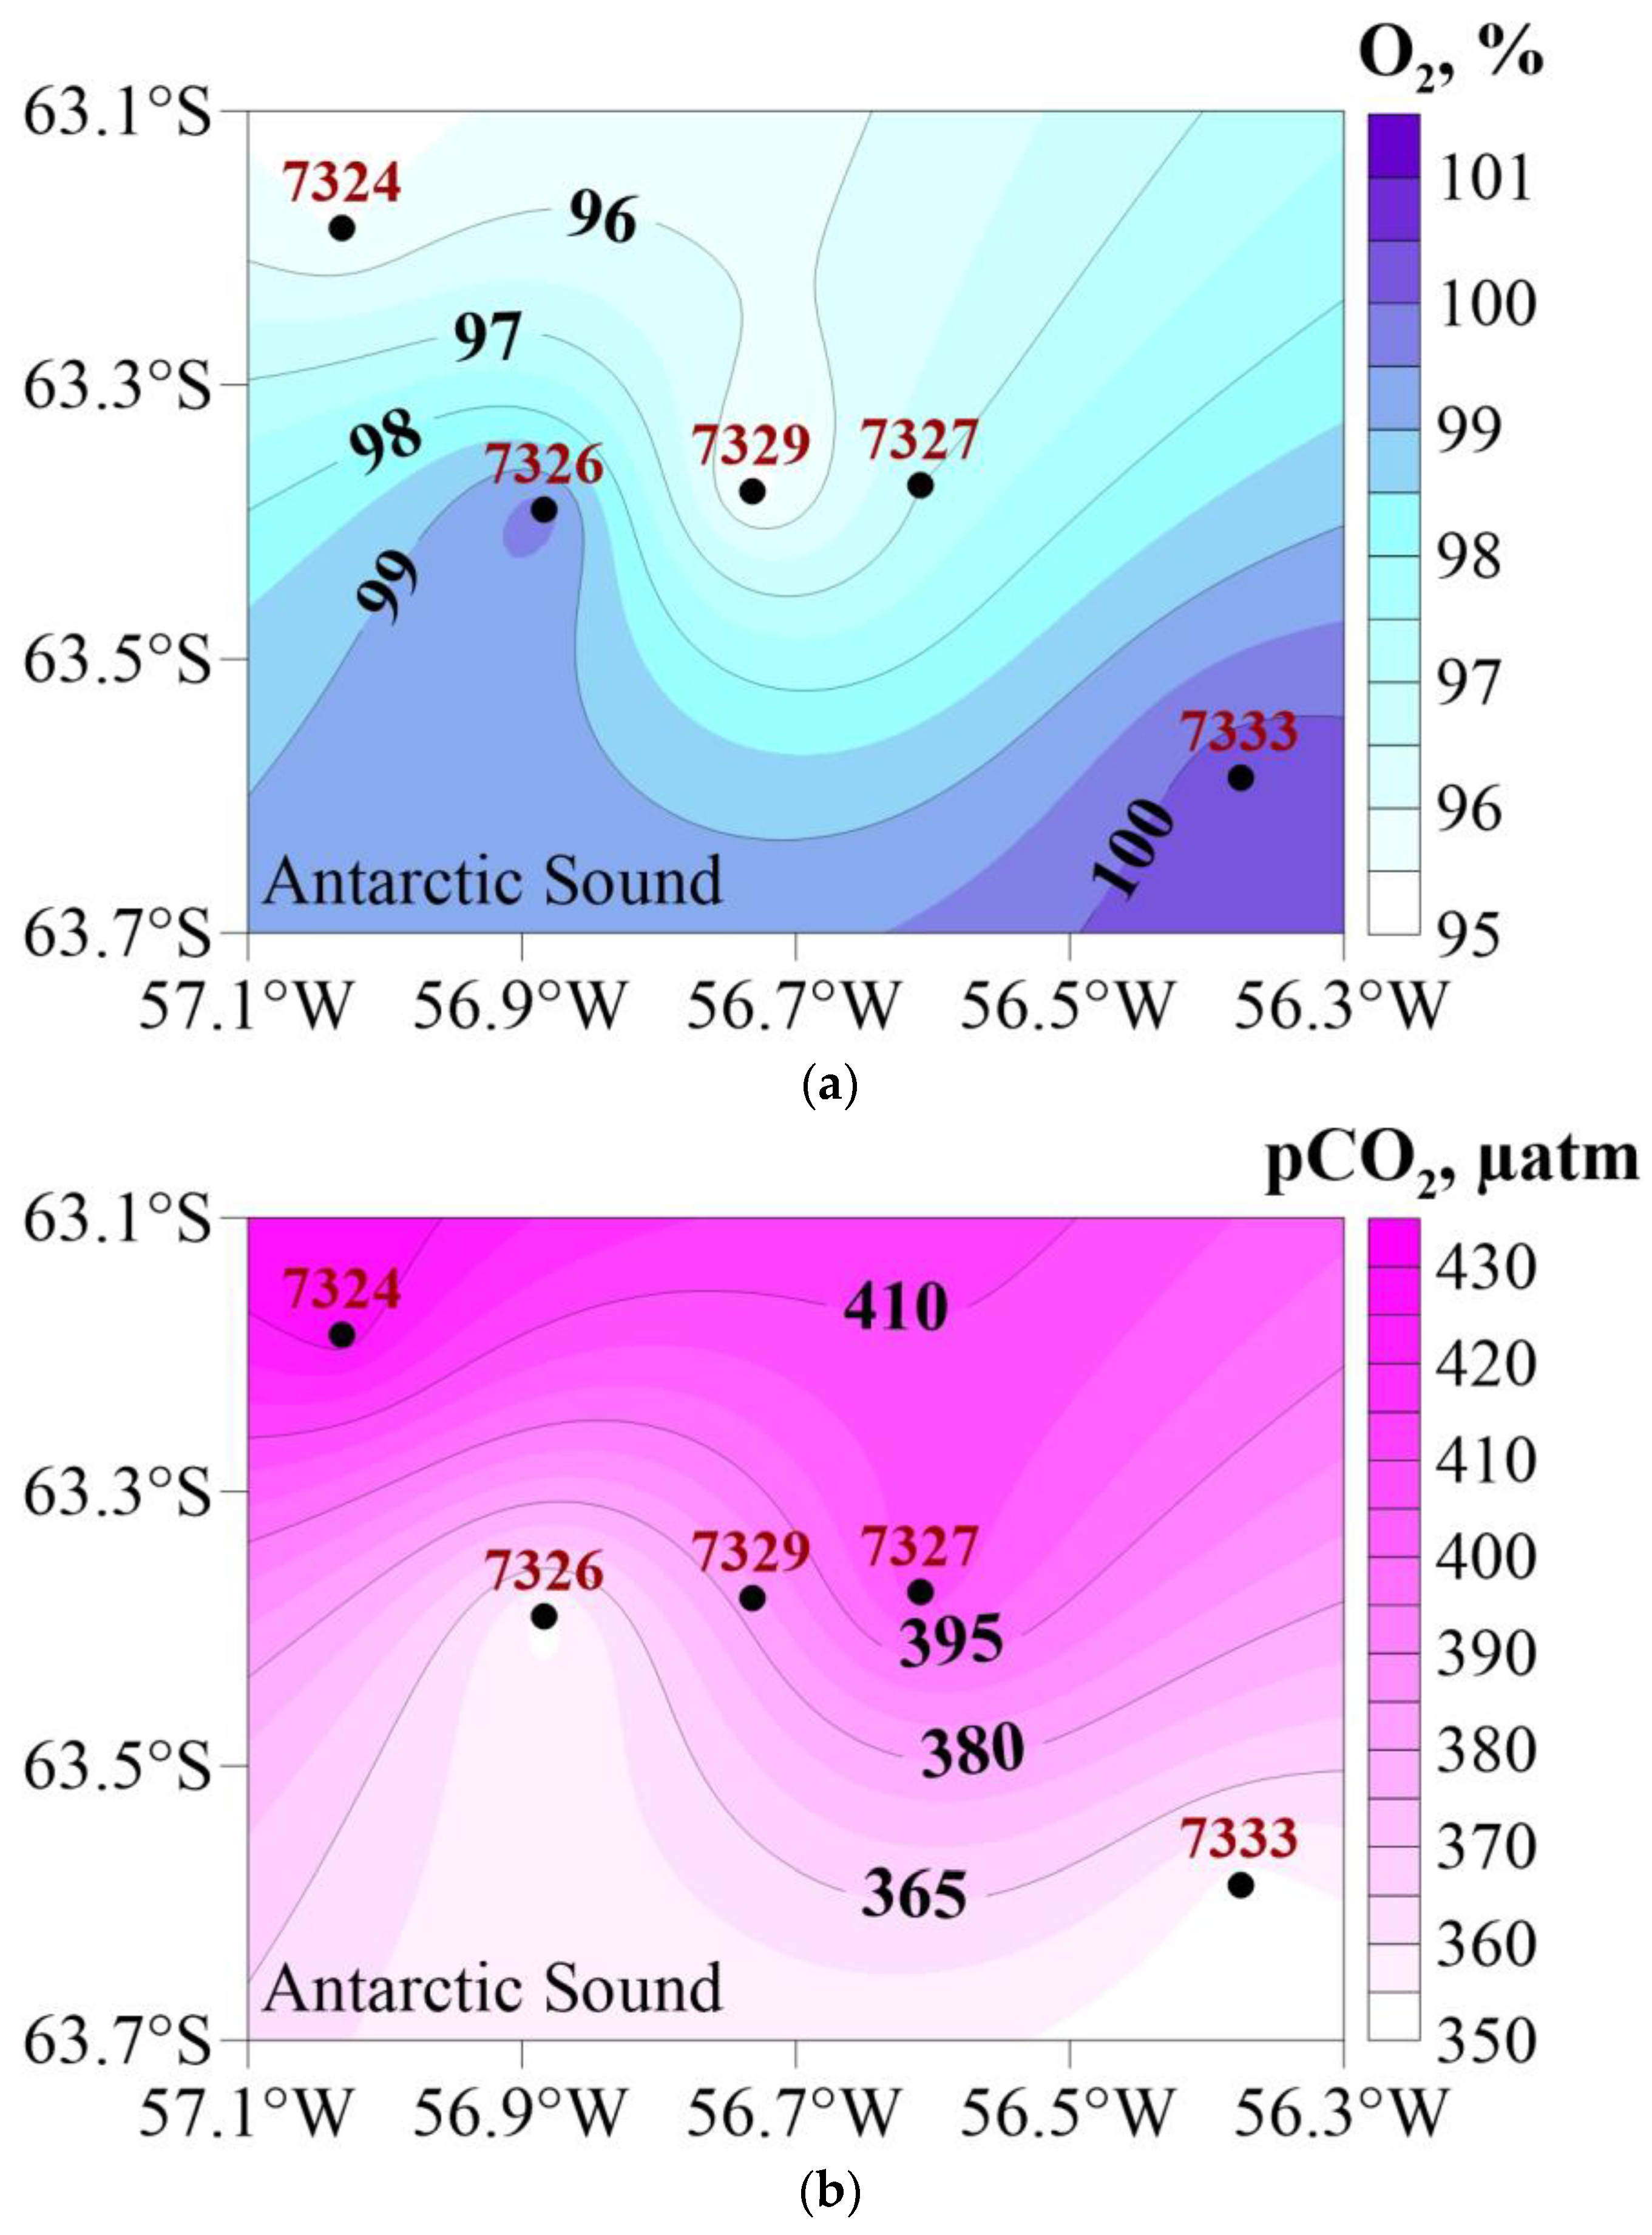
The lowest temperatures (from −0.08 down to −0.63 °C, at average −0.41 °C) and the highest salinities (on average 34.44) were traced in the surface waters of the Antarctic Sound (Table 1), as water masses make way to the Bransfield Strait, revealing a decrease in oxygen saturation from 100% sat. (st. 7333) down to 95% sat. (st. 7324) and an increase in pCO2 from 353 µatm (st. 7333) to 428 µatm (st. 7324) (Figure 3a,b). This might indicate a shift from production to the destruction of biogeochemical processes and organic matter oxidation.
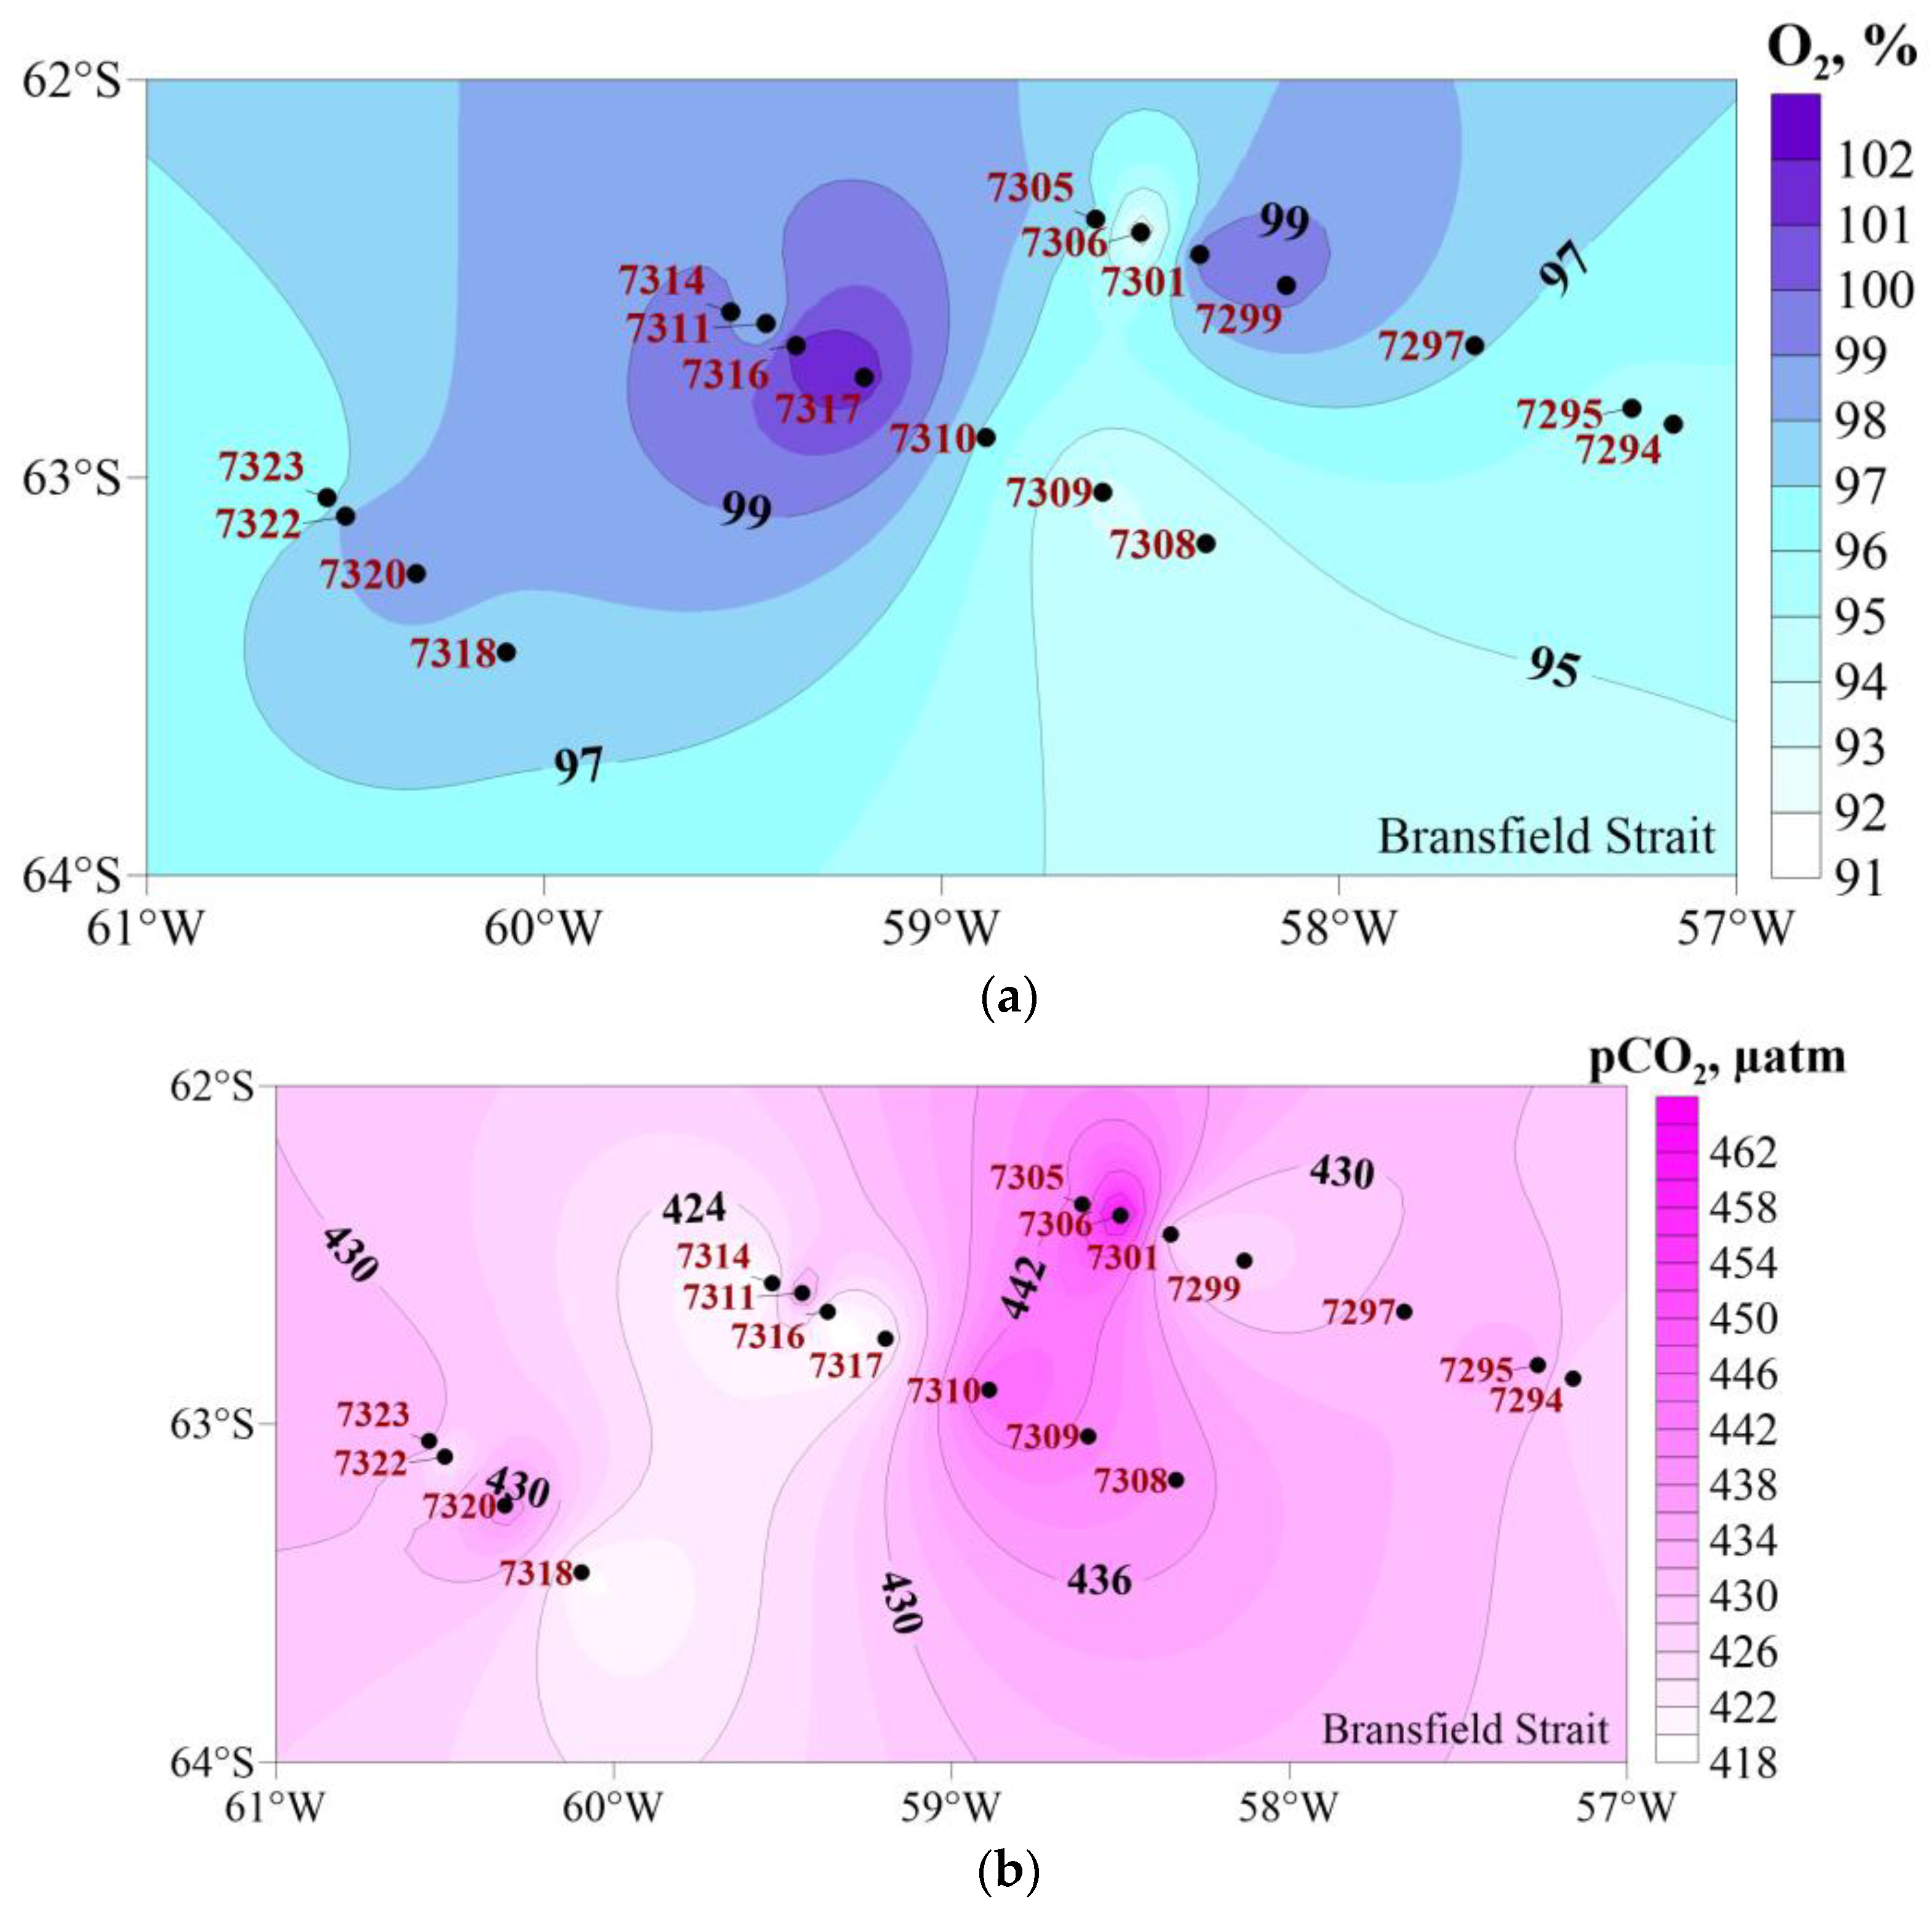
The surface waters of the Bransfield Strait were characterized by the greatest variation in hydrochemical characteristics (Table 1, Figure 4a,b) due to a complex structure of currents and intrusions of different water masses [10,11]. In general, this area was characterized by the maximum pCO2, while the surface waters were undersaturated with oxygen (Table 1).
The distribution of temperature and salinity in the Bransfield Strait varied spatially and reflected the structure of the incoming waters from the Weddell and Bellingshausen seas as a result of their mixing with the shelf waters of the South Shetland Islands and the Antarctic Peninsula [10]. That led to the formation of two water masses—warm and relatively fresh in the area of the South Shetland Islands (1.12 °C and 34.35, respectively) and cold and salty (−0.06 °C and 34.44, respectively) waters along the Antarctic Peninsula. In the area of warm and relatively fresh water in the area of the South Shetland Islands, the oxygen saturation varied within 91–102% (average 98% sat.), while the sea surface pCO2 varied in the range of 419–465 µatm (average 433 µatm) (Figure 4a,b), which was above the level of atmospheric pCO2 (425 µatm, according to our direct measurements) and indicated an additional source of CO2 beside the processes of organic matter oxidation. Oxygen undersaturation (91–97% sat.) and carbon dioxide oversaturation (the range of pCO2 was 419–465 µatm with an average value of 433 µatm) were traced along the Antarctic Peninsula (Figure 4a,b). The minimum sea surface temperatures (−0.19–−0.32 °C) were traced near the Antarctic Sound (st. 7294, 7295, 7308, 7309 (Figure 1)). Those waters revealed a narrow range of salinity changes (34.52–34.55), low oxygen concentrations (340–347 µM or 95% sat.) and high values of pCO2 (426–441 µatm) (Figure 4a,b). That meant an oversaturation of water with carbon dioxide compared to the atmosphere, which could be due to organic matter destruction.
4. Discussion
Carbon dioxide dissolved in water is one of the components of the carbonate system, which determines not only the carbon cycle in water but other major natural cycles too. The gradient of carbon dioxide concentration between the sea surface and the atmosphere determines the ability of marine systems to absorb CO2 from or to release it into the atmosphere.
The pCO2 is proportional to the concentration of carbon dioxide. The value of pCO2 in surface waters, in which CO2 is exchanged with the atmosphere, is determined by seasonal changes in temperature, dissolved inorganic carbon (DIC) concentration, and alkalinity. The temperature of the sea surface is mainly determined by physical processes, while DIC and alkalinity are affected by biological processes of photosynthesis, organic matter degradation and calcification or carbonates dissolution (Equations (1)–(3)), as well as the input of subsurface waters enriched with carbon dioxide and nutrients [22].
To reveal differences between the production and destruction of organic matter and to estimate the intensity of these processes, we used the pCO2 gradient between the sea surface and the atmosphere (ΔpCO2 w-a) and the apparent oxygen utilization.
The excess of pCO2 in the surface layer of water over its atmospheric value indicates the oversaturation of water with carbon dioxide and the predominance of the process of CO2 production. Similarly, negative values of AOU indicate an excess and production of oxygen in the surface layer of water, while negative values indicate a lack of oxygen due to its consumption for organic matter oxidation.
Though the values of pCO2 and oxygen saturation depend on the thermohaline characteristics of water masses by changing the carbonate system and dissolution of gasses, there were no statistically supported correlations between ΔpCO2, AOU, and abiotic properties (temperature, salinity) (Figure 5a,b). This might indicate that the dynamics of these components were influenced by biotic processes or that the transformation of waters occurred too fast for the equilibration of chemical parameters for the changing conditions.
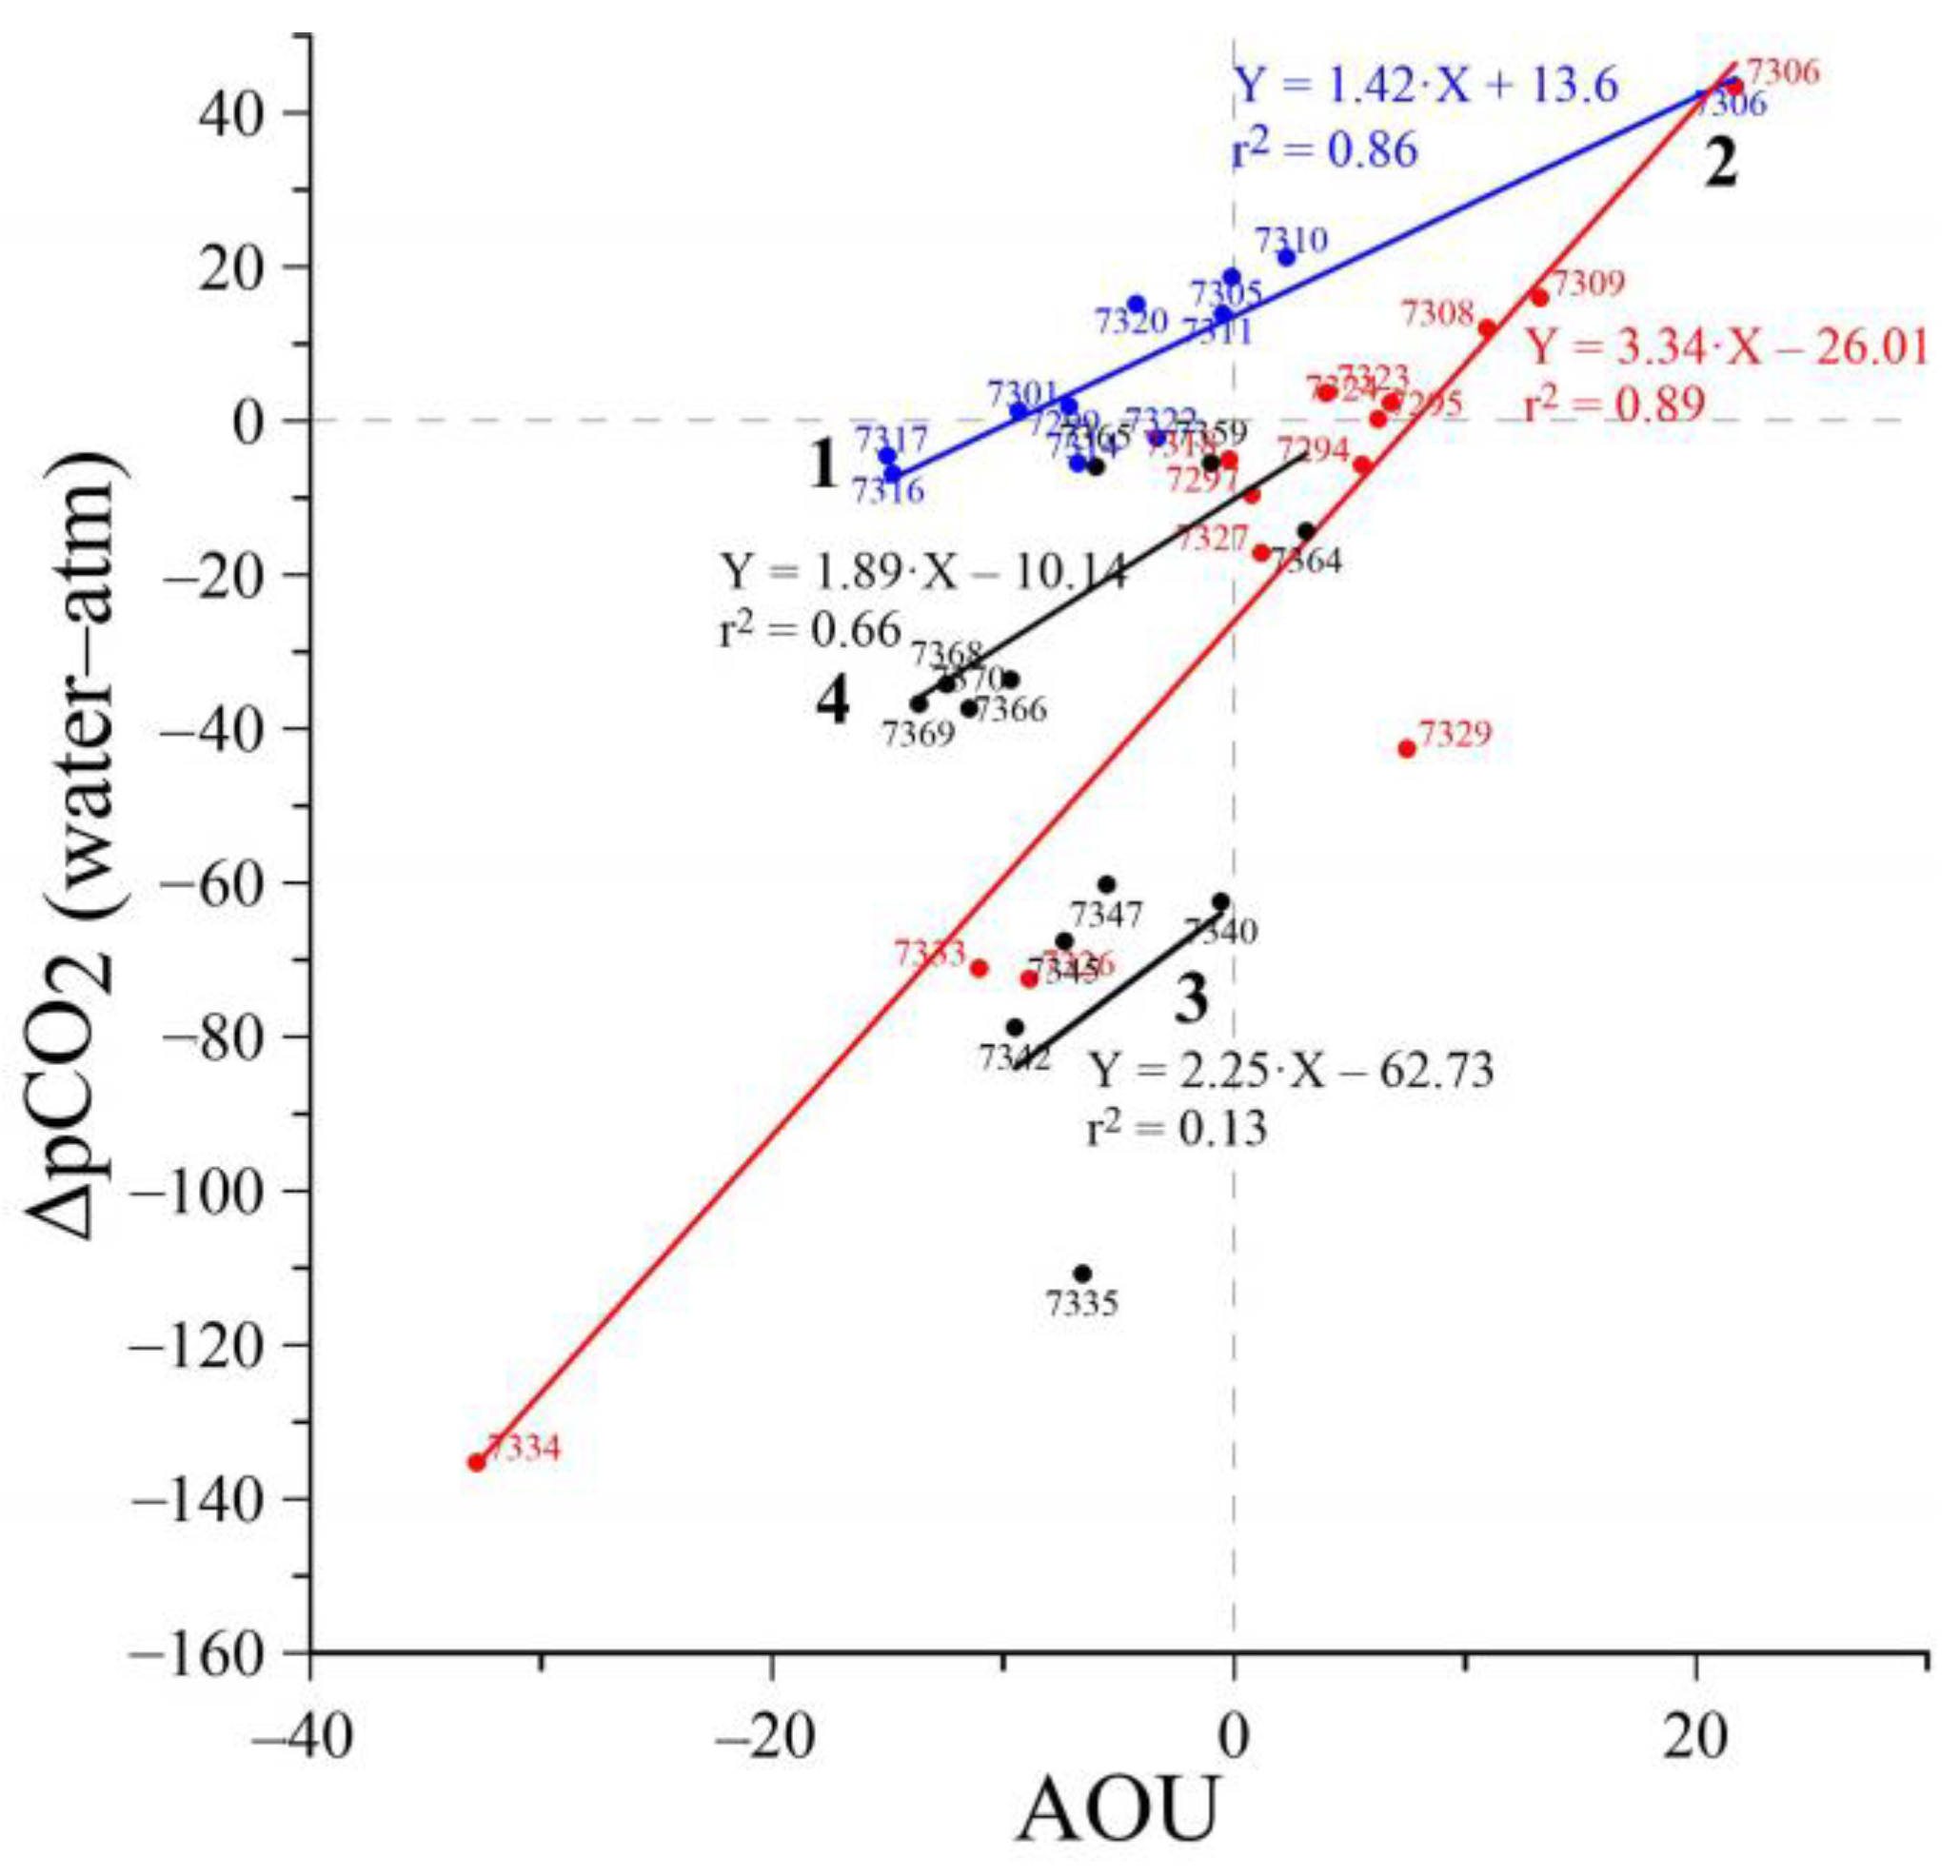
An analysis of the ratio of ΔpCO2/AOU (Figure 6) revealed four individual marine sub-systems (Figure 6 and Figure 7), in which the intensities of the production and destruction processes were different. This allowed the identification of different types of water or their transformation, which occurred as a result of the mixing of different types of water.
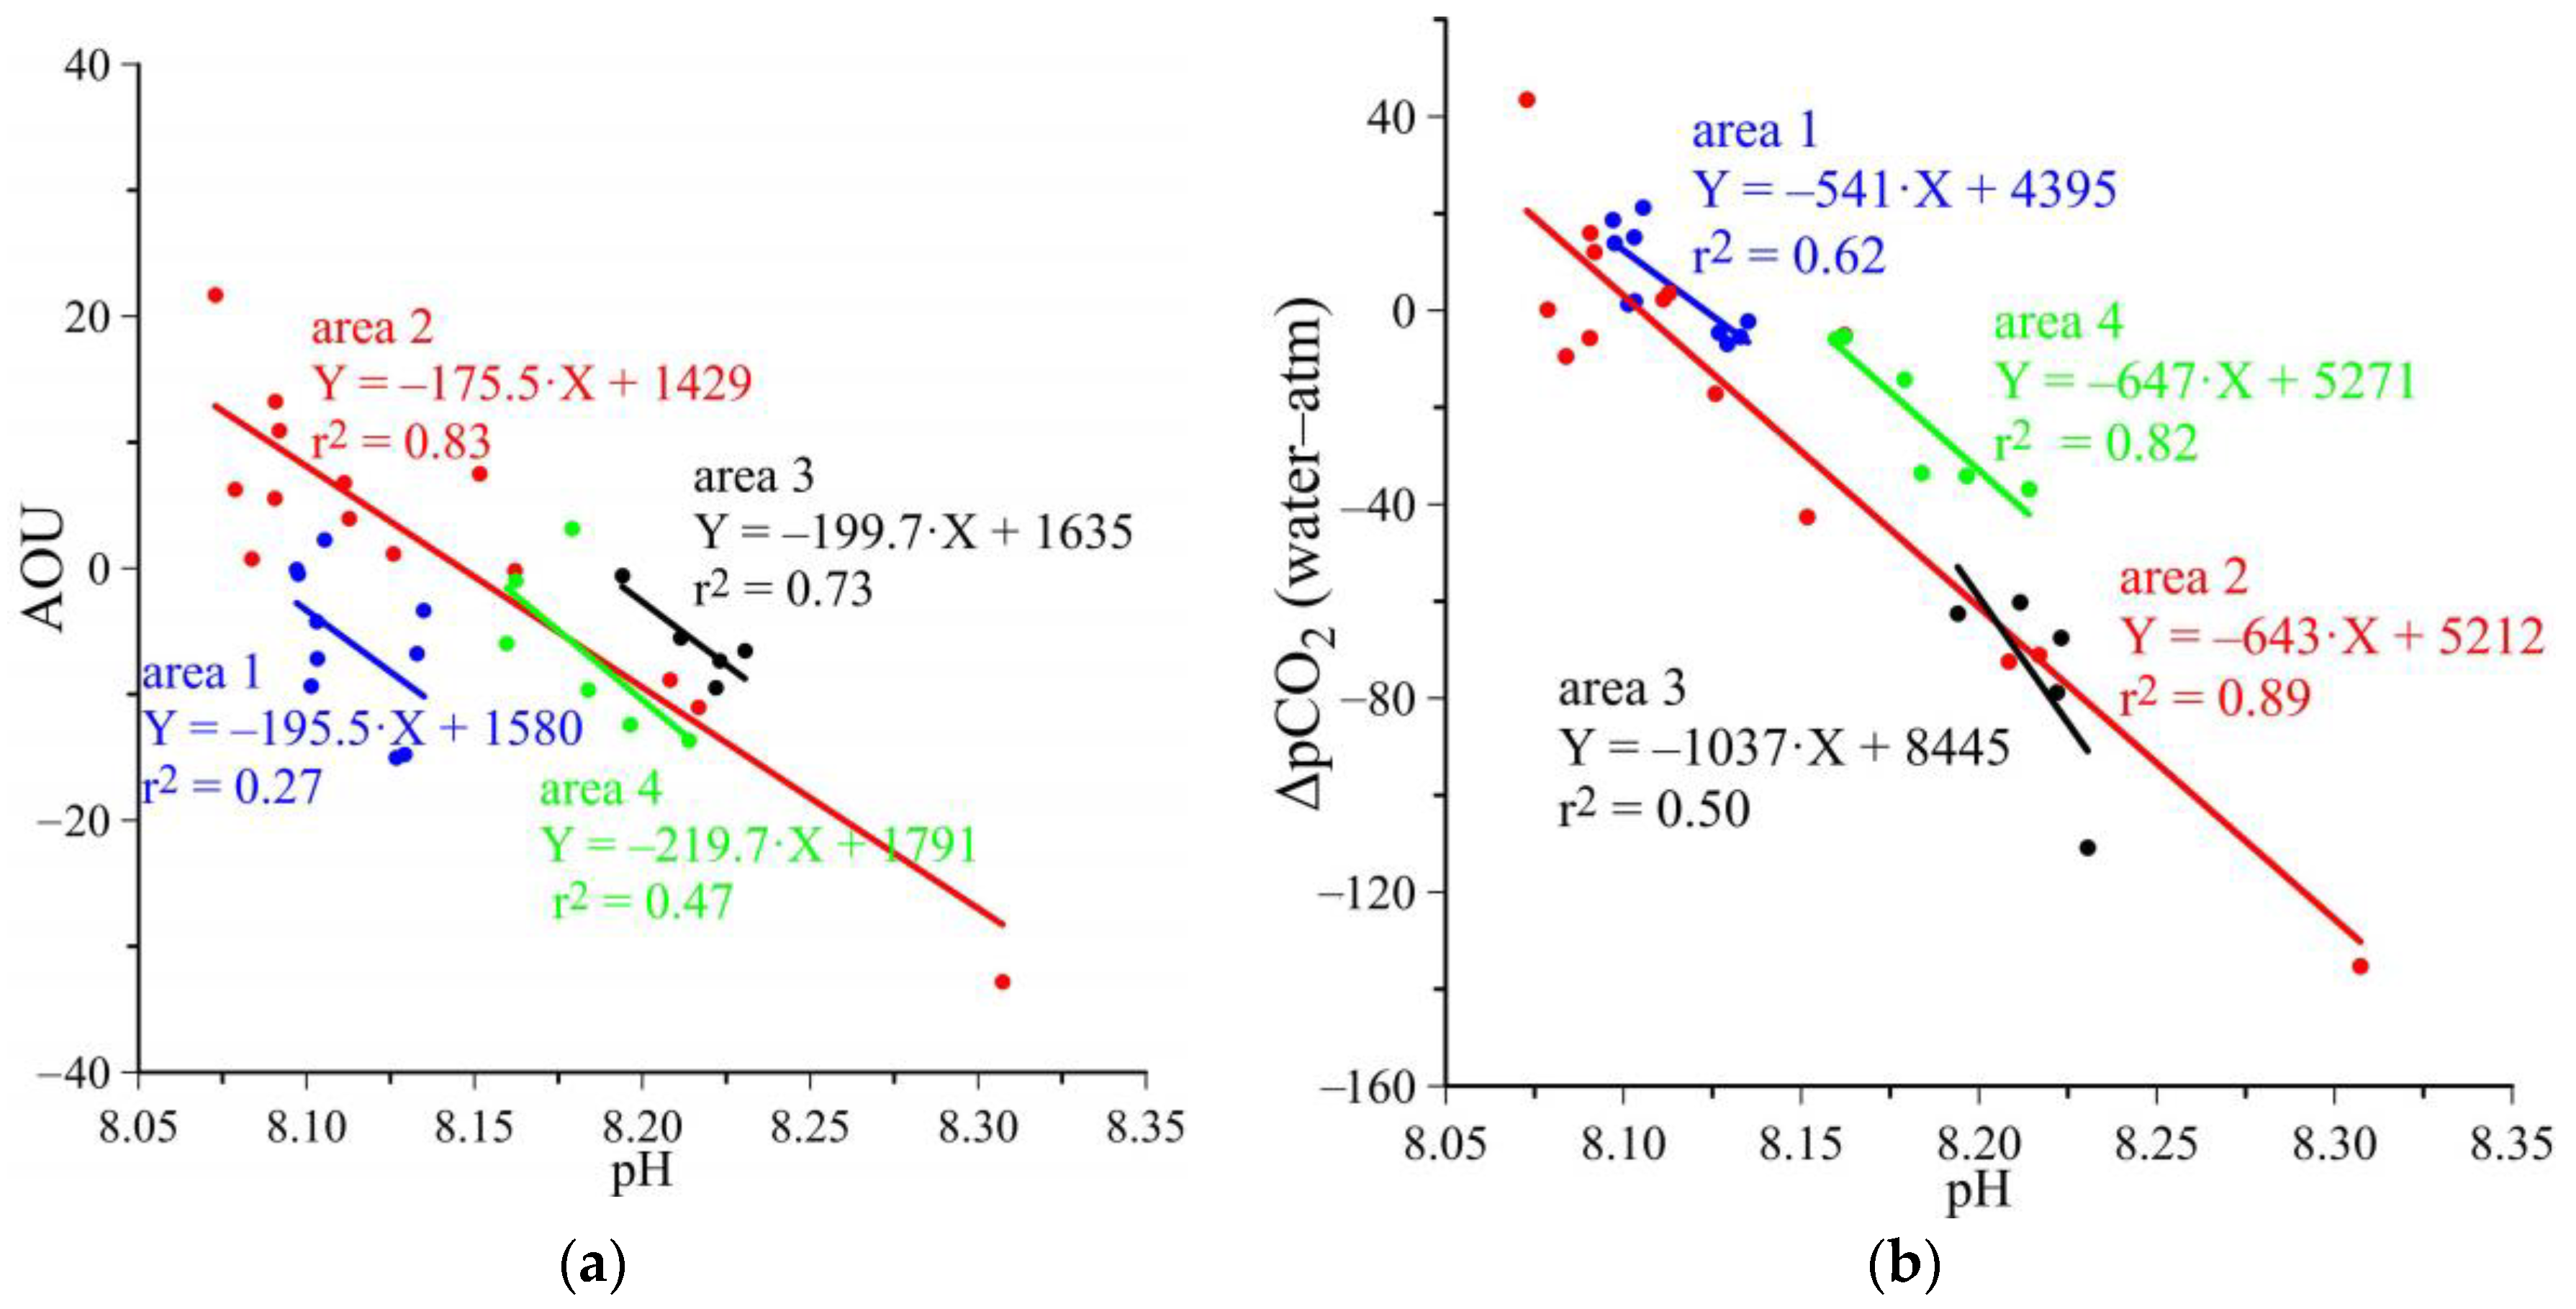
To assess the effect of biotic processes on the hydrochemical characteristics of water, we analyzed the relationship between the sea-air gradient of pCO2 or AOU and the pH values (Figure 8a,b). Those relationships were mainly determined by the concentration of carbon dioxide and the intensity of organic matter production and destruction processes. Decreasing the pH values would be observed in the case of prevailing oxidation of organic matter when oxygen is consumed, and carbon dioxide is released (Equation (1)).
In the Bransfield Strait, waters transformed due to the predominance of photosynthesis over the oxidation of organic matter, but the intensities of those “production–destruction” processes were different in Area 1 and Area 2 (Figure 6).
In Area 1 (Figure 7), the ratio of photosynthesis to the oxidation of organic matter varied from the prevailing photosynthesis at st. 7317, 7318 to the prevailing oxidation of organic matter at st. 7306. However, according to the ΔpCO2/AOU ratio (Figure 6, correlation coefficient 0.86), we would expect an additional source of carbon dioxide here. It is highly likely that the CO2 was accumulated as a result of biogeochemical processes (4, 5):
C6H12O6 + 6 O2 → 6 H+ + HCO3−
Ca2+ + 2 HCO3− → CaCO3↓+ CO2 + H2O
Another piece of evidence for the additional sources of CO2 comes from the slope on the graph of the ΔpCO2/AOU ratio (Figure 6). When the balance of oxygen and pCO2 in surface waters is determined by the processes of oxidation and the production of organic matter (Equation (1)), the angle of inclination should be close to 1. If this value is higher, an additional source of carbon dioxide due to both physical processes (influx from the atmosphere, water transport, temperature, salinity, ice melting) and biogeochemical processes of carbonate dissolution is expected.
At the same time, the absence of a correlation between AOU, ΔpCO2, and temperature or salinity (correlation coefficients were less than 0.1) is evidence for the predominant contribution of biotic factors that govern the distribution of oxygen and carbon dioxide in these waters. This is also confirmed by the ratio of the AOU or ΔpCO2 values to the pH values (Figure 8a,b) or total alkalinity. The pH value mostly depends on the concentration of carbon dioxide (Equation (2)), while the total alkalinity does not depend on the concentration of carbon dioxide [18] but on the concentration of carbonate and bicarbonate ions. The correlation coefficient between the sea-air ΔpCO2 and pH is 0.62 (Figure 8a), while there is no correlation between AOU and pH (Figure 8b) or the total alkalinity. This confirms our assumption about the biotic sources of CO2 in this area.
In Area 2 (Figure 6 and Figure 7), the transformation of waters and the changes in the concentration of oxygen and values of pCO2 in the surface waters are due to photosynthesis (st. 7334, 7333) and the oxidation of organic matter (st. 7323, 7324, 7308, 7309, 7306). Moreover, maximum concentrations of chlorophyll a in this area have been recorded in the surface waters at stations 7334 and 7333 [34]. Unlike in Area 1, waters in Area 2 undergo the processes of carbon dioxide removal (st. 7327, 7297, 7294, 7295), and we believe this is a result of the processes (6):
6CO2 + 6H2O → 6 H+ + 6HCO3− → H+ + CO32−
At the same time, the slope of ΔpCO2/AOU shows (Figure 6) that the intake of carbon dioxide is three times higher than the consumption of CO2 in photosynthesis and formation of oxygen (correlation coefficient 0.89). Thus, in this area, production and destruction processes involving organic matter are not the major drivers governing oxygen and pCO2 in the surface waters. The correlation coefficients of ΔpCO2 with temperature or salinity were 0.33 and 0.14, respectively. The correlation coefficient of AOU with temperature or salinity was 0.17. This indicates the minor importance of the physical processes for the distribution of CO2 and oxygen in the area.
Yet, the correlation coefficient of ΔpCO2 with pH is 0.89, AOU with pH is 0.83 (Figure 8a,b), while the relationship between ΔpCO2 and total alkalinity both in Area 1 and 2 is absent, which indicates an additional source of CO2 in this area.
In Area 3, st. 7335, 7340, 7342, 7345, 7347 (Figure 6), for cold and salty waters of the Weddell Sea, the predominance of photosynthesis for this type of water is traced to govern distributions of pCO2 and oxygen. The correlation of ΔpCO2 and AOU with physical characteristics is low (correlation coefficient with temperature is 0.31–0.33, and it is 0.11 for salinity), while the relationship with pH is high (0.73 for AOU and 0.5 for ΔpCO2), indicating the contribution of biotic factors to the dynamics of oxygen and CO2 in this area.
The dynamics of oxygen and pCO2 in Area 4 (st. 7359, 7364, 7365, 7366, 7368, 7369, 7370) is determined by the intrusion of the waters from the seas of Scotia and Weddell. Here, as well as in Area 3, photosynthesis is the predominant process in surface waters (Figure 6), however, the intensity of these processes in Area 4 differs significantly from Area 3, as it is seen from the angle of inclination. The dynamics of pCO2 is governed by changes in salinity (correlation coefficient is 0.54) and pH (correlation coefficient is 0.82), while AOU is governed by mixing processes, as the correlation coefficient with temperature is 0.70.
5. Conclusions
Complex interactions of water masses were traced for the Bransfield Strait and the northern part of the Weddell Sea. Each of the four to five water masses revealed its own set of unique characteristics [35,36].
Waters of the Bransfield Strait mainly revealed pCO2 oversaturation and O2 undersaturation, which was evidence of active organic carbon decomposition as the major controlling process. Results of the cruise in 2020 [37] showed that the central part of the Bransfield Strait, adjacent to the South Shetland Islands, was undersaturated with carbon dioxide. That effect was greater than for the waters near the Antarctic Peninsula, where pCO2 in the surface layer was closer to equilibrium. The oxygen saturation of waters in the area close to the islands was also higher, while the oxygen was below 90% near the coast of the peninsula [21,37]. These variations can be explained by the difference in the intensity of production-destruction processes. In the waters of the Weddell and Scotia seas, photosynthesis is the major governing process, and these waters are undersaturated with CO2 and oversaturated with O2. In this case, the results are consistent with the observations in 2020 [36]. Since the interaction of the main water masses occurs in deep layers, the hydrological conditions are more stable, and the production is lower than usually observed during the austral summer [19].
As it comes from the analysis of the distribution and correlation coefficients of AOU and the sea–air gradients of pCO2 with other physical and biogeochemical properties, the predominance of biotic processes in the dynamics of oxygen and pCO2 in surface waters have been demonstrated for the studied areas. There is evidence of additional sources of CO2 that are not associated with the processes of production and destruction of organic matter. Presumably, this occurs due to the exchange of carbon dioxide in the atmosphere, which reveals higher pCO2 values than in water [35].
Author Contributions
N.A.O. and A.A.P. conceptualized and designed the study; A.M.S. collected samples and investigation; N.A.O., S.K.K. and A.A.P. analyzed the data and wrote the first draft of the manuscript; A.M.S. technical support the MS. All authors have read and agreed to the published version of the manuscript.
Funding
This research was funded by the state assignments of FRC MHI # FNNN-2022-0001 “Complex oceanological studies of abiotic factors of the ecosystem in the Atlantic Antarctic” and # FNNN-2022-0002 “Monitoring of the carbonate system, CO2 content and its fluxes in the marine environment of the Black and Azov Seas”; the state agreement of Shirshov Institute of Oceanology FMWE-2021-0007.
Institutional Review Board Statement
Not applicable.
Informed Consent Statement
Not applicable.
Data Availability Statement
Not applicable.
Acknowledgments
The authors are grateful to the administration of the Shirshov Institute of Oceanology, the Russian Academy of Sciences for the organization of the expedition and field operations, the captain and crew of the R/V Akademik Mstislav Keldysh for comprehensive assistance, and also to Masevich A.V. for invaluable assistance in data collection.
Conflicts of Interest
The authors declare no conflict of interest.
References
- Brandon, M.; Goyet, C.; Touratier, F.; Lefèvre, N.; Kestenare, E.; Morrow, R. Spatial and temporal variability of the physical, carbonate and CO2 properties in the Southern Ocean surface waters during austral summer (2005–2019). Deep. Sea Res. Part I Oceanogr. Res. Pap. 2022, 187, 103836. [Google Scholar] [CrossRef]
- Wu, Y.; Bakker, D.C.; Achterberg, E.P.; Silva, A.N.; Pickup, D.D.; Li, X.; Hartman, S.E.; Stappard, D.; Qi, D.; Tyrrell, T. Integrated analysis of carbon dioxide and oxygen concentrations as a quality control of ocean float data. Commun. Earth Environ. 2022, 3, 1–11. [Google Scholar] [CrossRef]
- Dlugokencky, E.; Tans, P. Trends in Atmospheric Carbon Dioxide, National Oceanic and Atmospheric Administration, Earth System Research Laboratory (NOAA/ESRL). Available online: https://gml.noaa.gov/ccgg/trends/ (accessed on 22 March 2022).
- Frölicher, T.L.; Sarmiento, J.L.; Paynter, D.J.; Dunne, J.P.; Krasting, J.P.; Winton, M. Dominance of the Southern Ocean in anthropogenic carbon and heat uptake in CMIP5 models. J. Clim. 2015, 28, 862–886. [Google Scholar] [CrossRef]
- Deppeler, S.L.; Davidson, A.T. Southern Ocean phytoplankton in a changing climate. Front. Mar. Sci. 2017, 4, 40. [Google Scholar] [CrossRef]
- Henley, S.F.; Cavan, E.L.; Fawcett, S.E.; Kerr, R.; Monteiro, T.; Sherrell, R.M.; Bowie, A.R.; Boyd, P.W.; Barnes, D.K.A.; Schloss, I.R.; et al. Changing biogeochemistry of the Southern Ocean and its ecosystem implications. Front. Mar. Sci. 2020, 7, 581. [Google Scholar] [CrossRef]
- Bushinsky, S.M.; Landschützer, P.; Rödenbeck, C.; Gray, A.R.; Baker, D.; Mazloff, M.R.; Resplandy, L.; Johnson, K.S.; Sarmiento, J.L. Reassessing Southern Ocean air-sea CO2 flux estimates with the addition of biogeochemical float observations. Glob. Biogeochem. Cycles 2019, 33, 1370–1388. [Google Scholar] [CrossRef]
- Keller, D.P.; Kriest, I.; Koeve, W.; Oschlies, A. Southern Ocean biological impacts on global ocean oxygen. Geophys. Res. Lett. 2016, 43, 6469–6477. [Google Scholar] [CrossRef]
- Ogundare, M.O.; Fransson, A.; Chierici, M.; Joubert, W.R.; Roychoudhury, A.N. Variability of sea-air carbon dioxide flux in Autumn across the Weddell Gyre and Offshore Dronning Maud Land in the Southern Ocean. Front. Mar. Sci. 2021, 7, 1168. [Google Scholar] [CrossRef]
- Choudhury, D.; Menviel, L.C.; Meissner, K.J.; Yeung, N.K.; Chamberlain, M.A.; Ziehn, T. Marine carbon cycle response to a warmer Southern Ocean: The case of the Last Interglacial. Clim. Past 2021, 18, 507–523. [Google Scholar] [CrossRef]
- Mongwe, N.P.; Vichi, M.; Monteiro, P.M.S. The seasonal cycle of pCO2 and CO2 fluxes in the Southern Ocean: Diagnosing anomalies in CMIP5 Earth system models. Biogeosciences 2018, 15, 2851–2872. [Google Scholar] [CrossRef]
- Carrillo, C.J.; Smith, R.C.; Carl, D.M. Processes regulating oxygen and carbon dioxide in surface waters west of the Antarctic Peninsula. Mar. Chem. 2004, 84, 161–179. [Google Scholar] [CrossRef]
- Takahashi, T.; Sutherland, S.C.; Sweeney, C.; Poisson, A.; Metzl, N.; Tilbrook, B.; Bates, N.R.; Wanninkhof, R.; Feely, R.A.; Sabine, C.L.; et al. Global sea-air CO2 flux based on climatological surface ocean pCO2, and seasonal biological and temperature effects. Deep Sea Res. Part II Top. Stud. Oceanogr. 2002, 49, 1601–1622. [Google Scholar] [CrossRef]
- Schmidtko, S.; Stramma, L.; Visbeck, M. Decline in global oceanic oxygen content during the past five decades. Nature 2017, 542, 335–339. [Google Scholar] [CrossRef] [PubMed]
- Doney, C. Marine ecosystems, biogeochemistry, and climate. Int. Geophys. 2013, 103, 817–842. [Google Scholar] [CrossRef]
- Rabalais, N.N.; Dıaz, R.J.; Levin, L.A.; Turner, R.E.; Gilbert, D.; Zhang, J. Dynamics and distribution of natural and human-caused hypoxia. Biogeosciences 2010, 7, 585–619. [Google Scholar] [CrossRef]
- Riebesell, U.; Gattuso, J.-P.; Thingstad, T.F.; Middelburg, J.J. Preface “Arctic ocean acidification: Pelagic ecosystem and biogeochemical responses during a mesocosm study”. Biogeosciences 2013, 10, 5619–5626. [Google Scholar] [CrossRef]
- Majkut, J.D.; Carter, B.R.; Frölicher, T.L.; Dufour, C.O.; Rodgers, K.B.; Sarmiento, J.L. An observing system simulation for Southern Ocean carbon dioxide uptake. Philos. Trans. R. Soc. A Math. Phys. Eng. Sci. 2014, 372, 20130046. [Google Scholar] [CrossRef]
- Romanova, N.D.; Mosharov, S.A.; Bardyukova, E.V.; Artemiev, V.A.; Vorobieva, O.V. Quantitative and Production Characteristics of Phytoplankton in the Northern Part of the Weddell Sea in Summer. Oceanology 2022, 62, 185–197. [Google Scholar] [CrossRef]
- Sanchez, N.; Reiss, C.S.; Holm-Hansen, O.; Hewes, C.D.; Bizsel, K.C.; Ardelan, M.V. Weddell-Scotia Confluence Effect on the Iron Distribution in Waters Surrounding the South Shetland (Antarctic Peninsula) and South Orkney (Scotia Sea) Islands During the Austral Summer in 2007 and 2008. Front. Mar. Sci. 2019, 6, 771. [Google Scholar] [CrossRef]
- Orekhova, N.A.; Vidnichuk, A.V.; Konovalov, S.K. Features and processes of the oxygen and pCO2 dynamics in the surface waters in the western parts of the Weddell and Scotia Seas (Southern Ocean). In Antarctic Peninsula Region of the Southern Ocean; Morozov, E.G., Flint, M.V., Spiridonov, V.A., Eds.; Springer: Cham, Switzerland, 2021; Volume 6, pp. 175–186. [Google Scholar] [CrossRef]
- Krechik, V.A.; Frey, D.I.; Morozov, E.G. Peculiarities of Water Circulation in the Central Part of the Bransfield Strait in January 2020. Dokl. Earth Sci. 2021, 496, 92–95. [Google Scholar] [CrossRef]
- Morozov, E.G.; Frey, D.I.; Polukhin, A.A.; Krechik, V.A.; Artemiev, V.A.; Gavrikov, A.V.; Kasian, V.V.; Sapozhnikov, F.V.; Gordeeva, N.V.; Kobylyansky, S.G. Mesoscale variability of the ocean in the northern part of the Weddell sea. Oceanology 2020, 60, 663–679. [Google Scholar] [CrossRef]
- Gordon, A.L. Western Weddell sea thermohaline stratification. Ocean, ice, and atmosphere: Interactions at the Antarctic continental margin. Antarct. Res. Ser. 1998, 75, 215–240. [Google Scholar]
- Foster, T.D.; Carmack, E. Temperature and salinity structure in the Weddell Sea. J. Phys. Oceanogr. 1976, 6, 36–44. [Google Scholar] [CrossRef]
- Meredith, M.P.; Garabato, A.N.; Gordon, A.L.; Johnson, G.C. Evolution of the Deep and Bottom Waters of the Scotia Sea, Southern Ocean, during 1995–2005. J. Clim. 2008, 21, 3327–3343. [Google Scholar] [CrossRef]
- Artamonov, Y.V.; Skripaleva, E.A.; Nikolsky, N.V. Climatic structure of the dynamic and temperature fronts in the Scotia Sea and the adjacent water areas. Phys. Oceanogr. 2022, 9, 117–138. Available online: https://cyberleninka.ru/article/n/climatic-structure-of-the-dynamic-and-temperature-fronts-in-the-scotia-sea-and-the-adjacent-water-areas (accessed on 22 March 2022).
- Carpenter, J.H. The Chesapeake Bay institute technique for the Winkler dissolved oxygen method. Limnol. Oceanogr. 1965, 10, 141–143. [Google Scholar] [CrossRef]
- Dickson, A. Determination of Dissolved Oxygen in Sea Water by Winkler Titration. WHP Operations and Methods v.1.01. 1996. Available online: https://cchdo.github.io/hdo-assets/documentation/manuals/pdf/91_1/dickson2.pdf (accessed on 17 March 2023).
- Weiss, R.F. The solubility of nitrogen, oxygen and argon in water and seawater. Deep. Sea Res. Oceanogr. Abstr. 1970, 17, 721–735. [Google Scholar] [CrossRef]
- Khoruziy, D.S. Use of the AS-C3 instrument complex to determine partial pressure of carbon dioxide and concentration of inorganic carbon in seawater. Environ. Saf. Coast. Shelf Zones Integr. Use Shelf Resour. 2010, 23, 260–272. [Google Scholar]
- Dickson, A.G.; Sabine, C.L.; Christian, J.R. (Eds.) Guide to the Best Practices for Ocean CO2 Measurements; PICES Special Publication: Sidney, BC, Canada, 2007; Volume 3, p. 191. [Google Scholar]
- Weiss, R.F. Carbon dioxide in water and seawater: The solubility of a non-ideal gas. Mar. Chem. 1974, 2, 203–215. [Google Scholar] [CrossRef]
- Morozov, E.G.; Flint, M.V.; Orlov, A.M.; Frey, D.I.; Molodtsova, T.N.; Krechik, V.A.; Latushkin, A.A.; Salyuk, P.A.; Murzina, S.A.; Minin, K.V.; et al. oceanographic and ecosystem studies in the Atlantic sector of Antarctica (cruise 87 of the research vessel “Akademik Mstislav Keldysh”). Oceanology 2022, 62, 825–827. [Google Scholar] [CrossRef]
- Polukhin, A.A.; Morozov, E.G.; Tishchenko, P.P.; Frey, D.I.; Artemiev, V.A.; Borisenko, G.V.; Vidnichuk, A.V.; Marina, E.N.; Medvedev, E.V.; Popov, O.S.; et al. Water Structure in the Bransfield Strait (Antarctica) in January 2020: Hydrophysical, Optical, and Hydrochemical Features. Oceanology 2021, 61, 632–644. [Google Scholar] [CrossRef]
- Fedotova, A.A.; Stepanova, S.V. Water Mass Transformation in the Powell Basin. In Antarctic Peninsula Region of the Southern Ocean. Advances in Polar Ecology; Morozov, E.G., Flint, M.V., Spiridonov, V.A., Eds.; Springer: Cham, Switzerland, 2021; Volume 6. [Google Scholar] [CrossRef]
- Morozov, E.G.; Spiridonov, V.A.; Molodtsova, T.N.; Frey, D.I.; Demidova, T.A.; Flint, M.V. Investigations of the Ecosystem in the Atlantic Sector of Antarctica (Cruise 79 of the R/V Akademik Mstislav Keldysh). Oceanology 2020, 60, 721–723. [Google Scholar] [CrossRef]
Figure 1.
Locations of oceanographic stations in the 87th cruise of the R/V “A. M. Keldysh”.

Figure 2.
Spatial variation in oxygen saturation (a) and pCO2 concentration (b) at the surface waters of the transect from 56° W to the Orkney Islands.
Figure 2.
Spatial variation in oxygen saturation (a) and pCO2 concentration (b) at the surface waters of the transect from 56° W to the Orkney Islands.

Figure 3.
Spatial variation in oxygen saturation (a) and pCO2 concentration (b) at the surface waters of the Antarctic Sound.
Figure 3.
Spatial variation in oxygen saturation (a) and pCO2 concentration (b) at the surface waters of the Antarctic Sound.

Figure 4.
Spatial variation in oxygen saturation (a) and pCO2 concentration (b) at the surface waters of the Bransfield Strait.
Figure 4.
Spatial variation in oxygen saturation (a) and pCO2 concentration (b) at the surface waters of the Bransfield Strait.

Figure 5.
AOU (a) and ΔpCO2 (b) distribution depending on temperature and salinity.

Figure 6.
Ratio of pCO2 gradient to apparent oxygen consumption (AOU) in different areas.

Figure 7.
Areas with different water characteristics, identified by the ratio of ΔpCO2/AOU. The blue circles are the stations of the Area 1, the red circles are the stations of the Area 2, the black circles are the stations of the Area 3, the black triangles are the stations of the Area 4.
Figure 7.
Areas with different water characteristics, identified by the ratio of ΔpCO2/AOU. The blue circles are the stations of the Area 1, the red circles are the stations of the Area 2, the black circles are the stations of the Area 3, the black triangles are the stations of the Area 4.

Figure 8.
Relationship between AOU (a) or ΔpCO2 (b) and pH values.


Table 1.
Mean (up) and range (down) of the sea surface temperature (SST), salinity (S), oxygen (O2) concentration and percent of saturation, and pCO2 in water.
Table 1.
Mean (up) and range (down) of the sea surface temperature (SST), salinity (S), oxygen (O2) concentration and percent of saturation, and pCO2 in water.
| Studied Area | SST, °C | S, ‰ | O2 | pCO2, µatm | |
|---|---|---|---|---|---|
| µM | % sat. | ||||
| Transect from 56° W to Orkney Islands, zone of influence of Scotia and Weddell seas (st. 7334, 7335, 7340, 7342, 7345,7347, 7359, 7364, 7365, 7366, 7368, 7369, 7370) | 0.53 −0.64–+1.12 | 34.33 34.07–34.46 | 355 342–389 | 100 96–106 | 372 287–422 |
| Antarctic Sound (st. 7324, 7326, 7327, 7329, 7333) | −0.41 −0.63–−0.08 | 34.44 34.37–34.53 | 356 345–366 | 98 95–100 | 385 353–428 |
| Bransfield Strait (st. 7294, 7295, 7297, 7299, 7301, 7305, 7306, 7308, 7309, 7310, 7311, 7314, 7316, 7317, 7318, 7320, 7322, 7323) | 0.73 −0.32–+1.58 | 34.39 34.14–34.55 | 344 321–357 | 97 91–102 | 432 419–465 |
Disclaimer/Publisher’s Note: The statements, opinions and data contained in all publications are solely those of the individual author(s) and contributor(s) and not of MDPI and/or the editor(s). MDPI and/or the editor(s) disclaim responsibility for any injury to people or property resulting from any ideas, methods, instructions or products referred to in the content. |
© 2023 by the authors. Licensee MDPI, Basel, Switzerland. This article is an open access article distributed under the terms and conditions of the Creative Commons Attribution (CC BY) license (https://creativecommons.org/licenses/by/4.0/).
Share and Cite
MDPI and ACS Style
Orekhova, N.A.; Konovalov, S.K.; Polukhin, A.A.; Seliverstova, A.M. Oxygen and pCO2 in the Surface Waters of the Atlantic Southern Ocean in 2021–2022. Water 2023, 15, 1642. https://doi.org/10.3390/w15091642
AMA Style
Orekhova NA, Konovalov SK, Polukhin AA, Seliverstova AM. Oxygen and pCO2 in the Surface Waters of the Atlantic Southern Ocean in 2021–2022. Water. 2023; 15(9):1642. https://doi.org/10.3390/w15091642
Chicago/Turabian StyleOrekhova, Natalia A., Sergey K. Konovalov, Alexander A. Polukhin, and Anna M. Seliverstova. 2023. "Oxygen and pCO2 in the Surface Waters of the Atlantic Southern Ocean in 2021–2022" Water 15, no. 9: 1642. https://doi.org/10.3390/w15091642
Note that from the first issue of 2016, this journal uses article numbers instead of page numbers. See further details here.