
Hydro-Meteorological Characteristics of the 1973 Catastrophic Flood in the Mahi Basin, India


1
Department of Geography, HPT Arts and RYK Science College, Nashik 422 005, Maharashtra, India
2
School of Civil and Mechanical Engineering, Faculty of Science and Engineering, Curtin University, Bentley, Perth, WA 6102, Australia
3
Department of Civil Engineering and Construction, Faculty of Engineering and Design, Atlantic Technological University, F91 YW50 Sligo, Ireland
*
Authors to whom correspondence should be addressed.
Water 2023, 15(9), 1648; https://doi.org/10.3390/w15091648
Submission received: 7 March 2023
/
Revised: 10 April 2023
/
Accepted: 20 April 2023
/
Published: 23 April 2023
(This article belongs to the Special Issue The Interrelationship between Climate Change, Human Activities and Hydrological Processes, Volume II)
Abstract
:The September 1973 flood in the Mahi Basin was one of the most catastrophic and widespread in the 20th century. However, the hydro-meteorological characteristics of the 1973 flood were not studied. Therefore, an attempt has been made to analyze the meteorological and hydrological processes that led to the 1973 flood. Accordingly, daily rainfall data, river discharge, and cross-section data were obtained for the analysis. The 1973 flood was associated with very heavy rainfall resulting from two successive low-pressure systems (LPS) from 26 to 31 August 1973 and 2 to 5 September 1973. The rainfall variability in the Mahi Basin was 24% (annual) and 25% (monsoon) in 1973. The analysis showed that out of 69 rainfall stations, 13 stations received 100% rainfall in the monsoon season in 1973. Under the influence of the second LPS (7 and 9 September 1973), 21 rain gauge stations recorded very heavy rainfall (124.5–244.4 mm) on 8 September. As a result, the maximum discharge of the Mahi River (40,663 m3/s) was observed at Wanakbori on 9 September. The flood hydrograph denoted two flood peaks of 28,125 m3/s and 33,097 m3/s magnitudes resulting from LPS at Kadana. A newly constructed bridge (in 1972) on the Mahi River at the Kailashpuri village washed out due to a large discharge of 21,553 m3/s magnitude on 7 September 1973. The hydro-meteorological analysis of the 1973 flood specified the significance of the LPS in a flash flood disaster in the Mahi Basin. This study will benefit hydrologists and civil engineers creating design floods for the construction of the hydraulic structures in the Mahi Basin, and will help to avoid any future catastrophic floods.
1. Introduction
Flooding is regarded as one of the most destructive natural disasters, causing loss of life and economic damage [1,2,3]. Worldwide, many researchers have evaluated the effects of flash floods and their significant monetary losses, damage to infrastructure, displacement, and loss of life [4,5,6,7,8,9,10,11]. According to Pereira et al. [12], flash floods are short-duration and intense hydrometeorological events that affect small basin areas for a short period. The flooding problem is aggravated by several other factors, for instance, a decrease in the discharge-carrying capacity of the river due to heavy sediment load from the catchments, sedimentation in the river channel, alterations in the river channels due to erosion of beds and banks, and damming of flows in the river and tributaries due to landslides [13]. Floods are accompanied by river dynamics, and become natural disasters when they affect humans and their actions [14,15]. Most of the flood-affected population (about 1.36 billion) is found in Asia (South and East), mainly in China (329 million) and India (225 million) [16].
An investigation of extreme hydro-meteorological events for the design of hydraulic structures is essential [17]. Historic pre-instrumental records and longest stream flow time series data have great significance in the design of hydraulic structures, namely, dams, bridges, and culverts [18]. Extreme rainfall, resulting in floods and scour, is the most dynamic cause of bridge failures [19,20]. Globally, numerous studies have been conducted on the effects of floods on infrastructure in different countries. Shah [21] stated that the 1998 65-day flood in Bangladesh devastated roads and bridges along with houses, crops, and livestock. Similarly, Mustafa [22] reported that the 1987 flood caused serious damage to bridges, roads, railway lines, telephone connections, and dams in Pakistan. In India, Dhar et al. [23] have provided an investigation of the rainstorm that caused the Machhu-2 earth dam (6 km upstream of Morvi) to collapse under the onrush of an unprecedented volume of water on 11 August 1979. Flood-induced dam failure events have resulted either from mismanagement practices or inaccuracy in the computation of the design flood that did not consider or project extreme meteorological events under climate change circumstances, or the reservoir capability [24,25]. According to Adamo et al. [26], overtopping caused by floods has been one of the major causes of dam failure, which exceeds the spillway capacity as a result of insufficient knowledge of the hydrological conditions of the region and incorrect assessment of the inflow design discharge.
The climate of South Asia is significantly determined by the southwest monsoon. There are spatiotemporal variations in rainfall in the different countries of South Asia because of their geographical location, topography, and meteorological conditions [27]. According to Kronstadt, [28] heavy monsoon rainfall connected with the low depressions originating over the Bay of Bengal and moving west/northwest through India is the main cause of the floods in Pakistan. As a result, heavy rainfall in different regions of Pakistan during the monsoon season (July to September) caused severe floods in the Indus River Basin [29]. According to Dewan [30], flash floods are the most common in Bangladesh due to heavy rainfall in the hilly areas of the rivers and resulting streamflows, poor drainage, and storm surges that create flooding in the flood plains of major rivers and coastal regions. According to Sharma et al. [31], rugged hilly topography, fragile geology, and high-intensity monsoon rainfall is making Nepal more vulnerable to flooding. The flood hazard affects the population, infrastructure, and settlements in rural areas as well as in urban areas of Bangladesh and Nepal [30]. Likewise, floods in the large rivers of India, such as the Brahmaputra, Kosi, Ganga, Teesta, Mahanadi, Narmada, Tapi, Mahi, Godavari, and Kaveri, have received greater attention from researchers in various fields in India [32,33].
In India, heavy to very heavy monsoon rainfall associated with a low-pressure system (LPS) that forms over the Bay of Bengal and adjoining land regions and moves west or northwestward, with an extent of about 1000–2000 km and duration of 3 to 6 days, is the foremost reason for flash floods [34,35,36]. According to Roxy et al. [37], the average monsoon rainfall over India has decreased; nevertheless, the frequency of extreme rainfall events (daily rainfall ≥150 mm) increases by approximately 75% during the monsoon season. The monsoon variability has been greater in recent decades, causing natural disasters such as droughts and floods [38,39]. A comprehensive analysis of rainfall distribution, variability and trends has great significance for effective flood and drought management, water resource planning, and design of hydraulic structures [40,41,42].
The rainfall characteristics of the Mahi Basin are significantly governed by the monsoon rainfall. The major floods in the Mahi Basin associated with LPSs and subsequent heavy rainfall were the 1913, 1920, 1927, 1937, 1941, 1952, 1959, 1968, 1973, 1976, 1990, 1994, and 2006 floods [43]. Flood discharge time series data (from 1959 to 2016) specified that high-magnitude discharges recorded at Wanakbori are associated with LPSs. The high-magnitude flood (40,663 m3/s) observed at Wanakbori in 1973 was the largest in the Mahi River [44]. Nevertheless, very little geomorphological, hydrological, and meteorological information about the 1973 flood is known. Therefore, it is essential to understand the hydro-meteoroidal characteristics of the Mahi River to protect against losses caused by any future floods. The present study provides a comprehensive and multi-dimensional assessment of the 1973 flood in the Mahi Basin. Therefore, the objective of this research is to investigate the hydro-meteorological characteristics of the 1973 flood in the Mahi Basin.
2. Study Area
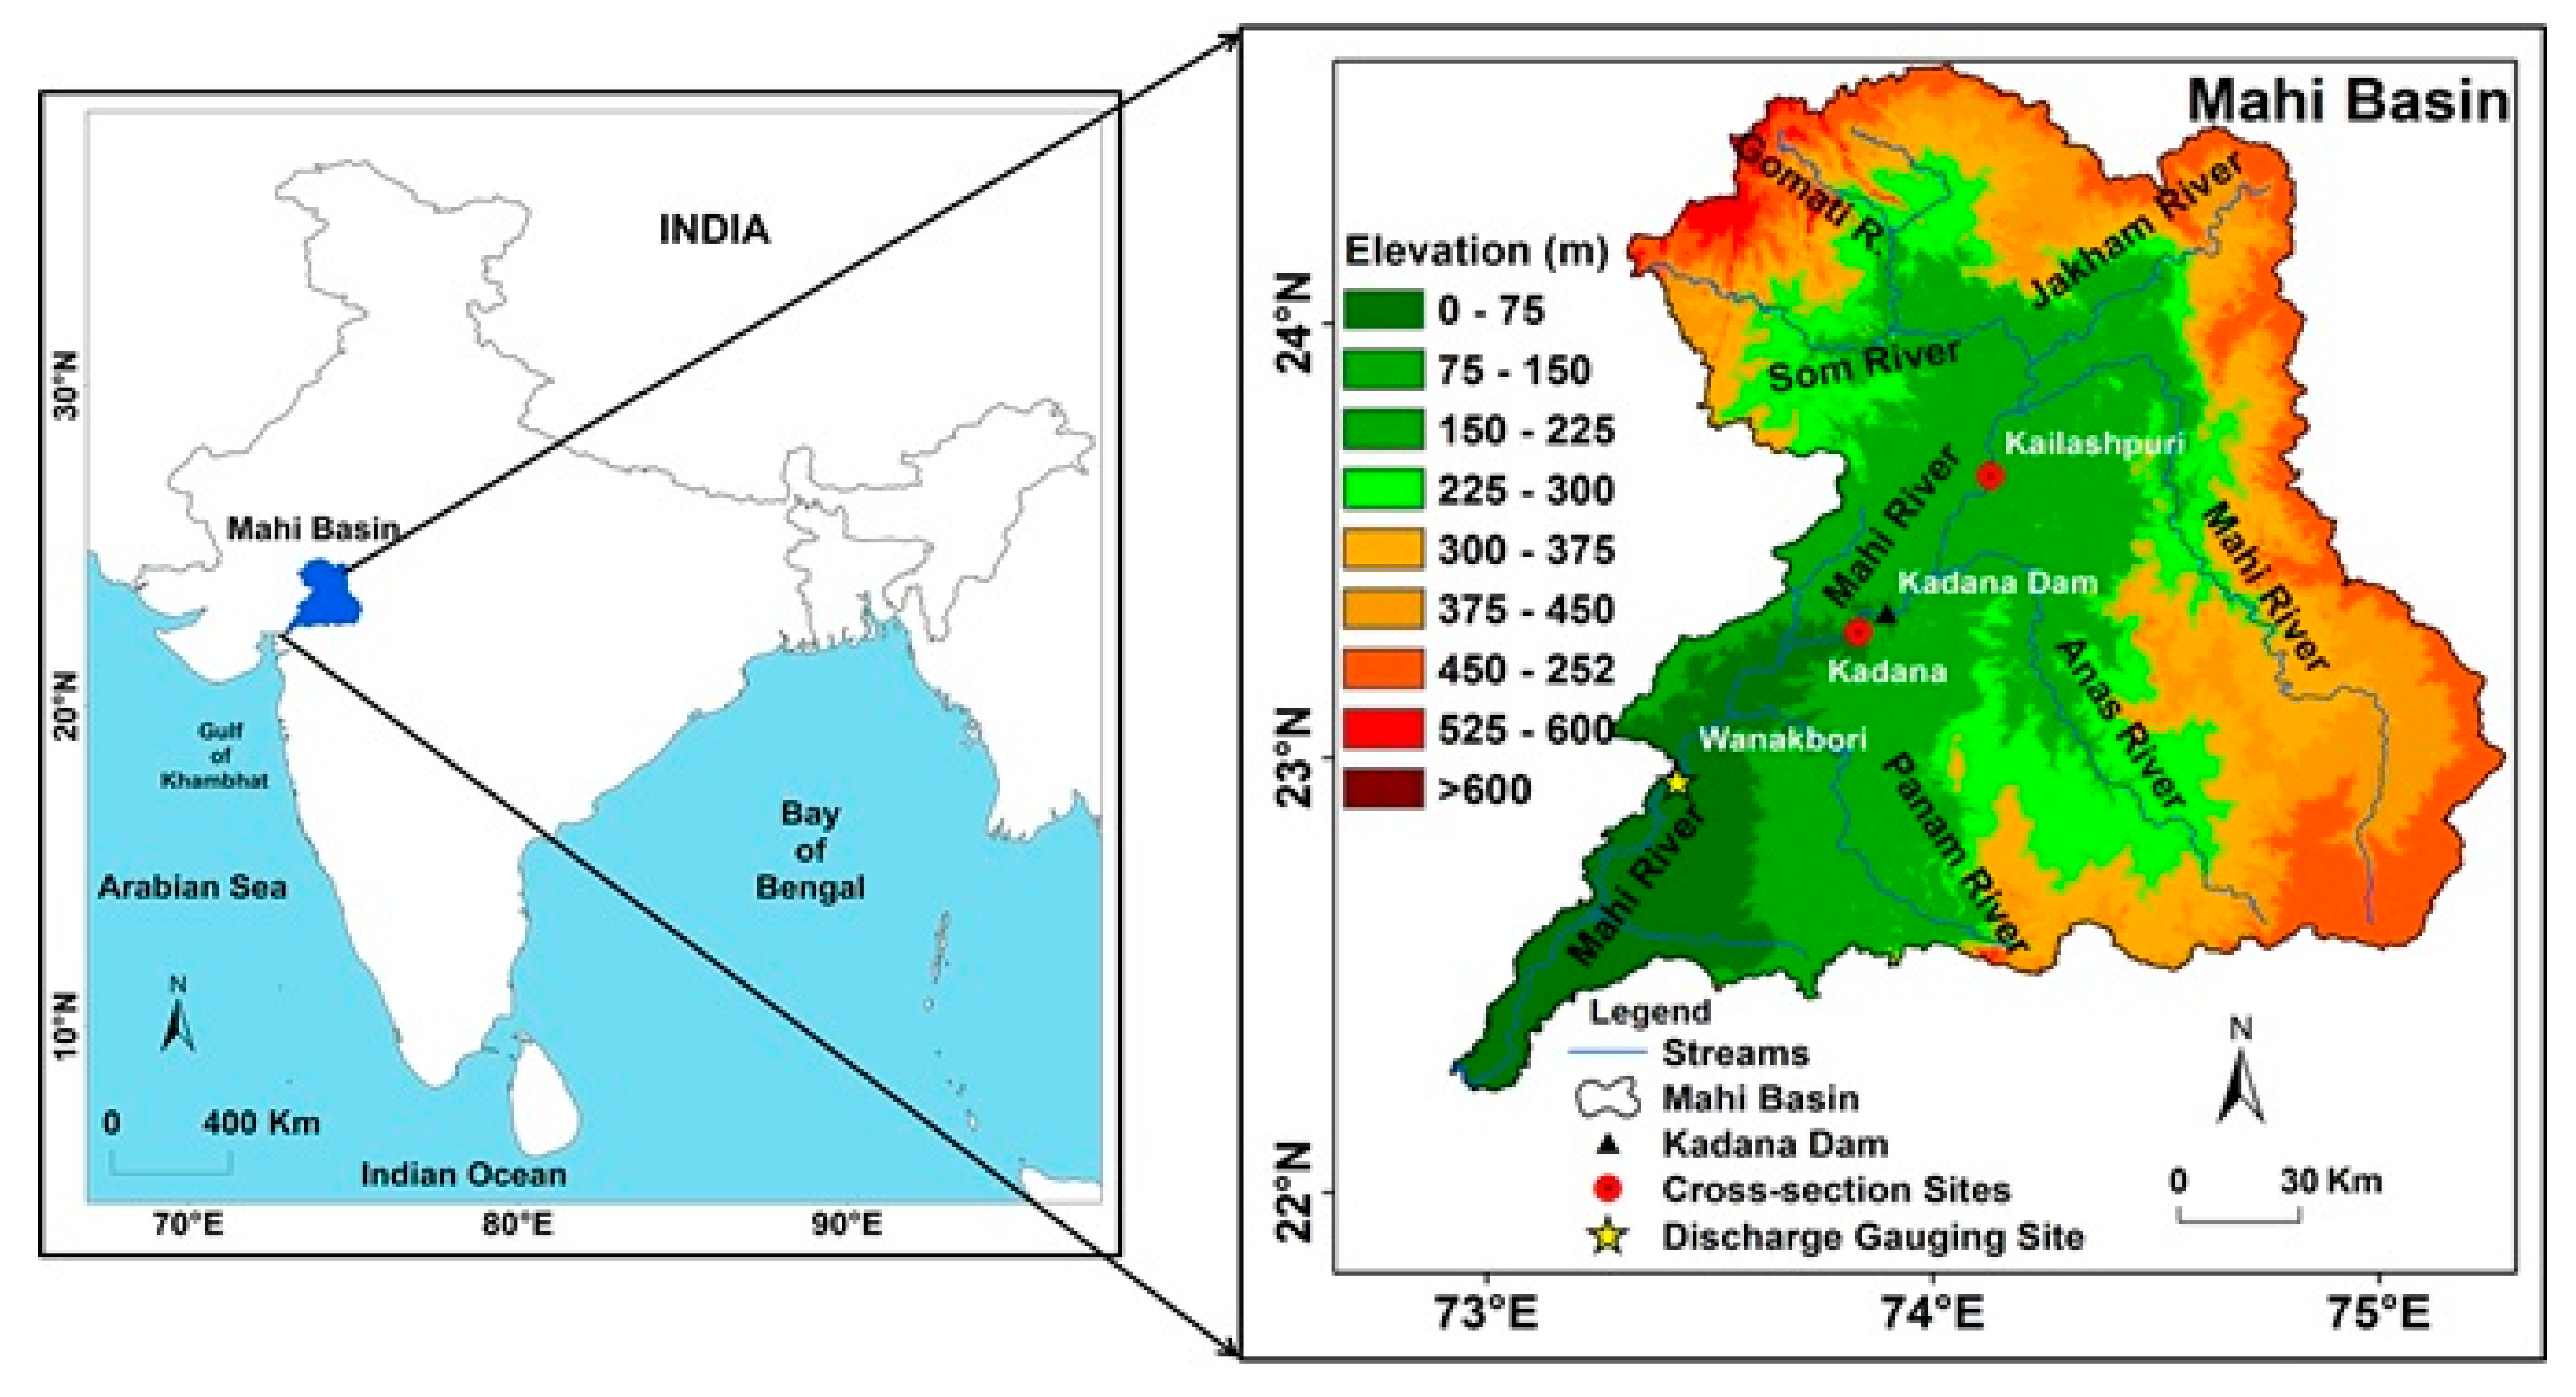
The Mahi River is the third largest interstate west-flowing river in India (refer to Figure 1). The river originates near the Minda village of the Sardarpur tehsil in the Dhar district (Madhya Pradesh) at an elevation of 580 m. It flows for a length of 583 km and meets the Gulf of Khambhat in Gujarat. The Som River, the Jakham River, the Anas River, and the Panam River are the major tributaries of the Mahi River (Figure 1). The Mahi Basin extends between 22°12′55″ to 24°35′22″ N latitudes and 72°46′11″ to 75°16′55″ E longitudes [43]. The drainage area of the basin is 34,842 km2. It covers 19.22% of the area of Madhya Pradesh, 47.22% area of Rajasthan, and 33.56% of the area of Gujarat. The annual average rainfall (AAR) of the Mahi Basin is 889 mm. About 97% of the annual rainfall occurs during the monsoon season (June–September). July (33%) is the rainiest month throughout the basin, followed by August (32%). The basin contains two climatic regions; the northern part of the basin comprises a subtropical wet climate in the upper reaches and a tropical wet climate in the lower reaches. The Mahi Basin is significantly influenced by the LPSs that form over either Bay of Bengal or adjoining land and move in western and northwestern directions [43]. These LPSs are accountable for boosting the rainfall of the Mahi Basin. Table 1 denotes some of the notable flash floods in the Mahi Basin in the past (1901–2020). The geology of the Mahi Basin encompasses the rocks of the Deccan Trap (Basalt), the Proterozoic Vindhyan Supergroup (sedimentary and metasedimentary rocks), Aravali Supergroup rocks (Leucogranite intrusion, granites, amphibolites), and Banded Gneissic Complex (BCG) rocks [45]. The vast area of the basin is occupied mainly by red and black soils. The maximum area of the basin is covered by finely textured soils (65.60%), followed by rocks and non-soil, accounting for 12.96% [46]. According to Patle et al. [47], agriculture is the most dominant land use land cover in the Mahi Basin (65% of the area), followed by 11% forest cover and about 2.9% taken up by water bodies.
3. Data and Methodology
3.1. Hydro-Meteorological Data
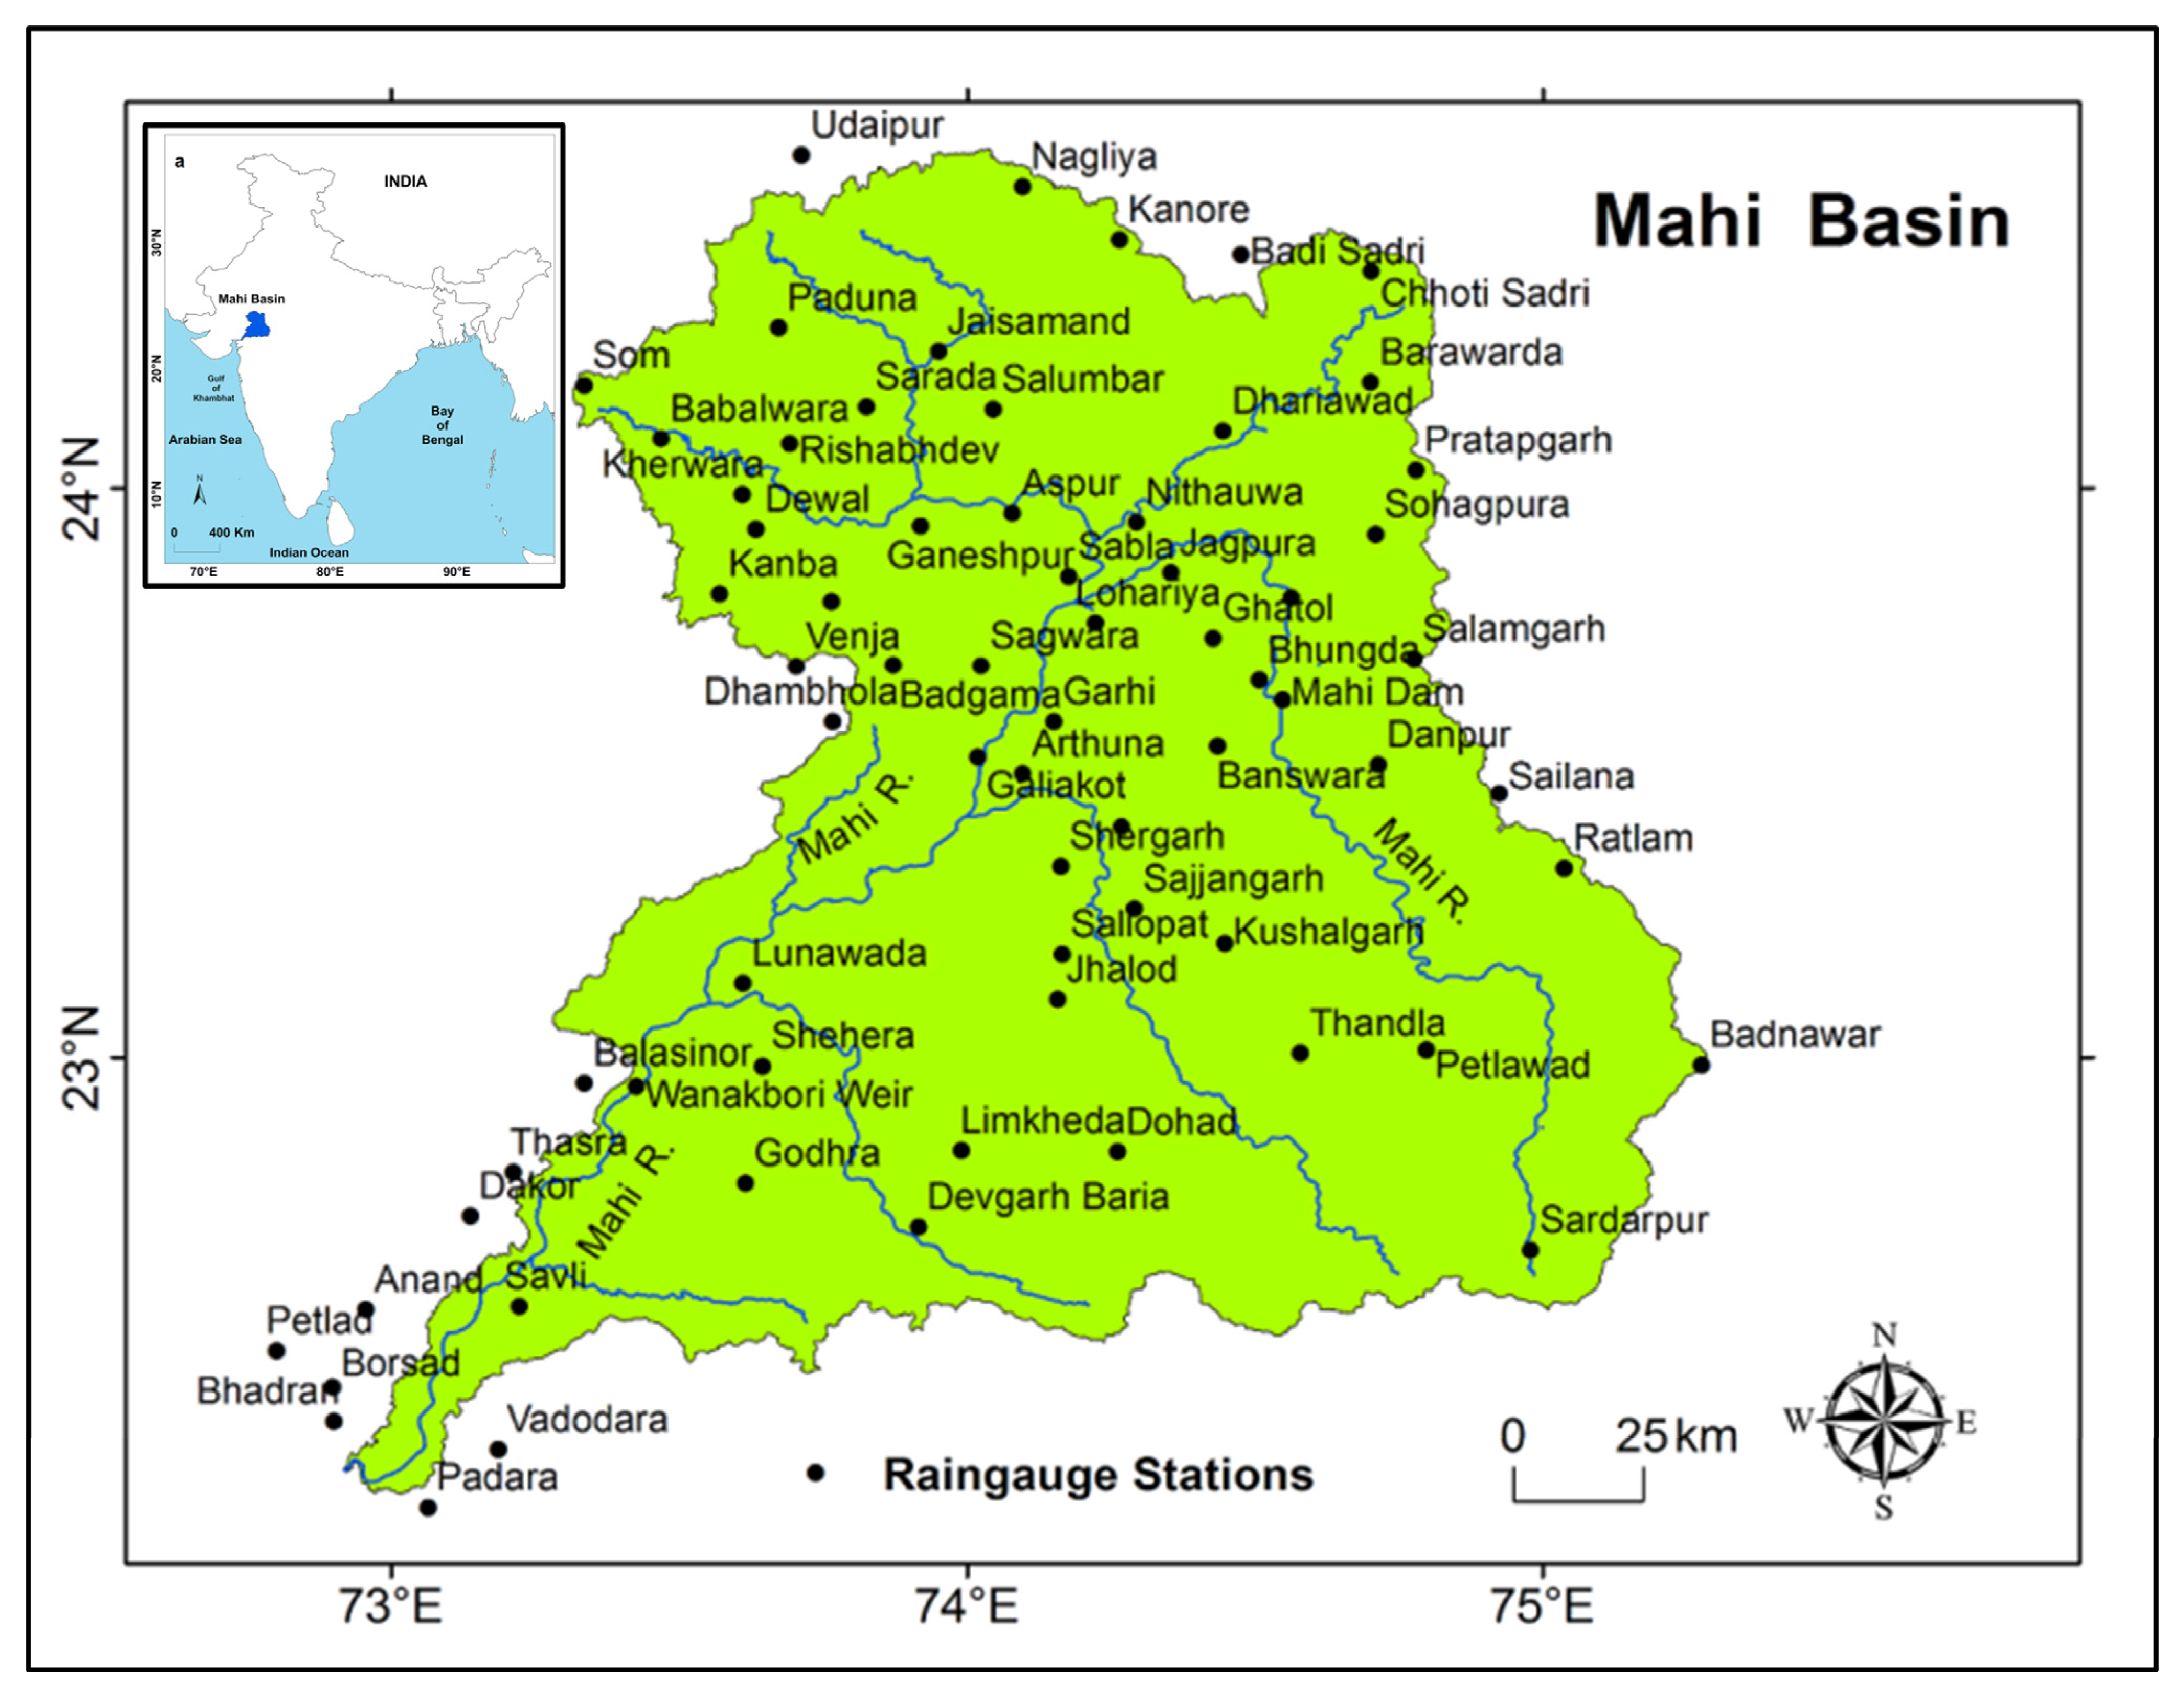
The main objective of the research is to understand rainfall characteristics and synoptic conditions responsible for the catastrophic flood of 1973 in the Mahi Basin; therefore, daily rainfall data for the 1973 flood were obtained for 69 stations located in the basin. (Figure 2). The rainfall data were procured from the India Meteorological Department (IMD), Pune, and from the Water Resource Department, Madhya Pradesh (MPWRD). The 1973 flood was associated with heavy to very heavy rainfall due to LPS. Accordingly, The LPSs track data were obtained from the “Cyclone eAtlas-IMD” published by IMD. Further, some data about synoptic situations responsible for the 1973 flood in the basin were obtained from a monsoon report published in the Indian Journal of Meteorology, Hydrology, and Geophysics in 1974 [48]. The annual maximum series (AMS) data for the Wanakbori sites (Figure 1) were derived from the Central Water Commission (CWC), Gandhinagar (Gujarat), and daily discharge data for the 1973 flood event for the Kadana (Figure 1) from the dissertation work of More in 1986 [49]. The 1973 flood levels were obtained with reference to flood marks during fieldwork in the Mahi Basin.
3.2. Methodology
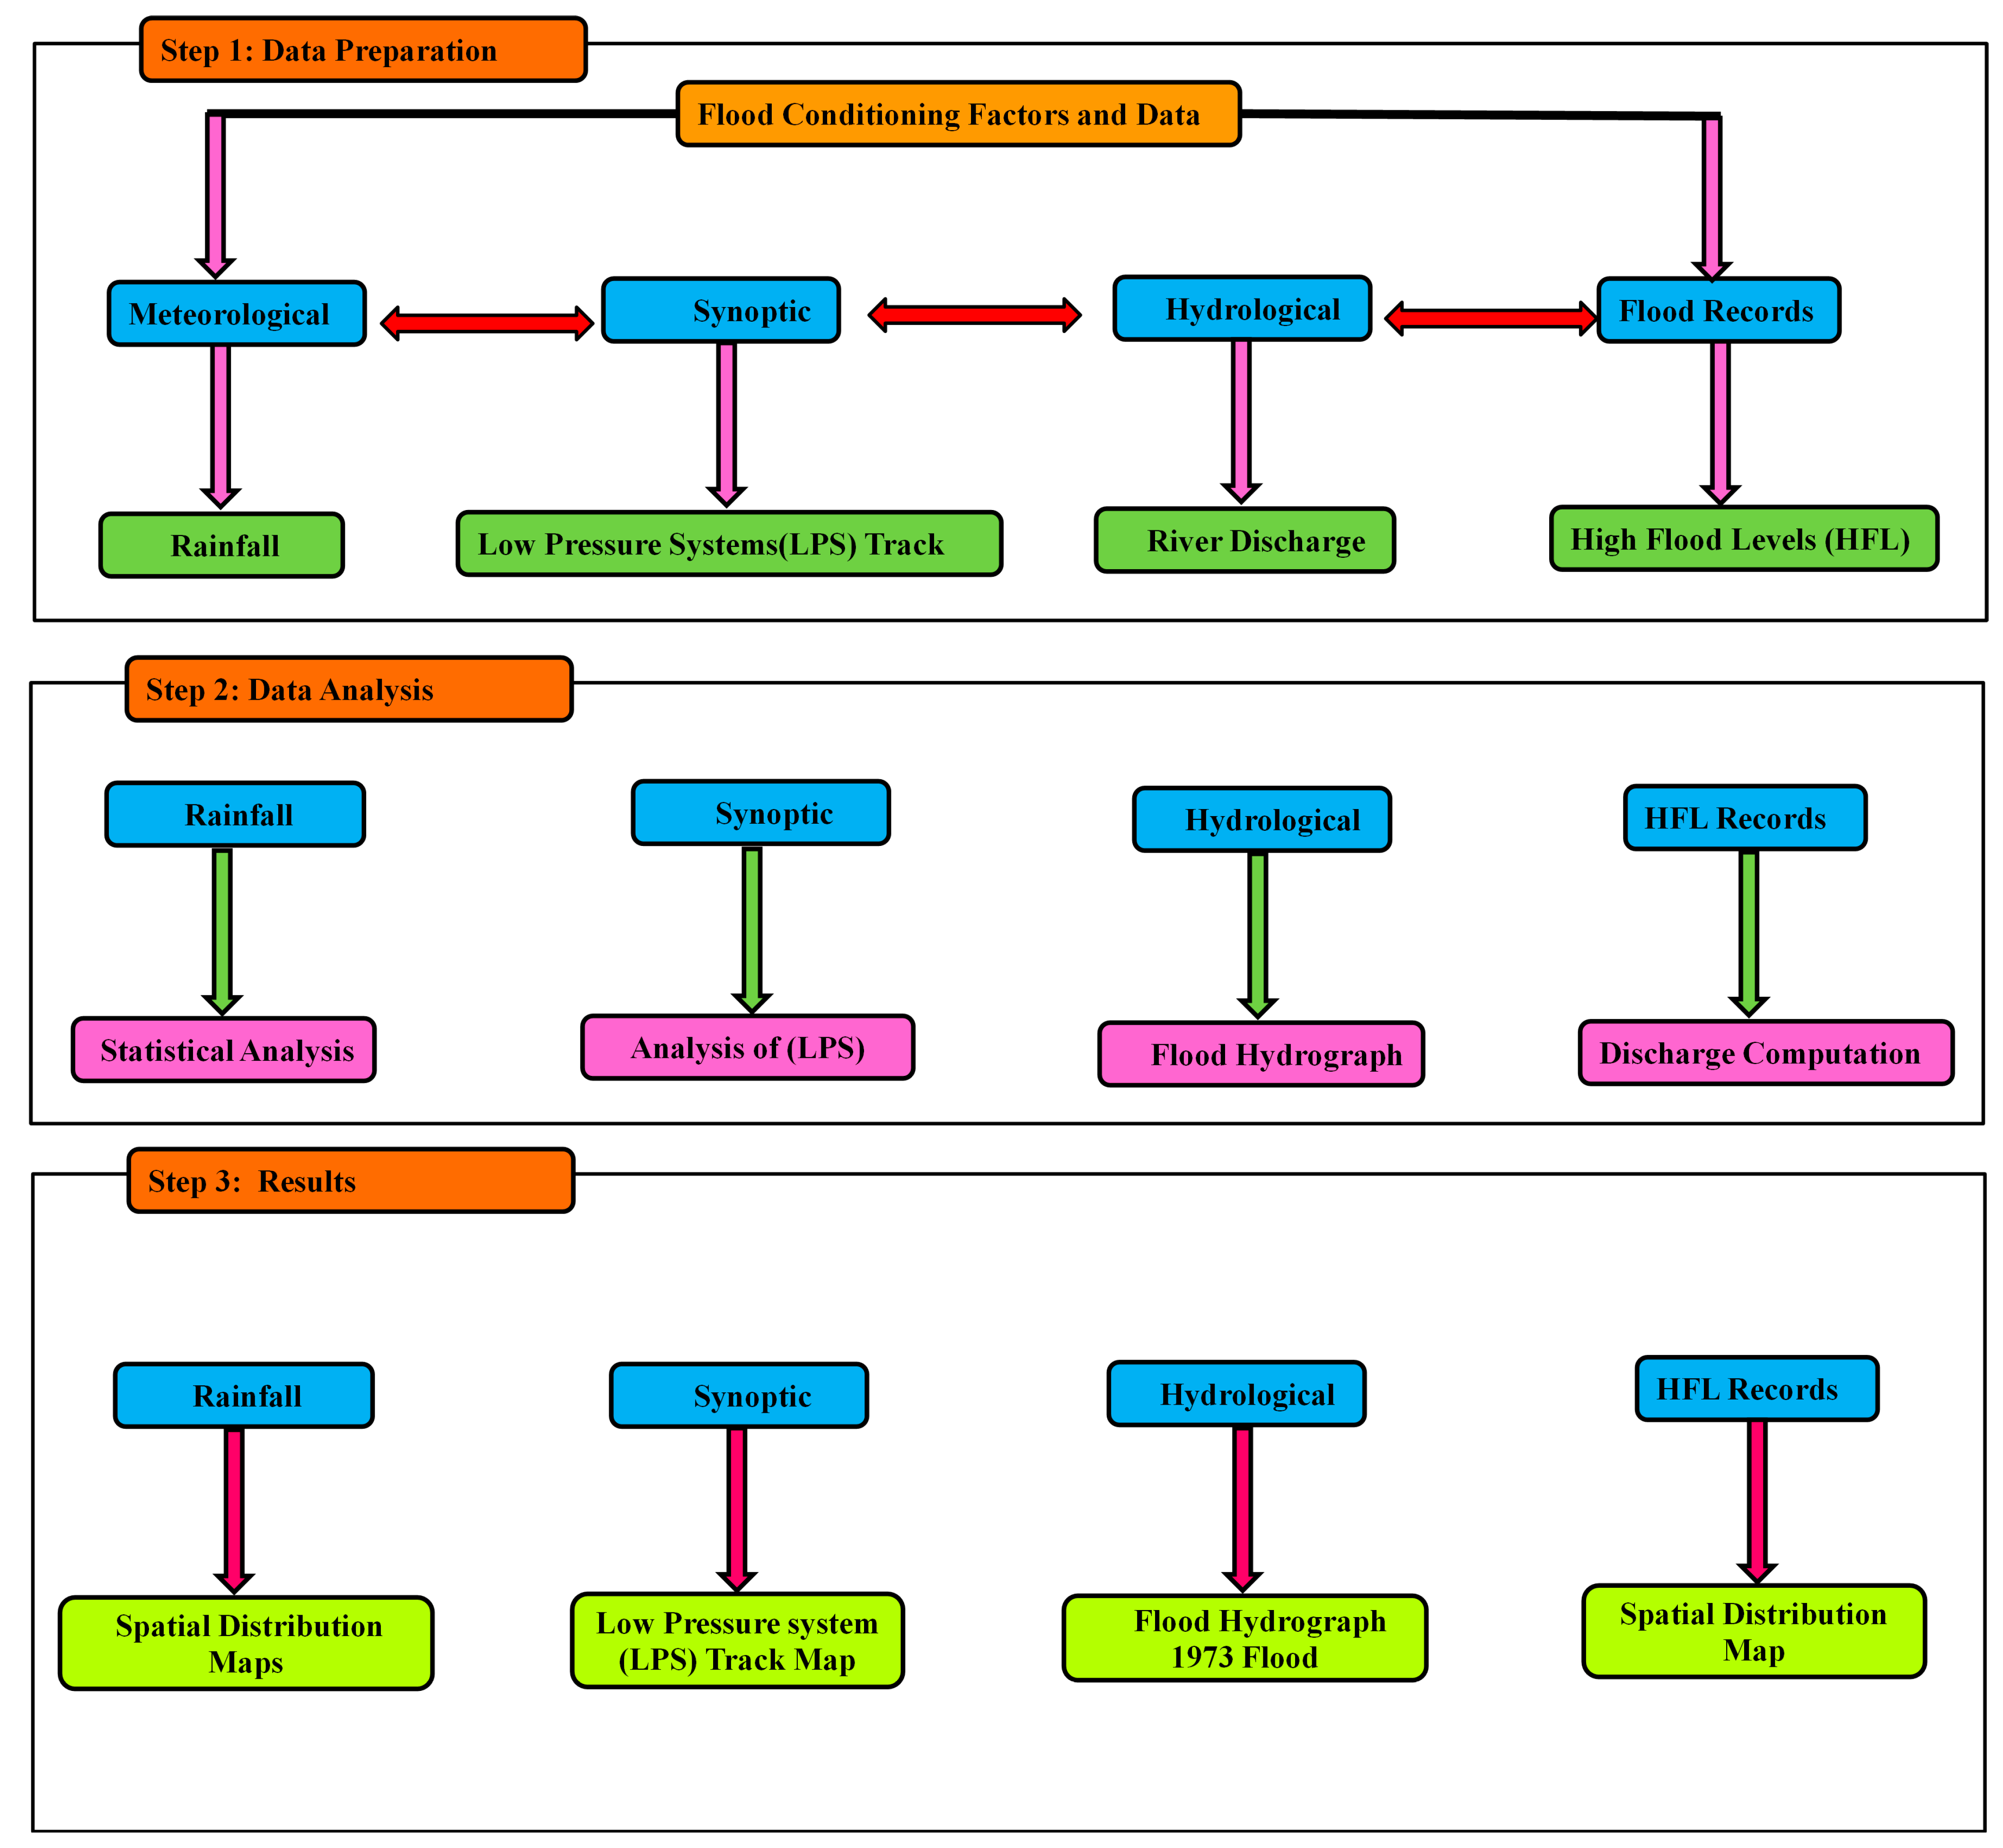
One of the aims of this research is to understand the rainfall characteristics and synoptic conditions associated with the 1973 flood in the Mahi Basin. Therefore, annual and monsoon rainfall data were analyzed using elementary statistical methods such as mean, standard deviation, and coefficient of variation. The LPSs that follow a west or northwestward track either close to the basin or through the basin are the important cause of heavy rainfall-associated floods in central India [32]. Therefore, an attempt has been made to identify and study the LPS tracks noted in 1973 using eAtlas and ArcGIS 10.1 software. The inverse distance weighted (IDW) technique of interpolation of point data is used for spatial analysis of the rainfall. The hydro-geomorphic efficiency of the 1973 flood was studied concerning the Mahi River bridge washout near the village of Kailashpuri and its effect on the ongoing construction of Kadana Dam (Figure 1). The methodology used for the hydro-meteorological analysis of the 1973 flood is shown in Figure 3.
4. Results
4.1. Rainfall Analysis of the 1973 Flood
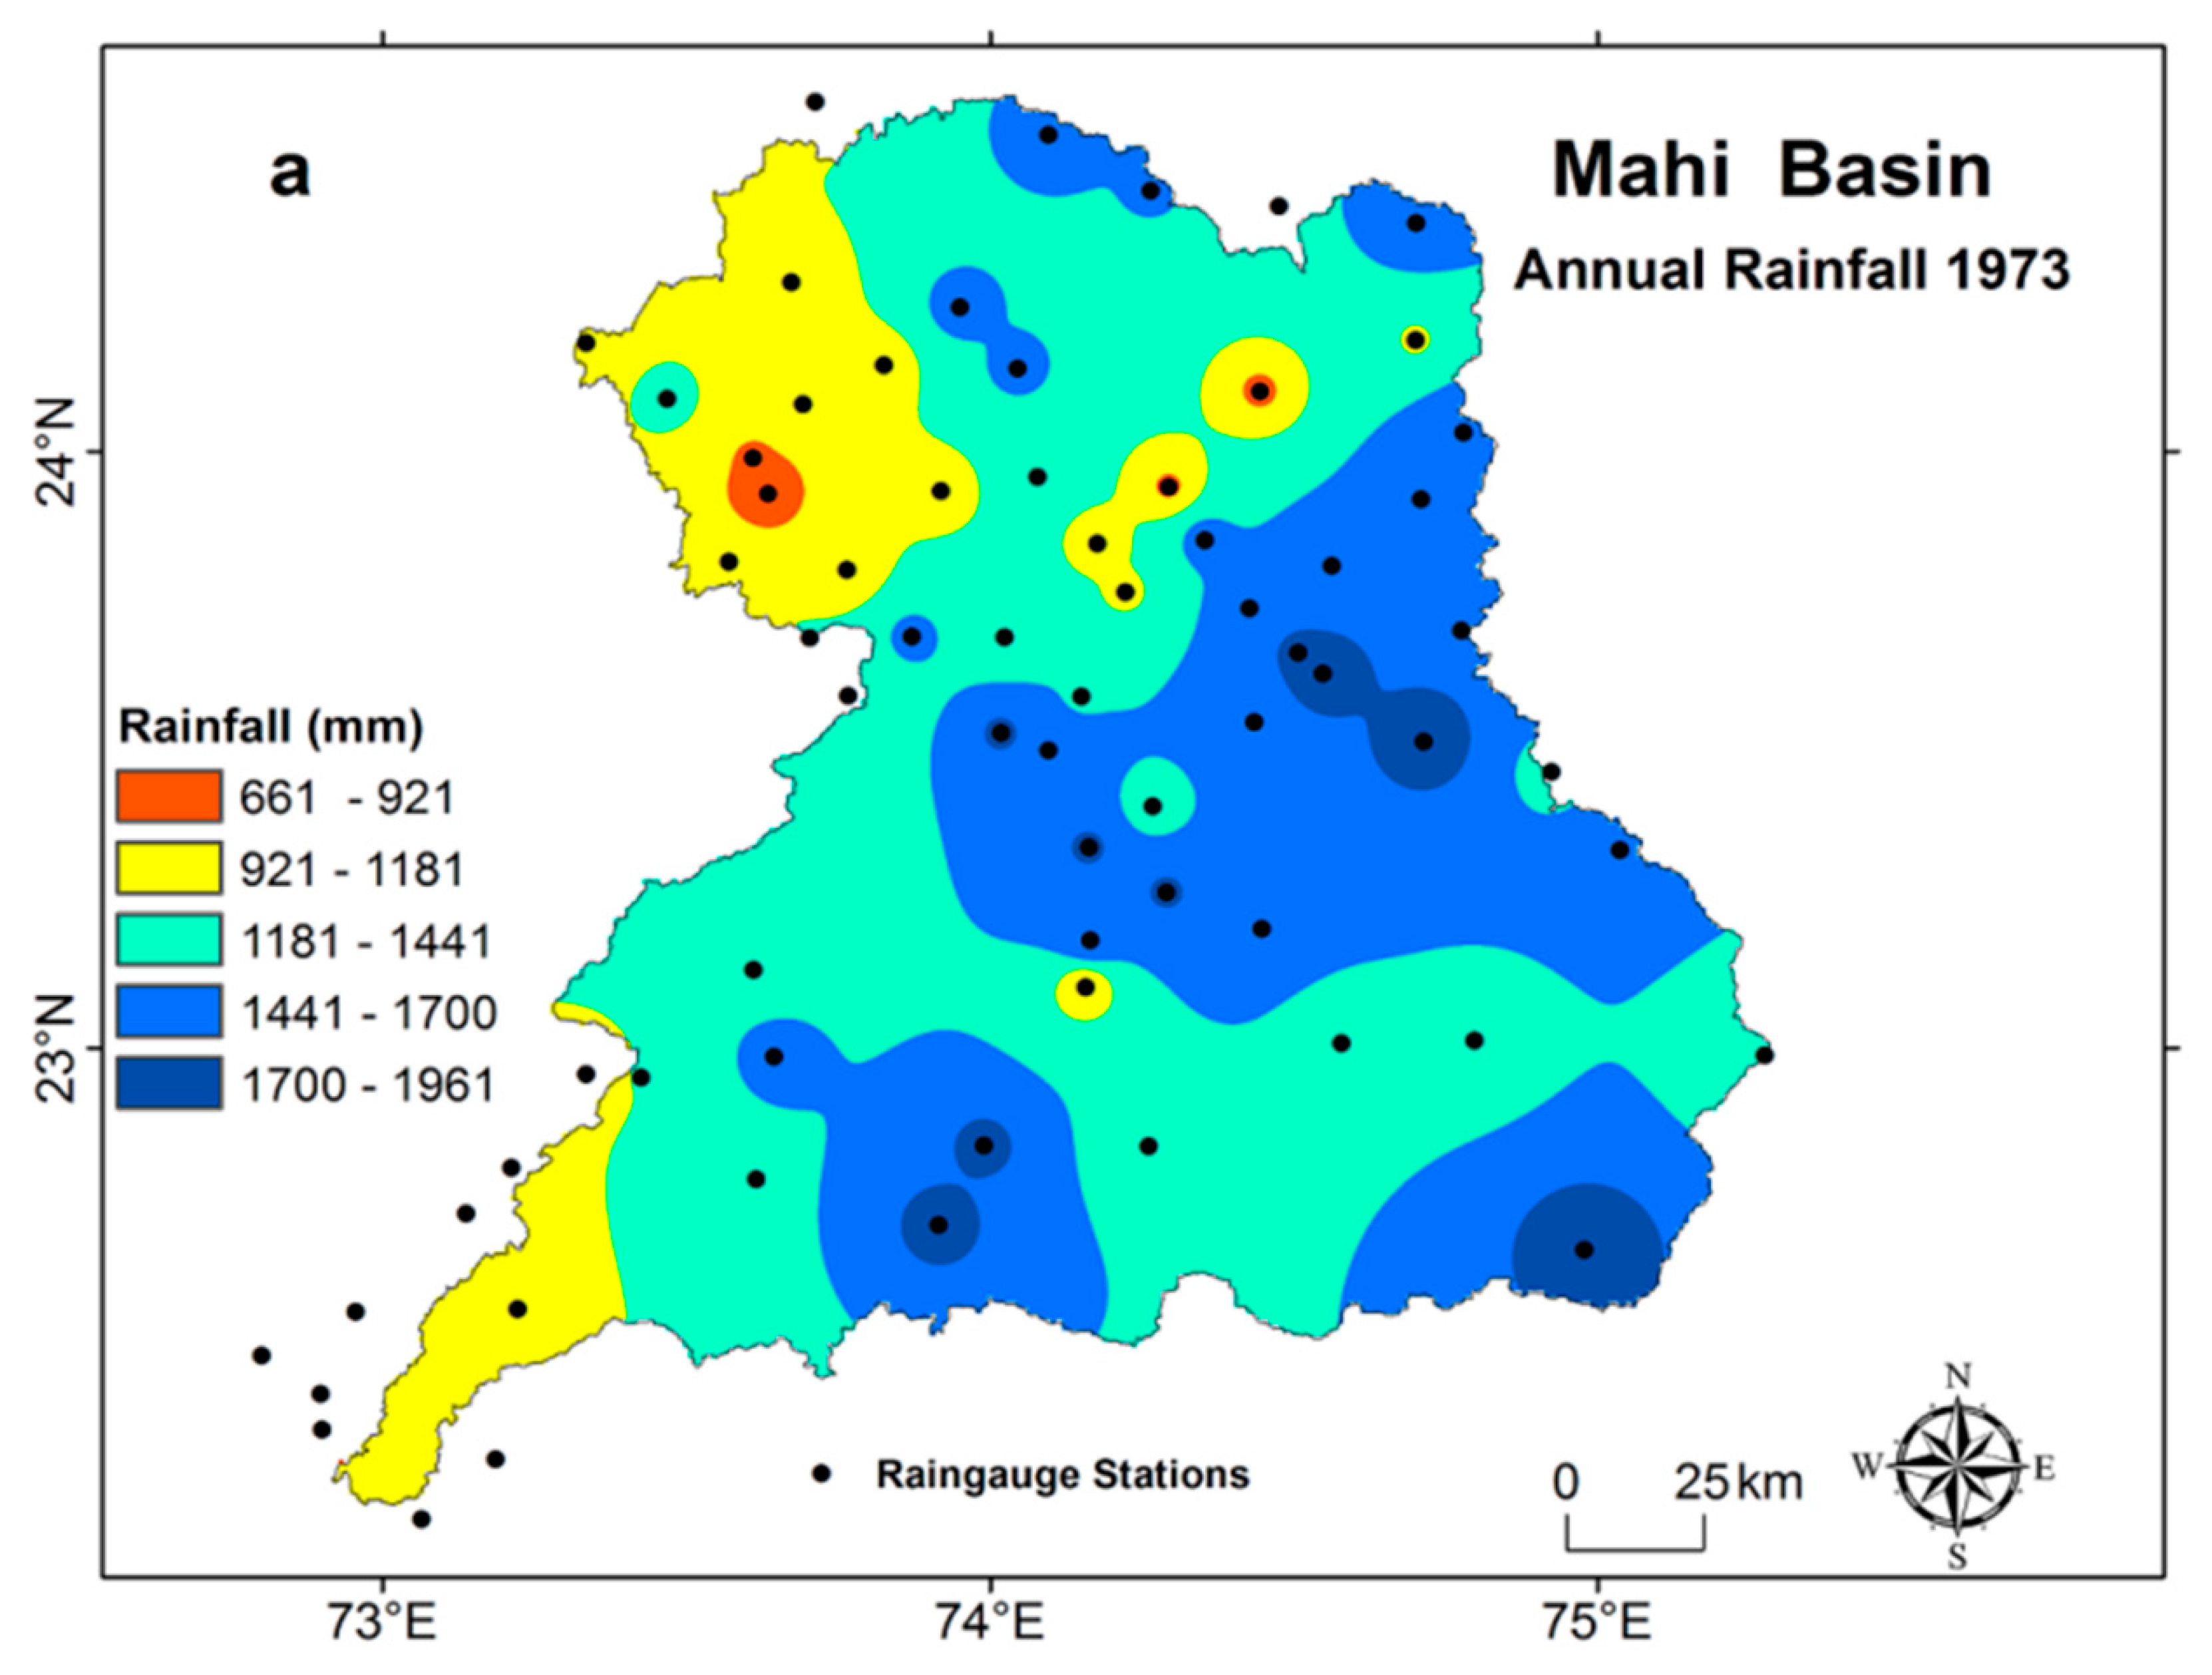
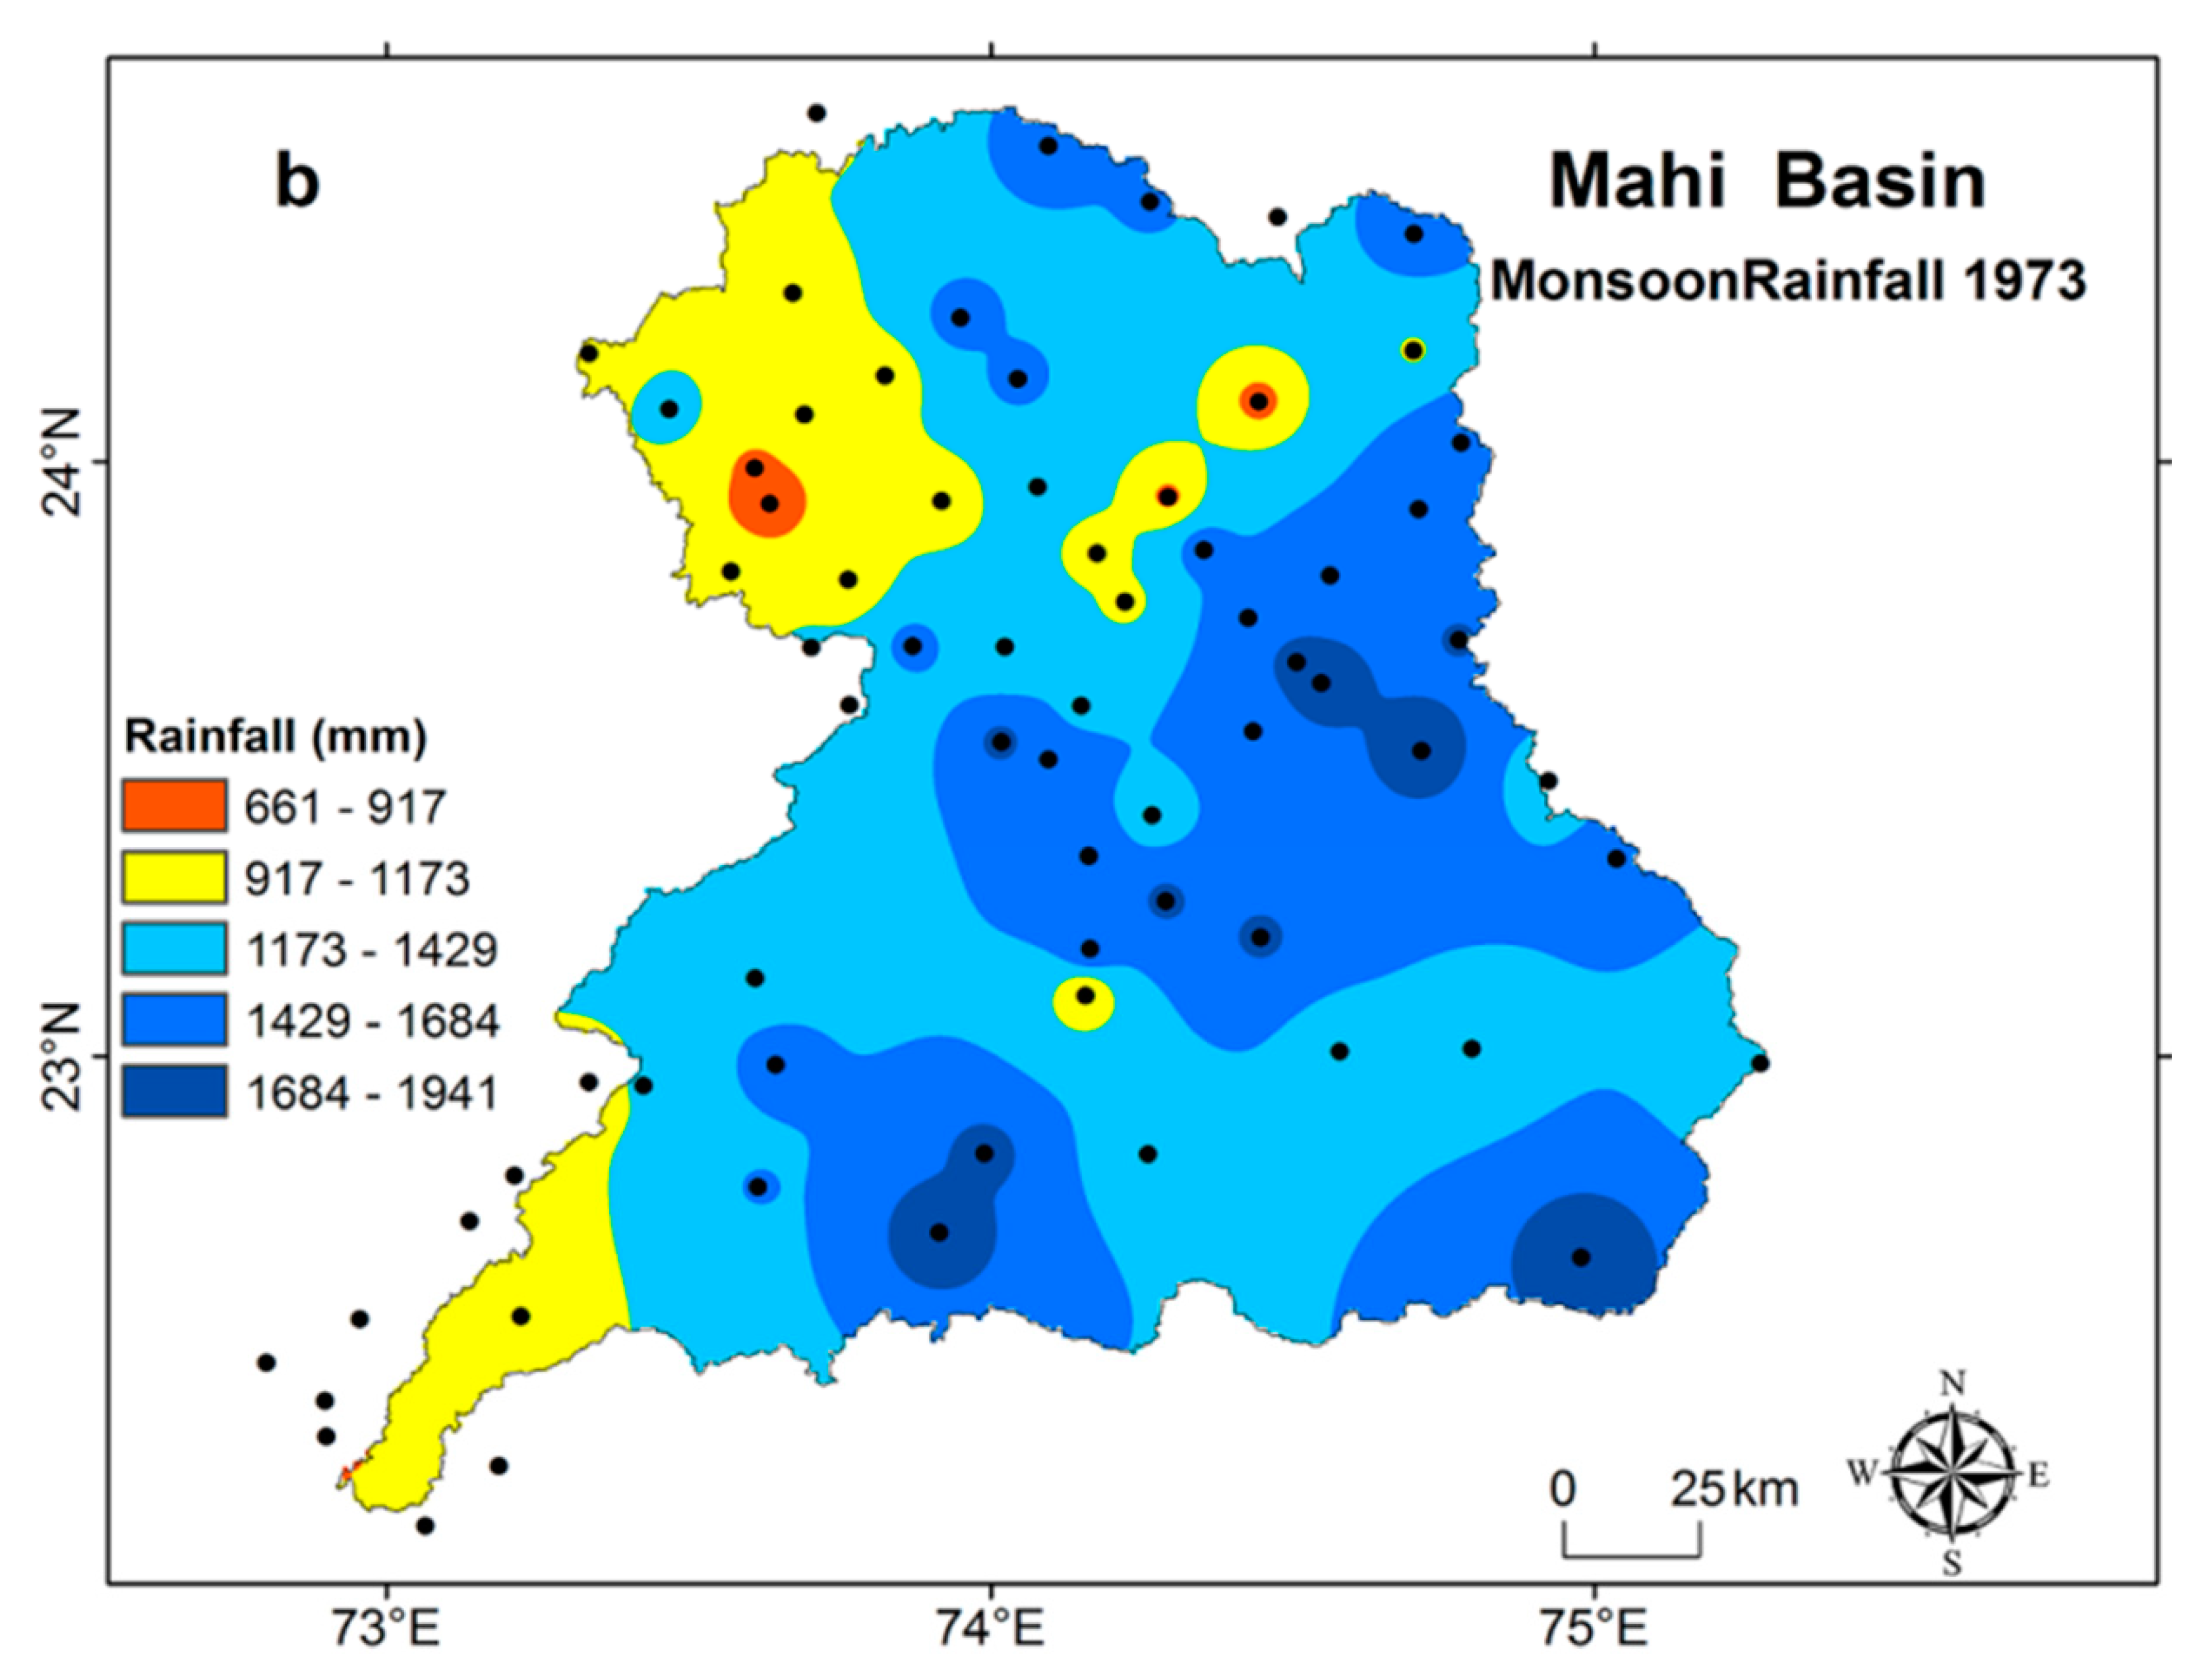
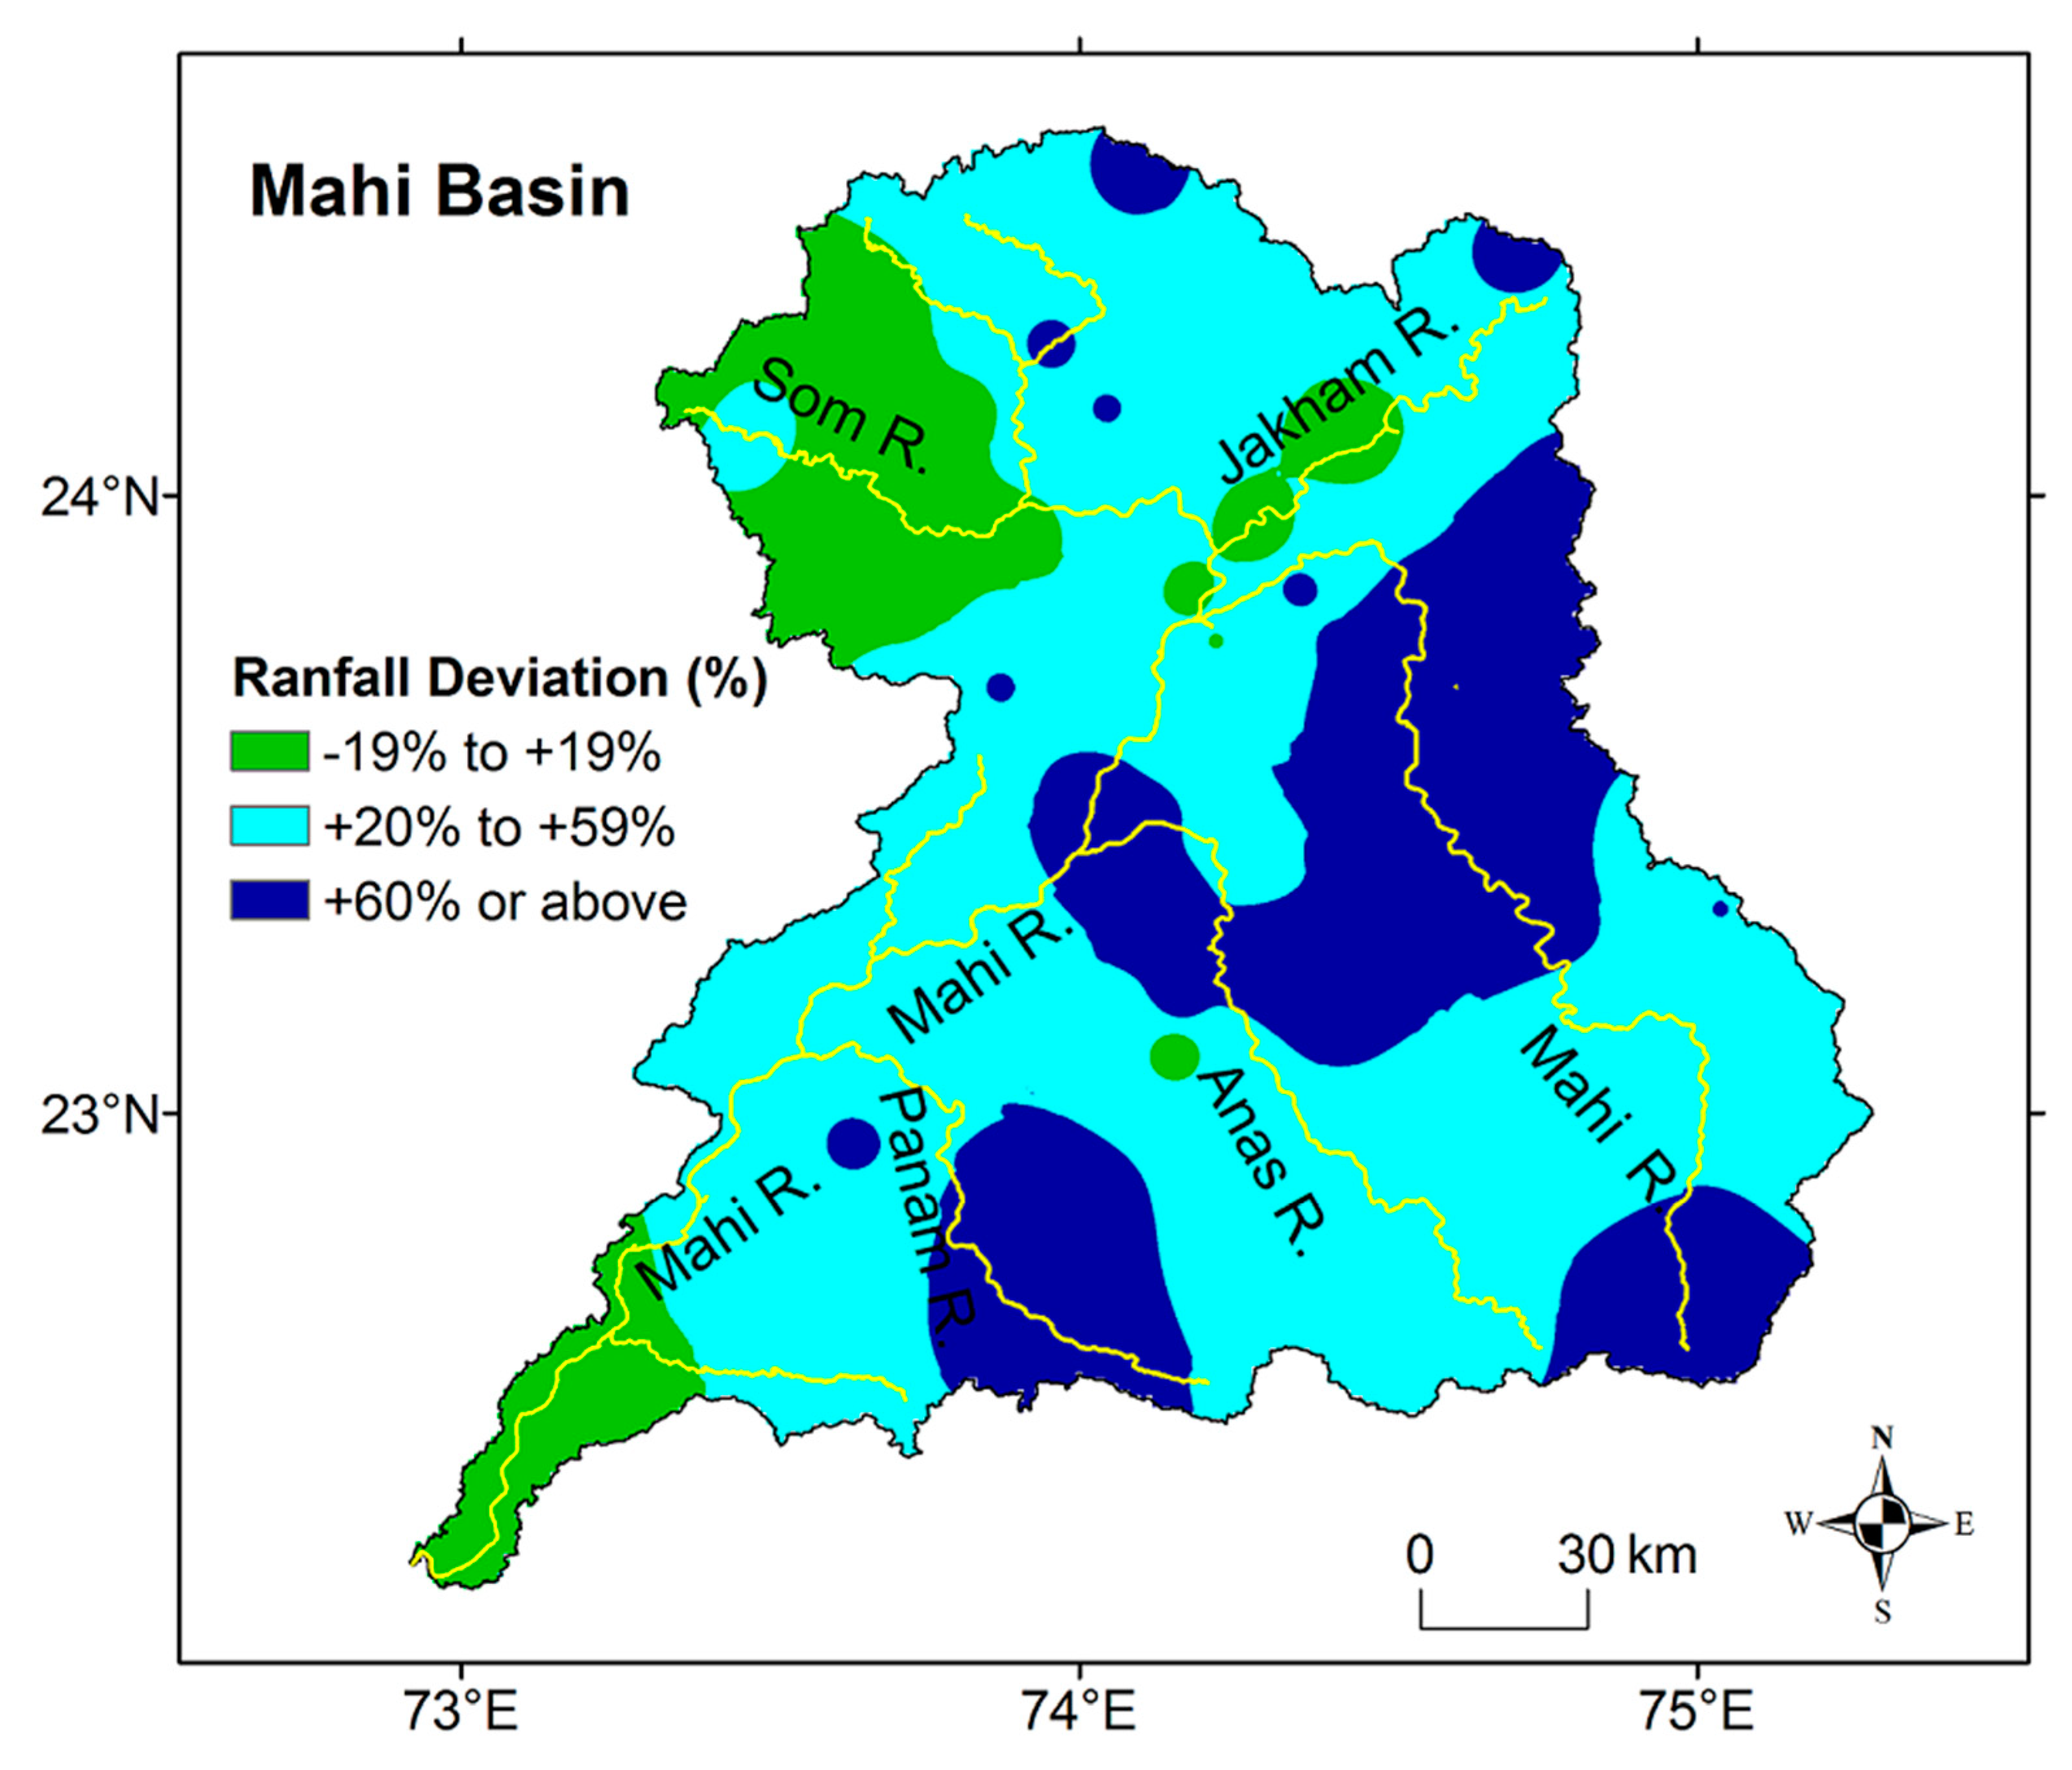
Spatio-temporal distribution of annual rainfall showed that annual rainfall of the Mahi Basin varied between 661 mm (at Dewal) and 1961 mm (at Danpur) during 1973 (Figure 2 and Figure 4a). In 1973, the AAR of the Mahi Basin was 1334 mm, which was about 50% more than the AAR (889 mm) of the basin. The minimum and maximum monsoon rainfall observed for the Dewal (661 mm) and Danpur (1961 mm) are shown in Figure 2 and Figure 4b. The Dewal, Danpur Babalwara, Badgama, Balasinor, Barawarda, Bhungra, Dohad, Galiakot, Godhra, Jagpura, Kanba, and Kanore stations received 100% annual rainfall from June to September (monsoon season) in 1973 (Figure 2 and Figure 4a,b). Moreover, the annual (monsoon) rainfall deviation was 327 mm (324), and rainfall variability was 24% (annual) and 25% (monsoon) in 1973. Analysis of percent deviation from the mean monsoon rainfall of the Mahi Basin showed that the Sardarpur, Danpur, Mahi Dam, Bhungda, Salamgarh, Kushalgarh, Sajjangarh, Galiakot, Limkheda, and Devgarh Baria stations recorded excessive (+60% and above) monsoon rainfall in 1973. (Figure 2 and Figure 5). During the 1973 monsoon season, the western, central northern, and lower basins received normal rainfall (−19% to +19%). Nevertheless, most of the Mahi Basin received excess rainfall (+20% to +59%) during the 1973 monsoon because of the impact of synoptic conditions (Figure 5).
4.2. Synoptic Conditions and Rainfall Analysis
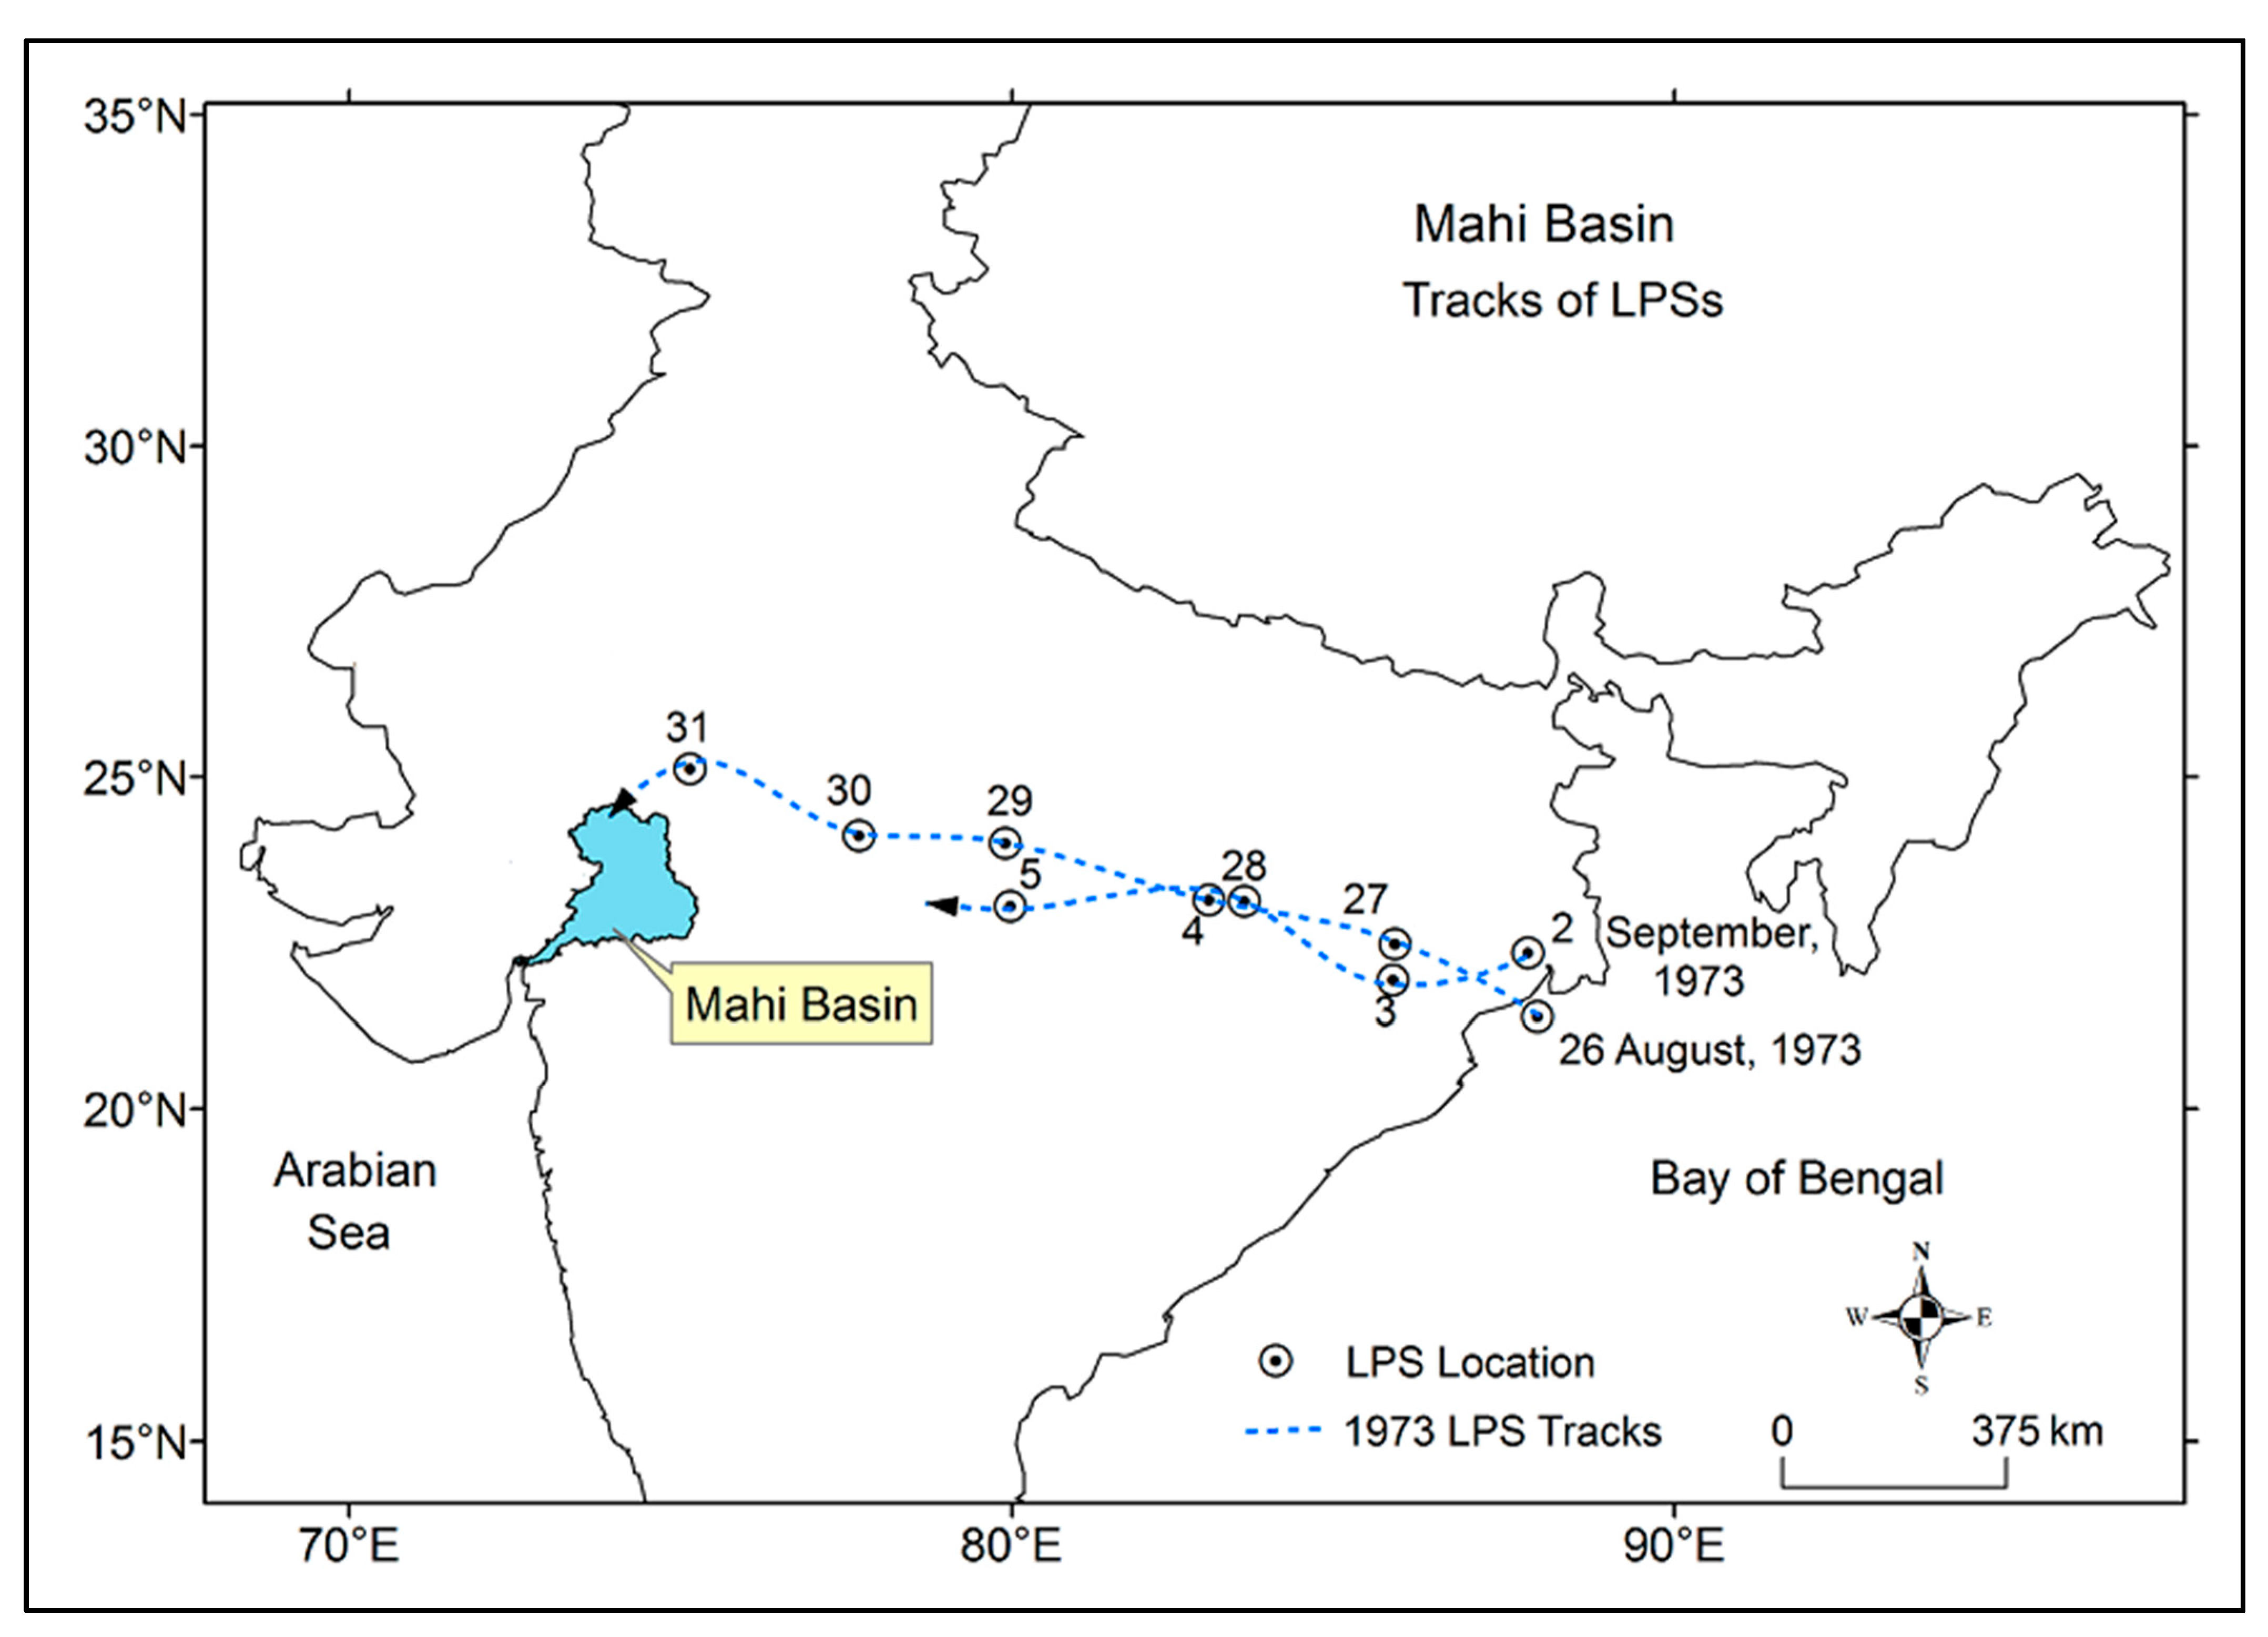
In 1973, the catastrophic flood of the Mahi Basin was widespread and associated with LPSs. The prominent synoptic conditions are depressions (D) formed over the Bay of Bengal and adjoining headland region from 26 to 31 August 1973 and 2 to 5 September 1973 (Figure 6). The first LPS formed as a monsoon low over the North Bay of Bengal on 24 August, became a depression on the morning of 26 August, and crossed the coast south of Balasore. It became a deep depression (DD) on 27 August, near Jamshedpur. The depression moved northwest across north Madhya Pradesh from 28 to 31 August and weakened into a low depression on the morning of 1 September over south Rajasthan. The monsoon low persisted over south Rajasthan until the morning of 3 September 1793, and merged with the monsoon trough [48,50,51].
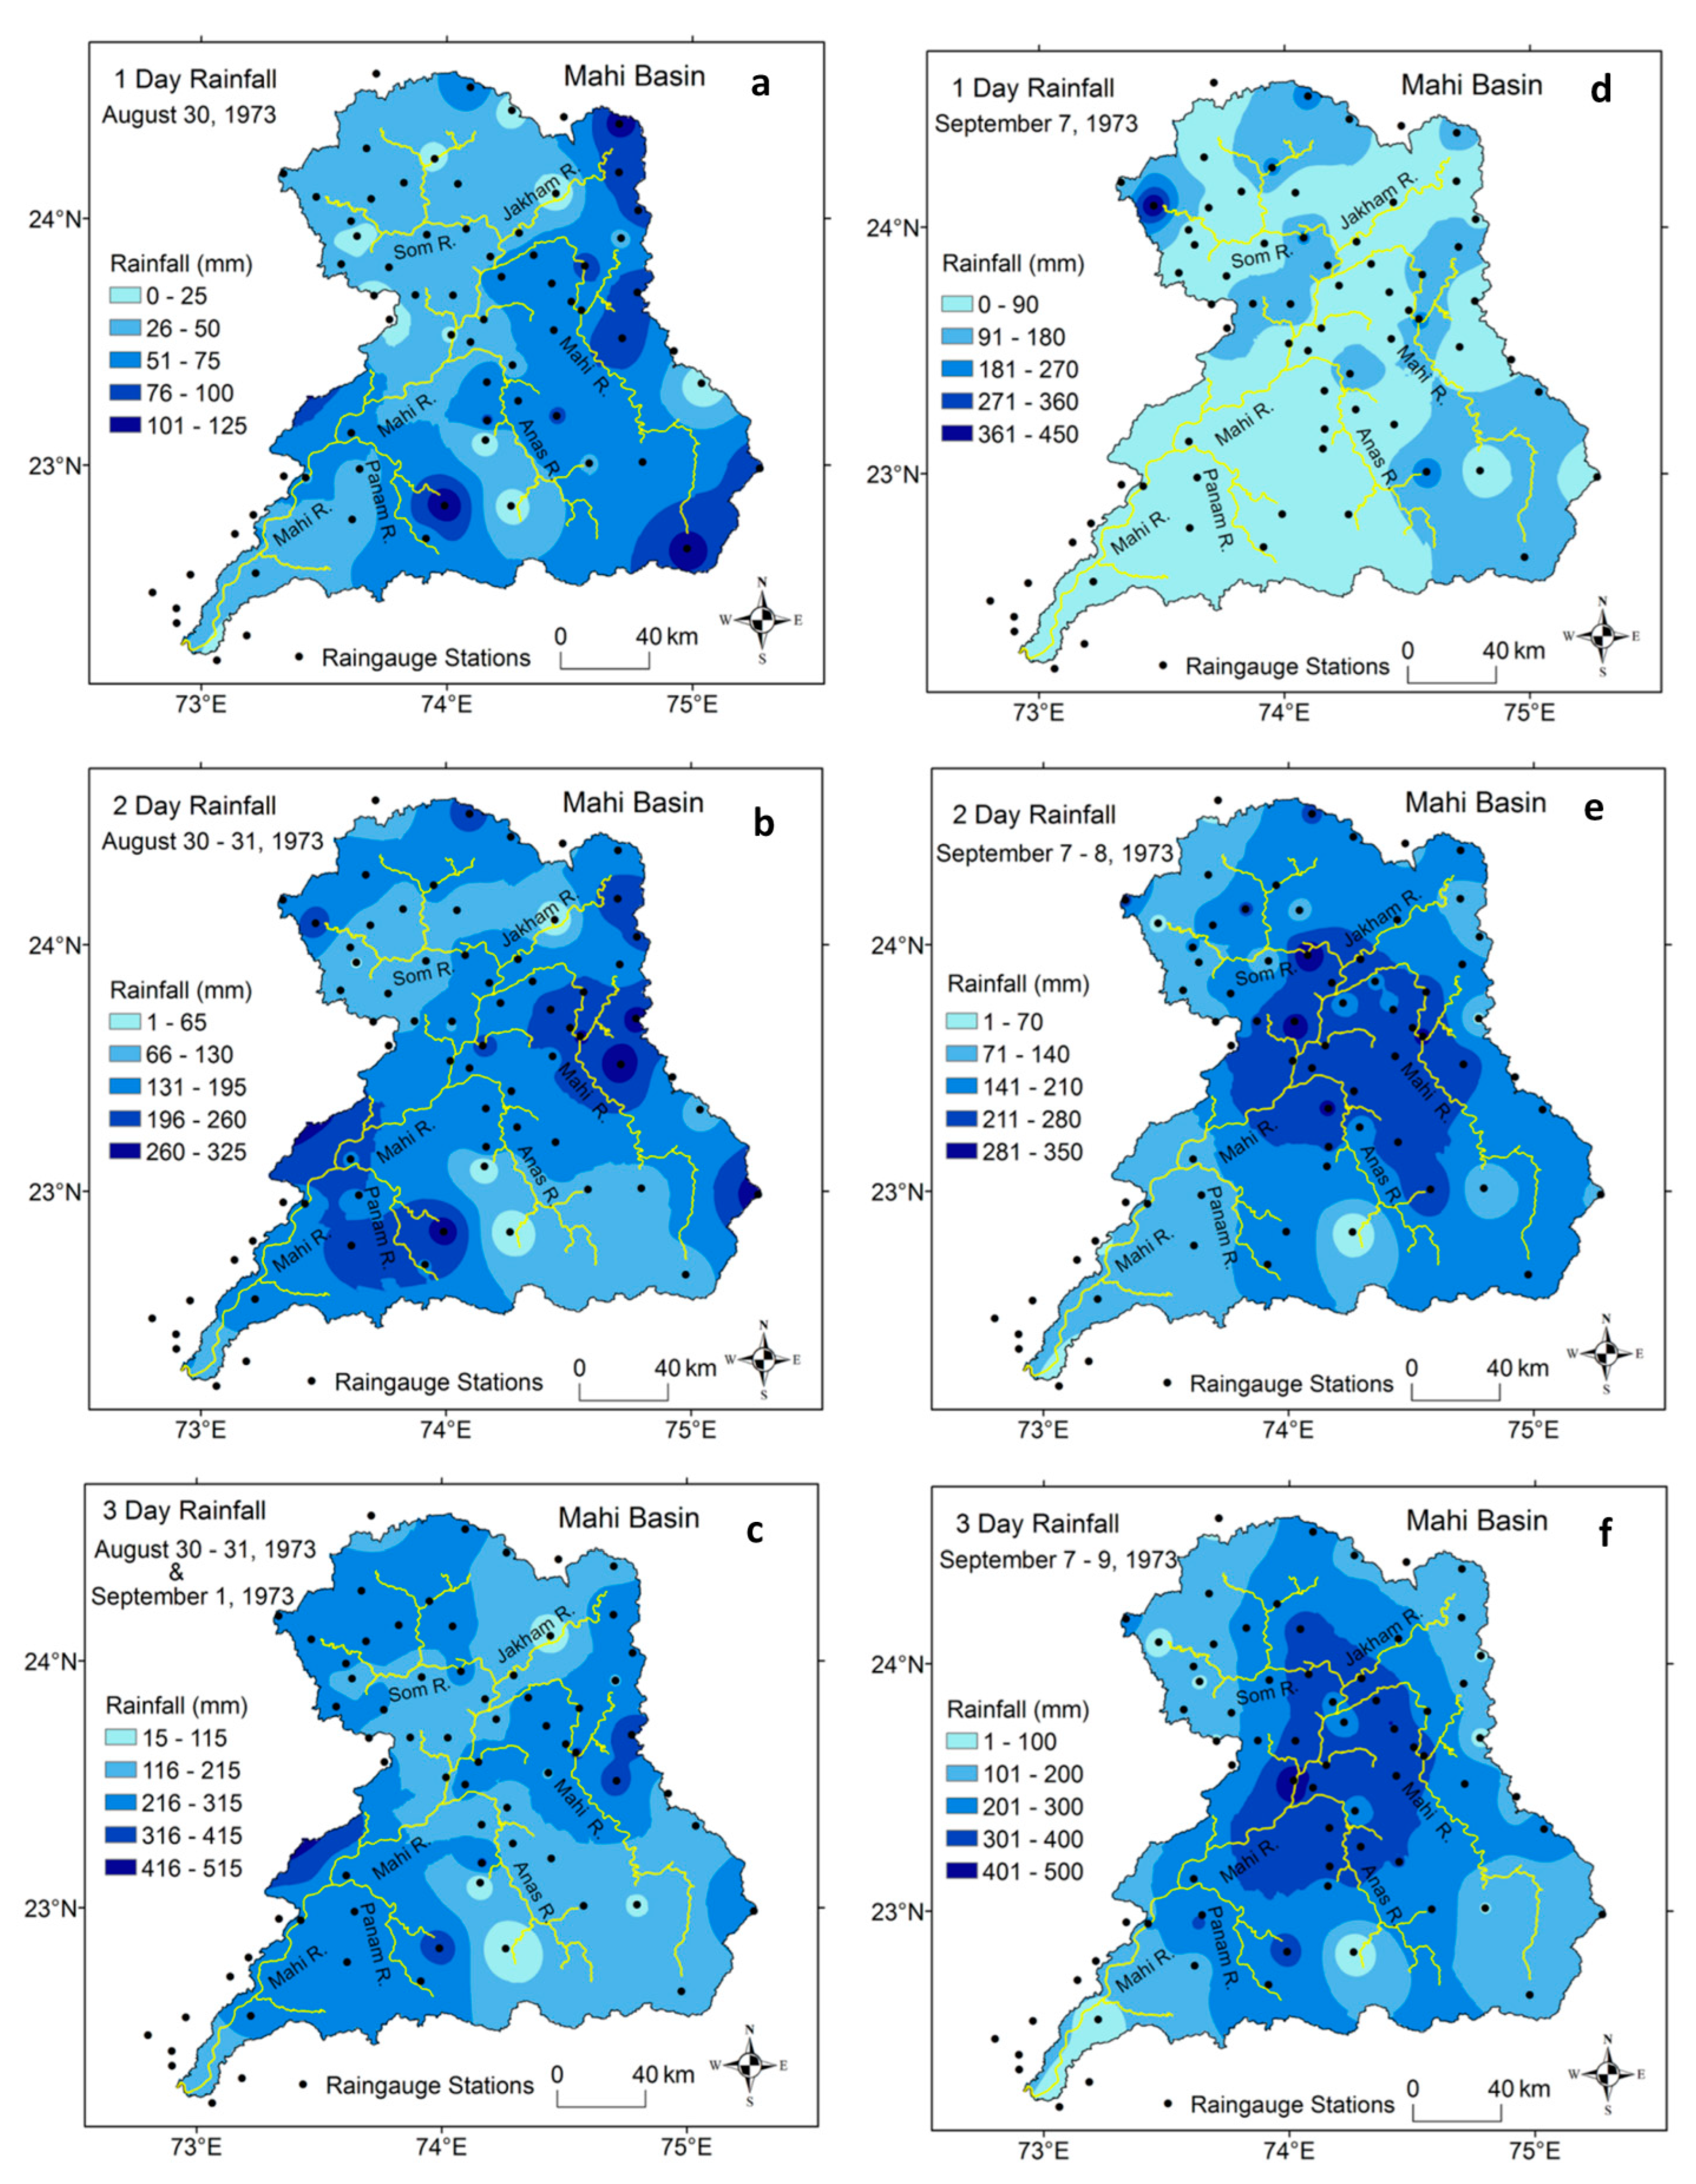
Under the influence of the LPS, widespread and heavy rainfall was recorded in the Mahi Basin on 30–31 August and 1 September 1973 (Table 2; Figure 7a–c). The highest 24–hr. rainfall on 30 August 1973 was recorded at Limkheda (125 mm) (Table 2; Figure 2 and Figure 7a). The highest 24 h rainfall in the Mahi Basin on 31 August 1973 was recorded at Babalwara (215 mm), and Kherwara recorded the maximum 24–h rainfall (153 mm) on 1 September 1973 (Table 2; Figure 2). The maximum rainfall (375 mm) in the basin over 3 days (30–31 August and 1 September) was documented at Limkheda and Simalwara (Table 2; Figure 2 and Figure 7c). Table 2 shows that out of 69 stations, 26 stations received very heavy rainfall (124.5–244.4 mm), and 28 stations recorded heavy rainfall (64.4–124.4 mm) on 31 August. As a result, wet conditions prevailed over the Mahi Basin.
Figure 6 shows that the second depression (D) formed near Contai in the coastal region of West Bengal on 2 September 1973. A depression moved westward and weakened into a well-marked low (L) over central Madhya Pradesh on 5 September 1973. The low moved to the west over east Rajasthan and merged with the monsoon trough on 9 September 1973 [48,50,51]. The significant effect of LPS was observed over western Madhya Pradesh on 5 September, east Rajasthan, and Gujarat Region on 5 and 7 September. Consequently, a large flood was observed in the Mahi Basin. The antecedent moisture conditions (AMC) resulted from the preceding LPS (29–31 August), and heavy to very heavy rainfall resulted from the current LPS (2–5 September) over the Mahi Basin; these factors were the root cause of the 1973 flood.
Under the influence of the second LPS (7 and 9 September 1973), the basin received heavy rainfall (Table 2; Figure 7d–f). The remarkable rainfall associated with this LPS over the Mahi Basin was observed between 7 and 9 September (Table 2). The extremely heavy rainfall spells were observed at Mahi Dam (247 mm), Bhungda (254 mm), and Shergarh (249 mm) on 7 and 8 September 1973 (Table 2; Figure 2 and Figure 7d,e). Table 2 shows that out of 69 stations, 21 rain gauge stations recorded very heavy rainfall (124.5–244.4 mm), whereas heavy rainfall was observed on 8 September 1973 (Table 2; Figure 2 and Figure 7e). Heavy to extremely heavy rainfall in the upper catchment of the basin on 7 and 8 September produced a catastrophic flood in the Mahi Basin. The highest discharge (40,663 m3/s) of the Mahi River on record was observed at Wanakbori on 9 September 1973 (Figure 1).
4.3. Hydrological Analysis of the 1973 Flood
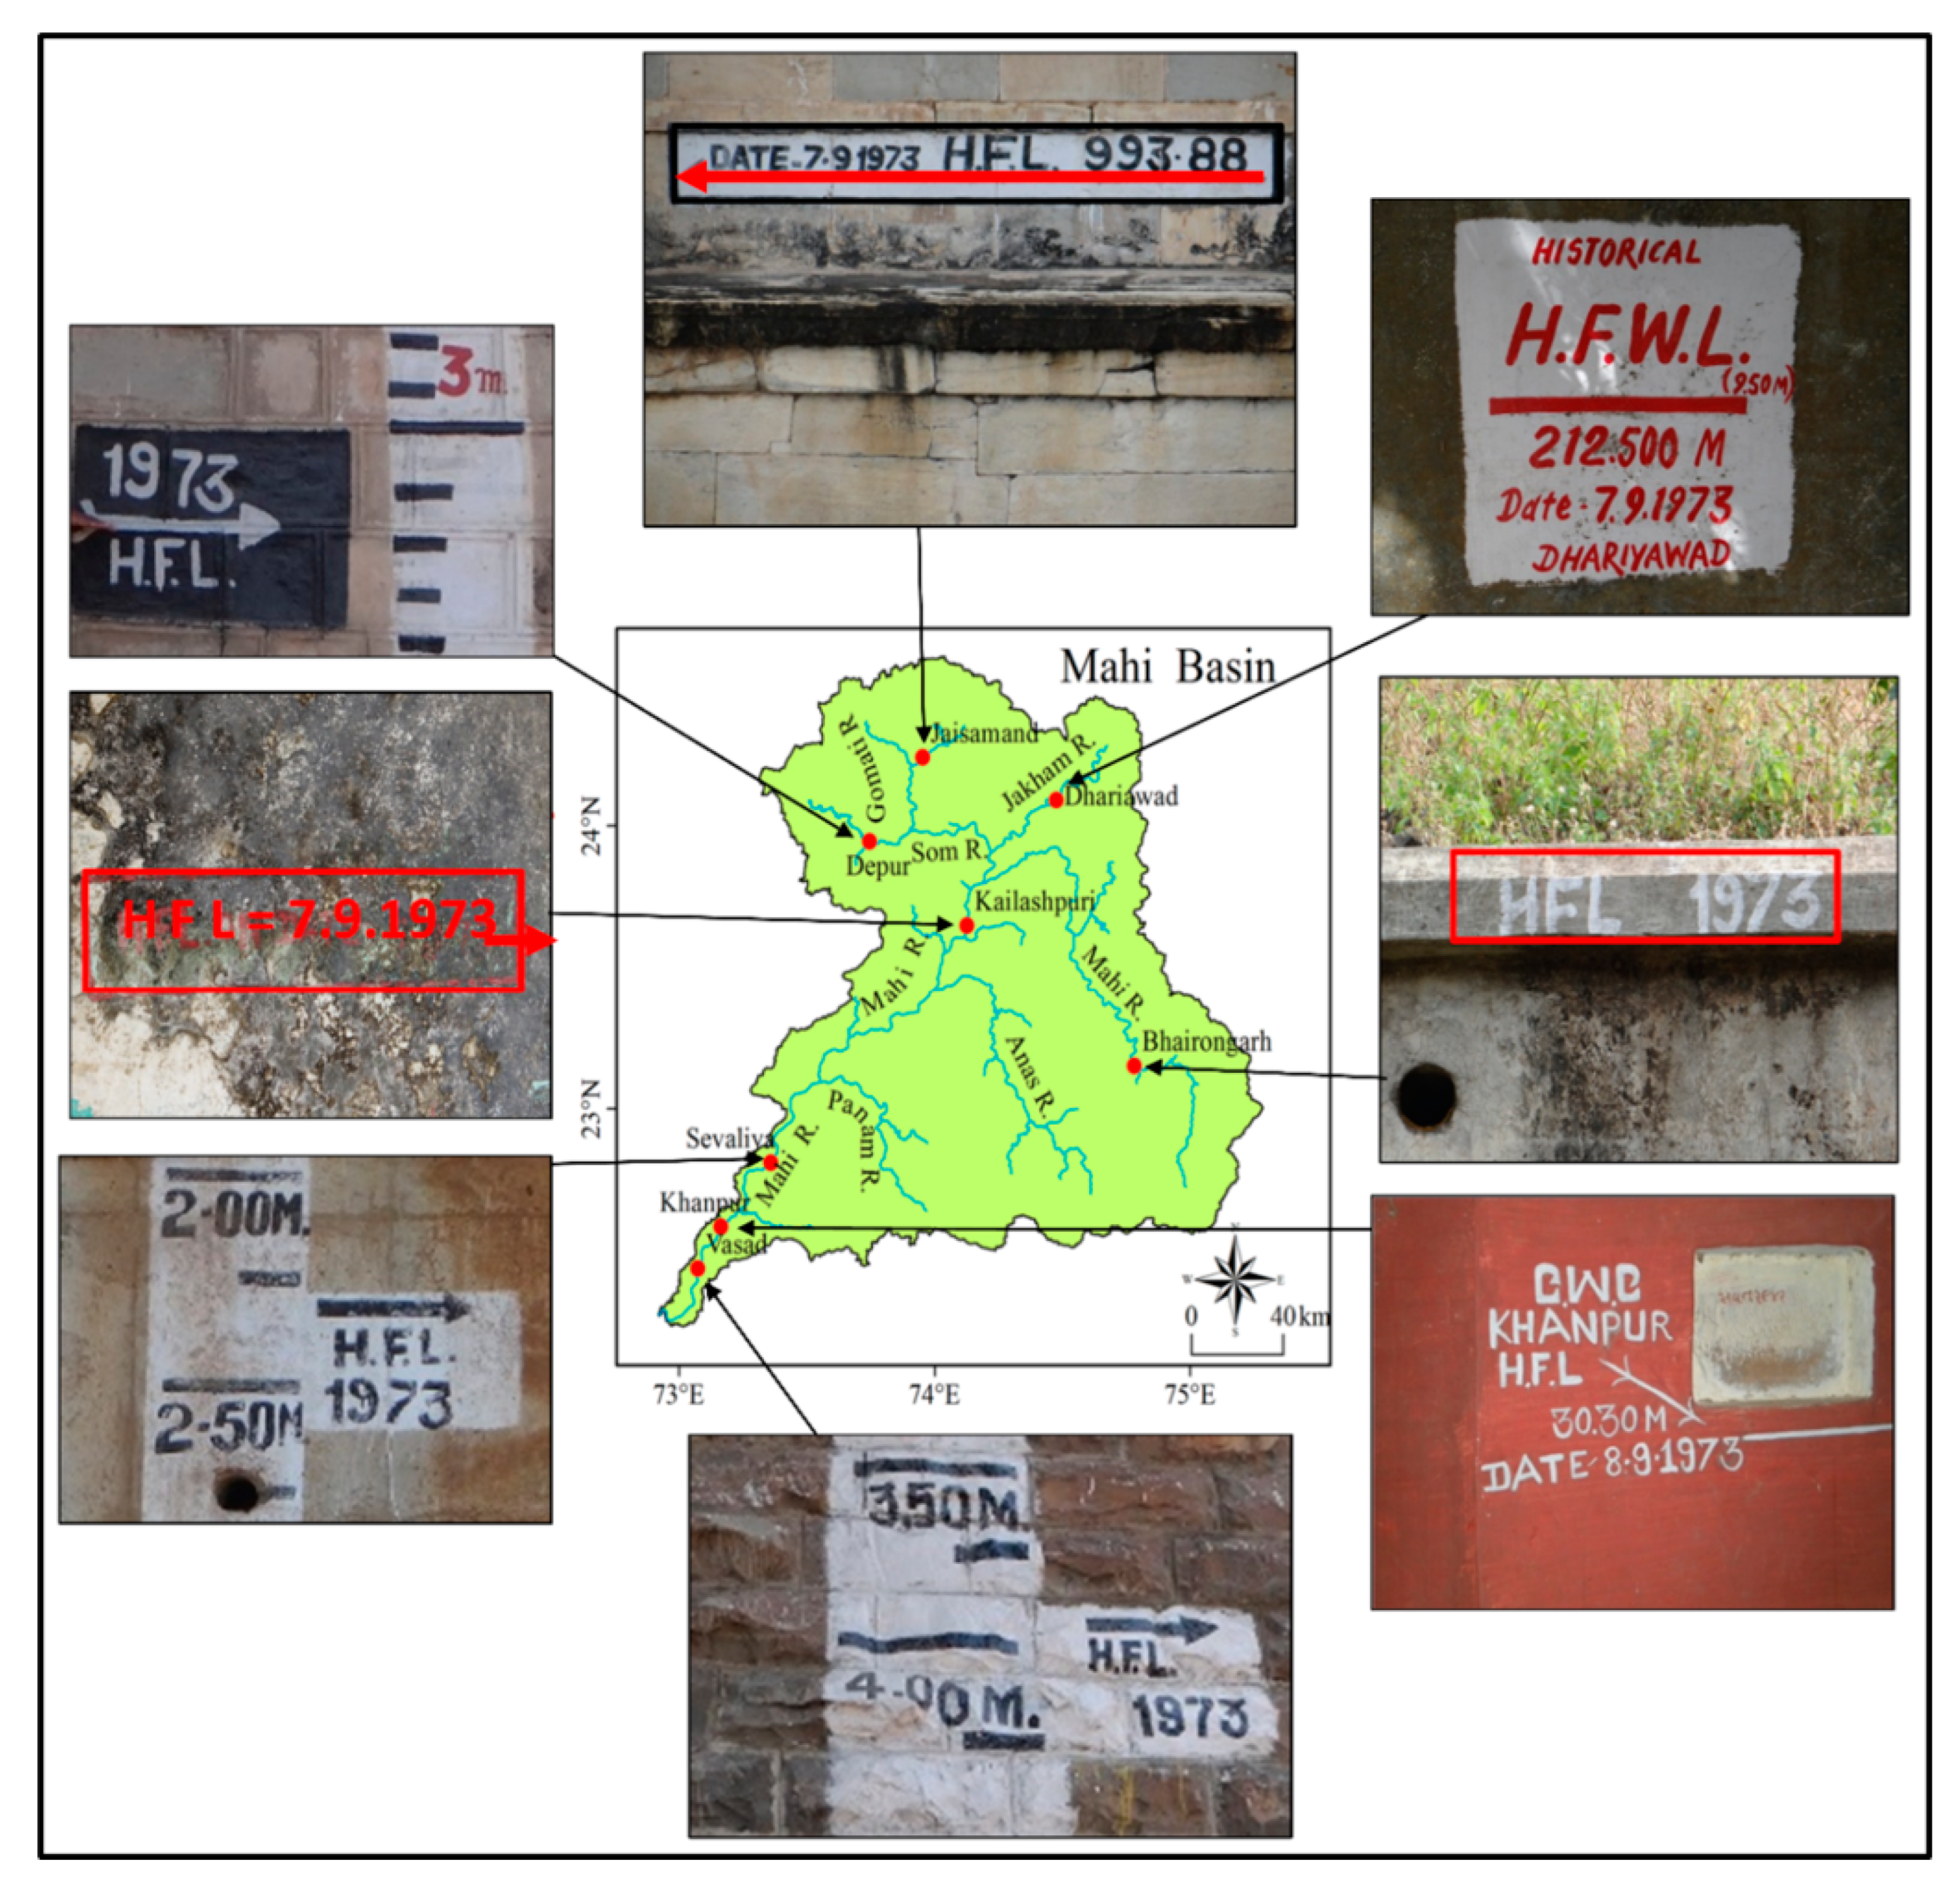
Long-term and well-documented historical flood records for the Mahi Rivers are not available. Besides, systematic discharge records at gauging sites in the Mahi Basin are short (30 to 40 years), except at Wanakbori (57 years). Long-term (1959–2016) AMS data of the Mahi River are available only for the Wanakbori site. Therefore, very little information about the 1973 flood on the Mahi River is available. Fieldwork and surveys were conducted to obtain more information about the 1973 flood. High flood level (HFL) marks of 1973 were observed at Bhairongarh, Kailashpuri, Sevaliya, Khanpur, and Vasad (Figure 8). Besides, HFL evidence of the 1973 flood was observed on the Som River at Depur, the Gomati River at Jaisamand Dam, and the Jakham River at Dhariawad (Figure 8).
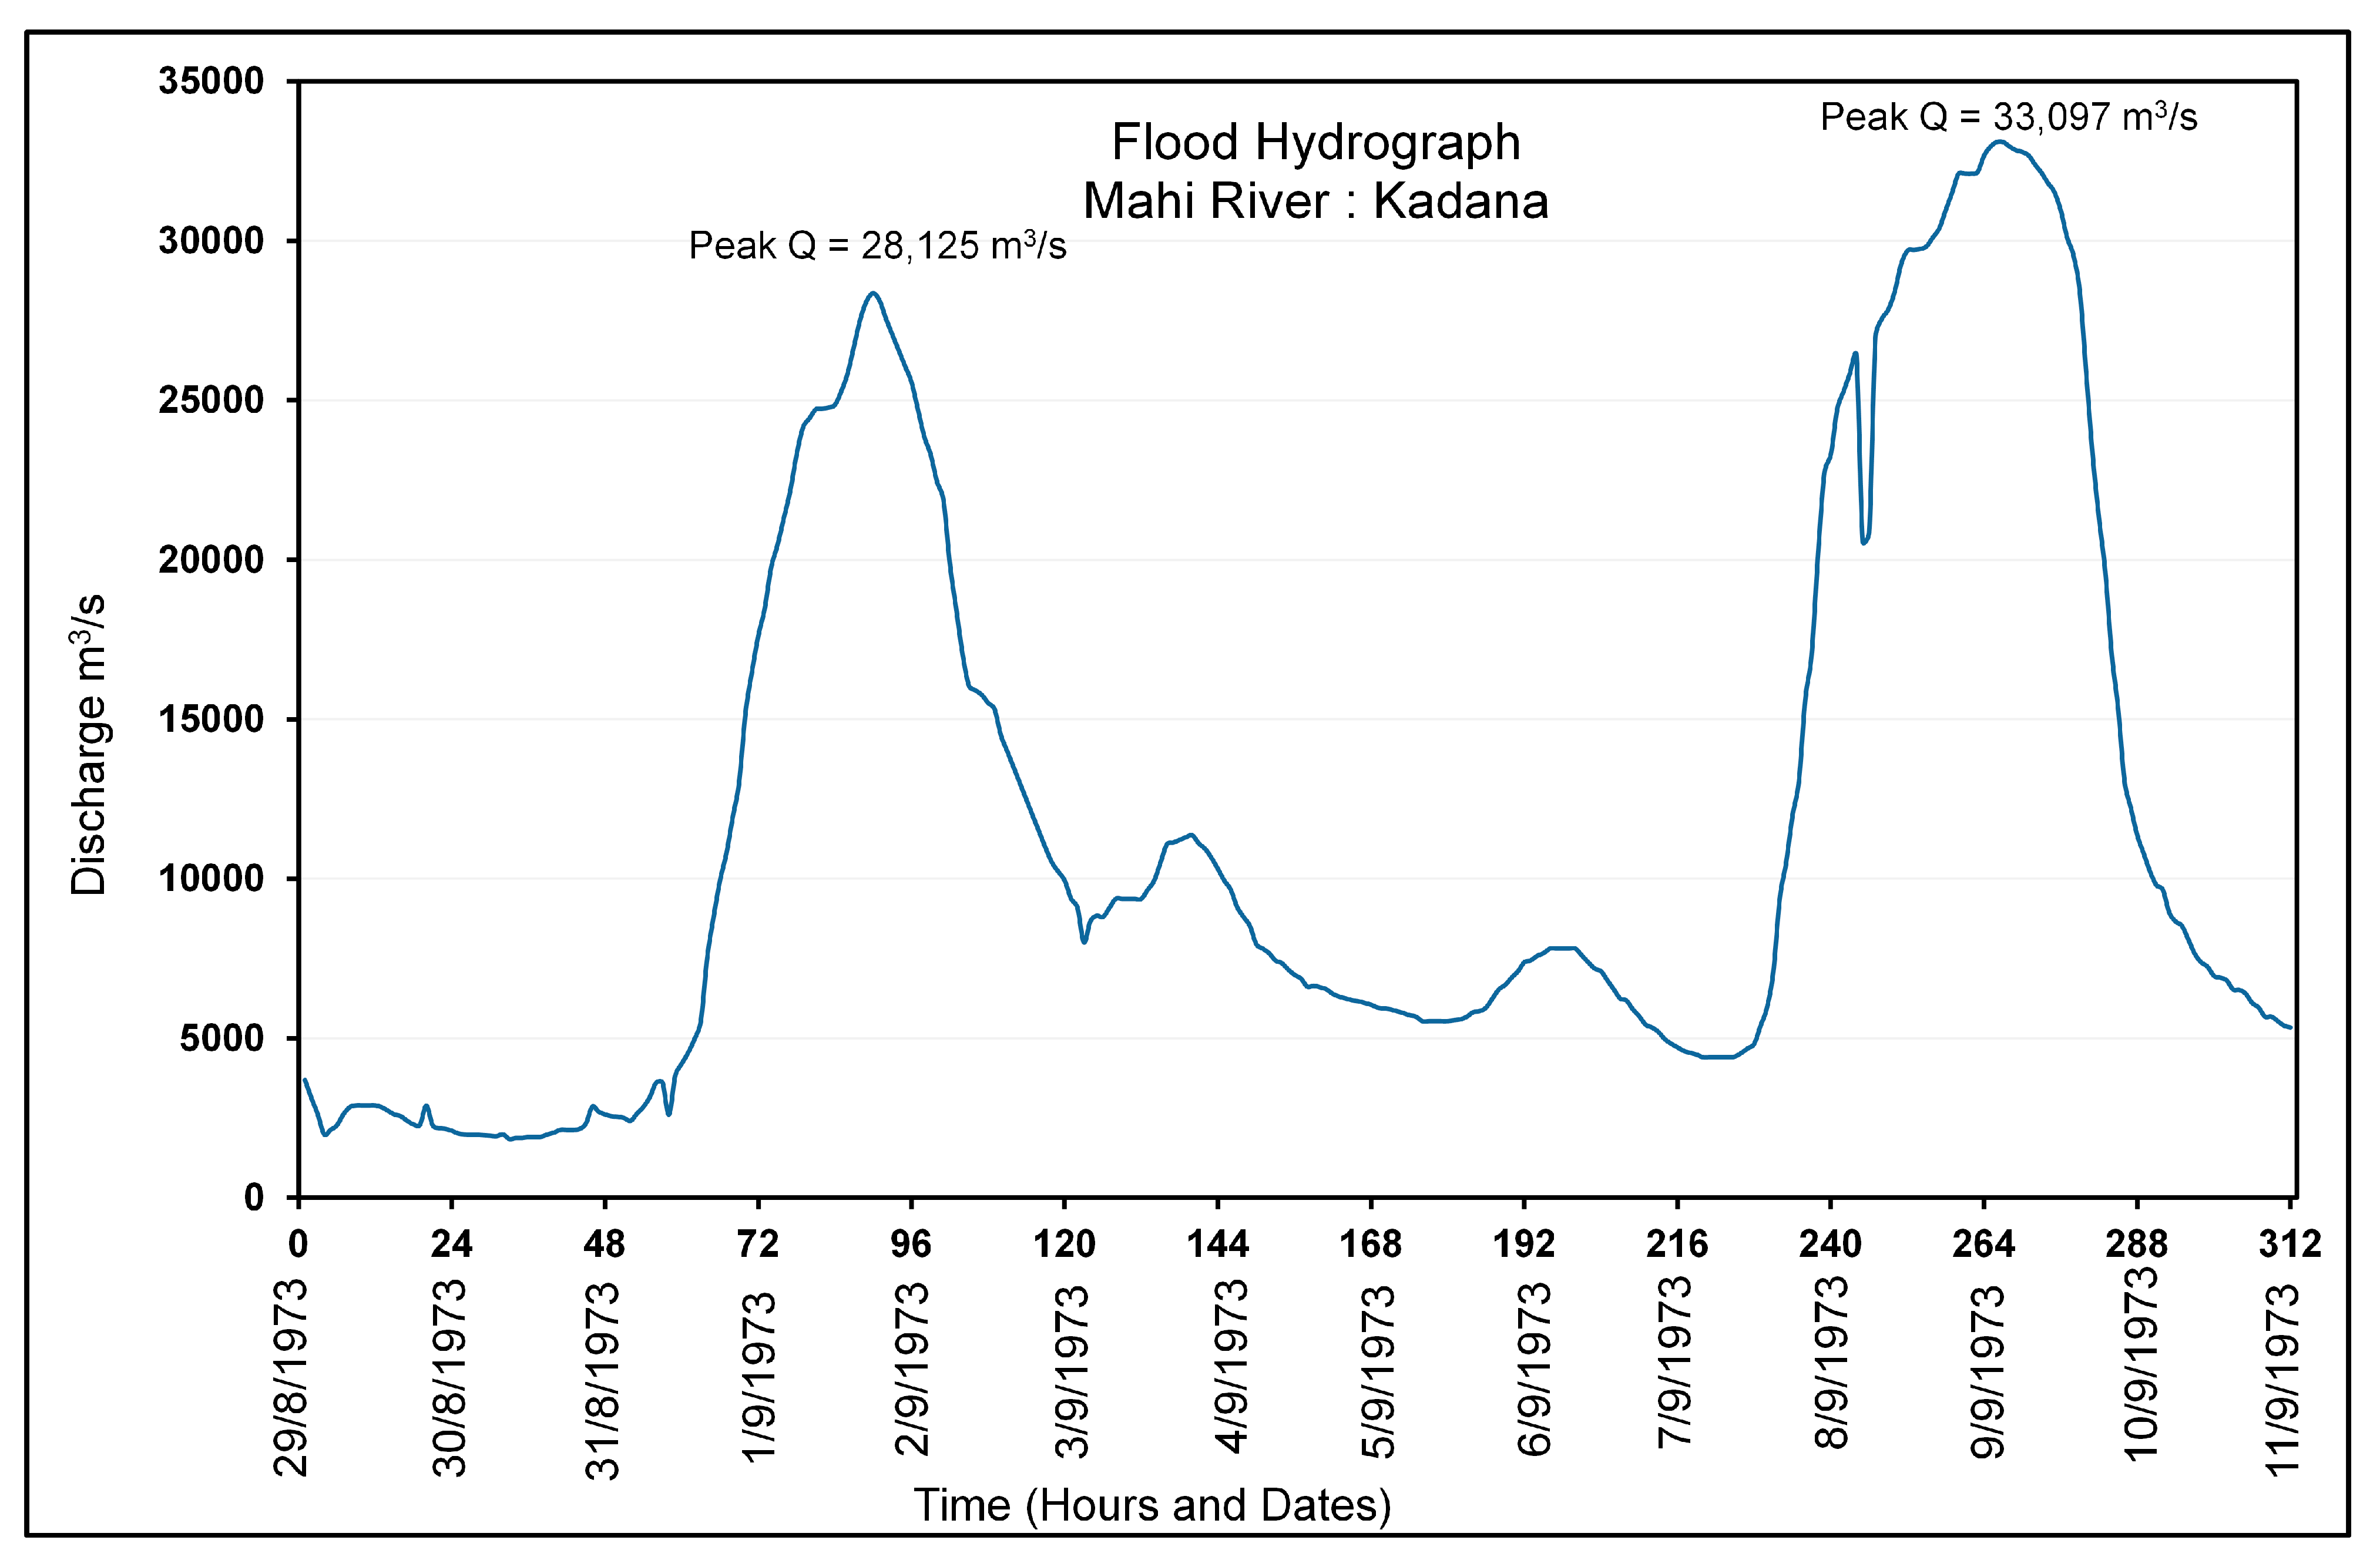
Flood hydrograph studies based on historical storm events have importance, as does computing design floods to construct hydraulic structures such as dams, weirs, and bridges. The flood hydrograph derived for the Kadana site showed a steep rising and falling limb with two pronounced flood peaks (Figure 9). It revealed the flashy nature of the Mahi River. The upstream catchment area of the Mahi Basin received heavy rainfall on 30–31 August 1973, and the first peak of hydrograph with 28,125 m3/s magnitudes was observed on 1 September 1973 at the Kadana. However, the highest peak of 33,097 m3/s was recorded on 9 September 1973 at the Kadana (Figure 9). The foremost reason for the high-magnitude flood at Kadana was the AMC and heavy rainfall in the upstream catchment of the Mahi Basin. Several scholars have emphasized the significance of AMC to flood runoff by evaluating the effects of AMC and rainfall on surface runoff, the volume of direct runoff, and flood magnitude [52,53,54,55,56]. Bronstert et al. [57] stated that the dynamics of the AMC of the catchment are frequently used to define sensitivity in order to produce surface flow and subsurface flow.
4.4. Impact of the 1973 Flood
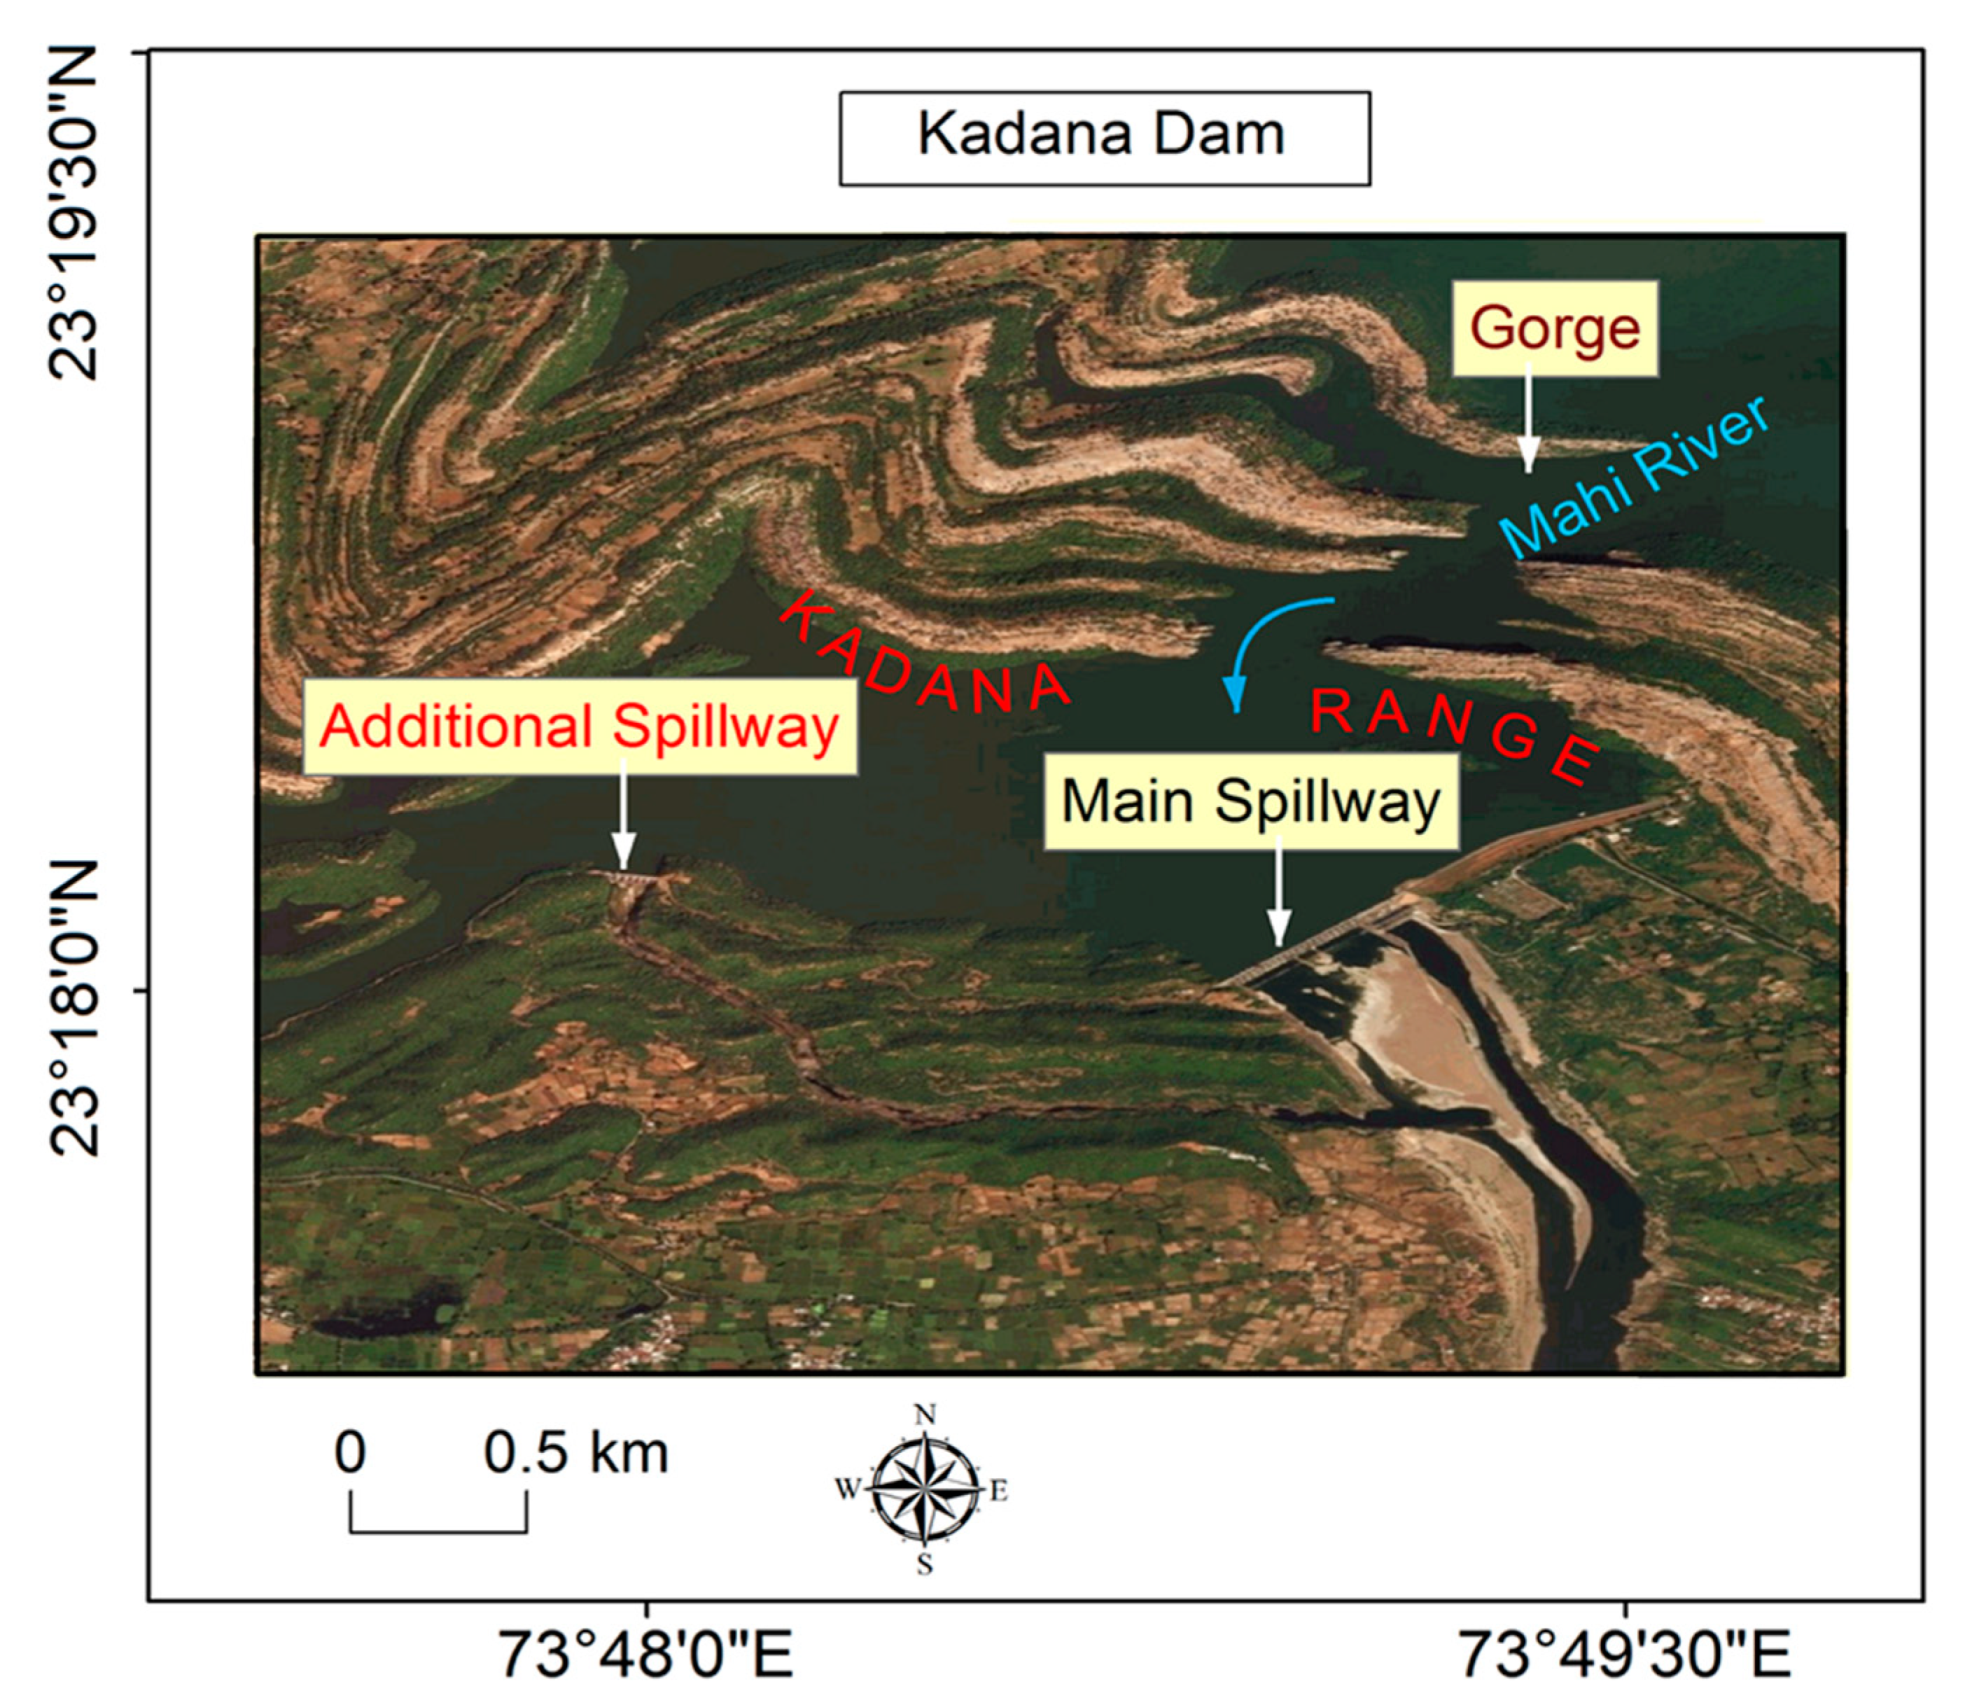
The flood impact data from the 1973 flood event were collected during fieldwork. The 1973 flood was more significant for redesigning the design flood of the Kadana Dam. The construction of the Kadana dam was planned based on the estimated design flood (31,087m3/s). However, the previously estimated design flood (31,087 m3/s) of the Kadana Dam was again revised because of the highest observed peak discharge of 21,820 m3/s in the 1968 flood at the Kadana. The revised design flood of the proposed dam at the Kadana was fixed at 36,840 m3/s [49]. The highest peak discharge of 33,097 m3/s observed at the Kadana in the year 1973 caused damage to the construction of the Kadana Dam. This enormous discharge again forced to the design flood of the Kadana Dam to be revised [49]. Normally, the shape and peak of the outflow hydrograph are considered to improve the existing flood peak estimation and design the spillway of a dam [58,59]. Accordingly, the design flood of the Kadana Dam was fixed at 46,871 m3/s discharge [49]. The main spillway of the Kadana Dam was designed to pass a discharge 36,871 m3/s through 21 radial gates, and an additional spillway was constructed based on a design flood to permit 10,000 m3/s discharges through 6 radial gates (Figure 10). The flood caused damage to the construction of the Kadana Dam in 1973 [49,60].
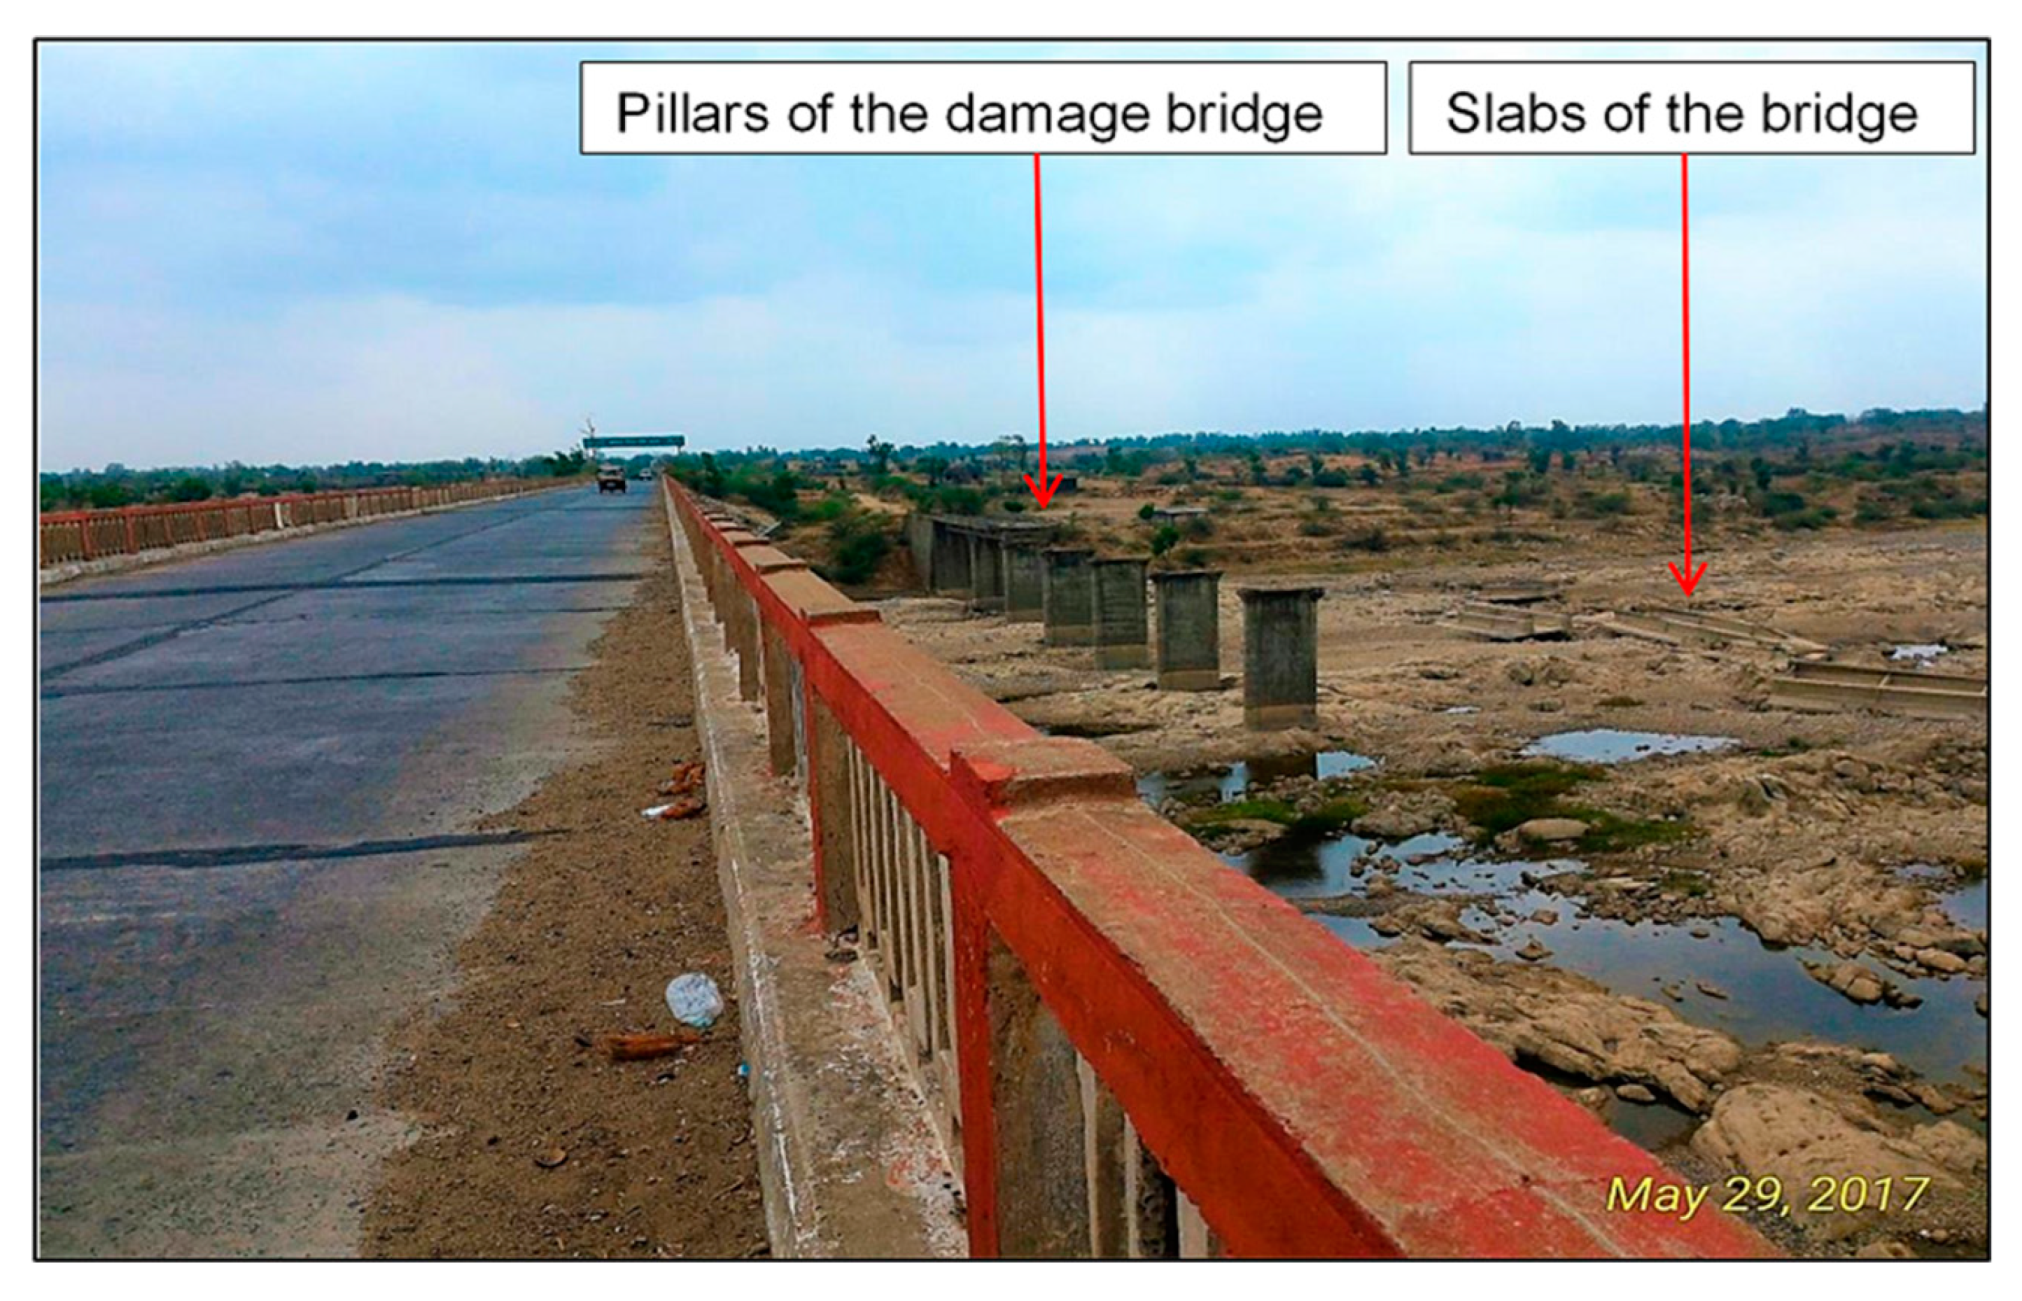
One of the significant effects of the 1973 flood was noticed at Kailashpuri, where a newly constructed bridge (1972) on the Banswara–Sagwara highway was washed out due to a large discharge of 21,553 m3/s on 7 September 1973 (Figure 11). A low level of the bridge and less spacing between two pillars caused damages to the bridge due to high magnitude discharges and uprooted trees in the flows. The slabs and pillars of the bridge were observed at a 50–60 m distance from the present pillars of the bridge. This suggests the importance of accurate estimation of design flood for hydraulic structures. Besides, the 1973 flood caused damage to several settlements and agriculture on both the banks of the Mahi River and its tributaries.
4.5. Floods and Climate Change
Flash floods can be managed in many ways, including structural and non-structural measures. However, non-structural measures would be more cost-effective in areas such as the Mahi basin. Flood inundation maps can be developed using satellite images, and matched with the respective flood discharges [61]. These inundation maps can then be used to define safer areas for the residents. In addition, the maps can be used to identify evacuation routes in an emergency state. Prior identification of those evacuation routes will be highly important to secure lives and properties [62]. Climate change and global warming have impacted the river basin’s hydro-meteorology and groundwater [61,63]. Climate change has not only increased the frequency of extreme rainfall but also affected the magnitude and frequency of flooding that causes damage to agriculture, infrastructure, and human life in various regions of the world [64,65,66]. The flood forecasting and warning system (FFWS) is one of the most effective measures to cope with climate change and global warming [67]. However, modeling is not easy, with changing future catchment characteristics in developing countries due to unstable development policies being in place. Manzoor et al. [29] propose numerous suggestions for efficient and sustainable flood control in Pakistan that can be used for South Asian countries such as India, Sri Lanka, and Bangladesh.
4.6. Limitations of the Research
The present study mostly focused on the 1973 flood. However, the availability of long-term continuous flood records is the major limitation of this research. Some of the tributaries of the Mahi River do not have discharge gauging stations.
5. Conclusions
The spatiotemporal rainfall characteristics of the Mahi Basin are significantly determined by the monsoon rainfall (June–September). The monsoon rainfall varies between 661 mm (at Dewal) and 1961 mm (at Danpur). The 1973 catastrophic flood was associated with chronological LPSs that produced heavy to very heavy rainfall over the Mahi Basin. As a result, most of the Mahi Basin received excess rainfall (+20% to +59%) in the 1973 monsoon season. Nevertheless, the annual rainfall of the basin was about 50% more than the normal annual rainfall (889 mm) in 1973. Some of the stations’ monsoon rainfall was above 60%, such as Sardarpur, Danpur, Mahi Dam, Bhungda, Salamgarh, Kushalgarh, Sajjangarh, Galiakot, Limkheda, and Devgarh Baria. Extremely heavy rainfall spells were observed at Bhungda (254 mm), Shergarh (249 mm), and Mahi Dam (247 mm), under the influence of the second LPS. Heavy to extremely heavy rainfall in the upper catchment of the basin on 7 and 8 September produced a catastrophic flood in the Mahi Basin. One of the notable impacts of 1973 was observed at Kailashpuri, where the slabs and pillars of the bridge were washed out and observed at a 50–60 m distance from the present pillars of the bridge. The catastrophic flood caused damage to several settlements and agricultural areas on both the banks of the Mahi River and its tributaries. Therefore, this study has significance for future flood disaster management and hydraulic structure construction in the Mahi Basin.
Author Contributions
Conceptualization, U.P.; methodology, U.P. and P.H.; fieldwork, U.P. and P.H.; software, U.P. and P.H.; validation, U.P. and P.H.; formal analysis, U.P. and P.H.; investigation, U.P. and P.H.; resources, U.P.; data curation, U.P.; writing—original draft preparation, U.P. and P.H.; writing—review and editing, U.R. and R.S.; visualization, U.P. and P.H.; supervision, P.H. and U.R.; project administration, U.R. and R.S. All authors have read and agreed to the published version of the manuscript.
Funding
This research received funding from the Science and Engineering Research Board (SERB), Department of Science and Technology (DST), Government of India, Project Number: EMR/2016/002590.
Data Availability Statement
Data used in this analysis can be requested from the corresponding author for noncommercial and research purposes.
Acknowledgments
The authors are extremely grateful to the Science and Engineering Research Board (SERB), Department of Science and Technology (DST), Government of India, Project Number: EMR/2016/002590 for providing financial support to carry out this research work. The authors are thankful to the India Meteorological Department (Pune), the Water Resource Department (Madhya Pradesh), and the India Water Portal and Central Water Commission (Gandhinagar), for providing rainfall and hydrological data. Additionally, the authors are also grateful to USGS for providing the free digital elevation model (DEM) dataset used in the analysis. The authors are indebted to D.K. More for valuable hydrological data and information obtained through their dissertation work. Thanks are due to Archana Patil and Gitanjali Bramhankar for their support during extensive fieldwork.
Conflicts of Interest
The authors declare no conflict of interest.
References
- Kale, V.S.; Hire, P.S.; Baker, V.R. Flood Hydrology and Geomorphology of Monsoon dominated Rivers: The Indian Peninsula. Water Int. 1997, 22, 259–265. [Google Scholar] [CrossRef]
- Jha, A.K.; Bloch, R.; Lamond, J. Cities and Flooding: A Guide to Integrated Urban Flood Risk Management for the 21st Century; World Bank Publications: Washington, DC, USA, 2012. [Google Scholar]
- Intergovernmental Panel on Climate Change (IPCC). Managing the Risks of Extreme Events and Disasters to Advance Climate Change Adaptation; A Special Report of Working Groups I and II of the Intergovernmental Panel on Climate Change; Cambridge University Press: Cambridge, UK, 2012. [Google Scholar]
- Ruin, I.; Creutin, J.D.; Anquetin, S.; Lutoff, C. Human exposure to flashfloods-relation between flood parameters and human vulnerability during a storm of September 2002 in Southern France. J. Hydrol. 2008, 361, 199–213. [Google Scholar] [CrossRef]
- Petrović, A.; Kostadinov, S.; Dragićević, S. The Inventory and Characterization of Torrential Flood Phenomenon in Serbia. Pol. J. Environ. Stud. 2014, 23, 823–830. [Google Scholar]
- Mrozik, K.D. Problems of Local Flooding in Functional Urban Areas in Poland. Water 2022, 14, 2453. [Google Scholar] [CrossRef]
- Ashley, S.T.; Ashley, W.S. Flood fatalities in the United States. J. Appl. Meteorol. Climatol. 2008, 47, 805–818. [Google Scholar] [CrossRef]
- Armah, F.A.; Yawson, D.O.; Yengoh, G.T.; Odoi, J.O.; Afrifa, E.K.A. Impact of floods on livelihoods and vulnerability of natural resource dependent communities in Northern Ghana. Water 2010, 2, 120–139. [Google Scholar] [CrossRef]
- Pande, R.K. Flash flood disasters in Uttarakhand. Disaster Prev. Manag. 2010, 19, 565–570. [Google Scholar] [CrossRef]
- Kotzee, I.; Reyers, B. Piloting a social-ecological index for measuring flood resilience: A composite index approach. Ecol. Indic. 2016, 60, 45–53. [Google Scholar] [CrossRef]
- Liu, T.; Shi, P.; Fang, J. Spatiotemporal variation in global floods with different affected areas and the contribution of influencing factors to flood-induced mortality (1985–2019). Nat. Hazards 2022, 111, 2601–2625. [Google Scholar] [CrossRef]
- Pereira, S.; Diakakis, M.; Deligiannakis, G.; Zêzere, J.L. Comparing flood mortality in Portugal and Greece (Western and Eastern Mediterranean). Int. J. Disaster Risk Reduct. 2017, 22, 147–157. [Google Scholar] [CrossRef]
- National Disaster Management Authority (NDMA). National Disaster Management Guidelines—Management of Floods; National Institute of Disaster Management (NDMA): New Delhi, India, 2008; pp. 1–135. [Google Scholar]
- Benito, G.; Hudson, P. Flood hazards: The context of fluvial geomorphology. In Geomorphological Hazards and Disaster Prevention; Alcántara-Ayala, I., Goudie, A., Eds.; Cambridge University Press: Cambridge, UK, 2010; pp. 111–128. [Google Scholar]
- Merz, B.; Kreibich, H.; Schwarze, R.; Thieken, A. Assessment of economic flood damage. Nat. Hazards Earth Syst. Sci. 2010, 10, 1679–1724. [Google Scholar] [CrossRef]
- Rentschler, J.; Salhab, M. People in Harm’s Way: Flood Exposure and Poverty in 189 Countries; Policy Research Working Paper No. 9447; World Bank: Washington, DC, USA, 2020. [Google Scholar]
- Pawar, U.V.; Hire, P.S.; Gunjal, R.P.; Patil, A.D. Modeling of magnitude and frequency of floods on the Narmada River: India. Model. Earth Syst. Environ. 2020, 6, 2505–2516. [Google Scholar] [CrossRef]
- Elleder, L.; Herget, J.; Roggenkamp, T.; Nießen, A. Historic floods in the city of Prague-a reconstruction of peak discharges for 1481–1825 based on documentary sources. Hydrol. Res. 2013, 44, 202–214. [Google Scholar] [CrossRef]
- Wang, W.; Zhou, K.; Jing, H.; Zuo, J.; Li, P.; Li, Z. Effects of Bridge Piers on Flood Hazards: A Case Study on the Jialing River in China. Water 2019, 11, 1181. [Google Scholar] [CrossRef]
- Pregnolato, M.; Winter, A.O.; Mascarenas, D.; Sen, A.D.; Bates, P.; Motley, M.R. Assessing flooding impact to riverine bridges: An integrated analysis. Nat. Hazards Earth Syst. Sci. 2020, 22, 1559–1576. [Google Scholar] [CrossRef]
- Shah, S. Coping with Natural Disaster: The 1998 Floods in Bangladesh; World Bank: Washington, DC, USA, 1999. [Google Scholar]
- Mustafa, D. Linking access and vulnerability: Perceptions of irrigation and flood management in Pakistan. Prof. Geogr. 2002, 54, 94–105. [Google Scholar] [CrossRef]
- Dhar, O.N.; Rakhecha, P.R.; Mandal, B.N.; Sangam, R.B. The Rainstorm which caused the Morvi Dam Disaster in August 1979. Hydrol. Sci. J. 1981, 26, 71–81. [Google Scholar] [CrossRef]
- Fluixá-Sanmartín, J.; Morales-Torres, A.; Escuder-Bueno, I.; Paredes-Arquiola, J. Quantification of climate change impact on dam failure risk under hydrological scenarios: A case study from a Spanish dam. Nat. Hazards Earth Syst. Sci. 2019, 19, 2117–2139. [Google Scholar] [CrossRef]
- Gaagai, A.; Aouissi, H.A.; Krauklis, A.E.; Burlakovs, J.; Athamena, A.; Zekker, I.; Boudoukha, A.; Benaabidate, L.; Chenchouni, H. Modeling and Risk Analysis of Dam-Break Flooding in a Semi-Arid Montane Watershed: A Case Study of the Yabous Dam, Northeastern Algeria. Water 2020, 14, 767. [Google Scholar] [CrossRef]
- Adamo, N.; Al-Ansari, N.; Sissakian, V.; Laue, J.; Knutsson, S. Dam safety and overtopping. J. Earth Sci. Geotech. Eng. 2020, 10, 41–78. [Google Scholar]
- Shrestha, M.S. Impacts of Floods in South Asia. J. South Asia Disaster Stud. 2008, 1, 85–106. [Google Scholar]
- Kronstadt, K.A. Flooding in Pakistan: Overview and Issues for Congress; DIANE Publishing: Collingdale, PA, USA, 2010. [Google Scholar]
- Manzoor, Z.; Ehsan, M.; Khan, M.B.; Manzoor, A.; Akhter, M.M.; Sohail, M.T.; Hussain, A.; Shafi, A.; Abu-Alam, T.; Abioui, M. Floods and flood management and its socio-economic impact on Pakistan: A review of the empirical literature. Front. Environ. Sci. 2022, 10, 1021862. [Google Scholar] [CrossRef]
- Dewan, T.H. Societal impacts and vulnerability to floods in Bangladesh and Nepal. Weather. Clim. Extrem. 2015, 7, 36–42. [Google Scholar] [CrossRef]
- Sharma, T.P.; Zhang, J.; Koju, U.; Zhang, Z.; Bai, Y.; Suwal, M.K. Review of flood disaster studies in Nepal: A remote sensing perspective. Int. J. Disaster Risk Reduct. 2019, 34, 18–27. [Google Scholar] [CrossRef]
- Kale, V.S.; Ely, L.L.; Enzel, Y.; Baker, V.R. Geomorphic and hydrologic aspects of monsoon floods on the Narmada and Tapi Rivers in central India. Geomorphology 1994, 10, 157–168. [Google Scholar] [CrossRef]
- Kale, V.S.; Hire, P.S. Effectiveness of monsoon floods on the Tapi River, India: Role of channel geometry and hydrologic regime. Geomorphology 2004, 57, 275–291. [Google Scholar] [CrossRef]
- Mooley, D.A. Some aspects of Indian monsoon depressions and the associated rainfall. Mon. Weather. Rev. 1973, 101, 271–280. [Google Scholar] [CrossRef]
- Mooley, D.A.; Shukla, J. Main features of the westward moving low pressure area system which forms over the Indian region during the summer monsoon season and their relation to the monsoon rainfall. Mausam 1989, 40, 137–152. [Google Scholar] [CrossRef]
- Patil, A.D.; Hire, P.S. Flood hydrometeorological situations associated with monsoon floods on the Par River in western India. Mausam 2021, 71, 687–698. [Google Scholar]
- Roxy, M.K.; Ghosh, S.; Pathak, A.; Athulya, R.; Mujumdar, M.; Murtugudde, R.; Terray, P.; Rajeevan, M. A threefold rise in widespread extreme rain events over central India. Nat. Commun. 2017, 8, 708. [Google Scholar] [CrossRef]
- Singh, D.; Tsiang, M.; Rajaratnam, B.; Diffenbaugh, N.S. Observed changes in extreme wet and dry spells during the South Asian summer monsoon season. Nat. Clim. Chang. 2014, 4, 456–461. [Google Scholar] [CrossRef]
- Mohan, T.; Rajeevan, M. Past and future trends of hydroclimatic intensity over the Indian monsoon region. J. Geophys. Res. Atmos. 2017, 122, 896–909. [Google Scholar] [CrossRef]
- Pawar, U.; Rathnayake, U. Spatiotemporal rainfall variability and trend analysis over Mahaweli Basin, Sri Lanka. Arab. J. Geosci. 2022, 15, 370–416. [Google Scholar] [CrossRef]
- Pawar, U.; Karunathilaka, P.; Rathnayake, U. Spatio-Temporal Rainfall Variability and Concentration over Sri Lanka. Adv. Meteorol. 2022, 2022, 6456761. [Google Scholar] [CrossRef]
- Ma, N.; Yu, K.; Zhang, Y.; Zhai, J.; Zhang, Y.; Zhang, H. Ground observed climatology and trend in snow cover phenology across China with consideration of snow-free breaks. Clim. Dyn. 2020, 55, 2867–2887. [Google Scholar] [CrossRef]
- Pawar, U.V. An Analytical Study of Geomorphological, Hydrological and Meteorological Characteristics of Floods in the Mahi River Basin: Western India. Ph.D. Thesis, Tilak Maharashtra Vidyapeeth, Pune, India, 2019; pp. 1–215. [Google Scholar]
- Pawar, U.V.; Hire, P.S. Flood frequency analysis of the Mahi Basin by using Log Pearson type III probability distribution. Hydrospat. Anal. 2019, 2, 102–112. [Google Scholar] [CrossRef]
- Sharma, A.; Sensarma, S.; Kumar, K.; Khanna, P.P.; Saini, N.K. Mineralogy and geochemistry of the Mahi River sediments in tectonically active western India: Implications for Deccan large igneous province source, weathering and mobility of elements in a semi-arid climate. Geochim. Cosmochim. Acta 2013, 104, 63–83. [Google Scholar] [CrossRef]
- Ministry of Irrigation and Power. Report of the Irrigation Commission 1972 Volume III (Part 1); Ministry of Irrigation and Power: New Delhi, India, 1972; pp. 354–383. [Google Scholar]
- Patle, P.; Singh, P.K.; Ahmad, I.; Matsuno, Y.; Leh, M.; Ghosh, S. Spatio-temporal estimation of green and blue water consumptions and water and land productivity using satellite remote sensing datasets and WA+ framework: A case study of the Mahi Basin, India. Agric. Water Manag. 2023, 277, 108097. [Google Scholar] [CrossRef]
- India Meteorological Department (IMD). Weather—Monsoon season (June–September 1973). Mausam 1974, 25, 85–92. [Google Scholar] [CrossRef]
- More, D.K. Flood Control Operation of Kadana Reservoir. Master’s Dissertation, University of Roorkee, Roorkee, India, 1986. [Google Scholar]
- Abbi, S.D.S.; Nagasubramanian, M.R.; Jain, B.C. Rainfall and floods in India during 1973 southwest monsoon period. Indian J. Meteorol. Geophys. 1974, 25, 363–370. [Google Scholar] [CrossRef]
- Alexander, G.; Grorge, C.A.; Jambunathan, R. Cyclones and depressions of 1973—Bay of Bengal and Arabian Sea. Ind. J. Meteorol. Geophys. 1974, 25, 347–362. [Google Scholar]
- Merz, B.; Plate, E.J. An analysis of the effects of spatial variability of soil and soil moisture on runoff. Water Resour. Res. 1997, 33, 2909–2922. [Google Scholar] [CrossRef]
- Tramblay, Y.; Bouvier, C.; Martin, C.; Didon-Lescot, J.F.; Todorovik, D.; Domergue, J.M. Assessment of initial soil moisture conditions for event-based rainfall runoff modelling. J. Hydrol. 2010, 380, 305–317. [Google Scholar] [CrossRef]
- Penna, D.; Tromp-van Meerveld, H.J.; Gobbi, A.; Borga, M.; Dalla Fontana, G. The influence of soil moisture on threshold runoff generation processes in an Alpine headwater catchment. J. Hydrol. Earth Syst. Sci. 2011, 15, 689–702. [Google Scholar] [CrossRef]
- Chifflard, P.; Kranl, J.; Zur Strassen, G.; Zepp, H. The significance of soil moisture in forecasting characteristics of flood events. A statistical analysis in two nested catchments. J. Hydrol. Hydromech. 2018, 66, 1–11. [Google Scholar] [CrossRef]
- Han, H.; Kim, J.; Chandrasekhar, V.; Choi, J.; Lim, S. Modeling streamflow enhanced by precipitation from atmospheric river using the NOAA national water model: A case study of the Russian river basin for February 2004. Atmosphere 2019, 10, 466. [Google Scholar] [CrossRef]
- Bronstert, A.; Creutzfeldt, B.; Graeff, T.; Hajnsek, I.; Heistermann, M.; Itzerott, S.; Jagdhuber, T.; Kneis, D.; Lück, E.; Reusser, D.; et al. Potentials and constraints of different types of soil moisture observations for flood simulations in headwater catchments. Nat. Hazards 2012, 60, 879–914. [Google Scholar] [CrossRef]
- Eagleson, P. Dynamics of flood frequency. Water Resour. Res. 1972, 14, 878–898. [Google Scholar] [CrossRef]
- Klemes, V. The improbable probabilities of extreme floods and droughts. In Hydrology of Disasters; Starosolszky, O., Melder, O.M., Eds.; James and James: London, UK, 1988; pp. 43–51. [Google Scholar]
- Kulkarni, Y.N.; Shah, C.S. Strengthening foundation of Kadana Dam. In Proceedings of the International Society for Rock Mechanics and Rock Engineering (ISRM) International Symposium, Tokyo, Japan, 21–24 September 1981. [Google Scholar]
- Pawar, U.; Suppawimut, W.; Muttil, N.; Rathnayake, U. A GIS Based Comparative Analysis of Frequency Ratio and Statistical Index Models for Flood Susceptibility Mapping in the Upper Krishna Basin, India. Water 2022, 14, 3771. [Google Scholar] [CrossRef]
- Srishantha, U.; Rathnayake, U. Sustainable urban drainage systems (SUDS) what it is and where do we stand today? Eng. Appl. Sci. Res. 2017, 44, 235–241. [Google Scholar]
- Sohail, M.T.; Hussan, A.; Ehsan, M.; Al-Ansari, N.; Akhter, M.M.; Manzoor, Z.; Elbeltagi, A. Groundwater budgeting of Nari and Gaj formations and groundwater mapping of Karachi, Pakistan. Appl. Water Sci. 2022, 12, 267. [Google Scholar] [CrossRef]
- Kotir, J.H. Climate change and variability in Sub-Saharan Africa: A review of current and future trends and impacts on agriculture and food security. Environ. Dev. Sustain. 2011, 13, 587–605. [Google Scholar] [CrossRef]
- Mirza, M.M.Q. Climate change and extreme weather events: Can developing countries adapt? Clim. Policy 2003, 3, 233–248. [Google Scholar] [CrossRef]
- Jiang, T.; Chen, Y.D.; Xu, C.Y.; Chen, X.; Chen, X.; Singh, V.P. Comparison of hydrological impacts of climate change simulated by six hydrological models in the Dongjiang Basin, South China. J. Hydrol. 2007, 336, 316–333. [Google Scholar] [CrossRef]
- Jain, S.K.; Mani, P.; Jain, S.K.; Prakash, P.; Singh, V.P.; Tullos, D.; Kumar, S.; Agarwal, S.P.; Dimri, A.P. A Brief review of flood forecasting techniques and their applications. Int. J. River Basin Manag. 2008, 16, 329–344. [Google Scholar] [CrossRef]
Figure 1.
Location of the study area and discharge station in the Mahi Basin.

Figure 2.
Rain gauge stations in the Mahi Basin.

Figure 3.
Flow chart of the methodology used for hydro-meteorological analysis of 1973 flood.

Figure 4.
Spatial distribution of (a) annual rainfall; (b) monsoon rainfall in the Mahi Basin in 1973.
Figure 4.
Spatial distribution of (a) annual rainfall; (b) monsoon rainfall in the Mahi Basin in 1973.


Figure 5.
Spatial distribution of 1973 rainfall deviation from mean rainfall in the Mahi Basin.

Figure 6.
Tracking of the low pressure systems (LPSs) that produced the 1973 flood in the Mahi Basin.
Figure 6.
Tracking of the low pressure systems (LPSs) that produced the 1973 flood in the Mahi Basin.

Figure 7.
Spatial distribution of rainfall of first LPS (a) day 1 (b) day 2 (c) day 3, and second LPS (d) day 1 (e) day 2 (f) day 3.
Figure 7.
Spatial distribution of rainfall of first LPS (a) day 1 (b) day 2 (c) day 3, and second LPS (d) day 1 (e) day 2 (f) day 3.

Figure 8.
Location map of the 1973 HFL in the Mahi Basin.

Figure 9.
Flood hydrograph of the Mahi River at Kadana (1973 flood). Data source—More [49].
Figure 9.
Flood hydrograph of the Mahi River at Kadana (1973 flood). Data source—More [49].

Figure 10.
Kadana Dam with additional spillway after 1973 flood.

Figure 11.
A view of collapsed Mahi Bridge as a result of the flood on 8 September 1973 from the new bridge on the Banswara–Sagwara highway near Kailashpuri (Sagwara, Rajasthan—captured by Hire, P.).
Figure 11.
A view of collapsed Mahi Bridge as a result of the flood on 8 September 1973 from the new bridge on the Banswara–Sagwara highway near Kailashpuri (Sagwara, Rajasthan—captured by Hire, P.).


Table 1.
Flash floods occurring in the Mahi Basin in the past (1901–2020).
| Month, Date and Year of Flood | Monsoon Rainfall of the Mahi Basin in mm | Synoptic Conditions |
|---|---|---|
| 27 July 1913 | 1072.43 (+24.27%) | Bay of Bengal Depression |
| 27 July 1927 | 1143.57 (+32.51%) | Bay of Bengal Depression |
| September 1933 | 1278.40 (+48.13%) | Bay of Bengal Depression |
| July 1941 | 1078.33 (+24.95) | Bay of Bengal Depression |
| August 1944 | 1347.11 (+56.10%) | Bay of Bengal Depression |
| 24 September 1945 | 1148.41 (+33.07%) | Bay of Bengal Depression |
| 5 August 1946 | 1184.27 (+37.23%) | Land Depression |
| 15 September 1959 | 1352.49 (+56.72%) | Land Depression |
| 6 September 1970 | 995.85 (+15.39%) | Land Depression |
| 7 September 1973 | 1287.94 (+49.24%) | Bay of Bengal Depression |
| 30 August 1976 | 1247.81 (+44.59%) | Bay of Bengal Depression |
| 30 August 1978 | 1025.24 (+18.80%) | Bay of Bengal Depression |
| 2 August 1994 | 1369.06 (+58.64%) | Bay of Bengal Depression |
| August 2006 | 1580.94 (+83.19%) | Bay of Bengal Depression |
Note: Values in brackets show the excess rainfall from the average rainfall of the basin for respective flood years. Data source—Pawar [43].
Table 2.
LPS-associated station-wise rainfall distribution over the Mahi Basin.
 |
Disclaimer/Publisher’s Note: The statements, opinions and data contained in all publications are solely those of the individual author(s) and contributor(s) and not of MDPI and/or the editor(s). MDPI and/or the editor(s) disclaim responsibility for any injury to people or property resulting from any ideas, methods, instructions or products referred to in the content. |
© 2023 by the authors. Licensee MDPI, Basel, Switzerland. This article is an open access article distributed under the terms and conditions of the Creative Commons Attribution (CC BY) license (https://creativecommons.org/licenses/by/4.0/).
Share and Cite
MDPI and ACS Style
Pawar, U.; Hire, P.; Sarukkalige, R.; Rathnayake, U. Hydro-Meteorological Characteristics of the 1973 Catastrophic Flood in the Mahi Basin, India. Water 2023, 15, 1648. https://doi.org/10.3390/w15091648
AMA Style
Pawar U, Hire P, Sarukkalige R, Rathnayake U. Hydro-Meteorological Characteristics of the 1973 Catastrophic Flood in the Mahi Basin, India. Water. 2023; 15(9):1648. https://doi.org/10.3390/w15091648
Chicago/Turabian StylePawar, Uttam, Pramodkumar Hire, Ranjan Sarukkalige, and Upaka Rathnayake. 2023. "Hydro-Meteorological Characteristics of the 1973 Catastrophic Flood in the Mahi Basin, India" Water 15, no. 9: 1648. https://doi.org/10.3390/w15091648
Note that from the first issue of 2016, this journal uses article numbers instead of page numbers. See further details here.