
Regional Flood Frequency Analysis: A Bibliometric Overview

School of Engineering, Design and Built Environment, Western Sydney University, Building XB, Kingswood, NSW 2051, Australia
*
Author to whom correspondence should be addressed.
Water 2023, 15(9), 1658; https://doi.org/10.3390/w15091658
Submission received: 7 March 2023
/
Revised: 16 April 2023
/
Accepted: 20 April 2023
/
Published: 24 April 2023
(This article belongs to the Special Issue Sustainable Water Futures: Climate, Community and Circular Economy)
Abstract
:In water resources management, environmental and ecological studies, estimation of design streamflow is often needed. For gauged catchments, at-site flood frequency analysis is used for this purpose; however, for ungauged catchments, regional flood frequency analysis (RFFA) is the preferred method. RFFA attempts to transfer flood characteristics from gauged to ungauged catchments based on the assumption of regional homogeneity. A bibliometric analysis on RFFA is presented here using Web of Science (WoS) and Scopus databases. A total of 626 articles were selected from these databases. From the bibliometric analysis, it has been found that Journal of Hydrology and Water Resources Research are the two leading journals reporting RFFA research. In RFFA research, leading countries include Canada, USA, UK, Italy and Australia. In terms of citations, the top performing researchers are Ouarda T, Burn D, Rahman A, Haddad K and Chebana F. Future research should be directed towards the identification of homogeneous regions, application of efficient artificial intelligence (AI)-based RFFA models, incorporation of climate change impacts and uncertainty analysis.
1. Introduction
Flooding is a natural disaster that often causes extensive economic damage and loss of life [1]. Flooding is becoming more intense and frequent due to climate change [2]. To reduce flood damage at a given location, a flood risk assessment is often carried out. It involves estimation of a design flood, which is defined as a flood discharge associated with an annual exceedance probability. Design floods are used in the design of hydraulic structures and many other flood management tasks. At a gauged location, at-site flood frequency analysis is carried out to estimate design floods. However, many locations where a design flood estimate is needed are ungauged or have little recorded streamflow data. For these ungauged sites, a regional flood frequency analysis (RFFA) is adopted to estimate design floods [3,4,5]. RFFA may focus on peak, volume, frequency, depth and duration of flood events [6,7].
RFFA consists of two principal steps: identification of homogeneous regions and development of regional flood estimation equations [8,9]. Homogeneous regions can be formed based on a geographical boundary where all the sites in an assumed region form a fixed region [10,11,12,13]. Alternatively, a region-of-influence (ROI) approach can be adopted where each of the selected sites forms its own region [14,15]. Regional homogeneity is a vital assumption of RFFA, which may affect relative accuracy of flood quantile estimates [16,17,18,19]. To assess the degree of homogeneity in a proposed region, various statistical tests are proposed [20,21,22,23]. Regions can be formed on a geographical space or in a catchment attribute space. Various multivariate statistical techniques such as principal component analysis [24,25], cluster analysis [25,26,27] and canonical correlation analysis [28,29,30] are used to derive homogeneous regions. More recently, Han et al. [9] applied network theory in identification of homogeneous regions in RFFA.
To develop regional flood estimation equations, several methods are proposed: (a) rational method/probabilistic rational method [11,31,32]; (b) index flood method [21,33,34,35,36]; (c) quantile regression technique [37,38,39,40,41]; (d) parameter regression technique [40,42,43]. The Australian Rainfall and Runoff Guidelines recommended the parameter regression technique for general use in data-rich regions of Australia [43]. To deal with the non-linearity of rainfall–runoff processes, some researchers have proposed the use of artificial intelligence-based models in RFFA [44,45,46,47]. Kriging has also been applied in RFFA [48,49,50].
There have been numerous studies on RFFA across the globe to suit the local hydrology. However, bibliometric analysis to summarize these RFFA studies is limited. To fill this research gap, the current study presents an overview of RFFA studies using a bibliometric analysis and a literature review. The main innovative aspect of this study is to identify the research trends in RFFA and future research needs. The motivation behind this study is to advance RFFA research by shedding light on the evolution of RFFA, current trends, degree of collaboration and scope of future enhancement.
2. Bibliometric Analysis
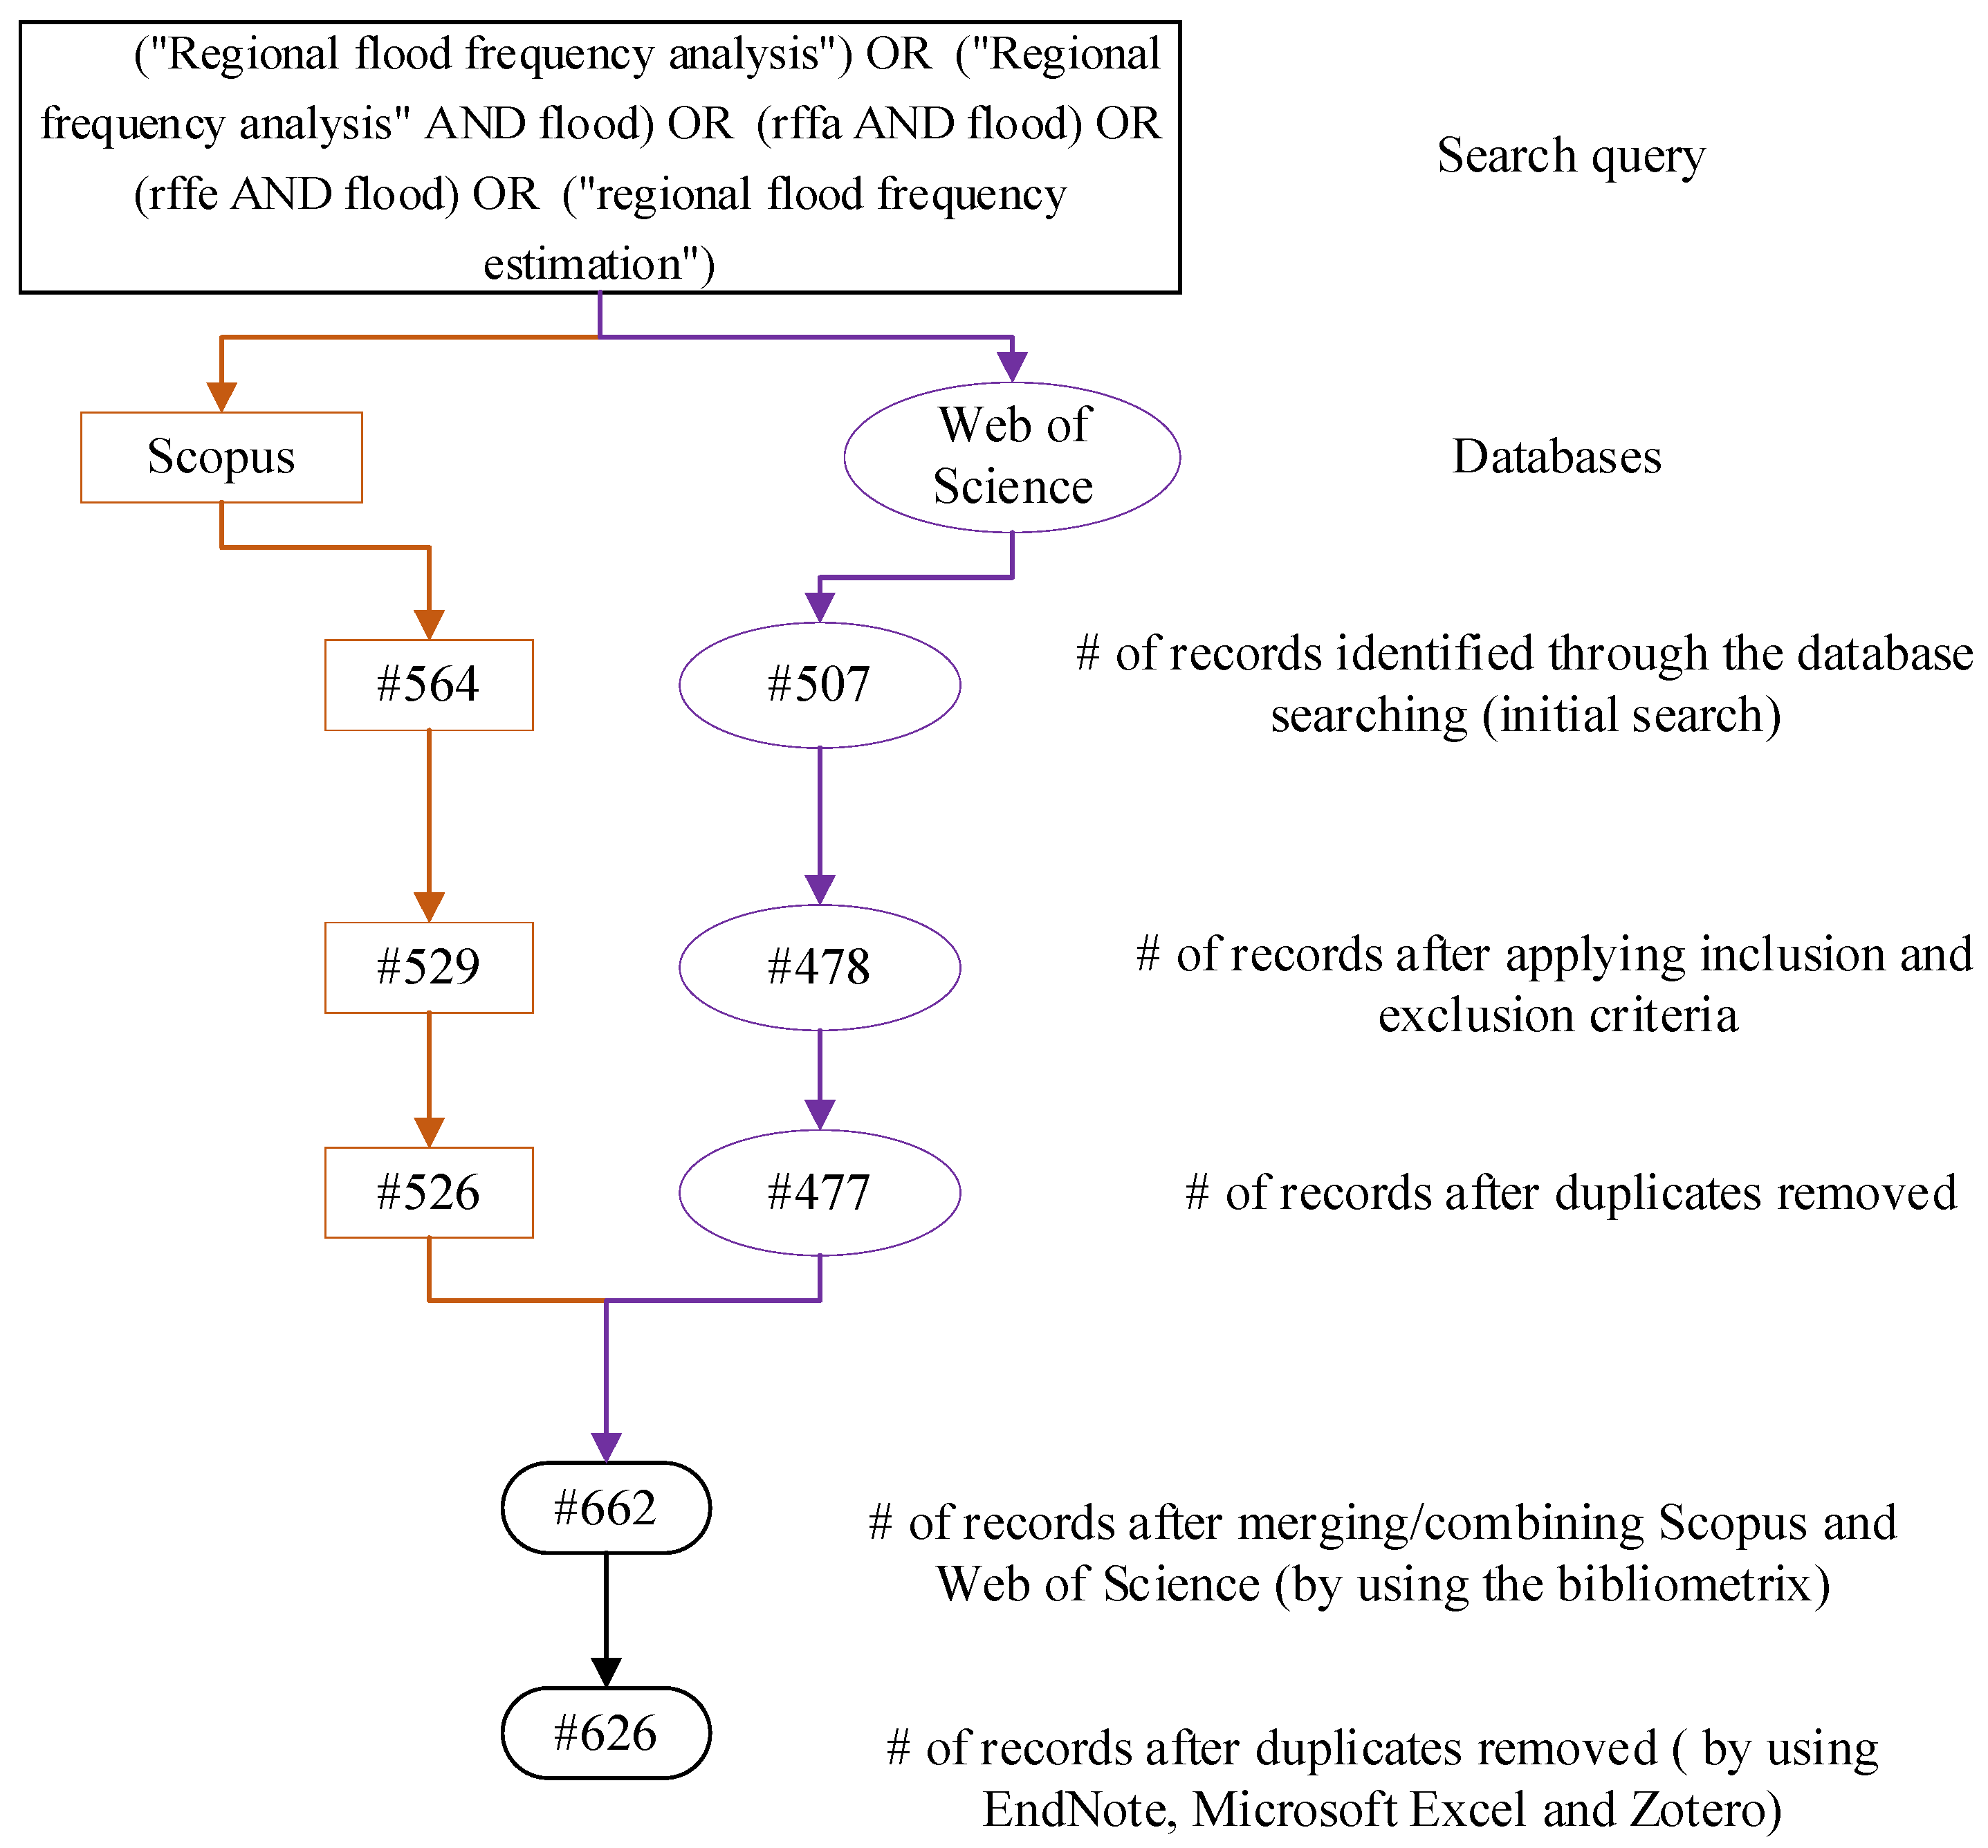
A standard workflow of science mapping in bibliometric analysis has five stages: (1) research design, (2) data collection, (3) data analysis, (4) visualization and (5) interpretation [51]. Peer-reviewed research articles on RFFA studies were obtained from the Web of Science (WoS) and Scopus databases on 9 November 2022 based on the search terms; the inclusion and exclusion criteria are given in Table 1. WoS and Scopus have already been used in bibliometric analysis in different fields either individually [52,53,54] or combined [55,56,57]. The record includes citation information (authors, titles, citation count, etc.), bibliographic information (e.g., affiliations), abstract, keywords and other information (e.g., references).
Figure 1 shows a schematic diagram of our analysis, including identification, screening, eligibility and included documents [58]. Data were downloaded/exported from WoS and Scopus in RIS, csv, BibTeX and plain text format to use in EndNote, Excel, LateX, Zotero and the bibliometrix. Data analysis tools were used to identify duplicates as well as merging, combining and/or finding inconsistent cells/nodes (such as no author information and misspelling) [59]. The bibliometrix 2017 and VOSviewer [60] were used to achieve the visualization step of our bibliometric analysis.
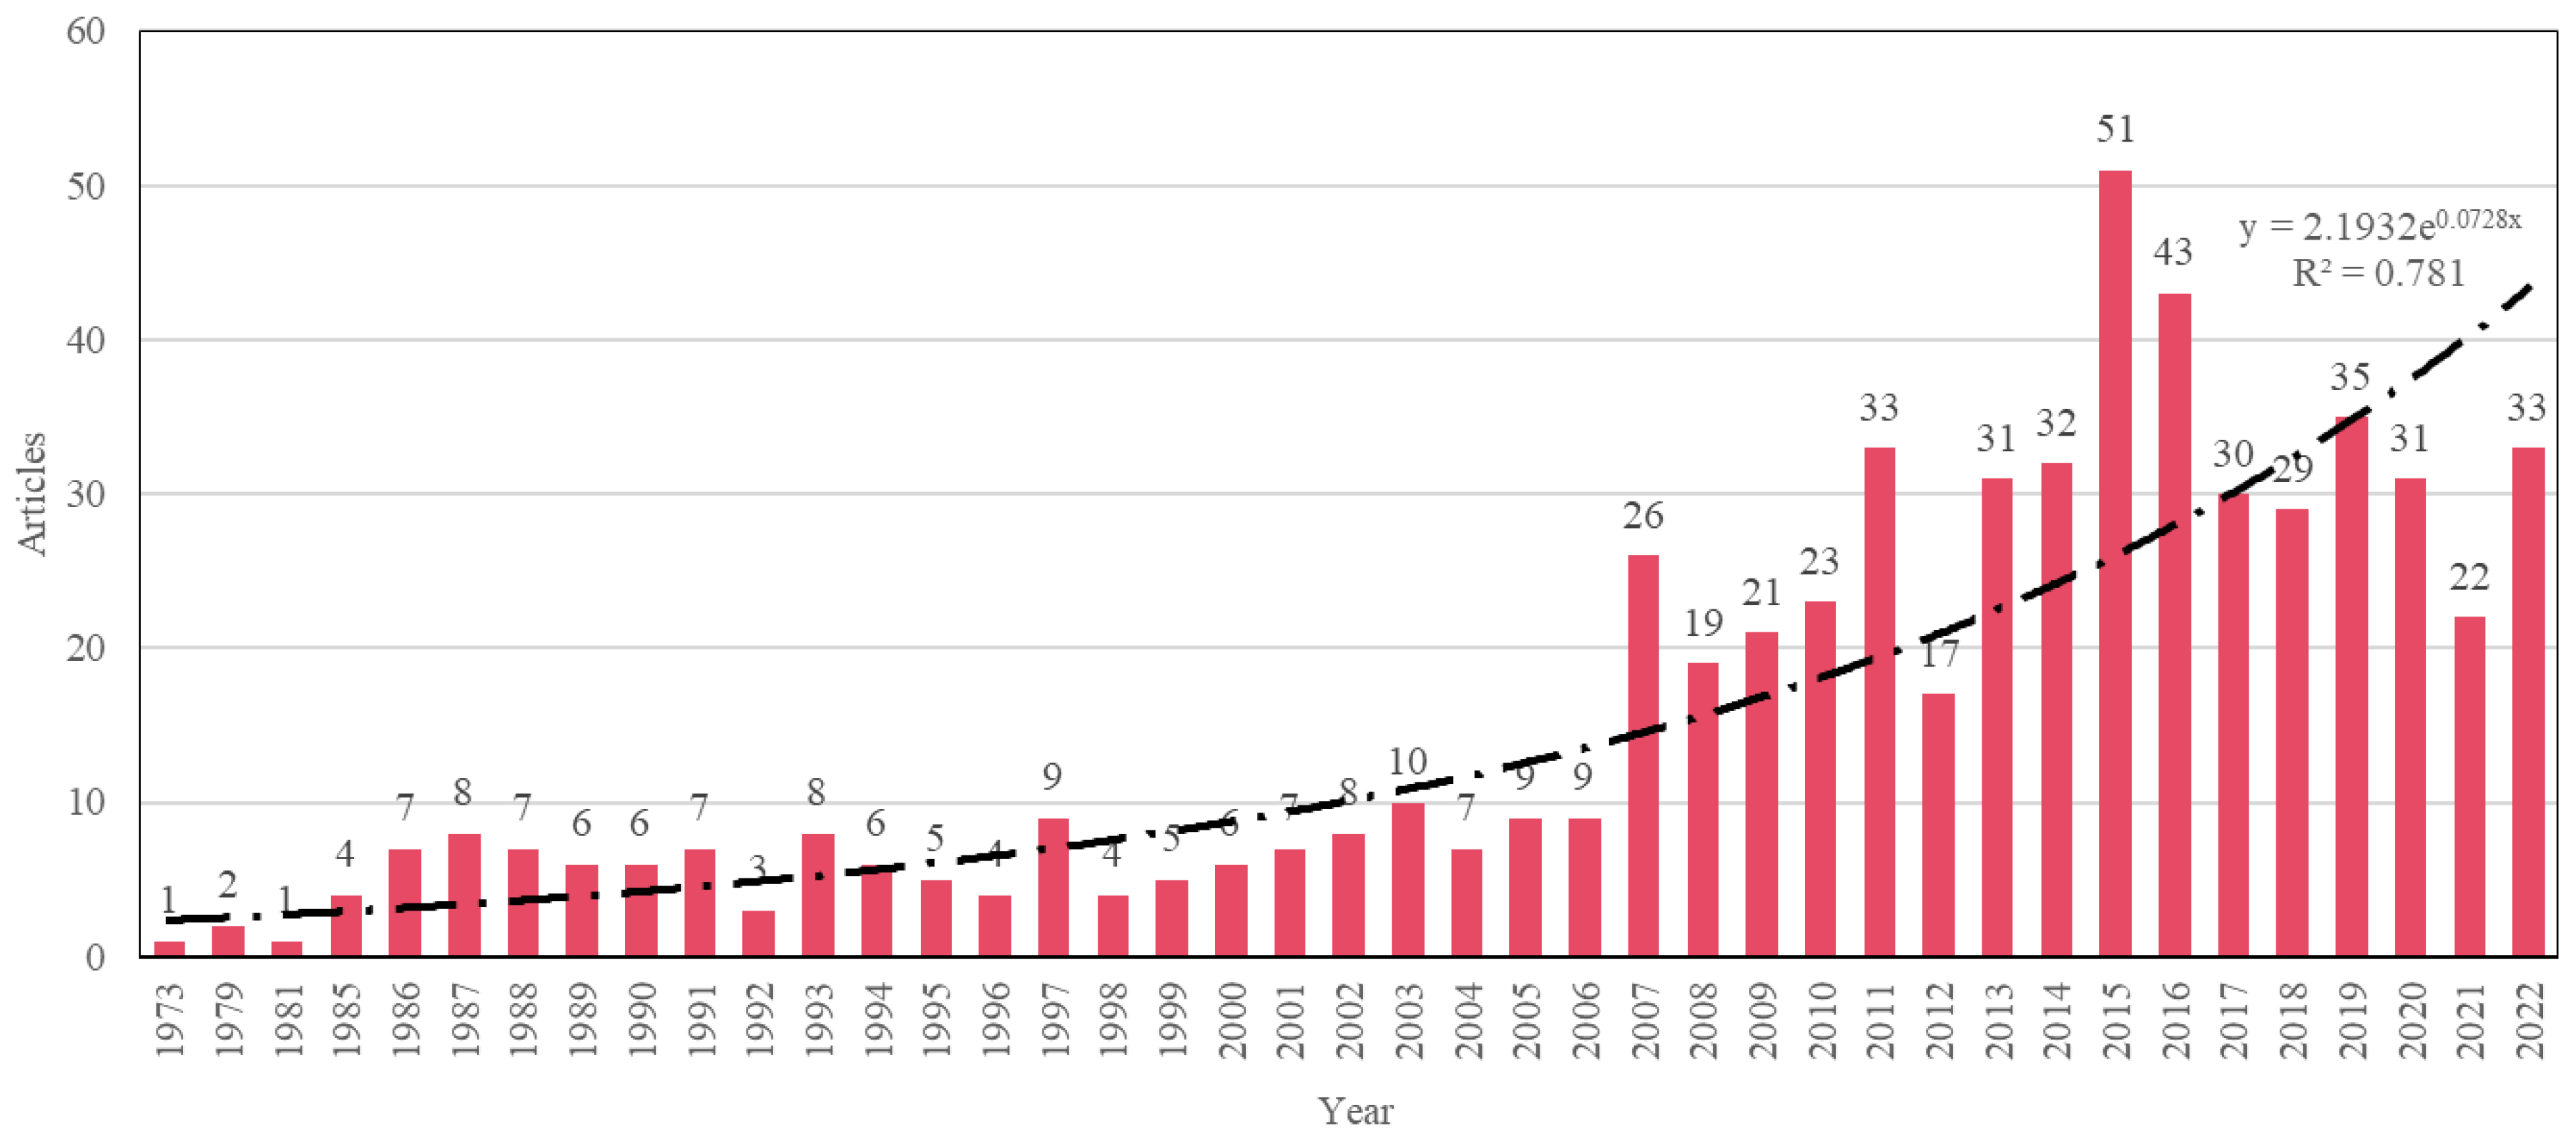
Based on our search, a total of 626 documents were published on the RFFA field between the years 1973 and 2022. The annual publication trend (Figure 2) shows that the number of publications is less than 10 until 2006; in contrast, there is a dramatic peak in 2007. The highest number of publications observed was 51 in 2015, and the annual growth rate was 9.13% between 1973 and 2022.
Probable reasons for the two peaks during the years 2007 and 2015 (Figure 2) are as follows:
- The implementation of the Australian Rainfall and Runoff (ARR) Project 5 Regional Flood Methods from 2006 to 2019 produced many publications [43].
- The joint contributions of the most productive authors in RFFA have a remarkable impact on these two peaks.
The top 10 sources (journals) in terms of number of publications and total citations are given in Table 2. The Journal of Hydrology and Water Resources Research are the two leading and dominant journals in the RFFA field with 77 (5298 citations) and 52 (3108 citations) publications, respectively. These two journals also have the oldest first issue year in addition to the Hydrological Sciences Journal. The youngest journal in the top 10 list is Water (Switzerland) with 11 publications and 49 citations. It should be noted that ‘first issue year’ refers to the year when the journal first published an article in the RFFA field.
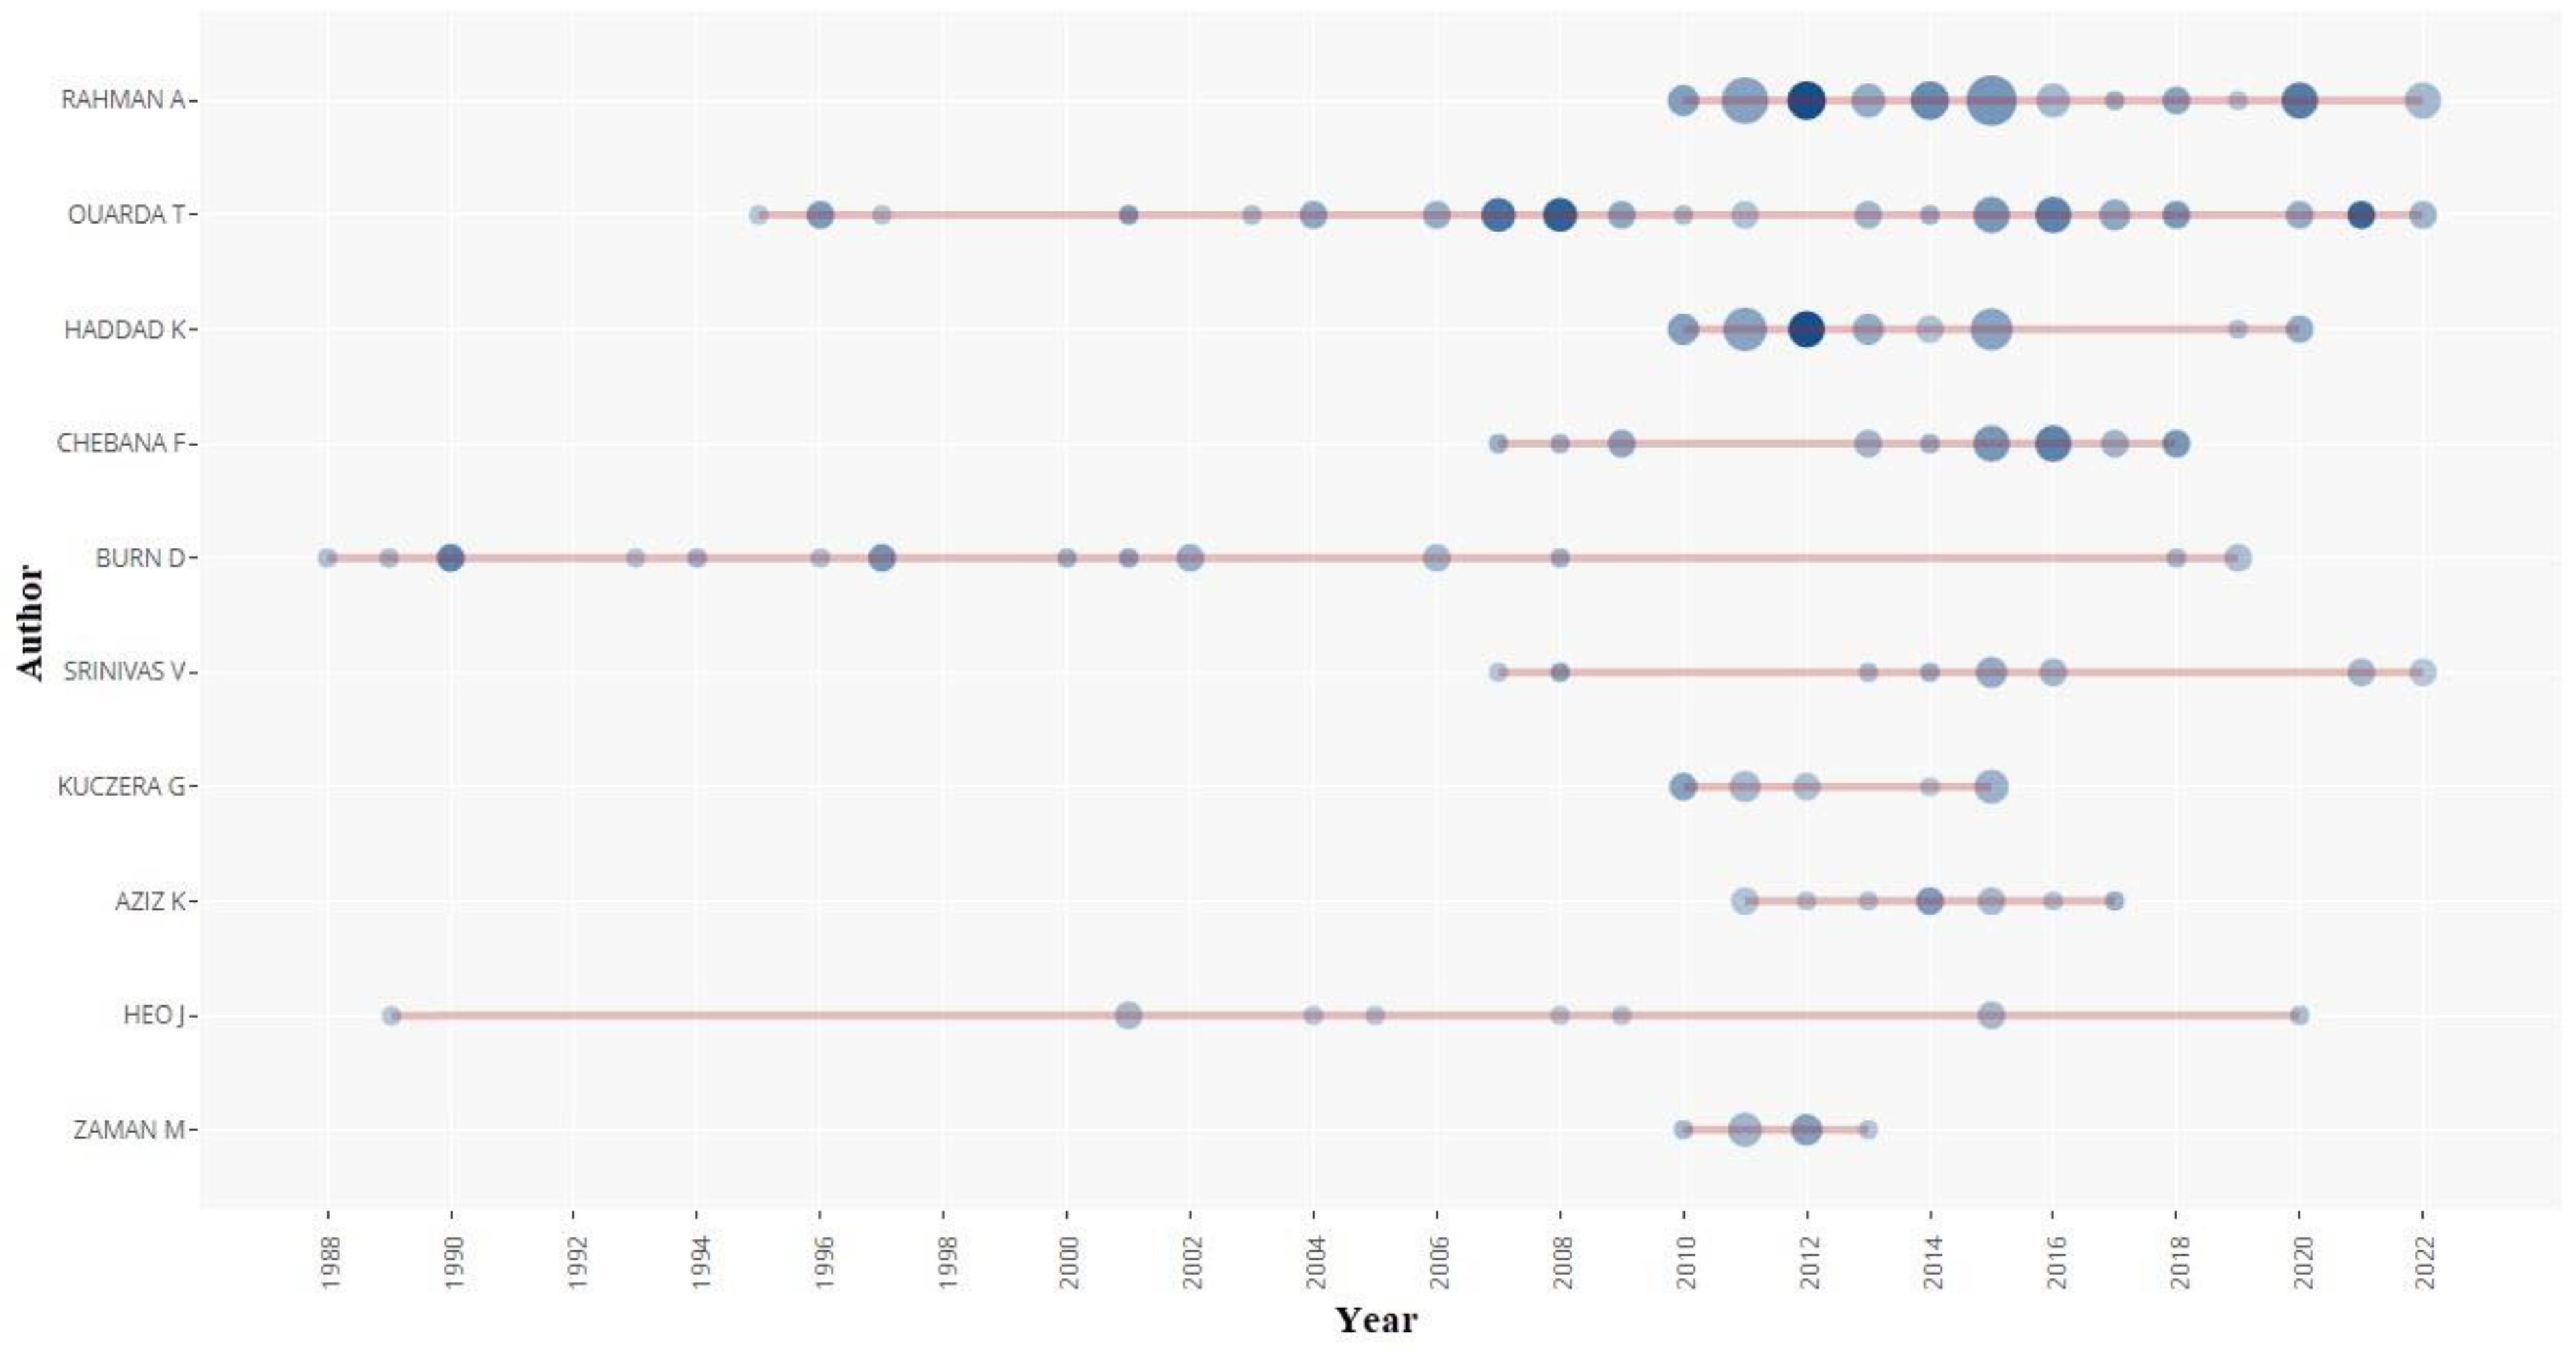
The quantity of an academic researcher’s publications and the number of citations received by a researcher can quantify their research strength and influence of their work [61,62]. Table 3 presents the top 10 contributing authors with the quantity of publications and citations. Australia and Canada are the most dominant countries in terms of the most productive authors. Figure 3 shows the authors’ productivity over time. The horizontal line shows the authors’ active years. Colour density of circles presents the total citations per year (darker colours show higher citations) whereas the size of the circles presents the number of articles. Table 4 lists the most cited articles in RFFA.
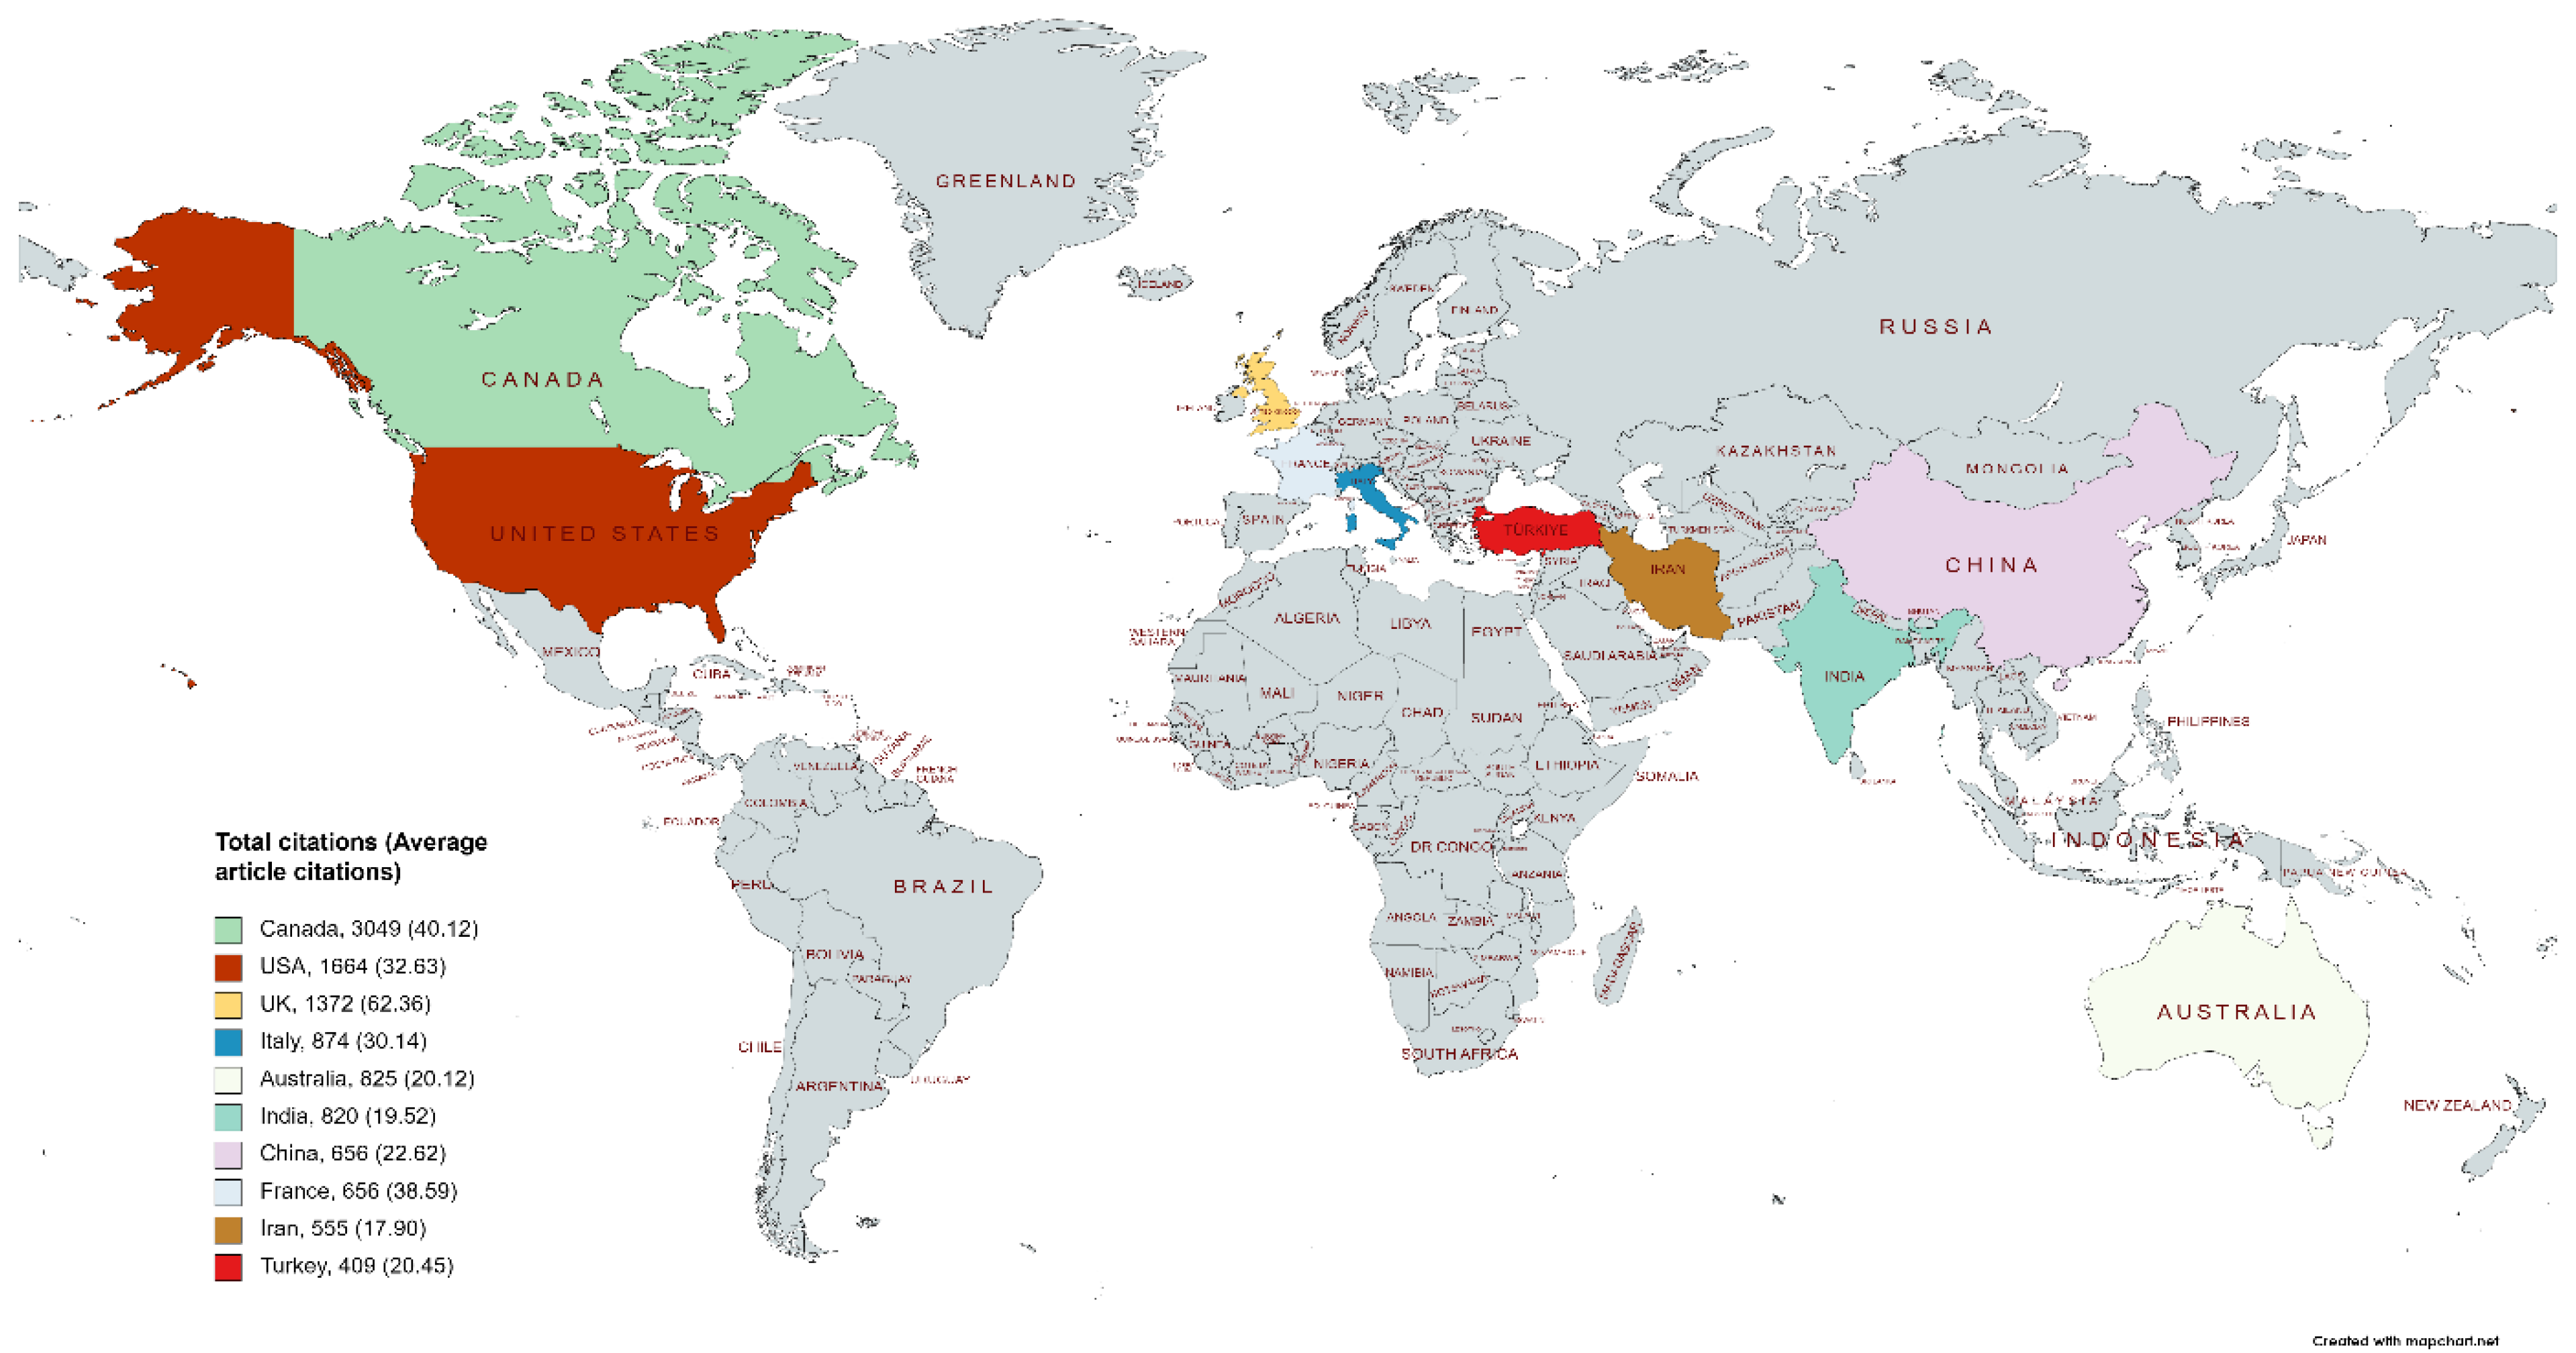
In Figure 4, the map includes the most cited countries that have contributed to RFFA research. The leading countries are Canada, USA, UK, Italy and Australia. Although Australia has the most productive authors in the top 10 list, its influence is not as effective as Canada. One of the main reasons is that the most productive authors contributed as co-authors in many publications. Therefore, this directly affects the total number of documents and citation statistics from a country perspective. It should be noted that developing countries have fewer stream gauging stations; hence, formulation of RFFA models is difficult for these countries and few papers on RFFA originated from these countries. The countries dominating RFFA research have the best stream gauging networks.
Frequency analysis of keywords is a vital research tool which indicates the essential parts of the related research field [63]. Table 5 lists the most frequently used authors’ keywords and keywords plus in the RFFA field during 1981–2022. Keywords plus goes beyond title–word indexing, and the algorithm identifies recurring words or phrases appearing in a paper’s list of cited references. Therefore, keywords plus can capture a document’s content with greater variety and depth in bibliometric analysis [64].
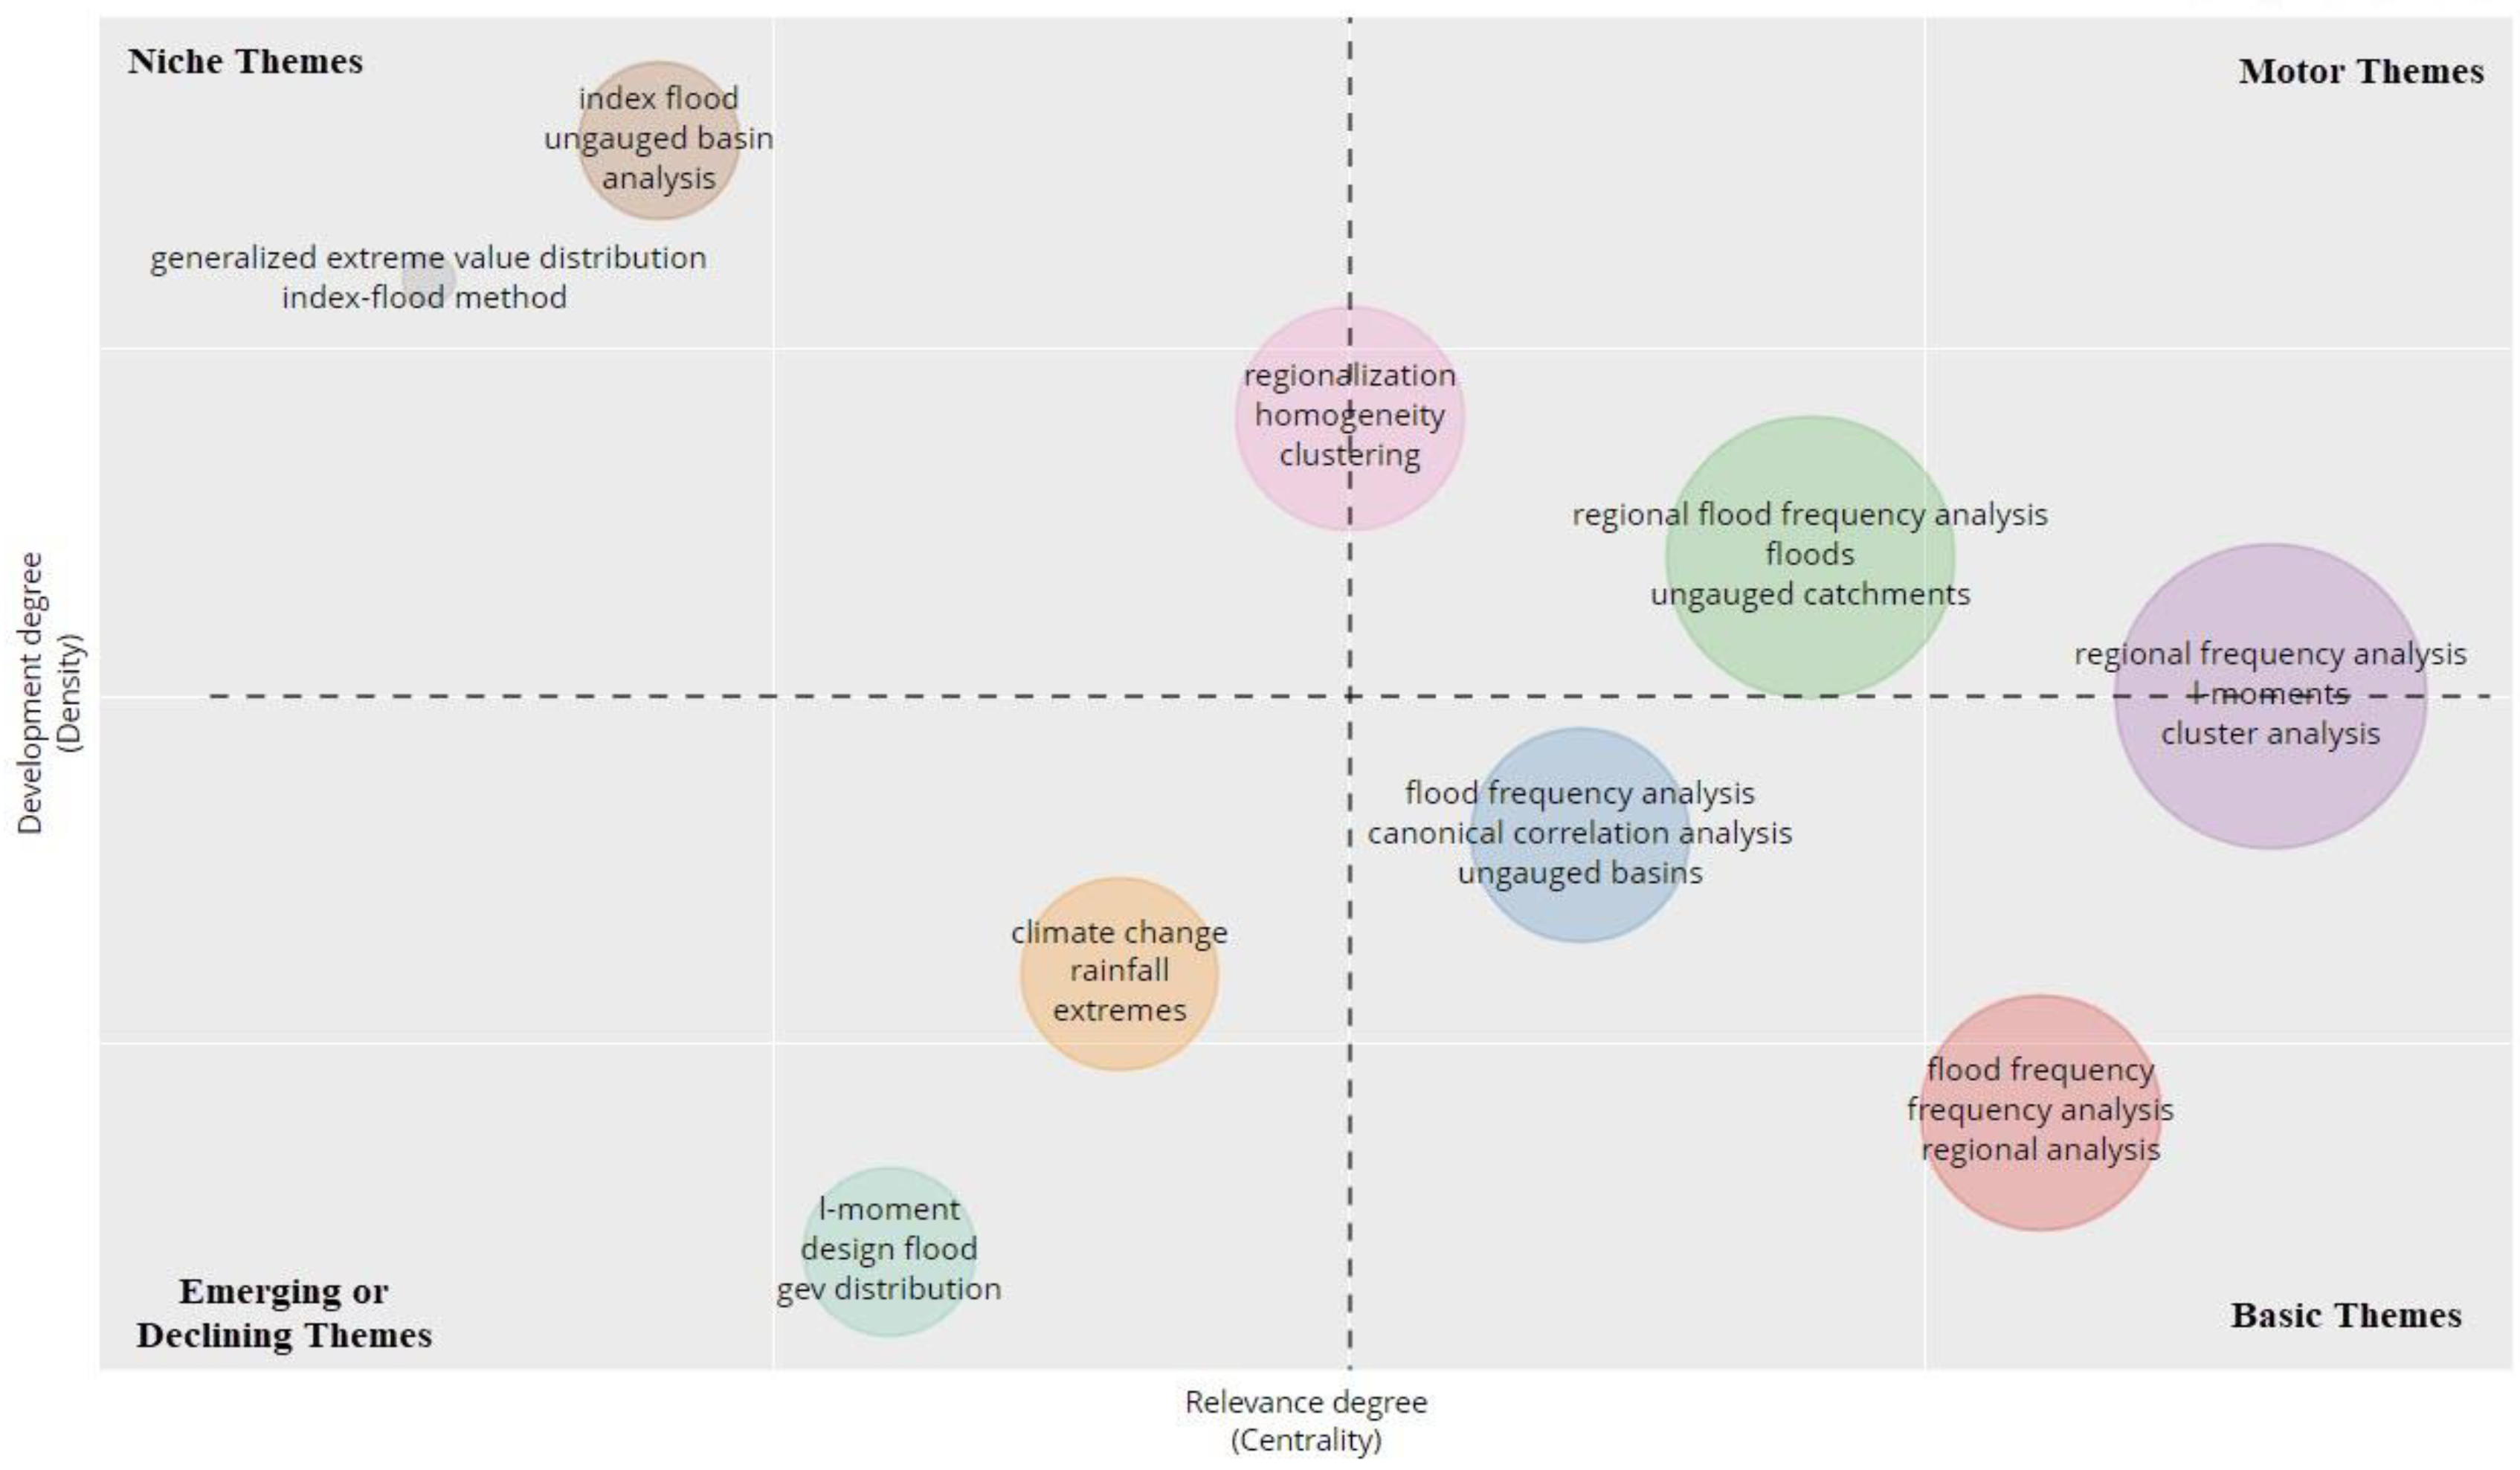
The thematic map shown in Figure 5 is a very intuitive plot and allows for the superior interpretation of research themes. The plot was divided into four parts, and each quadrant provides details about the importance of the study. Motor themes (first quadrant) are well developed and important for structuring of the research field. Motor themes show a strong relevance degree and high density. Niche themes (second quadrant), on the other hand, have high density but lower centrality. Niche themes are well developed but isolated. Therefore, they are of only marginal importance for the field. Emerging or declining themes (third quadrant) are weakly developed and marginal. Emerging or declining themes have both low density and low centrality. Basic themes (4th quadrant) are important for a research field not yet well developed. This theme has higher centrality but lower density.
In total, eight clusters were created in the thematic map based on the authors’ keywords. ‘Regional (flood) frequency analysis’ and ‘regionalization’ are placed in the motor themes with high centrality and density. These are developed and essential topics for the study. ‘Index flood’ and ‘generalized extreme value distribution’ were two marginal clusters placed in niche themes. These clusters (or themes) were considered highly developed but isolated. ‘L-moments’ and ‘climate change’ clusters placed in emerging and declining themes were weakly developed and had low centrality and low density. More research is needed in this field. ‘Flood frequency analysis’ and ‘flood frequency’ clusters were placed in the basic themes. These topics showed high centrality (highly relevant) but low density (less developed). The clusters placed in the basic or transversal theme were important for research [54].

Table 4.
The most cited documents.
| Rank | Author (Country) | No. A. | Journal | Title | TC | TCPY | Paper Main Theme |
|---|---|---|---|---|---|---|---|
| 1 | Hosking JRM, 1993 (USA) [21] | 2 | WRR | Some statistics useful in regional frequency analysis | 650 | 21.67 | Developed discordancy, heterogeneity, and goodness-of-fit measures |
| 2 | Burn DH, 1990 (Canada) [14] | 1 | WRR | Evaluation of regional flood frequency analysis with an ROI approach | 376 | 11.39 | Development of region of influence approach (ROI) in RFFA where each site forms its own region |
| 3 | Cooley D, 2007 (USA) [65] | 3 | JoASA | Bayesian spatial modelling of extreme precipitation return levels | 310 | 19.38 | Extreme precipitation returns level map production and uncertainty measures through the improvement of spatial model development considering geographical and climatological covariates. |
| 4 | Fowler HJ, 2003 (UK) [66] | 2 | IJoC | A regional frequency analysis of United Kingdom extreme rainfall from 1961 to 2000 | 271 | 13.55 | Using multi-day annual maximum rainfall, assesses the uncertainty in the fitted decadal growth curves to identify significant trends in both distribution parameters and quantile estimates. |
| 5 | Cunnane C, 1988 (Ireland) [33] | 1 | JoH | Methods and merits of regional flood frequency analysis | 268 | 7.66 | Regional homogeneity, hydrological data smoothing and the effect of inter-site dependency was discussed for RFFA |
| 6 | Burn DH, 1997 (Canada) [67] | 1 | JoH | Catchment similarity for regional flood frequency analysis using seasonality measures | 233 | 8.96 | Formation of regions based on ROI using seasonality measures |
| 7 | Ouarda TBMJ, 2001 (Canada) [8] | 4 | JoH | Regional flood frequency estimation with canonical correlation analysis | 217 | 9.86 | A theoretical basis of CCA application in RFFA to delineate homogeneous regions with a maximum number of sites. |
| 8 | Yang T, 2010 (China) [68] | 7 | JoH | Regional frequency analysis and spatio-temporal pattern characterization of rainfall extremes in the Pearl River Basin, China | 215 | 16.54 | Spatio-temporal pattern characterization of extreme rainfall regimes applying an L-moments approach through a stationarity test and a serial correlation check |
| 9 | Renard B, 2007 (France) [69] | 2 | AWR | Use of a Gaussian copula for multivariate extreme value analysis: Some case studies in hydrology | 213 | 13.31 | Application of Gaussian copula for multivariate frequency analysis in hydrology |
| 10 | Pandey GR, 1999 (USA) [70] | 2 | JoH | A comparative study of regression-based methods in regional flood frequency analysis | 198 | 8.25 | Developed a regional regression model adopting a power form model of Thomas and Benson to estimate the streamflow statistics in case of data scarcity |
Notes: No. A: Number of authors; TC: Total citations; TCPY: Total citations per year. WRR: Water Resources Research; JoH: Journal of Hydrology; AWR: Advances in Water Resources; IJoC: International Journal of Climatology; JoASA: Journal of the American Statistical Association.
Table 5.
Frequently used authors’ keywords and keywords plus.
| Rank | Keywords Plus | T.F. | 1981–1992 | 1993–2002 | 2003–2012 | 2013–2022 |
| 1 | Floods | 315 | 17 | 35 | 94 | 169 |
| 2 | Flood control | 242 | 2 | 8 | 84 | 148 |
| 3 | Flood frequency | 232 | 3 | 29 | 82 | 118 |
| 4 | Frequency analysis | 172 | 1 | 9 | 63 | 99 |
| 5 | Regional flood frequency analysis | 153 | 4 | 13 | 49 | 87 |
| 6 | Catchments | 143 | 0 | 7 | 54 | 82 |
| 7 | Runoff | 106 | 1 | 4 | 35 | 66 |
| 8 | Rain | 105 | 1 | 6 | 46 | 52 |
| 9 | Regional frequency analysis | 103 | 0 | 5 | 33 | 65 |
| 10 | Regression analysis | 99 | 1 | 7 | 43 | 48 |
| Rank | Authors’ keywords | T.F. | 1987–1992 | 1993–2002 | 2003–2012 | 2013–2022 |
| 1 | Regional frequency analysis | 107 | 1 | 0 | 27 | 79 |
| 2 | L-moments | 97 | 1 | 4 | 34 | 58 |
| 3 | Regional flood frequency analysis | 89 | 0 | 8 | 29 | 52 |
| 4 | Regionalization | 46 | 0 | 2 | 9 | 35 |
| 5 | Floods | 43 | 0 | 3 | 15 | 25 |
| 6 | Flood frequency analysis | 29 | 0 | 2 | 8 | 19 |
| 7 | Flood frequency | 24 | 1 | 2 | 14 | 7 |
| 8 | Frequency analysis | 22 | 0 | 2 | 12 | 8 |
| 9 | Ungauged catchments | 22 | 0 | 0 | 4 | 18 |
| 10 | Homogeneity | 19 | 0 | 3 | 5 | 11 |
Note: T.F. is the sum of frequencies of the keywords.
3. Homogeneity Testing in RFFA
Dalrymple [71] proposed a homogeneity test based on the ratio of 10-year flood to mean annual flood. This test was widely used in the context of the index flood method. Wiltshire [20] mentioned that this test is not very powerful as in most of the applications the proposed region appeared to be homogeneous when the test was applied. Fill and Stedinger [17] stated that the Dalrymple [71] test should not be applied in practice as L-moments-based tests [21] are more powerful. Wiltshire [20] proposed a CV-based test, which is based on the coefficient of variation (CV) in annual maximum (AM) flood series of the gauged sites in a proposed region. The power of this test increases with the number of sites and streamflow record length of sites in a region, which is indeed true for any homogeneity test. Fill and Stedinger [17] stated that this CV-based test is not preferable to an L-moments-based test. Lu and Stedinger [72] proposed a homogeneity test, which depends on the variability of at-site normalized flood quantiles estimated by fitting a generalized extreme value (GEV) distribution to AM flood data of each of the sites in a proposed region.
The L-moments-based test proposed by Hosking and Wallis [21] has become a standard in RFFA as noted by Ouarda [3]. However, this test does not work well for highly skewed data as reported by Viglione et al. [23]. The application of Hosking and Wallis [21] test could not deliver a homogeneous region for Australia [73,74]. Chebana and Ouarda [22] extended the Hosking and Wallis [21] test to a multivariate case which can consider the correlations among the variables. To apply this test to the bivariate case, Chebana and Ouarda [22] considered peaks and volumes of flood events with the Gumbel logistic model and Gumbel marginal distributions. It was noted that for regions with a smaller number of sites and short record length, the multivariate test does not perform well, which is the case for any homogeneity test. Although the Hosking and Wallis test [21] has good power, it depends on the subjective choice of a distribution for the data and a poorly justified rejection threshold [18]. To overcome some of these limitations, Masselot et al. [18] integrated a nonparametric method with the L-moments-based homogeneity test. Further research is needed in this area as the proposed homogeneous regions lack of physical significance; there is also a paucity of guidance on how these tests should be conducted under nonstationary conditions.
4. Development of Regional Estimation Equations
Dalrymple [71] proposed the index flood method in 1960. In this method, AM flood data at each site in the region are normalized by dividing the at-site mean (index flood). These normalized data are then used to develop a regional growth factor. A regional prediction equation is developed for the index flood as a function of climatic and physical characteristics. The index flood method was once favoured by the US Geological Survey, but it was discarded since it was found that the CVs of AM flood data vary with catchment area and other catchment characteristics [75]. However, since the introduction of the L-moments-based index flood method by Hosking and Wallis [21], the index flood method has become popular in RFFA. As noted by Kjeldsen and Jones [76], the index flood method is widely used in RFFA in the UK. In Australia, the index flood method is not adopted as homogeneous regions cannot be identified in the country [43].
The United States Geological Survey (USGS) proposed the quantile regression technique (QRT) where a flood peak of T-year return period is estimated from selected catchment characteristics [37,39,77,78]. Ordinary least squares or generalized least squares regression techniques are generally used to estimate the coefficients of the regression equations [35,38,40,79,80]. The US Interagency Working Group on Flood Frequency Estimation at Ungauged Sites found that regression-based methods in RFFA are the most consistent [81]. The parameter regression technique (PRT) develops regression equations of the parameters of a probability distribution [40,42]. In a comparative study in Australia, Haddad and Rahman [40] found that QRT and PRT provide very similar performance in flood quantile estimation; however, PRT is more consistent. Based on their findings, the Australian Rainfall and Runoff (national guideline) has recommended PRT for general use in Australia except in the arid regions [43,82].
There are other approaches to develop estimation equations in RFFA. For example, Chebana et al. [83] applied a generalized additive model to Quebec province in Canada and noted that this allows incorporating non-linear effects of explanatory variables in RFFA. Similarly, Rahman et al. [84] and Noor et al. [85] applied a generalized additive model to an Australian data set and reported positive outcomes. Dawson et al. [44] applied artificial neural networks (ANN) to 850 catchments in the UK to develop an RFFA model and noted that ANN provides improved flood estimates when compared to multiple regression models. Shu and Ouarda [45] applied adaptive neuro-fuzzy inference systems (ANFIS) in RFFA in Quebec province, Canada based on data from 151 catchments for design flood estimation at ungauged sites. They noted that ANFIS has much better generalization capability than the non-linear regression approach. Aziz et al. [86] applied ANN to 452 Australian catchments and found that an ANN-based RFFA model outperforms the QRT. Kumar et al. [87] applied ANN and a fuzzy inference system to 17 Indian catchments and noted that ANN outperforms the L-moments-based index flood approach. Further research is needed in these types of artificial intelligence (AI)-based RFFA techniques as there is a lack of user-friendly tools to apply AI-based techniques in practice.
5. Impacts of Climate Change on RFFA
Leclerc and Ouarda [88] presented a nonstationary RFFA using data from southeastern Canada and the northeastern United States. They noted that not considering trends can lead to serious under- or overestimation of flood quantile estimates. Kalai et al. [81] compared nonstationary RFFA methods for real-world and synthetically generated data. Han et al. [89] presented a nonstationary RFFA technique using 105 Australian catchments which can capture the differing behaviour of flood quantiles in frequent and rare ranges under a warming climate. Guo et al. [90] developed a nonstationary Bayesian RFFA method for Dongting Lake Basin in China. They noted that the nonstationary model reduces the uncertainty in flood quantile estimates. Further research is needed in this area as there is a dearth of guidance on how to consider the effects of non-stationarity in regional flood quantile estimation: for example, Australian Rainfall and Runoff does not include any recommendation on this.
6. Discussion
It is expensive to maintain a dense stream of gauging stations; hence, it is important to design a stream gauging network that can serve the purpose of a country. The streamflow data collected at the gauged sites can be used to develop RFFA models which allow estimation of design flows at any location in the country. In this regard, the length and quality of the collected streamflow data are important. A shorter record length introduces a higher sampling error in at-site flood frequency analysis, which eventually affects the accuracy of the RFFA models. The quality of streamflow data is important. In many instances, it has been found that there are too many missing records in the data, and other factors, such as rating curve errors, can affect the collected streamflow data. The impacts of data error on RFFA models are not well examined and this is an area that needs further research. Most RFFA research is carried out in developed countries where the number of gauged stations is too high to develop any RFFA techniques. In many developing countries, the number of stream gauging stations is too low to develop any meaningful homogeneous regions and RFFA techniques. Hence, RFFA research is limited in numbers in most developing countries. Efforts should be made to establish reference stream gauging stations in developing countries, which in future can be used to develop RFFA techniques. Most RFFA techniques are based on annual maximum models; however, peaks over threshold (POT) models may be preferable under some circumstances. Hence, future research should focus on the development of POT-based RFFA techniques. These will be particularly useful to estimate more frequent floods in ungauged catchments where there is more application for ecological and environmental studies. Homogeneity testing is a vital step in RFFA. All the existing homogeneity tests are based on the stationarity assumption. These tests do not consider the impacts of building dams on flood frequency analysis; this is an important area and needs further research [91]. The integration of geographic information systems (GIS), remote sensing, geostatistics and dynamic Bayesian networks [92] with RFFA may help to enhance RFFA techniques. This also needs further research.
7. Conclusions
RFFA is an important area of research in hydrology, as there are numerous ungauged catchments where flood quantile estimation is needed. Several countries have recommended RFFA techniques for nationwide application, such as the UK (Robson and Reed [93]) and Australia (Rahman et al. [43]). Bloschl et al. [94] summarized international research efforts in ungauged basin prediction. In the US, the Interagency Committee on Water Data presented guidance on RFFA [95]. Durocher et al. [80] presented a study in Canada using 771 catchments to develop a nationwide RFFA technique.
This bibliometric analysis shows that there has been an increase in the intensity of RFFA research since 2007. The leading countries in RFFA research are Canada, USA, UK, Italy and Australia. The top five journals publishing RFFA research include the Journal of Hydrology, Water Resources Research, the Journal of Hydrologic Engineering, Water Resources Management and Hydrological Processes. In terms of citations, the top performing researchers in RFFA are Ouarda T, Burn D, Rahman A, Haddad K and Chebana F. Future research should be directed towards nonlinear AI-based RFFA models that can be applied in practice, the incorporation of climate change impacts and uncertainty analysis. More efforts should be directed to the collection of flow data covering a greater number of stations and longer length at gauged sites, as this is a prerequisite to the development of any accurate RFFA technique. The incorporation of the impacts of dams, GIS, remote sensing and geostatistics with RFFA models also needs further research.
Author Contributions
Conceptualization, A.A., G.Y. and A.R.; methodology, A.A., G.Y., A.R. and K.H.; formal analysis, A.A. and G.Y.; writing—original draft preparation, A.A., G.Y. and A.R.; writing—review and editing, A.R. and K.H.; supervision, A.R. and K.H. All authors have read and agreed to the published version of the manuscript.
Funding
This research received no external funding.
Institutional Review Board Statement
Not applicable.
Informed Consent Statement
Not applicable.
Data Availability Statement
The data used in this research are available publicly via scientific database such as Scopus, Web of Science and Google Scholar.
Conflicts of Interest
The authors declare no conflict of interest.
References
- Fitzgerald, G.; Du, W.; Jamal, A.; Clark, M.; Hou, X.-Y. Flood fatalities in contemporary Australia (1997–2008). Emerg. Med. Australas. 2010, 22, 180–186. [Google Scholar] [CrossRef] [PubMed]
- Li, Z.; Gao, S.; Chen, M.; Gourley, J.J.; Hong, Y. Spatiotemporal Characteristics of US Floods: Current Status and Forecast Under a Future Warmer Climate. Earth’s Future 2022, 10, e2022EF002700. [Google Scholar] [CrossRef]
- Ouarda, T.B.M.J. Handbook of Applied Hydrology, 2nd ed.; Chapter 77, Regional Flood Frequency Modeling; McGraw-Hill Education: New York, NY, USA, 2017. [Google Scholar]
- Haddad, K.; Rahman, A. Regional flood frequency analysis: Evaluation of regions in cluster space using support vector regression. Nat. Hazards 2020, 102, 489–517. [Google Scholar] [CrossRef]
- Zalnezhad, A.; Rahman, A.; Nasiri, N.; Haddad, K.; Rahman, M.M.; Vafakhah, M.; Samali, B.; Ahamed, F. Artificial Intelligence-Based Regional Flood Frequency Analysis Methods: A Scoping Review. Water 2022, 14, 2677. [Google Scholar] [CrossRef]
- Odry, J.; Arnaud, P. Comparison of Flood Frequency Analysis Methods for Ungauged Catchments in France. Geosciences 2017, 7, 88. [Google Scholar] [CrossRef]
- Mostofi Zadeh, S.; Burn, D.H. A Super Region Approach to Improve Pooled Flood Frequency Analysis. Can. Water Resour. J. Rev. Can. Des Ressour. Hydr. 2019, 44, 146–159. [Google Scholar] [CrossRef]
- Ouarda, T.B.; Girard, C.; Cavadias, G.S.; Bobée, B. Regional flood frequency estimation with canonical correlation analysis. J. Hydrol. 2001, 254, 157–173. [Google Scholar] [CrossRef]
- Han, X.; Ouarda TB, M.J.; Rahman, A.; Haddad, K.; Mehrotra, R.; Sharma, A. A Network Approach for Delineating Homogeneous Regions in Regional Flood Frequency Analysis. Water Resour. Res. 2020, 56, e2019WR025910. [Google Scholar] [CrossRef]
- Acreman, M.C.; Sinclair, C.D. Classification of drainage basins according to their physical characteristics; an application for flood frequency analysis in Scotland. J. Hydrol. 1986, 84, 365–380. [Google Scholar] [CrossRef]
- Pilgrim, D. Australian Rainfall and Runoff: A Guide to Flood Estimation; Engineers: Canberra, Australia, 2001; Volume 1. [Google Scholar]
- Wiltshire, S. Identification of homogeneous regions for flood frequency analysis. J. Hydrol. 1986, 84, 287–302. [Google Scholar] [CrossRef]
- Burn, D.H. Delineation of groups for regional flood frequency analysis. J. Hydrol. 1988, 104, 345–361. [Google Scholar] [CrossRef]
- Burn, D.H. Evaluation of regional flood frequency analysis with a region of influence approach. Water Resour. Res. 1990, 26, 2257–2265. [Google Scholar] [CrossRef]
- Haddad, K.; Rahman, A.; Stedinger, J.R. Regional flood frequency analysis using Bayesian generalized least squares: A comparison between quantile and parameter regression techniques. Hydrol. Process. 2011, 26, 1008–1021. [Google Scholar] [CrossRef]
- Castellarin, A.; Burn, D.; Brath, A. Homogeneity testing: How homogeneous do heterogeneous cross-correlated regions seem? J. Hydrol. 2008, 360, 67–76. [Google Scholar] [CrossRef]
- Fill, H.D.; Stedinger, J.R. Homogeneity tests based upon Gumbel distribution and a critical appraisal of Dalrymple’s test. J. Hydrol. 1995, 166, 81–105. [Google Scholar] [CrossRef]
- Masselot, P.; Chebana, F.; Ouarda, T.B. Fast and direct nonparametric procedures in the L-moment homogeneity test. Stoch. Environ. Res. Risk Assess. 2017, 31, 509–522. [Google Scholar] [CrossRef]
- Lettenmaier, D.P.; Wallis, J.R.; Wood, E.F. Effect of regional heterogeneity on flood frequency estimation. Water Resour. Res. 1987, 23, 313–323. [Google Scholar] [CrossRef]
- Wiltshire, S.E. Regional flood frequency analysis I: Homogeneity statistics. Hydrol. Sci. J. 1986, 31, 321–333. [Google Scholar] [CrossRef]
- Hosking JR, M.; Wallis, J.R. Some statistics useful in regional frequency analysis. Water Resour. Res. 1993, 29, 271–281. [Google Scholar] [CrossRef]
- Chebana, F.; Ouarda, T.B. Multivariate L-moment homogeneity test. Water Resour. Res. 2007, 43. [Google Scholar] [CrossRef]
- Viglione, A.; Laio, F.; Claps, P. A comparison of homogeneity tests for regional frequency analysis. Water Resour. Res. 2007, 43, W03428. [Google Scholar] [CrossRef]
- Prieto, C.; Le Vine, N.; Kavetski, D.; García, E.; Medina, R. Flow prediction in ungauged catchments using probabilistic random forests regionalization and new statistical adequacy tests. Water Resour. Res. 2019, 55, 4364–4392. [Google Scholar] [CrossRef]
- Rahman, A.S.; Rahman, A. Application of Principal Component Analysis and Cluster Analysis in Regional Flood Frequency Analysis: A Case Study in New South Wales, Australia. Water 2020, 12, 781. [Google Scholar] [CrossRef]
- Abdolhay, A.; Saghafian, B.; Soom, M.A.M.; Ghazali, A.H.B. Identification of homogenous regions in Gorganrood basin (Iran) for the purpose of regionalization. Nat. Hazards 2012, 61, 1427–1442. [Google Scholar] [CrossRef]
- Basu, B.; Srinivas, V.V. Regional Flood Frequency Analysis Using Entropy-Based Clustering Approach. J. Hydrol. Eng. 2016, 21, 4016020. [Google Scholar] [CrossRef]
- Ribeiro-Corréa, J.; Cavadias, G.S.; Clément, B.; Rousselle, J. Identification of hydrological neighborhoods using canonical correlation analysis. J. Hydrol. 1995, 173, 71–89. [Google Scholar] [CrossRef]
- Rahman, A.; Bates, B.C.; Mein, R.G.; Weinmann, P.E. Regional flood frequency analysis for ungauged basins in south-eastern Australia. Aust. J. Water Resour 1999, 3, 199–207. [Google Scholar]
- Ouali, D.; Chebana, F.; Ouarda, T.B.M.J. Non-linear canonical correlation analysis in regional frequency analysis. Stoch. Environ. Res. Risk Assess. 2015, 30, 449–462. [Google Scholar] [CrossRef]
- Mulvany, T.J. On the use of self-registering rain and flood gauges in making observations of the relation of rainfall and flood discharge in a given catchment. Trans ICE Ire 1851, 4, 18–31. [Google Scholar]
- Rahman, A.; Haddad, K.; Zaman, M.; Kuczera, G.; Weinmann, P.E. Design flood estimation in ungauged catchments: A comparison between the Probabilistic Rational Method and Quantile Regression Technique for NSW. Aust. J. Water Resour. 2011, 14, 127–137. [Google Scholar] [CrossRef]
- Cunnane, C. Methods and merits of regional flood frequency analysis. J. Hydrol. 1988, 100, 269–290. [Google Scholar] [CrossRef]
- Potter, K.W.; Lettenmaier, D.P. A comparison of regional flood frequency estimation methods using a resampling method. Water Resour. Res. 1990, 26, 415–424. [Google Scholar] [CrossRef]
- Bobée, B.; Mathier, L.; Perron, H.; Trudel, P.; Rasmussen, P.F.; Cavadias, G.; Bernier, J.; Nguyen VT, V.; Pandey, G.; Ashkar, F.; et al. Presentation and review of some methods for regional flood frequency analysis. J. Hydrol. 1996, 186, 63–84. [Google Scholar]
- Kjeldsen, T.R.; Smithers, J.C.; Schulze, R.E. Regional flood frequency analysis in the KwaZulu-Natal province, South Africa, using the index-flood method. J. Hydrol. 2002, 255, 194–211. [Google Scholar] [CrossRef]
- Benson, M.A. Evolution of methods for evaluating the occurrence of floods. US Geol. Surv. Water Supply Pap. 1962, 1580, 30. [Google Scholar]
- Stedinger, J.R.; Tasker, G.D. Regional Hydrologic Analysis: 1. Ordinary, Weighted, and Generalized Least Squares Compared. Water Resour. Res. 1985, 21, 1421–1432. [Google Scholar] [CrossRef]
- Rahman, A. A quantile regression technique to estimate design floods for ungauged catchments in south-east Australia. Australas. J. Water Resour. 2005, 9, 81–89. [Google Scholar] [CrossRef]
- Haddad, K.; Rahman, A. Regional flood frequency analysis in eastern Australia: Bayesian GLS regression-based methods within fixed region and ROI framework—Quantile Regression vs. Parameter Regression Technique. J. Hydrol. 2012, 430–431, 142–161. [Google Scholar] [CrossRef]
- Formetta, G.; Over, T.; Stewart, E. Assessment of peak flow scaling and its effect on flood quantile estimation in the United Kingdom. Water Resour. Res. 2021, 57, e2020WR028076. [Google Scholar] [CrossRef]
- Ahn, K.H.; Palmer, R. Regional flood frequency analysis using spatial proximity and basin characteristics: Quantile regression vs. parameter regression technique. J. Hydrol. 2016, 540, 515–526. [Google Scholar] [CrossRef]
- Rahman, A.; Haddad, K.; Kuczera, G.; Weinmann, E. Regional Flood Methods. In Australian Rainfall and Runoff, Chapter 3, Book 3; Ball, J., Babister, M., Nathan, R., Weeks, W., Weinmann, E., Retallick, M., Testoni, I., Eds.; Geoscience, Commonwealth of Australia: Canberra, Australia, 2019. [Google Scholar]
- Dawson, C.; Abrahart, R.; Shamseldin, A.; Wilby, R. Flood estimation at ungauged sites using artificial neural networks. J. Hydrol. 2006, 319, 391–409. [Google Scholar] [CrossRef]
- Shu, C.; Ouarda, T. Regional flood frequency analysis at ungauged sites using the adaptive neuro-fuzzy inference system. J. Hydrol. 2008, 349, 31–43. [Google Scholar] [CrossRef]
- Aziz, K.; Haque, M.M.; Rahman, A.; Shamseldin, A.Y.; Shoaib, M. Flood estimation in ungauged catchments: Application of artificial intelligence based methods for Eastern Australia. Stoch. Environ. Res. Risk Assess. 2016, 31, 1499–1514. [Google Scholar] [CrossRef]
- Zalnezhad, A.; Rahman, A.; Vafakhah, M.; Samali, B.; Ahamed, F. Regional Flood Frequency Analysis Using the FCM-ANFIS Algorithm: A Case Study in South-Eastern Australia. Water 2022, 14, 1608. [Google Scholar] [CrossRef]
- Chokmani, K.; Ouarda, T.B.M.J. Physiographical space-based kriging for regional flood frequency estimation at ungauged sites. Water Resour. Res. 2004, 40, W12514. [Google Scholar] [CrossRef]
- Merz, R.; Blöschl, G. Flood frequency regionalisation—Spatial proximity vs. catchment attributes. J. Hydrol. 2005, 302, 283–306. [Google Scholar] [CrossRef]
- Ali, S.; Rahman, A. Development of a kriging-based regional flood frequency analysis technique for South-East Australia. Nat. Hazards 2022, 114, 2739–2765. [Google Scholar] [CrossRef]
- Zupic, I.; Čater, T. Bibliometric methods in management and organization. Organ. Res. Methods 2015, 18, 429–472. [Google Scholar] [CrossRef]
- Díez-Herrero, A.; Garrote, J. Flood Risk Analysis and Assessment, Applications and Uncertainties: A Bibliometric Review. Water 2020, 12, 2050. [Google Scholar] [CrossRef]
- Fahimnia, B.; Sarkis, J.; Davarzani, H. Green supply chain management: A review and bibliometric analysis. Int. J. Prod. Econ. 2015, 162, 101–114. [Google Scholar] [CrossRef]
- Yildirim, G.; Alim, M.A.; Rahman, A. Review of Rainwater Harvesting Research by a Bibliometric Analysis. Water 2022, 14, 3200. [Google Scholar] [CrossRef]
- Gorraiz, J.; Schloegl, C. A bibliometric analysis of pharmacology and pharmacy journals: Scopus versus Web of Science. J. Inf. Sci. 2008, 34, 715–725. [Google Scholar] [CrossRef]
- Durán-Sánchez, A.; Álvarez-García, J.; del Río-Rama, M.D.L.C. Sustainable water resources management: A bibliometric overview. Water 2018, 10, 1191. [Google Scholar] [CrossRef]
- Rodríguez-Soler, R.; Uribe-Toril, J.; Valenciano, J.D.P. Worldwide trends in the scientific production on rural depopulation, a bibliometric analysis using bibliometrix R-tool. Land Use Policy 2020, 97, 104787. [Google Scholar] [CrossRef]
- Moher, D.; Liberati, A.; Tetzlaff, J.; Altman, D.G.; PRISMA Group. Preferred Reporting Items for Systematic Reviews and Meta-Analyses: The PRISMA Statement. Ann. Intern. Med. 2009, 151, 264–269. [Google Scholar] [CrossRef] [PubMed]
- Aria, M.; Cuccurullo, C. bibliometrix: An R-tool for comprehensive science mapping analysis. J. Informetr. 2017, 11, 959–975. [Google Scholar] [CrossRef]
- Van Eck, N.J.; Waltman, L. Software survey: VOSviewer, a computer program for bibliometric mapping. Scientometrics 2010, 84, 523–538. [Google Scholar] [CrossRef]
- Wang, Z.; Zhao, Y.; Wang, B. A bibliometric analysis of climate change adaptation based on massive research literature data. J. Clean. Prod. 2018, 199, 1072–1082. [Google Scholar] [CrossRef]
- Yildirim, G.; Rahman, A.; Singh, V.P. A Bibliometric Analysis of Drought Indices, Risk, and Forecast as Components of Drought Early Warning Systems. Water 2022, 14, 253. [Google Scholar] [CrossRef]
- Su, H.-N.; Lee, P.-C. Mapping knowledge structure by keyword co-occurrence: A first look at journal papers in Technology Foresight. Scientometrics 2010, 85, 65–79. [Google Scholar] [CrossRef]
- Garfield, E. KeyWords Plus-ISI’s breakthrough retrieval method. 1. Expanding your searching power on current-contents on diskette. Curr. Contents 1990, 32, 5–9. [Google Scholar]
- Cooley, D.; Nychka, D.; Naveau, P. Bayesian Spatial Modeling of Extreme Precipitation Return Levels. J. Am. Stat. Assoc. 2007, 102, 824–840. [Google Scholar] [CrossRef]
- Fowler, H.J.; Kilsby, C.G. A regional frequency analysis of United Kingdom extreme rainfall from 1961 to 2000. Int. J. Climatol. J. R. Meteorol. Soc. 2003, 23, 1313–1334. [Google Scholar] [CrossRef]
- Burn, D.H. Catchment similarity for regional flood frequency analysis using seasonality measures. J. Hydrol. 1997, 202, 212–230. [Google Scholar] [CrossRef]
- Yang, T.; Shao, Q.; Hao, Z.-C.; Chen, X.; Zhang, Z.; Xu, C.-Y.; Sun, L. Regional frequency analysis and spatio-temporal pattern characterization of rainfall extremes in the Pearl River Basin, China. J. Hydrol. 2010, 380, 386–405. [Google Scholar] [CrossRef]
- Renard, B.; Lang, M. Use of a Gaussian copula for multivariate extreme value analysis: Some case studies in hydrology. Adv. Water Resour. 2007, 30, 897–912. [Google Scholar] [CrossRef]
- Pandey, G.; Nguyen, V.-T. A comparative study of regression based methods in regional flood frequency analysis. J. Hydrol. 1999, 225, 92–101. [Google Scholar] [CrossRef]
- Dalrymple, T. Flood-Frequency Analyses, Manual of Hydrology: Part 3 Flood Flow Technique (No. 1543-A); United States Department of Interior: Washington, DC, USA, 1960. [Google Scholar]
- Lu, L.-H.; Stedinger, J.R. Sampling variance of normalized GEV/PWM quantile estimators and a regional homogeneity test. J. Hydrol. 1992, 138, 223–245. [Google Scholar] [CrossRef]
- Bates, B.C.; Rahman, A.; Mein, R.G.; Weinmann, P.E. Climatic and physical factors that influence the homogeneity of regional floods in southeastern Australia. Water Resour. Res. 1998, 34, 3369–3381. [Google Scholar] [CrossRef]
- Rahman, A.S.; Khan, Z.; Rahman, A. Application of independent component analysis in regional flood frequency analysis: Comparison between quantile regression and parameter regression techniques. J. Hydrol. 2020, 581, 124372. [Google Scholar] [CrossRef]
- Stedinger, J.R.; Lu, L.H. Appraisal of regional and index flood quantile estimators. Stoch. Environ. Res. Risk Assess. 1995, 9, 49–75. [Google Scholar] [CrossRef]
- Kjeldsen, T.R.; Jones, D. Estimation of an index flood using data transfer in the UK. Hydrol. Sci. J. 2007, 52, 86–98. [Google Scholar] [CrossRef]
- Kalai, C.; Mondal, A.; Griffin, A.; Stewart, E. Comparison of nonstationary regional flood frequency analysis techniques based on the index-flood approach. J. Hydrol. Eng. 2020, 25, 06020003. [Google Scholar] [CrossRef]
- Thomas, D.M.; Benson, M.A. Generalization of Streamflow Characteristics from Drainage-Basin Characteristics; US Government Printing Office: Washington, DC, USA, 1970; Volume 1975. [Google Scholar]
- Micevski, T.; Kuczera, G. Combining site and regional flood information using a Bayesian Monte Carlo approach. Water Resour. Res. 2009, 45, W04405. [Google Scholar] [CrossRef]
- Durocher, M.; Burn, D.H.; Zadeh, S.M. A nationwide regional flood frequency analysis at ungauged sites using ROI/GLS with copulas and super regions. J. Hydrol. 2018, 567, 191–202. [Google Scholar] [CrossRef]
- Newton, D.W.; Herrin, J.C. Assessment of commonly used methods of estimating flood frequency. Transp. Res. Rec. 1982, 896, 10–30. [Google Scholar]
- Zaman, M.A.; Rahman, A.; Haddad, K. Regional flood frequency analysis in arid regions: A case study for Australia. J. Hydrol. 2012, 475, 74–83. [Google Scholar] [CrossRef]
- Chebana, F.; Charron, C.; Ouarda, T.B.M.J.; Martel, B. Regional Frequency Analysis at Ungauged Sites with the Generalized Additive Model. J. Hydrometeorol. 2014, 15, 2418–2428. [Google Scholar] [CrossRef]
- Rahman, A.; Charron, C.; Ouarda, T.B.M.J.; Chebana, F. Development of regional flood frequency analysis techniques using generalized additive models for Australia. Stoch. Environ. Res. Risk Assess. 2017, 32, 123–139. [Google Scholar] [CrossRef]
- Noor, F.; Laz, O.U.; Haddad, K.; Alim, M.A.; Rahman, A. Comparison between Quantile Regression Technique and Generalised Additive Model for Regional Flood Frequency Analysis: A Case Study for Victoria, Australia. Water 2022, 14, 3627. [Google Scholar] [CrossRef]
- Aziz, K.; Rahman, A.; Fang, G.; Shrestha, S. Application of artificial neural networks in regional flood frequency analysis: A case study for Australia. Stoch. Environ. Res. Risk Assess. 2013, 28, 541–554. [Google Scholar] [CrossRef]
- Kumar, R.; Goel, N.K.; Chatterjee, C.; Nayak, P.C. Regional flood frequency analysis using soft computing techniques. Water Resour. Manag. 2015, 29, 1965–1978. [Google Scholar] [CrossRef]
- Leclerc, M.; Ouarda, T.B. Non-stationary regional flood frequency analysis at ungauged sites. J. Hydrol. 2007, 343, 254–265. [Google Scholar] [CrossRef]
- Han, X.; Mehrotra, R.; Sharma, A.; Rahman, A. Incorporating nonstationarity in regional flood frequency analysis procedures to account for climate change impact. J. Hydrol. 2022, 612, 128235. [Google Scholar] [CrossRef]
- Guo, S.; Xiong, L.; Chen, J.; Guo, S.; Xia, J.; Zeng, L.; Xu, C.-Y. Nonstationary Regional Flood Frequency Analysis Based on the Bayesian Method. Water Resour. Manag. 2022, 37, 659–681. [Google Scholar] [CrossRef]
- Zhu, X.; Xu, Z.; Liu, Z.; Liu, M.; Yin, Z.; Yin, L.; Zheng, W. Impact of dam construction on precipitation: A regional perspective. Mar. Freshw. Res. 2022. [Google Scholar] [CrossRef]
- Xie, X.; Tian, Y.; Wei, G. Deduction of sudden rainstorm scenarios: Integrating decision makers’ emotions, dynamic Bayesian network and DS evidence theory. Nat. Hazards 2022, 45, W04405. Available online: https://link.springer.com/article/10.1007/s11069-022-05792-z (accessed on 4 April 2023). [CrossRef]
- Robson, A.J.; Reed, D.W. Statistical procedures for flood frequency estimation. In Volume 3 of the Flood Estimation Handbook; Centre for Ecology & Hydrology: Lancaster, UK, 1999. [Google Scholar]
- Blöschl, G.; Sivapalan, M.; Wagener, T.; Savenije, H.; Viglione, A. (Eds.) Runoff Prediction in Ungauged Basins: Synthesis across Processes, Places and Scales; Cambridge University Press: Cambridge, UK, 2013. [Google Scholar]
- Interagency Committee on Water Data (IACWD). Guidelines for Determining Flood Flow Frequency: Bulletin 17-B (Revised and Corrected); SubComm: Eatontown, NJ, USA, 1982. [Google Scholar]
Figure 1.
Flow of information through the different phases of bibliometric analysis (# means number).
Figure 1.
Flow of information through the different phases of bibliometric analysis (# means number).

Figure 2.
Annual scientific production on RFFA studies.

Figure 3.
Author productivity over time.

Figure 4.
Geographical distribution of the most cited countries. The regions which shown in grey colour are not among the top 10.
Figure 4.
Geographical distribution of the most cited countries. The regions which shown in grey colour are not among the top 10.

Figure 5.
Thematic map based on authors’ keywords.

Table 1.
Searched terms, query and inclusion and exclusion criteria used in this study.
| Database | Search Terms and Query |
|---|---|
| Scopus (Title, abstract, keywords) | (“Regional flood frequency analysis”) OR (“Regional frequency analysis” AND flood) OR (rffa AND flood) OR (rffe AND flood) OR (“regional flood frequency estimation”) |
| Web of Science (Topic) | (“Regional flood frequency analysis”) OR (“Regional frequency analysis” AND flood) OR (rffa AND flood) OR (rffe AND flood) OR (“regional flood frequency estimation”) |
| Inclusion criteria | Peer-reviewed research and review articles, conference papers, book chapters English literature Source type (journal, conference proceeding, book) |
| Exclusion criteria | Notes, letters, opinion pieces, and non-peer-reviewed literature |
Table 2.
The most productive sources.
| Rank | Sources | Articles | TC | FIY |
|---|---|---|---|---|
| 1 | Journal of Hydrology | 77 | 5298 | 1986 |
| 2 | Water Resources Research | 52 | 3108 | 1981 |
| 3 | Journal of Hydrologic Engineering | 28 | 564 | 1997 |
| 4 | Water Resources Management | 21 | 763 | 1998 |
| 5 | Hydrological Processes | 20 | 451 | 1995 |
| 6 | Hydrological Sciences Journal | 19 | 722 | 1985 |
| 7 | Stochastic Environmental Research and Risk Assessment | 17 | 644 | 2007 |
| 8 | International Journal of Climatology | 16 | 621 | 2003 |
| 9 | Natural Hazards | 13 | 172 | 2011 |
| 10 | Theoretical and Applied Climatology | 11 | 134 | 2011 |
| 10 | Water (Switzerland) | 11 | 49 | 2019 |
Notes: TC represents total citations, FIY shows first issue year.
Table 3.
The most productive authors.
| Rank | Author | Current Affiliation | Country | TC | NP | CPP | FPY |
|---|---|---|---|---|---|---|---|
| 1 | Rahman A | WSU | Australia | 944 | 67 | 14.09 | 2010 |
| 2 | Ouarda T | CETE | Canada | 1972 | 47 | 41.96 | 1995 |
| 3 | Haddad K | WSU | Australia | 653 | 33 | 19.79 | 2010 |
| 4 | Chebana F | CETE | Canada | 585 | 21 | 27.86 | 2007 |
| 5 | Burn D | UoW | Canada | 1623 | 19 | 85.42 | 1988 |
| 6 | Srinivas V | IIoS | India | 260 | 13 | 20.00 | 2008 |
| 7 | Kuczera G | UoN | Australia | 187 | 12 | 15.58 | 2010 |
| 8 | Aziz K | WSU | Australia | 148 | 10 | 14.80 | 2011 |
| 9 | Heo J | YU | South Korea | 112 | 10 | 11.20 | 1989 |
| 10 | Zaman M | WSU | Australia | 175 | 9 | 19.44 | 2010 |
Notes: WSU: Western Sydney University. CETE: Centre Eau Terre Environment. UoW: University of Waterloo. IIoS: Indian Institute of Science. UoN: The University of Newcastle. YU: Yonsei University. TC presents total citations. NP shows number of publications. CPP presents citation per publication. FPY represents author’s first publication year in this field.
Disclaimer/Publisher’s Note: The statements, opinions and data contained in all publications are solely those of the individual author(s) and contributor(s) and not of MDPI and/or the editor(s). MDPI and/or the editor(s) disclaim responsibility for any injury to people or property resulting from any ideas, methods, instructions or products referred to in the content. |
© 2023 by the authors. Licensee MDPI, Basel, Switzerland. This article is an open access article distributed under the terms and conditions of the Creative Commons Attribution (CC BY) license (https://creativecommons.org/licenses/by/4.0/).
Share and Cite
MDPI and ACS Style
Ahmed, A.; Yildirim, G.; Haddad, K.; Rahman, A. Regional Flood Frequency Analysis: A Bibliometric Overview. Water 2023, 15, 1658. https://doi.org/10.3390/w15091658
AMA Style
Ahmed A, Yildirim G, Haddad K, Rahman A. Regional Flood Frequency Analysis: A Bibliometric Overview. Water. 2023; 15(9):1658. https://doi.org/10.3390/w15091658
Chicago/Turabian StyleAhmed, Ali, Gokhan Yildirim, Khaled Haddad, and Ataur Rahman. 2023. "Regional Flood Frequency Analysis: A Bibliometric Overview" Water 15, no. 9: 1658. https://doi.org/10.3390/w15091658
Note that from the first issue of 2016, this journal uses article numbers instead of page numbers. See further details here.