

Research on Water Level Anomaly Data Alarm Based on CNN-BiLSTM-DA Model

1
College of Water Conservancy and Hydropower Engineering, Hohai University, No.1 Xikang Road, Ninghai Road Street, Gulou District, Nanjing 210098, China
2
Huaneng Lancang River Hydropower Inc., Yunda West Road, Guandu District, Kunming 650214, China
*
Author to whom correspondence should be addressed.
Water 2023, 15(9), 1659; https://doi.org/10.3390/w15091659
Submission received: 17 March 2023
/
Revised: 5 April 2023
/
Accepted: 19 April 2023
/
Published: 24 April 2023
(This article belongs to the Topic Hydro-Meteorological Hazards: Forecasting, Assessment and Risk Management)
Abstract
:With frequent extreme rainfall events caused by rapid changes in the global climate, many cities are threatened by urban flooding. Timely issuance of flood warnings can help prepare for disasters and minimize losses caused by floods. In this study, we propose a method based on a convolutional neural network-bidirectional long short-term memory-difference analysis (CNN-BiLSTM-DA) model for water level prediction analysis and flood warning. The method calculates and analyzes the difference sequence between water level monitoring values and water level prediction values, compares historical flood data to determine the alarm threshold for abnormal water level data, and achieves real-time flood warnings to provide technical references for flood prevention and mitigation. Taking Yancheng city, a low-lying city located in the plain area of Jiangsu Province in China, as an example, this study verifies the accuracy of the CNN-BiLSTM model in water level prediction, which can achieve an accuracy rate above 95%. This provides a reliable data basis for further determination of warning thresholds using the DA model. The CNN-BiLSTM-DA model achieves an accuracy rate of 85.71% in flood warnings without any missed reports, demonstrating that this method has scientific, practical, and accurate features in addressing flood warning issues.
1. Introduction
As global climate change intensifies, extreme rainfall events are occurring more frequently, posing greater threats to people’s lives and properties from flooding disasters. To tackle this issue, China has been increasing its investment in water level monitoring stations, which serve as a crucial foundation for monitoring water level changes and providing timely warnings of potential flood risks. From just over 300 stations in the early years of the founding of the People’s Republic of China, the network has now grown to over 3000 stations that are spatially distributed relatively reasonably, with well-developed functions, covering the ten major river basins and major lakes and reservoirs in China.
The water level data obtained from these monitoring stations serve as basic information for reflecting water level changes. Timely detection of abnormal data during the monitoring process is of vital importance for predicting and warning of imminent flood disasters [1]. In water level monitoring work, timely detection of abnormal data and early warning are essential safeguards for ensuring high-quality economic and social development and the safety of people’s lives and properties [2].
Numerous scholars have conducted various research on flood forecasting and warning, and many warning methods and techniques based on different principles have emerged. Currently, research on flood prediction and warning can be roughly divided into two types [3]. One is flood prediction and warning research based on numerical models. This type of research started earlier, has been studied more extensively, and can be more maturely applied [4]. SWMM [5,6], InfoWorks [7,8], MIKE [9,10,11], and STORM [12,13] are widely used numerical models for flood prediction. However, with the advancement of urbanization, the refinement of modeling requirements has made the modeling process more complicated. A large number of parameters need to be calibrated, and the difficulty in obtaining high-precision data and modeling makes the promotion and use of models limited to a certain extent [4].
The other type is flood prediction and warning research based on time series analysis. In recent years, the rapid development of artificial intelligence and information technology has attracted the attention of scholars from various countries. More and more scholars are applying deep learning models to flood warning research. For example, Zuo Ganggang constructed a runoff prediction simulation system based on three machine learning models: SVM, GBDT, and DNN. The system was simulated and verified using the Xianyang station in the Weihe River basin, showing strong dynamics, universality, and operability [14]. Sun Yingjun and others focused on water level prediction during the flood process and combined the advantages of convolutional networks and long short-term memory networks to build a convolutional sequence-to-sequence network (CNN-Seq2Seq) prediction model, which was experimentally verified to have high water level prediction accuracy [15]. Liu Wei and others proposed a water level prediction method based on the LSTM model for flood warning problems. By comparing historical flood events, the method can accurately predict critical flood nodes [16].
These deep-learning-based methods provide new directions and approaches for solving flood warning problems. They have obvious advantages compared to traditional methods, such as not requiring a high degree of hydrological and physical process cognition and relative simplicity in modeling. Therefore, they have great potential in the field of flood warning research [17,18].
The occurrence of extreme precipitation events can lead to abnormal changes in water levels. Therefore, the alarm for abnormal water level changes plays an essential role in flood forecasting and warning [1]. In flood warnings for plain areas, water level is an important warning indicator. The monitoring data from water level stations, which provide a real-time reflection of precipitation changes in the form of time series, possess strong periodicity, autocorrelation, and certain spatial features. Considering the ability of bidirectional long- and short-term memory (BiLSTM) to handle time-series information and capture temporal correlations, convolutional neural network (CNN) to extract spatial features from data, and difference analysis (DA) to calculate and analyze the reasonable differences between actual water level monitoring and predicted data, this paper proposes a method to predict water level based on CNN-BiLSTM, along with the DA model for water level anomaly alarm and flood warning in plain areas. The model predicts water level time series data, analyzes the difference between actual and predicted data, and determines the alarm threshold, thus achieving the alarm for abnormal water level data and flood warnings [1].
2. Materials and Methods
2.1. Study Area and Dataset
The water level data used for instance validation in this study were obtained from the Chuanchang River Hydrological Station in Yancheng City, Jiangsu Province. Yancheng City, located in a low-lying plain area in Jiangsu province, is vulnerable to the impacts of flood disasters. Therefore, using it as a study instance is of important reference and practical significance for further exploration of flood warning methods and techniques [19].
The study area is located in a plain region where water level is a crucial indicator for flood warnings. Considering the following factors, this paper chooses water level as the warning indicator for flood disasters in plain areas: water level is a direct indicator that reflects flood risk and is easy for people to understand and accept, as well as for warning information to be conveyed; water level data collection is relatively simple and convenient; as a crucial warning indicator for flood disasters in plain areas, the use of water level can better reflect the actual situation; water level change is sensitive and can reflect environmental changes in a short period, providing better timeliness for flood warning compared to other indicators. The emergence of extreme rainfall will cause abnormal changes in water level, and the realization of water level anomaly data warning plays an indispensable supportive role in achieving prediction and warning of flood disasters in plain areas.
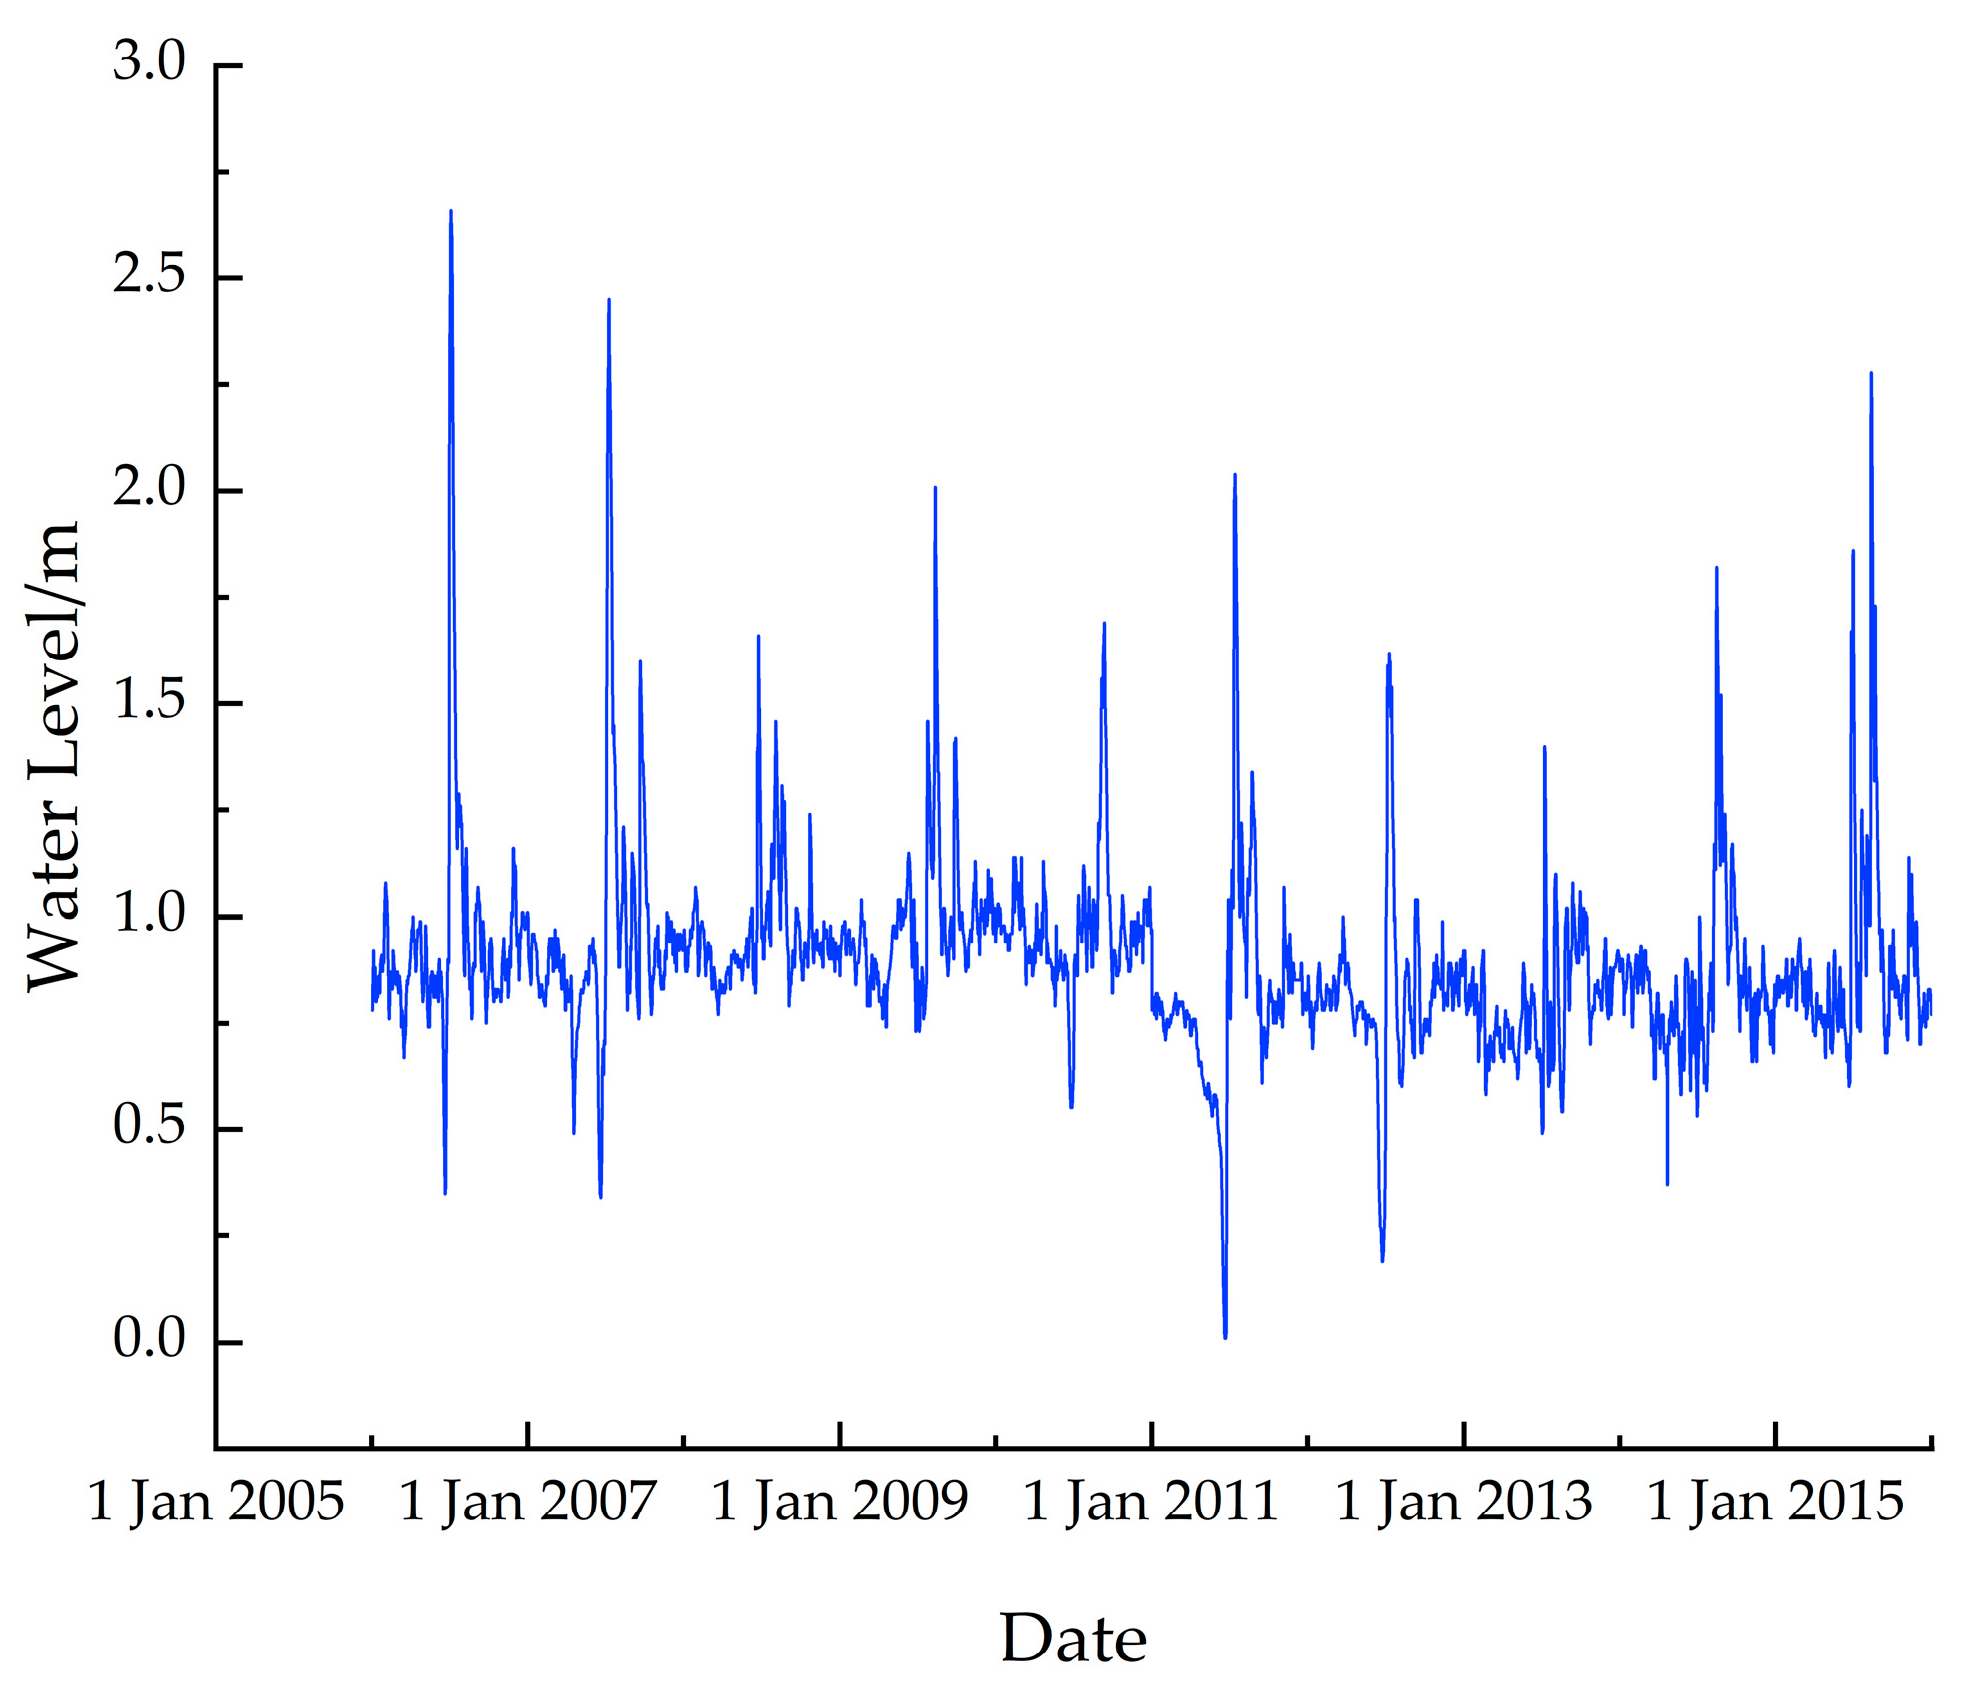
A total of 3652 daily water level monitoring data from the Chuanchang River Hydrological Station were selected for instance validation, covering the period from 1 January 2006 to 31 December 2015. Among them, 3649 data were valid while 3 data were missing. Considering that water level monitoring data are a time series with strong temporal correlation between adjacent time points, the nearest value filling method was used to process the missing data without affecting subsequent predictions [1]. A line graph using the completed water level data was plotted, as shown in Figure 1. Due to the frequent occurrence of flood disasters in Yancheng City in 2015, this year’s dataset was chosen as the test set. Without changing the temporal characteristics of the preprocessed dataset, the test set was divided into the training set, validation set, and test set in a ratio of 7:2:1. The model dataset is shown in Table 1.
2.2. Model Structure
2.2.1. CNN
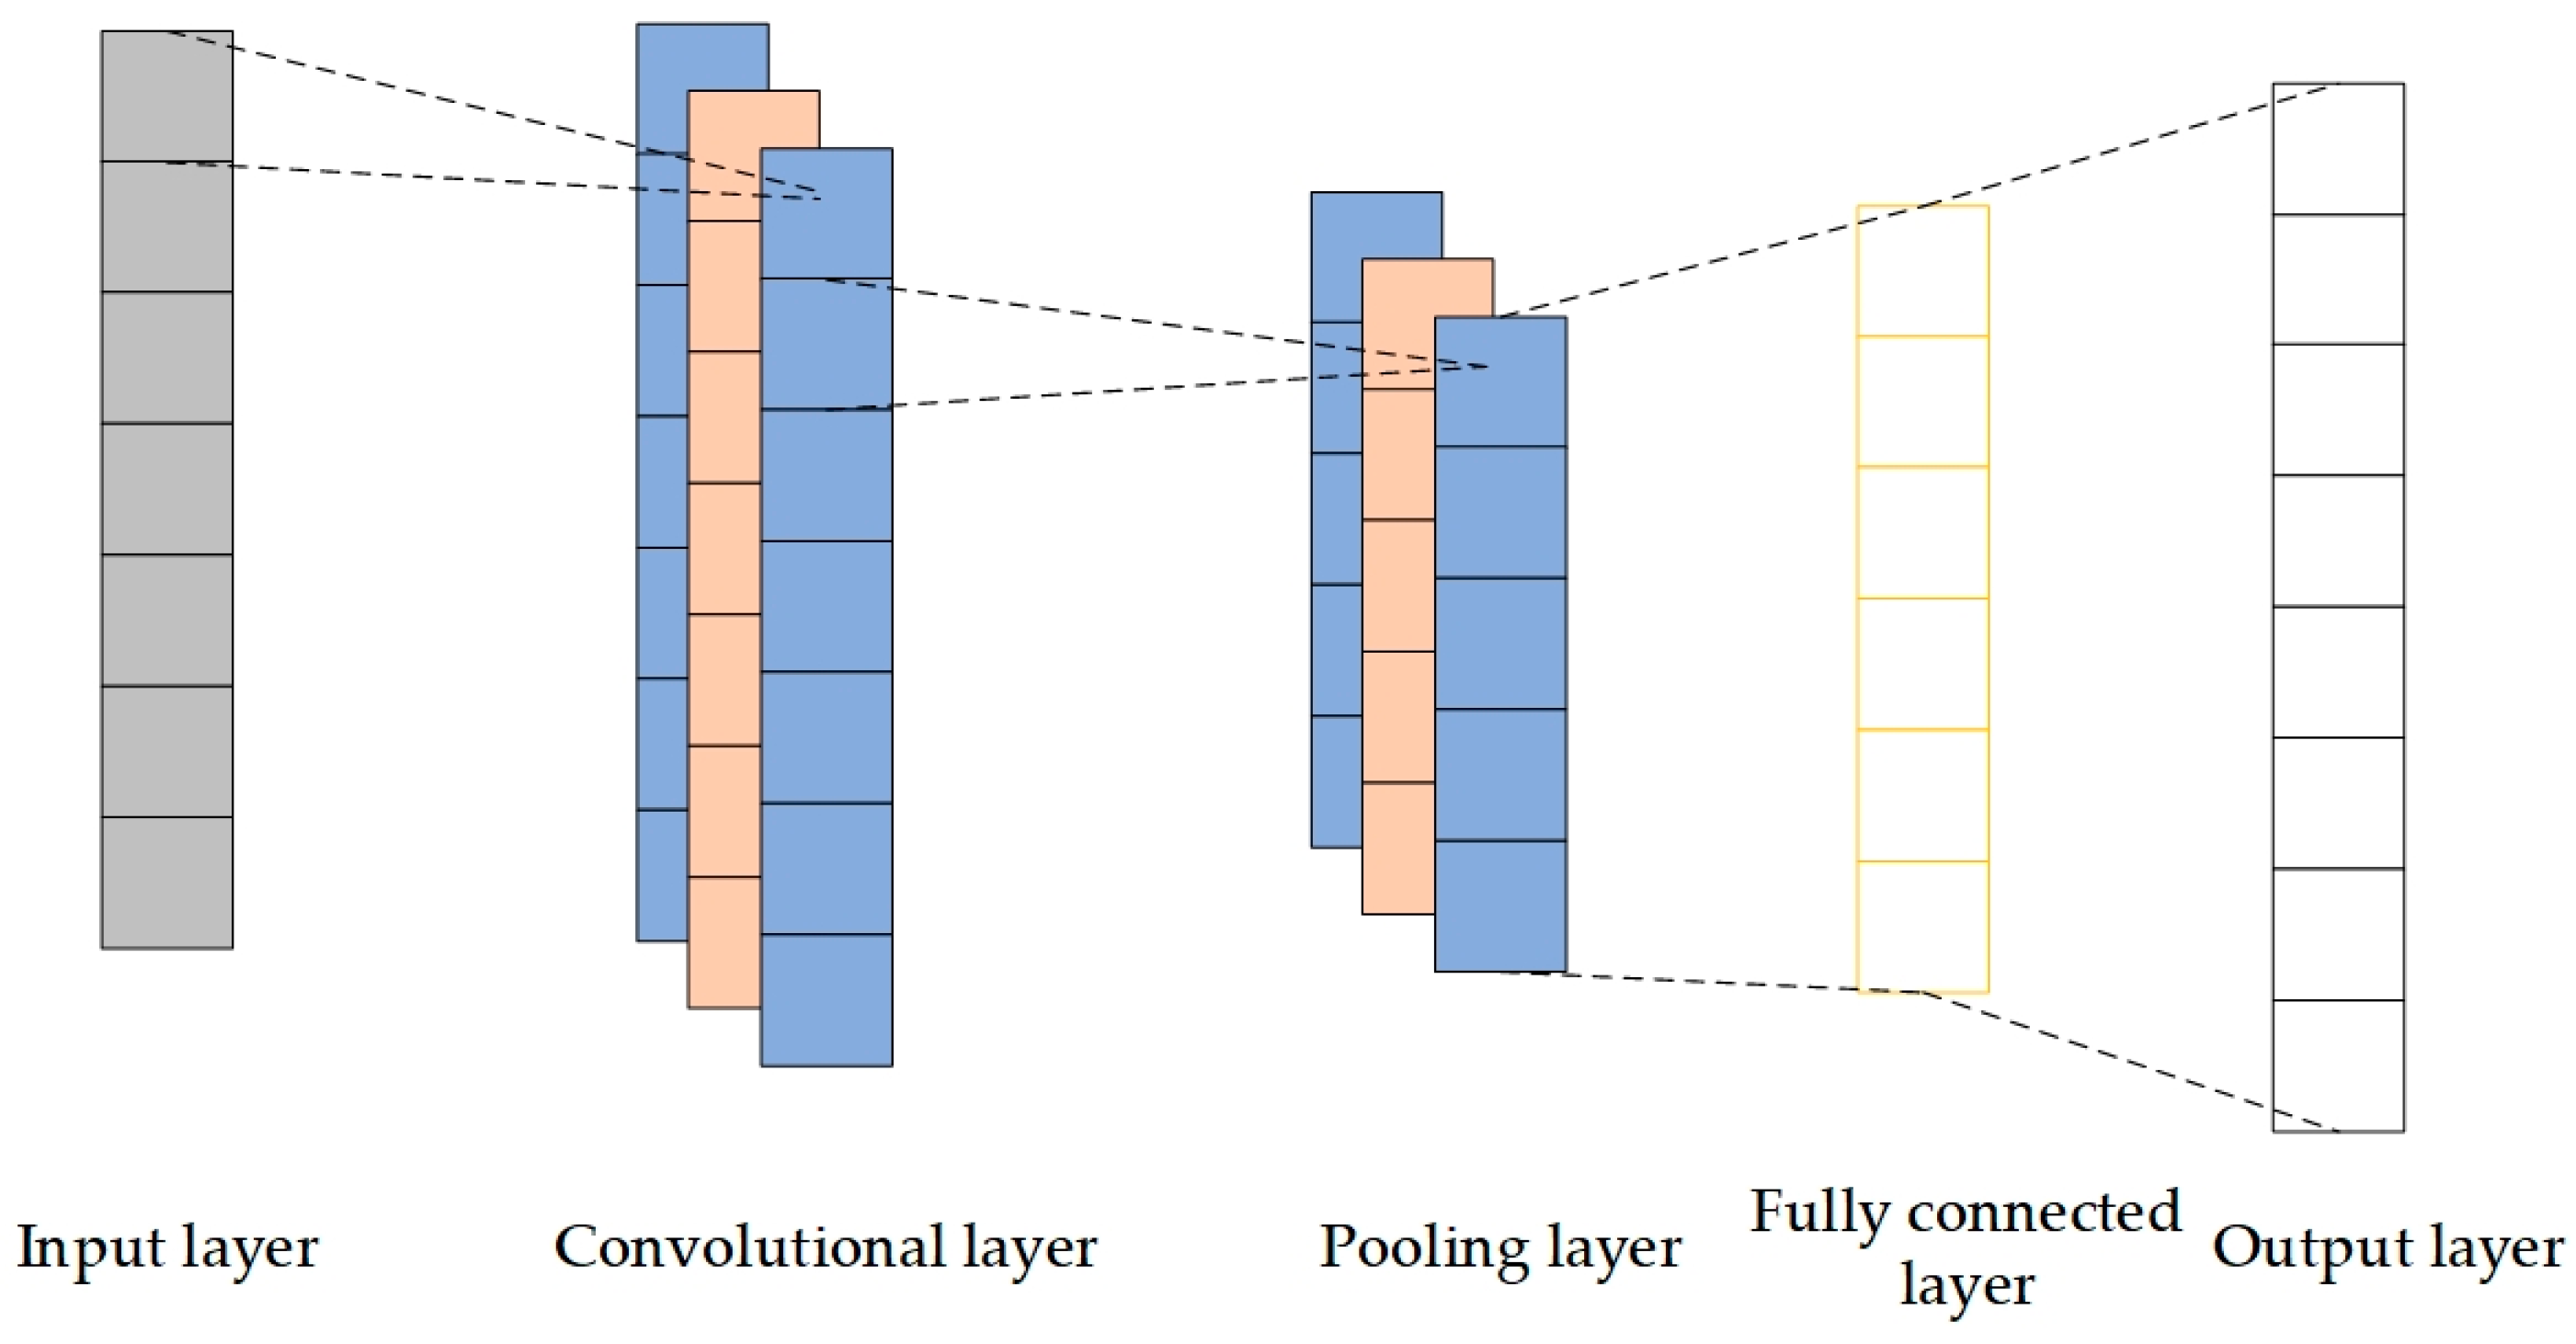
CNN is a feedforward neural network with deep structures that can perform convolutional operations. Its efficient feature extraction ability has made it widely applied in water level prediction fields [20,21]. The water level data are input into a one-dimensional CNN, in which the convolutional layer, pooling layer, and fully connected layer have specific functions. The convolutional layer uses convolution kernels to extract effective nonlinear local features of the water level monitoring data. The pooling layer compresses the extracted features, obtains critical feature information, and improves the generalization ability. Finally, the fully connected layer converts the obtained features into feature vectors and passes them to the output layer. The basic structure of one-dimensional CNN is shown in Figure 2. The mathematical model description is given in Equation (1).
In the equation: corresponds to the jth feature map of the lth layer; is an Activation Function; M is the number of input feature mappings; is the jth feature mapping of the l-1st layer; is the trainable convolution kernel; is a Paranoia Item.
2.2.2. LSTM
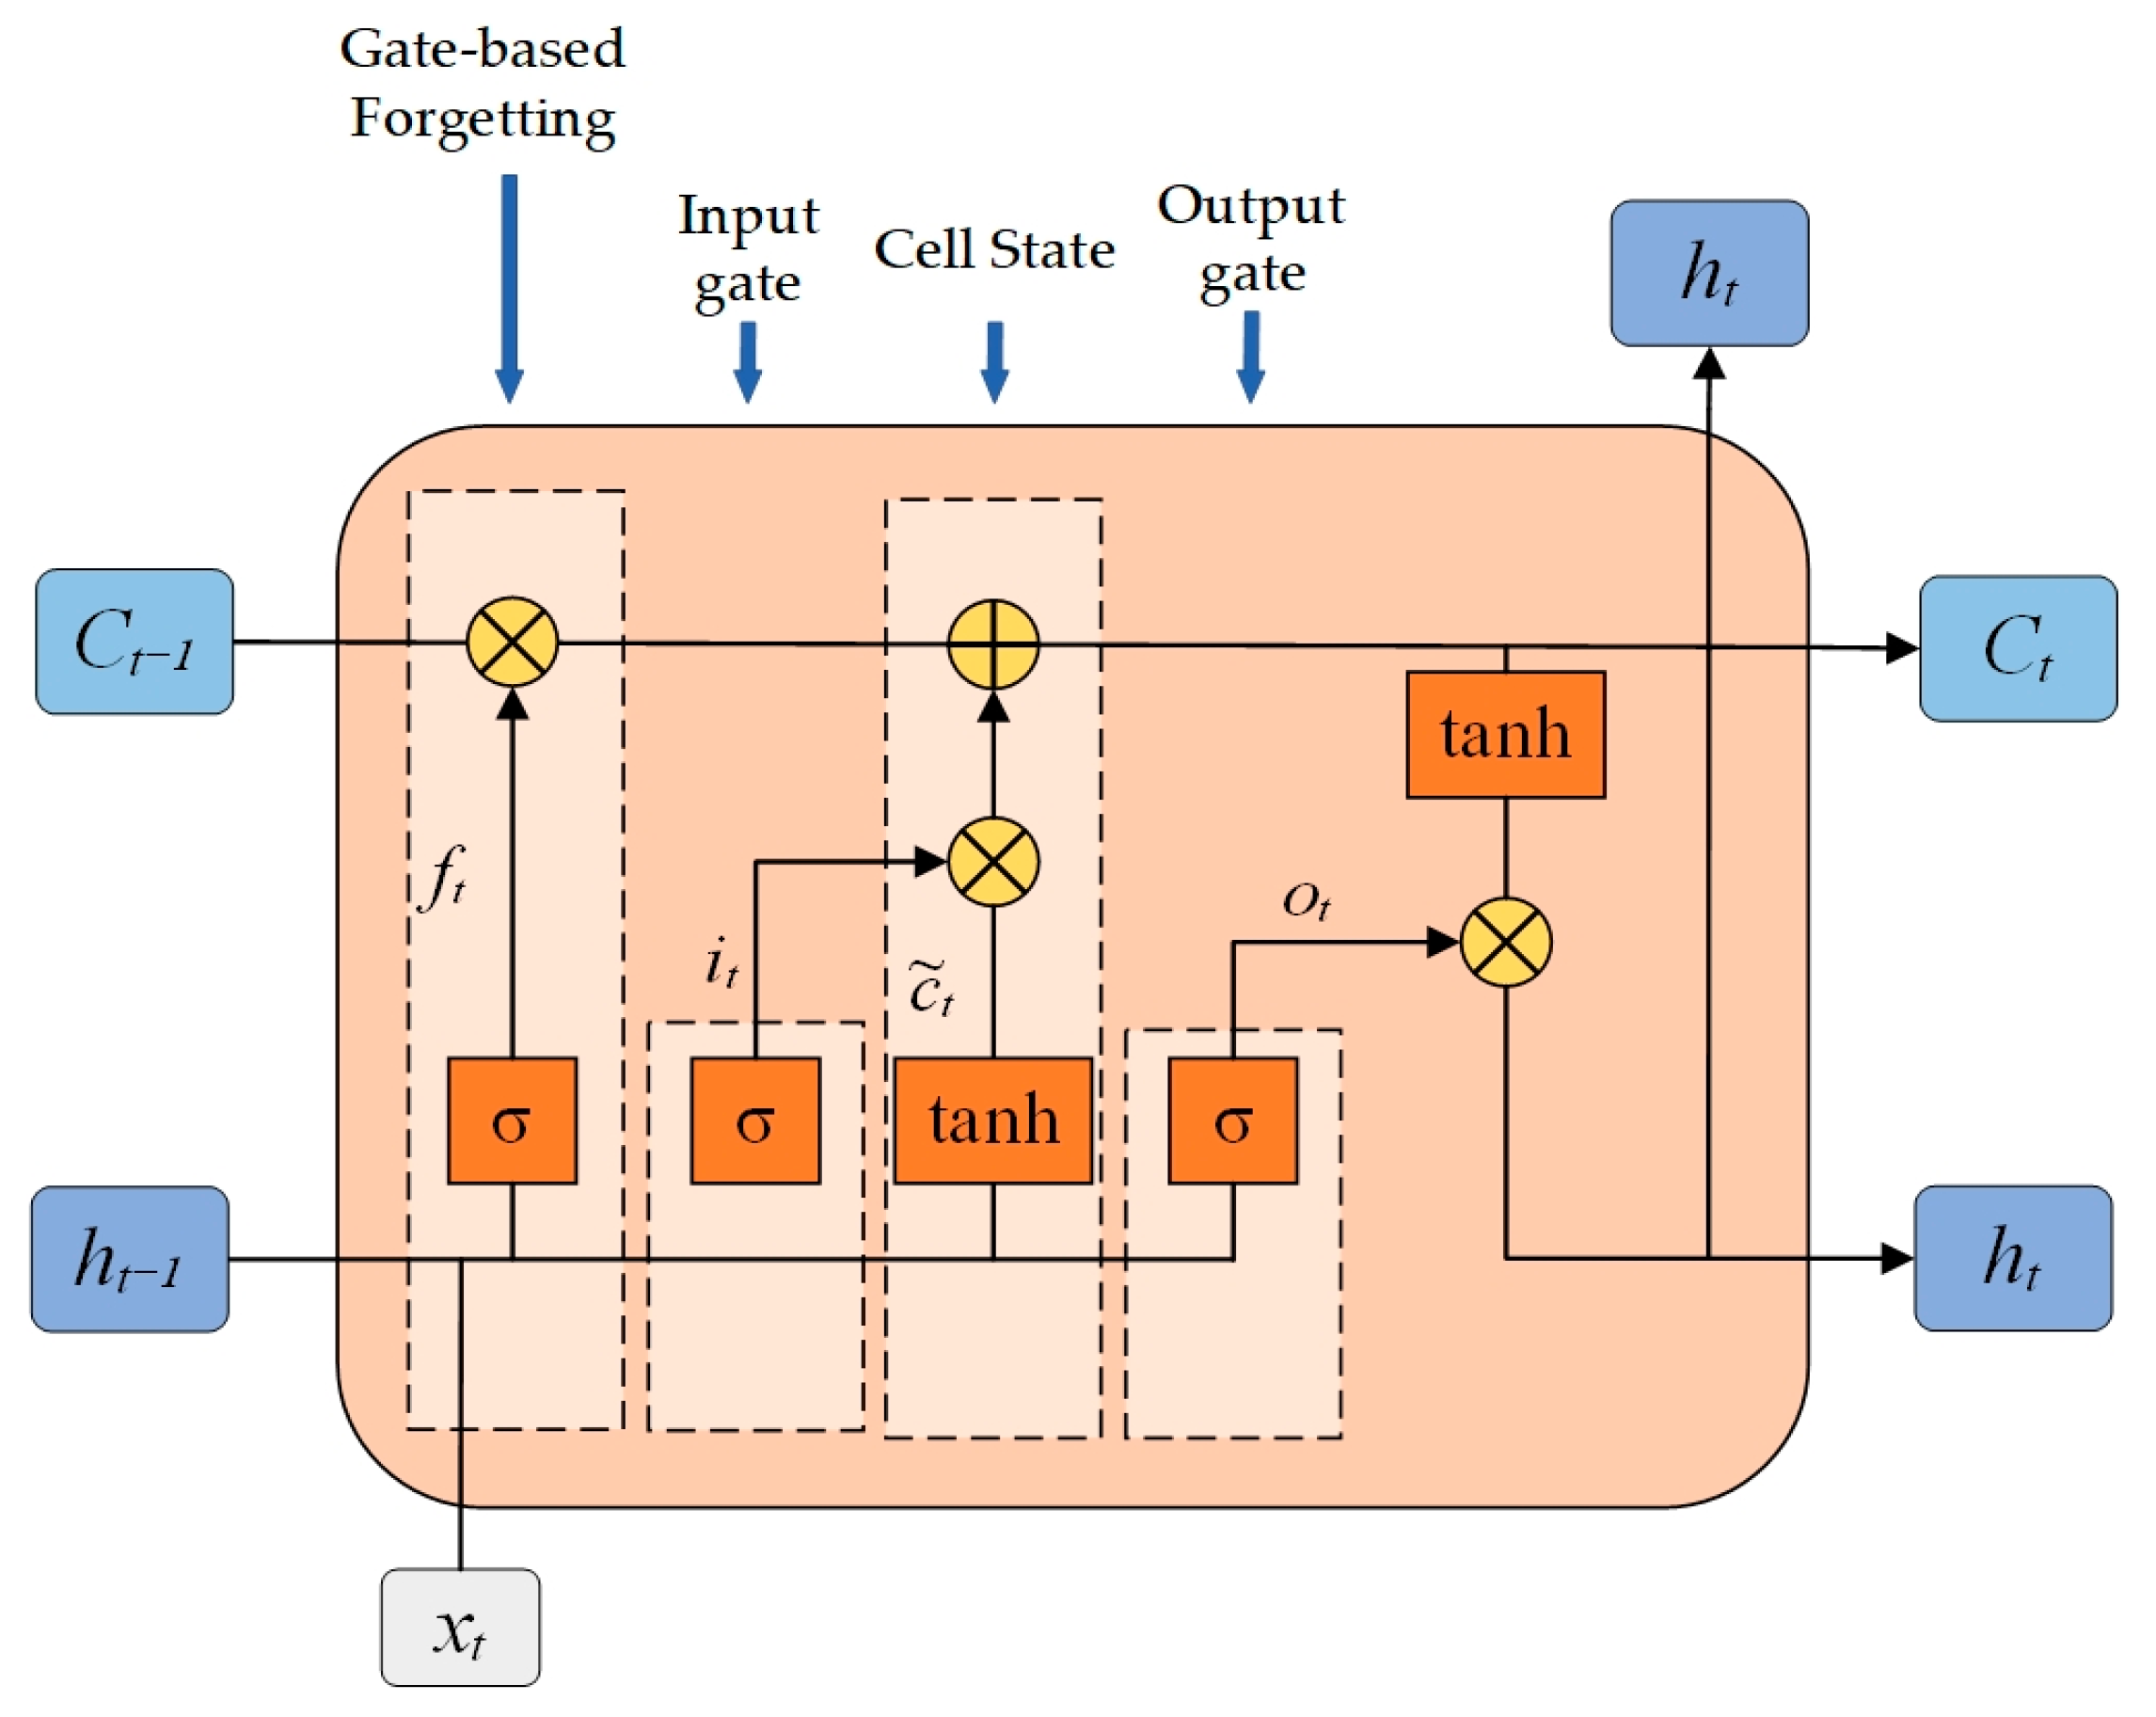
The LSTM neural network, proposed by Hochreiter et al. [22], is currently one of the most mature architectures in recurrent neural networks (RNNs). To address the problem of gradient explosion and vanishing in RNNs when predicting long-time series, LSTM supplements RNNs with three gate units—gate-based forgetting, input gate, and output gate—that can independently control information transfer. This enhances its ability to learn long-time sequences and improves the efficiency, speed, and accuracy of network convergence. The basic structure of LSTM is shown in Figure 3.
- Gate-based Forgetting: selectively forgetting useless information from the previous cell state . Read the hidden state from the previous time step and the input data from the current time step, and calculate a value between 0 and 1. When the value is 0, all information is forgotten, and when it is 1, all information is preserved, as shown in Equation (2).In the equation: in the calculation of the forget gate status, represents the result, while represents the weight matrix of the forget gate, and represents its bias term; σ denotes the sigmoid activation function.
- Input Gate: Read the input data at this time and retain useful information. Use the activation function tanh to obtain the temporary cell state at this time, and finally generate the cell state . Its updating process is shown in Equations (3)–(5).In the equations: represents the computation result of the input gate state at time t; is the weight matrix of the input gate; is the bias term of the input gate; is the weight matrix of the cell state; is the bias term of the cell state; tanh is the hyperbolic tangent activation function; and is the Hadamard product that multiplies elements in the same position.
- Output Gate: Selecting crucial information to be passed on to the next time step. The desired cell state for output is chosen using the sigmoid activation function, which is multiplied by the output that has passed through the tanh activation function to produce the next hidden state output value, , as shown in Equations (6) and (7).In the equations: represents the computation result of the output gate state when t is the current time step; is the weight matrix of the output gate; and is the bias term of the output gate.
2.2.3. BiLSTM
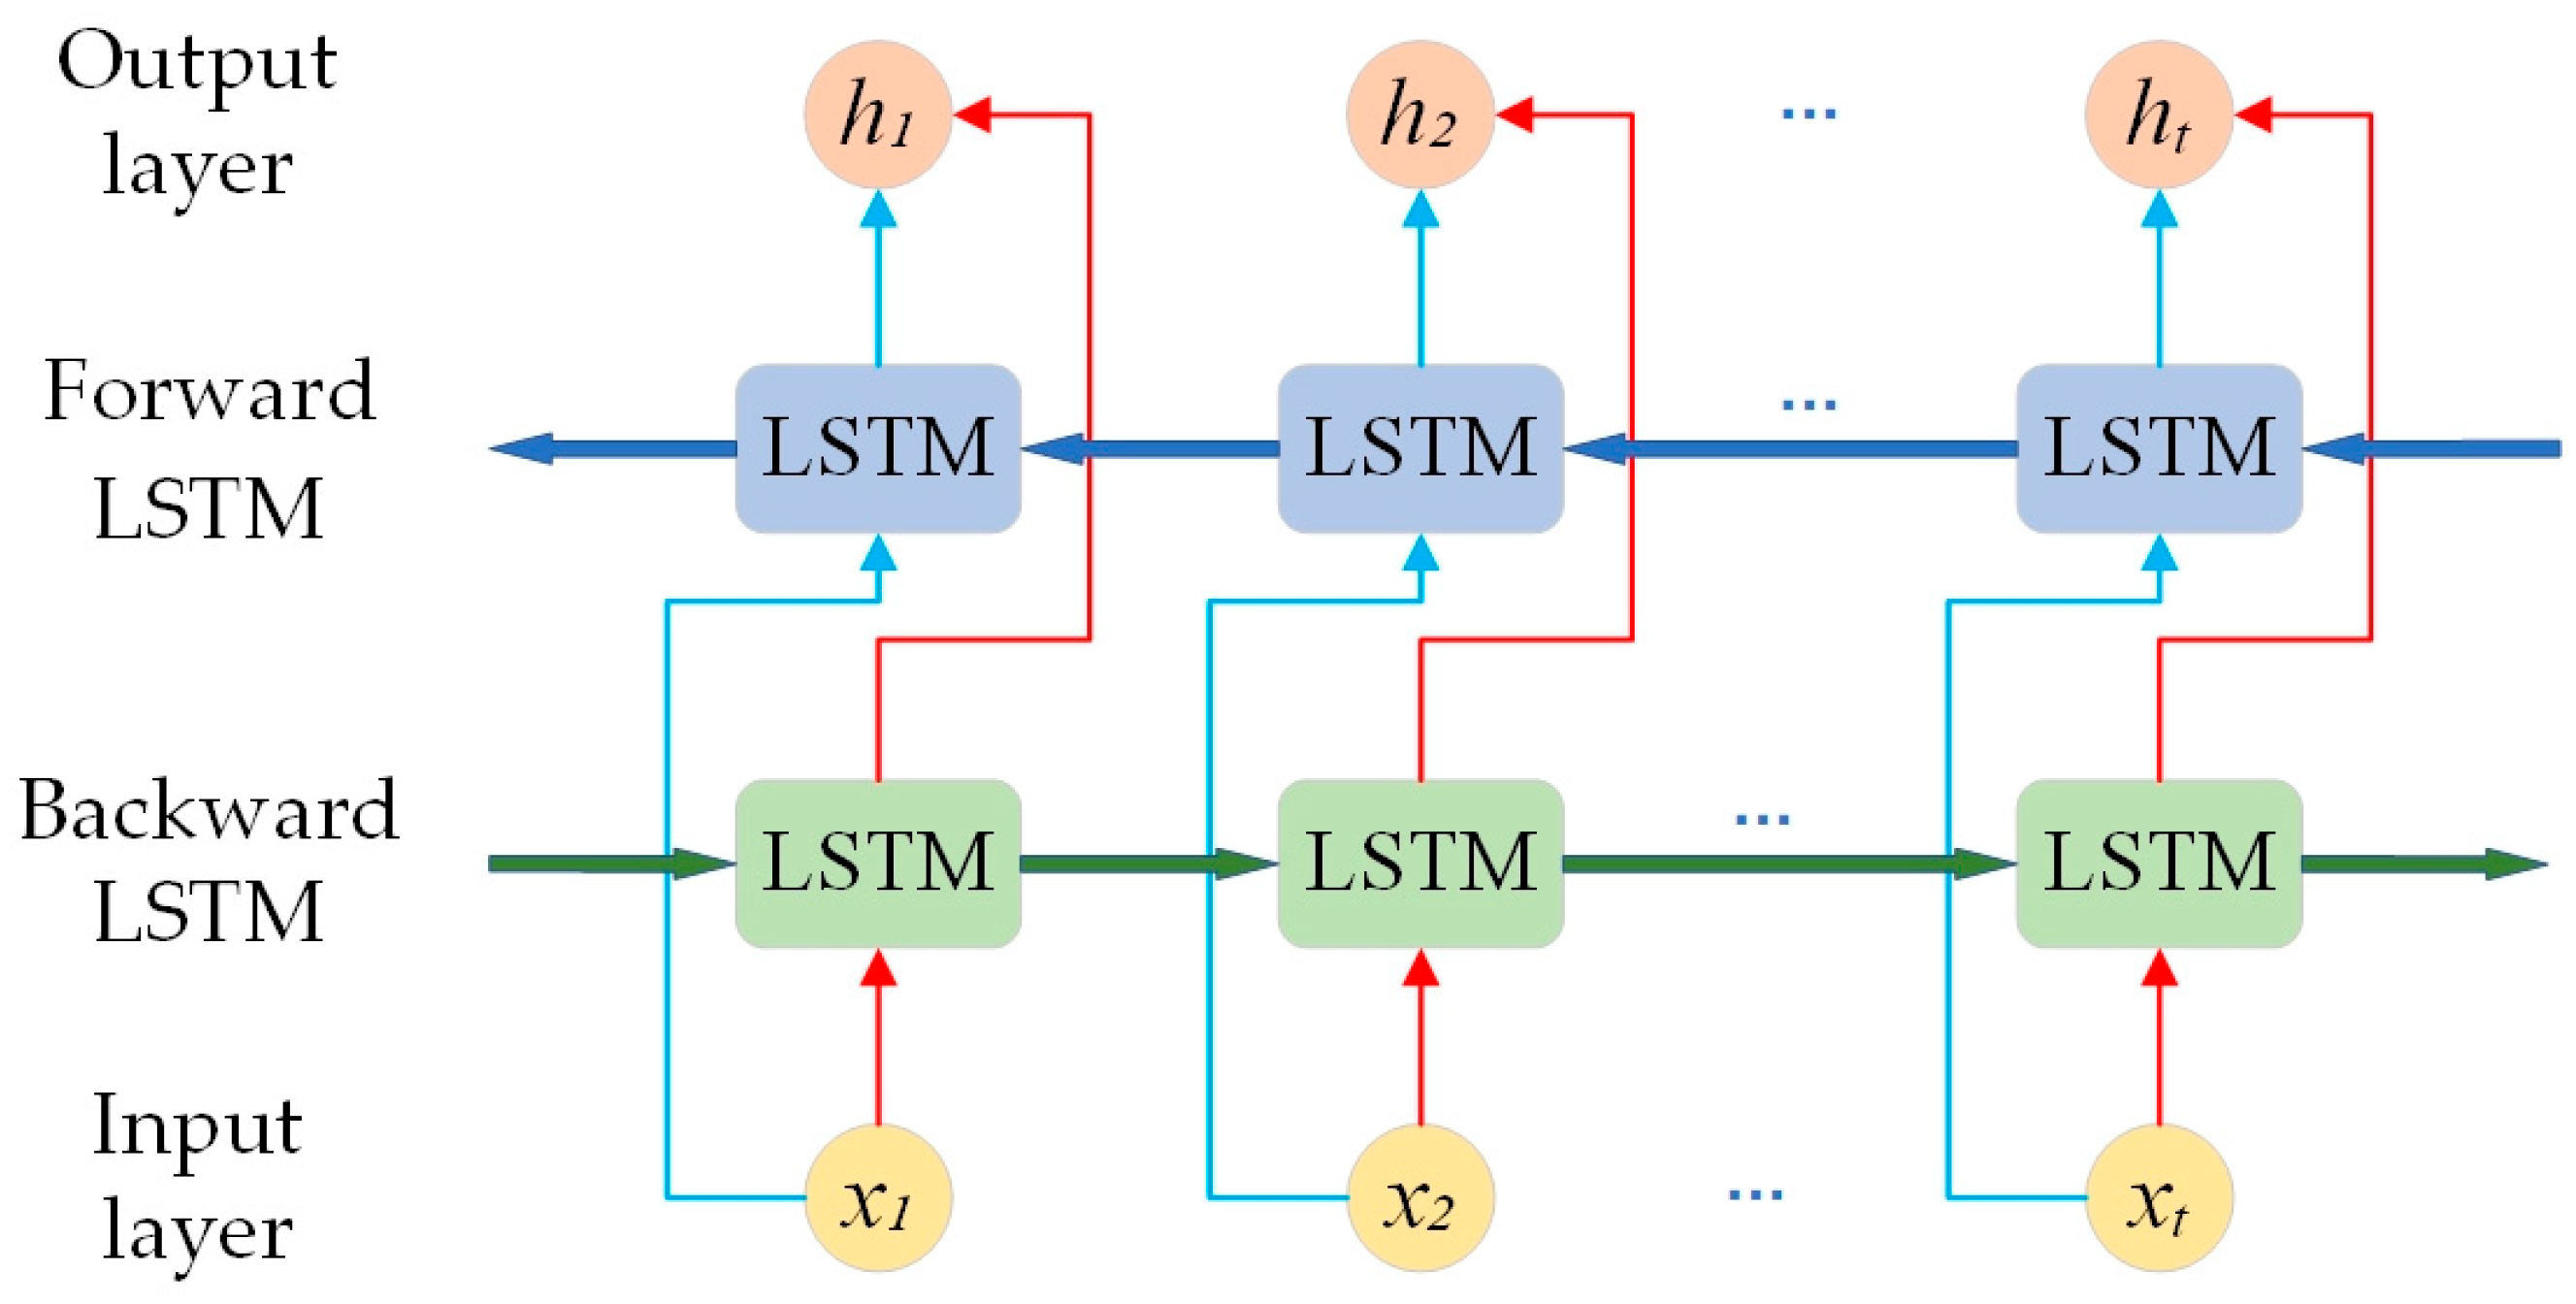
The BiLSTM model is an optimization of the LSTM model. By adding a backward LSTM layer, it creates a condition for fully mining historical and future information. Through bidirectional propagation of forward and backward layers, it achieves a greater degree of exploration of important information hidden in time series data, further improving the model’s prediction accuracy. The output process of BiLSTM is shown in Equations (8)–(10). Ultimately, the output of BiLSTM is the final prediction result, serving as one of the basic input data for the DA model. Its basic structure is illustrated in Figure 4.
In the equations: LSTM refers to the computation process of the LSTM hidden layer; represents the calculation result of the forward hidden layer state at time t; represents the calculation result of the backward hidden layer state at time t; is the forward output weight; is the backward output weight; and represents the calculation result of the BiLSTM hidden layer state at time t.
2.2.4. The Construction of CNN-BiLSTM
(1) The input layer is defined using sequenceInputLayer, with input data in the form of a sequence with size [f_, 1, 1] and named “sequence”. The sequenceFoldingLayer is then used to transform the input sequence data into matrix form for processing in the convolutional layers. (2) Two convolutional layers and two ReLU activation layers are used to extract features. (3) The sequenceUnfoldingLayer is used to convert the matrix output of the convolutional layers back into sequence form, and the flattenLayer is used to flatten the sequence data into vector form for processing in the fully connected layer. (4) In the BiLSTM layer, six LSTM units are set, and the output feature is obtained from the last time step. (5) The LSTM output is mapped to a scalar value using a fully connected layer and an output layer.
After adding the layers to the hierarchy chart, connectLayers is used to link the layers together. Specifically, the output of the sequence folding layer is connected to the input of the first convolutional layer, the miniBatchSize output of the sequence folding layer is connected to the miniBatchSize input of the sequence unfolding layer, and the output of the second ReLU activation layer is connected to the input of the sequence unfolding layer.
2.2.5. DA
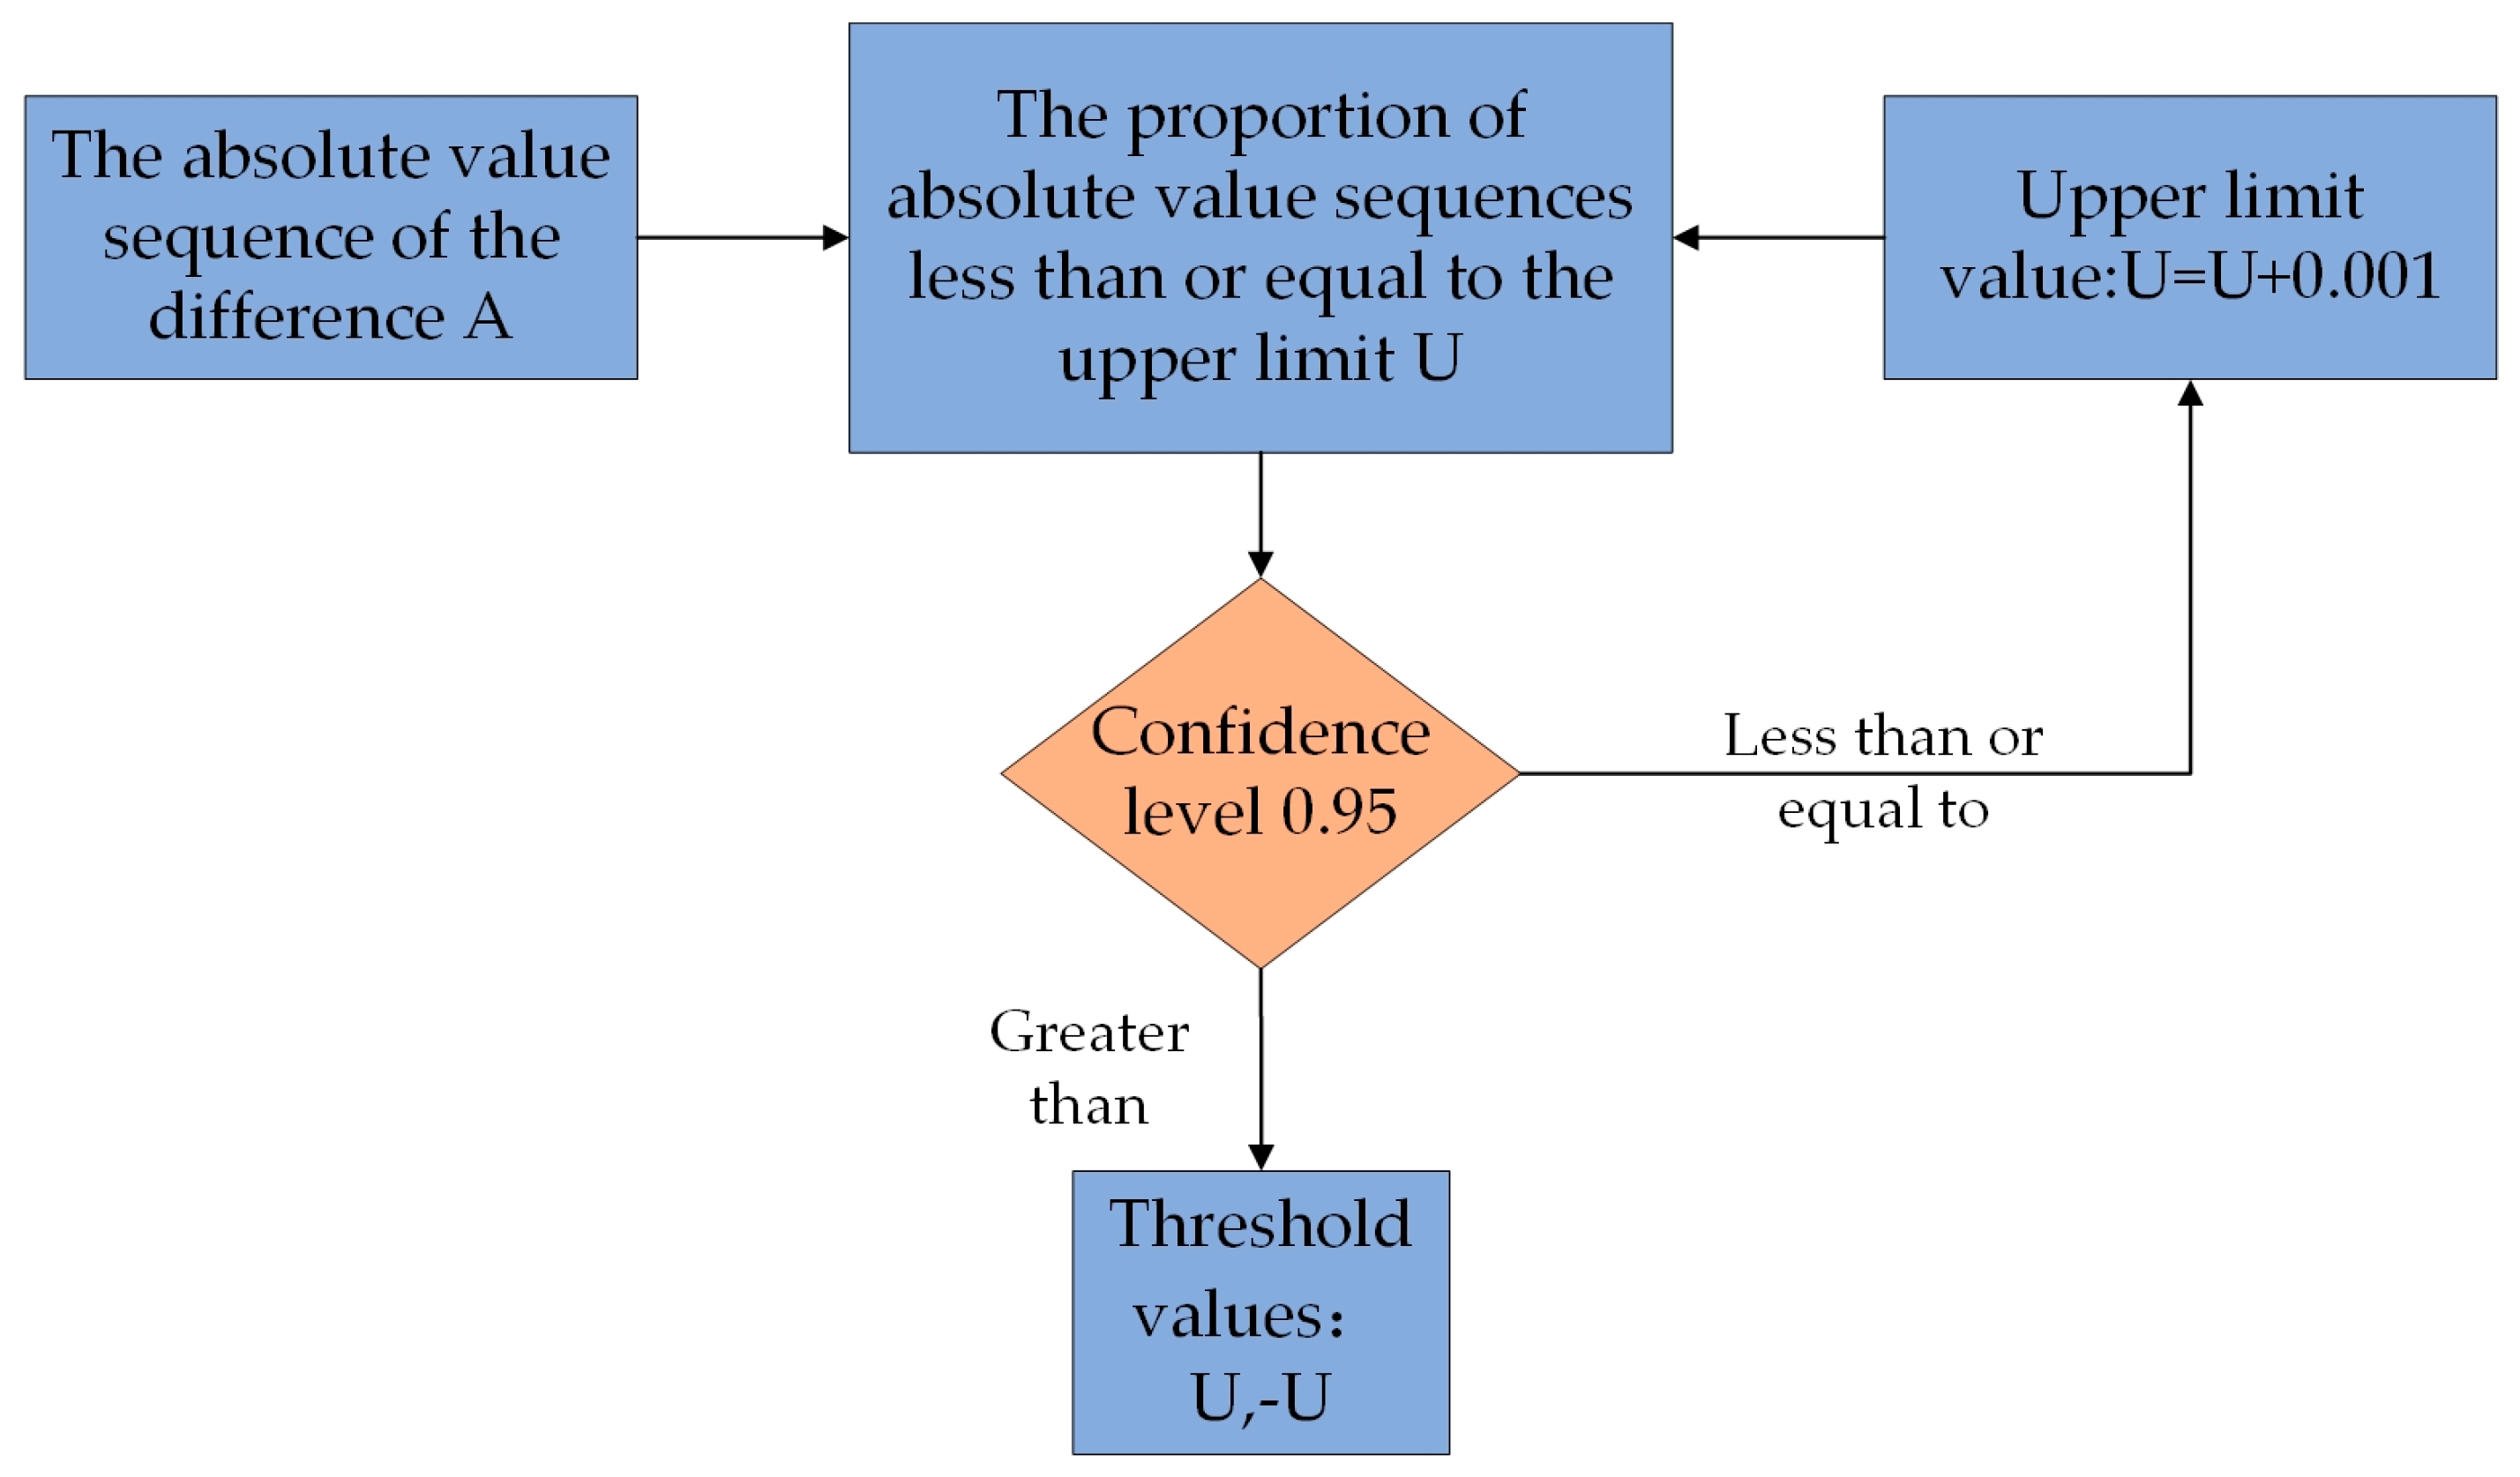
Given the intricate and diverse factors that influence changes in surface water levels, reasonable discrepancies may exist between actual monitoring data and predicted data. The CNN-BiLSTM model’s predictions and actual water level data are used as input for a DA model. This model analyzes the difference sequence between the actual and predicted water level data, extracting inherent patterns to determine warning threshold values. When the prediction model has sufficient accuracy, the difference sequence between its output prediction data and the measured data will fluctuate around zero and be roughly symmetrical about zero. Based on this rule, we propose a method for iteratively determining the alarm threshold for abnormal water level data. (1) To derive the difference sequence, the measured value sequence is subtracted from the predicted value sequence, followed by computation of the absolute value sequence, denoted as “A”, from the resulting difference value sequence; (2) Take 0 as the initial upper limit value U and choose 0.95 as the confidence interval; (3) Observe the proportion of the absolute value sequence A that is less than or equal to the upper limit value U. If the proportion is greater than the confidence interval of 0.95, then take the upper limit value as the absolute value of the warning threshold, otherwise, increase the upper limit value until the threshold absolute value is obtained. The basic structure of the DA model is shown in Figure 5.
2.3. Anomaly Detection and Early Warning
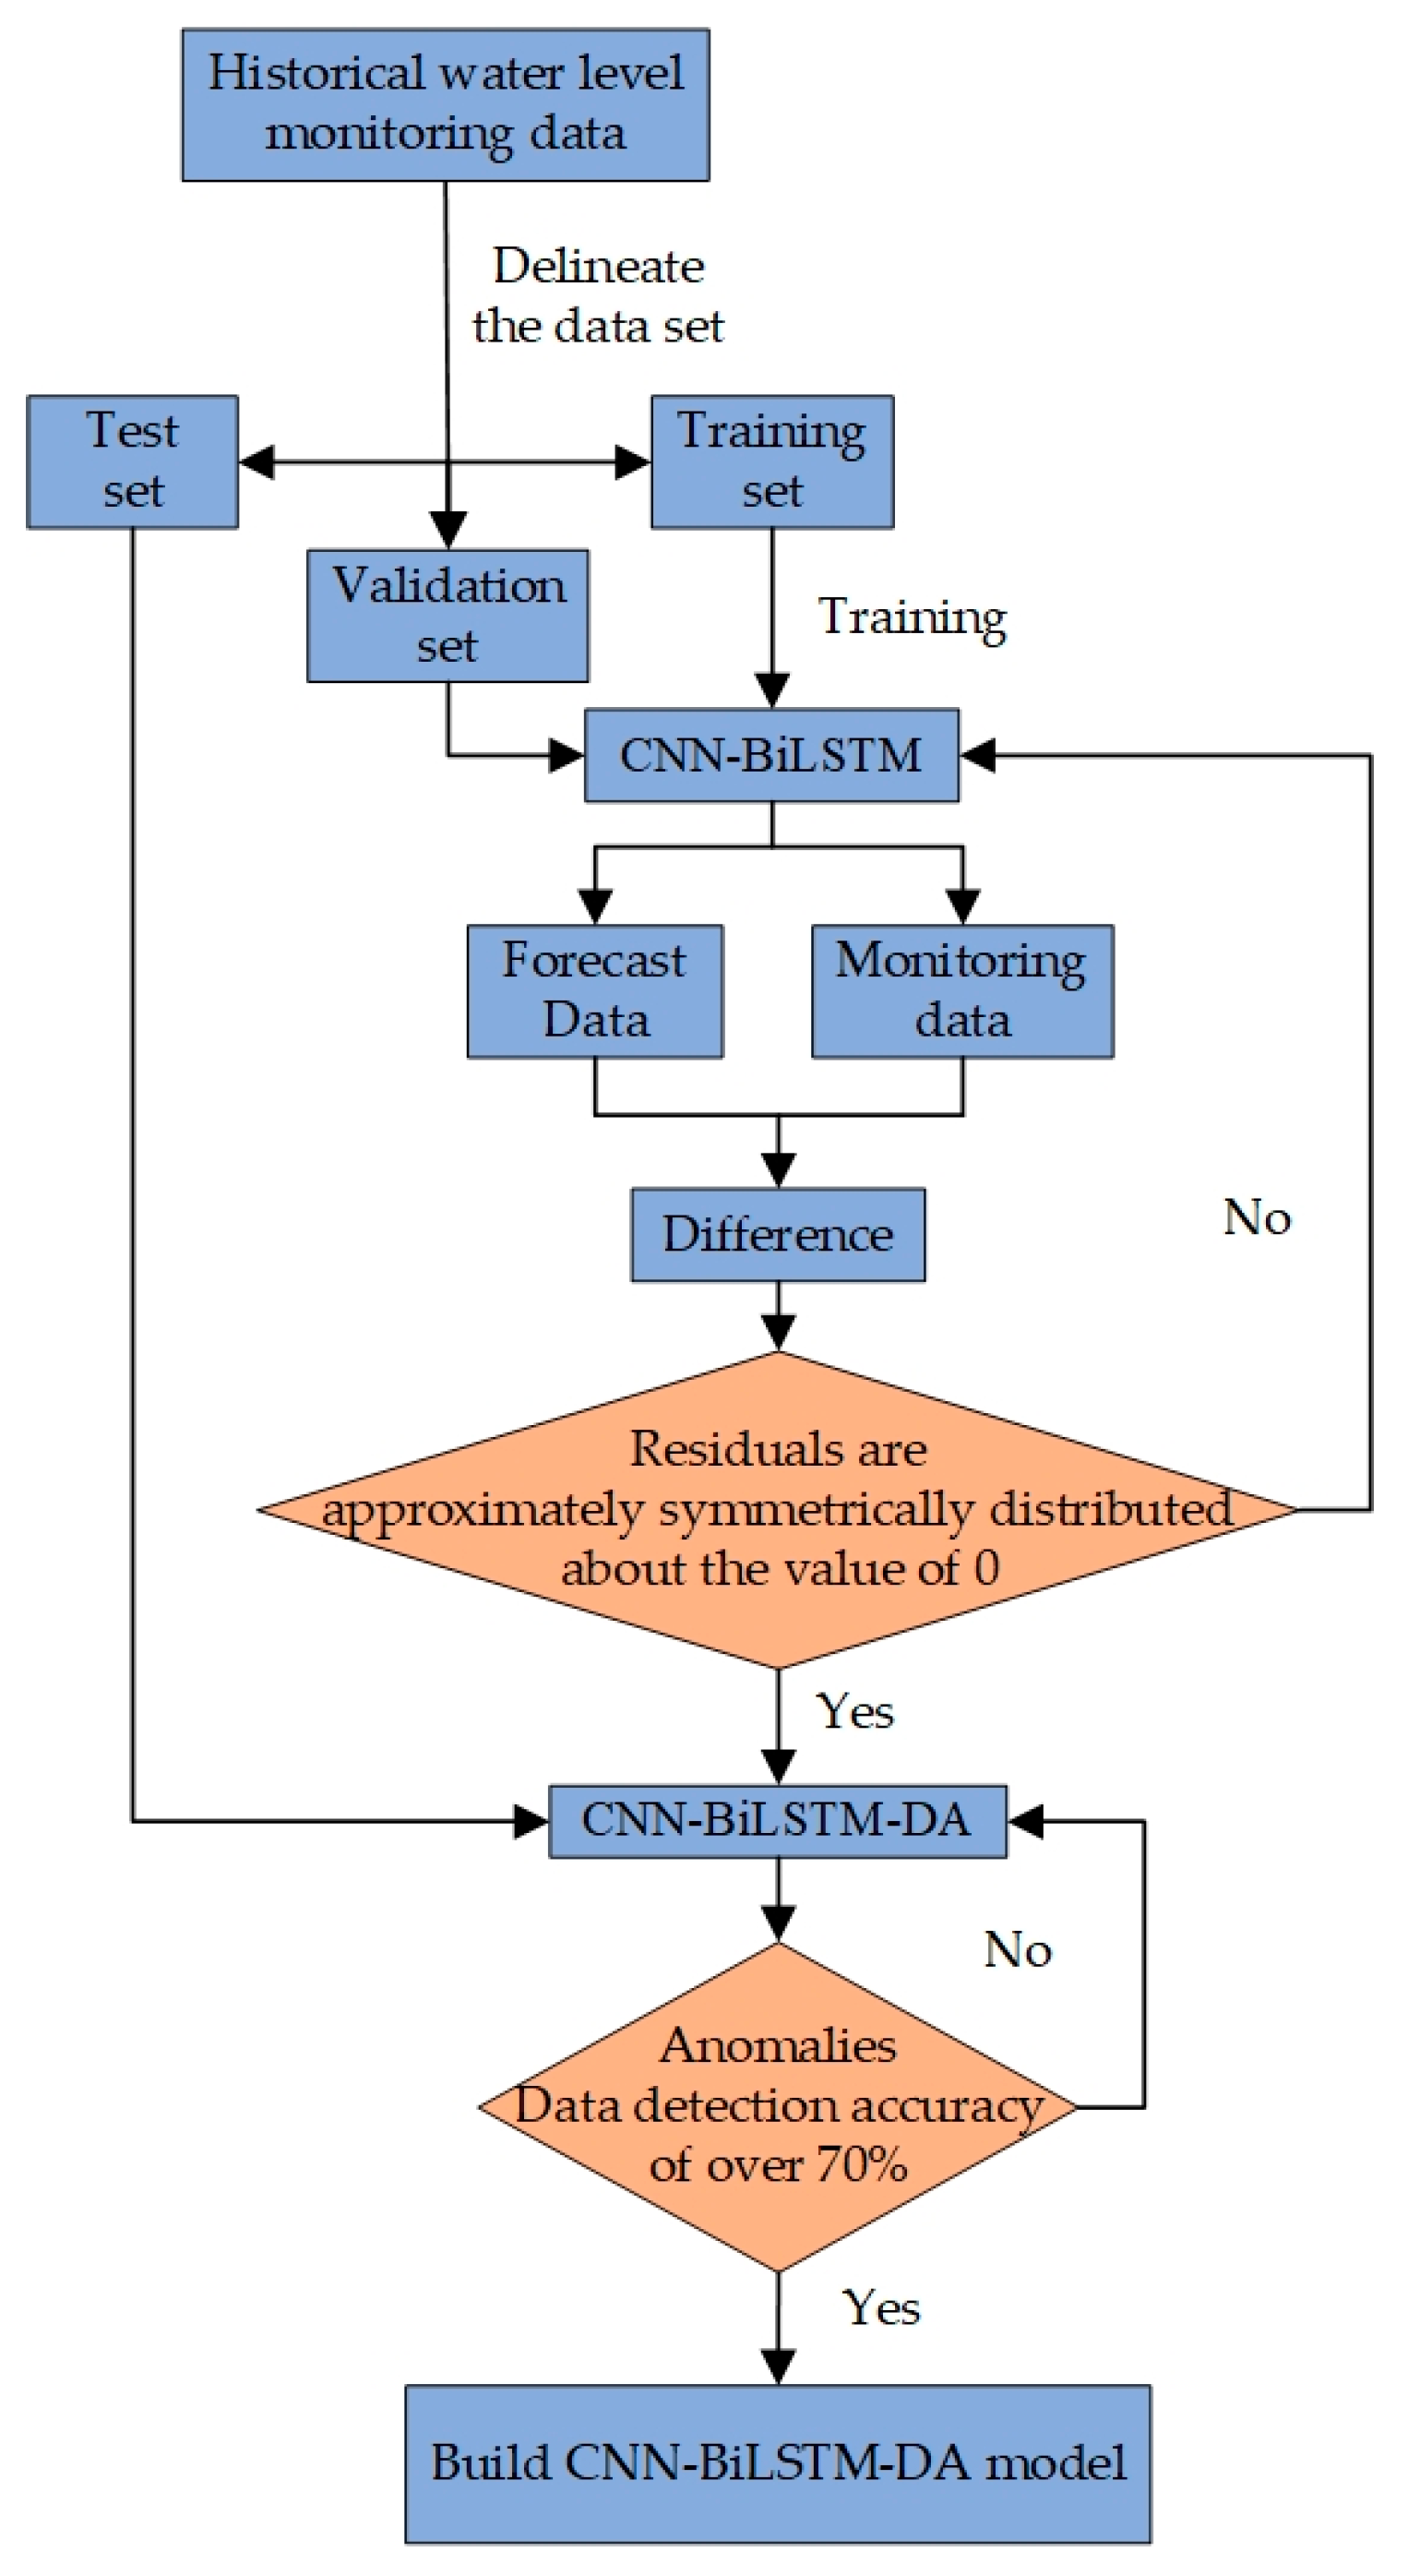
The process of alerting water level anomalies using the CNN-BiLSTM-DA model includes the following steps: data preprocessing, training the CNN-BiLSTM model, evaluating prediction performance, building the CNN-BiLSTM-DA model, validating model effectiveness, and real-time alerting, as shown in Figure 6.
2.3.1. Data Preprocessing
Firstly, the missing parts in the historical water level monitoring dataset were filled using the nearest value filling method to establish a complete preprocessed dataset. Secondly, the complete dataset was divided into training, validation, and test sets in chronological order, with a ratio of 7:2:1. Finally, the dataset was normalized using Min–Max normalization into a series of values ranging from 0 to 1.
2.3.2. Training the CNN-BiLSTM Model
The training set is input into the CNN-BiLSTM for training. The CNN framework used in this paper includes 2 one-dimensional convolutional layers and 2 pooling layersto extract feature information contained in the water level data. The pooling layer uses the max-pooling method to effectively compress the nonlinear and local features extracted by the convolutional layer and further inputs the feature vector to the BiLSTM. The BiLSTM hidden layer analyzes and learns the internal dynamic changes of the feature vectors extracted by the CNN through iterations, to extract more comprehensive global feature information. To prevent overfitting and improve the efficiency and generalization ability of the model, a dropout layer is added after the BiLSTM hidden layer. The number of iterations is set to 12,500 times, and the Adam neural network optimizer is used for parameter optimization. The CNN-BiLSTM prediction model is trained on the training set data, and the prediction effect of the model is verified using the validation set, and the predicted water level dataset is output [22].
2.3.3. Evaluating Prediction Performance
This paper selects Mean Absolute Error (MAE), Mean Absolute Percentage Error (MAPE), Mean Absolute Deviation (MAD), and Root Mean Square Error (RMSE) as evaluation metrics for the accuracy of water level prediction models [23,24]. Specifically, MAE is calculated as the average absolute difference between predicted and actual values, with smaller values indicating better prediction performance. MAPE ranges between 0 and positive infinity, with 0 indicating perfect prediction and larger values indicating greater prediction errors. MAD represents the average absolute difference between predicted and actual values, with smaller values indicating more minor prediction errors and better model performance, while RMSE represents the square root of the average squared prediction error, with smaller values indicating better prediction accuracy. The calculation formulae of the evaluation metrics are presented as follows:
In the formulae: and represent the actual monitoring value and predicted value at the time , while and represent the mean of the actual monitoring sequence and predicted sequence, respectively. is the total number of samples.
2.3.4. Building the CNN-BiLSTM-DA Model
The water level monitoring data, as time series that reflects precipitation changes in real-time, possess strong periodicity and autocorrelation and contain certain spatial features. Considering BiLSTM’s ability to process time series information and capture data’s temporal correlation, CNN’s capacity to extract spatial features of the data, and DA’s ability to calculate reasonable differences between measured water level data and predicted data, this paper employs a CNN-BiLSTM model to forecast water levels. Additionally, it combines the DA model to analyze the reasonable differences between the actual monitored water level data and the predicted water level data, constructing a CNN-BiLSTM-DA model for water level anomaly warnings and flood disaster warning in plain areas.
Using the predictions from the CNN-BiLSTM model and actual water level data as input for the DA model and calculating the difference between actual and predicted water level monitoring data, a residual frequency distribution histogram was plotted using Origin software to verify if the residual sequence is symmetrically distributed around zero. If so, a DA model was constructed to determine the alarm threshold for abnormal water level data using this model. Otherwise, the model parameters were reset, and the model structure was modified and refined for retraining until validation was successful.
2.3.5. Validating Model Effectiveness
Existing historical data were used to verify whether the abnormal water level data range and water level abnormal alarm threshold obtained are consistent with the actual historical situation. If the determined abnormal data match the actual situation, it proves the feasibility of the model and can be used to determine future abnormal water level data. Otherwise, the confidence interval of the DA model should be changed, and the water level abnormal data threshold should be re-determined.
2.3.6. Real-Time Alerting
To determine whether there is a risk of flooding, real-time data from water level monitoring stations were compared to predictions generated by a CNN-BiLSTM model. By calculating the difference between the two sets of data and comparing this value to a predetermined threshold for anomalous water levels, it is possible to determine whether the current data are within the expected range of normality or if there is a risk of flooding. If the difference between the real-time data and the model’s predictions does not exceed the threshold, then the data are considered to be safe. However, if the difference exceeds the threshold, then a flood warning is triggered.
3. Results
3.1. Evaluation of the Prediction Effect of CNN-BiLSTM Model
When performing water level prediction using the CNN-BiLSTM model, we employ 12 historical data as independent variables to learn their temporal features and make a prediction for the next data. However, such time series prediction models are susceptible to the autocorrelation effect within the time series, leading to a lag phenomenon where the current moment’s predicted data are used as the predicted value for the next moment, resulting in a significant deviation between the predicted and actual values. To avoid unfavorable impacts of this phenomenon, this study utilized the difference between the water level monitoring value of the present moment and the predicted water level value of the next moment as input data for difference analysis in the DA model. After completing the water level prediction using the CNN-BiLSTM model, we evaluated the accuracy of its prediction results. The evaluation indicators for each dataset are shown in Table 2.
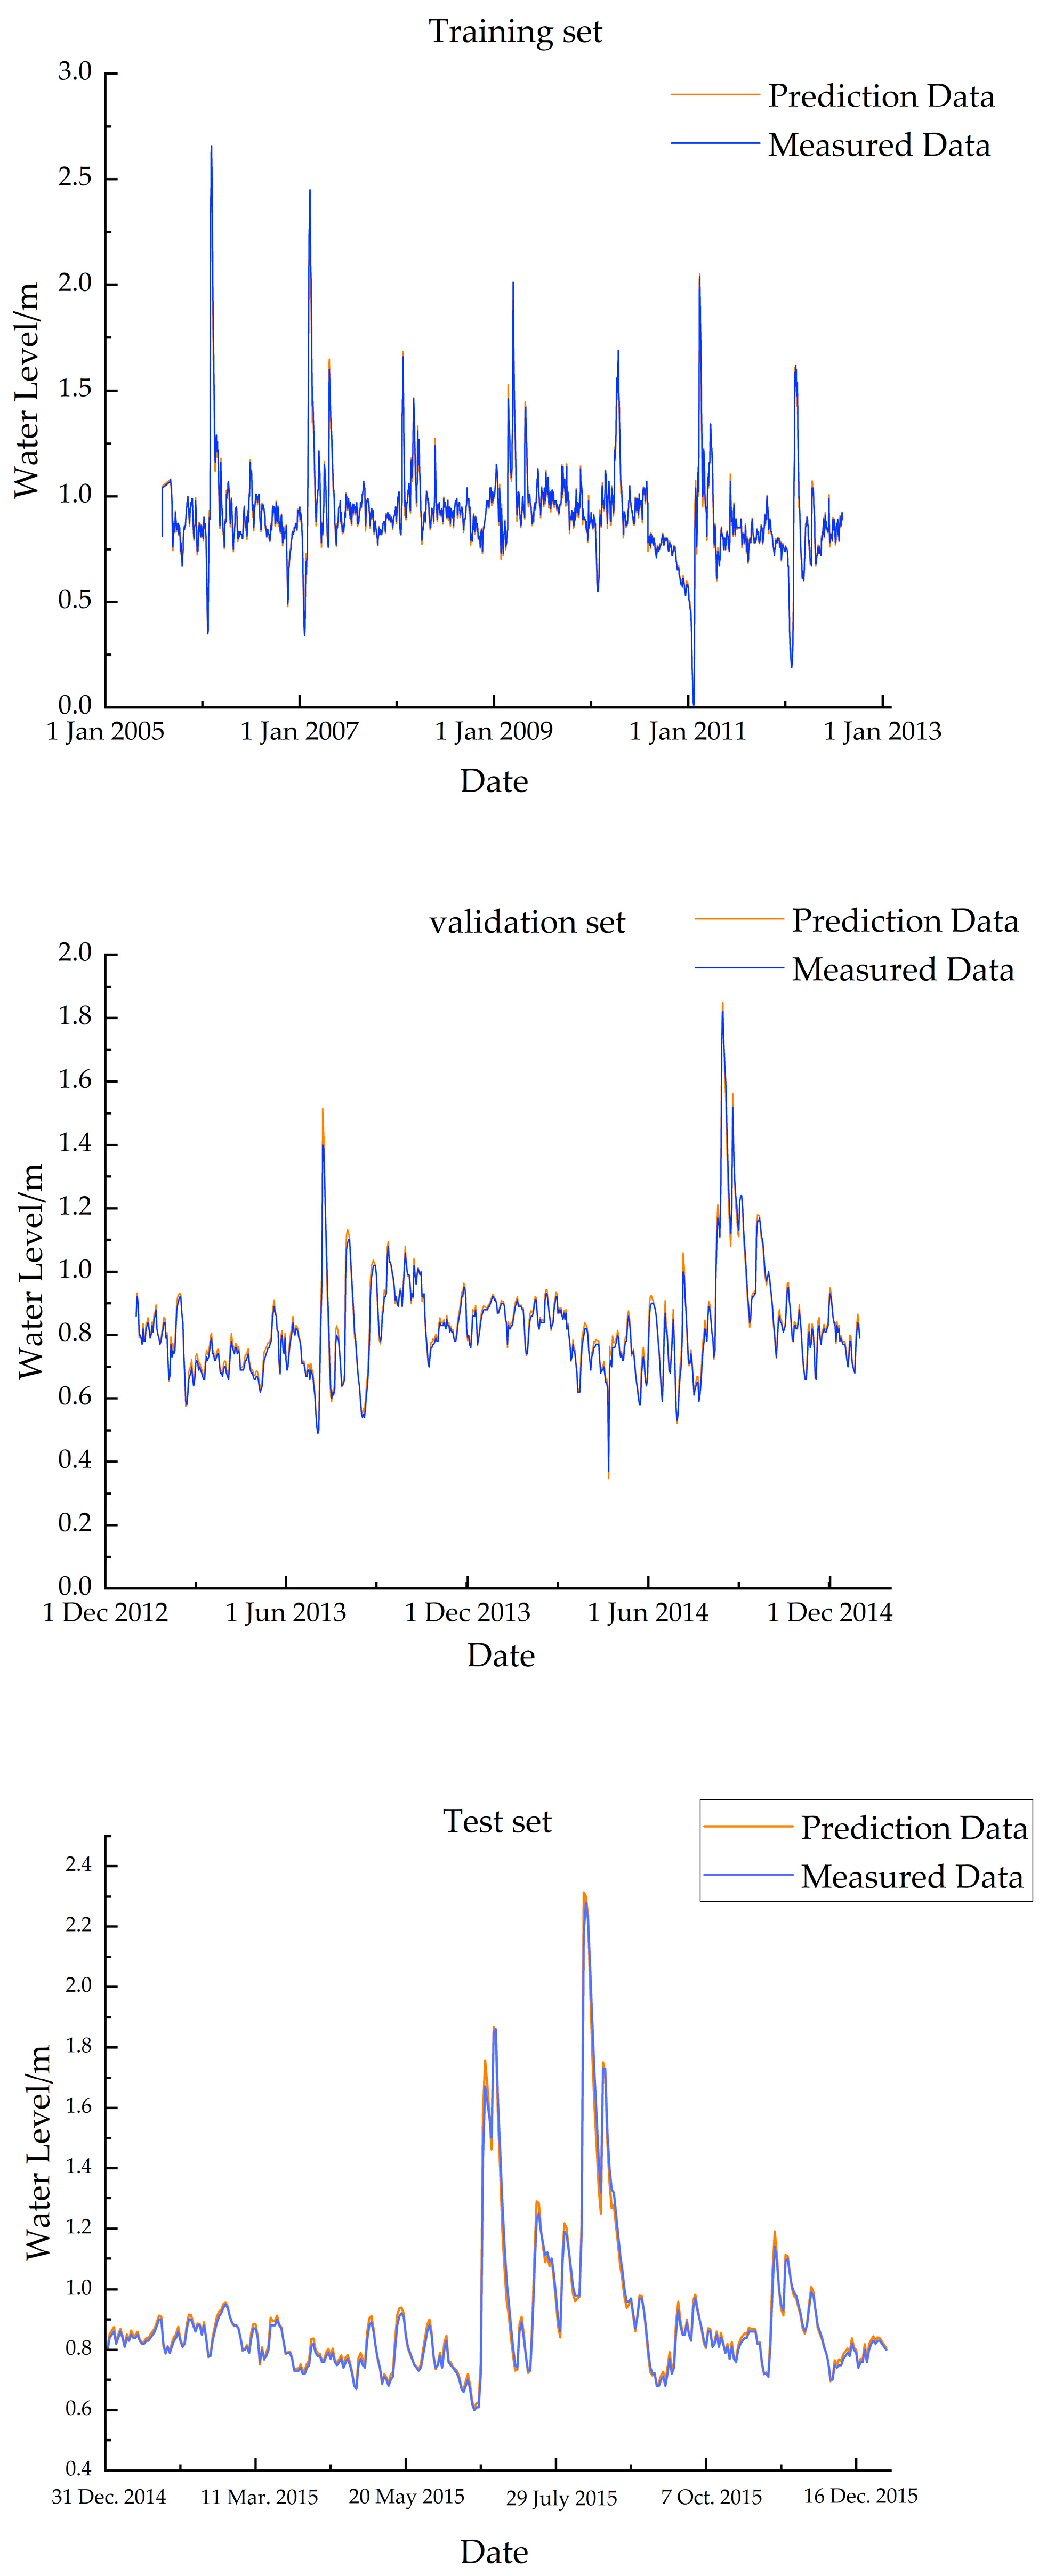
As shown in Table 2, which presents the accuracy evaluation indicator values of the CNN-BiLSTM model, the MAE values for the three datasets are much smaller than the range of the monitored water level data. The MAPE values for each dataset are less than 5%, indicating that the accuracy of the CNN-BiLSTM model prediction can reach more than 95%; and the MAD and RMSE values are both significantly lower than 0.1, indicating that the prediction error is small and reflecting the high accuracy of the model. The line graphs comparing the measured and predicted data sequences for each of the training, validation, and test sets show a high degree of fit, as shown in Figure 7.
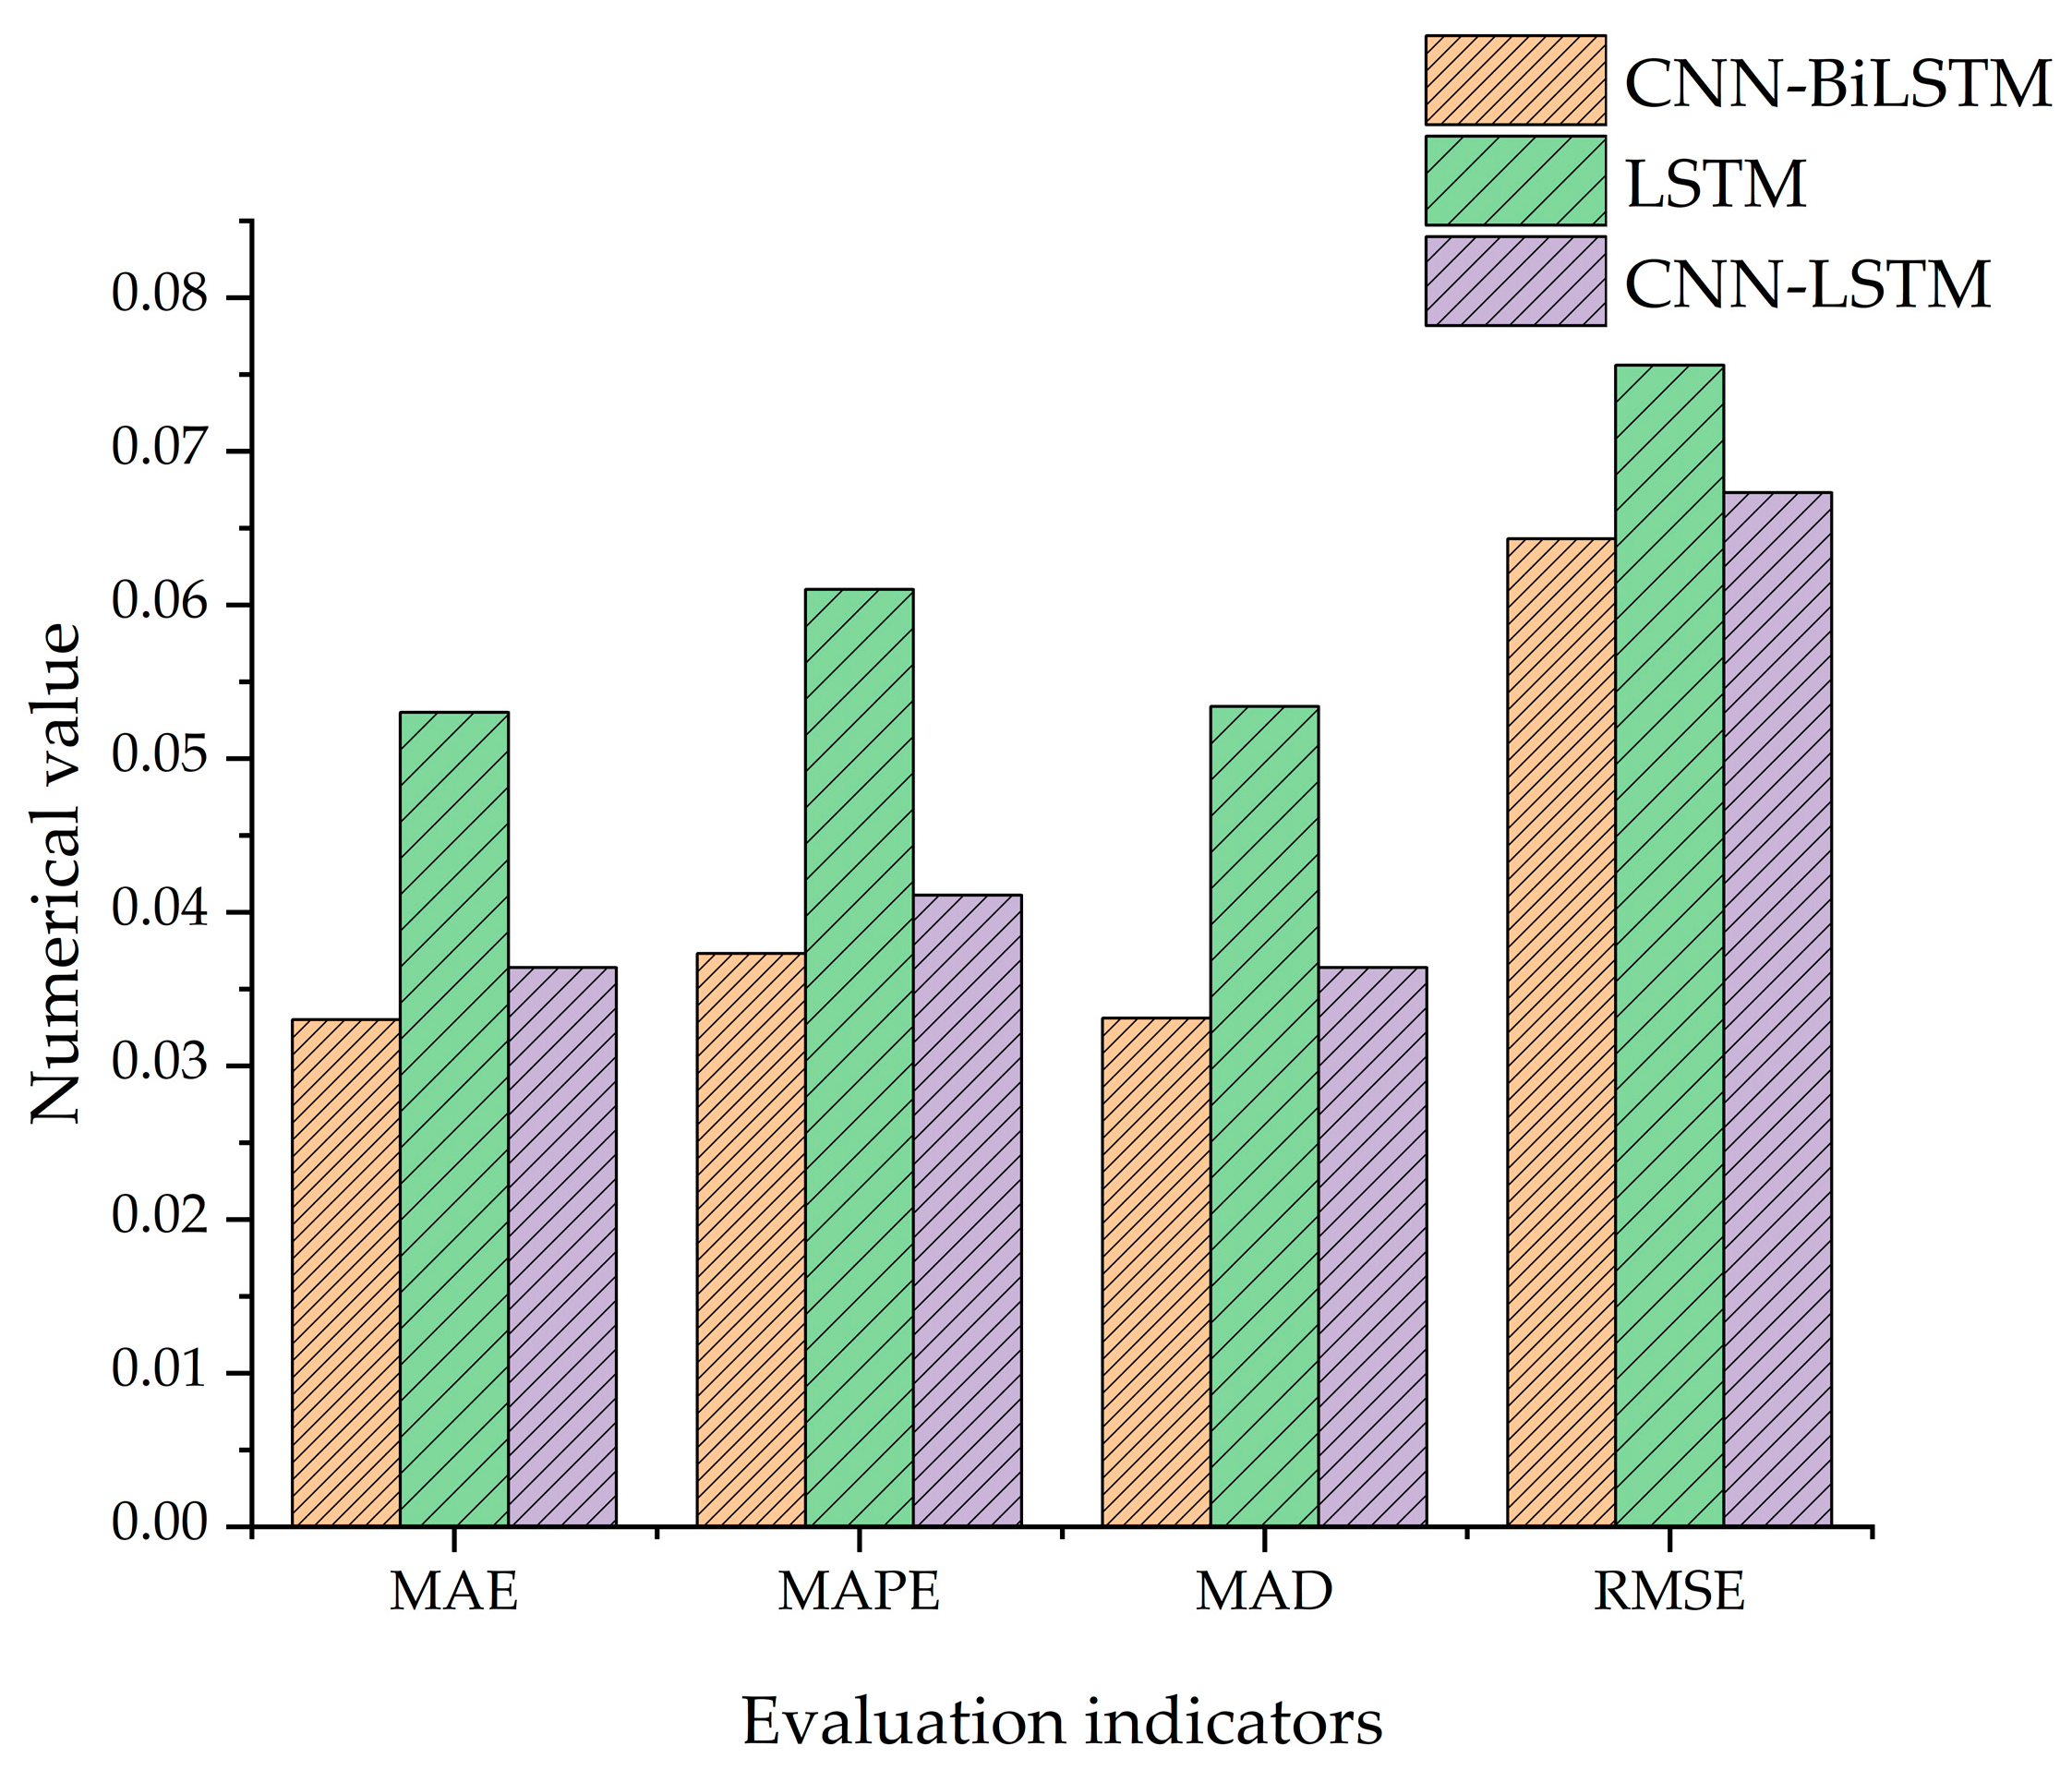
To further verify the effectiveness and superiority of using the CNN-BiLSTM model for water level prediction, this study compared it with the LSTM model [25] and the CNN-LSTM model [26], using the model evaluation indicators of the validation set for comparison. The comparison bar chart of the evaluation indicators for each model is shown in Figure 8. The accuracy evaluations of the three models are compared in Table 3. From Table 3, it can be seen that the MAE, MAPE, MAD, and RMSE values for the CNN-LSTM model were 31.32%, 32.62%, 31.84%, and 10.98% smaller than those for the LSTM model, respectively, indicating that CNN can extract spatial characteristics from water level data and enhance the model’s prediction accuracy. The corresponding MAE, MAPE, MAD, and RMSE values for the CNN-BiLSTM model were smaller than those for LSTM and CNN-LSTM models, and compared with the LSTM model, the values of MAE, MAPE, MAD, and RMSE were reduced by 38.06%, 38.81%, 31.76%, and 14.87%, respectively. Compared with the CNN-LSTM model, the values of MAE, MAPE, MAD, and RMSE were reduced by 9.36%, 9.18%, 9.17%, and 4.50%, respectively. These results demonstrate the effectiveness and superiority of the CNN-BiLSTM model in the field of water level prediction.
3.2. Determination of Threshold Values
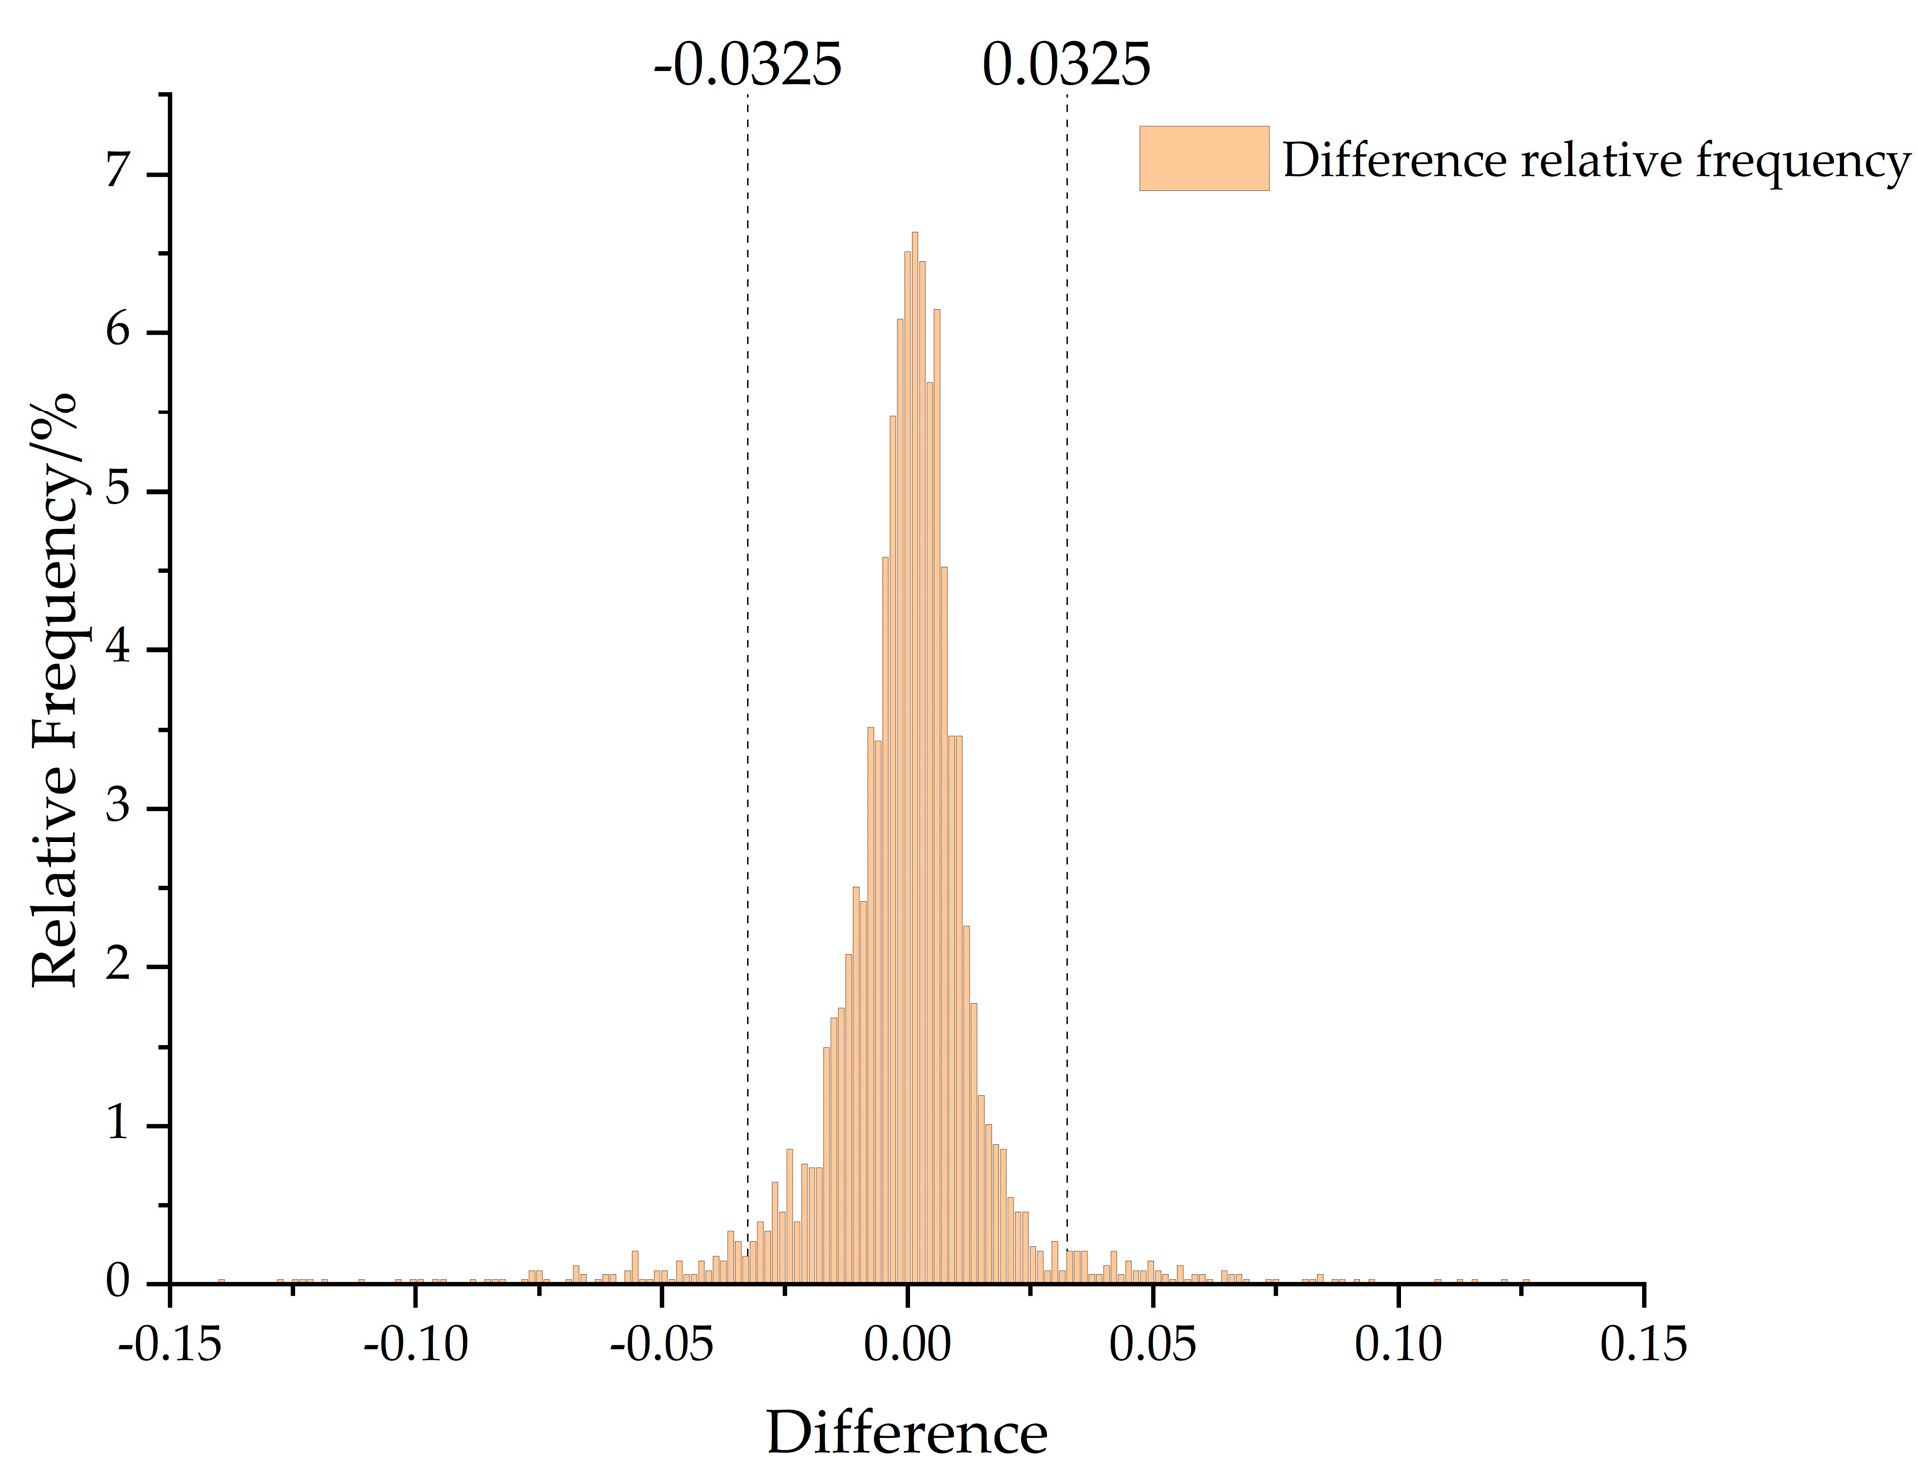
We calculated the difference series between the predicted and measured values for all datasets and selected the training and validation parts to plot the frequency histograms of the difference distribution using Origin software. We also determined the warning thresholds as −0.0325 and 0.0325 by the DA model, as shown in Figure 9. As can be seen from Figure 9, most of the differences are distributed near zero, and the overall distribution is roughly symmetrical about zero.
3.3. Flood Warning Verification
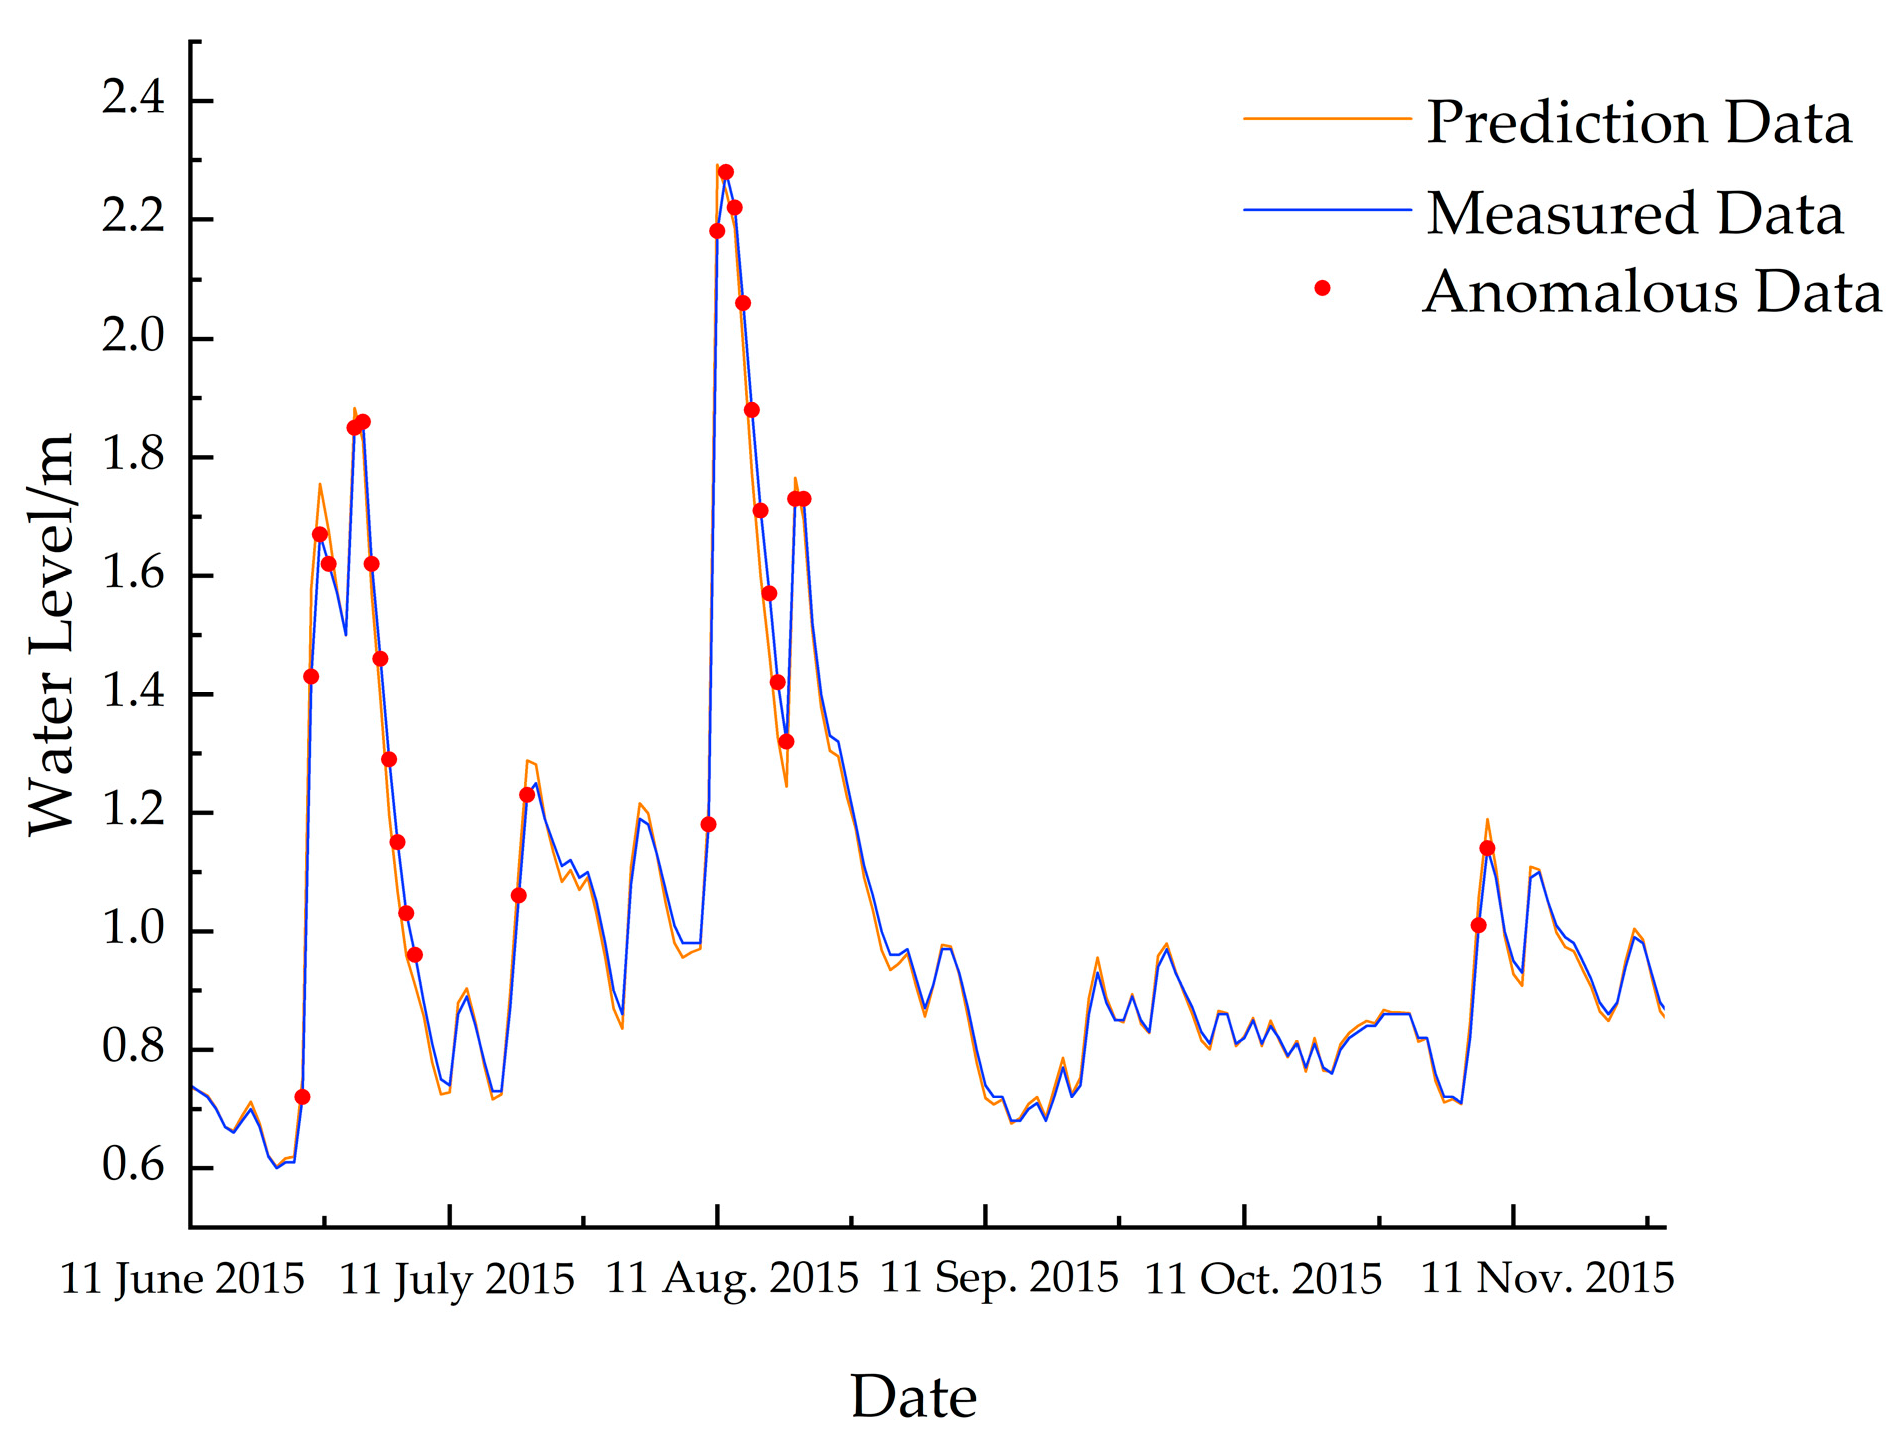
Based on the identified threshold for abnormal water level data, 28 abnormal data points were selected from the test set, as shown in Figure 10. Comparing the obtained abnormal points with the historical flood data in the investigation report on flood disasters in Yancheng City, it was found that 24 of them were flood occurrence points and 4 were false alarms. The accuracy of the CNN-BiLSTM-DA model for flood warnings reached 85.71%, and there was no missed reporting. This demonstrates the feasibility and accuracy of applying the CNN-BiLSTM-DA model to the screening of abnormal water level data and flood warnings.
4. Discussion
In order to effectively predict the occurrence of floods, improve the ability to prevent and mitigate floods, and reduce property and life losses caused by disasters, the present study proposes a method based on time series prediction models for water level forecasting and analysis of difference sequences to determine the methods of water level anomaly alarm and flood warning threshold. This method possesses high warning accuracy and enriches and expands the research ideas and methods for flood disaster warning. The proposed method mainly consists of two parts: the CNN-BiLSTM model and the DA model. (1) The accurate prediction of water levels by the CNN-BiLSTM model is an essential component of this method for accurate flood warnings. By combining the high efficiency of CNN in extracting time series spatial features with BiLSTM networks’ ability to fully exploit historical and future information, the CNN-BiLSTM model achieves accurate prediction of water level data sequences. The evaluation results of the prediction performance show that the MAE values output by the model are significantly smaller than the range of water level monitoring data; the MAPE values are all less than 5%, indicating an accuracy of over 95%. Additionally, the MAD and RMSE values are both significantly less than 0.1, demonstrating small prediction errors and reflecting high accuracy of the model. By comparing the prediction results of the LSTM model and CNN-LSTM model, the effectiveness and superiority of the CNN-BiLSTM model for water level prediction are verified; therefore, it can provide reliable data evidence for further determining thresholds. (2) The DA model is crucial in determining the warning threshold. It calculates the difference sequence between water level monitoring data and water level prediction data, selects 0.95 as the confidence interval, and determines the warning threshold by continuously adjusting the upper limit value U. The validated threshold values are −0.0325 and 0.0325. The CNN-BiLSTM-DA model achieves an accuracy of 85.71% in flood warnings without any missed warning events, demonstrating the scientific, emergency, and accuracy of this method in solving flood disaster warning problems. This method can provide technical reference for flood warning and urban flood control and disaster reduction to a certain extent.
5. Conclusions
(1) By using one-dimensional CNN to fully exploit the spatial features of water level data, feature vectors are generated and input into BiLSTM, which overcomes the drawbacks of single BiLSTM models and improves the stability and reliability of water level prediction models. Compared with LSTM, the prediction accuracy evaluation indicators MAE, MAPE, MAD, and RMSE are reduced by 38.06%, 38.81%, 31.76%, and 14.87%, respectively. Compared with CNN-LSTM, the prediction accuracy evaluation indicators MAE, MAPE, MAD, and RMSE are reduced by 9.36%, 9.18%, 9.17%, and 4.50%, respectively. This indicates that CNN-BiLSTM has higher prediction accuracy and better superiority. (2) Through the DA model, the difference between the actual monitoring data and the predicted data of the water level is calculated to determine the threshold for flood warning. Using Yancheng City in the China Plain as an example, we compared the anomaly points with historical flood data and found that the warning accuracy rate reached 85.71% without missing any warnings. This proves that the proposed CNN-BiLSTM-DA model has some scientific, emergency, and accuracy aspects in flood warnings in plain areas.
Author Contributions
Conceptualization, C.H. and L.Z.; methodology, C.H. and S.D.; software, C.H., Y.G. and Y.L.; validation, L.Z., Y.G. and C.H.; formal analysis, C.H.; investigation, C.H.; resources, L.Z.; data curation, C.H.; writing—original draft preparation, C.H.; writing—review and editing, C.H.; visualization, C.H. and L.Z.; supervision, S.D.; project administration, C.H. and L.Z.; funding acquisition, L.Z. All authors have read and agreed to the published version of the manuscript.
Funding
This research was funded by the National Natural Science Foundation of China, grant number 52239009.
Data Availability Statement
The research data used to support the findings of this study have not been made available because the data are confidential for the project.
Acknowledgments
At the completion of this paper, I would like to express my sincere gratitude to all the people who have supported, assisted, and encouraged me throughout the process. Firstly, I would like to thank my supervisor, Lanting Zhou, and my fellow students Yunzhu Gong, Siyuan Deng, and Yufei Li. Their valuable advice and guidance have greatly contributed to my research. The strict requirements and enthusiastic supervision of my supervisor have enabled me to achieve significant progress in my study, which in turn has helped me to explore the problems more deeply and improve my abilities in writing this paper. Secondly, I would like to express my gratitude to Wen Nan Yuan. Throughout the process of completing this paper, she has provided me with spiritual support and encouragement, which has enabled me to persevere. Her company has made me feel immensely warm and happy. I would like to once again express my gratitude to all those who have supported me. Their support and assistance have been crucial factors in the completion of this paper, and I will always be grateful to them.
Conflicts of Interest
The authors declare no conflict of interest.
References
- Ji, X.-Y.; Yao, Z.-P.; Yang, K.; Chen, Y.-N.; Wang, Z.; An, X.-G. Water quality alert with automatic monitoring data based on MSLSTM-DA model. China Environ. Sci. 2022, 42, 1877–1883. (In Chinese) [Google Scholar]
- Liu, B.Q.; Jing, R.Y.; Li, N.N.; Yang, G.H. Research and application of dynamic water level early warning mechanism of diversion channel. Water Resour. Hydropower Eng. 2022, 53, 166–173. (In Chinese) [Google Scholar]
- Zhang, M. Prediction of Water Level at Urban Waterlogging Point Based on Artificial Neural Network. Master’s Dissertation, South China University of Technology, Guangzhou, China, 20 May 2019. (In Chinese). [Google Scholar]
- Yihong, Z. Study on Prediction and Early Warning of Urban Flood Waterlogging Process Based on Deep Learning. Master’s Thesis, Zhengzhou University, Zhengzhou, China, 18 June 2021. (In Chinese). [Google Scholar]
- Sui, Z.; Li, Z. Simulation of Urban Rainstorm Waterlogging and Pipeline Network Drainage Process Based on SWMM. J. Phys. Conf. Ser. 2019, 1213, 052061. [Google Scholar]
- Hou, Q.Q. Study on Technology of City Flood Warning Based on SWAT and SWMM Model. Master’s Thesis, Hangzhou Normal University, Hangzhou, China, 26 May 2017. (In Chinese). [Google Scholar]
- Xu, Z.M.; Shi, K.; Xu, L.B. Infoworks RS in Flood Warning; China Academic Journal Electronic Publishing House: Beijing, China, 2012; pp. 33–35. (In Chinese) [Google Scholar]
- Nie, Q.M.; Luo, B.; Fang, Z. Research on rainstorm monitoring and early warning system of the Yangtze River tunnel based on internet of things. Water Wastewater Eng. 2016, 52, 126–130. (In Chinese) [Google Scholar]
- Xiong, H. Numerical Simulation on Urban Flood Based on MIKE FLOOD: A Case Study in Yinchuan City, Ningxia Province. Master’s Thesis, Changsha University of Science & Technology, Changsha, China, 30 May 2016. (In Chinese). [Google Scholar]
- Sandu, M.-A.; Virsta, A. Applicability of MIKE SHE to Simulate Hydrology in Argesel River Catchment. Agric. Agric. Sci. Procedia 2015, 6, 517–524. [Google Scholar] [CrossRef]
- Charalampos, D.; Pantazis, G.; Dimitris, P. Ecosystem approach to water resources management using the MIKE 11 modeling system in the Strymonas River and Lake Kerkini. J. Environ. Manag. 2012, 94, 132–143. [Google Scholar]
- Alley, W.M.; Smith, P.E. Distributed Routing Rainfall-Runoff Model, 2nd ed.; US Geological Survey: Reston, VA, USA, 1982. [Google Scholar]
- Warwick, J.J.; Wilson, J.S. Estimating Uncertainty of Stormwater Runoff Computations. J. Water Resour. Plan. Manag. 1990, 116, 187–204. [Google Scholar] [CrossRef]
- Ganggang, Z. The Research of Weiriver Runoff Prediction Systembased on Machine Learning. Master’s Thesis, Xi’an University of Technology, Xi’an, China, 14 June 2017. [Google Scholar]
- Sun, Y.; Tang, W.; Wang, C.; Li, Y. A river water level interval prediction method based on CNN-Seq2seq. J. Zhejiang Univ. Technol. 2022, 50, 381–392. (In Chinese) [Google Scholar]
- Liu, W.; Yin, F. A Reservoir Water Level Prediction Method Based on LSTM Model. Radio Eng. 2022, 52, 83–87. (In Chinese) [Google Scholar]
- Mounce, S.R.; Shepherd, W.; Sailor, G.; Shucksmith, J.; Saul, A. Predicting combined sewer overflowschamber depth using artificial neural networks with rainfall radar data. Water Sci. Technol. 2014, 69, 1326–1333. [Google Scholar] [CrossRef] [PubMed]
- Chiang, Y.M.; Chang, L.C.; Tsai, M.J.; Wang, Y.F.; Chang, F.J. Dynamic neural networks for real-timewater level predictions of sewerage systems-covering gauged and ungauged sites. Hydrol. Earth Syst. Sci. 2010, 14, 2317–2345. [Google Scholar]
- Hu, C.-C.; Zhou, L.-T.; Deng, S.-Y. Evaluation of urban waterlogging control based on cloud model. J. Yangtze River Sci. Res. Inst. 2023. in press (In Chinese) [Google Scholar]
- Han, Y.; Wang, L.; Wei, P.; Li, Z.; Zhou, W. VMD-CNN-GRU hybrid prediction model of reservoir water level. J. Nanjing Univ. Inf. Sci. Technol. Nat. Sci. Ed. 2022. in press (In Chinese) [Google Scholar]
- Hochreiter, S.; Schmidhuber, J. LSTM can solve hard long time lag problems. Adv. Neural Inf. Process. Syst. 1997, 9, 473–479. [Google Scholar]
- Ren, J.J.; Wei, H.H.; Zou, L.Z.; Hou, T.T.; Yuan, Y.L.; Shen, J.Q.; Wang, X.M. Ultra-short-term power load forecasting based on CNN-BiLSTM-Attention. Power Syst. Prot. Control 2022, 50, 108–115. (In Chinese) [Google Scholar]
- Narendra, K.; Kamal, K.K.; Abhishek, S. Prediction of effluent quality in ICEAS-sequential batch reactor using feedforward artificial neural network. Water Sci Technol. 2019, 80, 213–222. [Google Scholar]
- Narendra, K.; Kamal, K.K.; Abhishek, S. Artificial neural network modelling of faecal coliform removal in an intermittent cycle extended aeration system-sequential batch reactor based wastewater treatment plant. J. Water Process Eng. 2020, 37, 101477. [Google Scholar]
- Liu, Y.X.; Fan, Q.X.; Shang, Y.Z.; Fan, Q.M.; Liu, Z.W. Short-term water level prediction method for hydropower station based on LSTM neural network. Adv. Sci. Technol. Water Resources. 2019, 39, 56–60. (In Chinese) [Google Scholar]
- Rahim, B.; Taghi, A.M.; Jan, A. Coupling a hybrid CNN-LSTM deep learning model with a Boundary Corrected Maximal Overlap Discrete Wavelet Transform for multiscale Lake water level forecasting. J. Hydrol. 2021, 598, 126196. [Google Scholar]
Figure 1.
The daily water level line graph from 1 January 2005 to 31 December 2015.

Figure 2.
One-dimensional CNN basic structure diagram.

Figure 3.
LSTM basic structure diagram.

Figure 4.
BiLSTM basic structure diagram.

Figure 5.
DA basic structure diagram.

Figure 6.
Flow chart of water level data abnormal detection with CNN-BiLSTM-DA model.

Figure 7.
Line graph comparing measured and predicted values of water levels for various datasets.

Figure 8.
Comparison chart of evaluation indicators.

Figure 9.
Frequency histogram of residual distribution of training set and test set.

Figure 10.
Water level anomaly data distribution chart.


Table 1.
Model Dataset.
| Model Dataset | Duration | Number (pcs) |
|---|---|---|
| Training set | 1 January 2006 to 31 December 2012 | 2557 |
| Validation set | 1 January 2013 to 31 December 2014 | 730 |
| Test set | 1 January 2015 to 31 December 2015 | 365 |
Table 2.
Accuracy evaluation table of CNN-BiLSTM model.
| Index | MAE | MAPE | ||||
|---|---|---|---|---|---|---|
| Datasets | Training Set | Validation Set | Test Set | Training Set | Validation Set | Test Set |
| 0.0260 | 0.0330 | 0.0364 | 0.0353 | 0.0373 | 0.0365 | |
| Index | MAD | RMSE | ||||
| Datasets | Training Set | Validation Set | Test Set | Training Set | Validation Set | Test Set |
| 0.0259 | 0.0331 | 0.0375 | 0.0476 | 0.0643 | 0.0856 | |
Table 3.
Accuracy comparison table of three models.
| Models | CNN-BiLSTM | LSTM | CNN-LSTM | |
|---|---|---|---|---|
| Accuracy Index | ||||
| MAE | 0.0330 | 0.0530 | 0.0364 | |
| MAPE | 0.0373 | 0.0610 | 0.0411 | |
| MAD | 0.0331 | 0.0534 | 0.0364 | |
| RMSE | 0.0643 | 0.0756 | 0.0673 | |
Disclaimer/Publisher’s Note: The statements, opinions and data contained in all publications are solely those of the individual author(s) and contributor(s) and not of MDPI and/or the editor(s). MDPI and/or the editor(s) disclaim responsibility for any injury to people or property resulting from any ideas, methods, instructions or products referred to in the content. |
© 2023 by the authors. Licensee MDPI, Basel, Switzerland. This article is an open access article distributed under the terms and conditions of the Creative Commons Attribution (CC BY) license (https://creativecommons.org/licenses/by/4.0/).
Share and Cite
MDPI and ACS Style
Hu, C.; Zhou, L.; Gong, Y.; Li, Y.; Deng, S. Research on Water Level Anomaly Data Alarm Based on CNN-BiLSTM-DA Model. Water 2023, 15, 1659. https://doi.org/10.3390/w15091659
AMA Style
Hu C, Zhou L, Gong Y, Li Y, Deng S. Research on Water Level Anomaly Data Alarm Based on CNN-BiLSTM-DA Model. Water. 2023; 15(9):1659. https://doi.org/10.3390/w15091659
Chicago/Turabian StyleHu, Cancan, Lanting Zhou, Yunzhu Gong, Yufei Li, and Siyuan Deng. 2023. "Research on Water Level Anomaly Data Alarm Based on CNN-BiLSTM-DA Model" Water 15, no. 9: 1659. https://doi.org/10.3390/w15091659
Note that from the first issue of 2016, this journal uses article numbers instead of page numbers. See further details here.