

Mapping Irrigated Areas in China Using a Synergy Approach

1
Wageningen Economic Research, Wageningen University & Research, Droevendaalsesteeg 4, 6708 PB Wageningen, The Netherlands
2
International Institute for Applied Systems Analysis, Schloßpl. 1, 2361 Laxenburg, Austria
*
Author to whom correspondence should be addressed.
Water 2023, 15(9), 1666; https://doi.org/10.3390/w15091666
Submission received: 13 March 2023
/
Revised: 7 April 2023
/
Accepted: 22 April 2023
/
Published: 25 April 2023
(This article belongs to the Section Water, Agriculture and Aquaculture)
Abstract
:In China, irrigation plays a fundamental role in food production, which is hampered by water security, rising population and climate change. To ensure food security and formulate agricultural and irrigation policies, decision-makers need detailed grid-level information on the location of irrigated areas. Unfortunately, this information is not easily available as national irrigation maps are frequently outdated and often have a coarse spatial resolution. In this paper, we present new irrigation maps for China at a spatial resolution of 30 arc seconds (~1 × 1 km) that cover the period between 2005 and 2015. The maps were created using a synergy approach, which combines and integrates regional and global irrigation maps, cropland maps and subnational statistics. The maps were calibrated to subnational irrigation statistics and validated using an external dataset with geocoded information on the location of irrigated areas. The maps show, at the detailed spatial level, how much irrigation expanded over the period of 2005–2015. The proposed synergy approach is flexible and can easily be applied to create irrigation maps for other regions.
1. Introduction
Ensuring global food security is one of the most pressing challenges mankind currently faces [1]. According to the World Bank, 8.9% of the global population had insufficient food consumption to provide the dietary energy levels required for maintaining a healthy life in 2019 [2]. It is estimated that between 2010 and 2050, global food demand will increase between 35–56% [3]. Approximately 40% of global crop production takes place on irrigated land, accounting for about 20% of global farmland [4]. Irrigation plays a fundamental role in increasing future food production as it results in higher crop yield and provides a measure of coping with climate change [5,6].
To ensure food security and formulate agricultural and irrigation policies, decision-makers need to have information on which areas are currently irrigated and which are not. In addition, detailed irrigation maps are used as a key input in agricultural and land use models to assess future trajectories of agricultural development and food production in the context of climate change [7]. Several global irrigation maps have been produced [4,8,9,10,11,12,13], of which the Digital Global Map of Irrigation Areas (GMIA) provided by the FAO [12] is the most used. However, most of these maps are outdated as they represent irrigated areas for the period 2000–2010 (exceptions are [4,13]). Moreover, existing maps are based on different sources and produced using various methods (e.g., remote sensing, machine learning or statistical downscaling approaches), sometimes resulting in contradicting output and maps that are not consistent with available national irrigation national statistics [14].
The aim of this paper is to explore the use of a synergy approach to creating irrigation maps. The synergy approach was pioneered by [15] to explore the agreement between global land cover products for carbon cycle modeling. Ref. [16] extended the synergy method to map the location of cropland in sub-Saharan Africa. In this approach, different global and regional irrigation products are combined into one consistent map, which results in improved accuracy of the final product [17]. In this paper, we used the synergy approach to combine two regional and three global irrigation maps, and two global cropland maps, to create a new irrigation map for China that covers the periods 2005 and 2015.
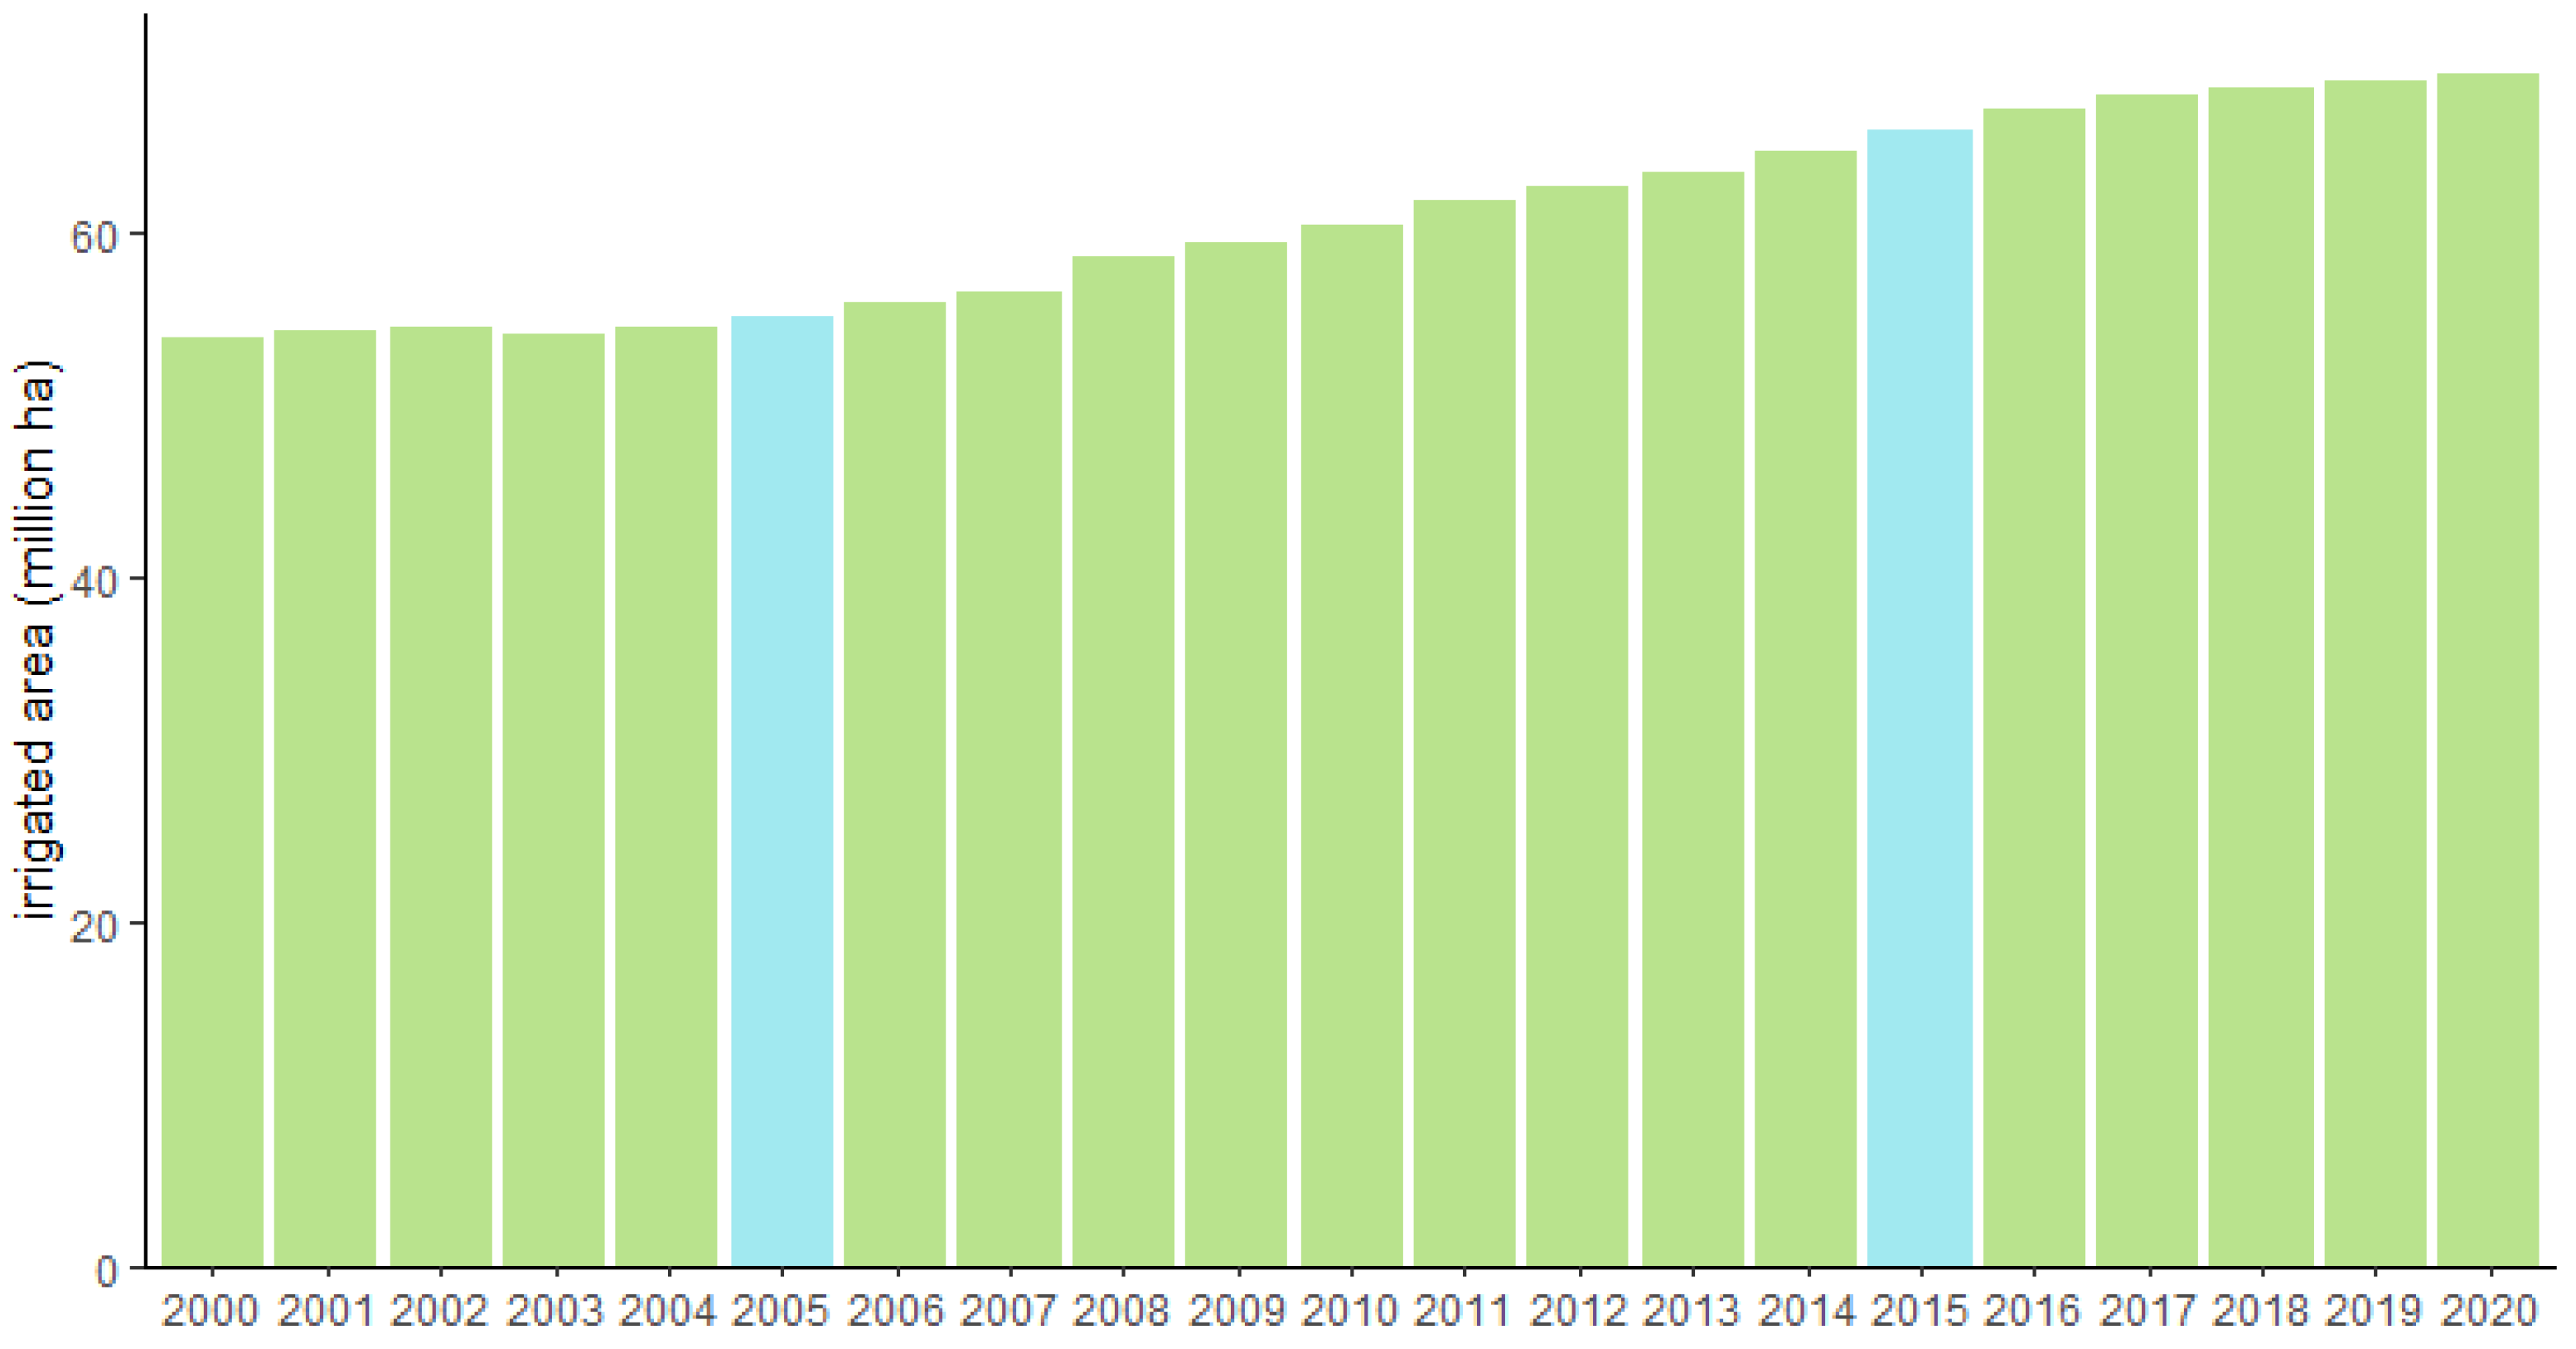
In China, irrigated land accounts for 70% of food production [5]. The availability of water is a key determinant of national food security. China’s annual water availability is approximately one-quarter of the global average [18]. With an increasing water demand in combination with climate change, there is a concern that a water deficit in agricultural production will occur in the future [18]. The pressure on water resources and the rising food demand have stimulated the Chinese government to invest more in irrigation [18]. Several projects, such as the 12th Five-Year Plan for Water Resources Reform and Development (2011–2015), have been launched [19] to increase the delivery efficiency of irrigation systems and to result in water savings [20]. Consequently, irrigated areas have expanded by around 10.9 million ha, from 55 million ha in 2005 to 66 million ha in 2015 [21].
Figure 1 depicts the development of effective irrigated land areas (EIA) in China in the last two decades. EIA is the irrigated area of cropland (e.g., annual food crops); it does not consider irrigated pastures and forests.
The paper is organized as follows. In Section 2, we introduce the proposed methodology and data. Section 3 presents the synergy irrigation maps for 2005 and 2015, including an assessment of the agreement between the various input products and validation using ground truth data. Section 4 presents the discussion, divided into sections covering policy implications, strengths and weaknesses and opportunities for future research. Finally, in Section 5, we draw conclusions.
2. Materials and Methods
2.1. Synergy Approach to Creating Irrigation Maps
In the synergy approach, all available spatial data is integrated into a single product which results in improved accuracy [17]. The approach has been mainly used to create new regional and global cropland products. There are two different methods to create a synergy map: the regression method and the agreement-scoring method. In the first method, a relationship between the input datasets and sample points is established. Subsequently, the cropland percentage in regions without samples is predicted. It requires training samples to estimate the model parameters at each location [17]. This method has been applied to multiple products, for instance, in a risk map of land degradation in Uzbekistan [22] and in an irrigation map for India [23].
In the agreement-scoring method, input datasets are ranked based on their level of accuracy. Subsequently, all input maps are overlayed to derive the mean (or maximum) cropland area per grid cell and allocate scores to measure the (dis)agreement at the grid cell level [16]. This methodology was applied in [16] to map cropland areas in sub-Saharan Africa. It was also applied by [17] to create a global synergy cropland map.
A study [24] compared the two methods. They concluded that agreement scoring is an adequate method for producing a global or regional large-scale map [24]. Additionally, they showed that the regression method is sensitive to the number of training samples. For China, there is little ground truth data available on irrigation [25]. Hence, we decided to use the agreement-scoring method to create a synergy irrigation map for China.
2.2. Data
The input products that are used in the synergy approach were obtained through a literature review in which both ‘pure’ irrigation maps, as well as cropland maps with irrigation information, were collected. Summary information is provided in Table 1. The literature review resulted in 7 input products: 2 cropland maps and 5 irrigation maps. Most of the maps were created using remote sensing techniques. Only for 1 map (CHN) was a downscaling methodology used in which images from a lower spatial resolution were converted to a higher resolution using statistical models. Likewise, only 1 irrigation map was prepared using a machine-learning approach (NAGARAJ).
The collected datasets are clustered around two time periods: 2005 (GRIPC, NAGARAJ, CHN, IAM and ESACCI) and 2015 (NAGARAJ, GIA, ZOHAIB, IAM and ESACCI). Hence, we decided to create separate synergy maps for each period. GIA was allocated to 2015 as it was created using a cropland mask for 2015 [8]. X marks for which year data is available.
2.3. Methodology
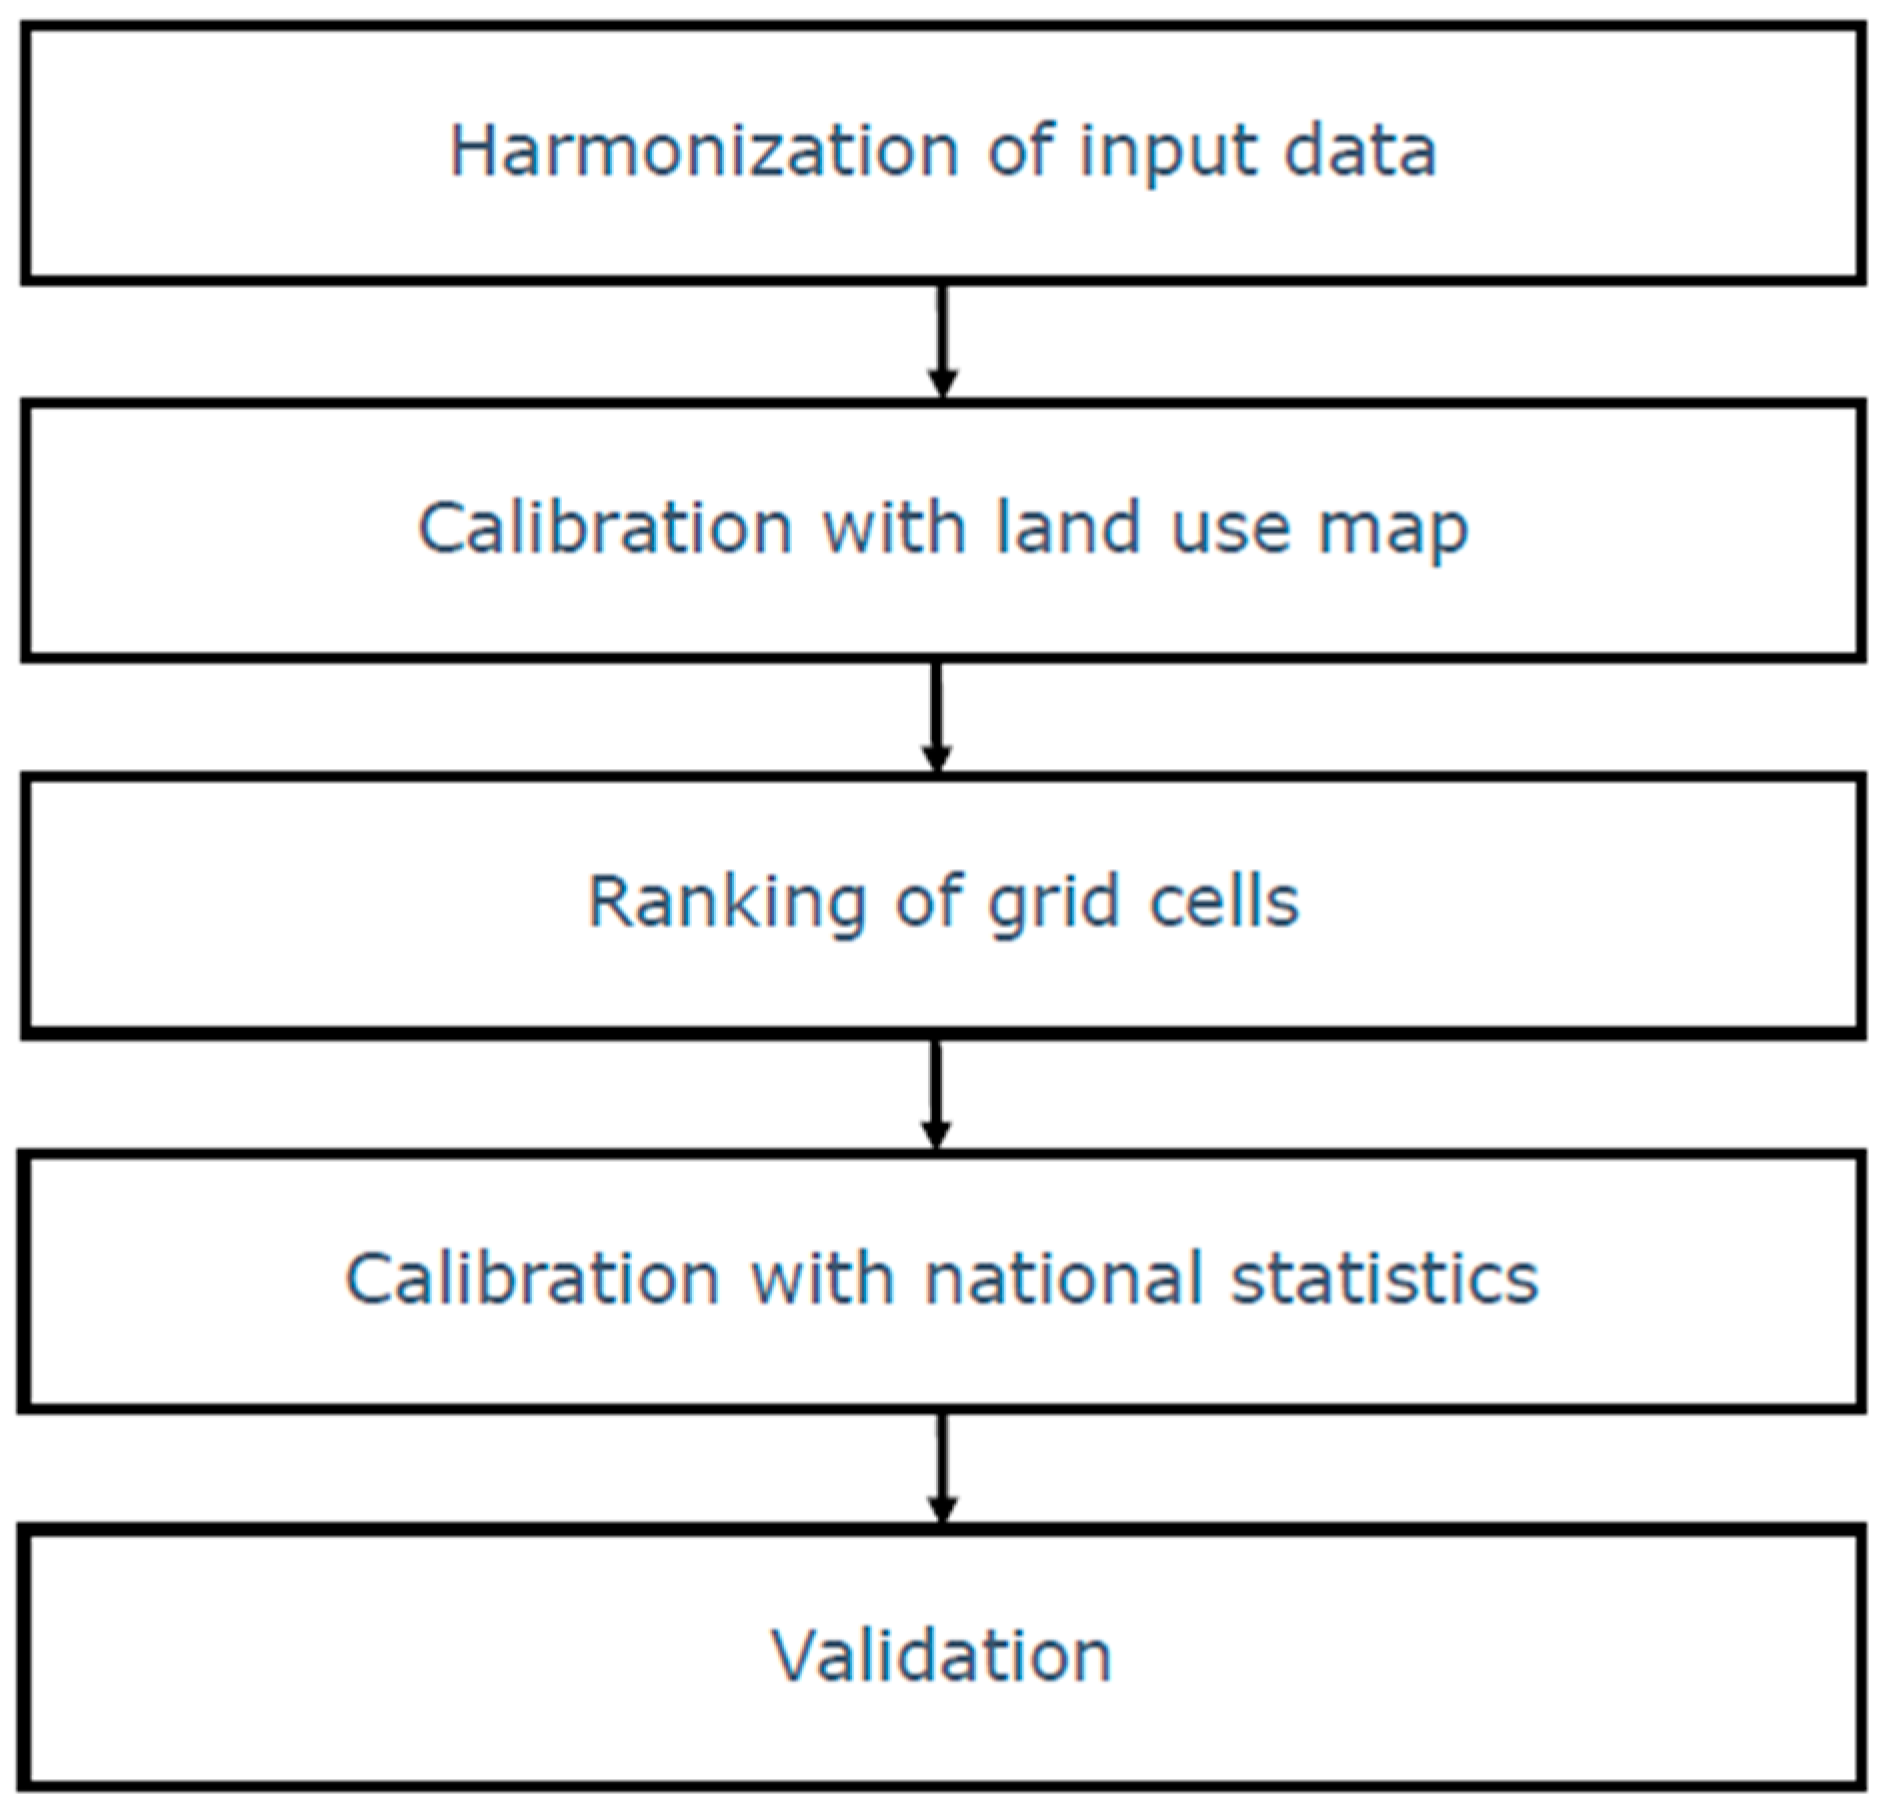
We followed the approach of [16] to create the synergy irrigation maps. As we applied the approach to developing irrigation maps instead of land use maps, we added an additional step (Figure 2), in which the irrigation maps are calibrated with a high-resolution land use map.
2.3.1. Harmonization of Input Data
In the first step, the global and regional maps that were collected for the creation of the synergy maps were harmonized. We reclassified the various irrigation and cropland classes (e.g., paddy rice and irrigated cropland) into irrigated and non-irrigated classes. Next, the maps were reprojected and resampled to the same resolution (30 arc seconds) and coordinate system (EPSG: 4326). For irrigation maps with a resolution higher than 30 arc seconds, we assume that 100% of the 30 arc seconds area is irrigated. All spatial data processing tasks were performed with R software [29], especially the tidyverse [30], sf [31] and terra [32] packages.
2.3.2. Calibration with Land Use Map
This is an additional step in comparison to the original approach by [16]. We used existing land use maps to mask the irrigated synergy map. In contrast to irrigation, there are a number of land use maps that show the location of cropland at a very high-resolution [33,34]. As the irrigated area in a grid cell is constrained by the total cropland area in the same grid cell, we used high-resolution cropland maps as a mask for the irrigated area maps.
We decided to use the ESACCI land use maps, which were also used as one of the input data sources (see Table 1) because they are the only available product that presents the location of cropland at high-resolution (300 m) for a long historical period (1992–2019) with an annual time step. As we combined irrigation maps that span the time period from 2000 to the present, we needed long-run historical time series for calibration.
We used the ESACCI maps to calculate the share of cropland in each 30 arc seconds grid cell. The harmonized irrigated area maps created in the previous step were subsequently combined with the processed ESACCI maps for the same year. If the share of cropland was larger or equal to the share of irrigated area, the data of the irrigation product was accepted. If the share of cropland was smaller than the share of irrigated area, it was set equal to the cropland share, which we regarded as the maximum potential irrigated area.
2.3.3. Ranking of Grid Cells
In the next step, a scoring table was created in which the individual irrigation maps were ranked, and the agreement between the input data was analyzed. We determined the following rules when ranking the validity and reliability of the products, prioritizing each rule in the order as stated:
- Products with a higher resolution were considered more accurate and were therefore preferred over lower-resolution maps [35];
- Regional maps were expected to better capture regional details and characteristics than global maps as their construction likely involved local experts [36];
- Products created with novel machine-learning approaches were expected to be more precise than maps produced using alternative approaches [14];
- Recent maps were considered more reliable than older maps since, in the last two decades, a substantial improvement in the resolution of Earth observations has taken place [14];
- Irrigation maps were preferred over cropland maps because the former focus on irrigation and therefore were expected to be more accurate than cropland maps.
The criteria resulted in a priority ranking of the input products, as shown in Table 2.
Using this ranking, we prepared a scoring table that indicates the agreement between the various irrigation products (Appendix A, Table A1 and Table A2). Since there were five input products per timeframe, the scoring table ranged from 1 to 32. A pixel was assigned a score of 1 if all input products agreed there was irrigation, whereas a higher score was allocated when only a subset of the input maps indicated the presence of irrigation.
2.3.4. Calibration with National Statistics
Similar to [16] and [17], we calibrated the synergy products to the national statistics on irrigated areas in China. We started by deriving data on irrigated areas for the province (adm1) and the prefecture (adm2) levels. The data was taken from the China Statistical Yearbook. For 19 out of the 31 administrative levels in China, detailed adm1 and adm2 information was available for both years. For the remaining units, we used adm1 data. Appendix B, Table A3 provides an overview of available data per year.
In the second step, we combined all irrigation input products and calculated the median and maximum irrigated area for each grid cell. Next, for each individual province/prefecture, we ranked all grid cells from low (score of 1) to high (score of 32) uncertainty and included all cells up to the level that the sum of the mean irrigated area was equal or slightly larger (i.e., two times the grid cell area) than the irrigated area according to the subnational statistics. To determine the exact cut-off between grid cells with the same score, we also used the size of the irrigated area in a grid cell as a criterion, assuming that larger values had a higher certainty than lower values.
For a few regions, the sum of the mean irrigated area was still smaller than the total irrigated area, as reported in the China Statistical Yearbook. To account for this, we used the maximum instead of the mean irrigated area when selecting grid cells.
2.3.5. Validation
Finally, we validated the synergy irrigated area map using a sample of 614 points distributed across China, which were retrieved from [26]. The samples contain the location of 262 irrigated and 352 non-irrigated sites for the year 2000, which were obtained from two sources, including a geo-coded ground truth dataset and manually labeling irrigated areas using Google Earth. We assumed that the sample also reflects the situation in 2005 and, therefore, can be used to validate the 2005 synergy irrigation map. We were not able to obtain ground truth data to validate the 2015 synergy irrigation map.
We overlayed the point samples with the 2005 ESACCI land use map, which we used as a mask to identify cropland in 2005, resulting in a sample of 472 points. Next, we developed a confusion matrix that provided a summary of the match between the ground truth sample and the synergy irrigation map [37]. With the confusion matrix, the overall accuracy of the product was calculated.
3. Results
3.1. Synergy Irrigated Area Maps
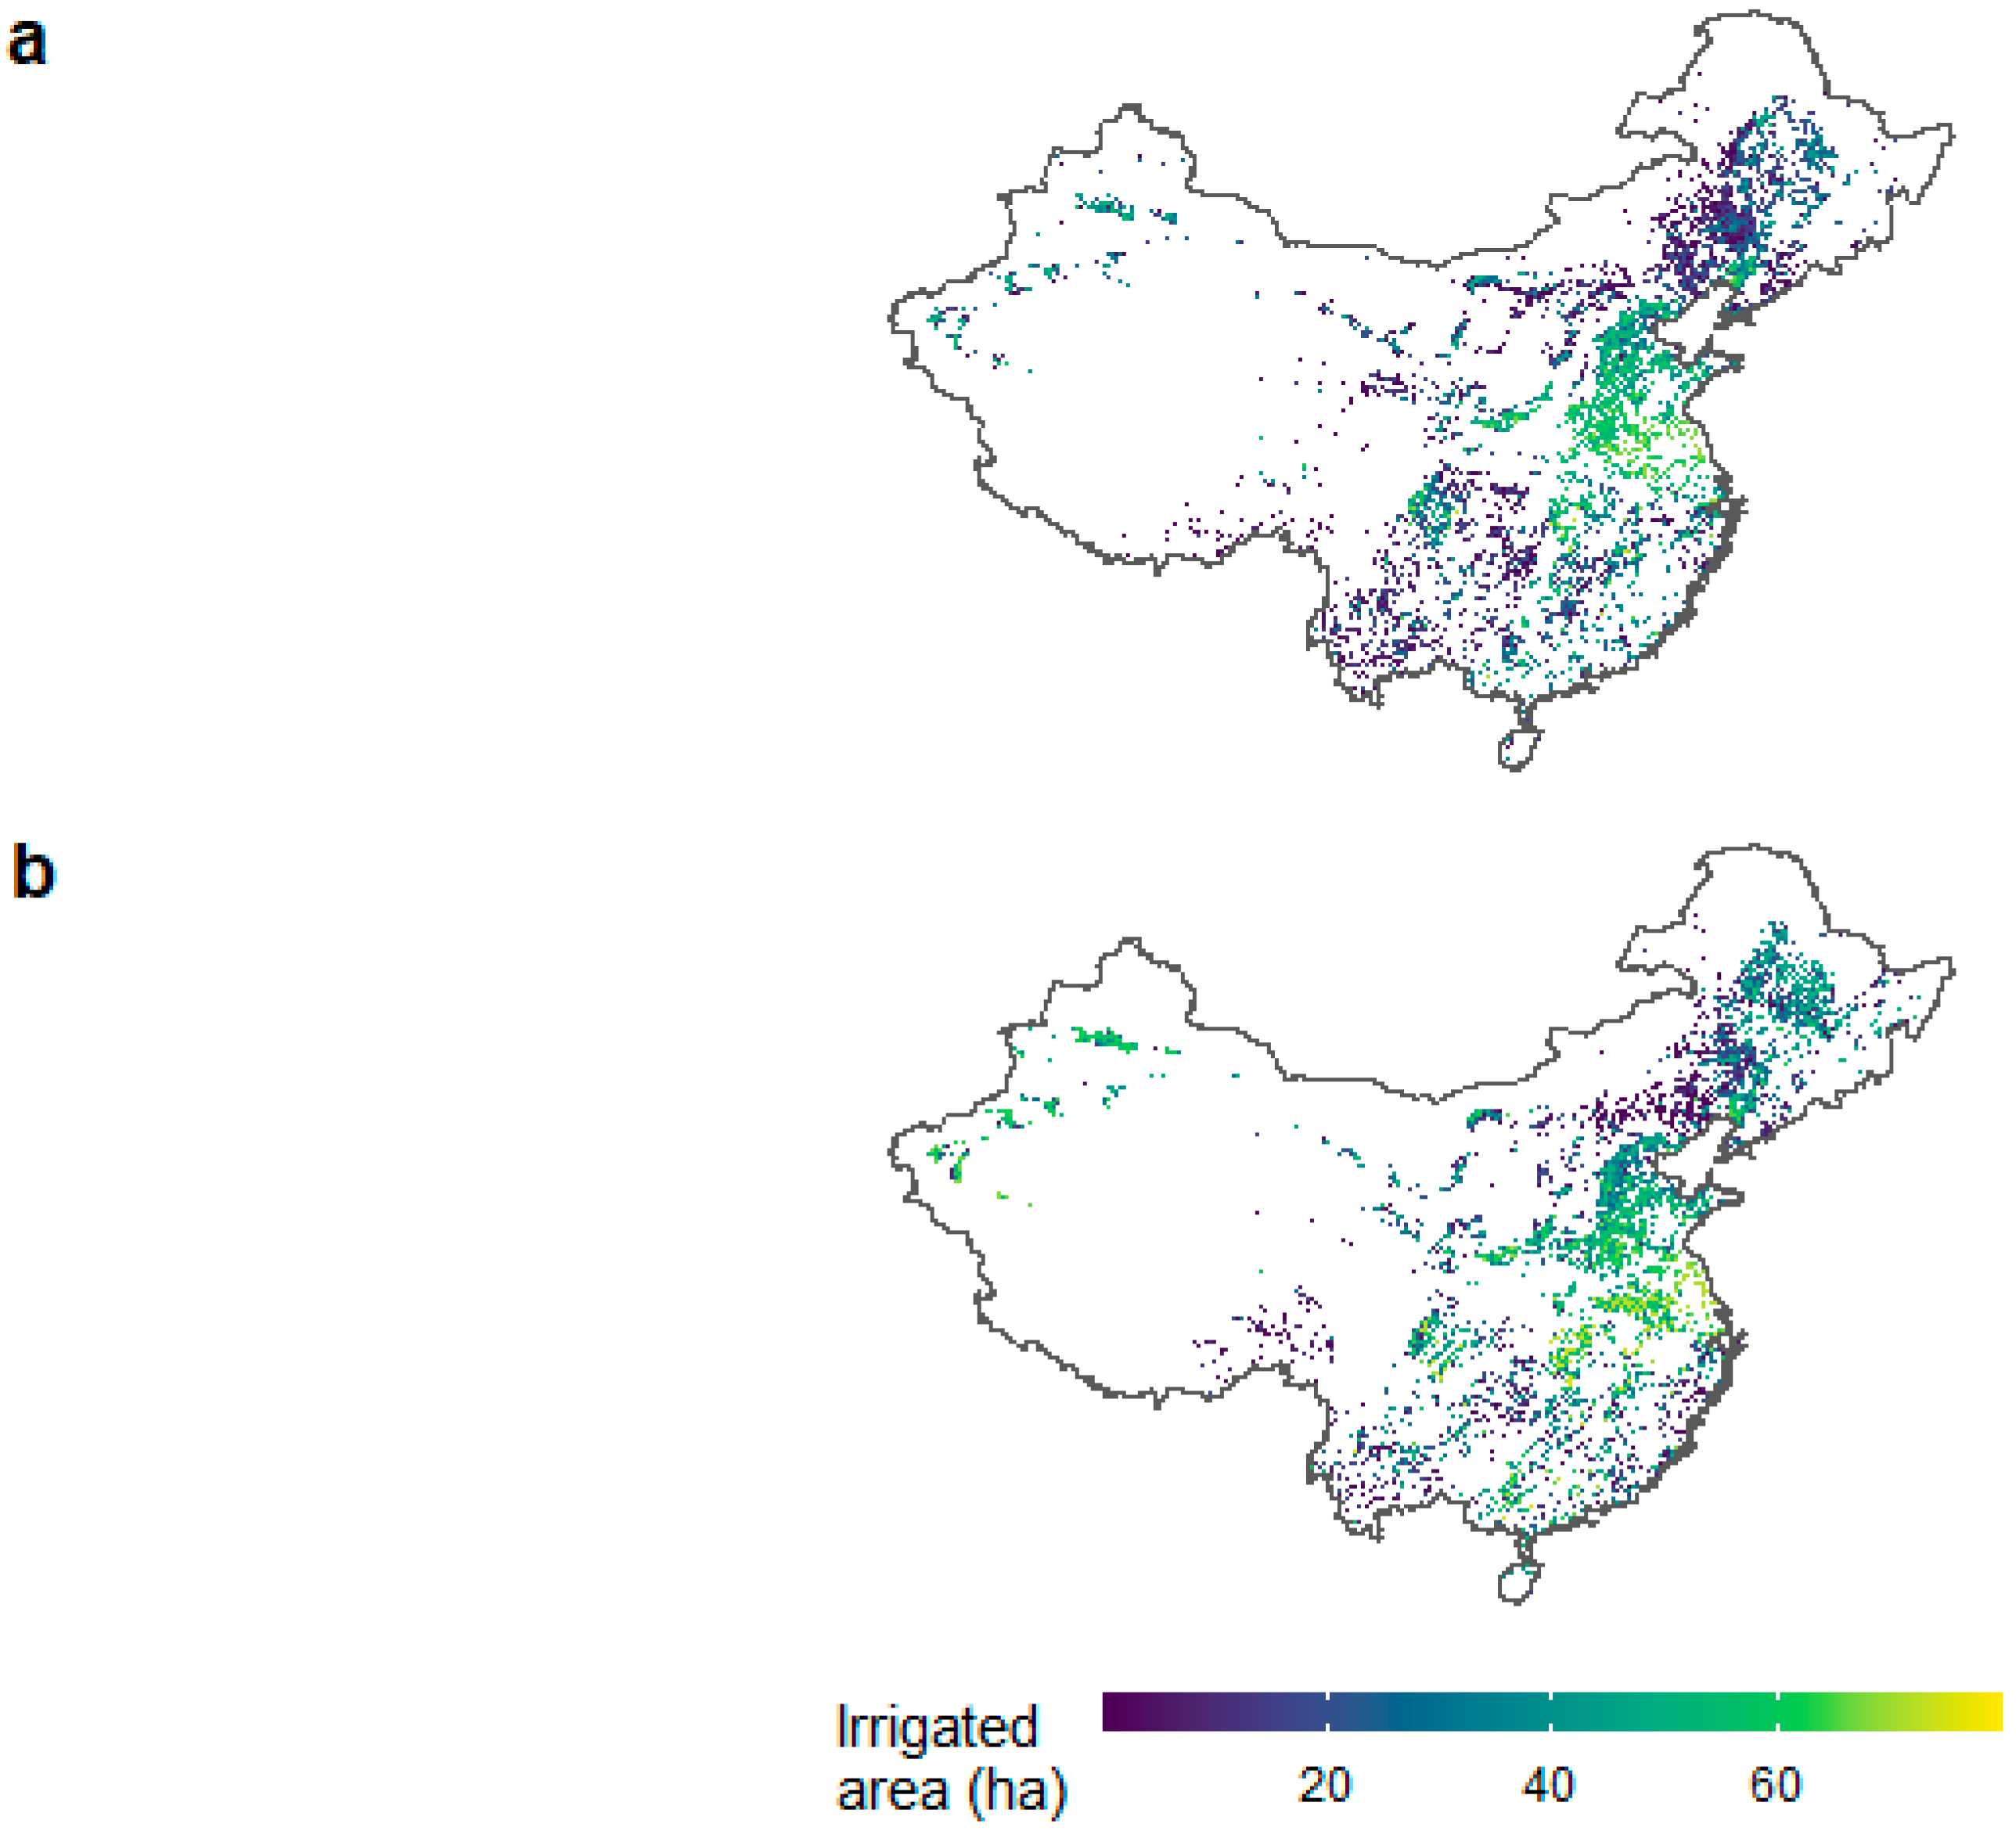
After using the synergy approach, two maps were developed that depict the irrigated area in China for 2005 and 2015 at a spatial resolution of 30 arc seconds (Figure 3). Most irrigated area is located in the Eastern part of China, in particular in the Heilongjiang, Henan and Shandong provinces. There is hardly any irrigation activity in the Southwest and Middle of China, e.g., in Qinghai and Xizang provinces.
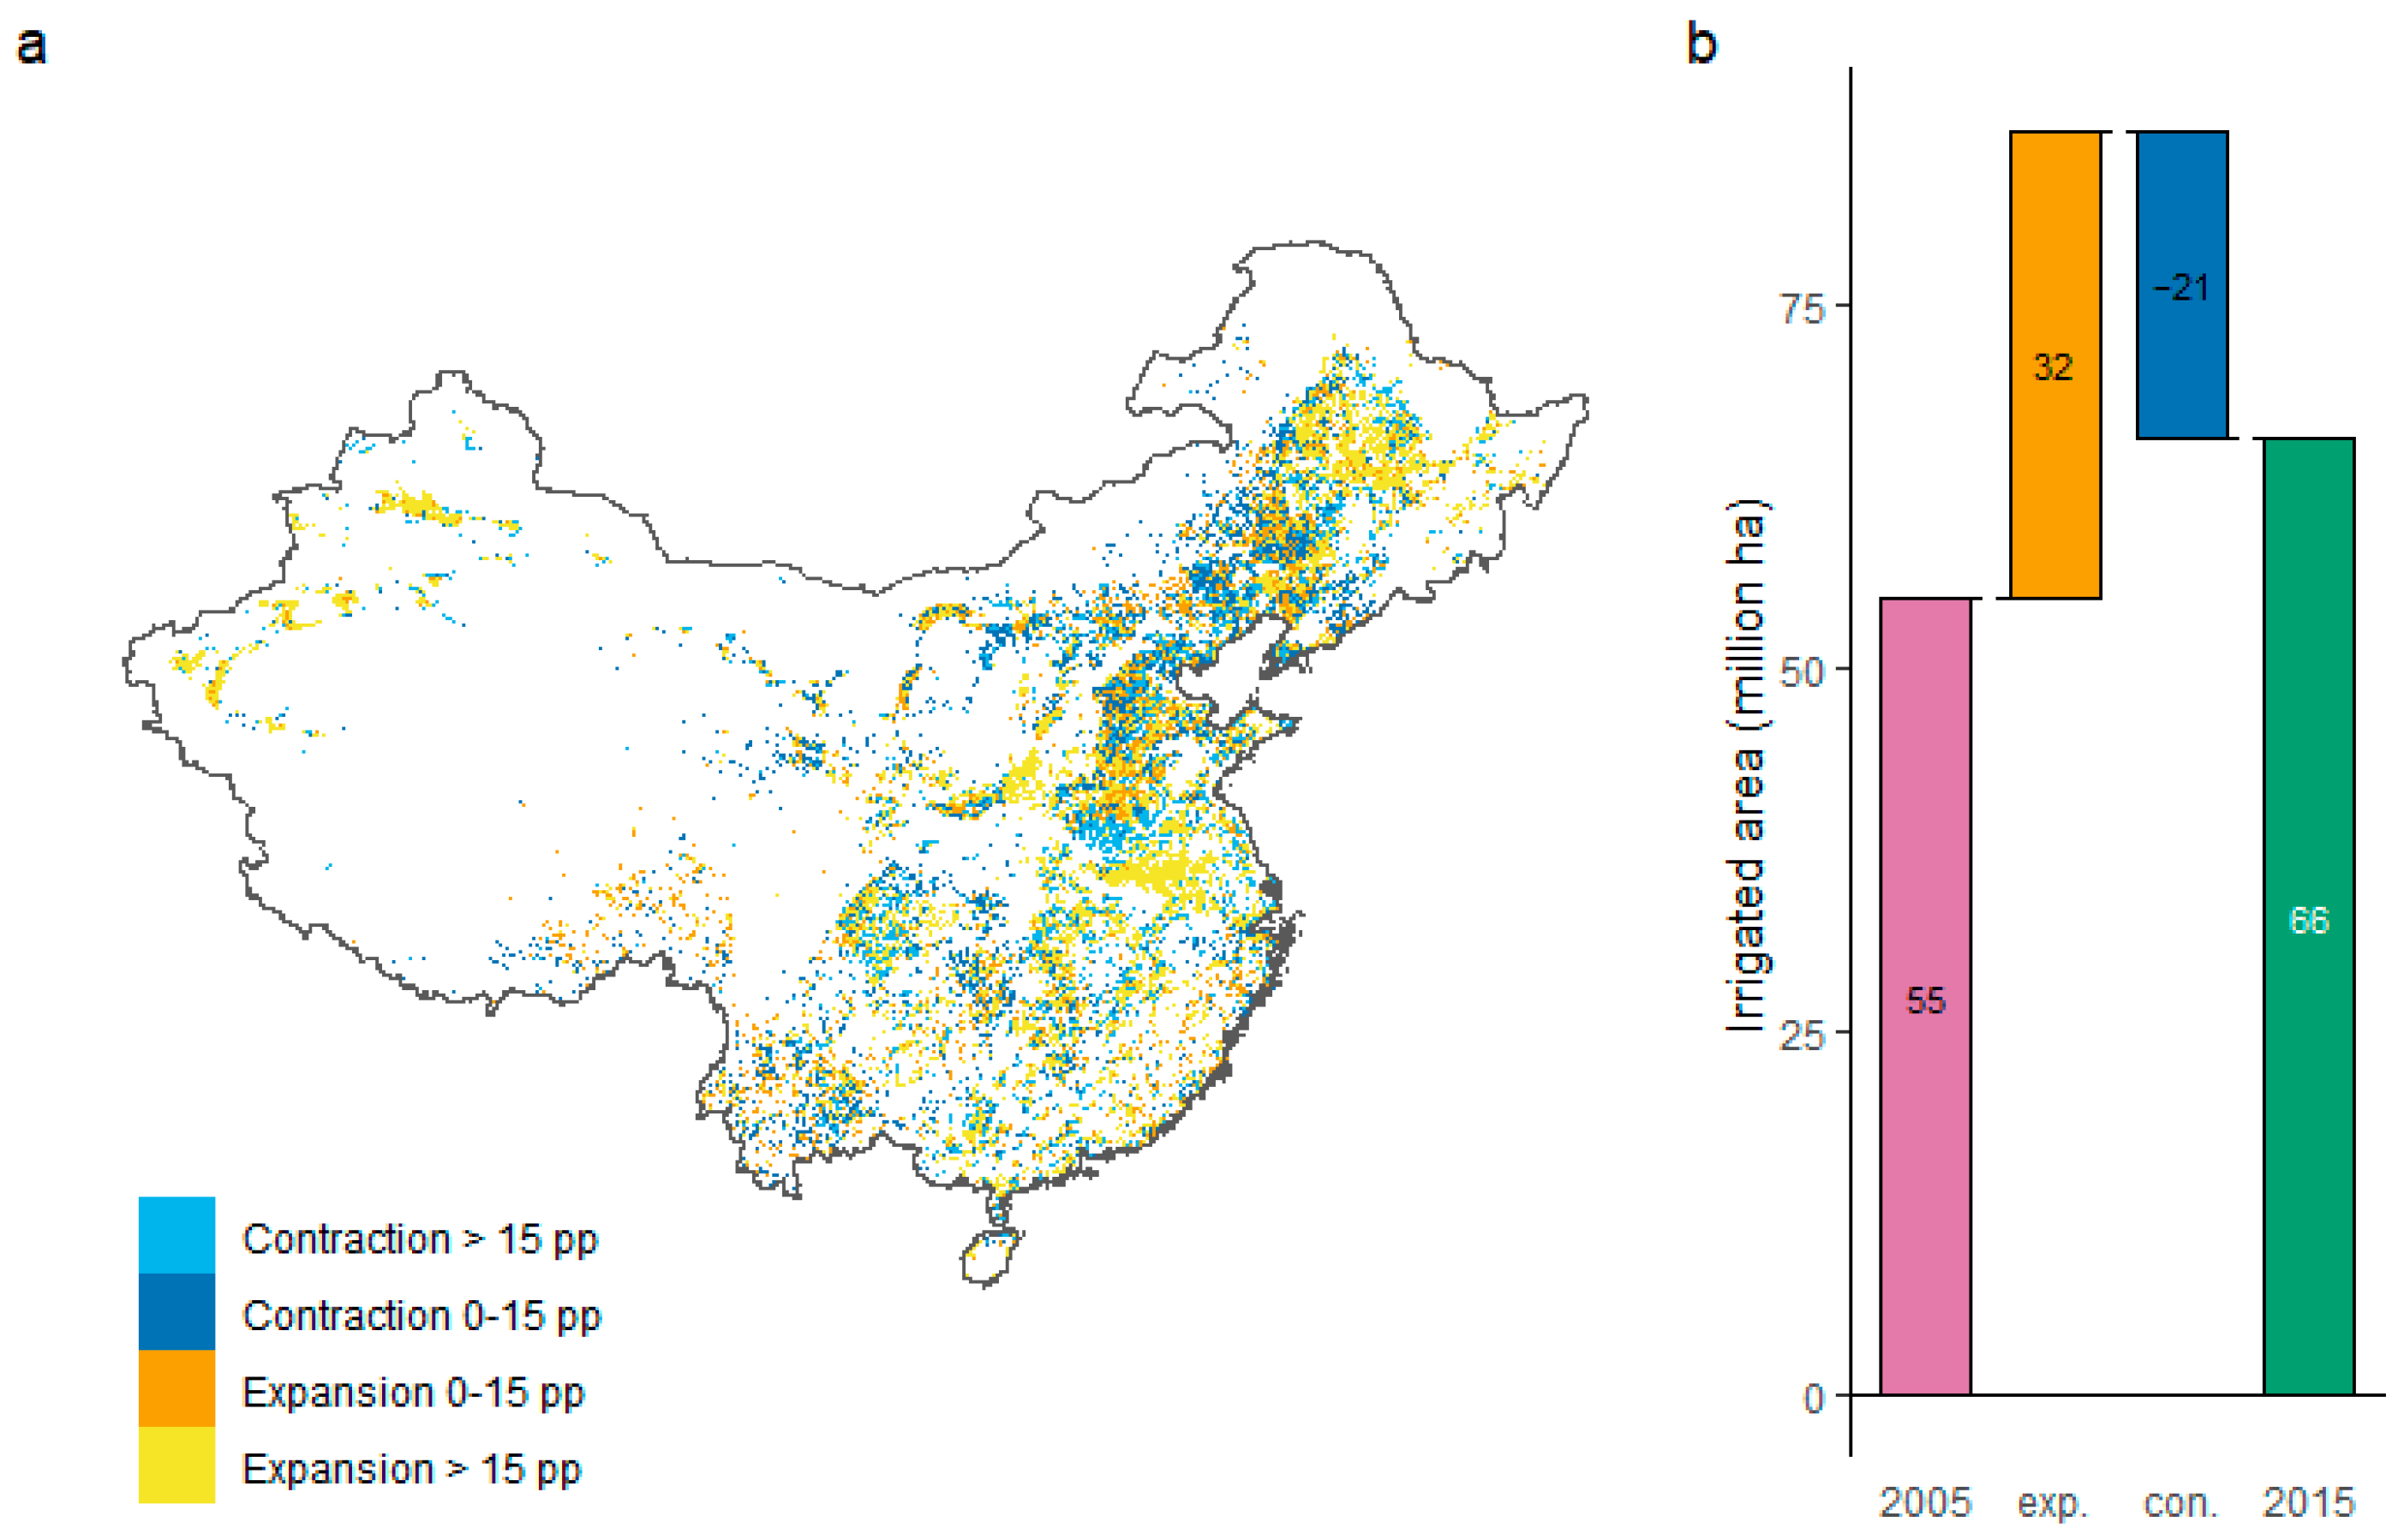
Figure 4 illustrates the percentage point change in irrigated areas distributed across China between 2005 and 2015. The figure shows that, although the total net irrigation increased from 55 million ha in 2005 to 66 million ha in 2015, an increase of approximately 20%, both expansion and contraction of the irrigated area seemed to have taken place at the same time. If we only consider expansion, the total irrigated area in China increased from 55 million ha to 87 million ha (+58%) over the period 2005–2015, while at the same time, a decrease of 21 million ha (−38%) was observed.
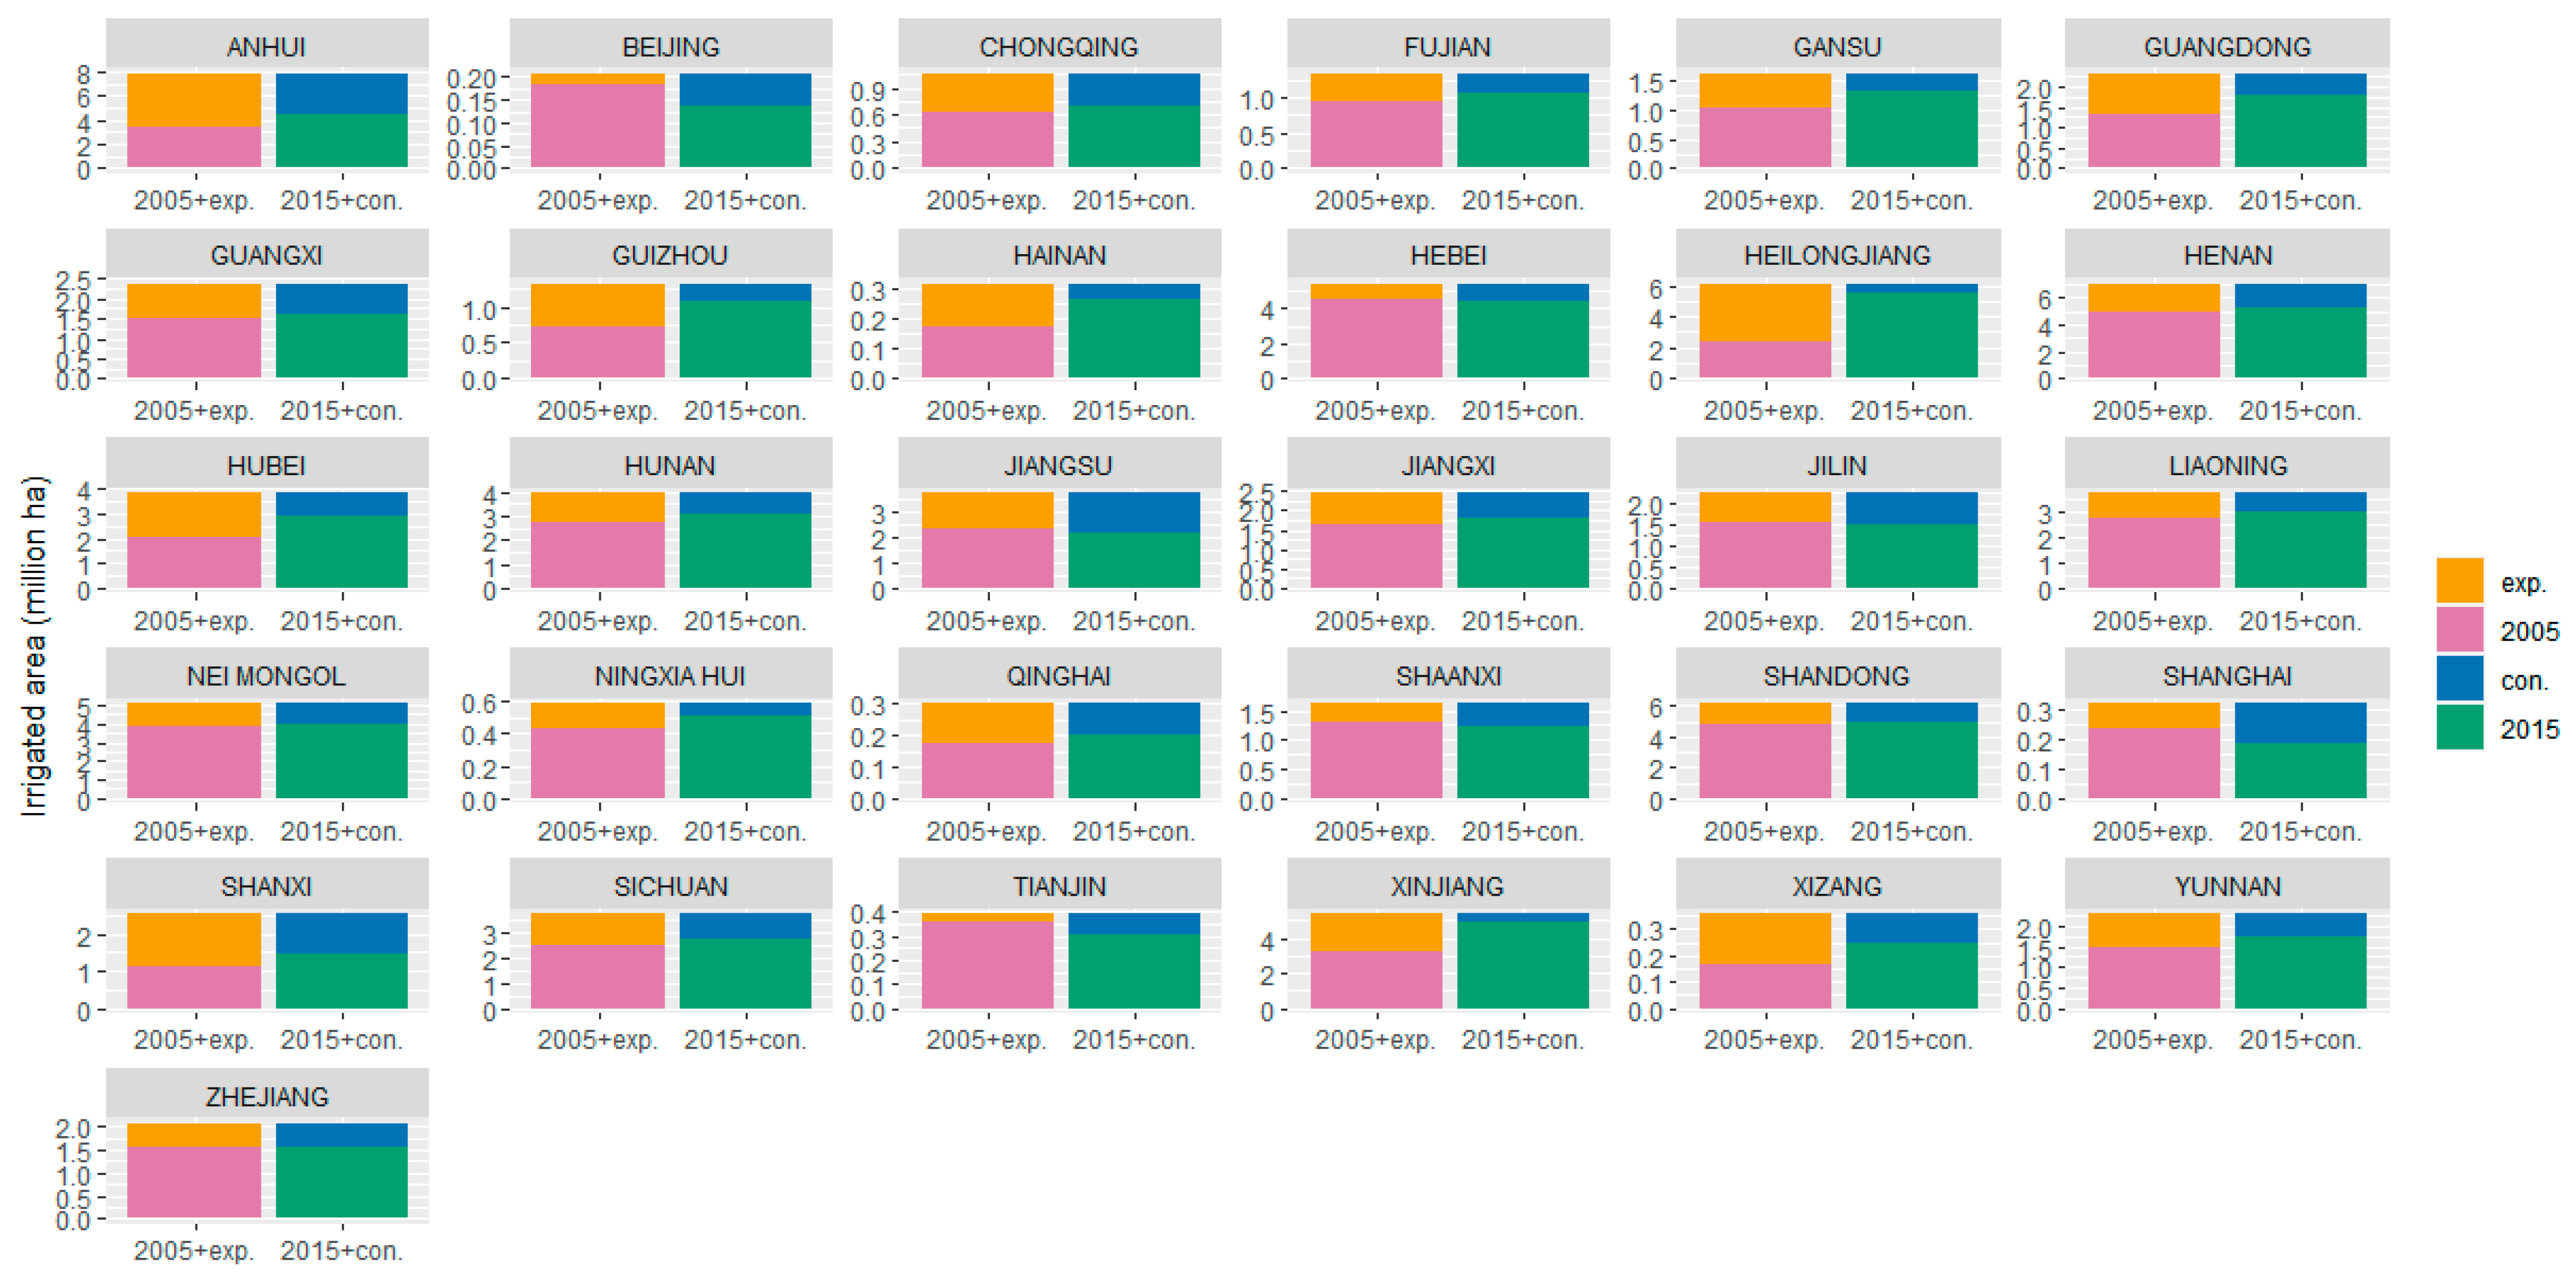
Figure 5 sheds light on the patterns of expansion and contraction at the province level. In all provinces, both an increase and decrease in the irrigated area took place at the same time. Nonetheless, three different patterns can be distinguished. First, in Gansu, Guangdong, Guizhou, Hainan, Heilongjiang, Hubei, Liaoning, Ningxia Hui, Shanxi, Xinjiang, Xizang and Yunnan provinces, there is a net increase in irrigated cropland because the expansion in the irrigated area was much larger than the contraction. The largest growth took place in Heilongjiang, which is the largest grain-producing area in China [38].
Second, in Beijing, Shanghai and Tianjin, the reverse pattern was observed, resulting in a net decrease in irrigated area. This is not surprising as these three provinces are characterized by rapid urban expansion. Finally, in the remaining provinces, the growth and decline in irrigated cropland were more or less in balance, resulting in only a modest change in the irrigated area between the two years.
In most cases, the expansion or the contraction was relatively small in comparison to the other effect, or both effects were of modest size. Interesting exceptions are Anhui, Chongqing, Jiangsu and Shanxi, in which both growth and decline in the irrigated area of more than 35% took place at the same time between 2005 and 2015. In all other regions, expansion and/or contraction was much smaller than 35%.
3.2. Agreement between Input Maps
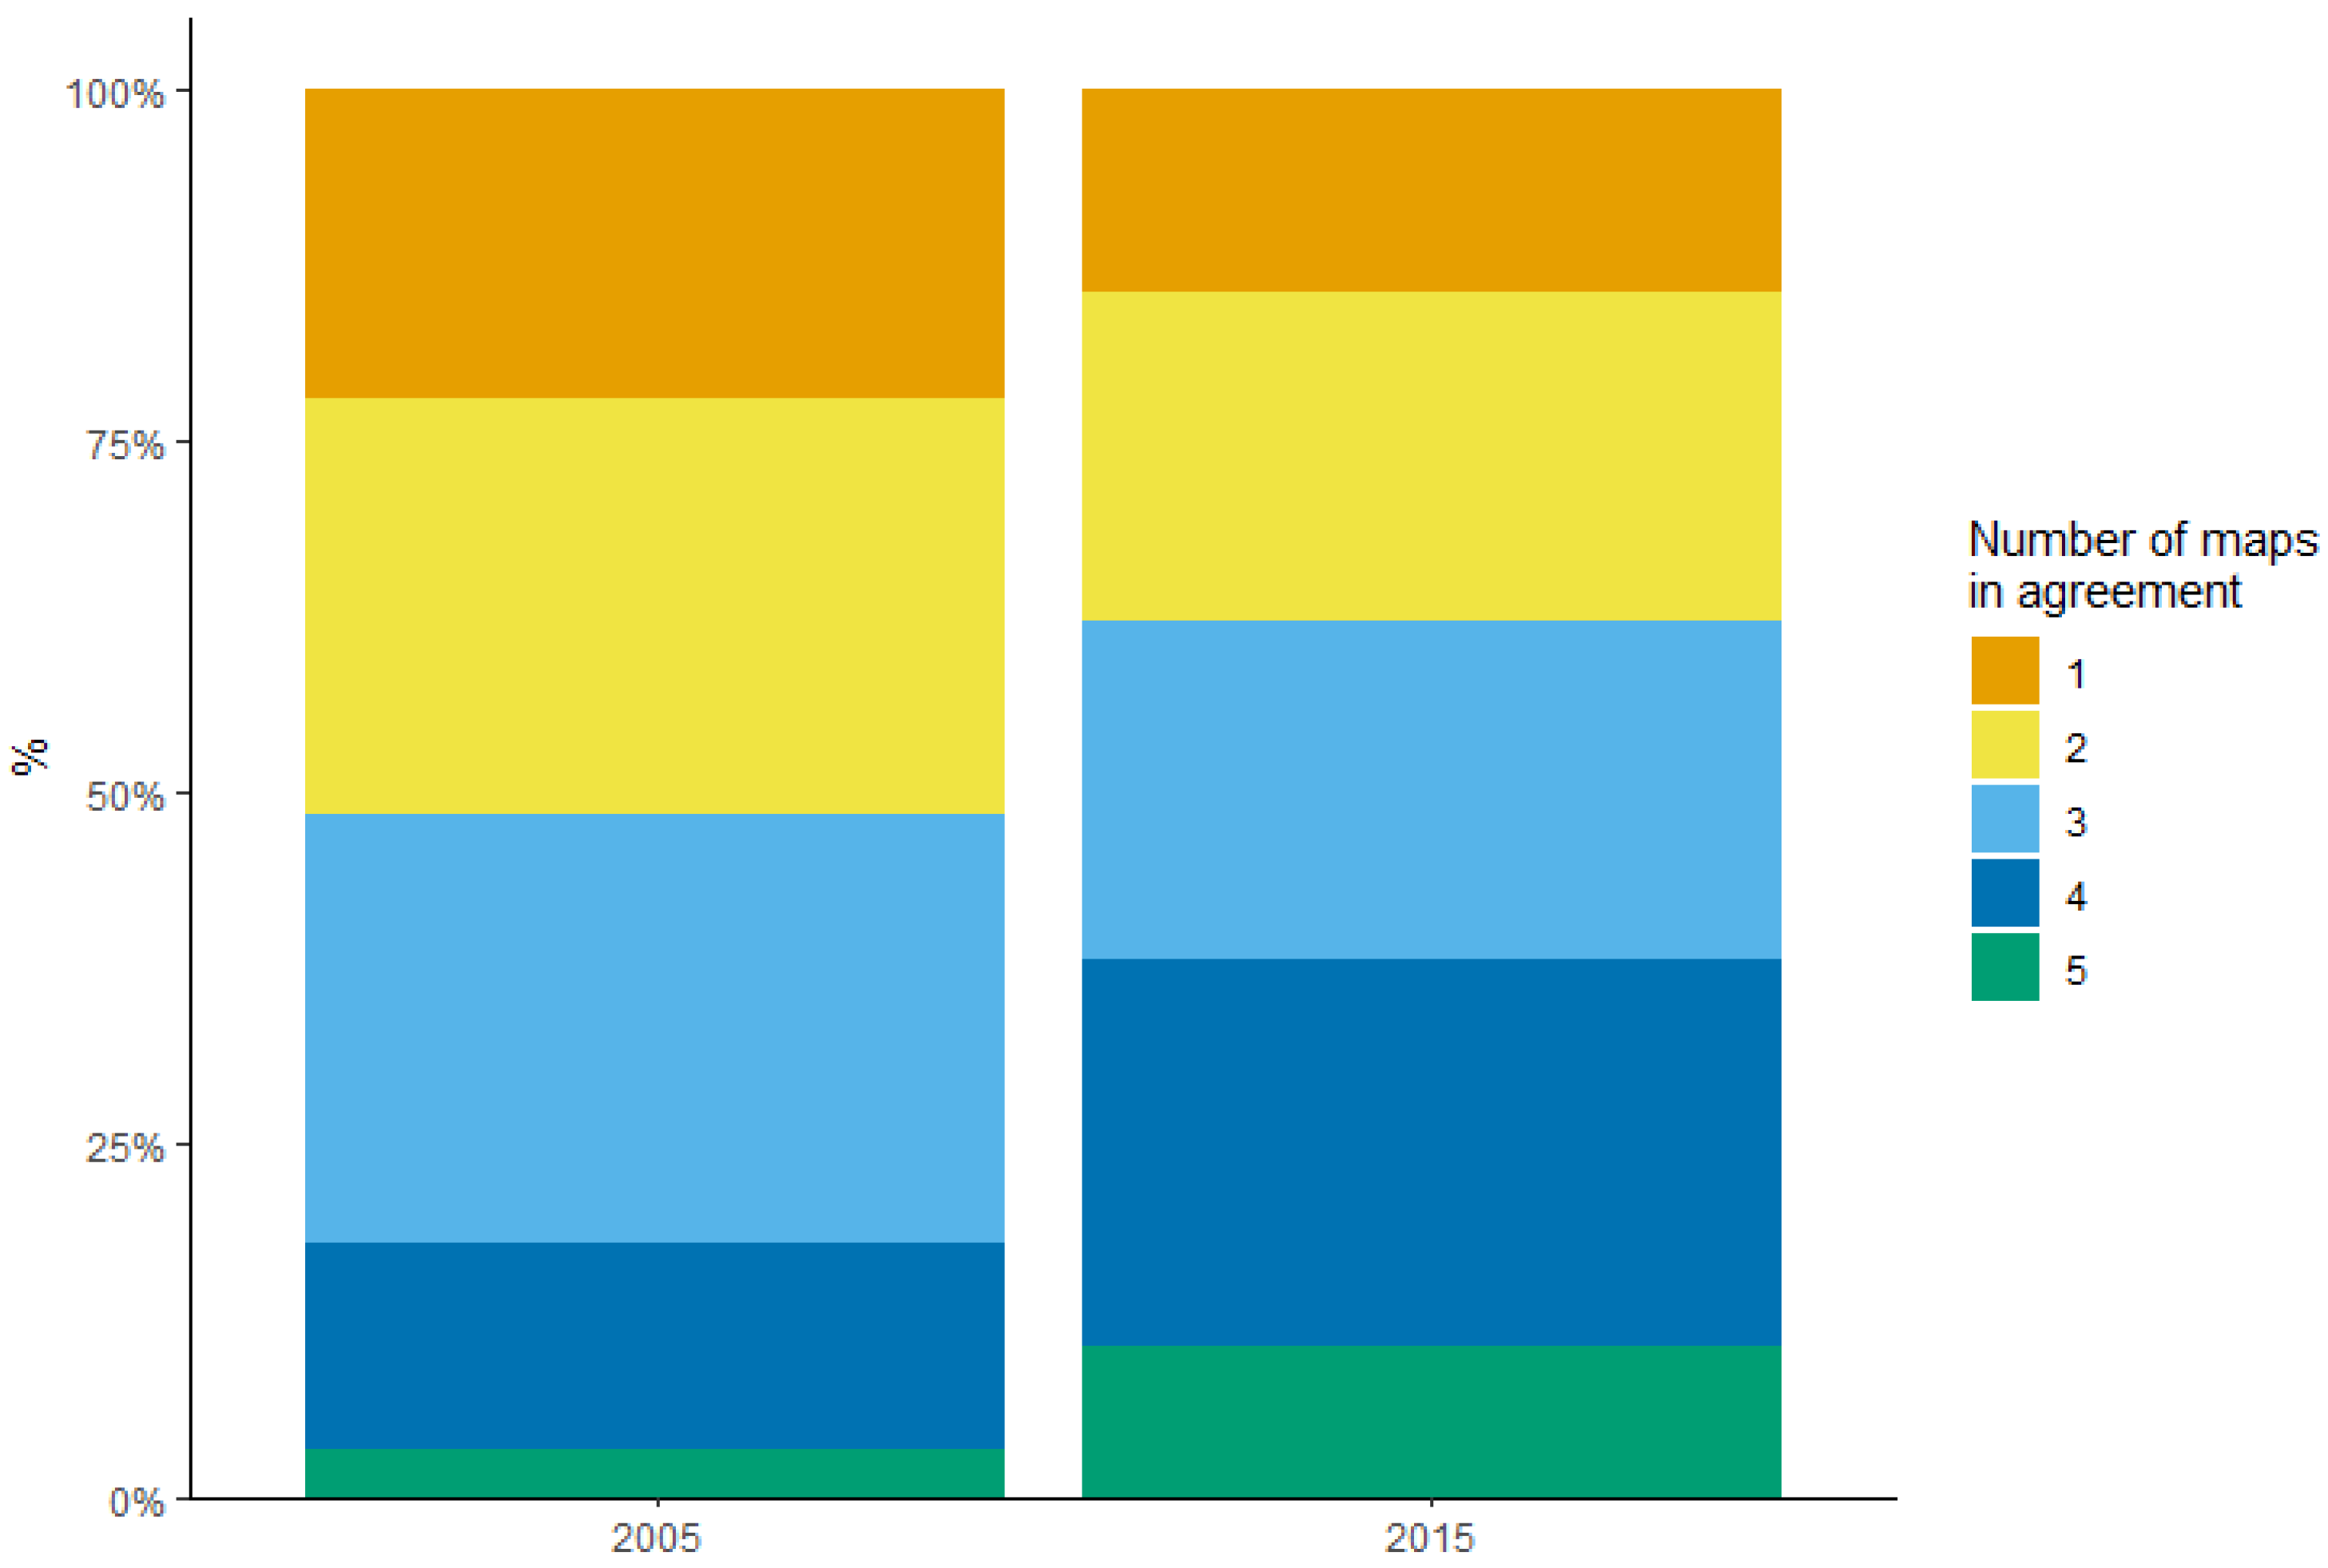
As explained above, all grid cells are given a score that measures the (dis)agreement between the irrigation input products. Figure 6 shows the share of grid cells that were identified as irrigated areas by one or more input maps. In 2015, for more than 30% of the grid cells, at least four maps indicated the presence of irrigated area. The share increased to over 85% if only two maps were considered. For 2005, the uncertainty was higher as for only 18% at least four maps showed agreement. The share increased to 77% if only two maps are considered.
3.3. Validation
Figure 7 illustrates the confusion matrix for the 2005 synergy map, revealing an overall accuracy of 0.58 and a kappa coefficient of 0.16. The accuracy is somewhat lower than the overall accuracy of 0.68 for the 2000 irrigation map presented in [26], which used the same dataset for validation. The main reason for the difference in accuracy is the relatively high number of false negatives (49% in comparison to 37%) in [26]) in our validation exercise, while the number of false negatives was comparable.
4. Discussion
4.1. Policy Implementations
The irrigation maps produced by means of the synergy approach provided detailed spatial information on the location of irrigated areas in China and how they changed over time. Having information on where irrigation is (not) taking place will support the identification of regions that require additional investment in irrigation equipment and infrastructure. As certain provinces have a higher potential to expand their irrigated areas due to favorable climatic and economic conditions, they might be prioritized [39]. With the new irrigation maps, it can be investigated if irrigation is expanding in these areas or if additional action plans are needed to support irrigation infrastructure.
In addition, the irrigation maps can also be used to support assessments of future food demand and supply and the impact on land use change and the environment in China [40]. These assessments are often conducted with large spatially explicit simulation models, which require detailed and up-to-date information on the geographical distribution of irrigation. Apart from improving base year information, the synergy irrigation maps can also be used for historical validation and calibration of such models as they cover two different periods.
4.2. Strengths and Weaknesses
The synergy approach to creating irrigation maps has several strengths. It provides a simple, transparent and tractable approach to combining different spatial datasets into a single map that structures all available data, including a measure of the level of agreement between the various input maps. Further, if new irrigation layers become available, they can be easily incorporated to produce an updated product.
At the same time, the synergy approach also has several weaknesses that need to be considered when using this approach and its outputs. The synergy maps are calibrated (i.e., constrained) using subnational irrigation statistics from national sources, in this case, information on irrigated areas in provinces and prefectures from China’s statistical Yearbook. These statistics are based on surveys and field measurements that are uncertain by themselves, which will be carried over to the synergy irrigation maps. Moreover, at least in China, the irrigation statistics only measure irrigated cropland, excluding irrigated pastures and forests. This means that the synergy maps only present a partial and probably underestimated map of irrigated areas in China.
The quality of the synergy product also depends on the quality of the irrigation maps that are used as input. We used two global irrigation input maps with a resolution of 9 km and 25 km, respectively, which is much coarser than the resolution of the synergy irrigation map (30 arc seconds). This means that their contribution to the final product is limited. In addition, the input maps were produced using a variety of techniques, including remote sensing, downscaling and machine learning, and included both cropland maps with irrigation information and ‘pure’ irrigation maps. The diversity and combination of the input irrigation products might explain why the uncertainty (i.e., a lower level of agreement between maps) was higher for the 2005 synergy product in comparison to the 2015 map.
Another type of uncertainty is related to cropland maps we used to mask the synergy irrigated maps. We used the ESACCI land use maps as they were the only high-resolution time-series product that covered the period 2005–2015. However, also these maps lack precision [41,42], which will also affect the location of irrigated areas identified by the synergy approach.
Finally, validation of the synergy irrigated maps is difficult as it requires geo-coded reference data on the location of irrigated and non-irrigated areas, which is not easily available. The only information available for use represented irrigated sites in the year 2000, which we used to validate the 2005 map. One of our findings is that the change in irrigated areas in China is a highly dynamic process that is characterized by both expansion and contraction, which occur at the same time. Similarly, crop rotation and shifting cultivation might also result in different patterns of cropland use between 2005 and 2015. It is, therefore, not unlikely that the information we used for validation only poorly reflects the situation in 2005, resulting in a relatively low accuracy statistic.
A proper validation exercise requires the collection of a large database with ground truth data, including both irrigated and non-irrigated locations. In the past, several crowd-sourcing campaigns have been organized to collect such reference data, but so far, no efforts have been undertaken to collect irrigation information [43]. To create and validate new (synergy) irrigation maps, new initiatives are needed to collect ground truth information on the location of irrigated crops.
4.3. Future Research
An interesting finding of this study is the pattern of simultaneous expansion and contraction of irrigated areas that can be observed in many provinces. As described above, we acknowledged that this might be partly explained by the fact that we are combining and comparing maps with different resolutions that are produced with different methodologies, possibly introducing a bias. Nonetheless, in provinces such as Anhui and Shanxi, the change in irrigated areas is very dynamic, including both substantial growth and decline in irrigated areas. Possible explanations for this finding might be the deterioration and replacement of canal irrigation, the dominant form of irrigation in China, with well irrigation [44]. Abandoned canal infrastructure may result in a pattern of irrigation contraction, while growth in well irrigation may result in a spatial pattern of irrigation expansion. Finally, the pattern might also be driven by changes in cropland. [45] report that between 2010 and 2015, cropland in many provinces was replaced by urban land. If the urban land replaced irrigated cropland, it would show up as a decline in irrigated areas. An interesting avenue for future research would be to organize detailed case studies to better understand the observed change in irrigated areas.
Finally, another option for future research would be to apply the synergy approach to other regions to create more detailed and up-to-date irrigation maps. Although we presented an application to China, the synergy approach can easily be applied to other regions using the same global irrigation input maps as used in this study, where possible, supplemented by regional products [46].
5. Conclusions
In this paper, we developed and applied a synergy approach to creating 30 arc seconds irrigated cropland maps for China that cover the period 2005 and 2015. The synergy approach combines and integrates existing global and regional irrigation products into a single map. The new Chinese irrigation maps reveal a highly dynamic pattern of change in irrigated areas, which is characterized by a dynamic pattern of expansion and contraction that takes place at the same time, often within the same province. More research is needed to explain the observed patterns.
An advantage of the synergy approach to creating irrigation maps is that it is transparent and can easily be applied to other regions using the same data sources as used in this paper, where possible, supplemented by regional irrigation maps. A weakness of the synergy approach is that validation of the output requires the use of geo-coded information on the location of irrigated and non-irrigated fields, which are generally not available. New initiatives are needed to create a database with ground truth data that can be used to validate (synergy) irrigation maps.
Author Contributions
Conceptualization, M.v.D.; methodology, M.v.D.; software, M.v.D. and S.G.; validation, M.v.D. and S.G.; formal analysis, M.v.D. and S.G.; investigation, M.v.D. and S.G.; resources, M.v.D.; data curation, M.v.D.; writing—original draft preparation, M.v.D. and S.G.; writing—review and editing, M.v.D.; visualization, M.v.D. and S.G.; supervision, M.v.D.; project administration, M.v.D.; funding acquisition, M.v.D. All authors have read and agreed to the published version of the manuscript.
Funding
This research was funded by a grant from Wageningen University & Research Programme on “Food Security and Valuing Water” (project code KB-35-005-001) that is supported by the Dutch Ministry of Agriculture, Nature and Food Quality, and a contribution from the Wageningen University and Research investment fund. The funders had no role in the study design, data collection and analysis, the decision to publish or the preparation of the manuscript.
Data Availability Statement
All data and results are available from the authors on request.
Acknowledgments
We would like to express our gratitude to Shuang Zhou and Lianghzi You for their support in obtaining the Chinese irrigation statistics and to Hester Biemans, Lotte de Vos and Marijn Gulpen for constructive feedback on previous versions of our paper.
Conflicts of Interest
The authors declare no conflict of interest. The funders had no role in the design of the study; in the collection, analyses, or interpretation of data; in the writing of the manuscript; or in the decision to publish the results.
Appendix A. Scoring Table According to the Priority Ranking

Table A1.
Scoring table of 2005.
| Agreement | Score | IAM | ESA | GRIPC | CHN | NAGARAJ |
|---|---|---|---|---|---|---|
| 5 | 1 | 1 | 1 | 1 | 1 | 1 |
| 4 | 2 | 1 | 1 | 1 | 1 | 0 |
| 4 | 3 | 1 | 1 | 1 | 0 | 1 |
| 4 | 4 | 1 | 1 | 0 | 1 | 1 |
| 4 | 5 | 1 | 0 | 1 | 1 | 1 |
| 4 | 6 | 0 | 1 | 1 | 1 | 1 |
| 3 | 7 | 1 | 1 | 1 | 0 | 0 |
| 3 | 8 | 1 | 1 | 0 | 1 | 0 |
| 3 | 9 | 1 | 1 | 0 | 0 | 1 |
| 3 | 10 | 1 | 0 | 1 | 1 | 0 |
| 3 | 11 | 1 | 0 | 1 | 0 | 1 |
| 3 | 12 | 1 | 0 | 0 | 1 | 1 |
| 3 | 13 | 0 | 1 | 1 | 1 | 0 |
| 3 | 14 | 0 | 1 | 1 | 0 | 1 |
| 3 | 15 | 0 | 1 | 0 | 1 | 1 |
| 3 | 16 | 0 | 0 | 1 | 1 | 1 |
| 2 | 17 | 1 | 1 | 0 | 0 | 0 |
| 2 | 18 | 1 | 0 | 1 | 0 | 0 |
| 2 | 19 | 1 | 0 | 0 | 1 | 0 |
| 2 | 20 | 1 | 0 | 0 | 0 | 1 |
| 2 | 21 | 0 | 1 | 1 | 0 | 0 |
| 2 | 22 | 0 | 1 | 0 | 1 | 0 |
| 2 | 23 | 0 | 1 | 0 | 0 | 1 |
| 2 | 24 | 0 | 0 | 1 | 1 | 0 |
| 2 | 25 | 0 | 0 | 1 | 0 | 1 |
| 2 | 26 | 0 | 0 | 0 | 1 | 1 |
| 1 | 27 | 1 | 0 | 0 | 0 | 0 |
| 1 | 28 | 0 | 1 | 0 | 0 | 0 |
| 1 | 29 | 0 | 0 | 1 | 0 | 0 |
| 1 | 30 | 0 | 0 | 0 | 1 | 0 |
| 1 | 31 | 0 | 0 | 0 | 0 | 1 |
| 0 | 32 | 0 | 0 | 0 | 0 | 0 |
Table A2.
Scoring table of 2015.
| Agreement | Score | IAM | ESA | GIA | NAGARAJ | ZOHAIB |
|---|---|---|---|---|---|---|
| 5 | 1 | 1 | 1 | 1 | 1 | 1 |
| 4 | 2 | 1 | 1 | 1 | 1 | 0 |
| 4 | 3 | 1 | 1 | 1 | 0 | 1 |
| 4 | 4 | 1 | 1 | 0 | 1 | 1 |
| 4 | 5 | 1 | 0 | 1 | 1 | 1 |
| 4 | 6 | 0 | 1 | 1 | 1 | 1 |
| 3 | 7 | 1 | 1 | 1 | 0 | 0 |
| 3 | 8 | 1 | 1 | 0 | 1 | 0 |
| 3 | 9 | 1 | 1 | 0 | 0 | 1 |
| 3 | 10 | 1 | 0 | 1 | 1 | 0 |
| 3 | 11 | 1 | 0 | 1 | 0 | 1 |
| 3 | 12 | 1 | 0 | 0 | 1 | 1 |
| 3 | 13 | 0 | 1 | 1 | 1 | 0 |
| 3 | 14 | 0 | 1 | 1 | 0 | 1 |
| 3 | 15 | 0 | 1 | 0 | 1 | 1 |
| 3 | 16 | 0 | 0 | 1 | 1 | 1 |
| 2 | 17 | 1 | 1 | 0 | 0 | 0 |
| 2 | 18 | 1 | 0 | 1 | 0 | 0 |
| 2 | 19 | 1 | 0 | 0 | 1 | 0 |
| 2 | 20 | 1 | 0 | 0 | 0 | 1 |
| 2 | 21 | 0 | 1 | 1 | 0 | 0 |
| 2 | 22 | 0 | 1 | 0 | 1 | 0 |
| 2 | 23 | 0 | 1 | 0 | 0 | 1 |
| 2 | 24 | 0 | 0 | 1 | 1 | 0 |
| 2 | 25 | 0 | 0 | 1 | 0 | 1 |
| 2 | 26 | 0 | 0 | 0 | 1 | 1 |
| 1 | 27 | 1 | 0 | 0 | 0 | 0 |
| 1 | 28 | 0 | 1 | 0 | 0 | 0 |
| 1 | 29 | 0 | 0 | 1 | 0 | 0 |
| 1 | 30 | 0 | 0 | 0 | 1 | 0 |
| 1 | 31 | 0 | 0 | 0 | 0 | 1 |
| 0 | 32 | 0 | 0 | 0 | 0 | 0 |
Appendix B
Table A3.
Overview of data availability for the calibration of the synergy products per administrative unit. X indicates the availability of data.
Table A3.
Overview of data availability for the calibration of the synergy products per administrative unit. X indicates the availability of data.
| adm2 ‘05 | adm1 ‘05 | adm2 ‘15 | adm1 ‘15 | adm2 ‘05/’15 | |
|---|---|---|---|---|---|
| Anhui | X | X | X | ||
| Beijing | X | X | |||
| Chongqing | X | X | |||
| Fujian | X | X | |||
| Gansu | X | X | X | ||
| Guangdong | X | X | X | ||
| Guangxi | X | X | |||
| Guizhou | X | X | |||
| Hainan | X | X | X | ||
| Hebei | X | X | X | ||
| Heilongjiang | X | X | |||
| Henan | X | X | |||
| Hubei | X | X | X | ||
| Hunan | X | X | X | ||
| Nei Mongol | X | X | X | ||
| Jiangsu | X | X | X | ||
| Jiangxi | X | X | X | ||
| Jilin | X | X | X | ||
| Liaoning | X | X | X | ||
| Ningxia Hui | X | X | |||
| Qinghai | X | X | |||
| Shaanxi | X | X | X | ||
| Shandong | X | X | X | ||
| Shanghai City | X | X | X | ||
| Shanxi | X | X | |||
| Sichuan | X | X | X | ||
| Tianjin City | X | X | X | ||
| Xizang | X | X | |||
| Xinjiang Uygur | X | X | |||
| Yunnan | X | X | X | ||
| Zhejiang | X | X | X |
References
- Prosekov, A.Y.; Ivanova, S.A. Food Security: The Challenge of the Present. Geoforum 2018, 91, 73–77. [Google Scholar] [CrossRef]
- Consumption|Details|The World Bank. Available online: https://datatopics.worldbank.org/consumption/detail#datastandardization (accessed on 12 October 2022).
- van Dijk, M.; Morley, T.; Rau, M.L.; Saghai, Y. A Meta-Analysis of Projected Global Food Demand and Population at Risk of Hunger for the Period 2010–2050. Nat. Food 2021, 2, 494–501. [Google Scholar] [CrossRef]
- Nagaraj, D.; Proust, E.; Todeschini, A.; Rulli, M.C.; D’Odorico, P. A New Dataset of Global Irrigation Areas from 2001 to 2015. Adv. Water Resour. 2021, 152, 103910. [Google Scholar] [CrossRef]
- Kadiresan, K.; Khanal, P.R. Rethinking Irrigation for Global Food Security. Irrig. Drain. 2018, 67, 8–11. [Google Scholar] [CrossRef]
- Salmon, J.M.; Friedl, M.A.; Frolking, S.; Wisser, D.; Douglas, E.M. Global Rain-Fed, Irrigated, and Paddy Croplands: A New High Resolution Map Derived from Remote Sensing, Crop Inventories and Climate Data. Int. J. Appl. Earth Obs. Geoinf. 2015, 38, 321–334. [Google Scholar] [CrossRef]
- Zou, X.; Li, Y.; Gao, Q.; Wan, Y. How Water Saving Irrigation Contributes to Climate Change Resilience-a Case Study of Practices in China. Mitig. Adapt. Strat. Glob. Change 2012, 17, 111–132. [Google Scholar] [CrossRef]
- Ehlers, M.H.; Huber, R.; Finger, R. Agricultural Policy in the Era of Digitalisation. Food Policy 2021, 100, 102019. [Google Scholar] [CrossRef]
- Meier, J.; Zabel, F.; Mauser, W. A Global Approach to Estimate Irrigated Areas—A Comparison between Different Data and Statistics. Hydrol. Earth Syst. Sci. 2018, 22, 1119–1133. [Google Scholar] [CrossRef]
- Portmann, F.T.; Siebert, S.; Döll, P. MIRCA2000—Global Monthly Irrigated and Rainfed Crop Areas around the Year 2000: A New High-Resolution Data Set for Agricultural and Hydrological Modeling. Glob. Biogeochem. Cycles 2010, 24, 3435. [Google Scholar] [CrossRef]
- Siebert, S.; Kummu, M.; Porkka, M.; Döll, P.; Ramankutty, N.; Scanlon, B.R. A Global Data Set of the Extent of Irrigated Land from 1900 to 2005. Hydrol. Earth Syst. Sci. 2015, 19, 1521–1545. [Google Scholar] [CrossRef]
- Siebert, S.; Henrich, V.; Frenken, K.; Burke, J. Update of the Digital Global Map of Irrigation Areas to Version 5; FAO: Rome, Italy, 2013. [Google Scholar]
- Zohaib, M.; Kim, H.; Choi, M. Detecting Global Irrigated Areas by Using Satellite and Reanalysis Products. Sci. Total Environ. 2019, 677, 679–691. [Google Scholar] [CrossRef] [PubMed]
- Massari, C.; Modanesi, S.; Dari, J.; Gruber, A.; de Lannoy, G.J.M.; Girotto, M.; Quintana-Seguí, P.; le Page, M.; Jarlan, L.; Zribi, M.; et al. A Review of Irrigation Information Retrievals from Space and Their Utility for Users. Remote Sens. 2021, 13, 4112. [Google Scholar] [CrossRef]
- Jung, M.; Henkel, K.; Herold, M.; Churkina, G. Exploiting Synergies of Global Land Cover Products for Carbon Cycle Modeling. Remote Sens. Environ. 2006, 101, 534–553. [Google Scholar] [CrossRef]
- Fritz, S.; You, L.; Bun, A.; See, L.; McCallum, I.; Schill, C.; Perger, C.; Liu, J.; Hansen, M.; Obersteiner, M. Cropland for Sub-Saharan Africa: A Synergistic Approach Using Five Land Cover Data Sets. Geophys. Res. Lett. 2011, 38, 3435. [Google Scholar] [CrossRef]
- Lu, M.; Wu, W.; You, L.; See, L.; Fritz, S.; Yu, Q.; Wei, Y.; Chen, D.; Yang, P.; Xue, B. A Cultivated Planet in 2010—Part 1: The Global Synergy Cropland Map. Earth Syst. Sci. Data 2020, 12, 1913–1928. [Google Scholar] [CrossRef]
- Cremades, R.; Wang, J.; Morris, J. Policies, Economic Incentives and the Adoption of Modern Irrigation Technology in China. Earth Syst. Dyn. 2015, 6, 399–410. [Google Scholar] [CrossRef]
- Du, L.; Xu, L.; Li, Y.; Liu, C.; Li, Z.; Wong, J.S.; Lei, B. China’s Agricultural Irrigation and Water Conservancy Projects: A Policy Synthesis and Discussion of Emerging Issues. Sustainability 2019, 11, 7027. [Google Scholar] [CrossRef]
- Water Conservation Project II. Available online: https://projects.worldbank.org/en/projects-operations/project-detail/P114138?lang=en (accessed on 31 March 2022).
- Wang, J.; Zhu, Y.; Sun, T.; Huang, J.; Zhang, L.; Guan, B.; Huang, Q. Forty Years of Irrigation Development and Reform in China. Aust. J. Agric. Resour. Econ. 2020, 64, 126–149. [Google Scholar] [CrossRef]
- Dubovyk, O.; Menz, G.; Conrad, C.; Kan, E.; Machwitz, M.; Khamzina, A. Spatio-Temporal Analyses of Cropland Degradation in the Irrigated Lowlands of Uzbekistan Using Remote-Sensing and Logistic Regression Modeling. Environ. Monit. Assess. 2013, 185, 4775–4790. [Google Scholar] [CrossRef]
- Biggs, T.W.; Thenkabail, P.S.; Gumma, M.K.; Scott, C.A.; Parthasaradhi, G.R.; Turral, H.N. Irrigated Area Mapping in Heterogeneous Landscapes with MODIS Time Series, Ground Truth and Census Data, Krishna Basin, India. Int. J. Remote Sens. 2007, 27, 4245–4266. [Google Scholar] [CrossRef]
- Chen, D.; Lu, M.; Zhou, Q.; Xiao, J.; Ru, Y.; Wei, Y.; Wu, W. Comparison of Two Synergy Approaches for Hybrid Cropland Mapping. Remote Sens. 2019, 11, 213. [Google Scholar] [CrossRef]
- Fang, X.S.; Sheng, Q.Z.; Wang, X.; Zhang, W.E.; Ngu, A.H.H.; Yang, J. From Appearance to Essence. ACM Trans. Intell. Syst. Technol. 2020, 11, 1–24. [Google Scholar] [CrossRef]
- Zhu, X.; Zhu, W.; Zhang, J.; Pan, Y. Mapping Irrigated Areas in China from Remote Sensing and Statistical Data. IEEE J. Sel. Top Appl. Earth Obs. Remote Sens. 2014, 7, 4490–4504. [Google Scholar] [CrossRef]
- IWMI Irrigated Area Map. Available online: http://waterdata.iwmi.org/applications/irri_area/ (accessed on 23 February 2022).
- ESA Land Cover CCI Product User Guide Version 2. Tech. Rep. Available online: http://maps.elie.ucl.ac.be/CCI/viewer/download/ESACCI-LC-Ph2-PUGv2_2.0.pdf (accessed on 23 February 2022).
- R Core Team R: A Language and Environment for Statistical Computing 2022; European Environment Agency: Copenhagen, Denmark, 2022.
- Wickham, H.; Averick, M.; Bryan, J.; Chang, W.; McGowan, L.; François, R.; Grolemund, G.; Hayes, A.; Henry, L.; Hester, J.; et al. Welcome to the Tidyverse. J. Open Source Softw. 2019, 4, 1686. [Google Scholar] [CrossRef]
- Pebesma, E. Simple Features for R: Standardized Support for Spatial Vector Data. R J. 2018, 10, 439. [Google Scholar] [CrossRef]
- Hijmans, R.J. Terra: Spatial Data Analysis, Version 1.6-47; CRAN: Windhoek, Namibia, 2022. [Google Scholar]
- Potapov, P.; Turubanova, S.; Hansen, M.C.; Tyukavina, A.; Zalles, V.; Khan, A.; Song, X.P.; Pickens, A.; Shen, Q.; Cortez, J. Global Maps of Cropland Extent and Change Show Accelerated Cropland Expansion in the Twenty-First Century. Nat. Food 2022, 3, 19–28. [Google Scholar] [CrossRef]
- Samasse, K.; Hanan, N.P.; Anchang, J.Y.; Diallo, Y. A High-Resolution Cropland Map for the West African Sahel Based on High-Density Training Data, Google Earth Engine, and Locally Optimized Machine Learning. Remote Sens. 2020, 12, 1436. [Google Scholar] [CrossRef]
- Zhang, D.; Pan, Y.; Zhang, J.; Hu, T.; Zhao, J.; Li, N.; Chen, Q. A Generalized Approach Based on Convolutional Neural Networks for Large Area Cropland Mapping at Very High Resolution. Remote Sens. Environ. 2020, 247, 111912. [Google Scholar] [CrossRef]
- Pérez-Hoyos, A.; Rembold, F.; Kerdiles, H.; Gallego, J. Comparison of Global Land Cover Datasets for Cropland Monitoring. Remote Sens. 2017, 9, 1118. [Google Scholar] [CrossRef]
- Radoux, J.; Bogaert, P. About the Pitfall of Erroneous Validation Data in the Estimation of Confusion Matrices. Remote Sens. 2020, 12, 4128. [Google Scholar] [CrossRef]
- Liu, W.; Ma, Z.; Lei, B. Spatiotemporal Distribution of Irrigation Water Use Efficiency from the Perspective of Water Footprints in Heilongjiang Province. Water 2022, 14, 1232. [Google Scholar] [CrossRef]
- Cao, X.; Wu, M.; Zheng, Y.; Guo, X.; Chen, D.; Wang, W. Can China Achieve Food Security through the Development of Irrigation? Reg. Environ. Change 2018, 18, 465–475. [Google Scholar] [CrossRef]
- Zhao, H.; Chang, J.; Havlík, P.; van Dijk, M.; Valin, H.; Janssens, C.; Ma, L.; Bai, Z.; Herrero, M.; Smith, P.; et al. China’s Future Food Demand and Its Implications for Trade and Environment. Nat. Sustain. 2021, 4, 1042–1051. [Google Scholar] [CrossRef]
- Liu, X.; Yu, L.; Li, W.; Peng, D.; Zhong, L.; Li, L.; Xin, Q.; Lu, H.; Yu, C.; Gong, P. Comparison of Country-Level Cropland Areas between ESA-CCI Land Cover Maps and FAOSTAT Data. Int. J. Remote Sens. 2018, 39, 6631–6645. [Google Scholar] [CrossRef]
- Tubiello, F.N.; Conchedda, G.; Casse, L.; Pengyu, H.; Zhongxin, C.; de Santis, G.; Fritz, S.; Muchoney, D. Measuring the World’s Cropland Area. Nat. Food 2023, 4, 30–32. [Google Scholar] [CrossRef]
- See, L.; Bayas, J.C.L.; Lesiv, M.; Schepaschenko, D.; Danylo, O.; McCallum, I.; Dürauer, M.; Georgieva, I.; Domian, D.; Fraisl, D.; et al. Lessons Learned in Developing Reference Data Sets with the Contribution of Citizens: The Geo-Wiki Experience. Environ. Res. Lett. 2022, 17, 065003. [Google Scholar] [CrossRef]
- Wang, Y.; Cao, M. The Decline of Canal Irrigation in China: Causes, Impacts and Implications. Water Altern. 2021, 14, 332–349. [Google Scholar]
- Ning, J.; Liu, J.; Kuang, W.; Xu, X.; Zhang, S.; Yan, C.; Li, R.; Wu, S.; Hu, Y.; Du, G.; et al. Spatiotemporal Patterns and Characteristics of Land-Use Change in China during 2010–2015. J. Geogr. Sci. 2018, 28, 547–562. [Google Scholar] [CrossRef]
- Ambika, A.K.; Wardlow, B.; Mishra, V. Remotely Sensed High Resolution Irrigated Area Mapping in India for 2000 to 2015. Sci. Data 2016, 3, 118. [Google Scholar] [CrossRef]
Figure 1.
Development of effective irrigated areas (EIA) in China over the last two decades. EIA is the irrigated area of cropland (e.g., annual food crops). Target years are depicted in blue. Source: China Statistical Yearbook.
Figure 1.
Development of effective irrigated areas (EIA) in China over the last two decades. EIA is the irrigated area of cropland (e.g., annual food crops). Target years are depicted in blue. Source: China Statistical Yearbook.

Figure 2.
Overview of the approach to create a synergy irrigation map.

Figure 3.
Synergy irrigation map for (a) 2005 and (b) 2015.

Figure 4.
Change in the irrigated area: 2005–2015. (a) Percentage point change in the irrigated area at the grid cell level. Change is measured as the difference in the share of irrigated area in the total grid cell area between 2005 and 2015. The cut-off value of 15 pp is close to the 25% (11 pp decline) and 75% (22 pp increase) interquartile values. (b) Decomposition of the change in the total irrigated area between 2005 and 2015 in terms of expansion (exp.) and contraction (con.). Totals may differ because of rounding.

Figure 5.
Change in the irrigated area by province, decomposed in an expansion and contraction effect: 2005–2015. Columns to the left indicate the irrigated area in 2005 plus the expansion effect. Columns to the right indicate the irrigated area in 2015 plus the contraction effect (compare with Figure 4b).

Figure 6.
Agreement between the number of input maps used to construct the synergy irrigation maps. See Annex A for the corresponding input ranking and score.
Figure 6.
Agreement between the number of input maps used to construct the synergy irrigation maps. See Annex A for the corresponding input ranking and score.

Figure 7.
Confusion matrix for the 2005 synergy map.

Table 1.
Input products for the creation of the synergy irrigation maps for China.
| Maps | Scale | Time | Resolution | Source | Type | Methodology | 2000–2009 | 2010–2019 |
|---|---|---|---|---|---|---|---|---|
| GRIPC | Global | 2005 | 500, spatial | [6] | Cropland | Remote sensing | X | |
| NAGARAJ | Global | 2001–2015 | 9 km | [4] | Irrigation | Machine learning | X | X |
| GIA | Global | 1999–2012 | 30 arc seconds | [9] | Irrigation | Remote sensing | X | |
| CHN | Regional: China | 2000 | 1 km | [26] | Irrigation | Downscaling | X | |
| ZOHAIB | Global | 2015 | 25 km spatial | [13] | Irrigation | Remote sensing | X | |
| IAM | Regional: Asia | 2000 & 2010 | 250 m spatial | [27] | Irrigation | Remote sensing | X | X |
| ESCACCI | Global | 1992–2015 | 300 m spatial | [28] | Cropland | Remote sensing | X | X |
Table 2.
Priority ranking of irrigation products for 2005 and 2015. See Table 1 for details about the data sources.
Table 2.
Priority ranking of irrigation products for 2005 and 2015. See Table 1 for details about the data sources.
| Priority Ranking 2005 | Priority Ranking 2015 |
|---|---|
| IAM | IAM |
| ESACCI | ESACCI |
| NAGARAJ | NAGARAJ |
| GRIPC | GIA |
| CHN | ZOHAIB |
Disclaimer/Publisher’s Note: The statements, opinions and data contained in all publications are solely those of the individual author(s) and contributor(s) and not of MDPI and/or the editor(s). MDPI and/or the editor(s) disclaim responsibility for any injury to people or property resulting from any ideas, methods, instructions or products referred to in the content. |
© 2023 by the authors. Licensee MDPI, Basel, Switzerland. This article is an open access article distributed under the terms and conditions of the Creative Commons Attribution (CC BY) license (https://creativecommons.org/licenses/by/4.0/).
Share and Cite
MDPI and ACS Style
van Dijk, M.; Geurtsen, S. Mapping Irrigated Areas in China Using a Synergy Approach. Water 2023, 15, 1666. https://doi.org/10.3390/w15091666
AMA Style
van Dijk M, Geurtsen S. Mapping Irrigated Areas in China Using a Synergy Approach. Water. 2023; 15(9):1666. https://doi.org/10.3390/w15091666
Chicago/Turabian Stylevan Dijk, Michiel, and Susan Geurtsen. 2023. "Mapping Irrigated Areas in China Using a Synergy Approach" Water 15, no. 9: 1666. https://doi.org/10.3390/w15091666
Note that from the first issue of 2016, this journal uses article numbers instead of page numbers. See further details here.