Article

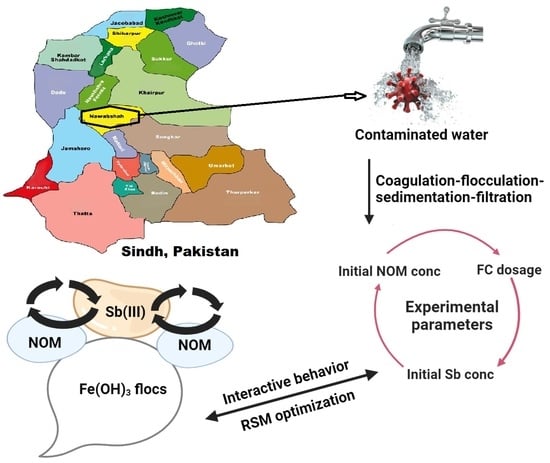
Competitive Removal of Antimony and Humic Acid by Ferric Chloride: Optimization of Coagulation Process Using Response Surface Methodology

1
School of Civil and Environmental Engineering (SCEE), Institute of Environmental Sciences and Engineering (IESE), National University of Sciences and Technology (NUST), H-12 Campus, Islamabad 44000, Pakistan
2
Department of Chemical Engineering, Quaid-e-Awam University of Engineering, Science and Technology (QUEST), Nawabshah 67480, Pakistan
3
Department of Energy and Environmental Engineering, Catholic University, Seoul 14662, Republic of Korea
4
Graduate School of Water Resources, Sungkyunkwan University (SKKU), Suwon 16419, Republic of Korea
*
Authors to whom correspondence should be addressed.
Water 2023, 15(9), 1676; https://doi.org/10.3390/w15091676
Submission received: 12 February 2023 / Revised: 11 March 2023 / Accepted: 16 March 2023 / Published: 25 April 2023
(This article belongs to the Section Wastewater Treatment and Reuse)

Abstract

:
The co-contamination of aquatic systems with antimony (Sb) and humic acid (HA) is a global concern due to their potential risks to human health and environment. In this research, three-level-three-variable Box–Behnken design (BBD) was investigated for simultaneous Sb(III) and total organic carbon (TOC) removal responses from groundwater by use of ferric chloride (FC) as a coagulant. This study focuses on three operating variables, including initial Sb(III) concentration (100, 550, and 1000 μg/L), HA concentration (2, 6, and 10 mgC/L) and FC dosages (20, 60, and 100 mg/L). The proposed quadratic model presented good correlation with experimental values having R2 and adjusted R2 values of response variables (Sb(III): 0.9981 and 0.9956) and (TOC: 0.9935 and 0.9851), respectively. The most pronounced influence of FC dosage was observed in the removal responses of TOC and Sb(III). Interestingly, the model revealed that a high level of FC dosage had the same TOC removal potential regardless of increasing HA concentration. The statistical model for both Sb(III) and TOC responses was used to optimize the experimental conditions. Moreover, the experimental results were successfully validated with predicted values having high accuracy. The sludge volume produced for studied variables followed the decreasing order as FC dosage > HA concentration > Sb(III) concentration. Under optimum conditions, 0.45 mL/L sludge volume was produced in the treatment of ground water in Nawabshah. In general, the results of the current study may provide some insights into the predictability of simultaneous removal performance of Sb species and organic substances from groundwater.

Graphical Abstract

1. Introduction

Antimony (Sb) is semi-metallic element having numerous applications in the manufacture of pesticides, plastics, flame retardants, feed additives, batteries, and semiconductor materials [1,2,3]. A recent research survey [4] has indicated the global annual consumption of Sb to be 188,000 tons. The release of Sb and its compounds from natural as well as anthropogenic sources into water bodies is a severe problem in many regions of the world [5,6,7,8]. For instance, the elevated Sb concentrations have been observed as 239 µg/L in Alaska watersheds (USA), 6384 µg/L in Hunan Province rivers (China), and 157 µg/L in Sindh Province lakes (Pakistan), respectively [9,10,11,12]. Because of its toxicity and carcinogenicity, such high amounts of Sb pollution pose a potential risk to human health and aquatic life [10,13]. The ingestion of Sb into the human body causes harmful health effects, such as vomiting, cardiac toxicity, abdominal cramps, and diarrhea [13]. Therefore, Sb is included in the priority interest pollutant list by the European Union (EU) and United States Environmental Protection Agency (USEPA) [12]. Moreover, to protect humans from associated health effects, the maximum permissible Sb limits in potable water is therefore regulated at 6 µg/L (USSEPA), 10 µg/L (EU), 20 µg/L (South Korea), and 5 µg/L (Pakistan and World Health Organization) [14,15,16]. Therefore, it will be worthy to explore cost effective and efficient methods for removal of Sb ions from real water environments.
Various treatment technologies have been employed to control Sb mobility in aquatic environment. These includes coagulation, adsorption, membrane separation, bioremediation, and electrochemical processes [12,17,18,19]. Among them, a conventional coagulation process is adopted by various water treatment plants owing to its high efficiency and low operational cost [17,18,19,20]. Previous research [21,22] has demonstrated the efficacy of ferric chloride (FC) coagulant in efficient Sb removal from water. By contrast, the coagulation behavior of Sb ions was remarkably affected due to coexistence of other organic substances, including humic acid (HA) in aqueous solutions [21,23]. Various categories of organic molecules are all over present in the water bodies, with concentrations values up to 10 mg C/L [18,24]. These organic species tend to bind with Sb ions, which may account for mobility of metal ions in the natural environment by several means, which makes interaction between organic matter and Sb an attractive topic for research [18,24,25]. Among various organic species, HA molecules are high molecular weight hydrophobic compounds having phenol, carboxyl, amine, and hydroxyl groups, with strong interactive capacity with metals [26]. However, these HA molecules may form complexes with iron (Fe) and Sb species during the FC coagulation process, thereby affecting the efficiency of the water treatment system and posing adverse human health effects [16,27]. To date, the influence of HA on the adsorption, complexation, speciation, and coagulation behavior of Sb have been reported in previous studies [23,28,29]. However, the literature provides insufficient knowledge about the interacting performance of Sb and HA during the water treatment process, necessitating additional research as a significant aspect focusing on the operating parameters in commonly applied drinking water treatment technologies.
The existence of organic ligands, i.e., HA in Sb-contaminated water, may offer a probable route for humans, particularly if it is used for drinking purposes. This necessitates the removal of both Sb and HA from drinking water, whereby conventional water treatment processes are commonly applied [18,24,25]. Therefore, it is essential to obtain optimal operating conditions for both Sb and HA removal by coagulation. For such a purpose, a one factor at a time (OFAT) approach may be employed. However, this classical technique has certain drawbacks, including time and energy consumption, and the incapability to reveal the optimum combination of independent variables because it ignores their interactions [30,31]. To address this problem, statistical design of experiments has received substantial attention. In such a case, response surface methodology (RSM) has been widely applied since it provides information on the interactions of operating parameters while also reducing the number of experimental trials essential to achieve accurate results. RSM uses regression analysis of experimental data to model and analyze problems in which a response of interest is influenced by numerous independent variables, and the goal is to optimize this response. The obtained equation represents a single response function of dependent variable and graphed as a response surface and contour [31,32].
The available literature on the applications of RSM to investigate interactive behavior of operating parameters in drinking water treatment is limited. For instance, previous research [30] investigated the simultaneous removal responses of turbidity and dissolved organic carbon (DOC) using RSM by a coagulation process. An earlier study [32] also showed applicability of RSM for simultaneous removal of arsenic (As) and DOC during the chemical coagulation process. Our previous study [33] investigated Sb removal by varying initial Sb concentration, FC dosage, and pH values using RSM and the Box–Behnken design (BBD) model. However, the developed model did not account for the interaction of organic species, and up to 12% of total variation in Sb removal response was not described by the model. As a result, the literature studies that use RSM to explore the removal of both Sb and HA are still scarce and need investigation.
This research aims to utilize RSM and BBD to examine and model simultaneous removal performance of total organic carbon (TOC) and Sb, to classify their relations during the FC coagulation method, to validate the model, and to optimize removal responses obtained using natural water from the potable water supply source in Nawabshah, Sindh Province, Pakistan. Furthermore, the current work also assesses the change in sludge volumes generated as a function of three independent variables, including initial Sb(III) concentration, initial HA concentration, and FC dosages.

2. Materials and Methods

2.1. Preparation of Stock Solutions and Test Samples

The 100 mg/L Sb(III) stock solution was prepared with antimony (III) oxide (Sb2O3) in 2M hydrochloric acid (HCl) solution. The 1000 mg/L (417 mgC/L) stock solution of humic acid (HA) was prepared by adding HA powder in pure water. The sodium hydroxide (NaOH) solution was used to adjust pH of HA stock solution to 11 and was stirred at 100 rpm for 24 h [29]. This model organic matter is widely used to simulate natural water conditions [18,24]. The 1000 mg/L coagulant stock solution was prepared by adding ferric chloride hexahydrate (FeCl3·6H2O) in pure water. The groundwater sample was collected from the locality in Nawabshah, Sindh Province, Pakistan, whose detailed characteristics are presented in Table 1. To acquire test samples with required concentrations of Sb(III), HA, and FC, a desired volume of prepared stock solutions were spiked in the groundwater sample. After the addition of required reagents, the pH of test samples was maintained to 7 using 0.1 M HCl and NaOH solutions for subsequent coagulation experiments.

2.2. Experimental Procedure and Analytical Techniques

The operating procedure was set based on a conventional treatment process used in water treatment plants. The predetermined quantity of FC dosage was first supplied to test samples in all trials during a rapid coagulation phase followed by a pH adjustment to 7, which is close to real groundwater conditions. The experimental procedure was then executed using a jar tester apparatus (Model: SJ-10, Young Hana Tech Co., Ltd., Gyeongsangbuk-Do, Korea) in various phases: Flash mixing phase (coagulation at 140 rpm for 3 min); slow mixing phase (flocculation at 40 rpm for 20 min); and sedimentation phase (settling of particles for 30 min) [24,25,29,31]. The aliquots were collected after experimental procedure and analyzed for quantifying TOC content using an unfiltered sample using a TOC analyzer (TOC-5000A, Shimadzu Corp, Kyoto, Japan). For quantification of residual Sb(III) content in water, an aliquot was filtered using 0.45 μm filter paper and then measured by hydride generation atomic absorption spectrophotometer (HG-AAS: Model NovAA 800D, Analytik Jena, Jena, Germany).

2.3. Experimental Design and Statistical Analysis

Design Expert software (Version 8.0.6, USA) was used for the experimental design, determination of coefficients, statistical analysis of data, and plotting of response graphs. The BBD method was employed to investigate the influence of three independent variables, including initial Sb(III) concentration (A: 100–1000 µg/L), initial HA concentration (B: 2–10 mgC/L), and FC coagulant dose (C: 20–100 mg/L) on the TOC and Sb(III) removal process [34]. This BBD was utilized to inspect all three independent variables at three equally spaced coded levels designated as −1 (low), 0 (middle), +1 (high) levels of each variable (Table 2). The detailed methodology adopted with our experimental data set using BBD and RSM is presented in Section S1. The produced sludge volume in each experimental trial was quantified after 30 min of sedimentation time for all studied independent variables.

3. Results and Discussion

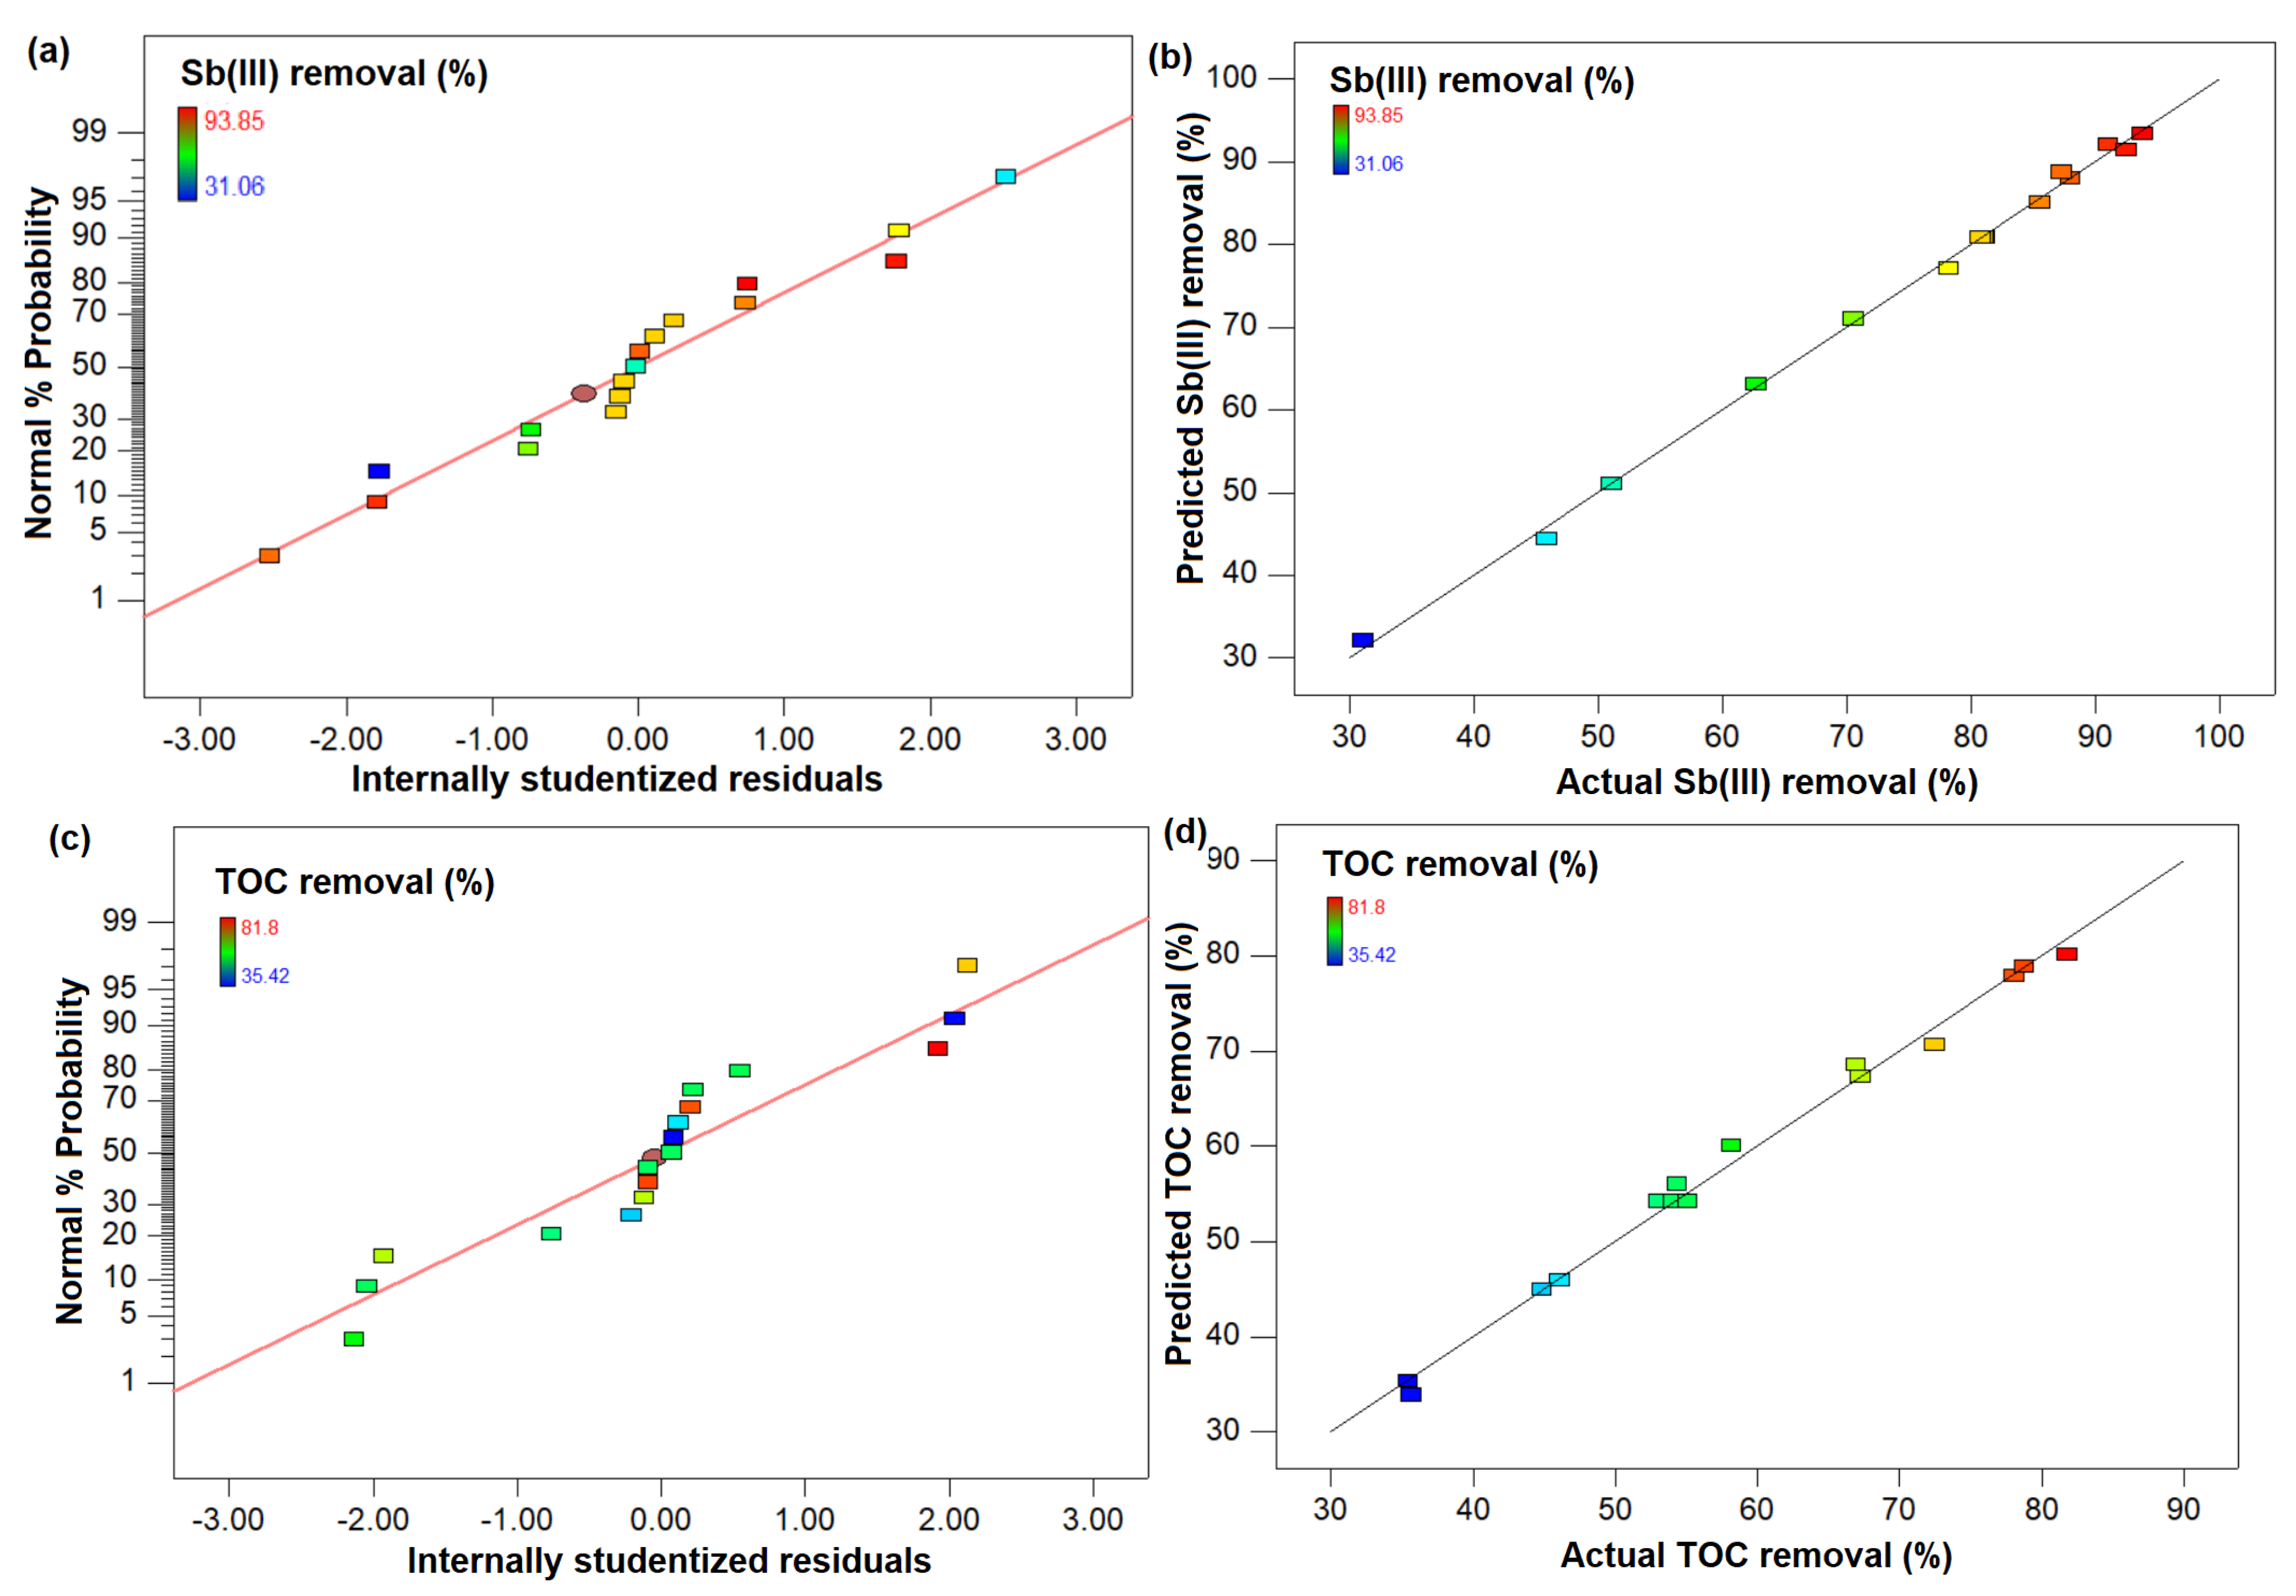
3.1. Identifying Best Response Function Using Statistical Analysis

The RSM and BBD were used to model the experimental data of Sb(III) and TOC removal for each run as presented in Table S1. The experimental data were correlated with linear, interactive (2FI), quadratic, and cubic models, and the adequacy of each model for Sb(III) as well as TOC removal was examined from model summary statistics (Table 3). The summary statistics of the linear model indicate adjusted R2 (R2Adj) and predicted R2 (R2Pre) values of (0.7516, 0.5748) and (0.6058, 0.3024) for Sb(III) and TOC removal, respectively. Moreover, R2Adj and R2Pre values in 2FI model were observed to be (0.7300, 0.7708) and (0.2503, 0.3700), respectively. In accordance, significant variation in R2Adj and R2Pre values in both linear and 2FI models with high standard deviation were found. Therefore, these models seems to be inadequate for estimation of Sb(III) and TOC removal responses. The quadratic model summary statistics, by contrast, demonstrated a better fitting of experimental Sb(III) and TOC removal with the highest regression coefficients, R2Adj and R2Pre values, and low standard deviation. While the cubic model showed aliasing owing to lack of data points availability for model coefficients estimation. Therefore, further analysis was performed using the quadratic model [33].

3.2. Fitting the Models

The quadratic model statistics as well as analysis of variance (ANOVA) results for Sb(III) and TOC removal responses are presented in Table 4. F-test and ANOVA results were used to assess the statistical significance of the generated response function. The quadratic model was found to be significant with p value < 0.0001 for both TOC and Sb(III) removal with F values of 118.86 and 402.40, respectively. These statistical values suggested that there is only a 0.01% possibility that an F value this large could occur owing to noise. Moreover, the F value for “lack of fit” of 95.34 for Sb(III) removal indicates that the it is significant in comparison to pure errors, and there is a 0.04% probability that the F value for “lack of fit” this huge could be attributable to noise. In comparison, the “lack of fit F value” of 10.97 for TOC removal suggests that the “lack of fit” is insignificant compared to pure errors, with a 2.12% possibility that the F value for “lack of fit” this huge might be due to noise. Among the studied variables, the linear term “FC dosage: with the highest F values” in both Sb(III) and TOC removal responses is the most influential parameter during the coagulation process. For Sb(III) removal, statistical analysis indicated all three linear terms (A-initial Sb(III) concentration, B-initial HA concentration, and C-FC dosage), two interactive terms (initial Sb(III) concentration × FC dosage and initial HA concentration × FC dosage), and one quadratic term (FC dosage × FC dosage) as significant factors during the coagulation process. However, all linear, interactive, and quadratic terms except (FC dosage × FC dosage) were found to be significant in the TOC removal process. The model results are comparable with the earlier reported literature [28,29,35], where FC dosage was identified as a critical parameter for producing more iron precipitates in a multicomponent aquatic environment to achieve good Sb removal. Moreover, it was also previously reported that the TOC removal process can be achieved to an extent; adding more FC coagulant may not further enhance TOC removal during the chemical coagulation process [28]. In general, the statistical analysis indicated that the quadratic model may satisfactorily explain the relationship between model responses and variables.
The model response variables showed excellent correlation with experimental results, as evidenced by their coefficient of determination R2 (Sb(III)-R2: 0.9981) and (TOC-R2: 0.9935). The R2Adj values for both removal responses (Sb(III): 0.9956; and TOC: 0.9851) indicated that total variation in Sb(III) (0.44%) and TOC (1.14%) removal might not be described by the model. It is also obvious that R2Pre values of Sb(III) (0.9695) and TOC (0.9062) are in close agreement with R2Adj values. In accordance, the adequate precision values of 67.722 and 35.044 for Sb(III) and TOC removal responses, respectively, indicate sufficient signal. Hence, the selected model can predict removal responses of Sb(III) and TOC from water effectively [31,33]. The final quadratic regression model for TOC and Sb(III) removal in terms of coded factors can be expressed using Equations (1) and (2).
TOC removal = 54.25 − 2.68A − 8.00B + 13.77C − 4.34AB − 8.23AC + 8.63BC − 2.88 A2 + 9.64B2 + 1.85C2
Sb(III) removal = 80.85 + 1.86A − 9.34B + 20.34C +1.22AB − 1.49AC + 6.17BC + 1.33A2 + 1.24B2 − 14.13C2
Diagnostic plots, including the plot of predicted value versus actual value and the normal plot of studentized residuals, validate the model predictability, suggesting acceptable approximation of the real system (Figure 1). The normal probability plot in the Sb(III) and TOC removal process is presented in Figure 1a,c, and it generally exhibits a normal distribution with no evident trend and with some expected scattered data points. Moreover, Figure 1b,d indicate good agreement of modeled values with the experimental results, thus validating the robustness of the studied system. In general, these results suggested that experimental data points can be estimated with high accuracy using the quadratic model.

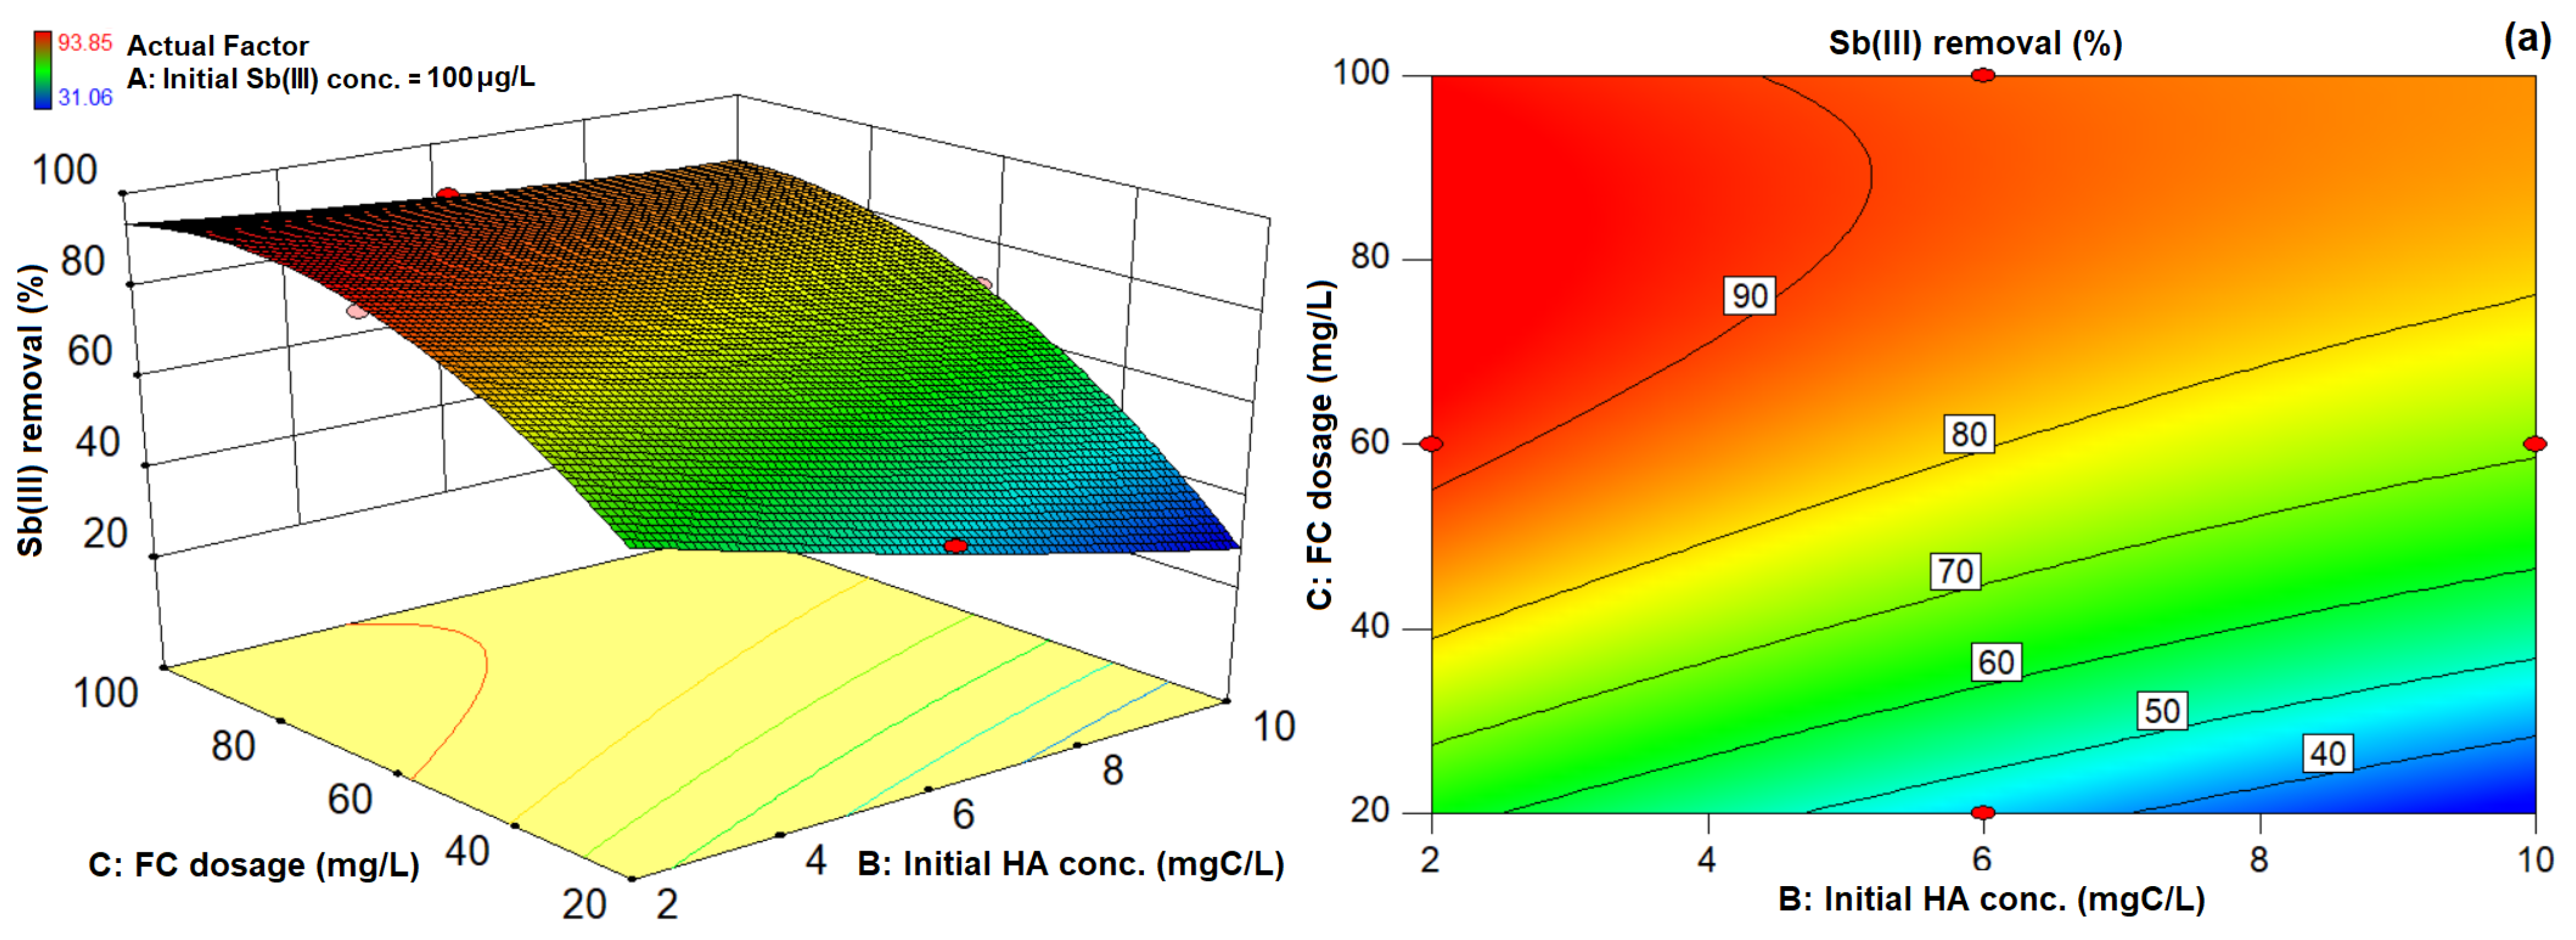
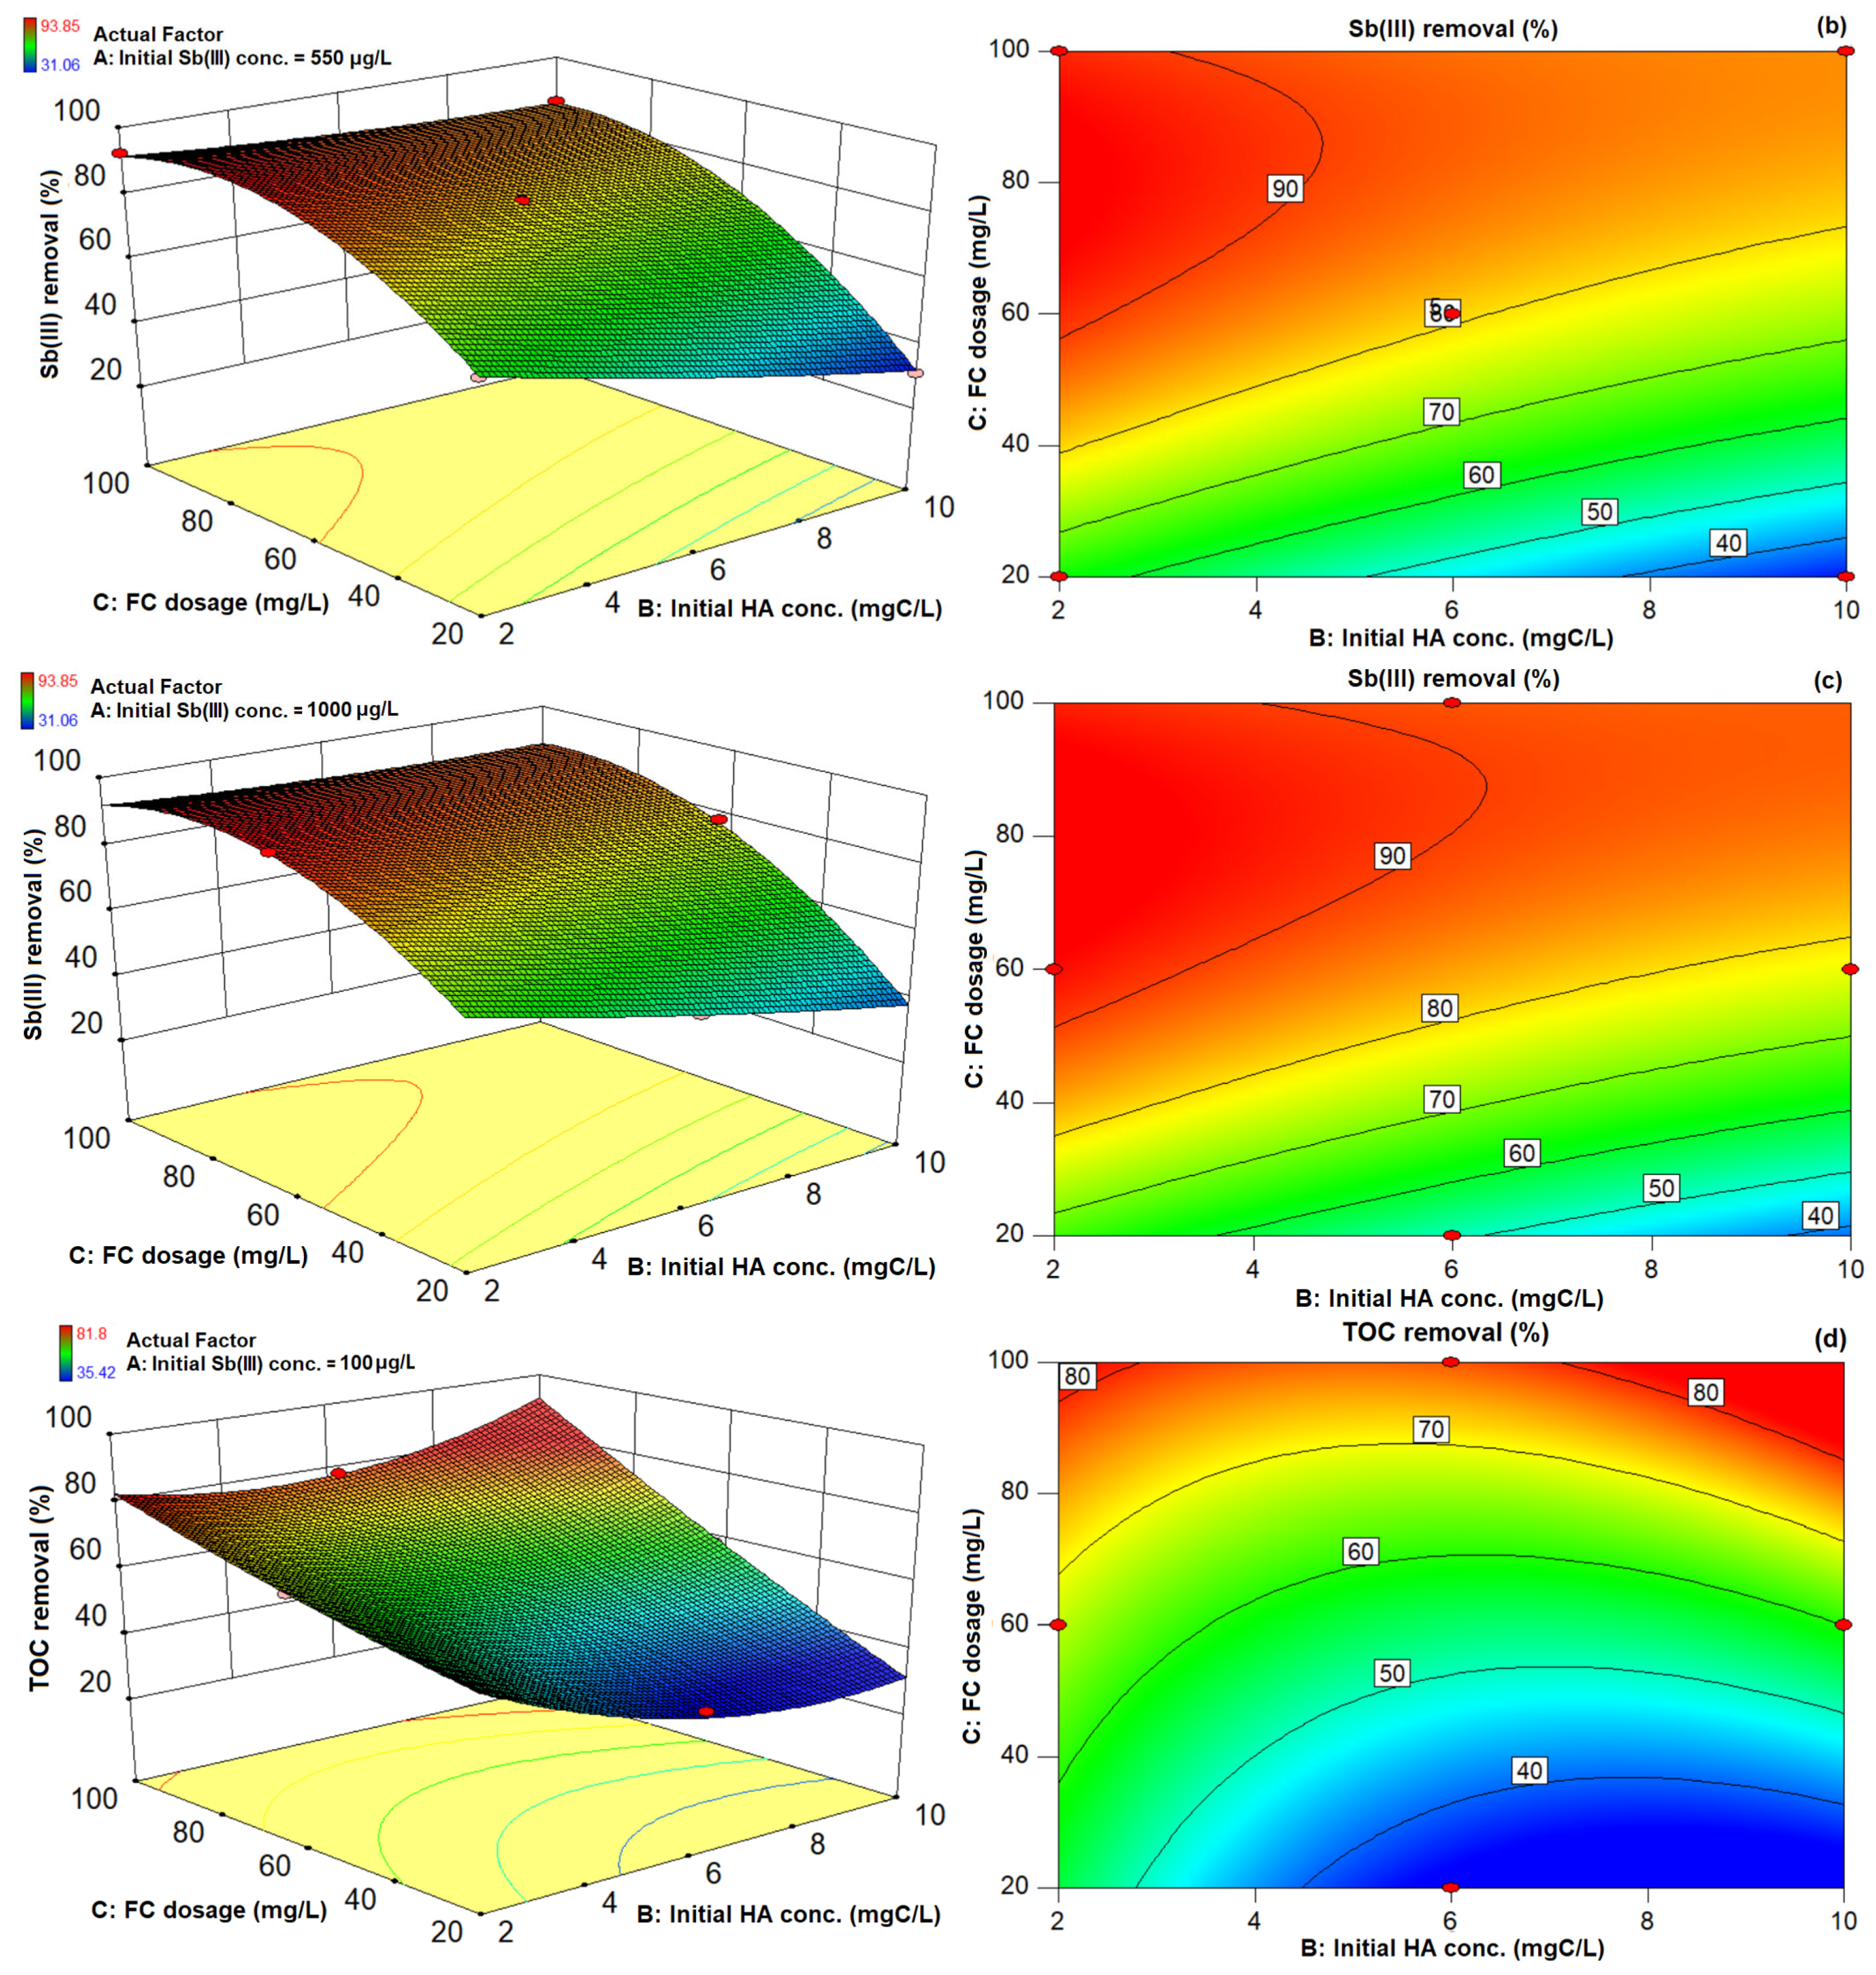
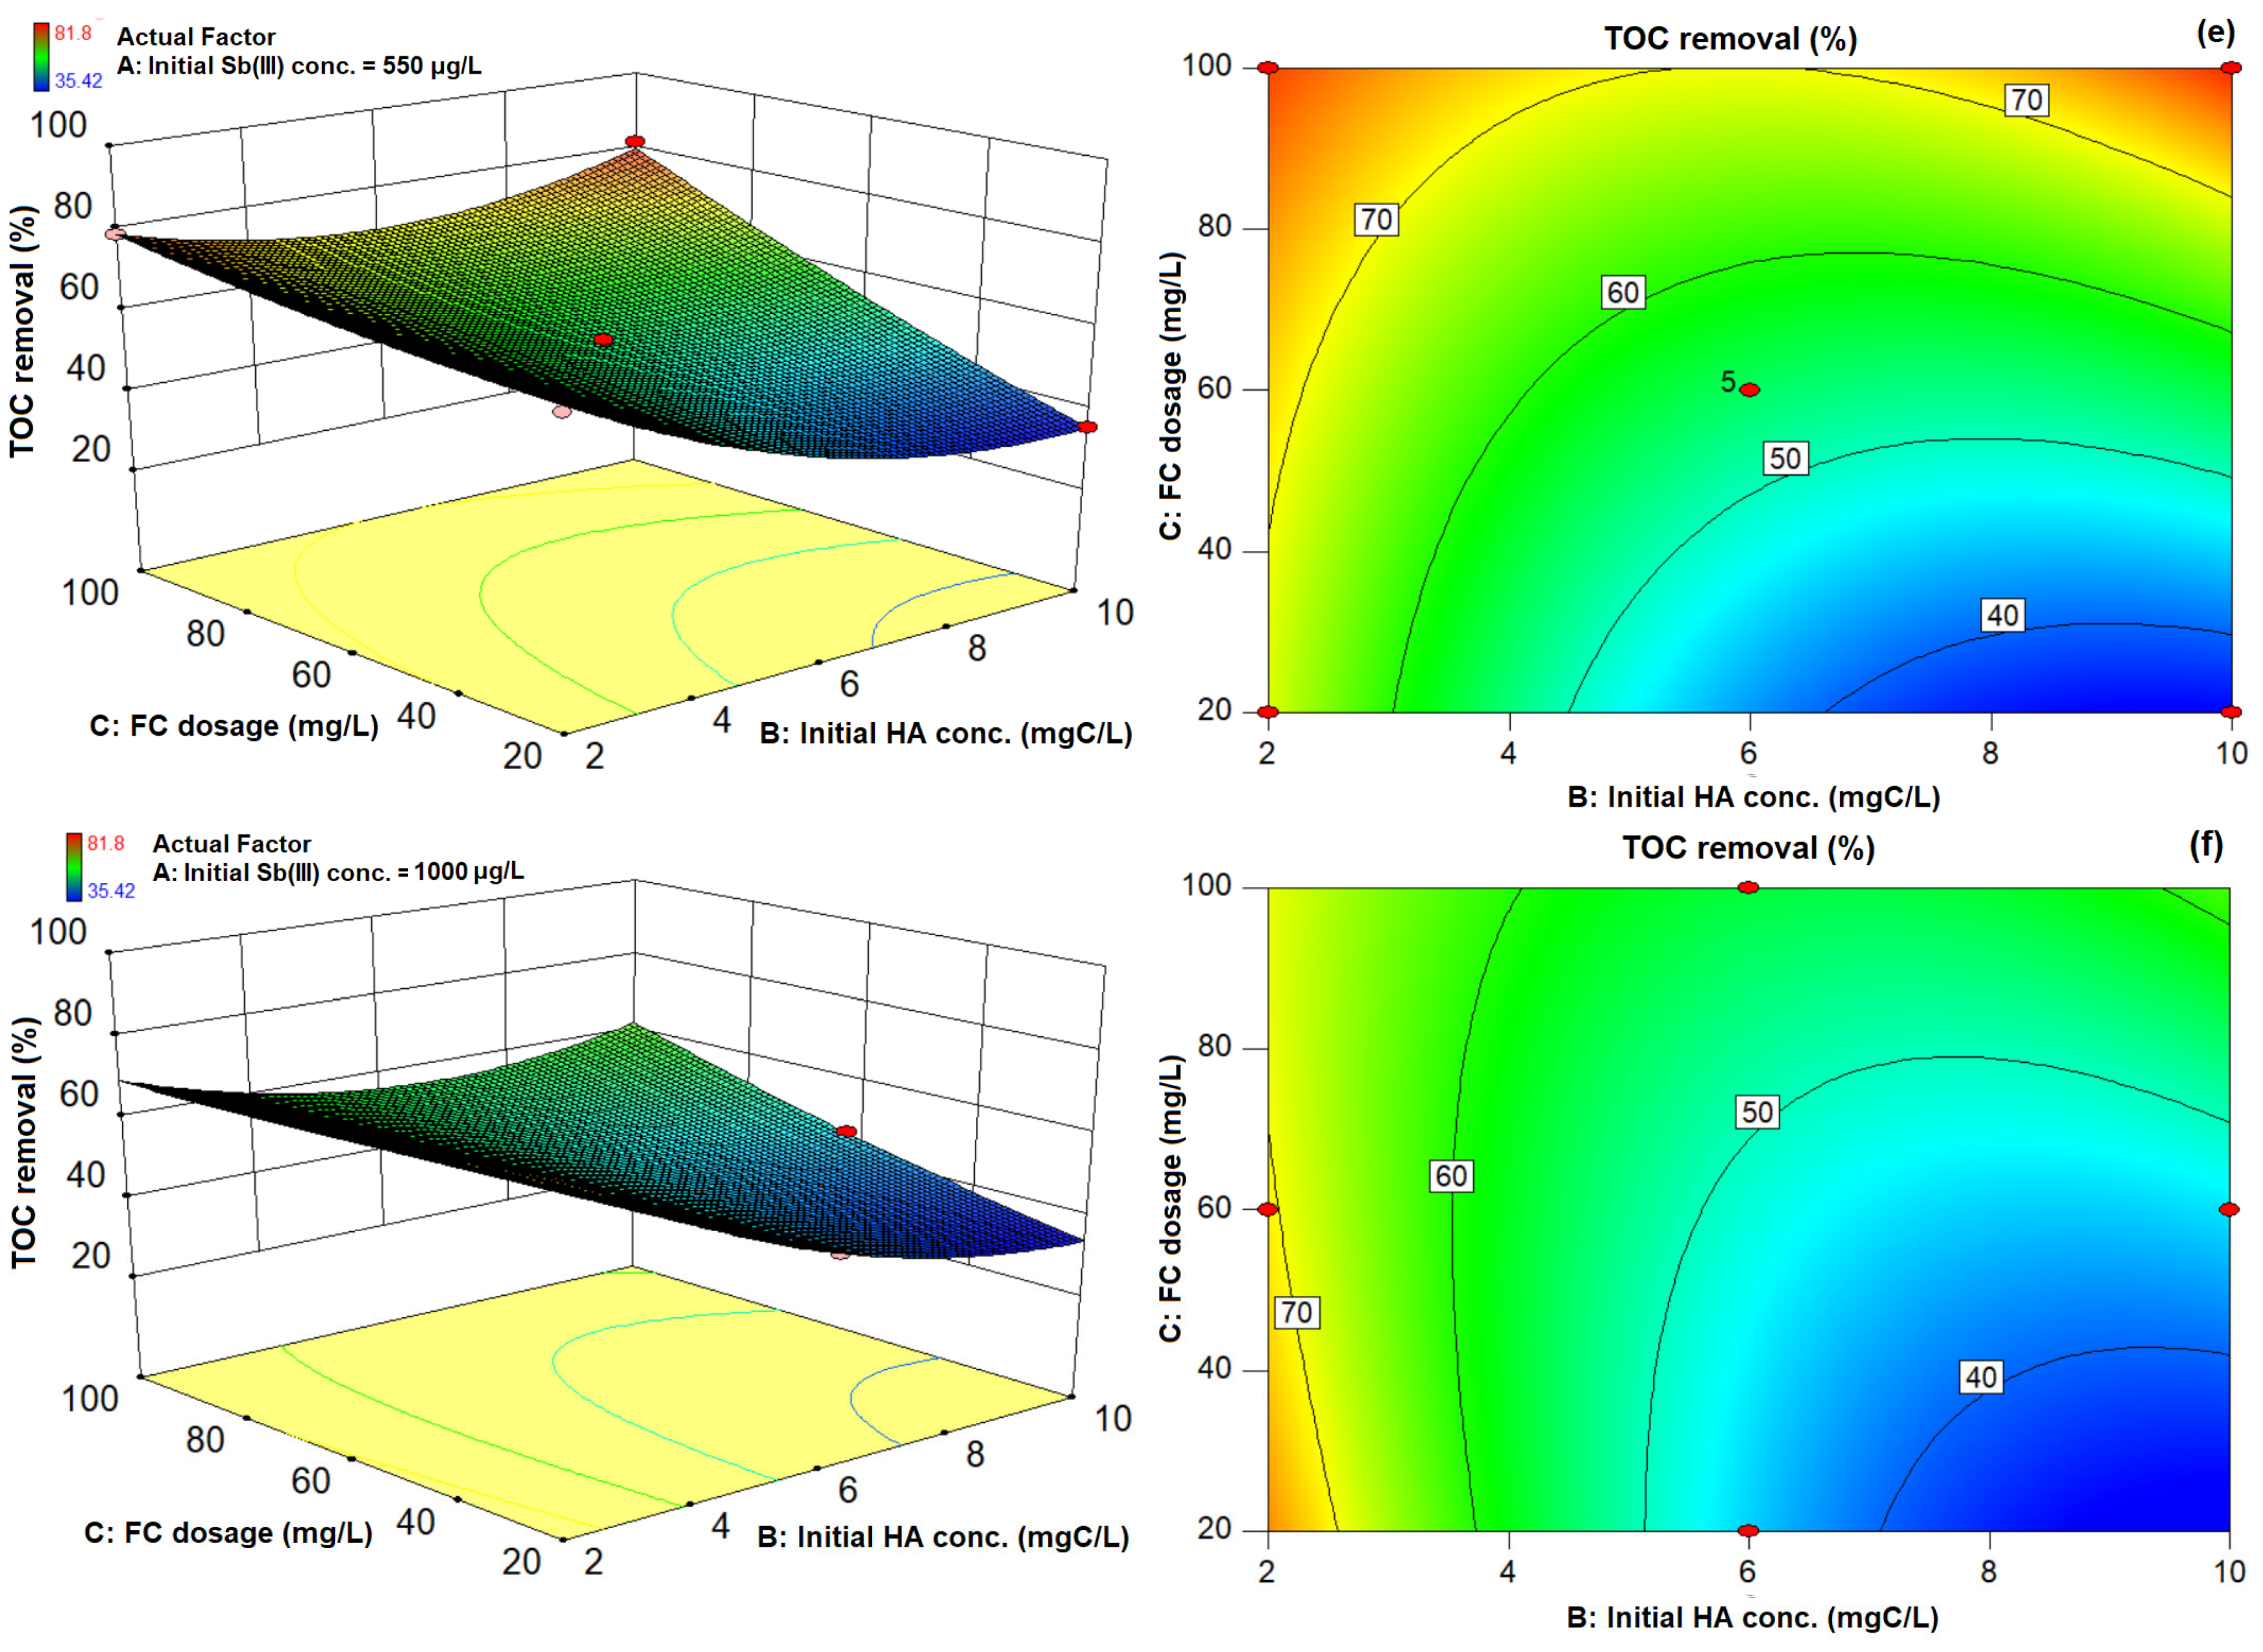
3.3. 3D Response Surface Plots and 2D Contour Plots of Sb(III) and TOC Removal

The 3D response surface plots display the function of any two independent variables on removal responses while keeping other variables fixed at desired levels, thus indicating the main and interactive effects of the two studied factors. Similarly, 2D contour plots can indicate the effect of variables on the removal response. Therefore, 3D response surface plots and 2D contour maps of Sb(III) and TOC removal using quadratic model were generated (Figure 2). As indicated in Table 4, initial HA concentration (B) and FC dosage (C) with the highest F value are observed as one of the most influential parameters in both the Sb(III) and TOC removal process. Therefore, both initial HA concentration and FC dosage were used to demonstrate model output with a third variable, initial Sb(III) concentration held at 100 µg/L, 550 µg/L, and 1000 µg/L, respectively.
The removal responses of Sb(III) ions as a function of FC dosage and initial HA concentration are shown in Figure 2a–c. For lowest initial Sb(III) concentration level, i.e., 100 µg/L, Figure 2a presents Sb(III) removal responses. It was observed that at a low initial HA concentration, Sb(III) removal was maximum, i.e., around 63% and 93.85% with minimum and maximum FC dosages required to carry out the coagulation process (Figure 2a). These results are consistent with our previous study, which showed strong complexation reactions between HA and Sb(III) (at low concentration), thus more Sb(III) binds with HA resulting in more Sb(III) adsorption onto coagulated flocs [28]. However, the sensitivity of the Sb(III) removal process is greatly influenced upon increasing the initial HA concentration and requires more flocs surface to achieve better Sb(III) removal. These results suggest that HA molecules compete with Sb(III) ions on the floc surface owing to steric interference and considerably greater complexations between HA and coagulated flocs [29]. This explains the significant effect of the initial HA concentration on Sb(III) removal during the treatment process, when Sb(III) ions are present at low levels in an aqueous environment. Similarly, at higher initial Sb(III) concentrations (Figure 2b,c), the pronounced effect of HA molecules on Sb(III) removal response was also observed. However, higher Sb(III) levels presented slightly better Sb(III) removal efficiencies at varying HA concentrations. Such observations may be due to the presence of more free and HA-bound Sb(III) ions in the suspension, with higher adsorption tendency toward coagulated flocs due to higher collision probability [36]. As presented in Table 4, the BBD response function for Sb(III) removal includes two linear terms, i.e., initial HA concentration, FC dosage, and one quadratic term, i.e., FC dosage × FC dosage as the most significant parameter. The argument in Figure 2a–c is strongly supported by ANOVA results of Sb(III) removal, and these terms are essential in the determination of Sb(III) removal from water. Overall, these findings are supported by previous work, which indicated coprecipitation, complexation, and physical adsorption as a major Sb(III) removal mechanism during the FC coagulation process [37].
The TOC removal responses as a function of HA and FC dosage at three initial Sb(III) concentration levels is shown in Figure 2d–f. At 100 µg/L Sb(III) level, Figure 2d shows the HA removal response. At a low initial HA concentration of 2 mgC/L, FC dosages of 20 mg/L and 100 mg/L achieve 54.5% and 80.9% TOC removal. However, at 10 mgC/L HA, 35.42% and 81.8% TOC removal was achieved at FC dosages of 20 mg/L and 100 mg/L, respectively. These results suggest that FC dosage is the most significant parameter at a low initial HA concentration. However, the addition of more FC coagulant at higher initial HA levels has insignificant impact on the TOC removal response. These results are consistent with previous research [28], which found an insignificant increase in TOC removal performance after optimum conditions with an increasing FC dosage for highly HA-contaminated suspensions. Similarly, the BBD removal response function of TOC also indicated that the quadratic term (FC dosage × FC dosage) is counterproductive and thus will not improve the TOC removal process (Table 4). Such observation is in good agreement with the previous literature, which reported that increasing the coagulant dosage beyond optimal removal range was ineffective in improving dissolved organic carbon removal from water [30,32]. Moreover, increasing the initial Sb(III) concentration levels, i.e., 550 µg/L and 1000 µg/L, hinders the TOC removal process at high FC dosages up to 75% and 60%, respectively (Figure 2e,f), thus indicating the competing role of Sb(III) ions with HA molecules during the coagulation process [18,24,25,28]. In general, our findings indicate the interactive behavior between Sb(III) and HA molecules, and their influence on simultaneous Sb(III) and TOC removal responses, with the aim of providing remarkable outcomes for large scale conventional water treatment plants.

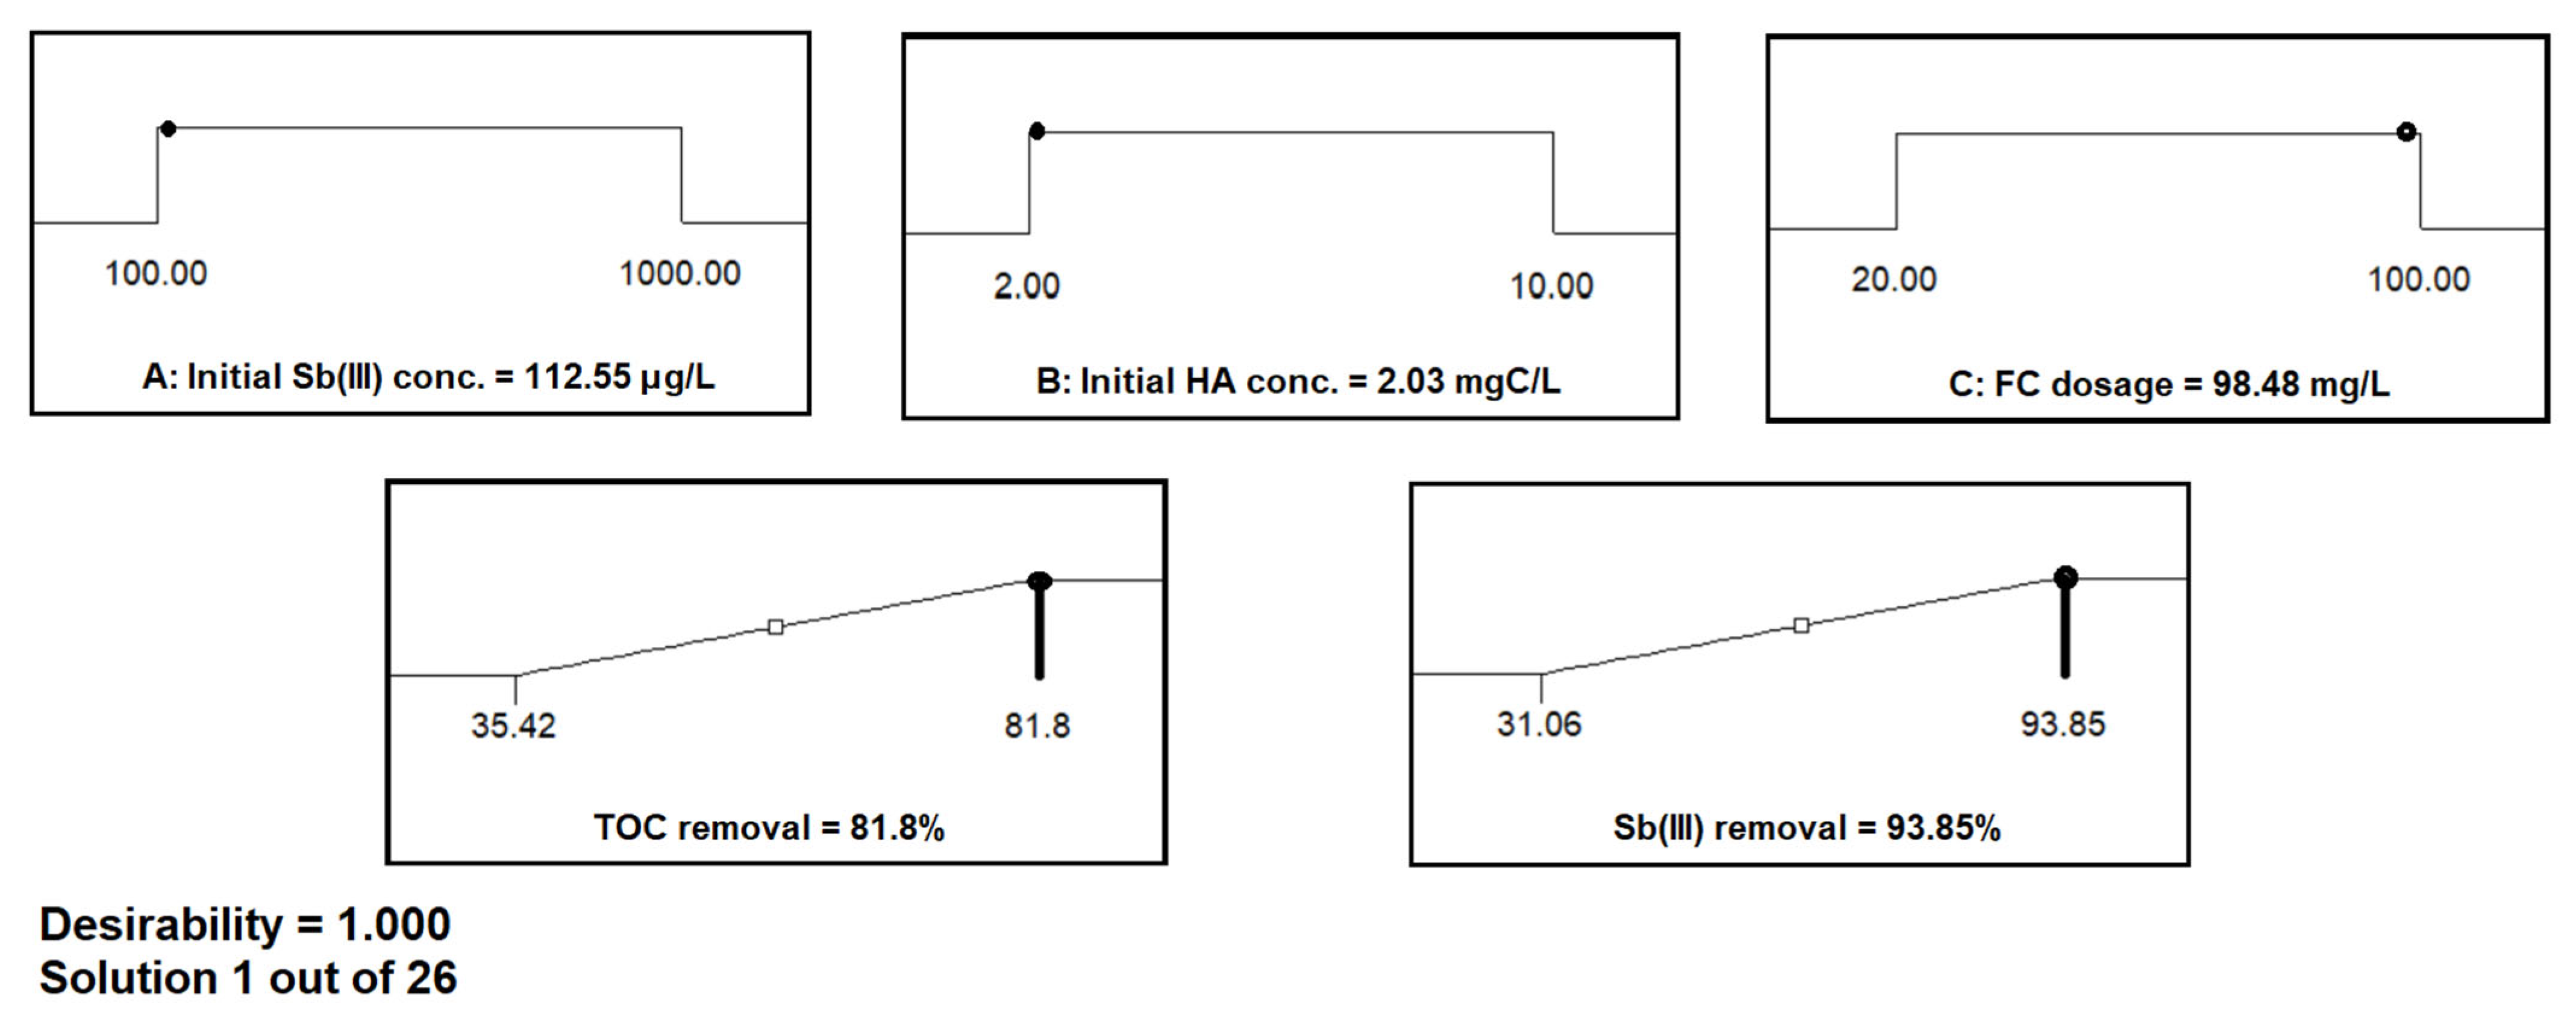
3.4. Optimum Experimental Design Conditions for Sb(III) and TOC Removal

To optimize the FC coagulation process using BBD statistical design, it is necessary to examine the response functions, to evaluate the factors by fitting them in the statistical model that fits the experimental data precisely, to predict and compare the response values of the fitted model with the experimental results, and to confirm the model’s adequacy [38]. Therefore, we have discussed the applicability of developed models in previous sections. In order to identify optimum removal responses for simultaneous Sb(III) and TOC removal, the values of independent variables, including initial HA Sb(III) concentration, initial HA concentration, and FC dosages, were kept in the levels’ range, and Sb(III) and TOC removal responses were set as maximize. The model suggested several experimental conditions for effective removal of TOC and Sb(III) by FC coagulation. Among them, optimal experimental conditions for maximum simultaneous Sb(III) and TOC removal were selected based on desirability of 1.000 and also presented in Figure 3. It can be noted that the model indicated 112.55 μg/L initial Sb(III) concentration, 2.03 mgC/L initial HA concentration, and 98.48 mg/L FC dosage for 93.85% Sb(III) and 81.8% TOC removal from such water suspension.
The Sb(III) and TOC removal process was repeated under similar optimum experimental conditions with groundwater from Nawabshah to validate the model prediction. The experimental results were in close agreement with the modeled values, indicating 92.71% Sb(III) and 79.54% TOC removal from the real groundwater. This suggests that the current model can predict removal responses of Sb(III) and TOC with high accuracy and can be used for the prediction of optimum experimental conditions with desired removal responses.

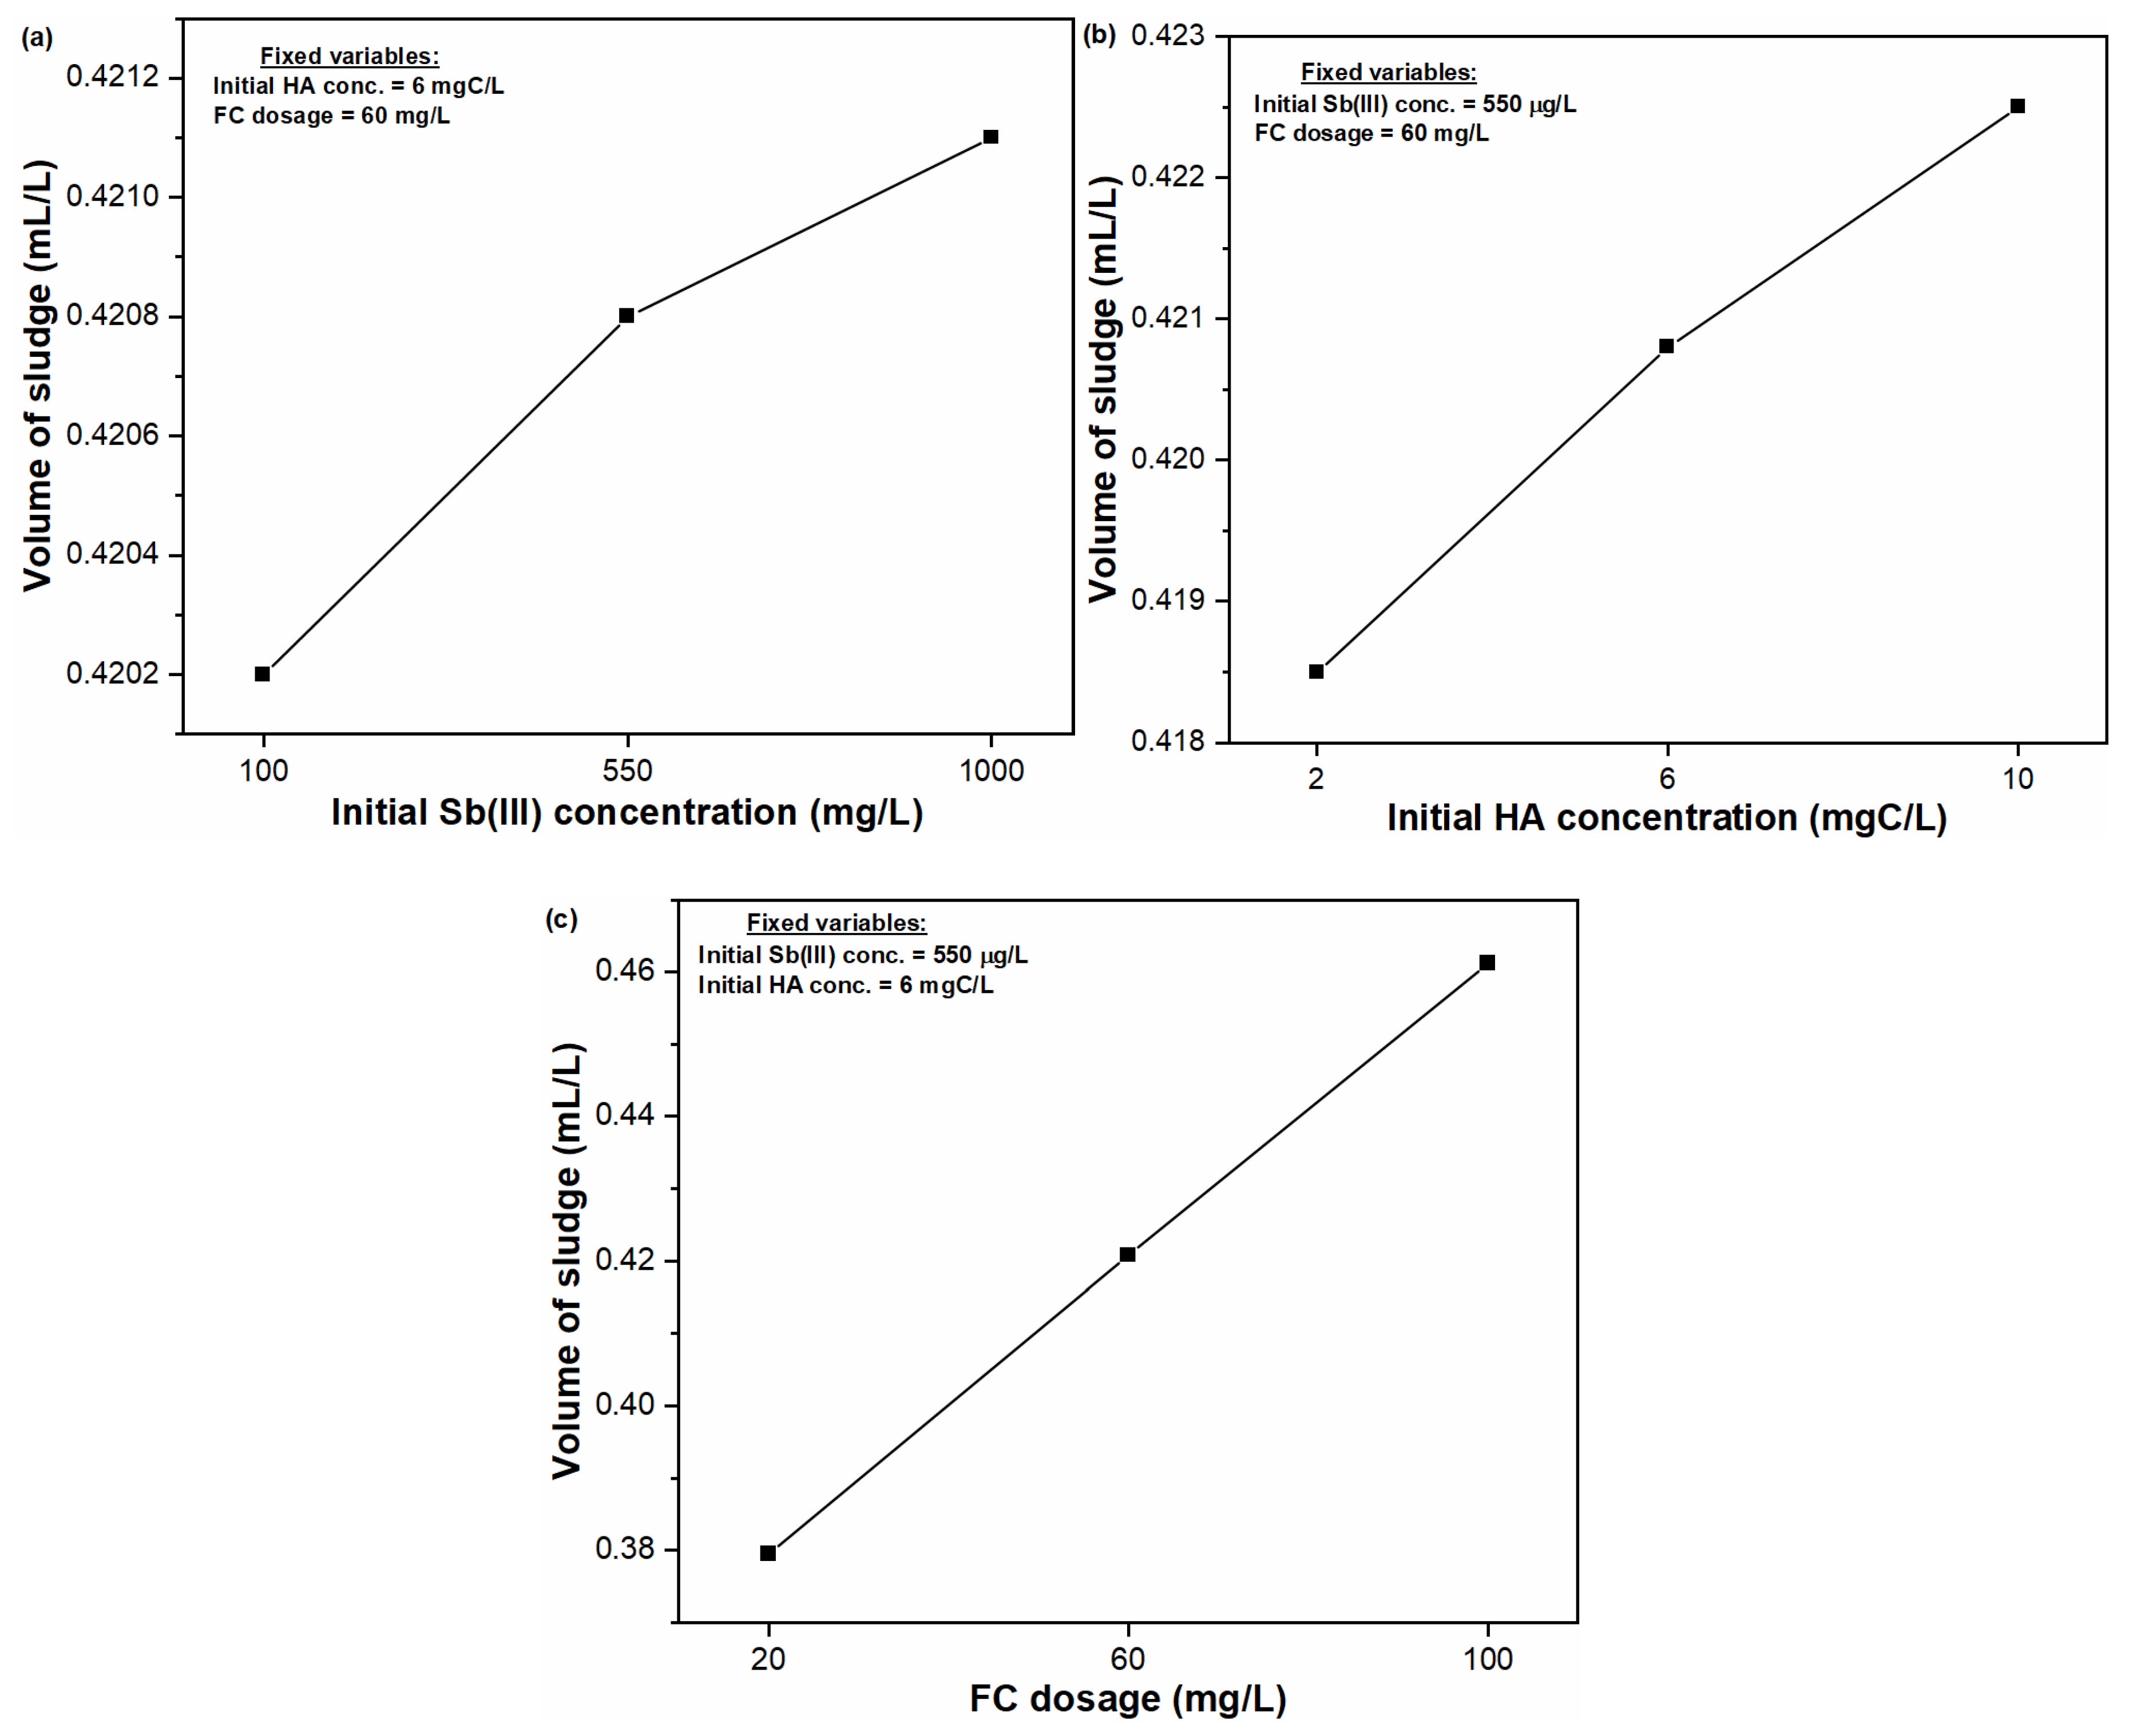
3.5. Volumetric Analysis of Produced Sludge

The volumetric analysis of the produced sludge in the chemical coagulation process is one of the major parameters to determine the cost and efficacy of a water treatment plant [47, 49 and 50 of As paper]. Figure 4 presents the variation in sludge volume under the influence of varying initial Sb(III) concentration, initial HA concentration, and FC dosages. The monitoring of sludge volume was performed by changing one variable from low levels to high levels and fixing medium levels of other variables. It can be seen from Figure 4a that increasing the initial Sb(III) concentration from 100 μg/L to 1000 μg/L resulted in a minimum increase in sludge volume to about 0.4202 mL/L to 0.4211 mL/L. Similarly, sludge volume was measured to be 0.4185 mL/L to 0.4225 mL/L for increasing the initial HA concentration from 2 mgC/L to 10 mgC/L, respectively (Figure 4b). These results suggested that presence of Sb(III) and HA molecules insignificantly contribute to sludge generation during the removal process. In contrast, increasing the FC dosage from 20 mg/L to 100 mg/L resulted in relatively higher sludge production of 0.38 mL/L to 0.46 mL/L, respectively (Figure 4c). This observation also supports the enhanced removal of both TOC and Sb(III) from water owing to the presence of more coagulated particles in suspension with high FC dosages, thus improving the bridging property of coagulated flocs [39,40]. In accordance, 0.45 mL/L of sludge volume was produced under the studied optimal experimental conditions. As a result, the current experimental strategy will not only be helpful in improving Sb(III) and TOC removal efficiency, but will also provide insight into reducing the amount of produced sludge. In accordance, this work will aid in the efficacy and economic sustainability of the removal process for the drinking water sector to ensure public health safety.

3.6. Comparison of Sb(III) and TOC Removal with the Literature Studies

Table 5 indicates a comparison of Sb(III) and TOC removal efficiencies by using different iron- and aluminum-based coagulants. As it can be seen, only a few studies reported simultaneous Sb(III) and TOC removal via the coagulation process. Additionally, these studies presented good removal of Sb(III) and TOC from water; however, only a few studies focused on the removal of HA and Sb(III) species in a coexisting system. Therefore, compared with other studies, the current work reported optimum removal conditions with simultaneous removal efficiencies of 92.51% Sb(III) and 78.8% TOC using 100 mg/L FC dosage in a binary system.

3.7. Future Prospects

The response surface methodology approach applied in the current study may provide a baseline to drinking water industries that completely rely on conventional treatment processes to ensure safe drinking water supplies. Specifically, the prospective of optimizing the chemical coagulation process in an actual water treatment plant in Nawabshah, where significant amounts of Sb and HA must be removed before water is ready for the disinfection process, necessitates the utilization of such mathematical modeling approach. Additionally, the developed model provides excellent agreement with experimental results under similar process conditions, a more comprehensive approach to evaluate the impact of structure and characteristics of organic matter on its interactions with antimony, which may be the subject of future work, and to extend the applicability of the models developed to more locations throughout Sindh province of Pakistan.

4. Conclusions

In this study, we use three-factor RSM and BBD to model the removal responses of Sb(III) and TOC by using FC as a coagulant. The three major variables, including initial Sb(III) concentration (100, 550, and 1000 μg/L), initial HA concentration (2, 6, and 10 mgC/L), and FC dosages (20, 60, and 100 mg/L) were considered in the BBD design. The quadratic model response values for Sb(III) and TOC presented excellent agreement with the experimental results, with a p value < 0.0001. Moreover, this model showed R2 and adjusted R2 values of (Sb(IIII): 0.9981 and 0.9956) and (TOC: 0.9935 and 0.9851), respectively. Among all studied variables, FC dosage was identified as the most influential parameter affecting the Sb(III) and TOC removal process. However, the effect of the quadratic term (FC dosage × FC dosage) was found to be insignificant in the removal of TOC from multicomponent suspension. Under the optimum experimental conditions of 112.55 μg/L initial Sb(III) concentration, 2.03 mgC/L initial HA concentration and 98.48 mg/L FC dosage, the model predicted 93.85% Sb(III) and 81.8% TOC removal from water. The experimental trial at optimal conditions indicated 92.71% Sb(III) and 79.54% TOC removal thus validating the model robustness for prediction of removal responses. The sludge volume produced for studied variables followed the order: FC dosage > initial HA concentration > initial Sb(III) concentration. Under optimal conditions, the 0.45 mL/L sludge volume was produced in the ground water in Nawabshah. In general, this research will be helpful in predicting the of amount of FC coagulant required in the efficient removal of coexisting Sb(III) ions and HA molecules from real water to reduce associated human health risks.

Supplementary Materials

The following supporting information can be downloaded at: https://www.mdpi.com/article/10.3390/w15091676/s1, Table S1: Experimental data points and results of Sb(III) and TOC removal in Box–Behnken experimental design.

Author Contributions

Conceptualization, M.A.I.; methodology, M.A.I. and R.K.; software, M.A.I.; validation, R.K.; formal analysis, R.K., K.H.L., Z.B.B. and I.T.Y.; investigation, M.A.I. and R.K.; resources, R.K.; data curation, R.K.; writing—original draft preparation, M.A.I.; writing—review and editing, M.A.I., R.K., K.H.L., Z.B.B. and I.T.Y.; visualization, K.H.L., Z.B.B. and I.T.Y.; supervision, M.A.I. and K.H.L.; project administration, M.A.I. and R.K.; funding acquisition, M.A.I. All authors have read and agreed to the published version of the manuscript.

Funding

This research was funded by National University of Sciences and Technology (NUST) Research Directorate recurring budget year 2021–22 under head Project Proposal with grant number “NUST-22-41-46”.

Institutional Review Board Statement

Not applicable.

Informed Consent Statement

Not applicable.

Data Availability Statement

All data used to support the findings of this study are included within the article.

Acknowledgments

This study was supported by the Research Fund, 2022 of the Catholic University of Republic of Korea.

Conflicts of Interest

The authors declare no conflict of interest.

References

  1. Wu, D.; Sun, S.-P.; He, M.; Wu, Z.; Xiao, J.; Chen, X.D.; Wu, W.D. As (V) and Sb (V) co-adsorption onto ferrihydrite: Synergistic effect of Sb (V) on As (V) under competitive conditions. Environ. Sci. Pollut. Res. 2018, 25, 14585–14594. [Google Scholar] [CrossRef] [PubMed]
  2. Mubarak, H.; Chai, L.-Y.; Mirza, N.; Yang, Z.-H.; Pervez, A.; Tariq, M.; Shaheen, S.; Mahmood, Q. Antimony (Sb)–pollution and removal techniques–critical assessment of technologies. Toxicol. Environ. Chem. 2015, 97, 1296–1318. [Google Scholar] [CrossRef]
  3. Filella, M.; Belzile, N.; Chen, Y.W. Antimony in the environment: A review focused on natural waters I. Occurence. Earth-Sci. Rev. 2002, 57, 125–176. [Google Scholar] [CrossRef]
  4. Ober, J.A. Mineral Commodity Summaries 2017: US Geological Survey; U.S. Geological Survey: Reston, VA, USA, 2017. [Google Scholar] [CrossRef]
  5. Sheng, L.; Hao, C.; Guan, S.; Huang, Z. Spatial distribution, geochemical behaviors and risk assessment of antimony in rivers around the antimony mine of Xikuangshan, Hunan Province, China. Water Sci. Technol. 2022, 85, 1141–1154. [Google Scholar] [CrossRef] [PubMed]
  6. Fu, X.; Song, X.; Zheng, Q.; Liu, C.; Li, K.; Luo, Q.; Chen, J.; Wang, Z.; Luo, J. Frontier materials for adsorption of antimony and arsenic in aqueous environments: A review. Int. J. Environ. Res. Public Health 2022, 19, 10824. [Google Scholar] [CrossRef]
  7. Xie, Q.; Ren, B. Pollution and risk assessment of heavy metals in rivers in the antimony capital of Xikuangshan. Sci. Rep. 2022, 12, 14393. [Google Scholar] [CrossRef]
  8. Gan, Y.; Ding, C.; Xu, B.; Liu, Z.; Zhang, S.; Cui, Y.; Wu, B.; Huang, W.; Song, X. Antimony (Sb) pollution control by coagulation and membrane filtration in water/wastewater treatment: A comprehensive review. J. Hazard. Mater. 2022, 442, 130072. [Google Scholar] [CrossRef]
  9. Arain, M.B.; Kazi, T.G.; Baig, J.A.; Jamali, M.K.; Afridi, H.I.; Shah, A.Q.; Jalbani, N.; Sarfraz, R.A. Determination of arsenic levels in lake water, sediment, and foodstuff from selected area of Sindh, Pakistan: Estimation of daily dietary intake. Food Chem. Toxicol. 2009, 47, 242–248. [Google Scholar] [CrossRef]
  10. Wang, X.; He, M.; Xi, J.; Lu, X. Antimony distribution and mobility in rivers around the world’s largest antimony mine of Xikuangshan, Hunan Province, China. Microchem. J. 2011, 97, 4–11. [Google Scholar] [CrossRef]
  11. Ritchie, V.J.; Ilgen, A.G.; Mueller, S.H.; Trainor, T.P.; Goldfarb, R.J. Mobility and chemical fate of antimony and arsenic in historic mining environments of the Kantishna Hills district, Denali National Park and Preserve, Alaska. Chem. Geol. 2013, 335, 172–188. [Google Scholar] [CrossRef]
  12. Ungureanu, G.; Santos, S.; Boaventura, R.; Botelho, C. Arsenic and antimony in water and wastewater: Overview of removal techniques with special reference to latest advances in adsorption. J. Environ. Manag. 2015, 151, 326–342. [Google Scholar] [CrossRef] [PubMed]
  13. Herath, I.; Vithanage, M.; Bundschuh, J. Antimony as a global dilemma: Geochemistry, mobility, fate and transport Title. Environ. Pollut. 2017, 223, 545–559. [Google Scholar] [CrossRef] [PubMed]
  14. Daud, M.K.; Nafees, M.; Ali, S.; Rizwan, M.; Bajwa, R.A.; Shakoor, M.B.; Arshad, M.U.; Chatha, S.A.S.; Deeba, F.; Murad, W.; et al. Drinking Water Quality Status and Contamination in Pakistan. BioMed Res. Int. 2017, 7908183. [Google Scholar] [CrossRef]
  15. Jo, M.; Kim, T.; Choi, S.; Jung, J.; Song, H.; Lee, H.; Park, G.; Lim, S.; Sung, Y.; Oh, J. Investigation of Antimony in Natural Water and Leaching from Polyethylene Terephthalate (PET) Bottled Water. In Proceedings of the 3rd World Congress on New Technologies (NewTech’17), Rome, Italy, 6–8 June 2017; pp. 6–8. [Google Scholar]
  16. Guo, W.; Fu, Z.; Wang, H.; Liu, S.; Wu, F.; Giesy, J.P. Removal of antimonate (Sb (V)) and antimonite (Sb (III)) from aqueous solutions by coagulation-flocculation-sedimentation (CFS): Dependence on influencing factors and insights into removal mechanisms. Sci. Total Environ. 2018, 644, 1277–1285. [Google Scholar] [CrossRef] [PubMed]
  17. Cheng, M.; Fang, Y.; Li, H.; Yang, Z. Review of recently used adsorbents for antimony removal from contaminated water. Environ. Sci. Pollut. Res. 2022, 1–24. [Google Scholar] [CrossRef] [PubMed]
  18. Ang, W.L.; Mohammad, A.W. State of the art and sustainability of natural coagulants in water and wastewater treatment. J. Clean. Prod. 2020, 262, 121267. [Google Scholar] [CrossRef]
  19. Cheng, K.; Wang, H.; Li, J.; Li, F. An effective method to remove antimony in water by using iron-based coagulants. Water 2020, 12, 66. [Google Scholar] [CrossRef]
  20. Fu, F.; Wang, Q. Removal of heavy metal ions from wastewaters: A review. J. Environ. Manage. 2011, 92, 407–418. [Google Scholar] [CrossRef] [PubMed]
  21. Guo, X.; Wu, Z.; He, M. Removal of antimony(V) and antimony(III) from drinking water by coagulation-flocculation-sedimentation (CFS). Water Res. 2009, 43, 4327–4335. [Google Scholar] [CrossRef]
  22. Kang, M.; Kamei, T.; Magara, Y. Comparing polyaluminum chloride and ferric chloride for antimony removal. Water Res. 2003, 37, 4171–4179. [Google Scholar] [CrossRef]
  23. Wu, Z.; He, M.; Guo, X.; Zhou, R. Removal of antimony (III) and antimony (V) from drinking water by ferric chloride coagulation: Competing ion effect and the mechanism analysis. Sep. Purif. Technol. 2010, 76, 184–190. [Google Scholar] [CrossRef]
  24. Mustereț, C.P.; Morosanu, I.; Ciobanu, R.; Plavan, O.; Gherghel, A.; Al-Refai, M.; Roman, I.; Teodosiu, C. Assessment of coagulation–flocculation process efficiency for the natural organic matter removal in drinking water treatment. Water 2021, 13, 3073. [Google Scholar] [CrossRef]
  25. Dayarathne, H.N.P.; Angove, M.J.; Aryal, R.; Abuel-Naga, H.; Mainali, B. Removal of natural organic matter from source water: Review on coagulants, dual coagulation, alternative coagulants, and mechanisms. J. Water Process Eng. 2021, 40, 101820. [Google Scholar] [CrossRef]
  26. Tang, W.-W.; Zeng, G.-M.; Gong, J.-L.; Liang, J.; Xu, P.; Zhang, C.; Huang, B.-B. Impact of humic/fulvic acid on the removal of heavy metals from aqueous solutions using nanomaterials: A review. Sci. Total Environ. 2014, 468, 1014–1027. [Google Scholar] [CrossRef] [PubMed]
  27. Wang, Y.; Duan, J.; Liu, S.; Li, W.; van Leeuwen, J.; Mulcahy, D. Removal of As (III) and As (V) by ferric salts coagulation–Implications of particle size and zeta potential of precipitates. Sep. Purif. Technol. 2014, 135, 64–71. [Google Scholar] [CrossRef]
  28. Inam, M.A.; Khan, R.; Park, D.R.; Khan, S.; Uddin, A.; Yeom, I.T. Complexation of Antimony with Natural Organic Matter: Performance Evaluation during Coagulation-Flocculation Process. Int. J. Environ. Res. Public Health 2019, 16, 1092. [Google Scholar] [CrossRef]
  29. Inam, M.A.; Lee, K.H.; Soni, H.L.; Mangi, K.H.; Channa, A.S.; Khan, R.; Wie, Y.M.; Lee, K.G. Coagulation Behavior of Antimony Oxyanions in Water: Influence of pH, Inorganic and Organic Matter on the Physicochemical Characteristics of Iron Precipitates. Molecules 2022, 27, 1663. [Google Scholar] [CrossRef]
  30. Trinh, T.K.; Kang, L.S. Response surface methodological approach to optimize the coagulation–flocculation process in drinking water treatment. Chem. Eng. Res. Des. 2011, 89, 1126–1135. [Google Scholar] [CrossRef]
  31. Amiri, S.; Vatanpour, V.; He, T. Optimization of Coagulation-Flocculation Process in Efficient Arsenic Removal from Highly Contaminated Groundwater by Response Surface Methodology. Molecules 2022, 27, 7953. [Google Scholar] [CrossRef]
  32. Watson, M.A.; Tubić, A.; Agbaba, J.; Nikić, J.; Maletić, S.; Jazić, J.M.; Dalmacija, B. Response surface methodology investigation into the interactions between arsenic and humic acid in water during the coagulation process. J. Hazard. Mater. 2016, 312, 150–158. [Google Scholar] [CrossRef]
  33. Inam, M.A.; Khan, R.; Yeom, I.T.; Buller, A.S.; Akram, M.; Inam, M.W. Optimization of Antimony Removal by Coagulation-Flocculation-Sedimentation Process Using Response Surface Methodology. Processes 2021, 9, 117. [Google Scholar] [CrossRef]
  34. Bezerra, M.A.; Santelli, R.E.; Oliveira, E.P.; Villar, L.S.; Escaleira, L.A. Response surface methodology (RSM) as a tool for optimization in analytical chemistry. Talanta 2008, 76, 965–977. [Google Scholar] [CrossRef] [PubMed]
  35. Inam, M.A.; Khan, R.; Park, D.R.; Lee, Y.W.; Yeom, I.T. Removal of Sb(III) and Sb(V) by ferric chloride coagulation: Implications of Fe solubility. Water 2018, 10, 418. [Google Scholar] [CrossRef]
  36. Baskan, M.B.; Pala, A. A statistical experiment design approach for arsenic removal by coagulation process using aluminum sulfate. Desalination 2010, 254, 42–48. [Google Scholar] [CrossRef]
  37. Inam, M.A.; Khan, R.; Inam, M.W.; Yeom, I.T. Kinetic and isothermal sorption of antimony oxyanions onto iron hydroxide during water treatment by coagulation process. J. Water Process Eng. 2021, 41, 102050. [Google Scholar] [CrossRef]
  38. Dong, C.-H.; Xie, X.-Q.; Wang, X.-L.; Zhan, Y.; Yao, Y.-J. Application of Box-Behnken design in optimisation for polysaccharides extraction from cultured mycelium of Cordyceps sinensis. Food Bioprod. Process. 2009, 87, 139–144. [Google Scholar] [CrossRef]
  39. Amuda, O.S.; Amoo, I.A.; Ajayi, O.O. Performance optimization of coagulant/flocculant in the treatment of wastewater from a beverage industry. J. Hazard. Mater. 2006, 129, 69–72. [Google Scholar] [CrossRef]
  40. Aguilar, M.I.; Saez, J.; Llorens, M.; Soler, A.; Ortuno, J.F. Nutrient removal and sludge production in the coagulation–flocculation process. Water Res. 2002, 36, 2910–2919. [Google Scholar] [CrossRef]
  41. Zhao, Y.X.; Gao, B.Y.; Zhang, G.Z.; Qi, Q.B.; Wang, Y.; Phuntsho, S.; Kim, J.-H.; Shon, H.K.; Yue, Q.Y.; Li, Q. Coagulation and sludge recovery using titanium tetrachloride as coagulant for real water treatment: A comparison against traditional aluminum and iron salts. Sep. Purif. Technol. 2014, 130, 19–27. [Google Scholar] [CrossRef]
  42. Sillanpää, M.; Ncibi, M.C.; Matilainen, A.; Vepsäläinen, M. Removal of natural organic matter in drinking water treatment by coagulation: A comprehensive review. Chemosphere 2018, 190, 54–71. [Google Scholar] [CrossRef]
Figure 1. (a,c) Normal plot of residuals; (b,d) predicted versus actual plot of Sb(III) and TOC removal.
Water 15 01676 g001
Figure 2. 3D surface plots and corresponding 2D contour plots showing the effect of FC dosage (mg/L) and initial HA concentration (mg/L) on TOC and Sb(III) removal under the influence of varying initial Sb(III) concentration of (a,d) 100 μg/L, (b,e) 550 μg/L, and (c,f) 1000 μg/L, respectively.
Water 15 01676 g002aWater 15 01676 g002bWater 15 01676 g002c
Figure 3. The optimum Sb(III) and TOC removal conditions using the Box–Behnken design model for FC coagulation process.
Water 15 01676 g003
Figure 4. Variation in volume of sludge produced during Sb(III) and TOC removal related to (a) initial Sb(III) concentration (mg/L); (b) initial HA concentration (mg/L) and; (c) FC dosage (mg/L).
Water 15 01676 g004
Table 1. Water sample characteristics used for the experiments.
ComponentsValue/Concentration
pH6.85
HCO3 (mg CaCO3/L)430
PO43− (mg/L)0.476
SO42− (mg/L)75.77
Cl (mg/L)70.97
NO3 (mg/L)9.37
As (mg/L)0.011
Fe (mg/L)0.243
Zn (mg/L)0.521
Cr (mg/L)0.121
Sb (mg/L) *0.1 to 1 *
TOC (mgC/L) *2 to 10 *
Note: * Indicates respective concentrations of contaminants were spiked in water sample.
Table 2. Levels of independent variables in Box–Behnken design of simultaneous Sb(III) and TOC removal by ferric chloride coagulation.
VariablesUnitsSymbolCoded Levels
UncodedCoded−10+1
A: Initial Sb(III) concentrationµg/LX1A1005501000
B: Initial HA concentrationmgC/LX2B2610
C: FC dosagemg/LX3C2060100
Table 3. Model summary statistics for TOC and Sb(III) removal.
SourceSequential p-ValueLack of Fit p-ValueStd. Dev.R2Adjusted R2Predicted R2Remarks
Sb(III) removal
Linear<0.0001<0.00018.860.79820.75160.6058
2FI0.5991<0.00019.240.83120.73000.2503
Quadratic<0.00010.00041.180.99810.99560.9695Suggested
Cubic0.0004 0.181.00000.9999 Aliased
TOC removal
Linear0.0025<0.00019.200.65460.57480.3024
2FI0.02690.00016.760.85670.77080.3700
Quadratic<0.00010.02121.720.99350.98510.9062Suggested
Cubic0.0212 0.750.99930.9972 Aliased
Table 4. ANOVA results of the response surface quadratic model for simultaneous Sb(III) and TOC removal by ferric chloride coagulation.
SourceSum of SquaresdfMean SquareF Valuep-Values Prob > F
Sb(III) removal
Model5044.749560.53402.40<0.0001 *
A-Initial Sb(III) concentration27.79127.7919.950.0029 *
B-Initial HA concentration698.451698.45501.42<0.0001 *
C-FC dosage3308.1013308.102374.90<0.0001 *
AB5.9315.934.260.0780
AC8.8818.886.380.0395 *
BC152.281152.28109.32<0.0001 *
A27.4717.475.370.0537
B26.4516.454.630.0685
C2840.691840.69603.54<0.0001 *
Lack of fit9.6233.2195.340.0004 *
Pure error0.1340.034
R2 = 0.9981, R2Adj = 0.9956, R2Pre = 0.9695, adequate precision = 67.722 (>4)
TOC removal
Model3165.369351.71118.86<0.0001 *
A-Initial Sb(III) concentration57.46157.4619.420.0031 *
B-Initial HA concentration511.681511.68172.93<0.0001 *
C-FC dosage1516.3511516.35512.47<0.0001 *
AB75.26175.2625.430.0015 *
AC270.771270.7791.51<0.0001 *
BC298.081298.08100.74<0.0001 *
A234.88134.8811.790.0109 *
B2391.021391.02132.15<0.0001 *
C214.44114.444.880.0629
Lack of fit18.4736.1610.970.0212 *
Pure error2.2540.56
R2 = 0.9935, R2Adj = 0.9851, R2Pre = 0.9062, adequate precision = 35.044 (>4)
Note: * Significant (p < 0.05).
Table 5. A comparison of TOC and Sb(III) removal efficiencies with different coagulants.
CoagulantsInitial Sb(III) (mg/L)Initial HA (mgC/L)Sb(III) Removal (%)TOC Removal (%)Ref.
TypeDosage (mg/L)
Al2(SO4)3·18H2O66.640.05-18.5-[21]
FeCl3·6H2O54.060.506-93.04-
FeCl3·6H2O54.060.101096-[23]
284-
458-
Polymeric ferric sulfate6.040.100096.5-[16]
190-
271.5-
FeCl3·6H2O27.031090.40[29]
0.41784.1581.26
0.83482.5371.61
2.08574.9264.15
4.1762.4865.86
Al2(SO4)330-3.9-43.2[41,42]
FeCl365-3.9-57.9
FeCl3·6H2O1000.55292.5178.8This work
Disclaimer/Publisher’s Note: The statements, opinions and data contained in all publications are solely those of the individual author(s) and contributor(s) and not of MDPI and/or the editor(s). MDPI and/or the editor(s) disclaim responsibility for any injury to people or property resulting from any ideas, methods, instructions or products referred to in the content.

