Article

Influence of Some Environmental Factors on Summer Phytoplankton Community Structure in the Varna Bay, Black Sea (1992–2019)

1
Department of Anatomy, Histology, Cytology and Biology, Faculty of Medicine, Medical University, 5800 Pleven, Bulgaria
2
Institute of Fish Resources, 9000 Varna, Bulgaria
3
Faculty of Geology and Geography, Sofia University “St. Kliment Ohridski”, 1000 Sofia, Bulgaria
4
Faculty of Mathematics, Physics, and Informatics, Comenius University, 842 48 Bratislava, Slovakia
5
Department of Agricultural Engineering, Faculty of Agriculture, Trakia University, 6000 Stara Zagora, Bulgaria
*
Author to whom correspondence should be addressed.
Water 2023, 15(9), 1677; https://doi.org/10.3390/w15091677
Submission received: 25 February 2023 / Revised: 21 March 2023 / Accepted: 21 April 2023 / Published: 25 April 2023
(This article belongs to the Section Water and Climate Change)

Abstract

:
During the last decades, a decrease in the nutrients and an increase in marine temperature on the surface of the Varna Bay of the Black Sea have been registered. The main aim of this study was to establish the influence of some environmental factors (SST, TP, DIN) on the structure of the phytoplankton and to define what part of these dynamics results from the changes in temperature. Bivariate correlation and Nonlinear regression analyses were used to establish the connection between factors of the environment and the quality parameters of different size and taxonomic groups of phytoplankton. The rising SST proved to statistically significantly influence the decrease in the abundance of nano-phytoplankton (50.9%), the abundance and biomass of micro-phytoplankton (53%; 33.2%), the Bacillariophyceae (49.5%; 35.6%), and the biomass of the species of group “Other” (51.4%). The decreasing TP has a significant influence on the decrease in the abundance and biomass of the diatoms and the biomass of group “Other”. The decreasing DIN significantly affects the decrease in the abundance and biomass of Dinophyceae. The analyses showed that rising temperatures had a leading role in the changes in the taxonomic and size structure of phytoplankton during the period 1992–2019.

1. Introduction

Temperate marine ecosystems react to climate changes at all trophic levels, both in terms of their development and in terms of the physiological processes (metabolism rate, breathing, nutrition of the hydrobionts [1,2]) and dynamics of the populations [3,4,5]. The main limiting factors for the long-term changes in their functions and, more specifically, in the phytoplankton structure are temperature, light, and nutrients [6].
The impact of climate change on the hydrological and hydrobiological characteristics of the Black Sea’s ecosystem has been described by Daskalov [7], Konovalov and Murray [8], Lancelot et al. [9], Mikaelyan [10], Niermann et al. [11], Oguz [12], and Yunev et al. [13].
The period of the 1980s and 1990s was characterized “by dramatic variations in the regional climate” [12] (p. 124) of the half-closed and severely polluted water basin known as the Black Sea. The winters in that region before 1995 were long and severe [12,14]. After this phase, the annual mean sea surface temperature (SST) (°C) started to rise [15]. Sakalli and Basusta [16] note that during a 34-year-long period (1982–2015), the SST in the Black Sea increased by 0.64 °C per decade.
Regardless of the temperature variations in the Black Sea or maybe as a result of them, the long-term data models show three states of the ecosystem of the Black Sea North West Shelf (BSNWS), [15]. They include:
  • A low-productive ecosystem before 1970 or the so-called “pristine” reference phase (1954–1970);
  • A highly productive eutrophic system during the 1980s or a phase of intensive anthropogenic eutrophication and destruction of the Black Sea ecosystem (1970–1995);
  • A transitional, relatively low productive system after the beginning of the 1990s or the so-called post-eutrophication phase in the development of the Black Sea ecosystem.
During the “pristine” period, the climate factors dominated over the anthropogenic ones, and a large part of the phytoplankton abundance and biomass were produced during the winter/spring period of the year with a dominance of diatoms [17,18,19].
During the eutrophication phase, the biomass and abundance of the phytoplankton as well as the frequency, duration, and intensity of the phytoplankton blooms sharply increased in the spring and summer [14,20,21,22,23,24,25,26,27,28,29,30,31,32,33,34,35,36,37,38,39,40]. The eutrophication seriously influenced not only the shallow waters, but also the whole shelf area during the 1970s [36,41,42,43,44,45,46,47,48]. The high abundance of the dinoflagellates was taken “as an indicator of an eutrophication” [45] (p.110).
The current post-eutrophication phase is characterized by a reduction of the concentration of the nutrients [49,50,51] as well as the quantity of phytoplankton.
The frequency and length of the phytoplankton blooms decreased. The tendency for recovery of the phytoplankton’s seasonal dynamics, which is normal for these latitudes, was confirmed [34,52,53,54,55,56].
However, there are still some anomalies in the characteristics describing the “natural state” of phytoplankton communities according to the criteria of the Water Framework Directive [16,32,33,43,44,56,57,58,59,60,61,62,63,64,65].
Questions that remain to be answered refer to the dominance of the anthropogenic or climate factors, their interaction with one another, and the signs of adaptation of the systems in the Bulgarian Black Sea coastal area.
Recently, changes in climate have been considered as one of the most serious threats to the global environment, which may adversely affect human life and economic activities, water and food security, ecosystems, and natural resources [66].
Allan et al. [67] indicated that the global surface temperature during the period 2011–2021 was 1.09 °C higher than that between 1850 and 1900. Despite the cooling effect of La Niña, the year 2021 was the seventh warmest on record. Scientific studies show that there is no change in the long-term trend of rising temperatures [68].
Research studies show an increase in the temperature of all European seas, with the largest trends observed for the Black Sea, where the trend values for the period 1993–2016 were 0.075 ± 0.008 °C/year [69].
The tendency for rising temperatures will probably continue, given the current state of the environment [16]. In the period 1997–2020, the quantities of chlorophyll (proxy indicator for the phytoplankton development) in the surface layer of the Black Sea waters decreased by −1.54 per year [70].
“Many studies have shown that temperature is a strong predictor of phytoplankton cell size in marine ecosystems [71,72] such that the average cell size within phytoplankton communities tends to decrease with the increase in temperature” [73] (p.14).
The results “support the hypothesis that temperature effects on cell size are to a great extent mediated by nutrient limitation. This effect is expected to be exacerbated under field conditions, where higher temperatures of the surface waters reduce the vertical nutrient transport” [74] (p.1).
Investigations for phytoplankton pigment from field observations and satellite data from cruises in the Atlantic Ocean showed that the average cell size within phytoplankton communities tends to decrease with increasing temperature [74].
Global climatic changes and regime shifts in many coastal regions (not only in the Black Sea) negatively affected biological elements. “As an example of holistic simplicity arising from underlying complexity, the variance in a community variable (total abundance) is explained by a single predictor (temperature) to the extent of 75% in the marginal seas. In the estuarine basin, weekly averages of phytoplankton and temperature computed from a 13 year time-series yield a predictive relationship with 91% explained variance” [75] (p. 1953).
“Climate change leads to more nutrient-depleted conditions in the surface ocean and that favors small phytoplankton at the expense of diatoms” [76] (p.1).
The purpose of this study was to establish how the rise of SST and the changes in nutrient concentration over a long period of time (1992–2019) affects the phytoplankton size structure and taxonomic structure in the surface waters of Varna Bay in the Black Sea.
This analysis contributes to a better understanding of the consequences of climate change and local anthropogenic factors on the phytoplankton communities as an adaptive response of the coastal ecosystems to climate change.

2. Materials and Methods

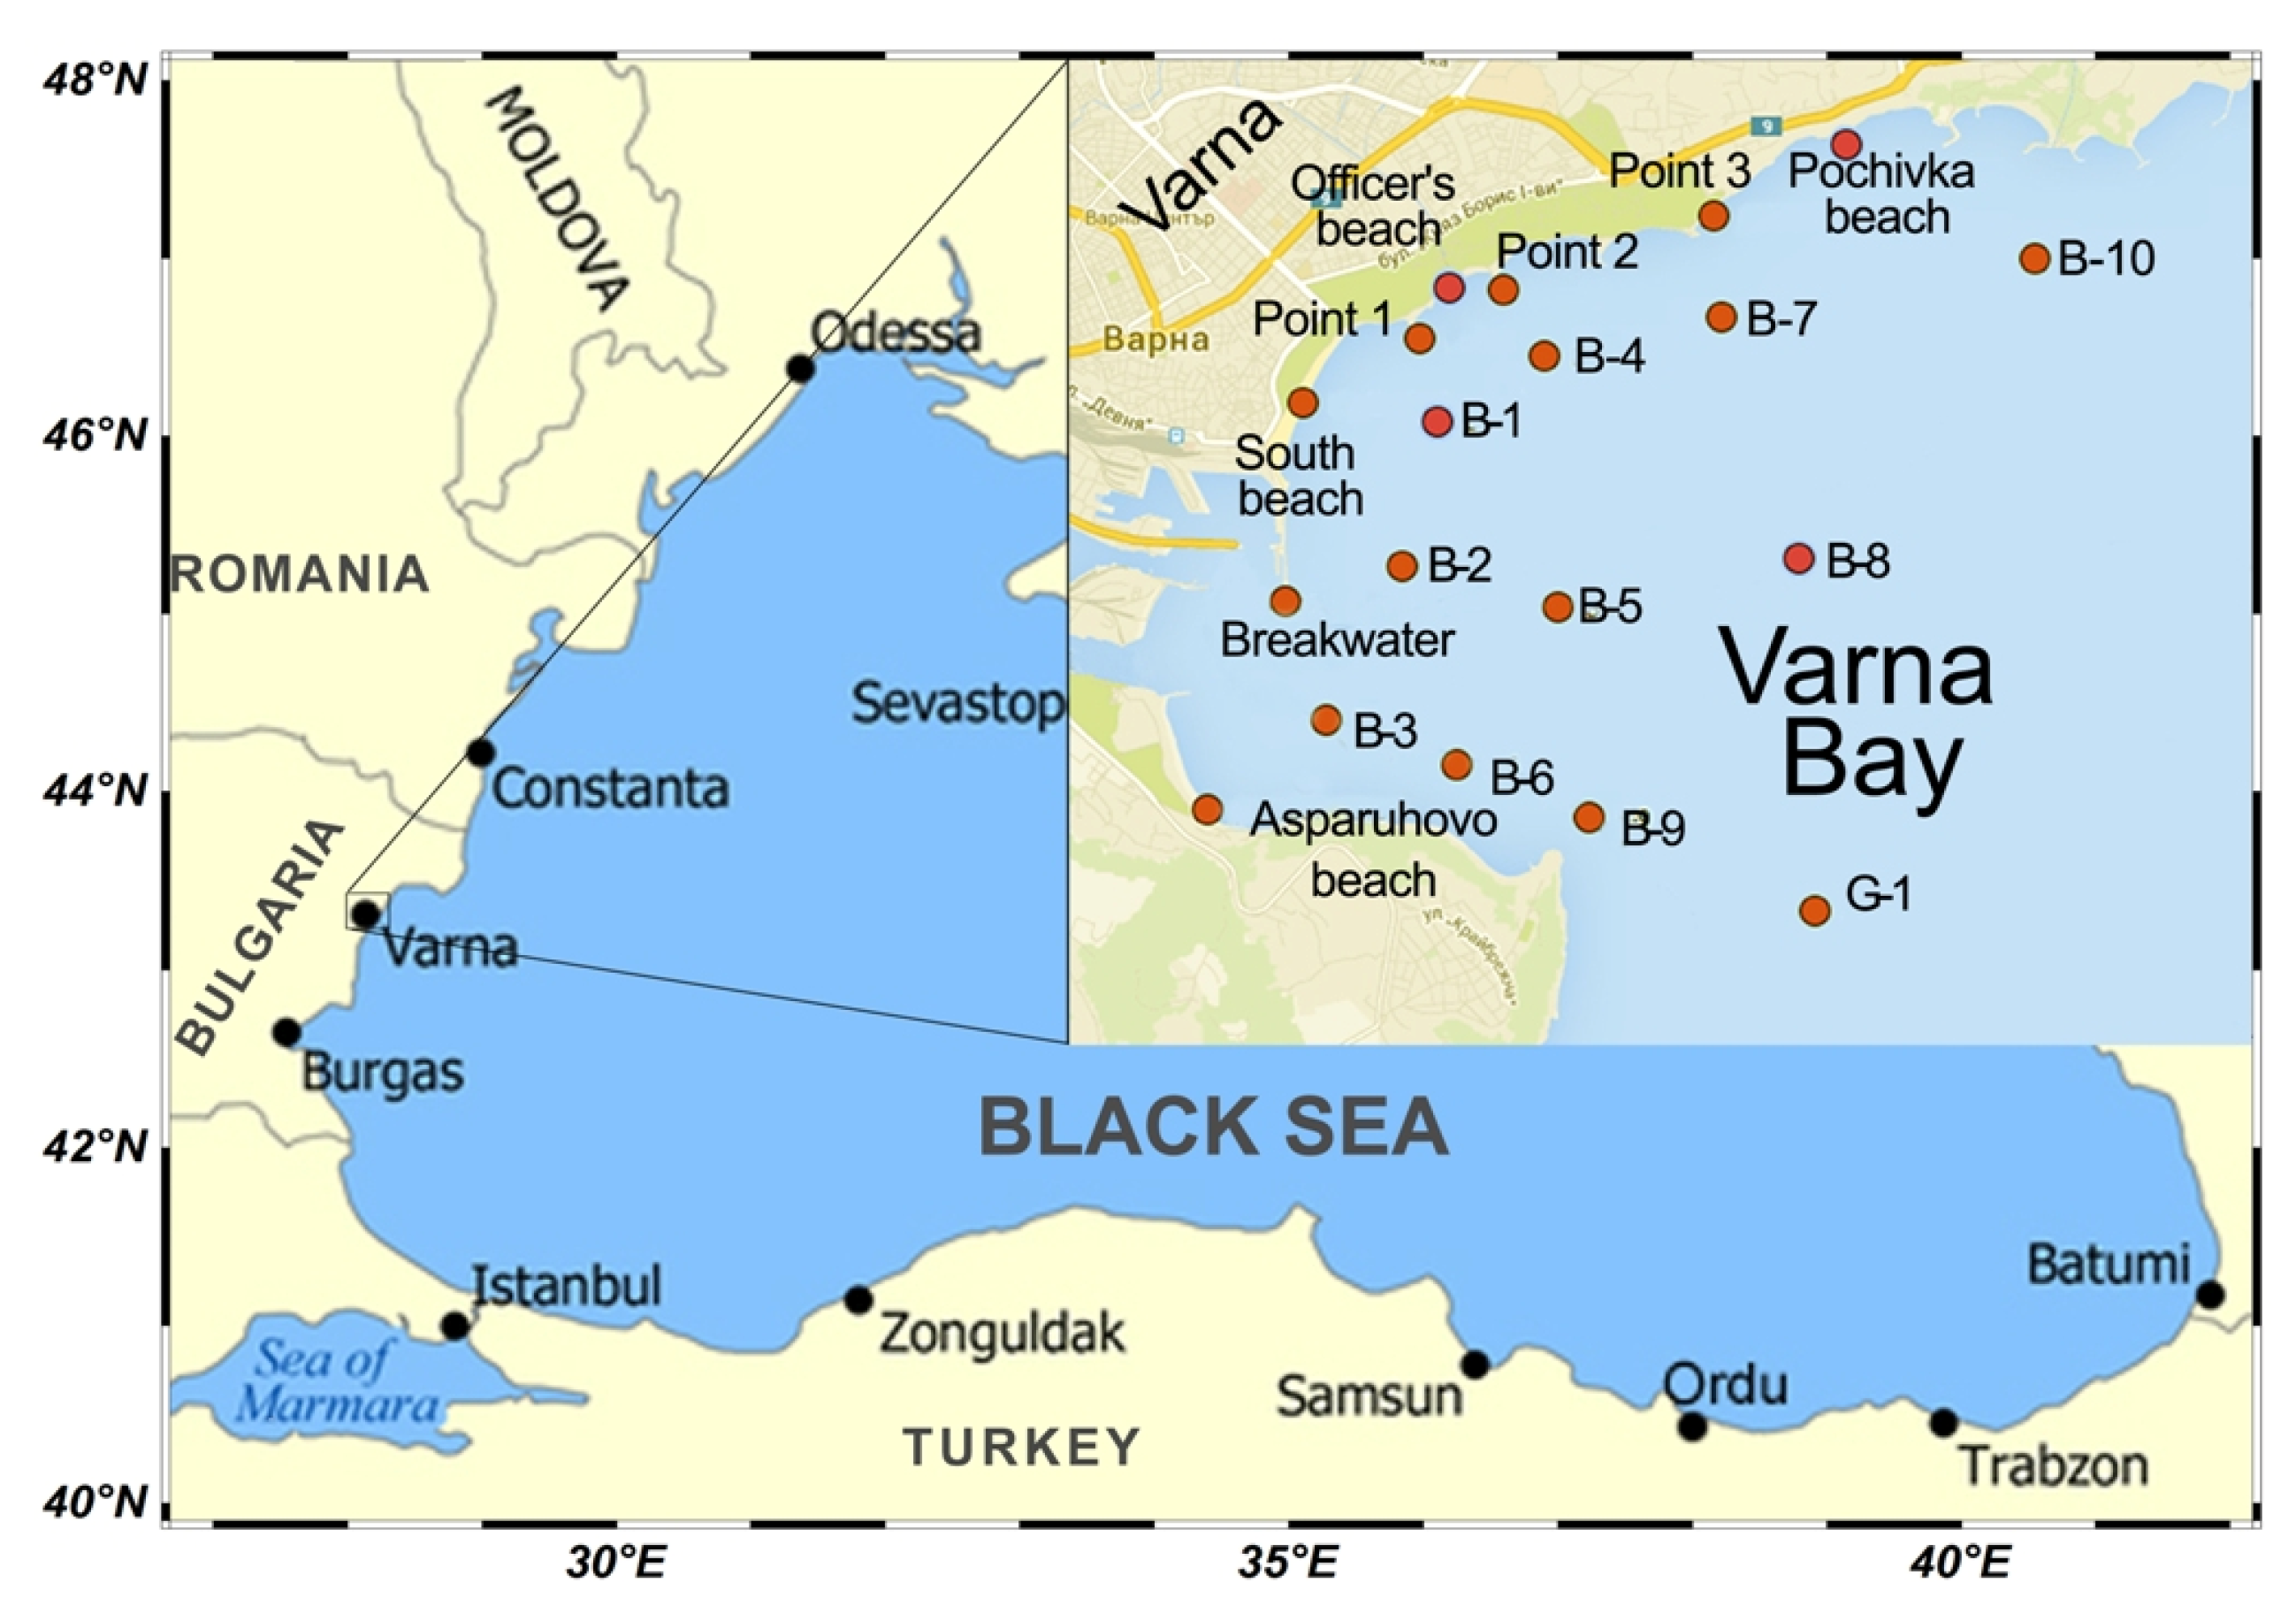
2.1. Study Area: Description of the Varna Bay

The Black Sea is one of the world’s semi-enclosed seas and is particularly sensitive to anthropogenic impacts due to its isolation and large river inflow. “The ratio of its surface and its catchment area exceeds 6. For this reason, the Black Sea is very vulnerable to pressure from land-based human activity and its health is equally dependent on the coastal and non-coastal states of its basin” [77] (p.1).
Varna Bay is situated in the northern part of the Black Sea Coast between Cape Galata and Cape St. George (Figure 1).
Its maximum width is 3.5 nm. Varna Bay is the second largest bay after the Bay of Burgas and runs along the Bulgarian Black Sea Coast. The bay has a flat bottom inclined eastwards. Its maximum depth is 18.5 m. To the west, it is artificially connected to Varna Lake, which has a great effect on the biodiversity in the two basins.
The city of Varna is located on the northern and western part of Varna Bay and the northeast shore of Varna Lake. The main industrial zone and the port complex are located in the northern part of the bay area.
The climate of Varna is maritime and is relatively mild in the warm months of the year. The absolute minimum temperature is –24.3 °C (measured on 10 February 1929), and the absolute maximum temperature is 41.4 °C in July (2021). The average annual rainfall is 498 mm, the maximum being in June and November, and the minimum is in February. The average height of the waves in Varna Bay is about 61cm [78]. The general circulation of the currents in Varna Bay is cyclonic [79].
The ecological state of Varna Bay is influenced by “urbanisation, industry, transport, and port activities. Agriculture is another major driver for the state alterations of the entire Varna region since it is responsible for the nutrients input to the rivers, lagoons, and, the sea. The main causes of environmental disturbance are eutrophication, coastal pollution due to the point sources, and diffuse (non-point) sources” [49] (p. 1695). The Bay is one of the marine “hot spots” along the Bulgarian Black Sea coast, as it is constantly changing and at the same time is used for recreation. The long-term database on phytoplankton, SST (°C), total phosphorus (TP) (mg·L−1), dissolved inorganic nitrogen (DIN) (mg·L−1) used in the study provides for a detailed analysis of the ecological changes in the coastal waters.
Figure 1 shows the study area with permanent monitoring stations for hydrological and hydrobiological observations.

2.2. Field Sampling

A total of 473 phytoplankton samples were collected every month in May, June, July, and August of each year during the research period (1992–2019).
The sampling was conducted during 116 research expeditions (as part of routine monitoring programs of the Institute of Fish Resources (IFR)-Varna beginning in the 1990s, and national and international projects) with Niskin bottles (5l) at the surface water layer (0–1m) (Figure 1).
The phytoplankton samples (500 mL) were fixed with 37% formaldehyde solution at a final concentration of 2% on board the research vessels (RV).

2.3. Laboratory Treatment of the Phytoplankton Samples

The bottles with preserved samples were transported to the hydrobiological laboratory (IFR-Varna). The seawater samples for the investigation of phytoplankton communities (taxonomic structure, abundance, and biomass) were concentrated by the settling method. Samples were allowed to settle for 10–12 days and then slowly decanted to 50 mL final volume [80].

2.4. Morphological Identification and Enumeration

The qualitative and quantitative analyses of the samples were performed with a conventional light microscope (Reichert Carl ZEISS, Carl Zeiss GmbH, Wien, Austria; Nikon Eclipse 400, Nikon Instruments, Melville, USA and OlympusBX41, Olympus, Tokyo, Japan), (with magnification 100×, 200×, and 400×) in counting chambers of Palmer–Maloney—0.05 mL and Sedgwick Rafter—1 mL, using standard protocols for the Black Sea [81].
The cell volume of phytoplankton was calculated using geometric formulas [82,83]. The wet biomass was assumed to be equal to the cell volume (ρ = 1). The biomass was determined through morphometric measurement of phytoplankton units [82].
Specialized software for phytoplankton analyses Phytomar 2.0 [84], SPSS Statistics 26.0, and Excel (Microsoft Office, Redmond, Washington DC, USA) were used for calculations and graphs.
The distribution of species in phytoplankton classes was conducted according to electronic databases WoRMS [85] and AlgaeBase [86].
During the research period, phytoplankton species representing 18 taxonomic classes were found (Dinophyceae; Bacillariophyceae; Chlorophyceae; Cyanophyceae; Prymnesiophyceae; Cryptophyceae; Euglenophyceae; Dictyochophyceae; Trebouxiophyceae; Chlorophyta incertae sedis; Zygnematophyceae; Prasinophyceae; Pyramimonadophyceae; Chlorodendrophyceae; Chrysophyceae; Euglenoidea; Craspedophyceae; and Dinoflagellata incertae sedis), according to WoRMS [85].
The phytoplankton species were grouped into three groups: class Dinophyceae, class Bacillariophyceae and the other classes of phytoplankton (16 classes) united in one group (Other) according to Oguz et al. [65] for the purpose of the taxonomic statistical analysis.
For the statistical analysis of the phytoplankton size structure, the species were classified according to their size—nano-phytoplankton (<20 µm) and micro-phytoplankton (≥ 20 µm), according to Zeitzschel [87].

2.5. Methods for Studying the Dependence of Phytoplankton on Sea Surface Temperature (SST) and Nutrients (TP), (DIN)

The sample selection, group identification and variable definitions, and the criteria for data analysis were conducted in such a way as to minimize the effect of confounding factors (physical, chemical, and biological) on the statistical analysis.
Limitations of the statistical analysis:
  • The study was conducted only in Varna Bay as an area with uniform hydrologic conditions. This area was also selected because there is a long-term database for the phytoplankton (1631 phytoplankton samples for the whole period 1992–2019).
  • To avoid the influence of light on the development of phytoplankton in deep water (from 1 m to 25 m), all samples were taken from the surface water layer (0–1 m).
  • Samples from only the period of May–August were analyzed to minimize the effect of the seasonal dynamics on the abundance and biomass of the phytoplankton.
The sea surface temperature (SST) data were obtained from the Integrated Climate Data Center in Hamburg, Germany. The sea surface temperature (SST) data version v2.1 was taken for the computation. Data are available for the period from September 1981 to the present. These data were obtained by the optimum interpolation (OI) technique. In the literature, the data can be found as the OISST dataset (formerly Reynolds SST). The result of OI is the 0.25° spatial grid data, which originated from the combination of the infrared channels of the Advanced Very High-Resolution Radiometer (AVHRR), with buoy and ship observations as reference data. This approach allows for a large-scale bias adjustment of satellite data [88]. To analyze data from the Bulgarian Black Sea coast, the monthly mean SST data were used. Bilinear interpolation was applied to a 0.25° spatial grid of OISST data to obtain surface sea temperature outside of the grid mesh. SST data were obtained by bilinear interpolation. For this purpose, we performed two linear interpolations along the length and one linear interpolation along the width direction for four points of the grid cells.
Using this technique, a time series for the period 1992–2019 was obtained for the region of Varna Bay.
The sources of the data of TP (mg·L−1) and DIN (mg·L−1) were the international projects of the Institute of Fish Resources-Varna and published and unpublished data from various sources (articles, reports of the Black Sea Commission, Regional Environment and Water Inspection-Varna, Black Sea Basin Directorate-Varna).
The relations between SST and the abundance and biomass of nano-phytoplankton (2–20 µm) and micro-phytoplankton (>20 µm) [73,87] and the relationships between SST, TP (mg·L−1), DIN (mg·L−1) and the groups Dinophyceae, Bacillariophyceae, and Other were established by bivariate correlation (Spearman’s coefficient) analyses and nonlinear (polynomial) regression analyses performed with SPSS Statistics 26.0 software. Excel (Microsoft Office) was used for the graphical evaluations.

3. Results

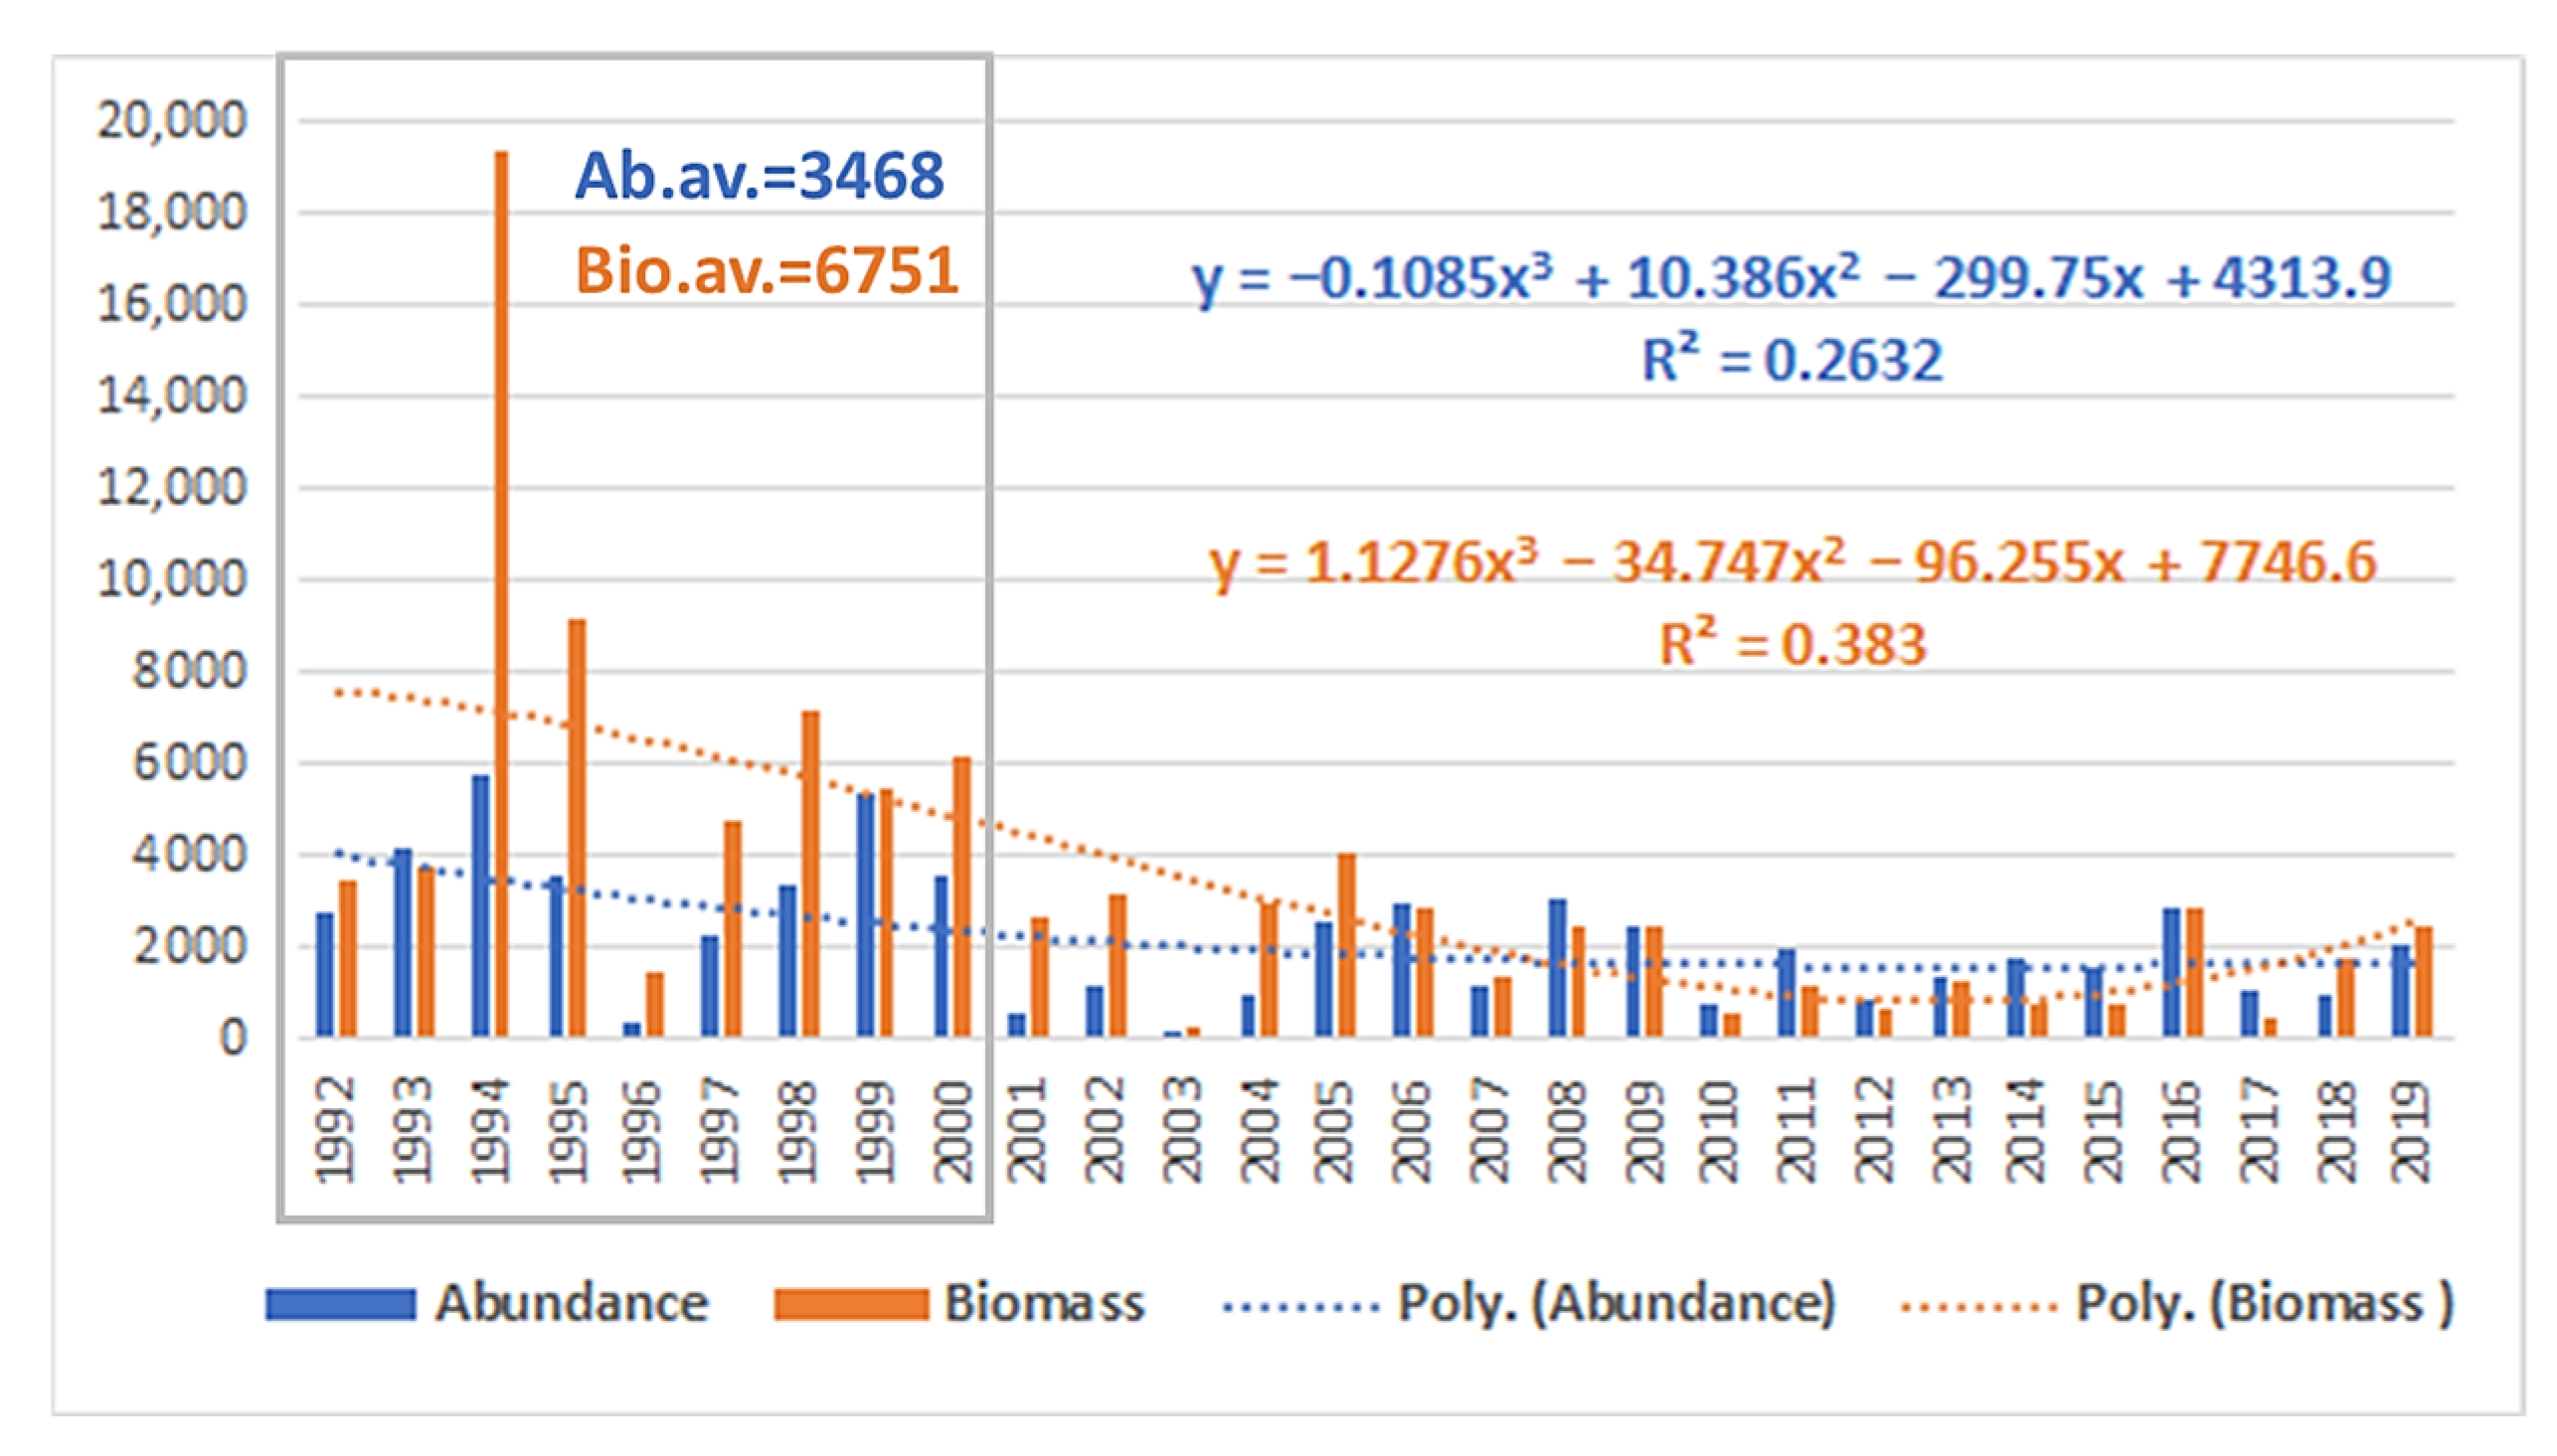
3.1. Tendencies in the Changes of the Phytoplankton Abundance and Biomass in the Varna Bay

The calculated nonlinear equations represent the tendencies in the changes of the phytoplankton abundance and biomass in the surface water layer of Varna Bay during the examined period (1992–2019) and are shown in Figure 2 and Figure 3. The highest average values of phytoplankton were registered in the first years of the studied period (abundance 3467 × 106 cells·m−3 and biomass 6750 mg·m−3), while in the last decade of the period, the abundance was 2.17 times lower and the biomass was 5.02 times lower.
Despite the moderate values of the coefficients of determination (R2 = 0.263; 0.383), the slope of the equations shows negative trends in the total abundance and biomass of the phytoplankton in the surface water layer for the period May–August, 1992–2019 (Figure 2).
The tendencies of the change in abundance and biomass of the nano- and micro-phytoplankton for the period 1992–2019 were established using nonlinear regression analysis (Figure 3). The trends of calculated cubic regression equations are negative and statistically significant at p < 0.05 in all cases, with the exception of the trend for the biomass of the nano-phytoplankton. According to the values of the coefficients of determination (R2 = 0.735; 0.4039), there are moderate to strong relationships between the long-term period (1992–2019) and changes in the abundance (73.5%) and biomass (40.39%) of nano-phytoplankton. Concerning the abundance and biomass of micro-phytoplankton, the coefficients of determination (R2 = 0.801; 0.806) show that 80 ÷ 80.6% of the changes were due to the long-term period.

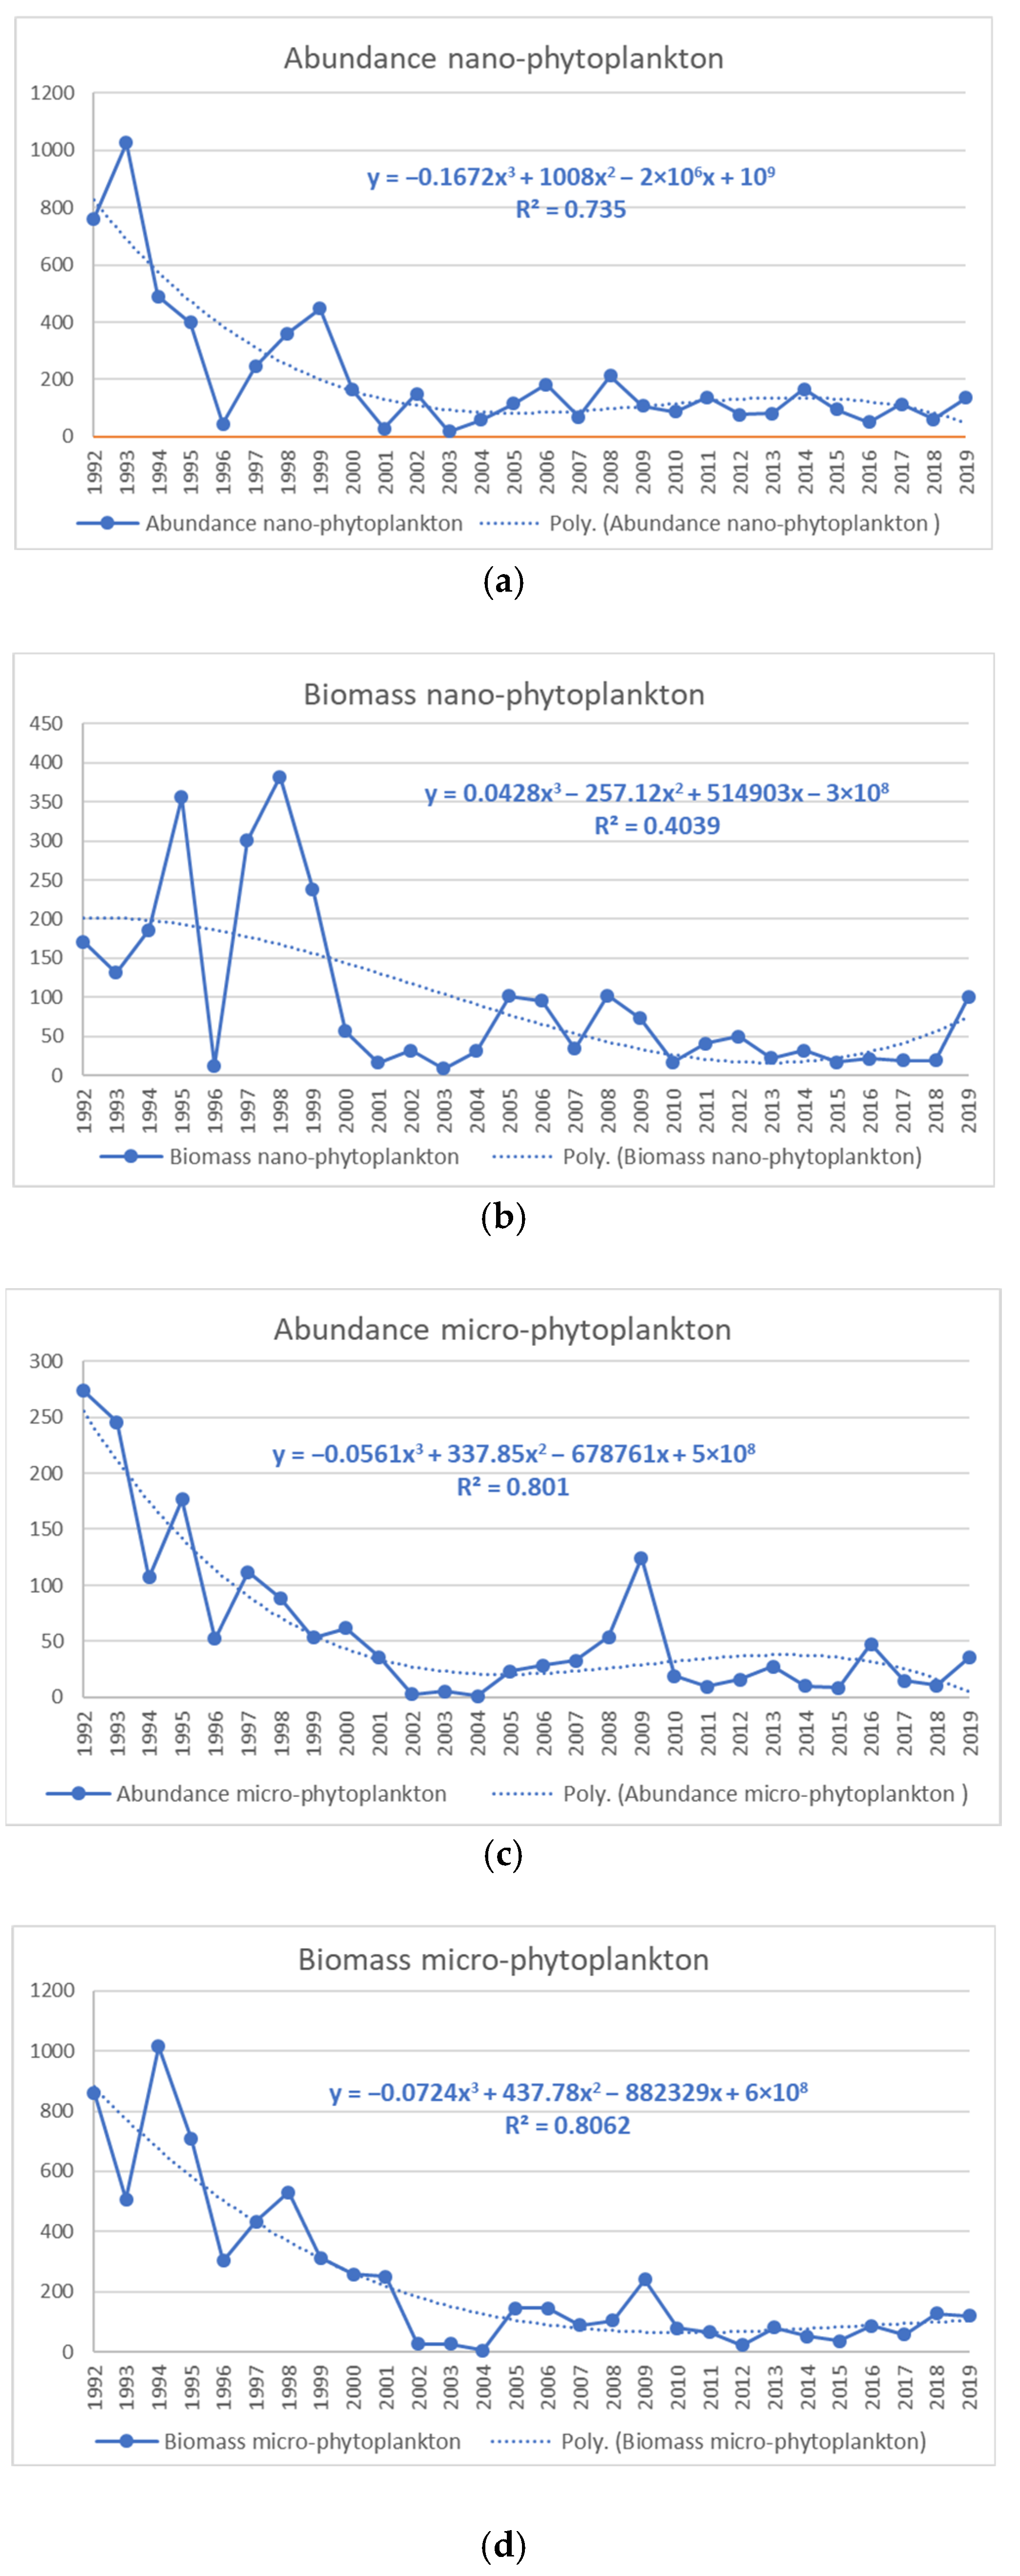
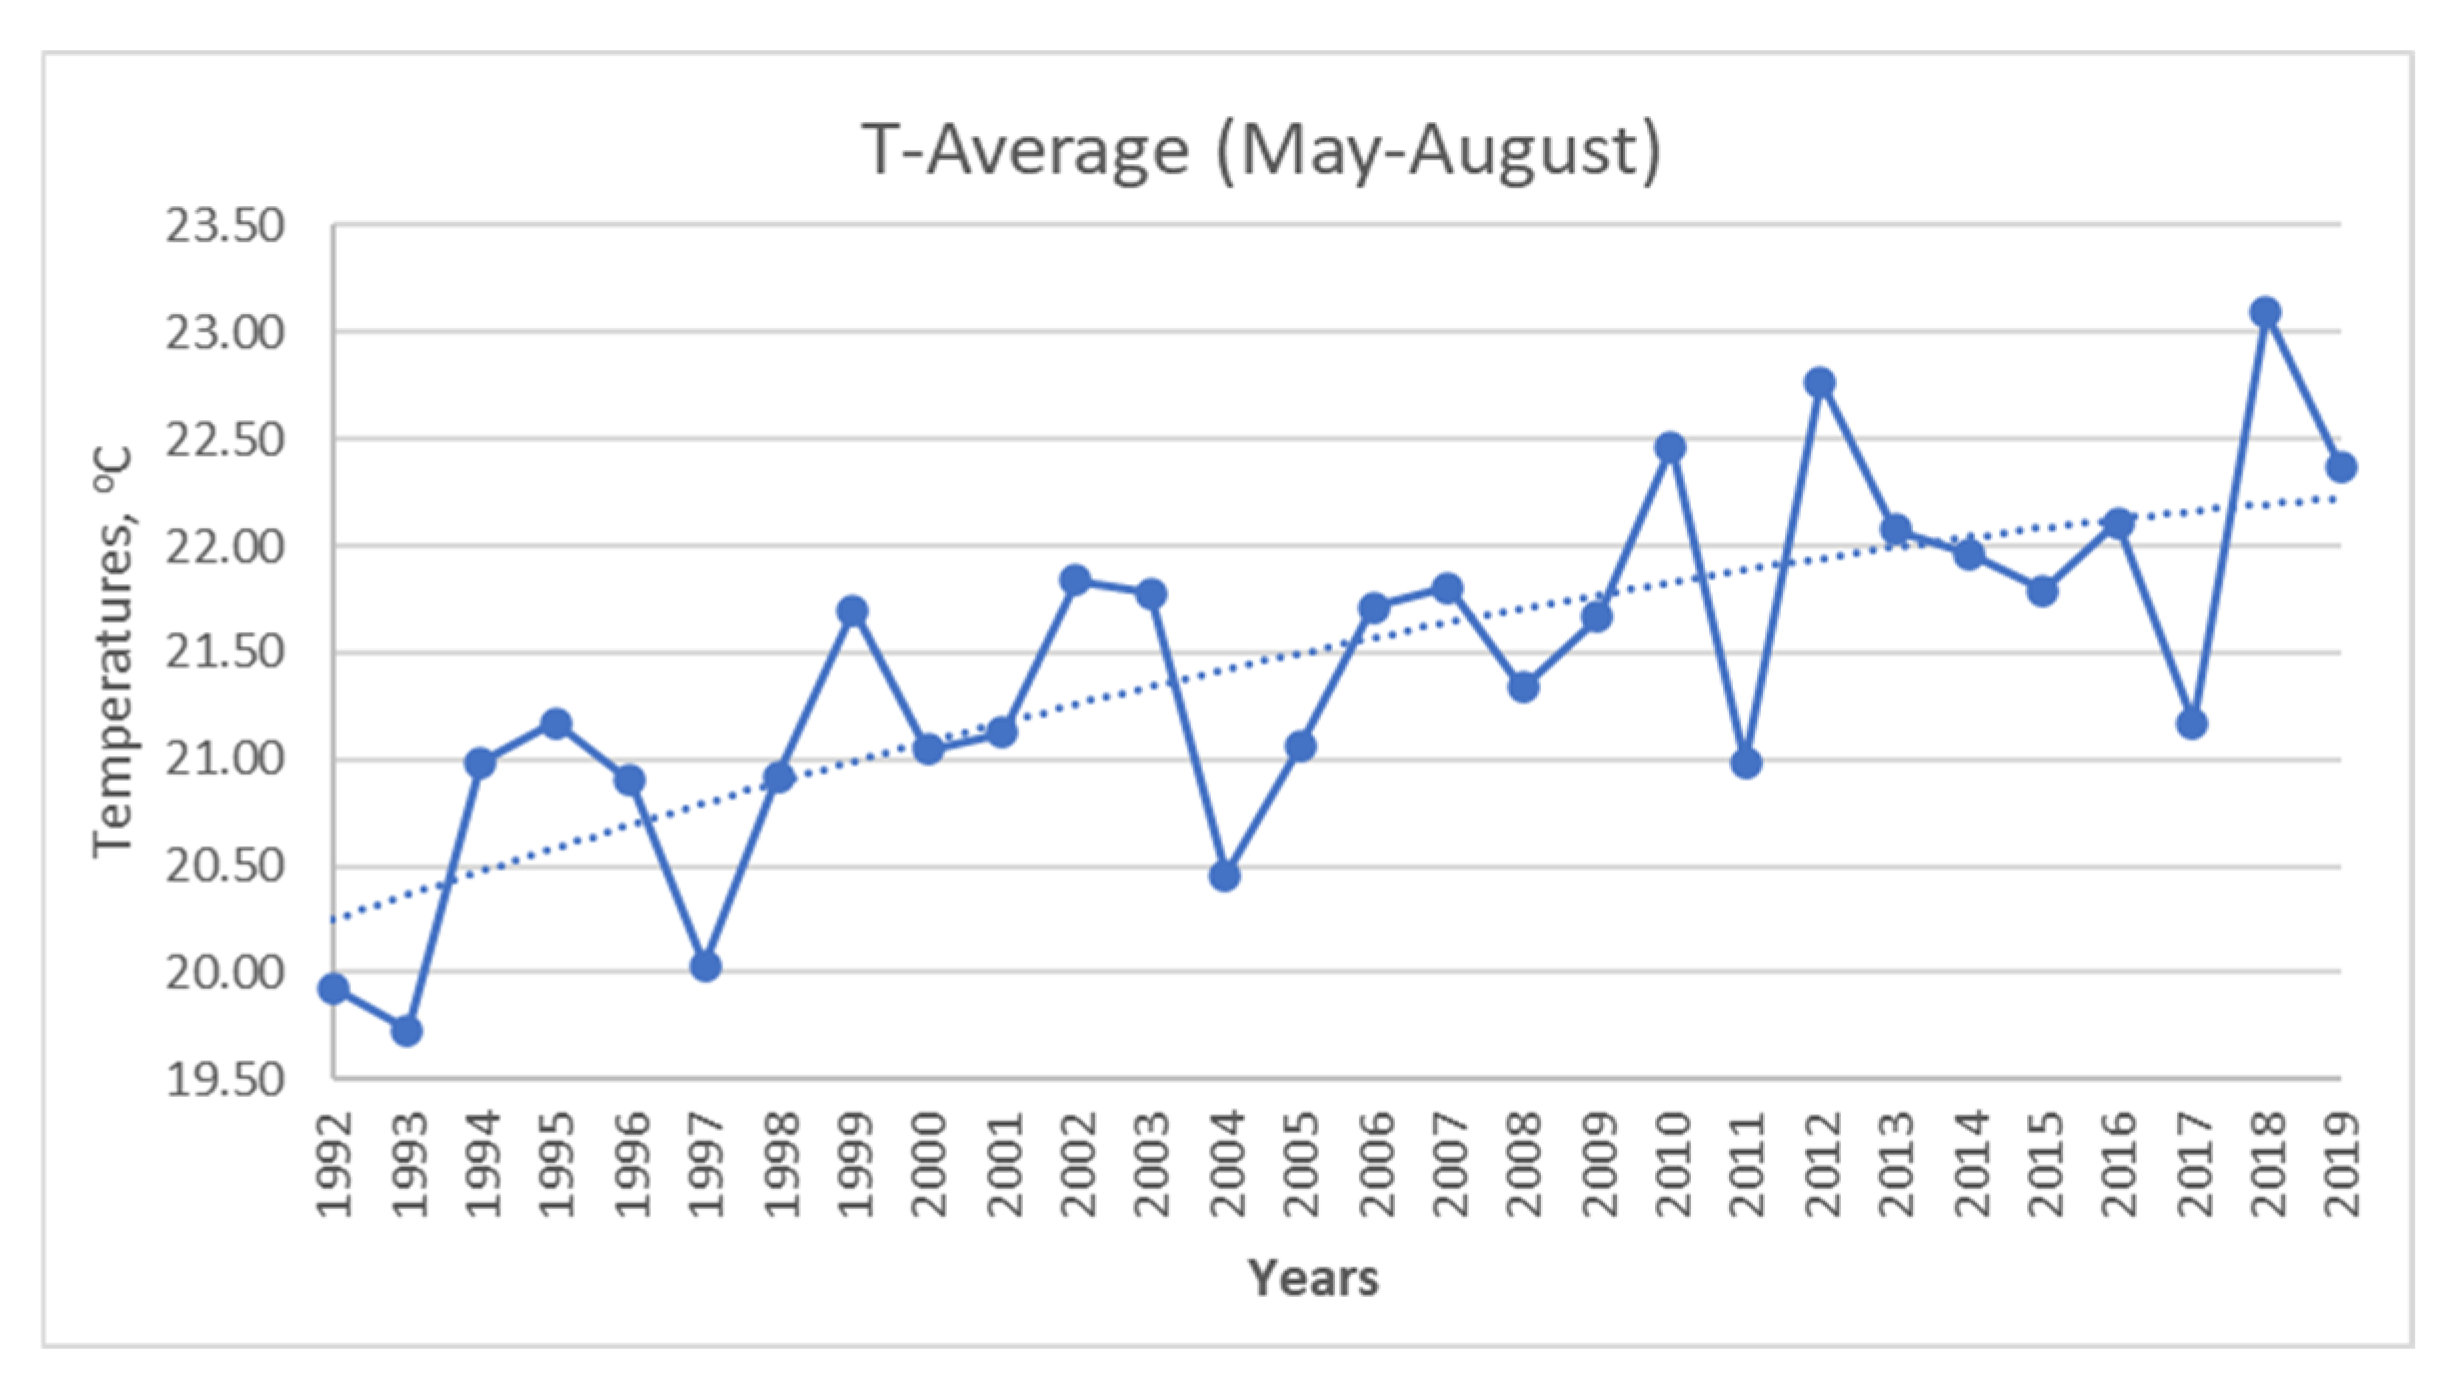
3.2. Relationship between the Sea Surface Temperature (SST), Abundance, and Biomass of Nano- and Micro-Phytoplankton

Based on the data for the Varna Bay region, we found a positive trend of the average values of SST for the period May–August, 1992–2019 (Figure 4).
Using bivariate correlation analysis, a negative, statistically significant correlation was found between the SST and the abundance and biomass of nano- and micro-phytoplankton (Table 1). The values of Spearman’s correlation coefficients show a well-defined relationship between temperature and nano-phytoplankton abundance (−0.431), as well as between temperature, micro-phytoplankton abundance (−0.471), and biomass (−0.553). The relationship between temperature and nano-phytoplankton biomass (−0.405) is weaker compared to the dependencies for the above-mentioned parameters (Table 1).
The relationship between SST and abundance and biomass of nano- and micro-phytoplankton was studied by nonlinear regression analysis, and quadratic regression equations were compiled (Table 2).
The empirical significance levels confirm the statistically significant results from the nonlinear regression analysis for all parameters (except biomass) of nano-phytoplankton (Table 2). Moreover, the coefficients of determination (0.509; 0.530; 0.332) show that the change in the SST had an influence of 50.9% and 53% in the abundance of nano- and micro-phytoplankton, and 33.2% in the biomass of the micro-phytoplankton.

3.3. Relationship between SST, TP, DIN, and Abundance and Biomass of the Groups Dinophyceae, Bacillariophyceae, and Other

We studied the three groups: Dinophyceae, Bacillariophyceae, and Other, which are the most important ones in the sea phytoplankton by bivariate correlation and nonlinear regression analyses and tried to find any relationship between their abundance and biomass and the values of the sea surface temperature (SST) (Figure 4) and the nutrients TP and DIN (Figure 5 and Figure 6). As can be seen in Figure 5 and Figure 6, a negative trend of the average values of TP and unstable variations in the average values of DIN with tendencies to reduce were found.
The analyses of the nutrient dynamics in Varna Bay indicated that “in spite of variability by seasons nutrients demonstrated a decreasing trend or remained at the same level” [49] (p. 1701).
The dynamics of the abundance and biomass of the groups Dinophyceae, Bacillariophyceae, and Other during the studied period are shown in Figure 7. Since the coefficients of determination for all examined groups (except for the abundance of species of the group Other) varied from 0.337 to 0.763, the compiled regression equations show a moderate relationship between the dynamics of abundance and biomass of the groups and the studied period.
In all three groups (Dinophyceae, Bacillariophyceae, and Other), there was a negative correlation with SST (Table 3). The Spearman’s correlation coefficients show moderate and significant relationships between temperature and Bacillariophyceae abundance and biomass, as well as between the temperature and biomass of the Other group. The relationship between temperature and group Dinophyceae abundance and biomass and the abundance of the Other group is weak and insignificant.
A positive, statistically significant correlation was reported between TP (mg·L−1) and abundance and biomass for all three studied groups. The Spearman’s correlation coefficient showing the strength of the relationship between TP and the biomass of the Other group is the highest (0.637). This does not change the fact that the strength of the relationship between TP and abundance and biomass for all three studied groups is moderate.
Regarding DIN (mg·L−1), a statistically significant correlation was reported only for the abundance and biomass of the Dinophyceae group. Spearman’s correlation coefficients (0.415 and 0.450) indicate a moderate relationship between DIN (mg·L−1) and the abundance and biomass of this group. The strength of the relationship between DIN (mg·L−1) and the abundance and biomass of Bacillariophyceae and the Other group is positive but weak.
The results from the nonlinear regression analysis showed statistically insignificant relationships between the abundance and biomass of Dinophyceae and SST (Table 4).
The relationship between abundance and biomass and SST is statistically significant, with moderate strength for class Bacillariophyceae (Table 4). The temperature change can account for 49.5% (R2 = 0.495) of the changes in the abundance of Bacillariophyceae and 35.6% (R2 = 0.356) of the changes in the biomass. The regression analysis established a weak statistically insignificant relationship between the abundance of group Other and SST (Table 4). The coefficient of determination (0.063) showed that the temperature changes influenced only 6.3% of the changes in the abundance of group Other. The change in biomass of group Other showed the highest statistical significance. The changes in the temperature account for 51.4% of the changes in the biomass of group Other, according to the coefficient of determination (R2 = 0.514).
Table 5 presents the results of the non-linear regression analysis examining the relationship between TP (mg·L−1) and the abundance and biomass of the three groups (Dinophyceae, Bacillariophyceae, and Other) during the observed period. As with sea surface temperature, a statistically insignificant relationship between the abundance and biomass of Dinophyceae and TP was obtained. The coefficient of determination indicated that only 13% (R2 = 0.13) of the changes in abundance and 29.3% (R2 = 0.293) of the changes in biomass were due to total phosphorus levels.
The results for group Other are similar. A weak, statistically insignificant relationship between the abundance of group Other and total phosphorus was reported. Only about 16.8% of the changes in the abundance of group Other are due to the changes in TP, evident from the value of the coefficient of determination (0.168). Regarding the biomass of group Other, the non-linear regression analysis showed a statistically significant relationship between biomass and TP. The coefficient of determination (0.413) is an indicator that 41.3% of the changes in the biomass of group Other are due to the changes in total phosphorus.
The relationship between the abundance and biomass of the Bacillariophyceae class is statistically significant, and according to the coefficients of determination (0.395 and 0.387), it can be concluded that about 39.5% of the abundance changes and 38.7% of the biomass changes of the Bacillariophyceae group are due to the changes in total phosphorus for the studied period.
Table 6 presents the results of the non-linear regression analysis examining the relationship between DIN (mg·L−1) and the abundance and biomass of the three groups (Dinophyceae, Bacillariophyceae, and Other) during the observed period. A statistically significant relationship was obtained only between the abundance and biomass of the Dinophyceae group and DIN (mg·L−1). Changes in DIN (mg·L−1) during the observed period can explain 23.7% of the changes in abundance (R2 = 0.237) and 40.8% of the changes in biomass (R2 = 0.408) of the Dinophyceae group.
The relationship between the abundance and biomass of class Bacillariophyceae and group Other with DIN (mg·L−1) is weak and statistically insignificant. The coefficients of determination (0.052 and 0.057) show that only about 5% of the changes in the abundance of Bacillariophyceae and the Other group result from the changes in DIN (mg·L−1). Similar results were obtained for changes in the biomass of Bacillariophyceae and group Other. About 13% of the changes in the biomass of Bacillariophyceae (R2 = 0.133) and 10% of the changes in the biomass of group Other (R2 = 0.100) are due to the changes in DIN (mg·L−1) for the studied period.

4. Discussion

At present, coastal habitats are vulnerable to climate change, but the research on these areas has not been organized in a coherent manner. Therefore, any research in this direction (including the results of this research) can contribute to the appropriate adaptation of the habitats in these areas to a changing climate.
“The unprecedented rates of warming observed during recent decades exceed the natural variability to such an extent that this phenomenon is widely recognized as a major environmental problem not only among scientists” [89] (p.203).
The increase in sea surface temperature (SST) in the Black Sea in recent decades is a fact [66,68,90]. The results from our study also demonstrate a positive trend in temperature increase and a possible significant influence on the biocoenosis in Varna Bay (especially on the phytoplankton, which is the first target of nutrient changes and is a critical factor in marine water quality and ecosystem health).
Why was Varna Bay chosen for this study? In order to execute a scientific comparison between different coastal ecosystems in the Black Sea, it is necessary to have a long-term data set for the period 1992–2019.
The only other heavily eutrophicated bay that is subject to human impact on the Bulgarian Black Sea coast is Burgas Bay. Unfortunately, there has not been enough data on it over the years. The authors’ have insufficient observations that do not allow for long-term analyses to be conducted. There are not enough publications on phytoplankton biocenoses. Available publications are for different years, different seasons, and different taxonomic compositions. Therefore, for the purpose of this study, Varna Bay has been chosen.
“Eutrophication has been described as one of the greatest contemporary threats to the integrity of coastal ecosystems. The increased availability of nutrients (generally N and P) is a major factor that drives eutrophication in coastal areas” [91] (p.40).
Increased nutrient input into the sea can lead to undesirable effects associated with eutrophication, including harmful algal blooms, undesirable changes in species composition, bottom layers’ anoxia, mass mortality of fish and benthic organisms, etc. Eutrophication has severely affected both the shallow waters as well as the entire shelf area of the Black Sea since the early 1970s.
“In 2007, eutrophication has been determined as one of the key transboundary problems in the Black Sea despite all evidence, compiled since 1995, which substantiate a certain decrease in its intensity as compared to the period of 1970–1990” [91] (p.41).
The research question of our study was “How do the temperature and nutrient changes in Varna Bay influence the size of the phytoplankton species and the abundance and biomass of the different taxonomic groups?” We tried to answer it by studying the relationships between the temperature and nutrients and the structure of phytoplankton through appropriate statistical procedures. The results seem to indicate that there are certain dependencies between these variables.
Our results show that one of the factors that has a strong influence on phytoplankton productivity is SST. This result is similar to what Stelmakh et al. (2023) [92] found in their study of a different Black Sea region.
In coastal waters near Sevastopol (the Quarantine Bay and Sevastopol Bay), Black Sea “during the last years, significant changes in the phytoplankton biomass annual dynamics and its dominant species composition have taken place. At the end of the last century and in the early 2000s, the authors observed an intensive development of small species of diatoms S. costatum, C. socialis, and C. curvisetus” [92] (p.11). They also comment that “this is mainly due to the influence of increased water temperature and growing anthropogenic pollution. At the same time, interannual variability of phytoplankton parameters cannot be ruled out” [92] (p.11).
“Currently, as a result of the phytoplankton species composition restructuring, the maximum values of the phytoplankton growth rate and microzooplankton grazing have significantly decreased compared to the respective values in the early 2000s. Reduced nutrition quality for microzooplankton and the suppressive effects of water pollutants on them caused a twofold decrease in the relative share of primary production consumed by microzooplankton. This suggests that the flow of matter and energy from phytoplankton through microzooplankton to the highest trophic levels has significantly decreased” [92] (p.12).
In another study on the Atlantic Ocean (Maranon et al., 2012 [93]), the authors were faced with the same question for a different region.
Maranon et al. (2012) [93] (p. 1266) “have recently suggested a direct and important effect of temperature on the size structure of phytoplankton assemblages, such that warmer temperatures would cause an increased contribution of small cells to total phytoplankton biomass reported that 73% of the variability in the contribution of picophytoplankton to total phytoplankton biomass in temperate waters of the North Atlantic is explained by temperature alone, irrespective of trophic status and resource supply as inferred from in situ nutrient concentrations”.
Long-term temperature change in ocean waters associated with climate trends has been shown to affect phytoplankton abundance, phenology [3], and shifts in taxonomic composition. Such changes can be spread to the higher levels of the food web [75].
Our statistical analyses demonstrate that temperature changes significantly affect the abundance of nano- and micro-phytoplankton (up to 51–53%), but influence the biomass of micro-phytoplankton to a lesser extent and do not affect nano-phytoplankton.
The above-quoted results support our conclusions.
Climate-driven changes in nutrients, temperature, and light have regionally varying and sometimes counterbalancing influences on phytoplankton biomass and structure [87]. The complex interaction of environmental factors (temperature, turbulence, nutrient assimilation, light, grazing, etc.) impacts the taxonomic structure of the phytoplankton and the size of mass-developing phytoplankton species [6,73,94,95].
The phytoplankton data reflect the long-term (1992–2019) results from the field research of the phytoplankton population in the Bulgarian coastal waters. It is possible that during this long period of 28 years, different environmental factors interacted with each other and influenced to a different extent the development of phytoplankton, taxonomic structure, and the size of mass-developing phytoplankton species.
Our multi-year monitoring analysis in Varna Bay took into account seasonality, succession, and other environmental factors. In the period of May, June, July, August, mainly heat-loving phytoplankton species develop, and during the transition from late spring to summer, phytoplankton succession takes place in which, if there are enough nutrients during these months, blooms mainly of dinoflagellates, diatoms and Prymnesiophycea develop.
In the 1990s, eutrophication caused a high abundance (blooms) of phytoplankton. A total of 25 dominant phytoplankton species were recorded. From the class Bacillariophyceae, 15 species prevailed in abundance: Skeletonema costatum (Greville) Cleve, 1873; Cyclotella caspia Grunow, 1878; Chaetoceros socialis H.S. Lauder, 1864; Cerataulina pelagica (Cleve) Hendey, 1937; Thalassiosira sp.; Chaetoceros sp.; Thalassiosira nana Lohmann, 1908; Chaetoceros muelleri Lemmermann, 1898; Chaetoceros similis Cleve, 1896; Nitzschia tenuirostris Mer., 1902; Nitzschia sp. Hassall, 1845; Leptocylindrus danicus P.T. Cleve, 1889; Melosira sp. C.Agardh, 1824; Dactyliosolen fragilissimus (Bergon) Hasle in Hasle and Syvertsen, 1996; Pseudo-nitzschia seriata (P.T. Cleve, 1883) H. Peragallo in H. and M. Peragallo, 1900. From the dinoflagellates, four species were found: Prorocentrum cordatum (Ostenfeld, 1901) Dodge, 1975; Gymnodinium catenatum L.W. Graham, 1943; Heterocapsa triquetra (Ehrenberg, 1840) Stein, 1883; Scrippsiella trochoidea (Stein, 1883) Balech ex Loeblich III, 1965. The other classes were represented by 1–2 species of each.
In the first decade of the 21st century, the number of bloom species was reduced to eight species, with dominating species Pr. cordatum (Dinophyceae); Ps.-nit. delicatissima, Dact. fragilissimus and Cer. pelagica (Bacillariophyceae); the classes Cyanophyceae, Prymnesiophyceae, Cryptophyceae were represented by one species each: Oscillatoria sp., Merismopedia elegans A.Braun ex Kützing, 1849 and Emiliania huxleyi respectively.
In the second decade of the 21st century, only six species were found with bloom condition: Pr. cordatum, Sk. costatum, Ps.-nitzschia delicatissima, Oscillatoria sp., Emiliania huxleyi and small Flagellates (Cryptophyceae). Among the species that developed in high abundance in the second decade of the 21st century, the usual for the eutrophic period microplankton representatives such as Heterocapsa triquetra, Scrippsiella trochoidea, Cerataulina pelagica, Dactyliosolen fragilissimus, Thalassiosira sp., Euglena viridis, Euglena sp., Astasia sp., which were common in the 1980s, are no longer present [36].
It is known that multiannual changes are accompanied by variations in the peaks of the quantitative development of phytoplankton, which depends on numerous environmental factors.
The analysis of the multi-year phytoplankton data raised another question—why, even though the number of phytoplankton blooms, the abundance and biomass of phytoplankton, and the concentration of nutrients decrease, can the characteristic features of the so-called “pristine” period in the ecology of the Black Sea ecosystem not be restored?
Based on our results, we can make a generalization that, if during the “pristine” period the climatic factors prevailed over the anthropogenic ones, then nowadays, the two types of factors act together and alternate in different variations.
This determines the still-unstable state of the Black Sea ecosystem, despite the implemented laws and policies for the protection of marine waters.
During the period of 1992–2019, the average yearly value of the phytoplankton abundance, biomass, the number and intensity of the phytoplankton blooms, and the nutrient content display a decreasing tendency, which marks a reduction of eutrophication in the Bay [36,41,96,97,98,99]. At the same time, parallel to these processes, the effect of temperature changes is observed.
On the one hand, the temperature increase suppressed the abundance of the diatoms [76] and thus changed the ratio between diatoms and dinoflagellates [99]. On the other hand, the increased temperatures accelerated the metabolism of the phytoplankton [99], which stimulates the development of small opportunistic dinoflagellates [100], which are an indicator of eutrophication [23].
The results from the key research studies describe temperature and the presence of nutrients as the two major factors driving the growth and structure of phytoplankton [16,98]. The temperature might affect not only the development of the different phytoplankton taxonomic groups, but also the groups of different sizes—nano- and micro-phytoplankton [3,76,99].
Our results support these conclusions and illustrate the significant role of temperature and nutrients as the factors of greatest importance for the development and structure of phytoplankton communities in Varna Bay over the years.
Bopp et al. (2005) [76] (p.1) found that “climate change leads to more nutrient-depleted conditions in the surface ocean and that it favors small phytoplankton at the expense of diatoms.” Ray et al. (2001) [101] (p.1) claim that “Size appears to be an important parameter in ecological processes. All physiological processes vary with body size ranging from small microorganisms to higher mammals.“ Edwards and Richardson (2004) [3] (p. 883) also conclude that “although many pelagic organisms are responding to climate warming, it is the intensity of the response that varies considerably amongst the pelagic assemblage.”
In our analysis rising SSTs moderately influence the reduction in abundance and biomass of the class Bacillariophyceae. A statistically strong influence of the rising temperatures on the reduction of the biomass of the representatives of the group Other was found.
It is possible that the established strong influence of increasing SST on the reduction of the biomass of species in group Other is due to the reduction in the size of these species.
The increasing temperature in Varna Bay does not affect the species of the class Dinophyceae. The results from the statistical analysis demonstrate that higher concentrations of dissolved inorganic nitrogen (DIN) have a moderate effect on the increase in the biomass of dinoflagellates, but they have a relatively weak effect on the increase in their abundance.
On the other hand, TP has a moderate effect on increasing the abundance and biomass of the class Bacilariophyceae, as well as on increasing the biomasses of the representatives of the group Other.
A routine practice in calculating species biomass is to measure individual sizes under a microscope. In these measurements over the last two decades, we observed that the typical species have been smaller in size (unpublished data).
The diversity in the structure of the dominant diatoms decreased, leading to significant changes in the ratio between nano- and micro-phytoplankton.
“Phytoplankton phenology and size structure are key ecological indicators that influence the survival and recruitment of higher trophic levels, marine food web structure, and biogeochemical cycling. For example, the presence of larger phytoplankton cells supports food chains that ultimately contribute to fisheries resources“ [102] (p.1).
To the authors’ knowledge, the paper is the first in Bulgarian research work that analyzes the long-term impact of SST and nutrients by the application of statistical methods for the evaluation of the changes in the taxonomic and size structure of the phytoplankton communities in Varna Bay. This determines the significance of this study. The obtained results could contribute to a better understanding of the processes taking place in coastal ecosystems and their effective management. Determining the specific contribution of the different factors on the phytoplankton changes requires additional holistic and modelling research.
The results from this study demonstrate a need to continue researching the dependence between SST/nutrients and changes in the group Other, which will be the subject of subsequent publications.

5. Conclusions

Our results illustrate the significant role of temperature and nutrients as factors of greatest importance for the development and structure of phytoplankton communities in the Varna Bay of the Black Sea over the years.
The results show that the increase in the sea surface temperature has a significant impact on the formation of the size structure of the phytoplankton community in Varna Bay, as the SST explains 50.9% of the abundance of nano-phytoplankton and 53% of the micro-phytoplankton, respectively. The effect of SST ranged from statistically weak on micro-phytoplankton biomass to insignificant on nano-phytoplankton biomass.
The long-term positive trend of SST in Varna Bay affects the reduction of the abundance and biomass of the class Bacillariophyceae and the biomass of the species in the group Other. An increase in SST slightly affects the abundance and biomass of the class Dinophyceae and does not affect the abundance of the species in the group Other.
The influence of TP (mg·L−1) is stronger than that of DIN (mg·L−1). The decrease in TP (mg·L−1) had a statistically significant effect on the decrease in the abundance and biomass of Bacillariophyceae, as well as on the decrease in biomass in the group Other.
The concentrations of DIN (mg·L−1) decrease and have a statistically significant effect exclusively on the reduction of the abundance and biomass of Dinophyceae.
The dynamics of SST and TP (mg·L−1) most significantly affect the reduction of the biomass of the species of the group Other (the determined dominant species are of small sizes from the classes Cryptophyceae, Prymnesiophyceae and Cyanophyceae).
The statistical analyses show that the increase in SST has a significant impact on the changes in the taxonomic structure of phytoplankton compared to the dynamics of the concentration of the analyzed TP (mg·L−1) and DIN (mg·L−1) during the period 1992–2019.

Author Contributions

Conceptualization, D.K. and D.G.; development of the study plan for the field work as well as the laboratory investigation, D.K. and D.G.; data curation, D.K., N.N. and M.G.; formal analysis, P.V.; methodology, D.K., N.N. and MG; resources, M.G.; validation, D.G., M.G. and P.V.; visualization, D.G. and P.V.; writing—original draft preparation, D.K., D.G., N.N., P.V. and M.G.; writing—review and editing, D.K., D.G., N.N., P.V. and M.G. All authors have read and agreed to the published version of the manuscript.

Funding

This research received funding from Medical University-Pleven, Bulgaria. Part of this research was supported by MASRI—Infrastructure for Sustainable Development of Marine Research, including the participation of Bulgaria in the European Infrastructure Euro-Argo, an object of the National Roadmap for Scientific Infrastructure (2017–2023) of the Republic of Bulgaria.

Institutional Review Board Statement

Not applicable.

Informed Consent Statement

Not applicable.

Data Availability Statement

Not applicable.

Acknowledgments

The authors would like to thank the management of Medical University-Pleven, Bulgaria for the financial support. Part of this research was supported by MASRI—Infrastructure for Sustainable Development of Marine Research, including the participation of Bulgaria in the European Infrastructure Euro-Argo, an object of the National Roadmap for Scientific Infrastructure (2017–2023) of the Republic of Bulgaria. The authors would like to thank Maria Angelova (Cleveland State University), for helping with the translation of parts of the text.

Conflicts of Interest

The authors declare no conflict of interest.

References

  1. Angelov, A. General Hydrobiology; Science and Art: Sofia, Bulgaria, 1971; pp. 1–326. (In Bulgarian) [Google Scholar]
  2. Eppley, R.W. Temperature and phytoplankton growth in the sea. Fish. Bull. 1972, 70, 1063–1085. Available online: https://spo.nmfs.noaa.gov/sites/default/files/pdf-content/1972/704/eppley.pdf (accessed on 6 September 2022).
  3. Edwards, M.; Richardson, A.J. Impact of climate change on marine pelagic phenology and trophic mismatch. Nature 2004, 430, 881–884. [Google Scholar] [CrossRef] [PubMed]
  4. Stenseth, N.C.; Mysterud, A.; Ottersen, G.; Hurrell, J.W.; Chan, K.-S.; Lima, M. Ecological effects of climate fluctuations. Science 2002, 297, 1292–1296. [Google Scholar] [CrossRef] [PubMed]
  5. Uzunov, J.; Kovachev, S. Hydrobiology; Pensoft: Sofia, Bulgaria; Moscow, Russia, 2002; pp. 1–342. ISBN 9789546425195. (In Bulgarian) [Google Scholar]
  6. Nicklisch, A.; Shatwell, T.; Köhler, J. Analysis and modelling of the interactive effects of temperature and light on phytoplankton growth and relevance for the spring bloom. J. Plankton Res. 2008, 30, 75–91. [Google Scholar] [CrossRef]
  7. Daskalov, G.M. Long-term changes in fish abundance and environmental indices in the Black Sea. Mar. Ecol. Prog. Ser. 2003, 255, 259–270. [Google Scholar] [CrossRef]
  8. Konovalov, S.K.; Murray, J.W. Variations in the chemistry of the Black Sea on a time scale of decades (1960–1995). J. Mar. Syst. 2001, 31, 217–243. [Google Scholar] [CrossRef]
  9. Lancelot, C.L.; Staneva, J.V.; Van Eeckhout, D.; Beckers, J.-M.; Stanev, E.V. Modelling the Danube-influenced North-western continental shelf of the Black Sea. Ecosystem response to changes in nutrient delivery by the Danube River after its damming in 1972. Estuar. Coast. Shelf Sci. 2002, 54, 473–499. [Google Scholar] [CrossRef]
  10. Mikaelyan, A.S. Long-term variability of phytoplankton communities in open Black Sea in relation to environmental changes. In Sensitivity to Change: Black Sea, Baltic Sea and North Sea NATO-ASI Series 2 Environment 27; Ozsoy, E., Mikaelyan, A., Eds.; Kluwer Academic Publishers: Dordrecht, The Netherlands, 1997; pp. 105–116. [Google Scholar] [CrossRef]
  11. Niermann, U.; Kideys, A.E.; Kovalev, A.V.; Melnikov, V.; Belokopytov, V. Fluctuations of pelagic species of the open Black Sea during 1980-1995 and possible teleconnections. In Environmental Degradation of the Black Sea: Challenges and Remedies NATO ASI Series B Environmental Security 56; Besiktepe, S., Unluata, U., Bologa, A., Eds.; Kluwer Academic Publishers: Dordrecht, The Netherlands, 1999; pp. 147–174. [Google Scholar] [CrossRef]
  12. Oguz, T. Black Sea ecosystem response to climatic teleconnections. Oceanography 2005, 18, 122–133. [Google Scholar] [CrossRef]
  13. Yunev, O.A.; Vedernikov, V.I.; Basturk, O.; Yilmaz, A.; Kideys, A.E.; Moncheva, S.; Konovalov, S. Long-term variations of surface chlorophyll-a and primary production in the open Black Sea. Mar. Ecol. Prog. Ser. 2002, 230, 11–28. [Google Scholar] [CrossRef]
  14. Mee, L.D. The Black Sea in crisis: A need for concerted international action. Ambio 1992, 21, 278–286. [Google Scholar] [CrossRef]
  15. Oguz, T.; Velikova, V. Abrupt transition of the northwestern Black Sea shelf ecosystem from a eutrophic to an alternative pristine state. Mar. Ecol. Prog. Ser. 2010, 405, 231–242. Available online: http://www.jstor.org/stable/24873891 (accessed on 2 July 2022). [CrossRef]
  16. Sakalli, A.; Basusta, N. Sea surface temperature change in the Black Sea under climate change: A simulation of the sea surface temperature up to 2100. Int. J. Climatol. 2018, 38, 4687–4698. [Google Scholar] [CrossRef]
  17. Petrova, V.Y. Phytoplankton in the Black Sea off the Bulgarian coast for the period 1954–1957. Proc. Cent. Res. Inst. Fish Farming Fish. (CRIFFF)-Varna 1963, 3, 31–60. (In Bulgarian) [Google Scholar]
  18. Petrova, V.Y. Phytoplankton in the Black Sea off the Bulgarian coast during the period 1958–1960. Proc. Inst. Fish Resour. (IFR)-Varna 1964, 5, 5–32. [Google Scholar]
  19. Petrova-Karadzhova, V.Y. Dynamics of phytoplankton biomass in the Black Sea off the Bulgarian coast during the period 1964–1970. Proc. Inst. Oceanogr. Fish. (IOF)-Varna 1973, 12, 41–66. (In Bulgarian) [Google Scholar]
  20. Cociasu, A.; Popa, L. Significant changes in Danube nutrient loads and their impact on the Romanian Black Sea coastal waters. Cercet. Mar. 2004, 35, 25–37. Available online: http://www.rmri.ro/Home/Downloads/Publications.RecherchesMarines/2004/paper02.pdf (accessed on 23 January 2020).
  21. Cociasu, A.; Dorogan, L.; Humborg, C.; Popa, L. Long-term ecological changes in the Romanian coastal waters of the Black Sea. Mar. Pollut. Bull. 1996, 32, 32–38. [Google Scholar] [CrossRef]
  22. Humborg, C.; Ittekkot, V.; Cociasu, A.; Bodunge, B.V. Effect of Danube River dam on Black Sea biogeochemistry and ecosystem structure. Nature 1997, 386, 385–388. [Google Scholar] [CrossRef]
  23. Kamburska, L.; Moncheva, S.; Konsulov, A.; Krastev, A.; Prodanov, K. The invasion of Beroe ovata in the Black Sea a warming signal for ecosystem concern. Proc. Inst. Oceanol. 2003, 4, 111–123. Available online: http://www.io-bas.bg/downloads/Ocean_V4_15.pdf (accessed on 22 July 2022).
  24. Mavrodieva, R.; Michneva, V.; Hiebaum, G.; Venzislav, K. Phytoplankton community in the bay of Bourgas, abiotic ambience and trends in major shifts. In Proceedings of the Seventh International Conference on the Mediterranean Coastal EnvironmentsMEDCOAST, Kushadasi, Turkey, 25–29 October 2005; Ozhan, E., Ed.; pp. 557–568. Available online: https://www·medcoast.net/modul/index/menu/MEDCOAST-05/208 (accessed on 4 July 2022).
  25. Moncheva, S.; Krastev, A. Some Aspects of Phytoplankton Long-Term Alterations Off Bulgarian Black Sea Shelf. In Sensitivity to Change: Black Sea, Baltic Sea and North Sea NATO ASI Series; Özsoy, E., Mikaelyan, A., Eds.; Springer: Dordrecht, The Netherlands, 1997; Volume 27, pp. 79–94. [Google Scholar] [CrossRef]
  26. Moncheva, S.; Doncheva, V.; Kamburska, L. On the long-term response of harmful algal blooms to the evolution of eutrophication off the Bulgarian Black Sea coast: Are the recent changes a sign of recovery of the ecosystem-the uncertainties. In Proceedings of the IX International Conference on Harmful Algal Blooms, Hobart, Tasmania, 7–11 February 2000; UNESCO-IOC: Paris, France, 2001; pp. 177–182. Available online: https://wedocs.unep.org/handle/20.500.11822/845?show=full (accessed on 7 June 2022).
  27. Moncheva, S.P. On the thermohaline development of some mass phytoplankton species from the northern part of the Bulgarian coast. Oceanol. BAS Sofia 1991, 21, 14–20. (In Bulgarian) [Google Scholar]
  28. Moncheva, S.P. Ecology of Mass Phytoplankton from the Black Sea under Anthropogenic Eutrophication. Ph.D. Thesis, Institute of Botany Bulgarian Academy of Sciences, Sofia, Bulgaria, 1991. (In Bulgarian). [Google Scholar]
  29. Moncheva, S.P. Quantitative development of phytoplankton species as an indicator of eutrophication of the Bulgarian Black Sea coast. Oceanol. BAS Sofia 1991, 21, 21–30. (In Bulgarian) [Google Scholar]
  30. Moncheva, S. Phytoplankton blooms and succession under eutrophication. In Proceedings of the First National Conference on Problems of Biological Monitoring, Plovdiv, Bulgaria, 22–24 October 1987; pp. 133–138. [Google Scholar]
  31. Moncheva, S. Phytoplankton blooms in relation to some abiotic environmental factors. In Proceedings of the Scientific and Practical Conference—State of Research, Rational Utilization and Protection of Natural Resources of the Varna Region, Varna, Bulgaria, 30 October 1989; pp. 134–145. (In Bulgarian). [Google Scholar]
  32. Petrova, D.; Gerdzhikov, D. Ecological aspects on the distribution of phytoplankton in the Bulgarian part of the Black Sea. In Proceedings of the Seventh International Symposium Ecology-Sustainable Developmentof the Union of Scientists, Vratsa, Bulgaria, 23–25 October 2008; pp. 357–368. (In Bulgarian). [Google Scholar]
  33. Petrova, D.; Gerdzhikov, D. The phytoplankton community—An indicator of the ecological state along the Bulgarian Black sea coast. Cercet. Mar. 2008, 38, 53–72. [Google Scholar]
  34. Petrova, D.; Velikova, V.; Gerdzhikov, D. Recent state of phytoplankton community in the Varna bay. Bulg. J. Agric. Sci. 2006, 12, 247–260. Available online: http://www.agrojournal.org/12/02-11-06.pdf (accessed on 10 October 2022).
  35. Sukhanova, I.; Flint, M.; Hibaum, G.; Karamfilov, V.; Kopylov, A.; Matveeva, E.; Ratkova, T.; Sazhin, A. Exuviaella cordata red tide in Bulgarian coastal waters (May to June 1986). Mar. Biol. 1988, 99, 1–8. [Google Scholar] [CrossRef]
  36. Velikova, V.; Moncheva, S.; Petrova, D. Phytoplankton dynamics and Red Tides (1987–1997) in the Bulgarian Black Sea. Water Sci. Technol. 1999, 39, 27–36. [Google Scholar] [CrossRef]
  37. Vinogradova, L.A.; Velikova, V.N. Long-Term Dynamics of the NW Ecosystem of the Black Sea and Its Modeling; Sankt-Petersburg Publishers: Sankt-Petersburg, Russia, 1992; pp. 1–108. (In Russian) [Google Scholar]
  38. Zaitsev, Y.P.; Alexandrov, B.G.; Minicheva, G.G.; Adobovski, V.V.; Alexandrov, B.G.; Aniulova, L.V.; Babich, E.I.; Berlinskii, N.A.; Birkun, A.A.; Bogatova, U.I.; et al. The Northwest Part of the Black Sea: Biology and Ecology; Naukova Dumka: Kiev, Ukraine, 2006; pp. 1–701. ISBN 966-00-0159-2. (In Russian) [Google Scholar]
  39. Yunev, O.A.; Carstensen, J.; Moncheva, S.; Khaliulin, A.; Ertebjerg, G.; Nixon, S. Nutrient and phytoplankton trends on the western Black Sea shelf in response to cultural eutrophication and climate changes. Estuar. Coast. Shelf Sci. 2007, 74, 63–76. [Google Scholar] [CrossRef]
  40. Valkanov, A.; Marinov, H.; Danov, H.; Vladev, P.; Mishev, K.; Popov, V.; Petrova, V.; Valkanov, A.; Valchanov, G.; Dimitrov, D.; et al. Black Sea; Georgi Bakalov Publishers: Varna, Bulgaria, 1978; pp. 1–635. (In Bulgarian) [Google Scholar]
  41. Zaitsev, Y.; Mamaev, V. Biological Diversity in the Black Sea, A Study of Change and Decline; United Nations Publications: New York, NY, USA, 1997; pp. 1–208. ISBN 92-1-126042-6. [Google Scholar]
  42. Klisarova, D.; Gerdzhikov, D. Eutrophication of Varna Bay and coastal waters. Bulg. J. Agric. Sci. 2015, 21, 86–89. Available online: https://www.agrojournal.org/21/01s-13.pdf (accessed on 17 May 2022).
  43. Klisarova, D.; Gerdzhikov, D. Phytoplankton development off the Bulgarian coast (2015–2016). Proc. SU-Varna Mar. Sci. Ser. 2017, 1, 59–67. (In Bulgarian) [Google Scholar]
  44. Klisarova, D.; Gerdzhikov, D. Features of phytoplankton dynamics in Bulgarian coastal water areas. Proc. IFR-Varna 2017, 28, 63–72. (In Bulgarian) [Google Scholar]
  45. Petrova-Karadzhova, V.Y. Change of plankton flora in the Bulgarian Black Sea under the influence of eutrophication. Proc. IFR-Varna 1984, 21, 105–112. (In Bulgarian) [Google Scholar]
  46. Raymont, J.E.G. Plankton and Productivity in the Oceans—Volume 1 Phytoplankton, 2nd ed.; Pergamon Press Ltd.: Oxford, UK, 1980; pp. 1–496. ISBN 9781483297880. [Google Scholar]
  47. Sommer, U.; Gliwicz, Z.M.; Lampert, W.; Duncan, A. The PEG model of a seasonal succession of planktonic events in fresh waters. Arch. Hydrobiol. 1986, 106, 433–471. Available online: https://oceanrep.geomar.de/id/eprint/14151 (accessed on 22 January 2022). [CrossRef]
  48. Stelmakh, L.V.; Babich, I.I.; Tugrul, S.; Moncheva, S.; Stefanova, K. Phytoplankton Growth Rate and Zooplankton Grazing in the Western Part of the Black Sea in the Autumn Period. Oceanology 2009, 49, 83–92. [Google Scholar] [CrossRef]
  49. Shtereva, G.; Hristova, O.; Dzhurova, B.; Krastev, A. Hydrochemistry of Varna Bay (2000–2008). J. Environ. Prot. Ecol. 2012, 13, 1695–1702. [Google Scholar]
  50. Shtereva, G.P. Nutrients elements in the water in Bourgas Bay. Proceeding Union Sci.-Varna 2005, 1, 89–93. (In Bulgarian) [Google Scholar]
  51. Strokal, M.; Kroeze, C. Nitrogen and phosphorus inputs to the Black Sea in 1970–2050. Reg. Environ. Chang. 2013, 13, 179–192. [Google Scholar] [CrossRef]
  52. Velikova, V.; Petrova, D. Perennial dynamics of phytoplankton in Varna Bay during 1991–1997. Proc. Inst. Fish Resour. 1999, 25, 89–102. (In Bulgarian) [Google Scholar]
  53. Velikova, V.; Petrova, D.; Mihneva, V.; Dineva, S.; Ouzounova, S. Recent state of the Bulgarian Black Sea—Signs of improvement of the ecosystem. In Proceedings of the Fifth International Conference on the Mediterranean Coastal Environment MEDCOAST, Hammamet, Tunisia, 23–27 October 2001; Ozhan, E., Ed.; pp. 893–905. [Google Scholar]
  54. Velikova, V.; Cociasu, A.; Popa, L.; Boicenco, L.; Petrova, D. Phytoplankton community and hydrochemical characteristics of the Western Black Sea. Water Sci. Technol. 2005, 51, 9–18. [Google Scholar] [CrossRef]
  55. Petrova, D.; Ivanova, P.; Velikova, V.; Mihneva, V. The distribution of the plankton of the Black sea. In Proceedings of the Seventh International Conference on the Mediterranean Coastal Environment, MEDCOAST, Kushadasi, Turkey, 25–29 October 2005; Ozhan, E., Ed.; pp. 547–556. [Google Scholar]
  56. Krutov, A.; Alexandrov, B.; Korshenko, A.; Lavrova, O.; Adobovskiy, V.; Lipchenko, A.; Amalina, A.; Luybimtsev, A.; Arashkevich, E.; Machitadze, N.; et al. State of the Environment of the Black Sea (2009-2014/5); Publications of the Commission on the Protection of the Black Sea Against Pollution (BSC): Istanbul, Turkey, 2019; pp. 1–811. ISBN 978-605-84837-0-5. [Google Scholar]
  57. Todorova, V.; Monchev, S.; Dzhurova, B.; Doncheva, V.; Peichev, V.; Slabakova, V.; Raykov, V.; Karamfilov, V.; Shtereva, G.P.; Berov, D.; et al. Initial Assessment of the state of the Marine Environment, According to Article 8 of the MSFD and the NOEMS; Publications of the Institute of Oceanology BAS: Varna, Bulgaria, 2013; pp. 1–487. (In Bulgarian) [Google Scholar]
  58. Yunev, O.; Velikova, V.; Carstensen, J. Reconstructing the trophic history of the Black Sea shelf. Cont. Shelf Res. 2017, 150, 1–9. [Google Scholar] [CrossRef]
  59. Mikaelyan, A.S.; Chasovnikov, V.K.; Kubryakov, A.A.; Stanichny, S.V. Phenology and drivers of the winter-spring phytoplankton bloom in the open Black Sea: The application of Sverdrup’s hypothesis and its refinements. Prog. Oceanogr. 2017, 151, 163–176. [Google Scholar] [CrossRef]
  60. Mikaelyan, A.S.; Pautova, L.A.; Fedorov, A.V. Seasonal evolution of deep phytoplankton assemblages in the Black Sea. J. Sea Res. 2021, 178, 102125. [Google Scholar] [CrossRef]
  61. Oguz, T.; Gilbert, D. Abrupt transitions of the top-down controlled Black Sea pelagic ecosystem during 1960–2000: Evidence for regime-shifts under strong fishery exploitation and nutrient enrichment modulated by climate-induced variations. Deep. Sea Res. Part I Oceanogr. Res. Pap. 2007, 54, 220–242. [Google Scholar] [CrossRef]
  62. Petrova, D.; Gerdzhikov, D. Seasonal and inter annual variations of phytoplankton communities in Varna bay—Anthropogenic impact or climate changes. In Proceedings of the IV Balkan Conference BALNIMALCON, Stara Zagora, Bulgaria, 14–16 May 2009; pp. 357–362. [Google Scholar]
  63. Petrova, D.; Gerdzhikov, D. Development of the traditionally blooming phytoplankton species Prorocentrum cordatum Dodge, 1975 off the Bulgarian coast (2008–2010). Proc. Union Sci.-Varna 2013, 1, 12–17. (In Bulgarian) [Google Scholar]
  64. Petrova, D.; Gerdzhikov, D. Phytoplankton growth and chlorophyll-a content in the surface layer of the Bulgarian Black Sea coastal waters in 2011. Agric. Sci. Technol. 2013, 5, 99–104. [Google Scholar]
  65. Oguz, T.; Abaza, V.; Akatov, V.; Aktan, Y.; Arashkevich, E.; Birkun, A.; Boicenco, L.; Chikina, M.V.; Cociasu, A.; Daskalov, G.M.; et al. State of the Environment of the Black Sea (2001-2006/7); Black Sea Commission Publications: Istanbul, Turkey, 2008; pp. 1–421. ISBN 978-9944-245-33-3. [Google Scholar]
  66. Climate Change 2022: Impacts, Adaptation and Vulnerability. Available online: https://www.ipcc.ch/report/ar6/wg2/ (accessed on 21 June 2022).
  67. Allan, R.P.; Arias, P.A.; Berger, S.; Canadell, J.G.; Cassou, C.; Chen, D.; Cherchi, A.; Connors, S.L.; Coppola, E.; Cruz, F.A.; et al. Summary for policymakers. In Climate Change 2021: The Physical Science Basis. Contribution of Working Group I to the Sixth Assessment Report of the Intergovernmental Panel on Climate Change; Masson-Delmotte, V., Zhai, P., Pirani, A., Connors, S.L., Péan, C., Berger, S., Caud, N., Chen, Y., Goldfarb, L., Gomis, M.I., et al., Eds.; Cambridge University Press: Cambridge, UK, 2021; pp. 3–32. [Google Scholar] [CrossRef]
  68. WMO State of the Global Climate. Available online: https://library.wmo.int/doc_num.php?explnum_id=11178 (accessed on 21 June 2022).
  69. Mulet, S.; Buongiorno Nardelli, B.; Good, S.; Pisano, A.; Greiner, E.; Monier, M.; Autret, E.; Axell, L.; Boberg, F.; Ciliberti, S.; et al. Ocean temperature and salinity. J. Oper. Oceanogr. 2018, 11, s5–s13. [Google Scholar] [CrossRef]
  70. Black Sea Time Series and Trend (1997–2020) of Satellite Chlorophyll. Available online: https://marine.copernicus.eu/access-data/ocean-monitoring-indicators/black-sea-chlorophyll-time-series-and-trend-observations (accessed on 26 April 2022).
  71. Marañon, E.; Holligan, P.M.; Barciela, R.; Gonzalez, N.; Mourino, B.; Pazo, M.J.; Varela, M. Patterns of phytoplankton size structure and productivity in contrasting open-ocean environments. Mar. Ecol. Progr. Ser. 2001, 216, 43–56. [Google Scholar] [CrossRef]
  72. Bouman, H.A.; Platt, T.; Sathyendranath, S.; Li, W.K.W.; Stuart, V.; Fuentes-Yaco, C.; Maass, H.; Horne, E.; Ulloa, O.; Lutz, V.; et al. Temperature as indicator of optical properties and community structure of marine phytoplankton: Implications for remote sensing. Mar. Ecol. Progr. Ser. 2003, 258, 19–30. [Google Scholar] [CrossRef]
  73. Robinson, A.; Bouman, H.A.; Tilstone, G.H.; Sathyendranath, S. Size Class Dependent Relationships between Temperature and Phytoplankton Photosynthesis-Irradiance Parameters in the Atlantic Ocean. Front. Mar. Sci. 2018, 4, 435. [Google Scholar] [CrossRef]
  74. Peter, K.H.; Sommer, U. Phytoplankton Cell Size Reduction in Response to Warming Mediated by Nutrient Limitation. PLoS ONE 2013, 8, e71528. [Google Scholar] [CrossRef] [PubMed]
  75. Li, W.K.W.; Harrison, W.G.; Head, E.J.H. Coherent assembly of phytoplankton communities in diverse temperate ocean ecosystems. Proc. R. Soc. B 2006, 273, 1953–1960. [Google Scholar] [CrossRef] [PubMed]
  76. Bopp, L.; Aumont, O.; Cadule, P.; Alvain, S.; Gehlen, M. Response of diatoms distribution to global warming and potential implications: A global model study. Geophys. Res. Lett. 2005, 32, 1–4. [Google Scholar] [CrossRef]
  77. BSCommision. Available online: http://www.blacksea-commission.org/The%20Black%20Sea/Geography/ (accessed on 15 March 2023).
  78. Vessel Traffic Service Authority. Available online: https://vtmis.bg/en/structure/vessel-traffic-services-authority-varna/general-information/vts-varna-geographical-information (accessed on 15 March 2023).
  79. PROVACAT Report of project Provadijska Catchment. Available online: http://www.iia.cnr.it/big_file/EUROCAT/minutes/ProvoCat.pdf (accessed on 15 September 2007).
  80. Morozova-Vodyanitskaya, N.V. Phytoplankton of the Black Sea, part II. Proc. Sevastopol Biol. Stn. 1954, 8, 11–99. (In Russian) [Google Scholar]
  81. Moncheva, S.; Parr, B. Manual for Phytoplankton Sampling and Analysis in the Black Sea; Black Sea Commission: Istanbul, Turkey, 2010; pp. 1–68. [Google Scholar]
  82. Edler, L. Recommendations for Marine Biological Studies in the Baltic Sea Phytoplankton and Chlorophyll; Baltic Marine Biologists: Uppsala, Sweden, 1979; pp. 5–38. [Google Scholar]
  83. Olenina, I.; Hajdu, S.; Edler, L.; Andersson, A.; Wasmund, N.; Busch, S.; Göbel, J.; Gromisz, S.; Huseby, S.; Huttunen, M.; et al. Biovolumes and size-classes of phytoplankton in the Baltic Sea. HELCOM Balt.Sea Environ. Proc. 2006, 106, 1–144. [Google Scholar]
  84. Klisarova, D. Phytomar 2.0—Software; Institute of Fish Resources: Varna, Bulgaria, 2008. [Google Scholar]
  85. WoRMS Editorial Board. World Register of Marine Species. Available online: https://www·marinespecies.org (accessed on 18 November 2021). [CrossRef]
  86. Guiry, M.D.; Guiry, G.M. AlgaeBase. World-Wide Electronic Publication, National University of Ireland, Galway. Available online: http://www.algaebase.org (accessed on 12 November 2021).
  87. Zeitzschel, B. Why study phytoplankton. In Phytoplankton Manual; UNESCO: Paris, France, 1978; pp. 1–5. [Google Scholar]
  88. Banzon, V.; Smith, T.M.; Chin, T.M.; Liu, C.; Hankins, W. A long-term record of blended satellite and in situ sea-surface temperature for climate monitoring, modeling and environmental studies. Earth Syst. Sci. Data 2016, 8, 165–176. [Google Scholar] [CrossRef]
  89. Pletterbauer, F.; Melcher, A.; Graf, W. Climate Change Impacts in Riverine Ecosystems. In Riverine Ecosystem Management. Aquatic Ecology Series Volume 8; Schmutz, S., Sendzimir, J., Eds.; Springer: Cham, Switzerland, 2018; pp. 1–571. [Google Scholar] [CrossRef]
  90. Avsar, N.B.; Jin, S.; Kutoglu, S.H. Interannual Variations of Sea Surface Temperature in the Black Sea. In Proceedings of the IGARSS 2018—2018 IEEE International Geoscience and Remote Sensing Symposium, Valencia, Spain, 22–27 July 2018; pp. 5617–5620. [Google Scholar] [CrossRef]
  91. Shtereva, G.; Velikova, V.; Doncheva, V. Human impact on marine water nutrients enrichment. J. Environ. Prot. Ecol. 2015, 16, 40–48. [Google Scholar]
  92. Stelmakh, L.; Kovrigina, N.; Gorbunova, T. Phytoplankton Seasonal Dynamics under Conditions of Climate Change and Anthropogenic Pollution in the Western Coastal Waters of the Black Sea (Sevastopol Region). J. Mar. Sci. Eng. 2023, 11, 569. [Google Scholar] [CrossRef]
  93. Maranon, E.; Cermeno, P.; Latasa, M.; Tadonleke, R.D. Temperature, resources, and phytoplankton size structure in the ocean. Limnol. Oceanogr. 2012, 57, 1266–1278. [Google Scholar] [CrossRef]
  94. Marinov, I.; Doney, S.C.; Lima, I.D. Response of ocean phytoplankton community structure to climate change over the 21st century: Partitioning the effects of nutrients, temperature and light. Biogeosciences 2010, 7, 3941–3959. [Google Scholar] [CrossRef]
  95. Moncheva, S.; Slabakova, V.; Doncheva, V. Dominant habitat types in the water column—Phytoplankton. In Initial Assessment of the State of the Marine Environment, According to Article 8 of the WFD and the NOEMS; Publication of Institute of Oceanology: Varna, Bulgaria, 2013; pp. 1–487. (In Bulgarian) [Google Scholar]
  96. Kroiss, H.; Zessner, M.; Lampert, C. Nutrient Management in the Danube Basin and Its Impact on the Black Sea, daNUbs; Final Report EVK1-CT-2000-00051, Project Duration: 01.02.2001–31.1.2005; Vienna University of Technology: Viena, Austria, 2005; pp. 1–69. Available online: https://cordis.europa.eu/project/id/EVK1-CT-2000-00051 (accessed on 14 September 2007).
  97. Klisarova, D.; Gerdzhikov, D.; Kostadinova, G.; Petkov, G. Investigation of phytoplankton in the Varna bay (2005–2014). In Proceedings of the Twelfth International Conference on the Mediterranean Coastal Environment MEDCOAST, Varna, Bulgaria, 6–10 October 2015; Özhan, E., Ed.; pp. 299–308. [Google Scholar]
  98. Moncheva, S. Phytoplankton Shifts in the Black Sea-Driving Forces and Possible Implication for Reference Conditions. In Proceedings of the Joint Workshop on Streamlining the Process of Producing Regional Assessments on Eutrophication for Pan-European Purposes. EC JRC-BSCOM-HELCOM, Istanbul, Turkey, 26–28 October 2005. [Google Scholar]
  99. Anderson, S.I.; Franze, G.; Kling, J.D.; Wilburn, P.; Kremer, C.T.; Menden-Deuer, S.; Litchman, E.; Hutchins, D.A.; Rynearson, T.A. The interactive effects of temperature and nutrients on a spring phytoplankton community. Limnol. Oceanogr. 2022, 67, 634–645. [Google Scholar] [CrossRef]
  100. Brandenburg, K.M.; Velthuis, M.; Van de Waal, D.B. Meta-analysis reveals enhanced growth of marine harmful algae from temperate regions with warming and elevated CO2 levels. Glob. Chang. Biol. 2019, 25, 2607–2618. [Google Scholar] [CrossRef] [PubMed]
  101. Ray, S.; Berec, L.; Straskraba, M.; Jørgensen, S.E. Optimization of exergy and implications of body sizes of phytoplankton and zooplankton in an aquatic ecosystem model. Ecol. Model. 2001, 140, 219–234. [Google Scholar] [CrossRef]
  102. Gittings, J.A.; Raitsos, D.E.; Brewin, R.J.W.; Hoteit, I. Links between Phenology of Large Phytoplankton and Fisheries in the Northern and Central Red Sea. Remote Sens. 2021, 13, 231. [Google Scholar] [CrossRef]
Figure 1. Map of sampling station locations (Legend: hydrobiological stations: Varna Bay (B), (B-1, B-2, B-3, B-4, B-5, B-6, B-7, B-9, B-10); Cape Galata—(G), (G-1); Asparuhovo beach, Breakwater, South beach, Officer’s beach, Pochivka beach, Point 1, 2, 3) (sources: https://www.boell.de/en/2020/01/21/cooperation-between-european-small-navies-black-sea-potential-alternative-naval, accessed on 20 February 2023 and Google Maps).
Water 15 01677 g001
Figure 2. Long-term yearly trend of the average phytoplankton abundance (×106 cells·m−3) and biomass (mg·m−3) for May–August 1992–2019 in the surface layer of Varna Bay.
Water 15 01677 g002
Figure 3. Trends of abundance and biomass of nano- and micro-phytoplankton in the surface layer of Varna Bay, 1992–2019; (a) abundance of nano-phytoplankton (×106 cells·m−3); (b) biomass of nano-phytoplankton (mg·m−3); (c) abundance of micro-phytoplankton (×106 cells·m−3); (d) biomass of micro-phytoplankton (mg·m−3).
Water 15 01677 g003
Figure 4. Long-term year variabilities and trend of average SST for the period May–August 1992–2019 in the Varna Bay region.
Water 15 01677 g004
Figure 5. Long-term year variabilities and trend of average total phosphorus for the period May–August 1992–2019 in Varna Bay.
Water 15 01677 g005
Figure 6. Long-term year variabilities and trend of average dissolved inorganic nitrates for the period May–August 1992–2019 in Varna Bay.
Water 15 01677 g006
Figure 7. Dynamics of the abundance (×106 cells·m−3) (a) and the biomass (mg·m−3) (b) of the groups Dinophyceae, Bacillariophyceae, and Other during the studied period.
Water 15 01677 g007
Table 1. Bivariate correlation between SST and nano- and micro-phytoplankton parameters.
Spearman’s
Coefficient
Nano-PhytoplanktonMicro-Phytoplankton
Abundance
(×106 Cells·m−3)
Biomass
(mg·m−3)
Abundance
(×106 Cells·m−3)
Biomass
(mg·m−3)
SST (May-August)−0.431 *−0.405 *−0.471 *−0.553 *
Note(s): * Correlation is significant at the 0.05 level.
Table 2. Model summary and parameter estimates for the influence of SST on parameters of nano- and micro-phytoplankton.
Regression EquationCoefficient of
Determination
R2
Significance
Nano-phytoplankton (n)
Abundance (×106 cells·m−3)(n) = 50,183.57 − 4511.78 × SST + 101.58 × SST20.5090.0001
Biomass (mg·m−3)(n) = 2331.002 − 153.55 × SST + 2.293 × SST20.1820.081
Micro-phytoplankton (m)
Abundance (×106 cells·m−3)(m) = 14,530.32 − 1301.47 × SST + 29.18 × SST20.5300.0001
Biomass (mg·m−3)(m) = 22,724.72 − 1924.57 × SST + 40.79 × SST20.3320.007
Table 3. Bivariate correlation between SST, TP, DIN and the abundance and biomass of the groups Dinophyceae, Bacillariophyceae, and Other.
Spearman’s CoefficientDinophyceaeBacillariophyceaeOther
Abundance
(×106 Cells·m−3)
Biomass
(mg·m−3)
Abundance
(×106 Cells·m−3)
Biomass
(mg·m−3)
Abundance
(×106 Cells·m−3)
Biomass
(mg·m−3)
SST (May–August)−0.322−0.287−0.563 *−0.682 *−0.282−0.534 *
TP (mg·L−1)0.559 *0.540 *0.600 *0.616 *0.432 *0.637 *
DIN (mg·L−1)0.415 *0.450 *0.2650.3370.0830.154
Note(s): * Correlation is significant at the 0.05 level.
Table 4. Model summary and parameter estimates showing the relationship between SST and abundance and biomass for groups Dinophyceae, Bacillariophyceae, and Other.
Regression StatisticsAbundanceBiomass
Dinophyceae
R20.1250.136
Significance0.1890.161
Regression equationsAD = 6997.026 − 616.024 × SST + 13.61 × SST2BD = 6585.15 − 496.66 × SST + 9.223 × SST2
Bacillariophyceae
R20.4950.356
Significance0.00010.004
Regression equationsAB = 44,305.918 − 3963.06 × SST + 88.72 × SST2BB = 79,85.64 − 520.07 × SST + 7.431 × SST2
Other
R20.0630.514
Significance0.4410.0001
Regression equationsAO = −17,043.57 + 1857.56 × SST − 47.58 × SST2BO = 167,448.308 − 15,137.41 × SST + 342.18 × SST2
Table 5. Model summary and parameter estimates showing the relation between TP (mg·L−1) and abundance and biomass for groups Dinophyceae, Bacillariophyceae, and Other.
Regression StatisticsAbundanceBiomass
Dinophyceae
R20.130.293
Significance0.1750.103
Regression equationsAD = −14.704 + 3075.81 × TP − 14,605.36 × TP2BD = 41.85 + 4528.87 × TP − 6260.64 × TP2
Bacillariophyceae
R20.3950.387
Significance0.0020.002
Regression equationsAB = −56.12 + 8830.05 × TP − 28,102.21 × TP2BB = 91.63 + 4848.21 × TP − 614.57 × TP2
Other
R20.1680.413
Significance0.1010.001
Regression equationsAO = 359.17 + 21,831.08 × TP − 94,401.01 × TP2BO = −588.40 + 42376.15 × TP − 185,415.56 × TP2
Table 6. Model summary and parameter estimates showing the relation between DIN (mg·L−1) and Abundance and Biomass for groups Dinophyceae, Bacillariophyceae, and Other.
Regression StatisticsAbundanceBiomass
Dinophyceae
R20.2370.408
Significance0.0340.001
Regression equationsAD = 5.28 + 1014.33 × DIN − 1551.36 × DIN2BD = 52.26 − 1424.08 × DIN + 7095.5 × DIN2
Bacillariophyceae
R20.0520.133
Significance0.5120.168
Regression equationsAB = 230.37 − 2807.4 × DIN + 17,931.8 × DIN2BB = 184.98 − 211.59 × DIN + 9292.15 × DIN2
Other groups
R20.0570.100
Significance0.4820.269
Regression equationsAO = 960.06 − 6104.9 × DIN + 43,687.8 × DIN2BO = 718.71 − 13,704.5 × DIN + 79,298.7 × DIN2
Disclaimer/Publisher’s Note: The statements, opinions and data contained in all publications are solely those of the individual author(s) and contributor(s) and not of MDPI and/or the editor(s). MDPI and/or the editor(s) disclaim responsibility for any injury to people or property resulting from any ideas, methods, instructions or products referred to in the content.

