
Quantitative Analysis of Rapid Siltation and Erosion Caused Coastline Evolution in the Coastal Mudflat Areas of Jiangsu

1
School of Geographical Sciences, Nanjing University of Information Science & Technology, Nanjing 210044, China
2
Department of Civil and Architectural Engineering, University of Wyoming, Laramie, WY 82071, USA
*
Author to whom correspondence should be addressed.
Water 2023, 15(9), 1679; https://doi.org/10.3390/w15091679
Submission received: 23 March 2023
/
Revised: 14 April 2023
/
Accepted: 21 April 2023
/
Published: 26 April 2023
(This article belongs to the Section Water Erosion and Sediment Transport)
Abstract
:Muddy coast due to natural and human-induced factors can be variable over a wide range of different spatiotemporal scales. Our limited capability to understand and especially predict this variability can lead to misinterpretation of muddy coastal change information, which hampers informed decision-making and subsequent design and implementation of engineering interventions. Therefore, the research on the evolution of the historical coastline is particularly important. In this study, annual mean coastlines and causes for the variability and possible evolutions are analyzed in a manner that avoids these effects by averaging the instantaneous coastline positions registered during the same year. A set of coastlines is obtained from Landsat MSS/TM/OLI series of remote sensing images taken between 1985 and 2020 in the Google Earth Engine at Jiangsu muddy coast of China Yellow Sea. The coastline is extracted based on the water body index and the Otsu method, and is classified by fractal dimension, annual rate of change, area calculation, center of gravity shift, and artificial index to calculate the temporal and spatial changes in the coastline. The results showed that most of the coastline advanced seaward due to rapid siltation and coastal development in the past 35 years with only a small portion receding landward. The entire coast experienced segmental changes and different evolutionary characteristics and the coastline shifted from rapid erosion to siltation. The silted banks were mainly distributed in the middle section of the coastline in the radial sandbank. The annual change rate in the coast section was 82.21 m/a and the average annual area increased by 18.07 km2. The artificial coastline increased substantially, while the natural coastline gradually decreased due to rapid erosion. From 1985 to 2020, the proportion of artificial coastline in Jiangsu rose from 14% to 77%. The coastline became more curved and the center of gravity of the coastline moved 5.13 km to the northwest by 61°. Before 2000, the driving force affecting the coastline variability was mainly rapid siltation, while the impact of rapid erosion and human activities gradually increased after 2000 with the natural coastline being continuously cut and straightened. Overall, Jiangsu’s muddy coast was the site with the highest anthropogenic pressure and highest vulnerability. However, it is difficult to generalize the results under other conditions, especially on decadal time scales. Scientific and engineering improvements still require more quantitative insight into the physical mechanisms behind the natural and forced shore behavior responsible for the variability to better explain the change process of the coastline and provide a basis for coastal management and sustainable development.
1. Introduction
Knowledge on factors involved in the long-term (multi-decadal to short-term) evolution of coastlines is important in terms of fundamental science and coastal management, especially with rapid siltation and erosion associated with climate change. Coastline change is a representation of the evolution of coastal mudflat areas resources and environmental ecosystems, land–sea interactions, and is also an integral reflection of human activities and modification of the natural environment, as well as a sensitive indicator of adaptation and response to climate change [1,2]. Because the exact causes of coastal evolution vary from place to place depending on local oceanographic/climatic conditions, it is necessary to study the individual or combination of factors which control the coastline configuration. Using long-term hydrological and climatological data, many studies illustrated that river sediment load is a major controlling factor for coastline changes [3]. Some studies showed that apart from reduction in river sediment discharge, anthropogenic activities such as land developing, barrage construction and harbor development are major factors responsible for coastline variations [4,5]. These results showed that after construction of breakwaters, significant morphological changes occurred [6]. However, these shifted coastal areas are often difficult to quantify using changes in the coastline because there are too many short-term variations related with water level variation, run-up dimensions, and seasonal beach profile variations [1].
Muddy coastal changes due to rapid siltation or erosion and anthropogenic activities have been studied by using various techniques such as remote sensing, beach profile analysis, and GPS surveys. Remotely sensed data products such as satellite images and aerial photographs have been widely used for coastline change studies due to their wide coverage, low cost, and high accuracy [7,8]. Remote sensing technology has the advantages of rapid, comprehensive, integrated, and dynamic monitoring over on-site trace measurements [9,10] and is more commonly used to extract the coastline. However, the traditional method of downloading remote sensing data is slow for large areas and long-term spatiotemporal analysis. In recent years, the emergence of remote sensing cloud platforms and the advent of deep learning, online processing, and convenient access to various databases have offered significant advantages [11,12,13], especially in tide-prone areas where remote sensing cloud platforms can easily retrieve all data in different timeframes in monitoring long-term coastline changes. To support coastal and estuarine management, Google Earth Engine (GEE) provides different datasets and interfaces that can be used to access and process vast amount of information [14], which has been used to map water resources, human activities, land cover, and beaches, among others. A new algorithm for waterlines was also developed [15,16]. Therefore, the obtained long-term coastlines better reflect the advancing and retreating processes of coastline evolution [17,18,19,20]. In previous studies, a large number of scholars used a variety of remote sensing [21,22] or actual measurement [23] methods to examine coastlines with heavy focus on coastline extraction and its evolution. Very few studies, however, investigated the drivers of coastline evolution, especially the impact of rapid siltation or erosion and anthropogenic activities.
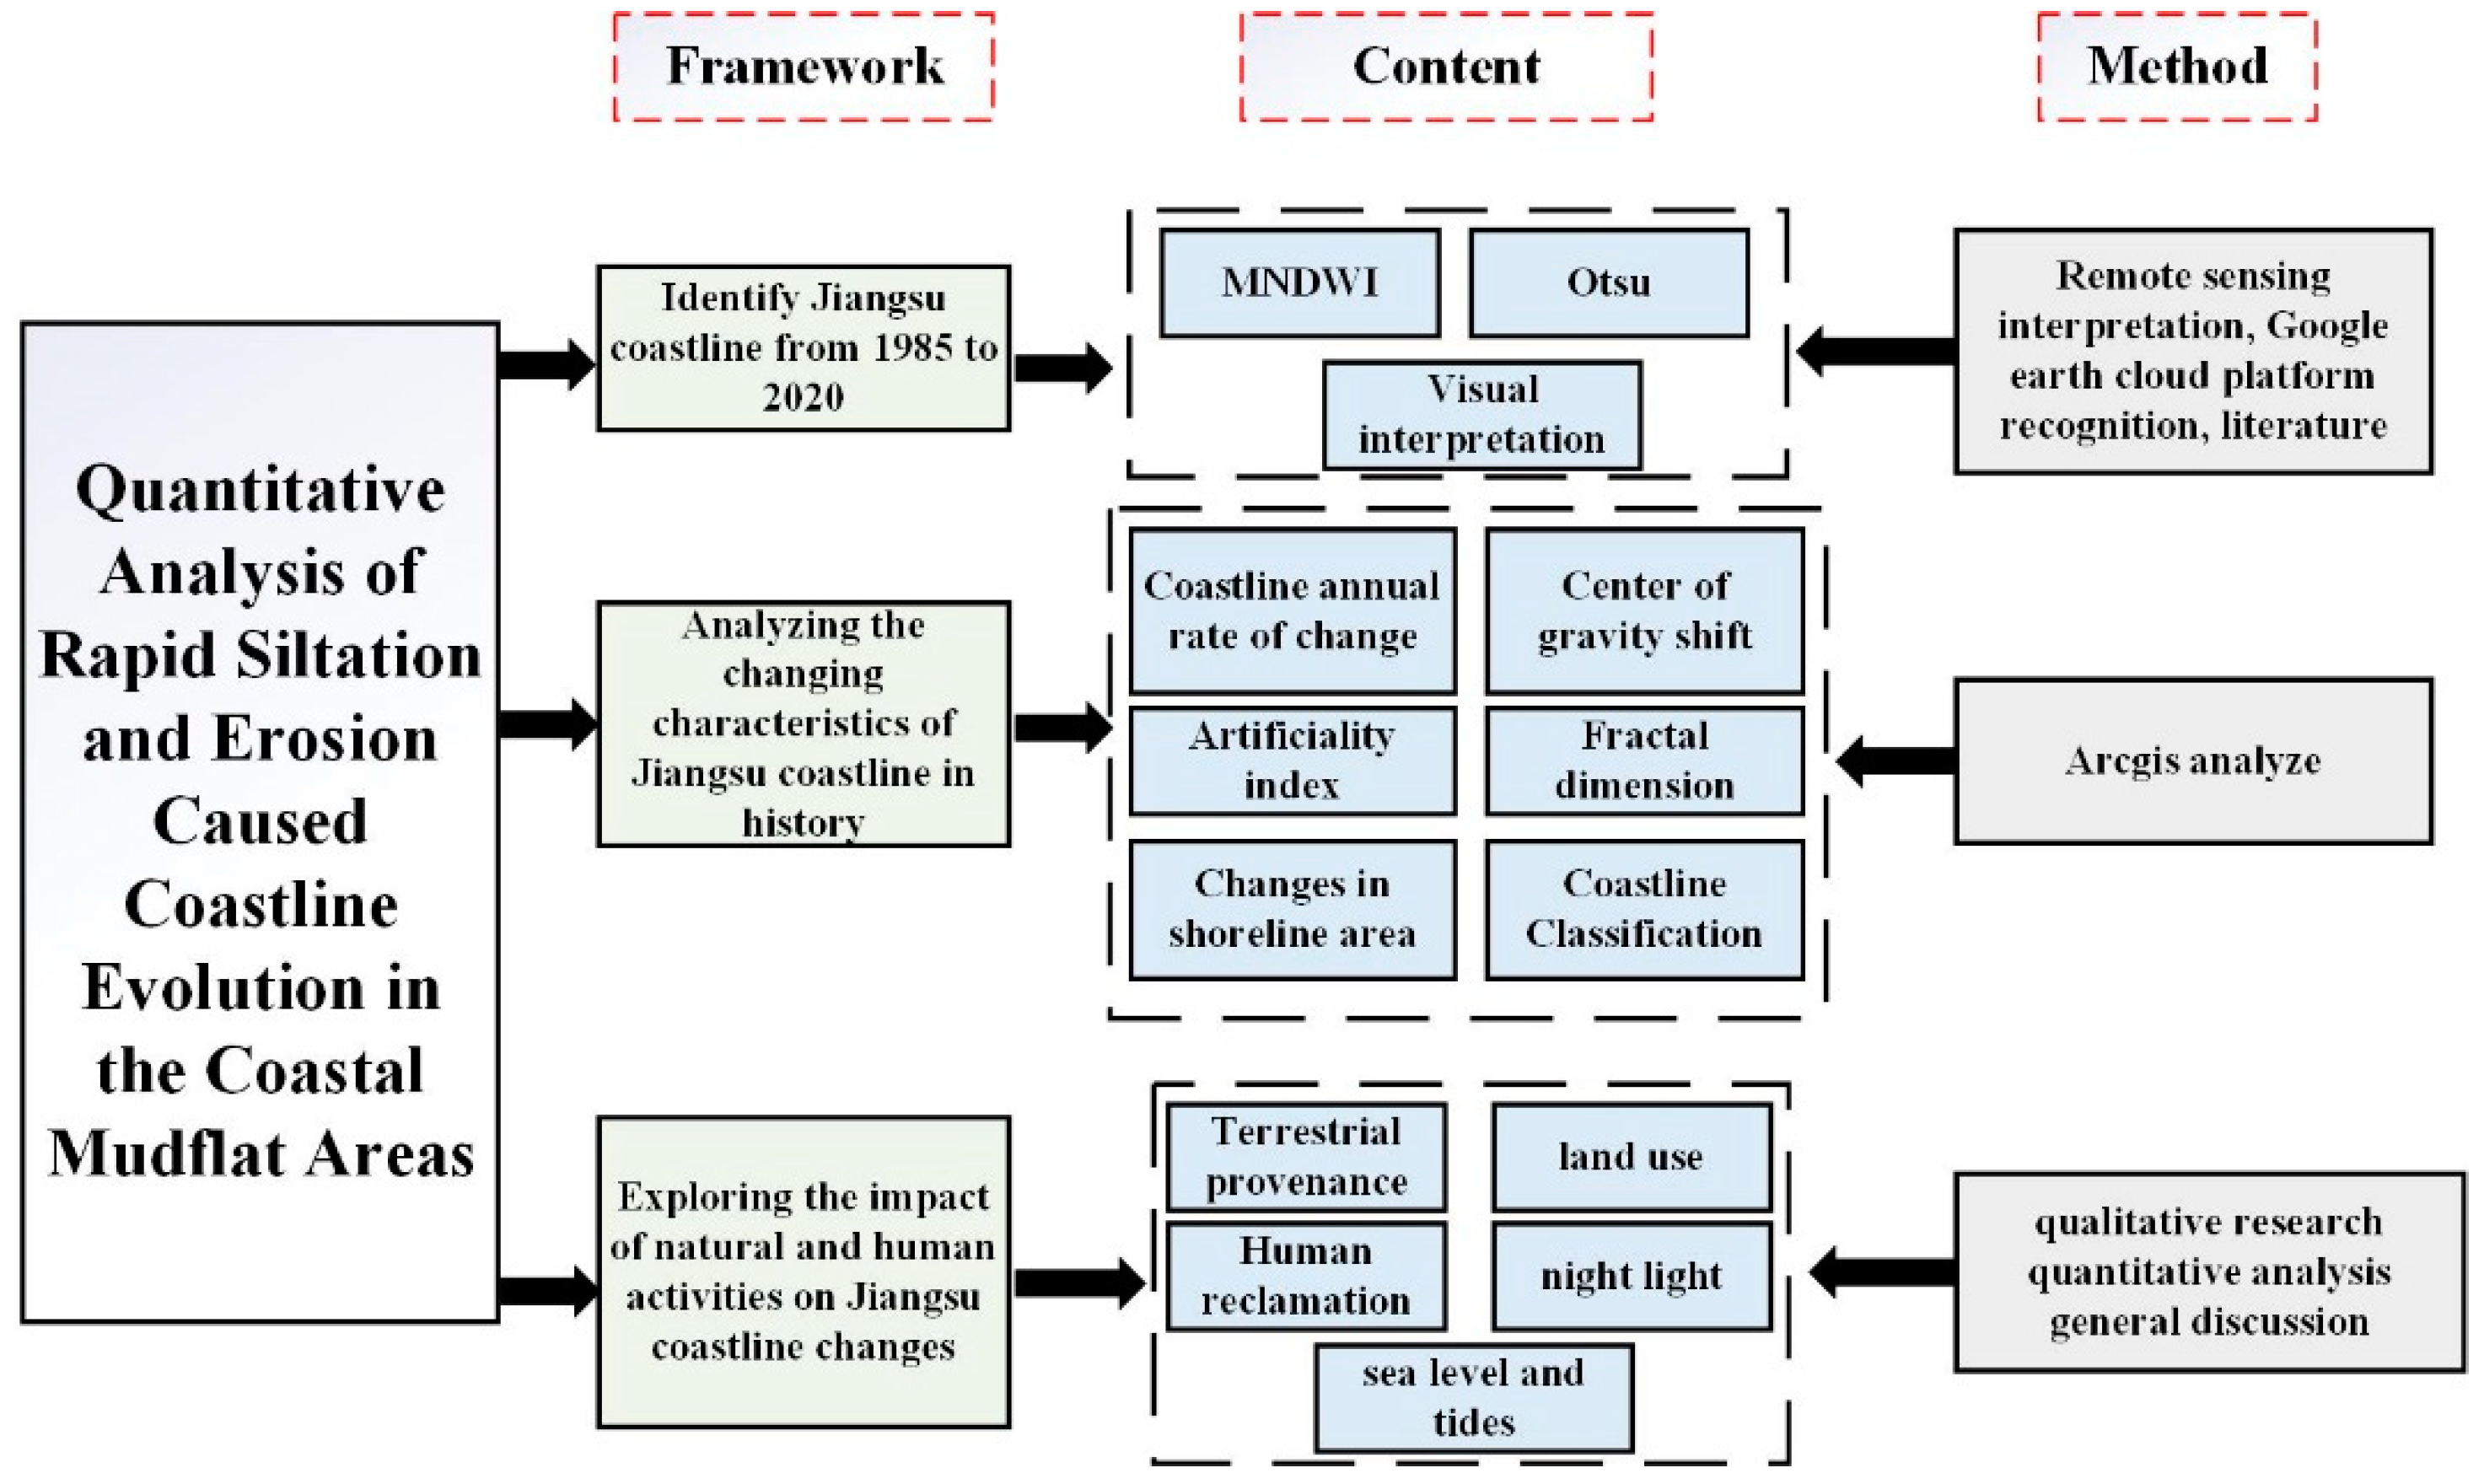
The muddy coastline evolution in Jiangsu coast is complex due to the supply of massive fine-grained sediment from the abandoned Yellow River during 1128 AD–1855 AD [24,25]. Historically, the Jiangsu coast has been a dynamic lowland with a long-term coastline advancement since the 12–13th centuries, which formed the thick and complex mudflats, with a total area of 5090.4 km2, accounting for around 25% of China’s total of tidal flat area [26]. The maximum tidal difference is more than 6 m and the average tidal difference between the north and south is more than 3 m, while the muddy coastline is particularly influenced by the tides [27]. Powdery mudflats and water have similar spectral reflectance values due to rapid siltation or erosion processes [28,29]. Knowledge of this influence is important for understanding the source-to-sink system of marginal seas in the context of human activities and providing a scientific basis for identifying sustainable development models in coastal areas in response to human-induced system regime shifts. This study focuses on three objectives (Figure 1) to quantitatively analyze the rapid siltation and erosion-induced coastline evolution in the coastal mudflat areas at multi-decadal scales by using Landsat series of satellite images combined with different spectral indices to extract coastlines based on the GEE. The precise extraction of coastlines for different coastline types is carried out from multiple perspectives such as annual rate of coastline variation, area change, fractal dimension, artificialization index, and transfer of gravity center. The set of coastline databases was established from 1985 to 2020, and the spatiotemporal variations of coastline change for the past 35 years were investigated on Jiangsu coast in China Yellow Sea using sediment river data, sea level data, and nighttime light and land use data. An assessment of was made for identifying causes and factors influencing the coastline evolution through geodetector. The analysis of the evolution of the coastline by a single influencing factor was previously conducted [30,31]. The multiple factors highlighted by this work would provide a basis for the long-term monitoring of coastline change patterns, the role of pioneer fluid mud on the dynamics of mudflats and a more improved understanding of land–sea processes.
2. Data and Methods
2.1. Study Area
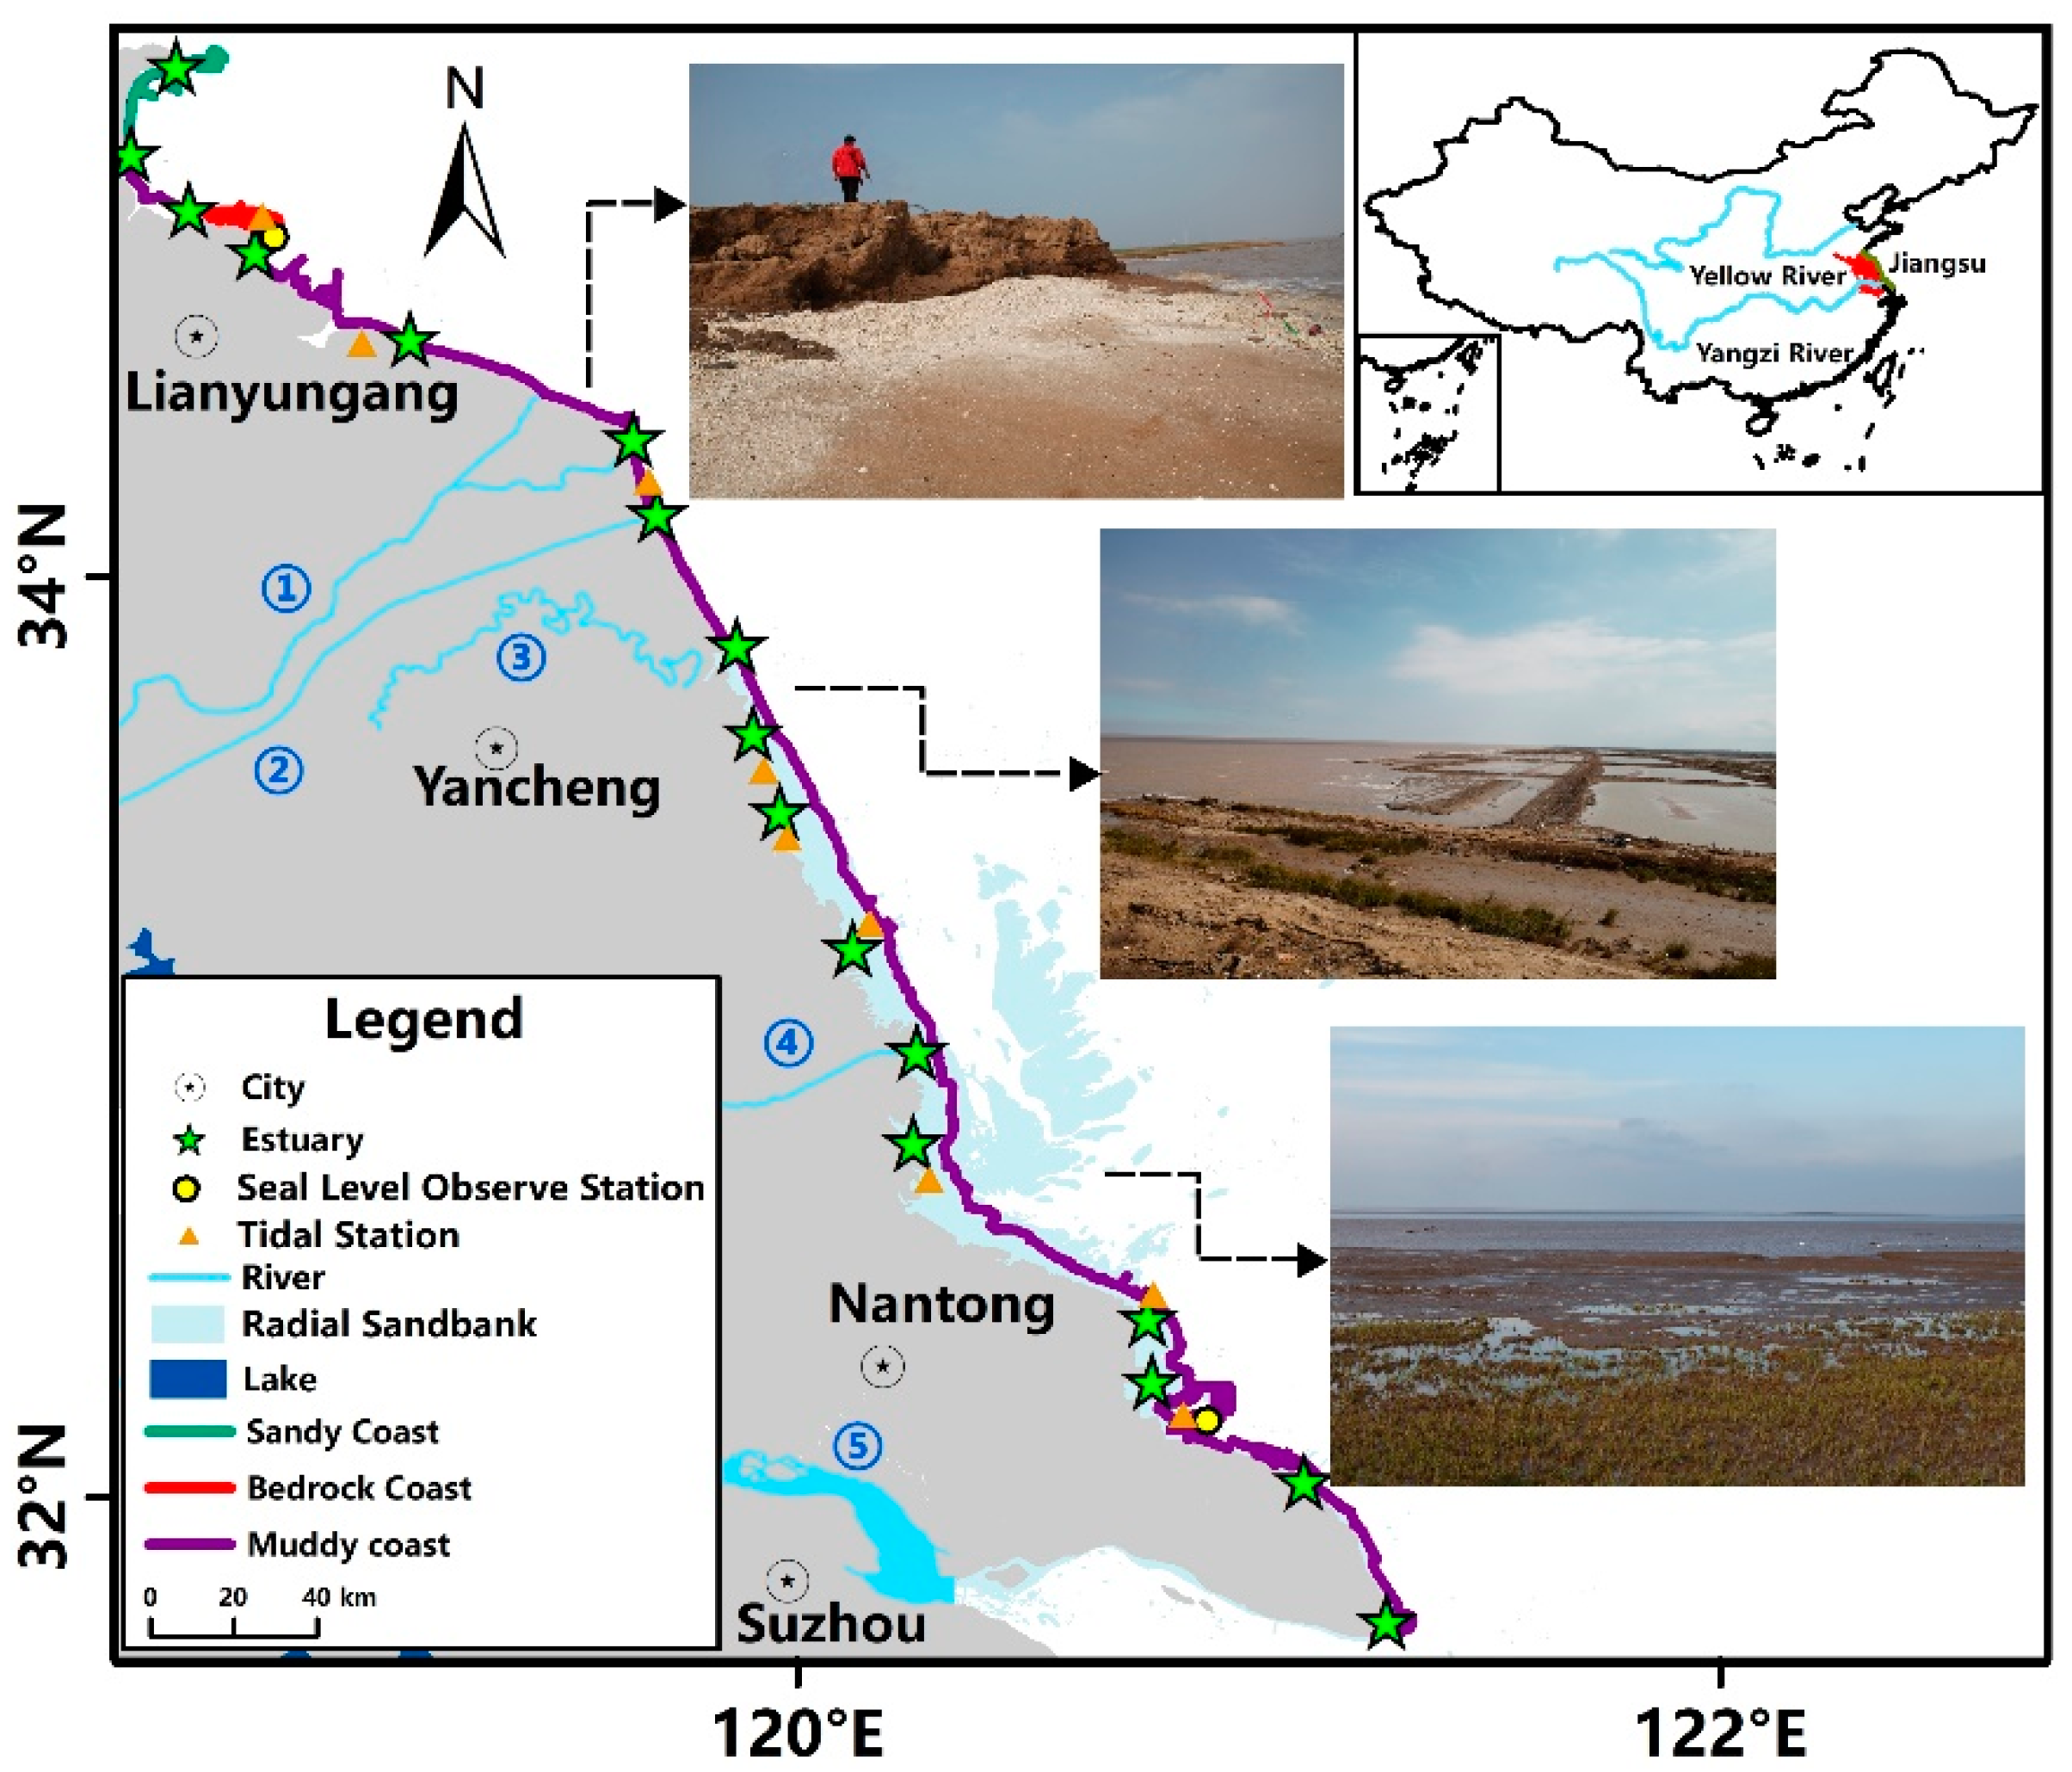
The Jiangsu coast is generally divided into muddy, sandy and bedrock coasts (Figure 2), with muddy coast accounting for over 90% of the Jiangsu coast [32]. It is also a typical area for studying muddy coasts since it is the only muddy coast in the country. The coastal areas of Jiangsu are mainly flat, and mountains are mostly located in Lianyungang city. Yancheng and Nantong cities are mostly plains, and there are radial sandbanks outside the Sheyang–Lianxing estuary. They are large in scale and have radial underwater sand ridges. The terrain is high in the south and low in the north, and material is coarse in the south and fine in the north with Doulong estuary being the boundary. The sediments in the Fangtang–Lianxing estuary are mainly fine sand and silt while those in the Xiuzhen–Fangtang estuary are fine-grained materials. The thickness of the sediment increases gradually from north to south and reaches the peak along the coast of the Biandan–Fangtang estuary at about 300–400 m, and further south the thickness of the Fangtang–Lianxing estuary is over 100 m [33]. Lianyungang is a sandy and bedrock coast and muddy coast is situated the Yancheng and Nantong. The annual average temperature increases from 13–14 °C in the north to 14–15 °C in the south of the Subei General Irrigation Canal. The Yellow River emptied into the Yellow Sea via the abandoned Yellow River mouth in Jiangsu coast for more than 700 years from 1128 to 1855. Massive amount of fine-grained sediment from the abandoned Yellow River course had accumulated in the delta and provided rich materials ready for resuspension under strong tidal currents [25,26,27,28,29,30,31,32,33,34,35]. The Yellow Sea is influenced strongly by semi-diurnal and meso-tidal currents, and the mean tidal range is 3.68 m. The tidal ranges are from 1.45 m to 9.68 m with the maximum amplitudes in the Beikan estuary [34,36]. The large tidal ranges and strong tidal currents along the Jiangsu muddy coast produce a complex and dynamic hydraulic regime in terms of sediment erosion and siltation, especially in the offshore areas [34,37,38].
2.2. Data Sources
The main data sources for identification the Jiangsu coastline and coastal levees are the Landsat MSS/TM/OLI series of remote sensing images taken between 1985 and 2020 in the GEE. Coastline accuracy verification was performed using a coastline dataset from Google earth and field monitoring in 2015 (http://www.geodoi.ac.cn/WebCn, accessed on 5 April 2022). Jiangsu Ocean University provided profile elevation data, seawater intrusion data and tidal flat wetland data in 2020. River sediment data in 2002–2020 (http://www.mwr.gov.cn, accessed on 20 April 2022), mean sea level data in 2002–2020 (http://gi.mnr.gov.cn, accessed on 12 October 2022) and tide data in 2020 (https://www.nmdis.org.cn/, accessed on 5 June 2022) were obtained. In addition, a 1993–2020 land use database developed by RESDC (https://earthexplorer.usgs.gov, accessed on 18 July 2022), wetland data in 2020 provided by Jiangsu Ocean University, and two-night lighting data from DMSP (https://www.ngdc.noaa.gov/eog/dmsp/downloadV4 composites.html, accessed on 15 April 2022) and VIIRS (https://eogdata.mines.edu/products/vnl/#annual_v2, accessed on 15 April 2022) and nighttime lighting calibration data (https://ngdc.noaa.gov/eog/dmsp/download_radcal.html, accessed on 15 April 2022) were obtained to study the impact of human factors on coastline variability. Some historical documents and terrain data were also obtained for coastline analysis.
2.3. Methods
2.3.1. Coastline Extraction Based on GEE and Classification
The coastline was extracted from multi-temporal satellite remote sensing images during the observation period, the average function was used to transform 7 periods of remote sensing images from 1985 to 2020 to obtain the annual map of the study years. Since there were stripes in the Landsat 7 images, we chose Landsat 5 TM images from 1985 to 2010 and Landsat 8 OLI images from 2015 to 2020 to monitor the long-term dynamics of Jiangsu coastline and selected the calibrated top-of-atmosphere reflectance images with less than 10% clouds. The multi-year average “mean ()” function can calculate the average remote sensing image with cloud cover less than 10% in a year and store it on the GEE. Annual averaging of images effectively mitigates the effects of tides through sea level rise and fall [39]. Ultimately, 130 image scenes met the criteria for inclusion in the extracted coastlines and were clipped according to the scope of the study area, after which water bodies and land were distinguished using the MNDWI’s improved normalized water body index. Otsu image threshold segmentation method (Otsu) was implemented on the GEE originally proposed by Clinton [27], which is an automatic and adaptive thresholding method and effective in finding suitable thresholds to address the limitations of manual thresholding in separating water bodies and land [28]. Once the threshold was determined, the image was divided into two different categories, water and land, and the result of segmentation was extracted by ArcGIS for further analysis and visualization studies. The extracted coastlines are then divided into natural and artificial coastlines by visual interpretation.
In previous studies, coastlines were generally divided into two categories: natural coastlines and artificial coastlines according to natural characteristics, morphological structure, development, and utilization [40]. Referring to the coastline classification criteria of secondary classification system, natural coastlines generally include bedrock, sandy, silty, biological, and estuary coastlines. Artificial coastlines generally include coastlines such as salt-raised embankments, port wharf coastlines, construction embankment coastlines, road sea embankments, and river embankments. In this study, based on the description of the image features and secondary classification categories, the coastline remote sensing discriminant signs are established, and the first-level classification of natural and artificial coastlines is carried out for the Jiangsu coastline in the past 35 years.
2.3.2. Calculation of Coastline Fractal Dimension
There are two methods to derive fractal dimension of coastline, namely the gauge method and the grid method. Both methods could be used to calculate the fractal dimension of the coastline. In this paper, the grid method was used to calculate the fractal dimension of the coastline [29]. The basic idea is to use square grids of different lengths that are continuous and overlapped to cover the measured coastline.
When the square grid length r changes, the number of grids N(r) required to cover the entire coastline changes accordingly as follows:
Taking logarithm for both sides of the Equation (1), one obtains
where C is an undetermined constant, D is the fractal dimension of the coastline with value of 1 < D < 2, N(r) is the number of grids, and r is the grid length [41]. A larger value of D indicates a more curved and complex coastline. The spatial resolution of remote sensing image pixels used in this paper was 30 m, so the grid lengths selected in this paper were integer multiples of 30 m of 30, 60, 90, 120, 150, 180, 210 and 240 m, respectively. Using the tool of ArcMap, the grid numbers of the above 8 grid length indicators were counted, and the fractal dimension could be obtained by performing least square regression analysis to fit Equation (2).
2.3.3. Coastline Artificialization Index
The process of coastline transformation into artificial coastline under the influence of human activities is the process of coastline artificialization, and the degree of human activity impact on the coastline can also be described by the coastline artificialization index [42] as follows:
where R denotes the coastline artificialization index, M represents the length of the artificial coastline in the region, and L represents the total length of the coastline in the region. The larger the R value, the higher the degree of artificialization of the coastline.
2.3.4. Center of Gravity Point Shift Model
Center of gravity is an important indicator to describe the spatial characteristics of geographical elements, which can be used to reflect the spatial location change trajectory of geographic elements over time [43]. By calculating the center of gravity of the coastline of Jiangsu at different periods, we can both visualize and quantitatively describe the spatial change in the coastline in the study area.
(1) The equation for the center of gravity is [44]
where and are the longitude and latitude of the center of gravity of the coastline in year t, respectively, is the grid area of the ith discrete coastline in year t, and xi and yi are the latitude and longitude of the ith discrete coastline, respectively. Since the spatial resolution of the remote sensing image was 30 m, we used ArcGIS to convert the Jiangsu coastline into a 30 m raster to calculate the raster area.
(2) The formula for the direction of movement of the center of gravity is [43]
where α is the angle of movement of the center of gravity in year t + n relative to year t (−180° ≤ α ≤ 180°), 0° indicates the east direction, counterclockwise is positive, and clockwise is negative.
(3) The distance d travelled by the center of gravity is calculated as
where C is a constant, which is the coefficient of conversion of spherical coordinates to plane distance, and its value is equal to 111.111 [45].
2.3.5. Annual Coastline Change Rate (EPR)
Using Digital Coastline Analysis System (DSAS) 4.2 [46], the EPR was calculated for different periods, and the annual coastline change rate (EPR) refers to the endpoint rate of the corresponding intersection of the coastline and the cross-section in the adjacent period, calculated as
where is the distance between the intersection of the coastline and the cross section of the adjacent period , .
2.3.6. Night Lighting Processing
To correlate the dynamic changes of Jiangsu coastline with human activities, we adopted the DMSP-OLS and VIIRS nighttime light data as proxies to quantify the intensity of human activities. Although the DMSP-OLS has lower resolution in bloom and saturation effects, the nighttime light data can be used as a proxy for human activities. The data provide different brightness in the form of Digital Number (DN: Light gray value) values. While the DMSP-OLS data were discontinued in 2013, another satellite SNPP-VIIRS started to be operational in 2012, which improved the saturation and lack of correction of the DMSP-OLS satellite. After 2013, we used the VIIRS night light data. The DMSP-OLS nighttime light data provided continuous changes in space at night for all cloud-free composites over the years. To ensure its continuity in processing, we used all DMSP-OLS nighttime light data from 1992–2013 and performed the correction of projection preprocessing for conversion, image cropping and resampling pre-processing, and sensor inter-correction and continuity correction according to [47]. For the VIIRE data, we used the same pre-processing process with continuity correction, inter-fitting and oversaturation correction data. For the nighttime light data, we used the DN value of the data as a proxy for the nighttime lighting intensity based on the nighttime temporal and spatial characteristics of light illumination which indicate the spatial and temporal distribution of human settlements and economic expansion for comparative analysis with coastline change area.
2.3.7. Quantitative Analysis of Geodetector on Influencing Factors
(1) Single Factor Detector
The factor detector mainly explores the dependent variable y space distribution heterogeneity and explains the differentiation of its independent variables x. The influence of various factors on the spatial differentiation of Jiangsu coastline can be quantified by the q value, which is calculated as follows [48]:
In the above formulas, h is the classification or partition of the influencing factors, and N are the number of units in the hth partition and the whole district, respectively, and are, respectively, the variance of the hth partition and the y value of the whole region. SSW and SST are the sum of the variance within the layer and the total variance of the whole area, respectively. The value range of q is [0, 1]. The larger the value of q, the stronger the influence of the impact factor x on the spatial distribution of coastlines, and vice versa.
(2) Interaction Detector
Interaction detectors are used to identify interactions between different influencing factors, probing factor and impact factor . When they act together, the influence on the spatial distribution of the coastline will be strengthened or weakened. The difference in the interaction of different factors mainly reflects the interactions in (1) nonlinear enhancement, (2) single-factor nonlinear enhancement, (3) two-factor enhancement, (4) independent interaction, and (5) nonlinear enhancement.
3. Results and Analysis
3.1. Accuracy Verification of Coastline Extraction
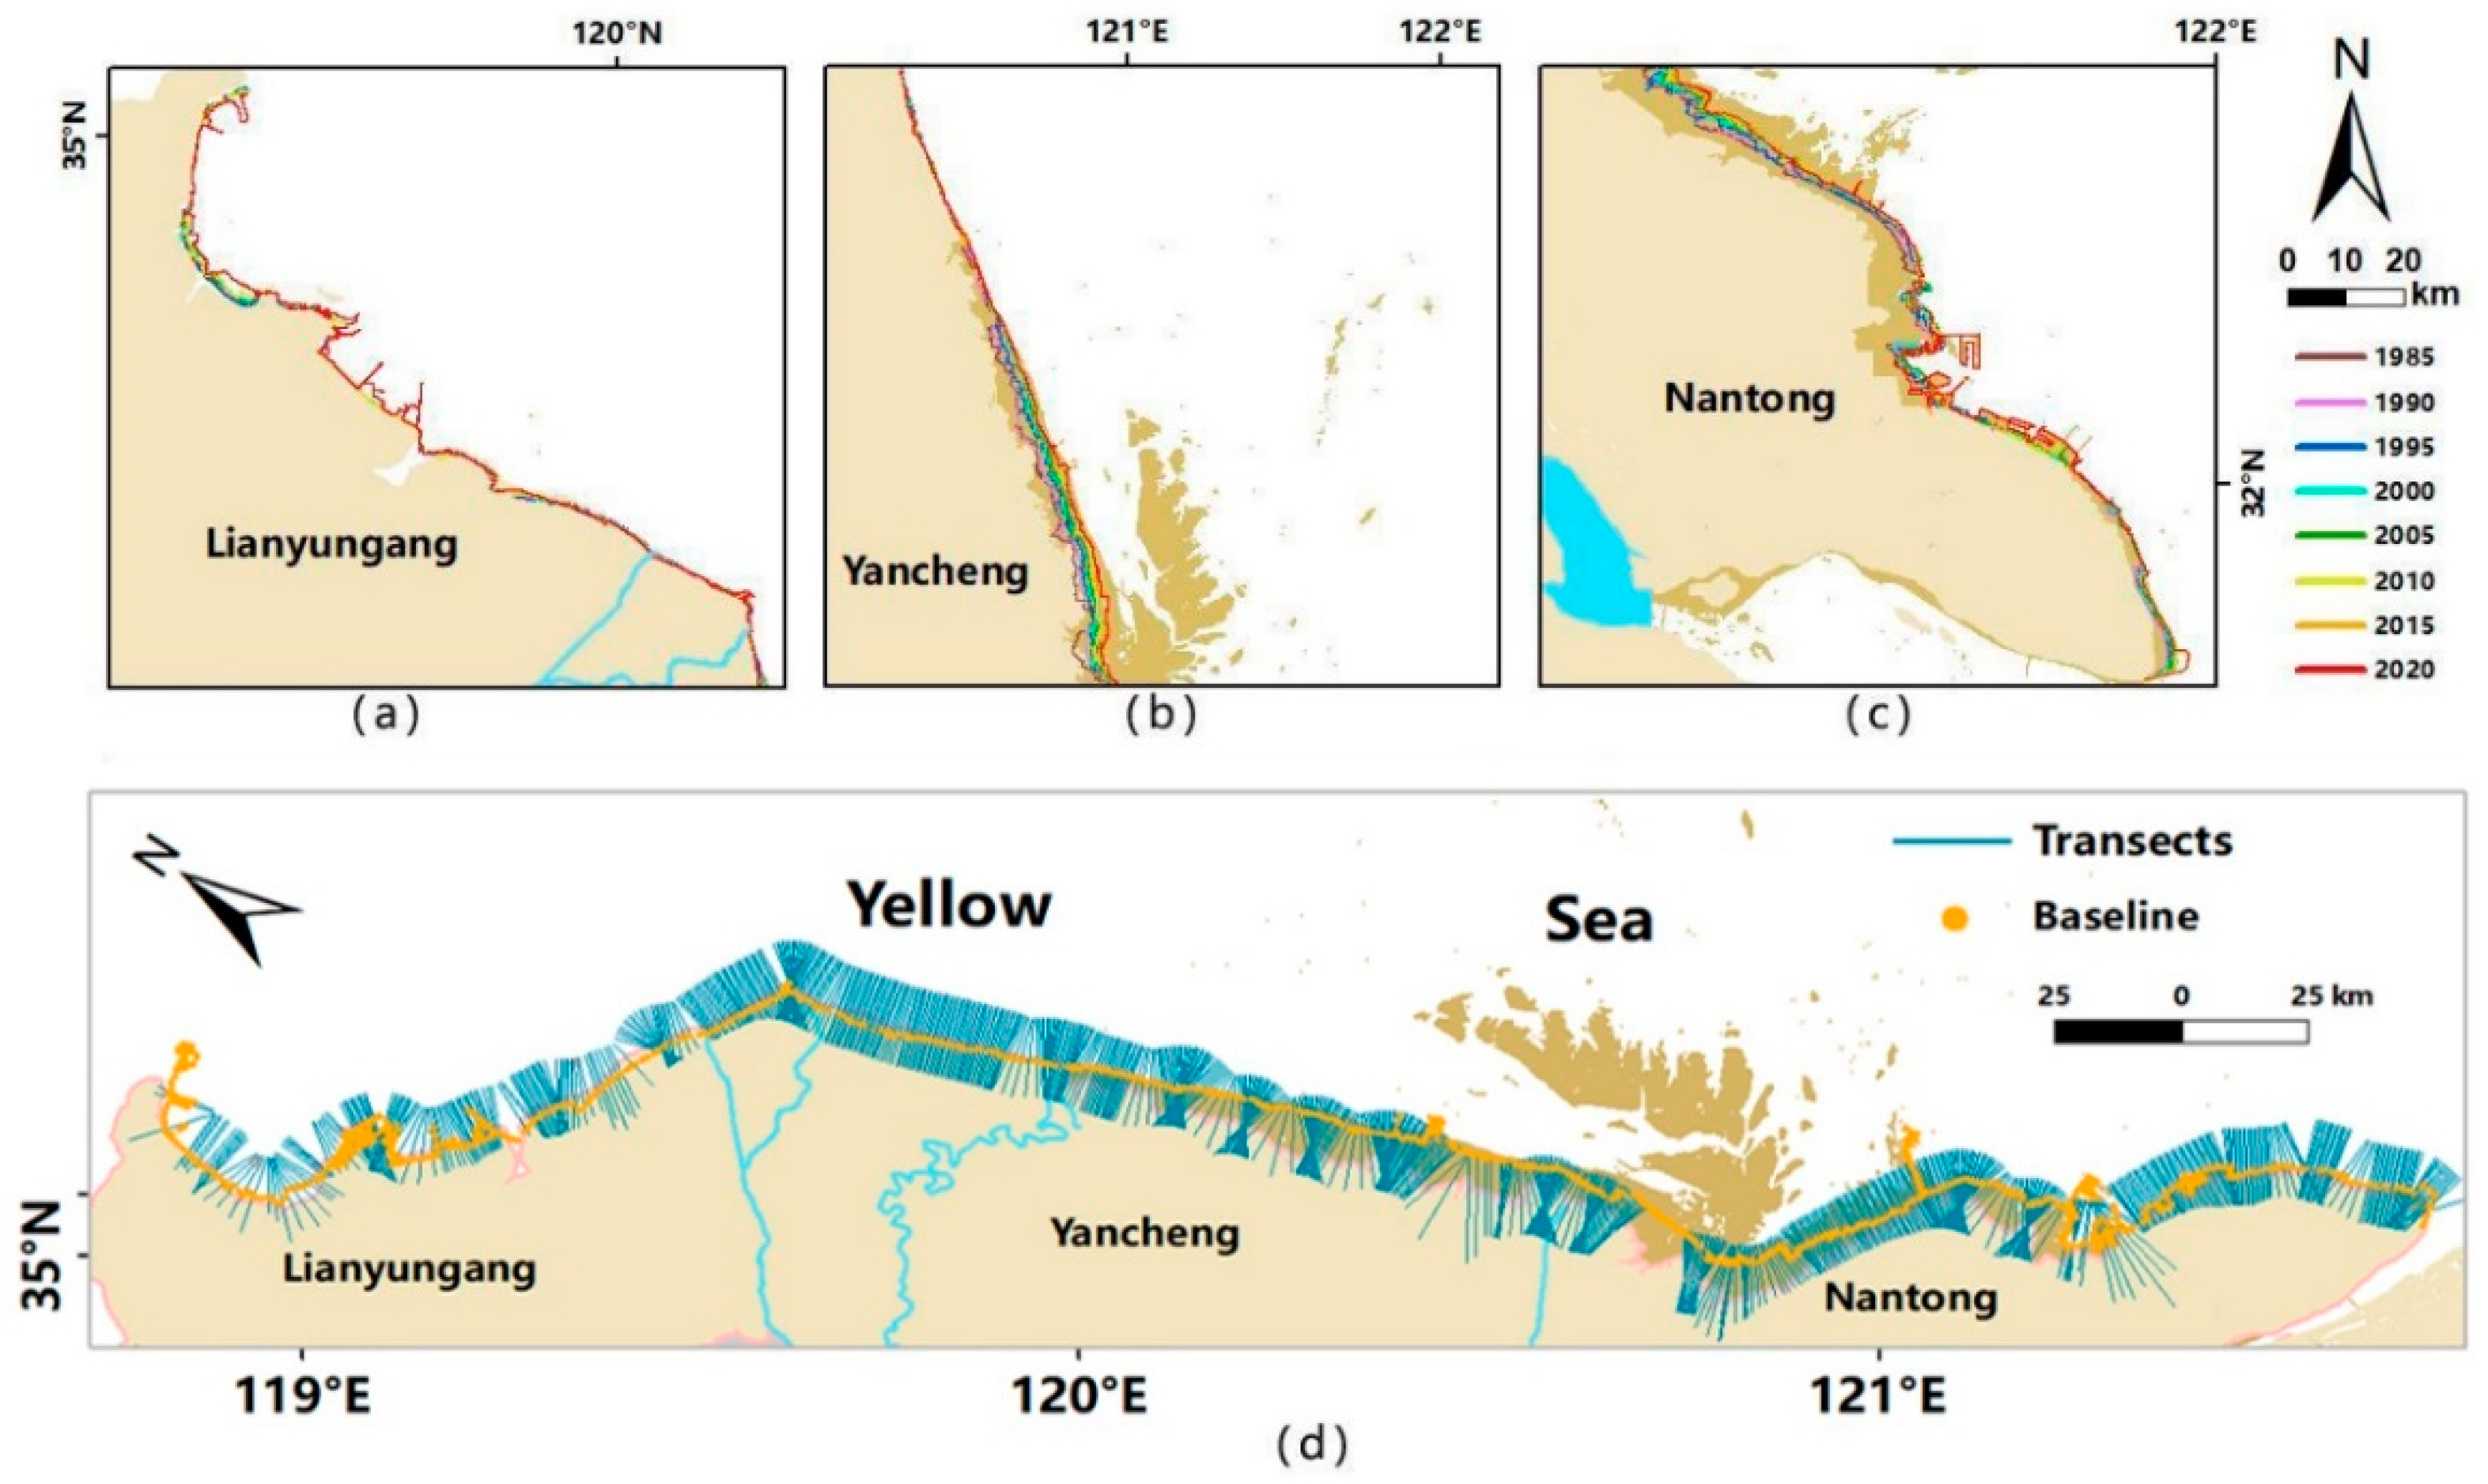
The 2015 data extracted by GEE are compared with the 2015 verification data (Figure 3), which are obtained using the human–computer interaction technology based on Google earth [49]. By using DSAS intersects with the coastline in 2015, a total of 3000 random points is obtained. After removing redundant points, 2500 points are used for verification, and buffers of 30 m, 60 m and 90 m are, respectively, established on the verification coastline area. The results show that the accuracy of the 30 m buffer is 0.80, the accuracy of the 60 m buffer is 0.84, the accuracy of the 90 m buffer is 0.88. Accuracy of Liangduo–Fangtang estuary and Beikan–Tuanjie estuary is poor, with an average error range of 90–150 m. Overall, the coastline extraction results are consistent with those of the verified coastline, meeting the precision requirements for subsequent spatiotemporal analysis.
3.2. Coastline Type
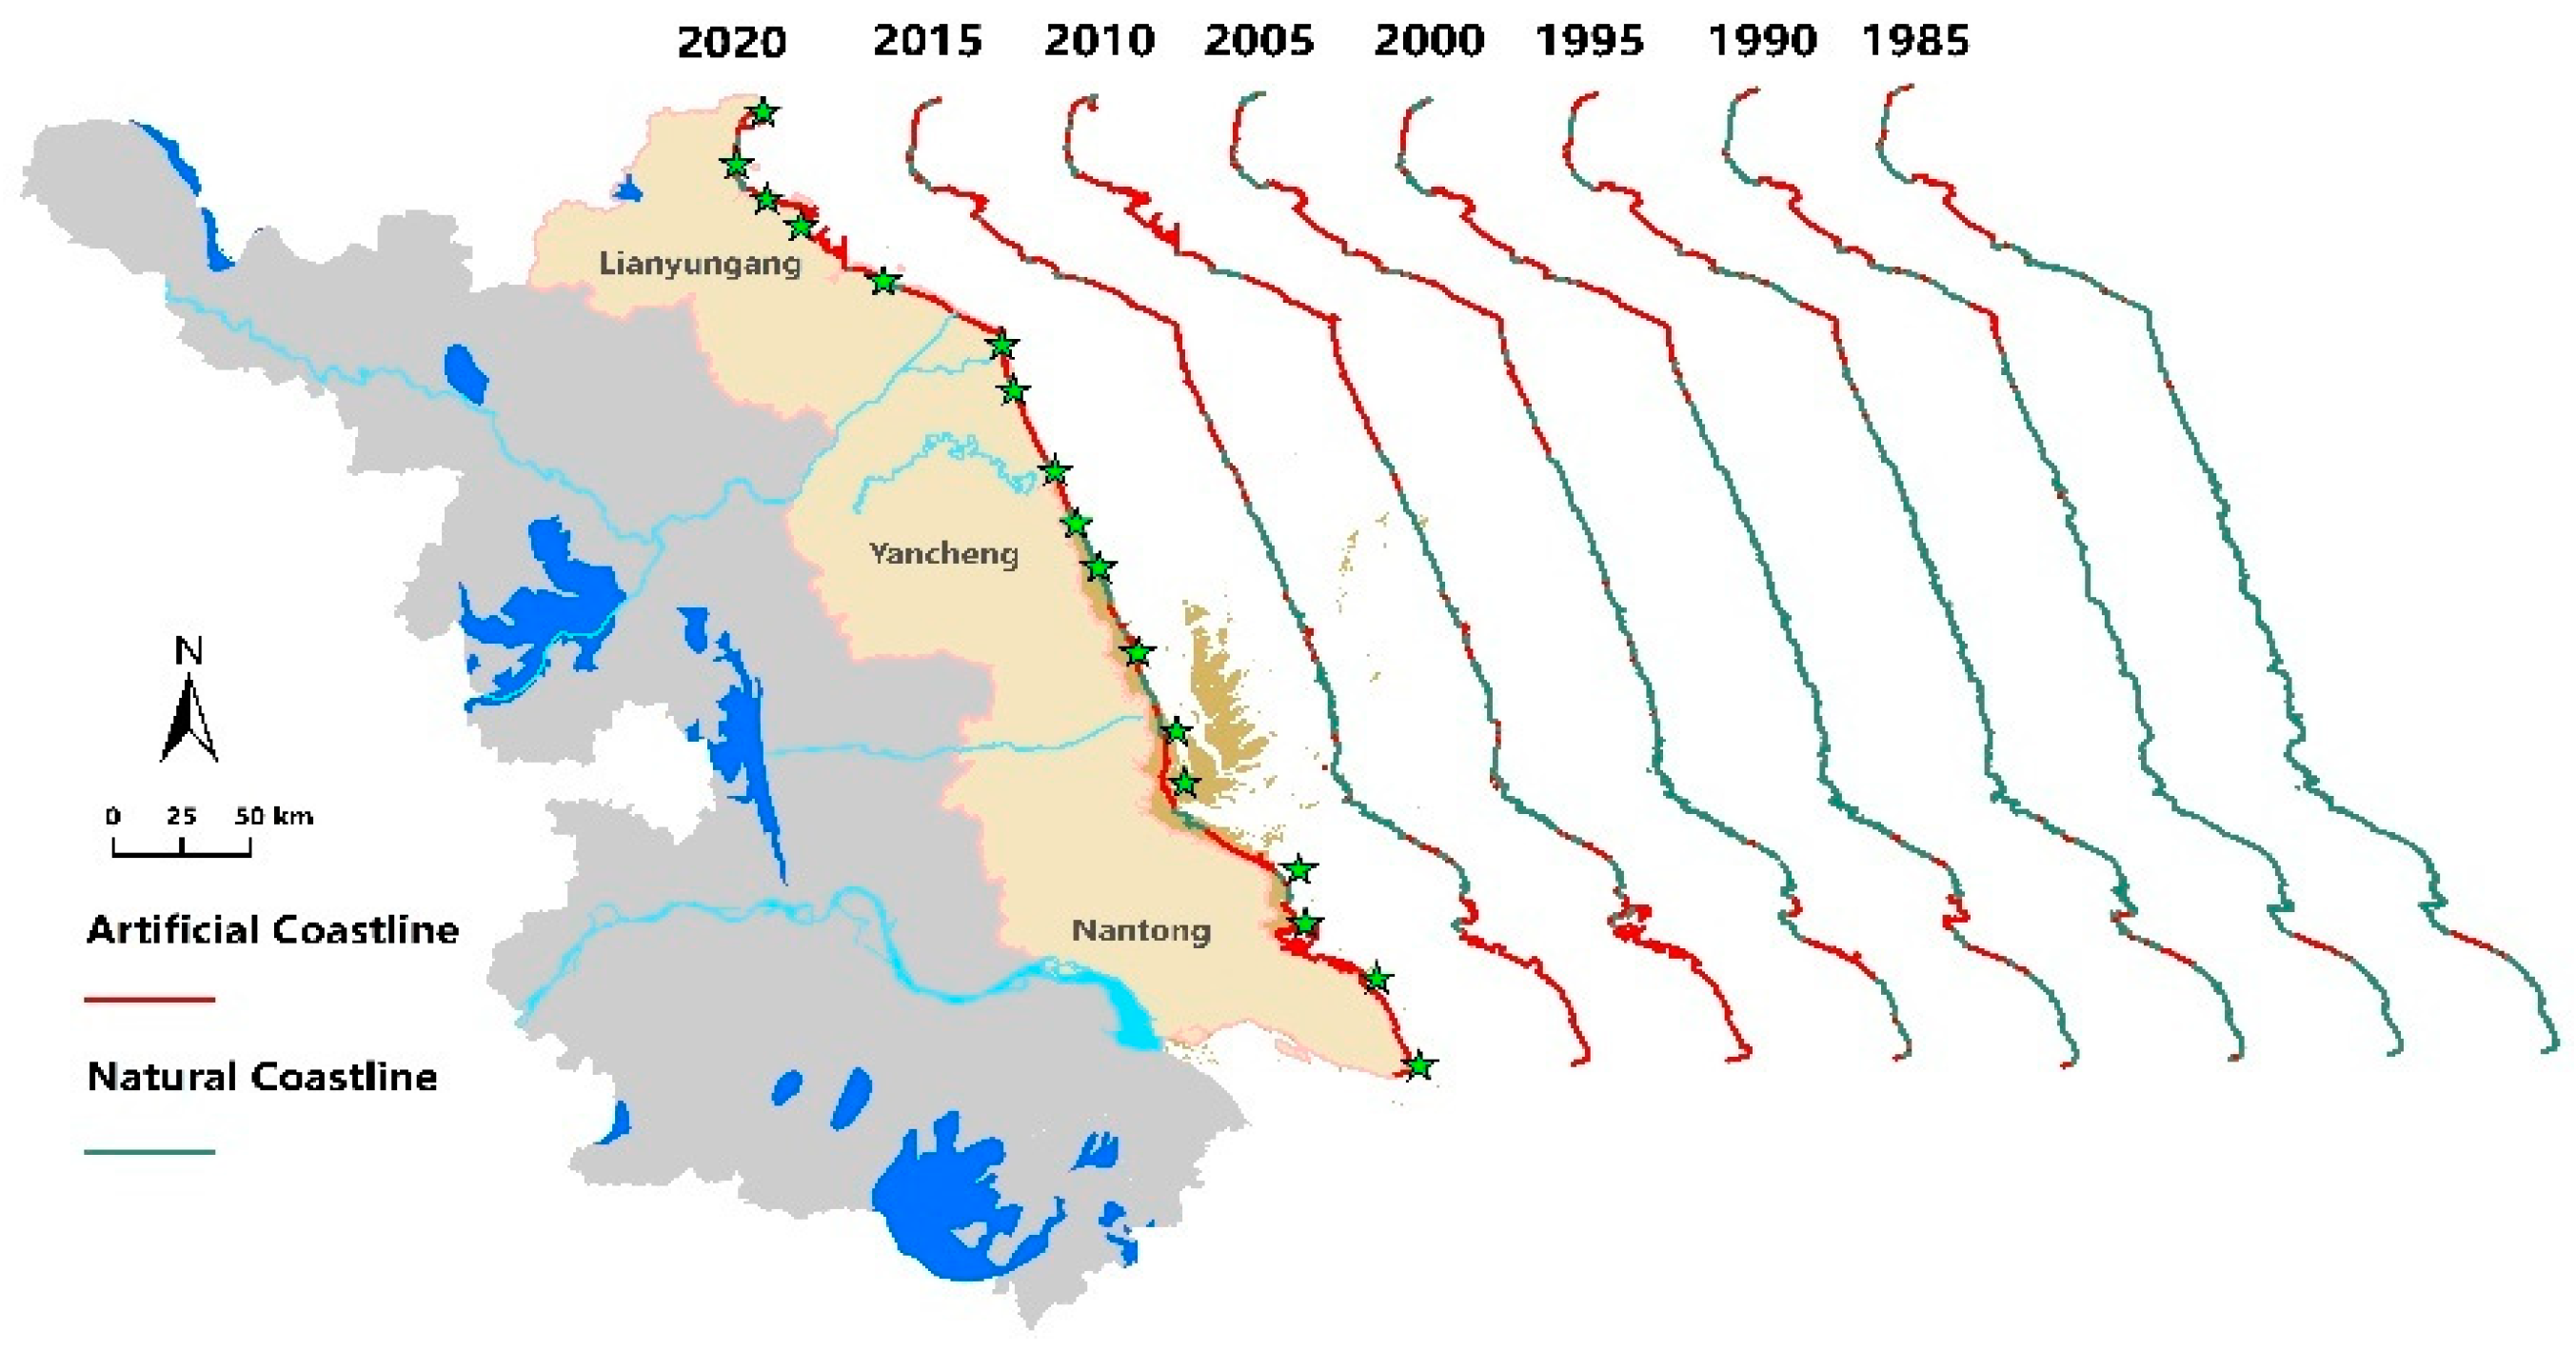
Figure 4 shows the changes in natural and artificial coastlines over the past 35 years. Under the dual effects of natural factors and human activities, the proportion of natural coastlines decreased. From 1985 to 2020, the proportion of artificial coastline in Jiangsu showed a substantial increase from 14% in 1985 to 77% in 2020. In 1990 and 1995, the proportion of artificial coastline was 25% and 21%. Coastlines decreased, and the proportion of artificial coastlines rose rapidly to 32% in 2000. In 2005, 2010, 2015, and 2020, the artificial coastlines were 34%, 49%, 63%, and 77%, respectively. The artificial coastline changed significantly after 2000.
Among them, the proportion of artificial coastlines on the coast of Lianyungang increased from 13% in 1985 to 19% in 2020. In 2020, the natural coastlines were mainly distributed in the Xingzhuang–Xishu estuary. From 1985 to 2020, the artificial coastline in Yancheng City accounted for 1–32%. The natural coastline is reduced, and most of Jiangsu natural coastlines are distributed in the Xinyang–Doulong and Chuandong–Liangduo coast sections, and the natural coastlines in other areas are scattered. The artificial coastlines in Nantong city are mainly distributed in Fangtang–Tuanjie estuary. From 1985 to 2020, the proportion of artificial coastlines was 2% and 26%.
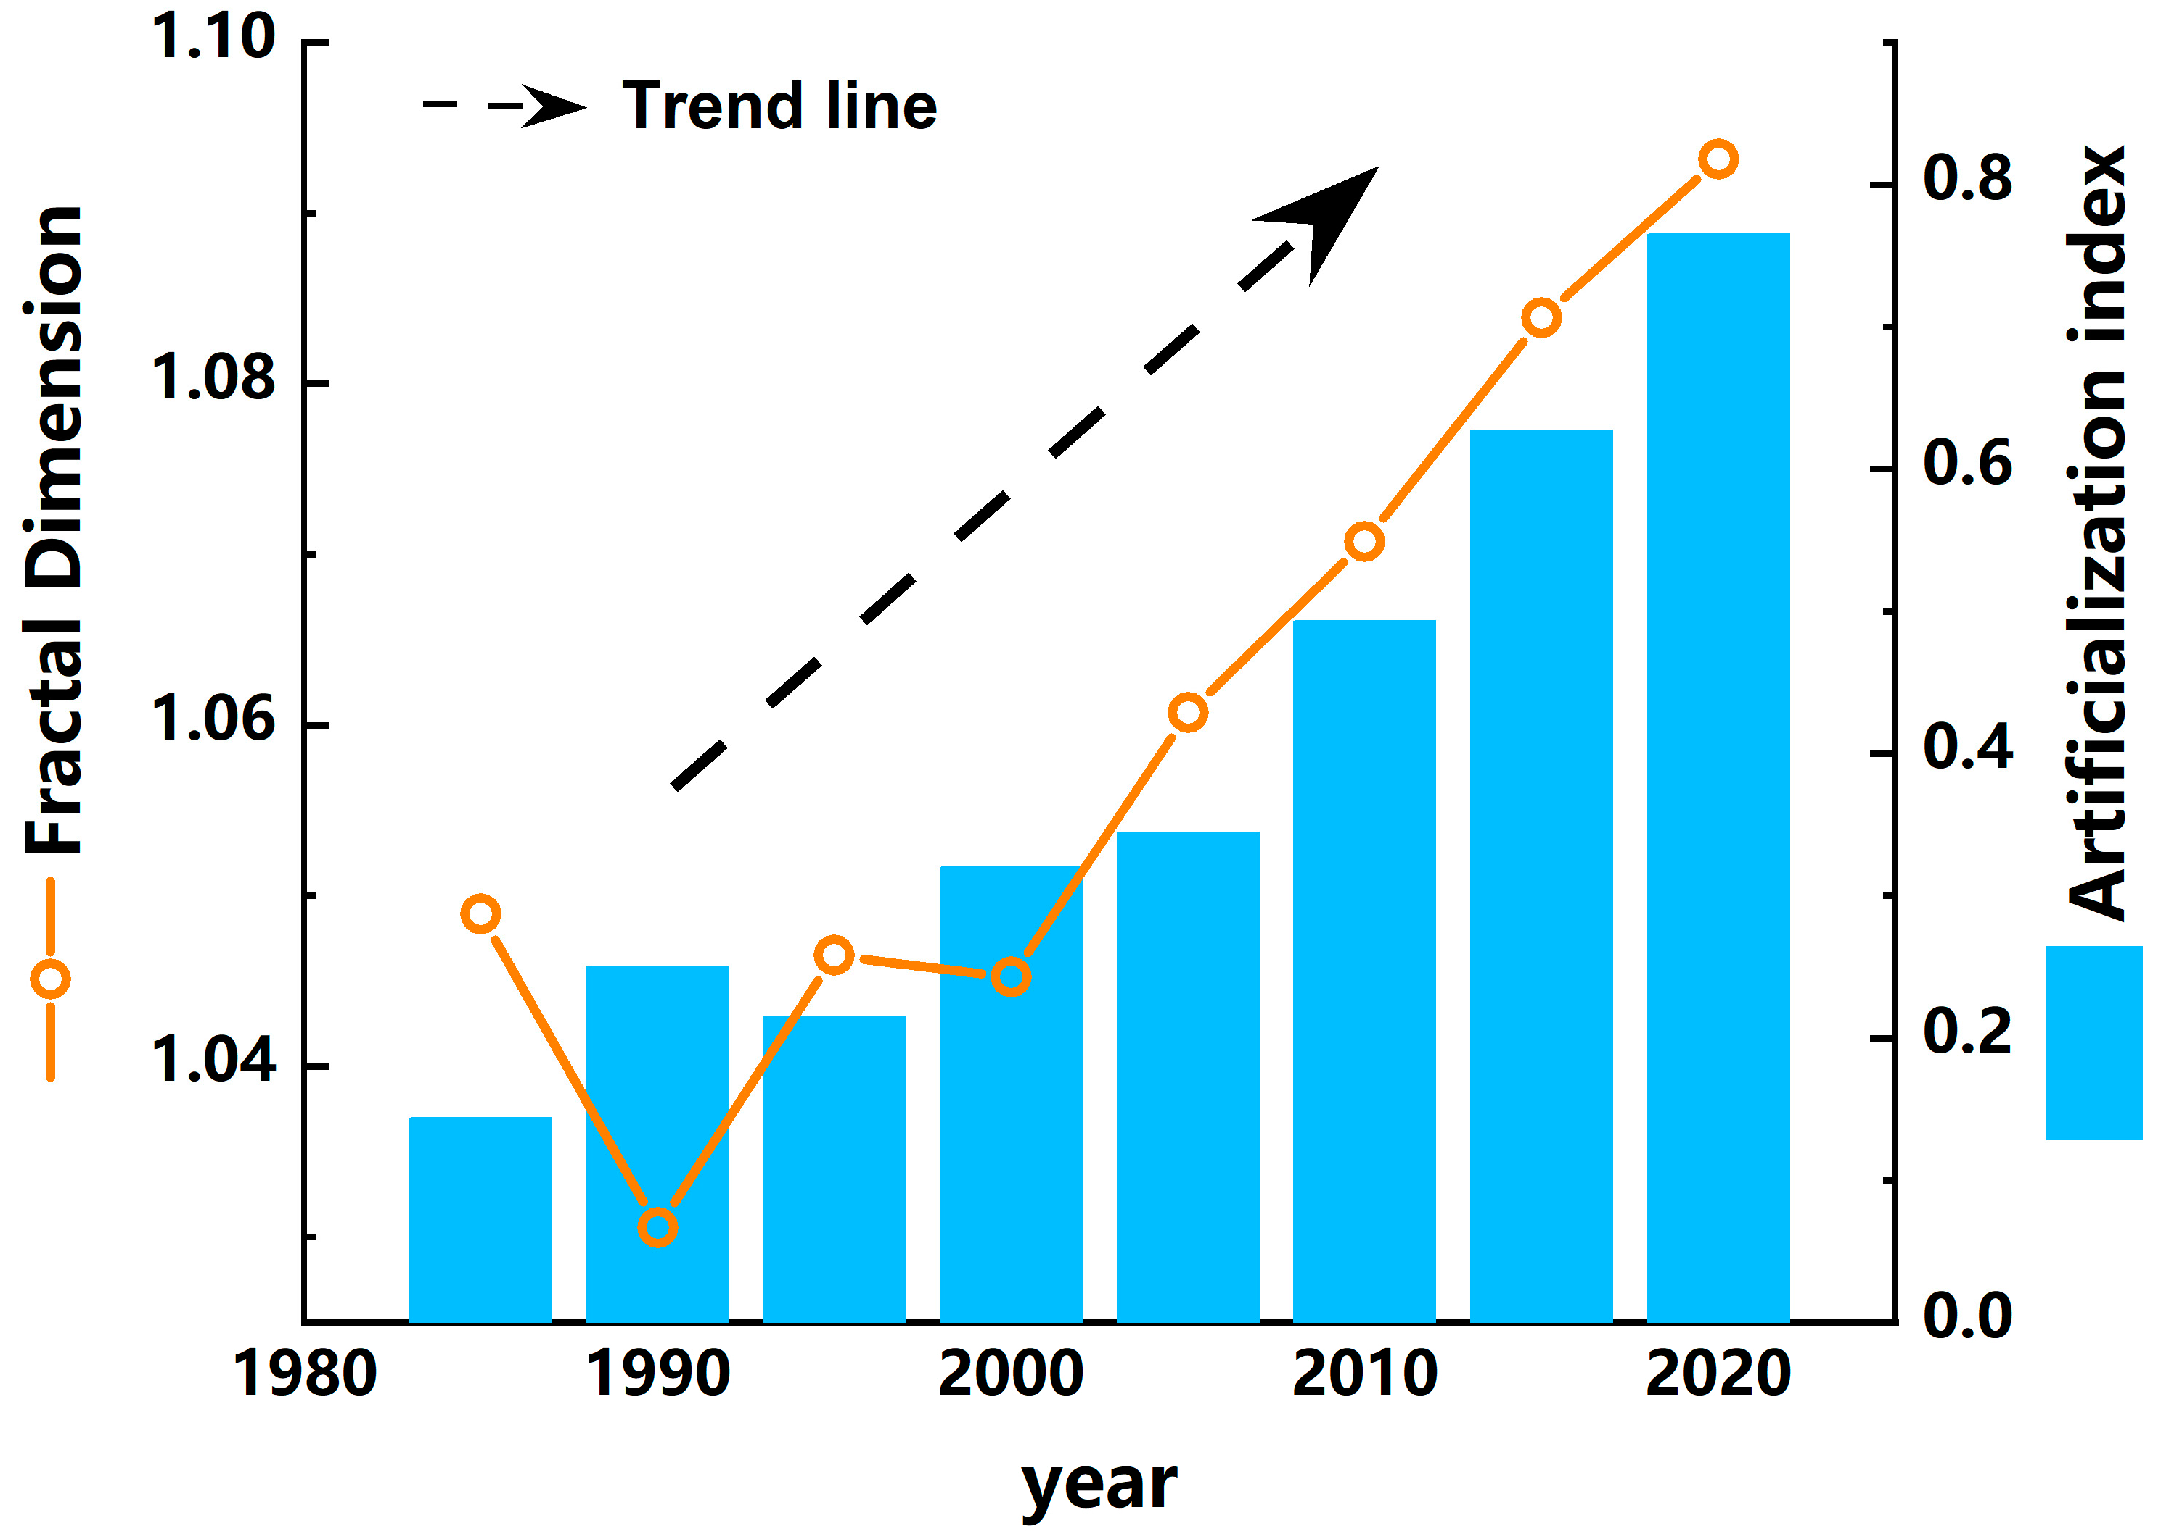
3.3. Fractal Dimension and Artificiality Rate of Coastline
Figure 5 shows the Jiangsu coastline fractal dimension and artificialization index from 1985 to 2020. In the past 35 years, both the fractal dimension and artificialization index of Jiangsu coastline generally increased except for first 5 years when the fractal dimension decreased. Economic development activities on the coastline have changed the shape of the natural coastline to more curved to a certain extent. From 1985 to 2020, the fractal dimension of Jiangsu coastline increased from 1.049 to 1.093, the artificialization index rose from 0.144 to 0.765. There is a certain linear relationship between the artificialization index and the fractal dimension. An increase in the fractal dimension indicates that the coastline shape becomes more curved and complex. From 1985 to 1990, the fractal dimension of the coastline decreased from 1.049 to 1.031, and the artificialization index increased from 0.144 to 0.250. From 1990 to 1995, the artificialization index decreased slightly from 0.250 to 0.212, and the fractal dimension increased from 1.031 to 1.047. From 1995 to 2000, the artificialization index increased significantly from 0.215 to 0.320, while the fractal dimension decreased from 1.047 to 1.045. After 2000, both the artificialization index and the fractal dimension showed a significant upward trend. The artificialization indices in 2000, 2005, 2010, 2015 and 2020 were 1.045, 1.061, 1.071, 1.084 and 1.093, respectively, and the fractal dimensions were 0.32., 0.345, 0.493, 0.627 and 0.765, respectively.
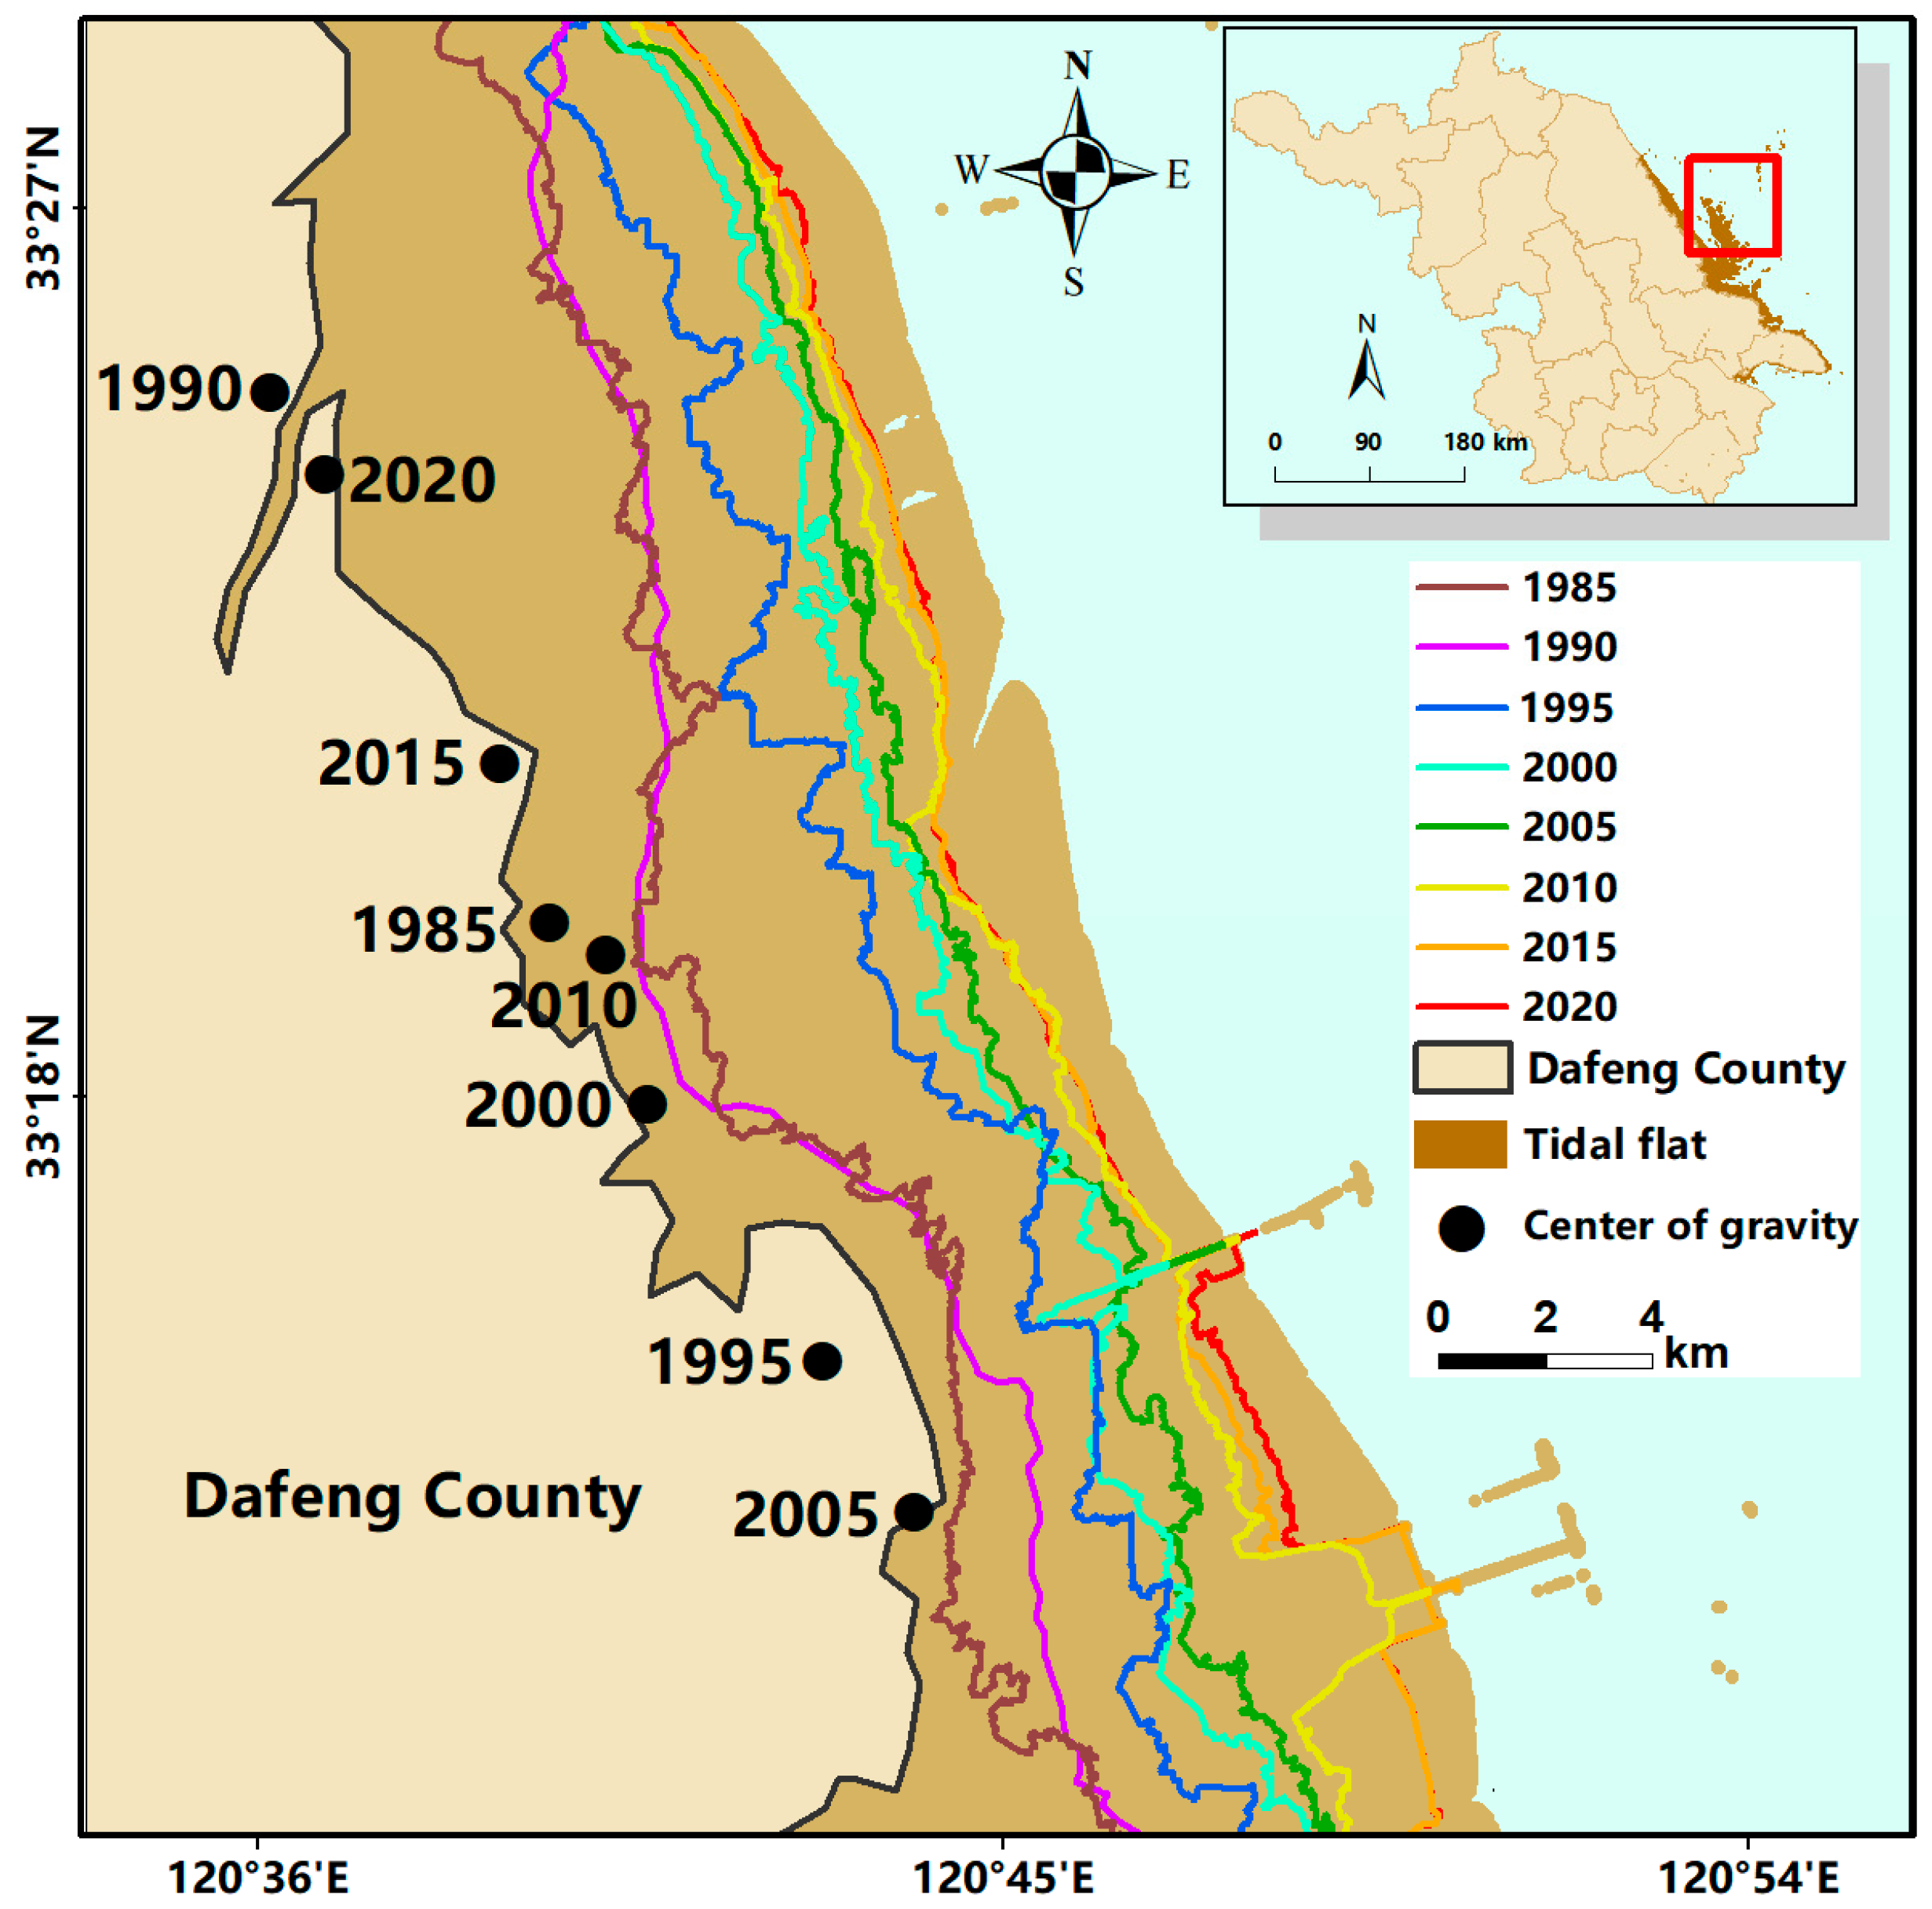
3.4. Jiangsu Coastline Center of Gravity Migration
The results in Figure 6 show that the center of gravity of the coastline moved rapidly from Dafeng City to the northwest in the late 1980s and then moved to the southeast in the 1990s. Quantitatively, it shifted by 11.8 km and 22.2 km in the direction of 56.48° northwest and 54.35° southeast in 1990 and 1995 compared to 1985, respectively. From late 1990s to early 2000s, the center of gravity shifted 6.3 km and 9.8 km in the direction of 49.43° northwest and 50.81° southeast in 2000 and 2005 compared to 1995. The spatial variations of the coastline in the two periods of 2010 and 2020 illustrated that the center of gravity moved 4.4 km at 55.08° northwest and 6.7 km at 52.97° northwest. Overall, the coastal line of Jiangsu moved 5.13 km upwards northwest by 61° from 1985 to 2020.
3.5. Annual Variation of Coastline
In the past 35 years, part of the coastline of Jiangsu advanced seaward, the land area of the coastal zone increased, and the coastline was silted up. Part of the coast receded landward, the land area decreased, and the coast eroded. The coastline of Jiangsu is divided into the northern coastline north of Sheyang estuary and the southern coastline south of Sheyang estuary for analysis.
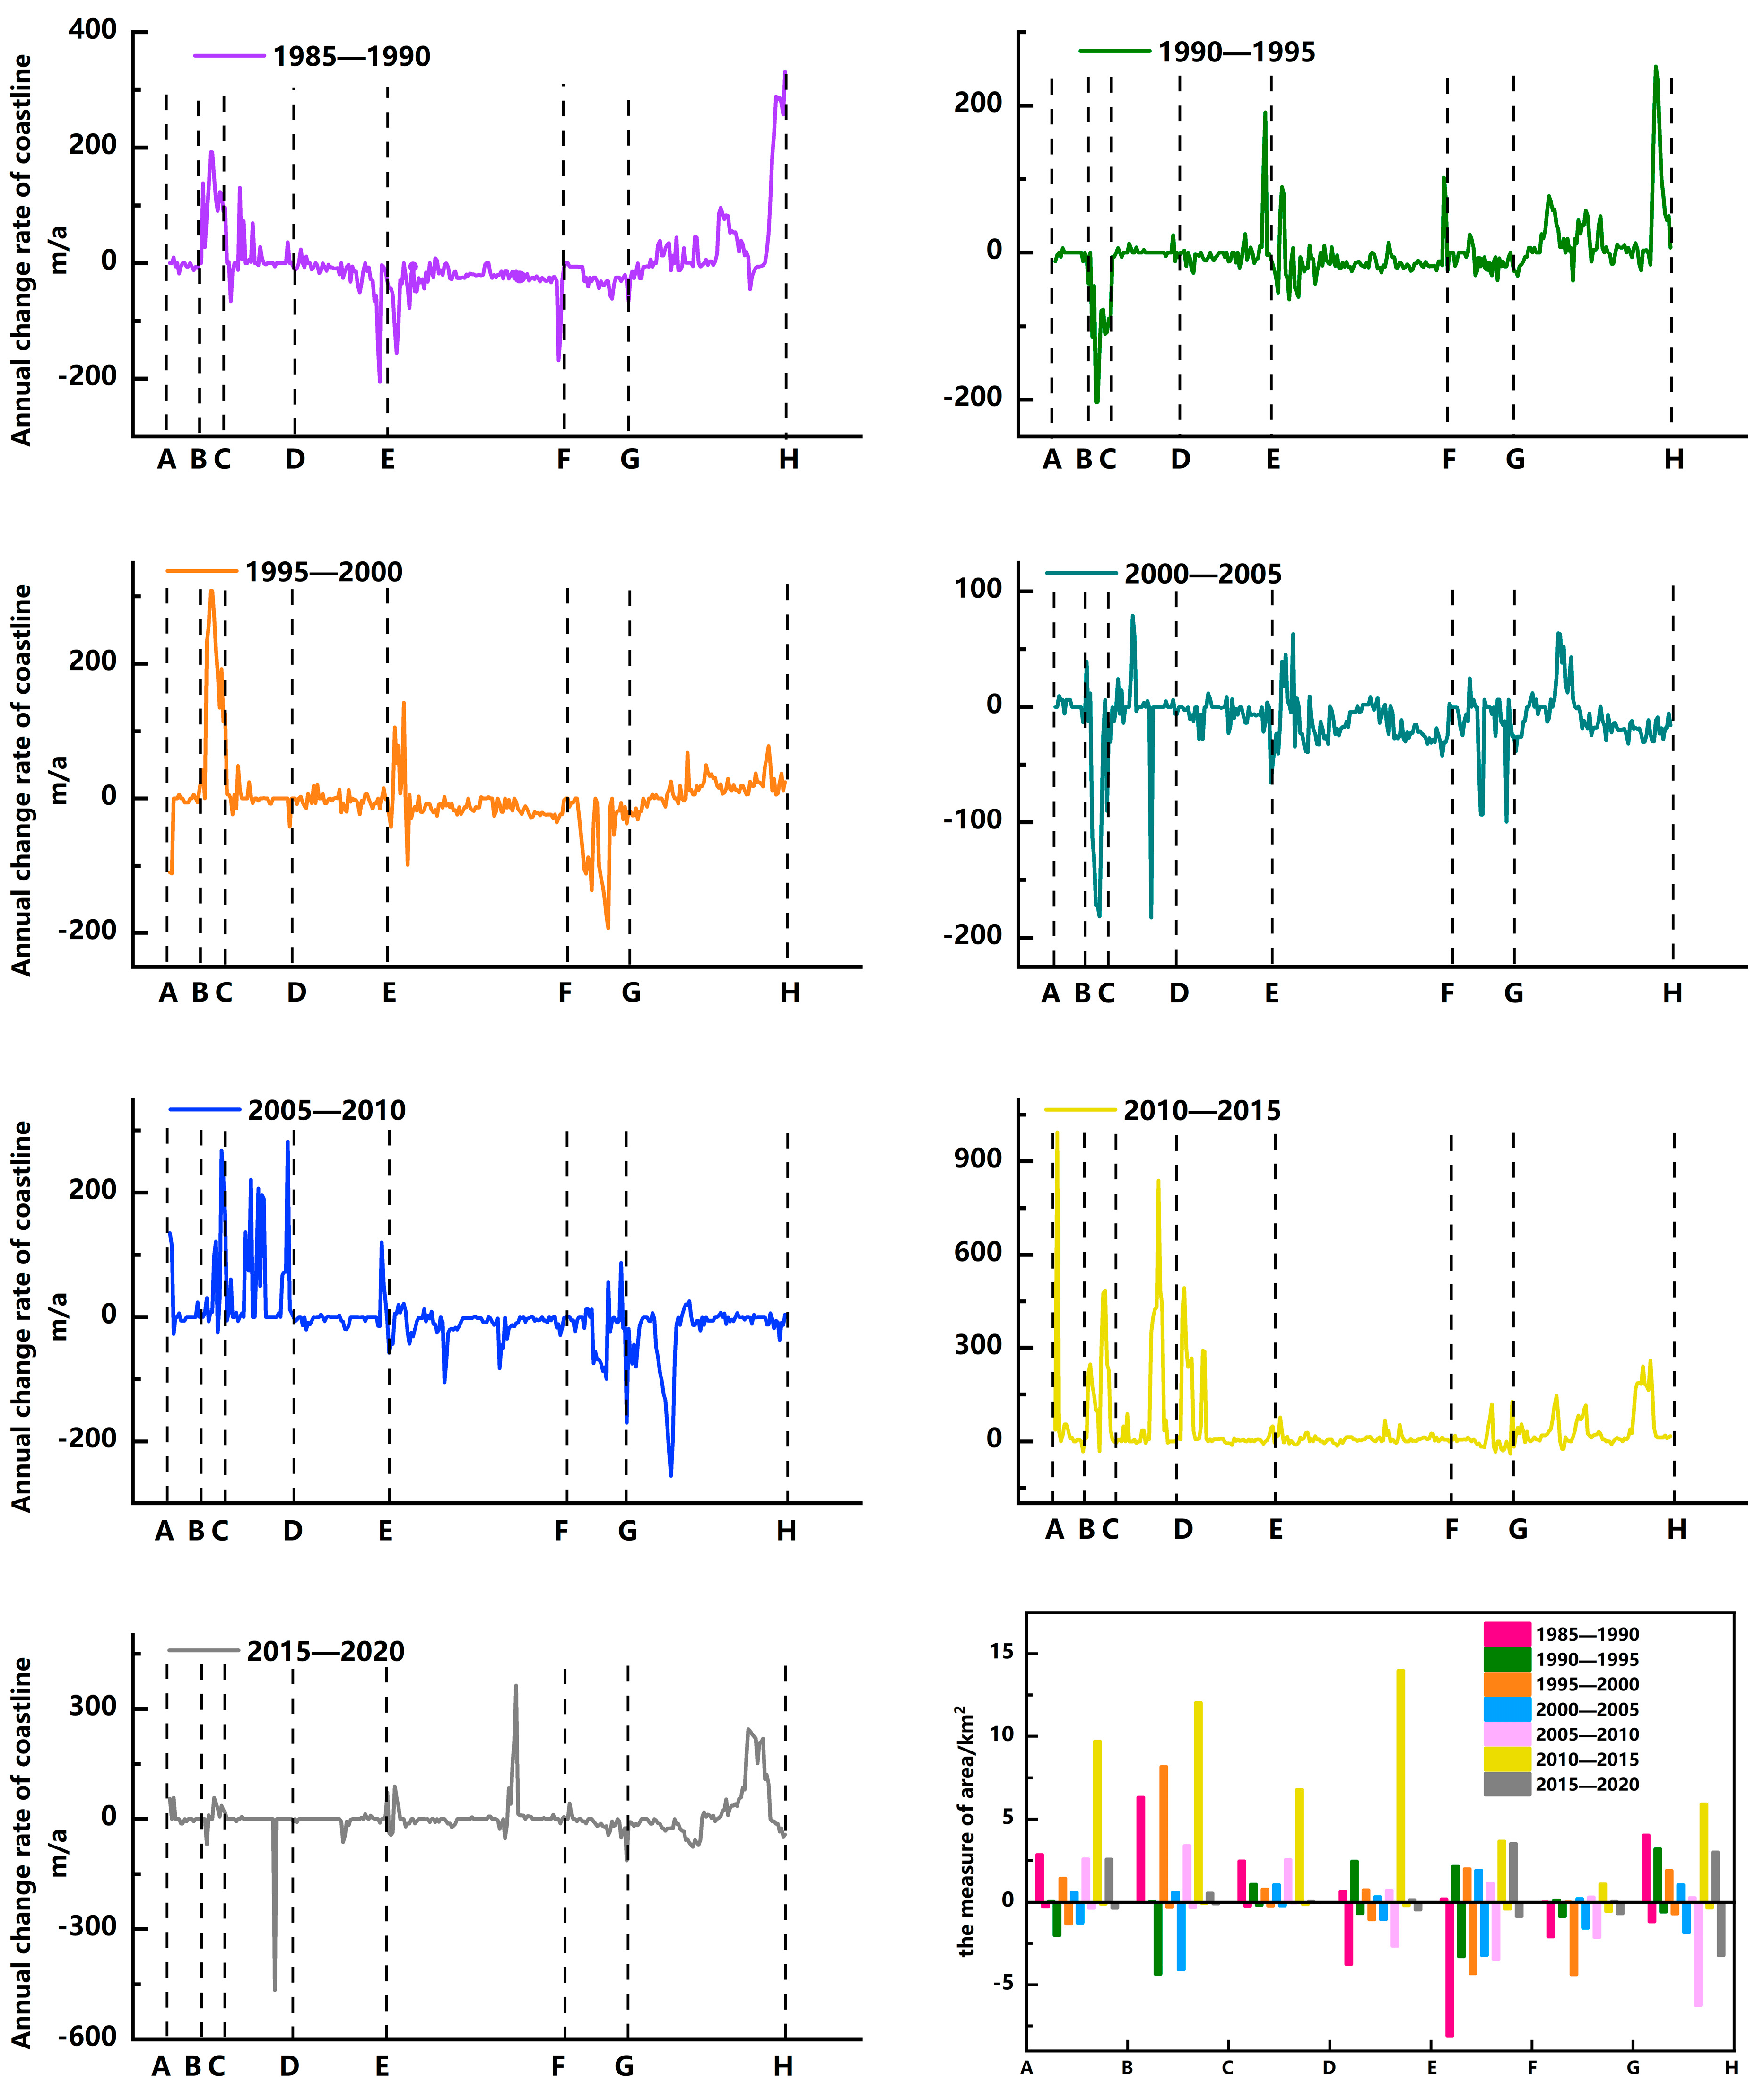
(1) Changes in the northern coastline
The annual change rate in the northern coastline from 1985 to 2020 was relatively small (Figure 7), with an average annual change rate of 1.83 m/a and an average area increase of 4.83 km2. The characteristics of the northern coastline change could be divided into two stages. In the first stage, the coastline of Xiuzhen–Shaoxiang estuary advanced towards the sea. The annual average change rate in the coastline of Xiuzhen–Xingzhuang estuary from 1985 to 2020 was 10.42 km2, and the average annual area of the coastline increased by 3.86 m/a. The highest advance rate was 134.68 m/a, and the largest area increase was 9.7 km2 from 2010 to 2015. The annual average change rate in the Xingzhuang–Xishu estuary coastline fluctuated significantly between 500 m/a and −200 m/a. The average annual rate of change was 55.18 m/a, the average annual area increased by 6.95 km2, the maximum siltation rate was 483.95 m/a in 2005–2010, and the increased area reached the maximum in 2010–2015 at 11.19 km2. The average annual change rate in Xishu–Shaoxiang estuary was 21.74 m/a, and the average annual area increase was 2.24 km2. In the second stage, the Shaoxiang–Sheyang estuary coastline receded towards the land. The annual average change rate in the Shaoxiang–Guanhe estuary coastline was −5.88 m/a, and the average annual area decreased by 0.15 km2. Significantly, the coastline changes were stable in the rest of the years. The average annual change rate in the Guanhe–Fanshen coastline was −8.59 m/a, and the average annual area decreased by 0.008 km2. The average annual area decreased by 0.16 km2, the average annual erosion rate of the Biandan–Sheyang estuary was −6.64 m/a. The average area decreased by 0.51 km2, the minimum annual change rate in the coastline was 256.04 m/a from 1995 to 2000, and the largest area reduction in 2005–2010 was 6.53 km2.
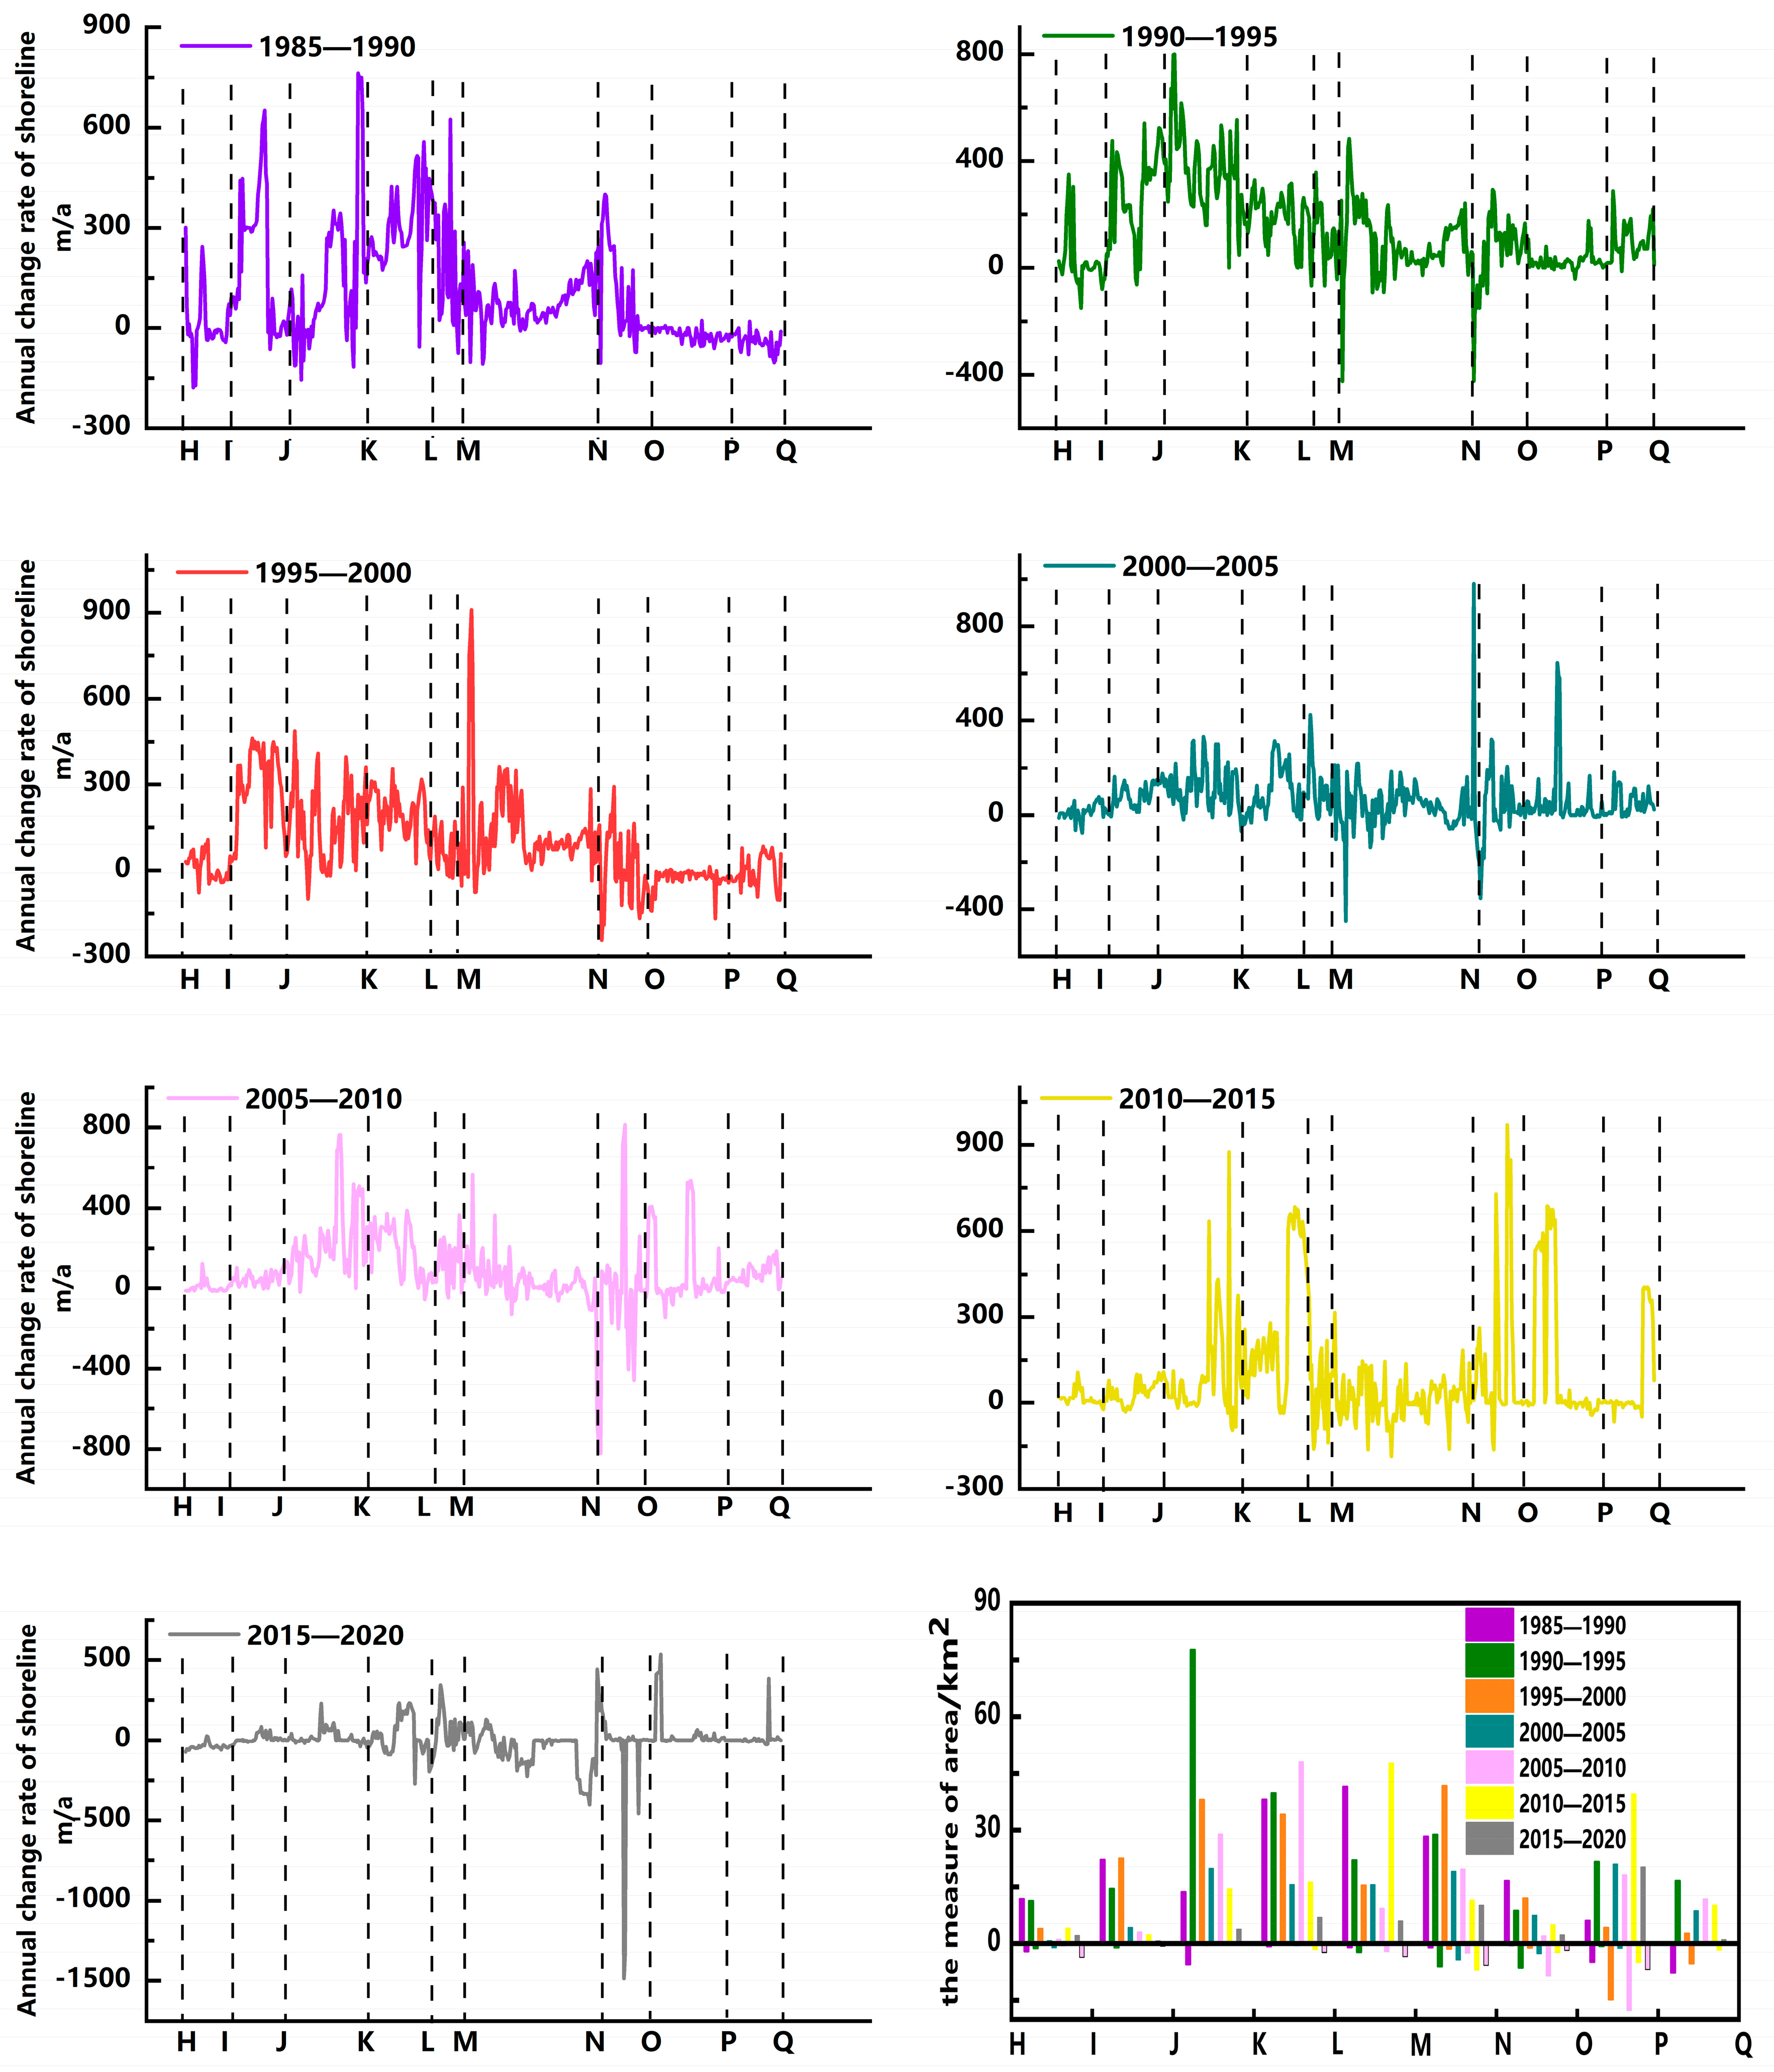
(2) Changes in the southern coastline
From 1985 to 2020, the coastline in the southern part of Jiangsu advanced greatly to the sea (Figure 8), with an average annual 82.21 m/a and an average annual change area of 18.07 km2. Compared to the northern part of the coastline, the change in the southern part of the coastline was much greater. The change characteristics of the southern coastline can be divided into three stages. In the first stage, Sheyang–Fangtang estuary coastline moved slowly towards the sea in the past 35 years. The Sheyang–Xinyang estuary coastline experienced an annual 29.34 m/a, with an average annual area change of 5.24 km2, while the Xinyang–Doulong estuary had an annual 85.06 m/a, with an average annual area change of 11.52 km2. The annual average area change in Doulong–Chuandong estuary was 5.24 km2. In the second stage, the coastline of Sheyang–Fangtang estuary rapidly moved towards the sea. Annual in Xinyang–Doulong coastline was 153.31 m/a, with an average annual area change of 23.41 km2. The annual in Liangduo–Fangtang estuary coastline was 180.98 m/a, and the average annual area change was 22.97 km2. In the third stage, the Fangtang–Lianxing estuary coastline moved slowly towards the sea, the annual in the Fangtang–Beikan estuary coastline was 57.95 m/a, and the average annual area change was 28.59 km2. The annual in Beikan–Tuanjie estuary coastline was 35.01 m/a, and the average annual area change was 11.52 km2, the annual in Tuanjie–Haozhi estuary was 50.99 m/a, and the annual average area change was 23.47 km2, the annual in Haozhi–Lianxing estuary coastline was 27.90 m/a, and the average annual area change was 7.58 km2.
4. Discussion
4.1. Rapid Siltation and Erosion Evolution of Jiangsu Coast
The erosion and siltation changes in the Jiangsu coastline are mainly reflected in the interannual changes in the coastline area and distance. Dynamic changes in coastline erosion and siltation are required, and the spatial change in the coastline in multiple periods is calculated. Spatial evolution characteristics and in the coastline in Jiangsu in the past 35 years can be understood through the analysis of area changes. Taking the coastline evolution rate as an index, the siltation and erosion status of the Jiangsu coastline are divided into five grades to represent the intensity of the coastline change and evaluate the historical dynamic status of the Jiangsu coastline more intuitively. The degree of coastline erosion is quantitatively measured by the criteria: Strong erosion coastline, EPR < −5; weak erosion coastline, −5 < EPR < 10; stable coastline, 10 < EPR < 20; weak siltation coastline, 20 < EPR < 85; and strong siltation coastline, EPR > 85. Since the evaluation index of erosion and siltation is determined not only by a single element of EPR, but also by consulting historical data and literature; in this way, the characteristics of siltation and erosion of the coastline can be obtained comprehensively.
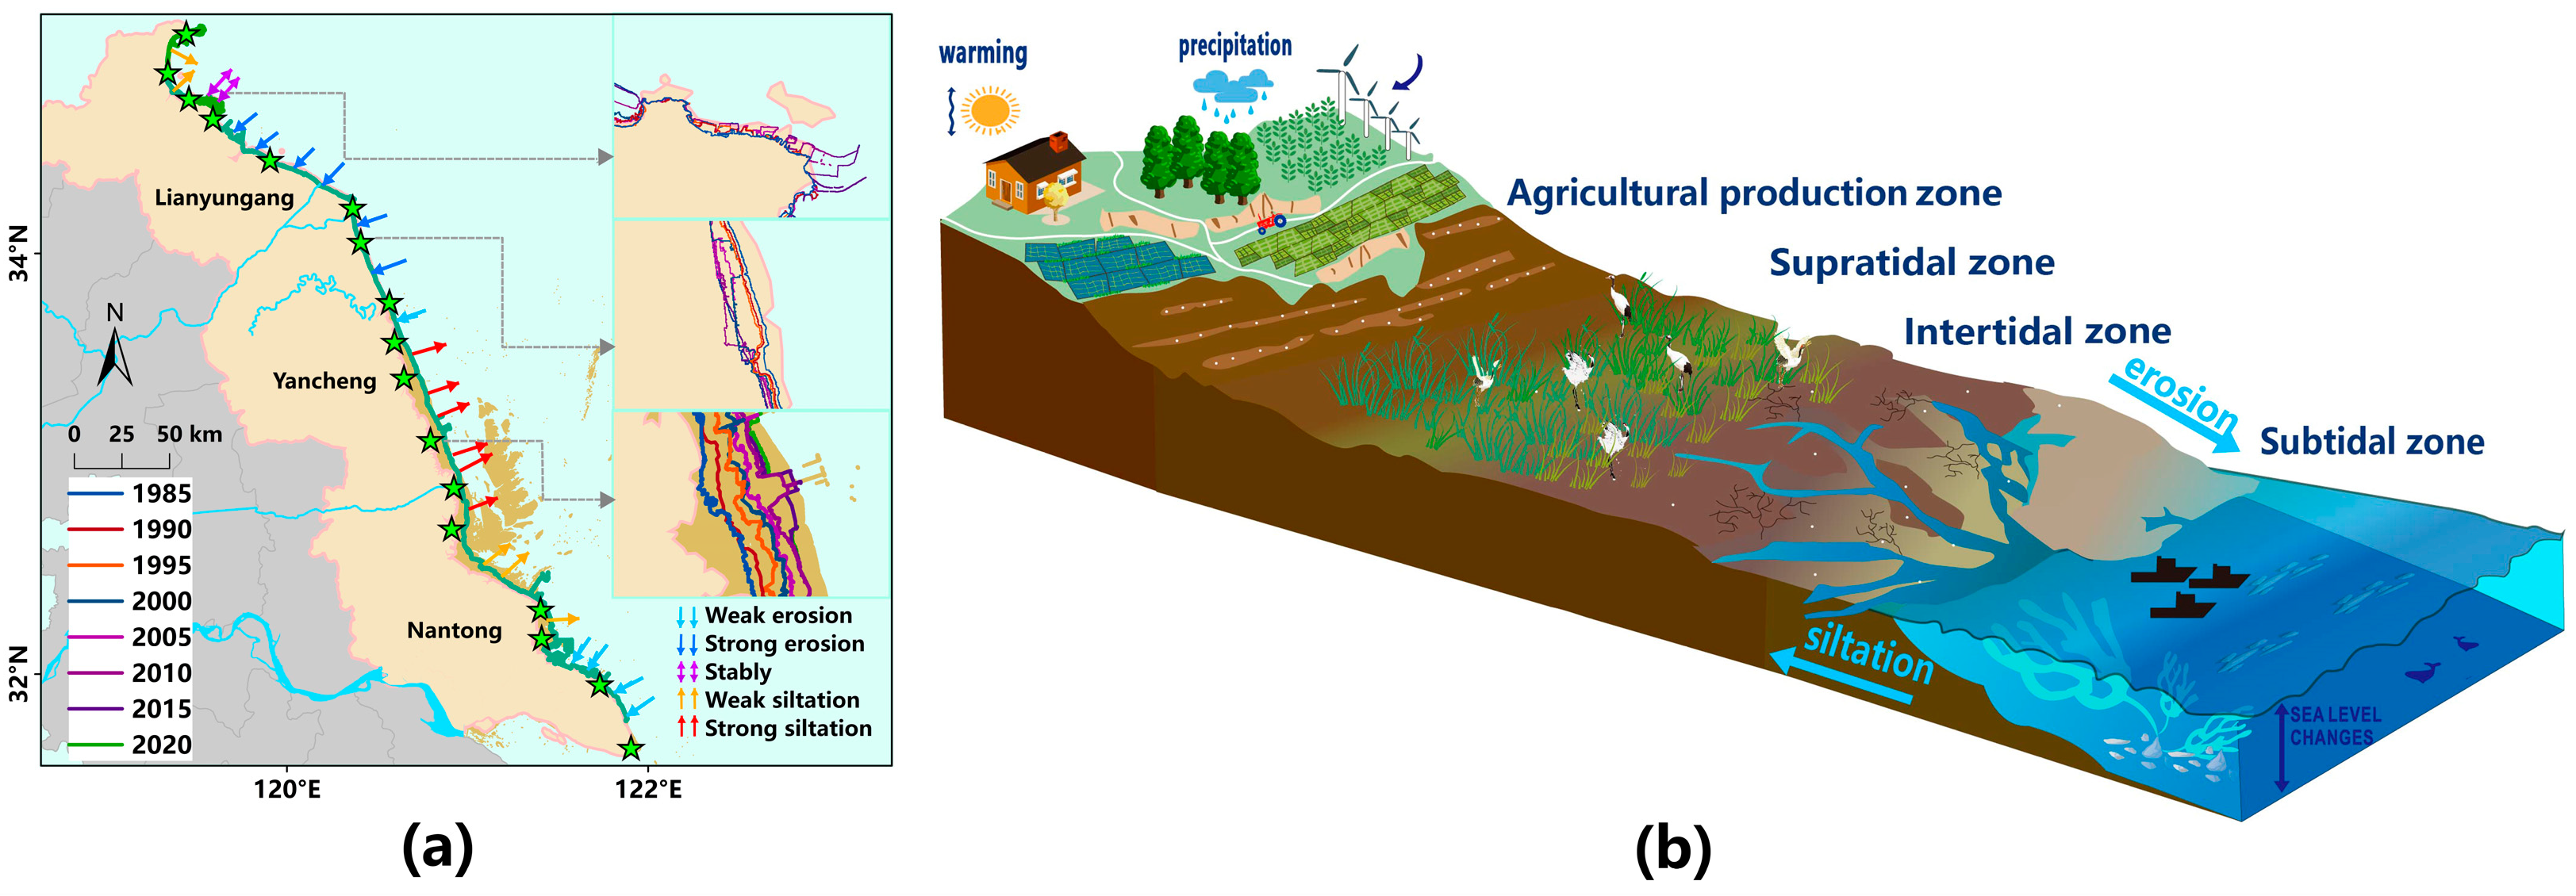
Figure 9 shows that the coast of Jiangsu, bounded by the Sheyang estuary, experienced north erosion, and south siltation [50]. The Sheyang–Xinyang estuary experienced slight siltation, and the siltation and erosion boundary moved southward over time consistent with the results of Yan et al. [51]. The erosion and siltation along the Jiangsu coast from north to range in the following way south generally: stable–strong erosion–weak erosion–strong siltation–weak siltation–weak erosion. The Xiuzhen–Xishu estuary is a weakly silted coast section, and Xiuzhen–Xingzhuang is a weakly silted sandy coast. The bank slope is relatively gentle and slightly silted, and the change is relatively uniform under the action of marine dynamics. In the past 35 years, it has been less affected by human activities. The Xingzhuang–Xishu estuary is a weakly silted coast. The coastline protection project implemented in the 1970s has a significant effect on curbing coastline erosion, and the riverbank has been relatively stable since the 1980s. The Xishu–Shaoxiang estuary is a stable section, which is a rare bedrock coast in Jiangsu. Under the long-term strong action of the ocean, the shape of the coastline changed, but the change rate in the coastline is not obvious, and the coast is relatively stable. The Shaoxiang–Sheyang estuary is a section of strongly eroded bank, while the Fanshen–Biandan estuary experienced dynamic adjustments on the north bank of the abandoned Yellow River estuary from 1985 to 2000, and the rate of erosion has gradually slowed down. Biological measures to promote siltation increased sediment discharge at the Guan River estuary [52] and slowed erosion and land loss near the abandoned Yellow River mouth. Initially, there was no vegetation other than the mudflats at the heights of the beach, naturally dotted with salt marsh communities. From 1979 to 1986, Spartina alterniflora was introduced and developed into artificial vegetation of Spartina alterniflora. Due to the serious erosion of the nearby coast, the vegetation area hardly developed in the ensuing years [53]. The bank section of the Sheyang–Xinyang estuary weakly eroded. The Xinyang–Fangtang estuary is a strongly silted section, and the rapid siltation of Xinyang–Doulong from 1985 to 2000 was mainly due to the establishment of Yancheng National Nature Reserve [54], and the siltation rate gradually decreased after 2000. The Doulong–Fangtang estuary experienced rapid seaward advancement. The Fangtang–Tuanjie estuary is a weakly silted section. Since 1985, the amount of sea reclamation in the estuary has increased rapidly. Engineering and farming activities are frequent, and most of them are small-scale low-standard farm reclamation polders. The Tuanjie–Lianxing estuary is a weakly eroded section. From 1985 to 2000, the coastal section eroded strongly. After 2000, the Tuanjie–Haozhi estuary area begun to silt up, while the Haozhi–Lianxing coastline eroded slowly.
The siltation from 1985 to 2000 was mainly caused by natural factors. In 1986, Jiangsu began to plant Spartina alterniflora north of the Sheyang to protect the coast and reduce soil erosion [55]. By 1989, the most serious water and soil erosion in Sheyang had formed the inter-flower straw belt. It was determined that the sedimentation rate along the coastline in Yancheng significantly accelerated. After 2000, Jiangsu economy developed rapidly, and large-scale reclamation activities were carried out in coastal areas, such as reclamation and breeding, construction of salt pan fish ponds, port, and dams. With the construction of many ports and wharves and the increase in large-scale reclamation projects, human activities alleviate the erosion of coastal beaches [56]. Coastal construction and development are one of the main factors affecting coastline changes. These activities take place mainly on muddy coasts. In general, modern coastlines are influenced by human activities. These activities changed not only the direction and speed of the Jiangsu coastline, but also the shape of the coastline. Natural factors such as temperature, precipitation, sea level rise, tidal, river systems, and sediment content of rivers entering the sea all affect the dynamics of the coastline, leading to the expansion or retraction of the coastline.
4.2. Quantitative Analysis among Influencing Factors
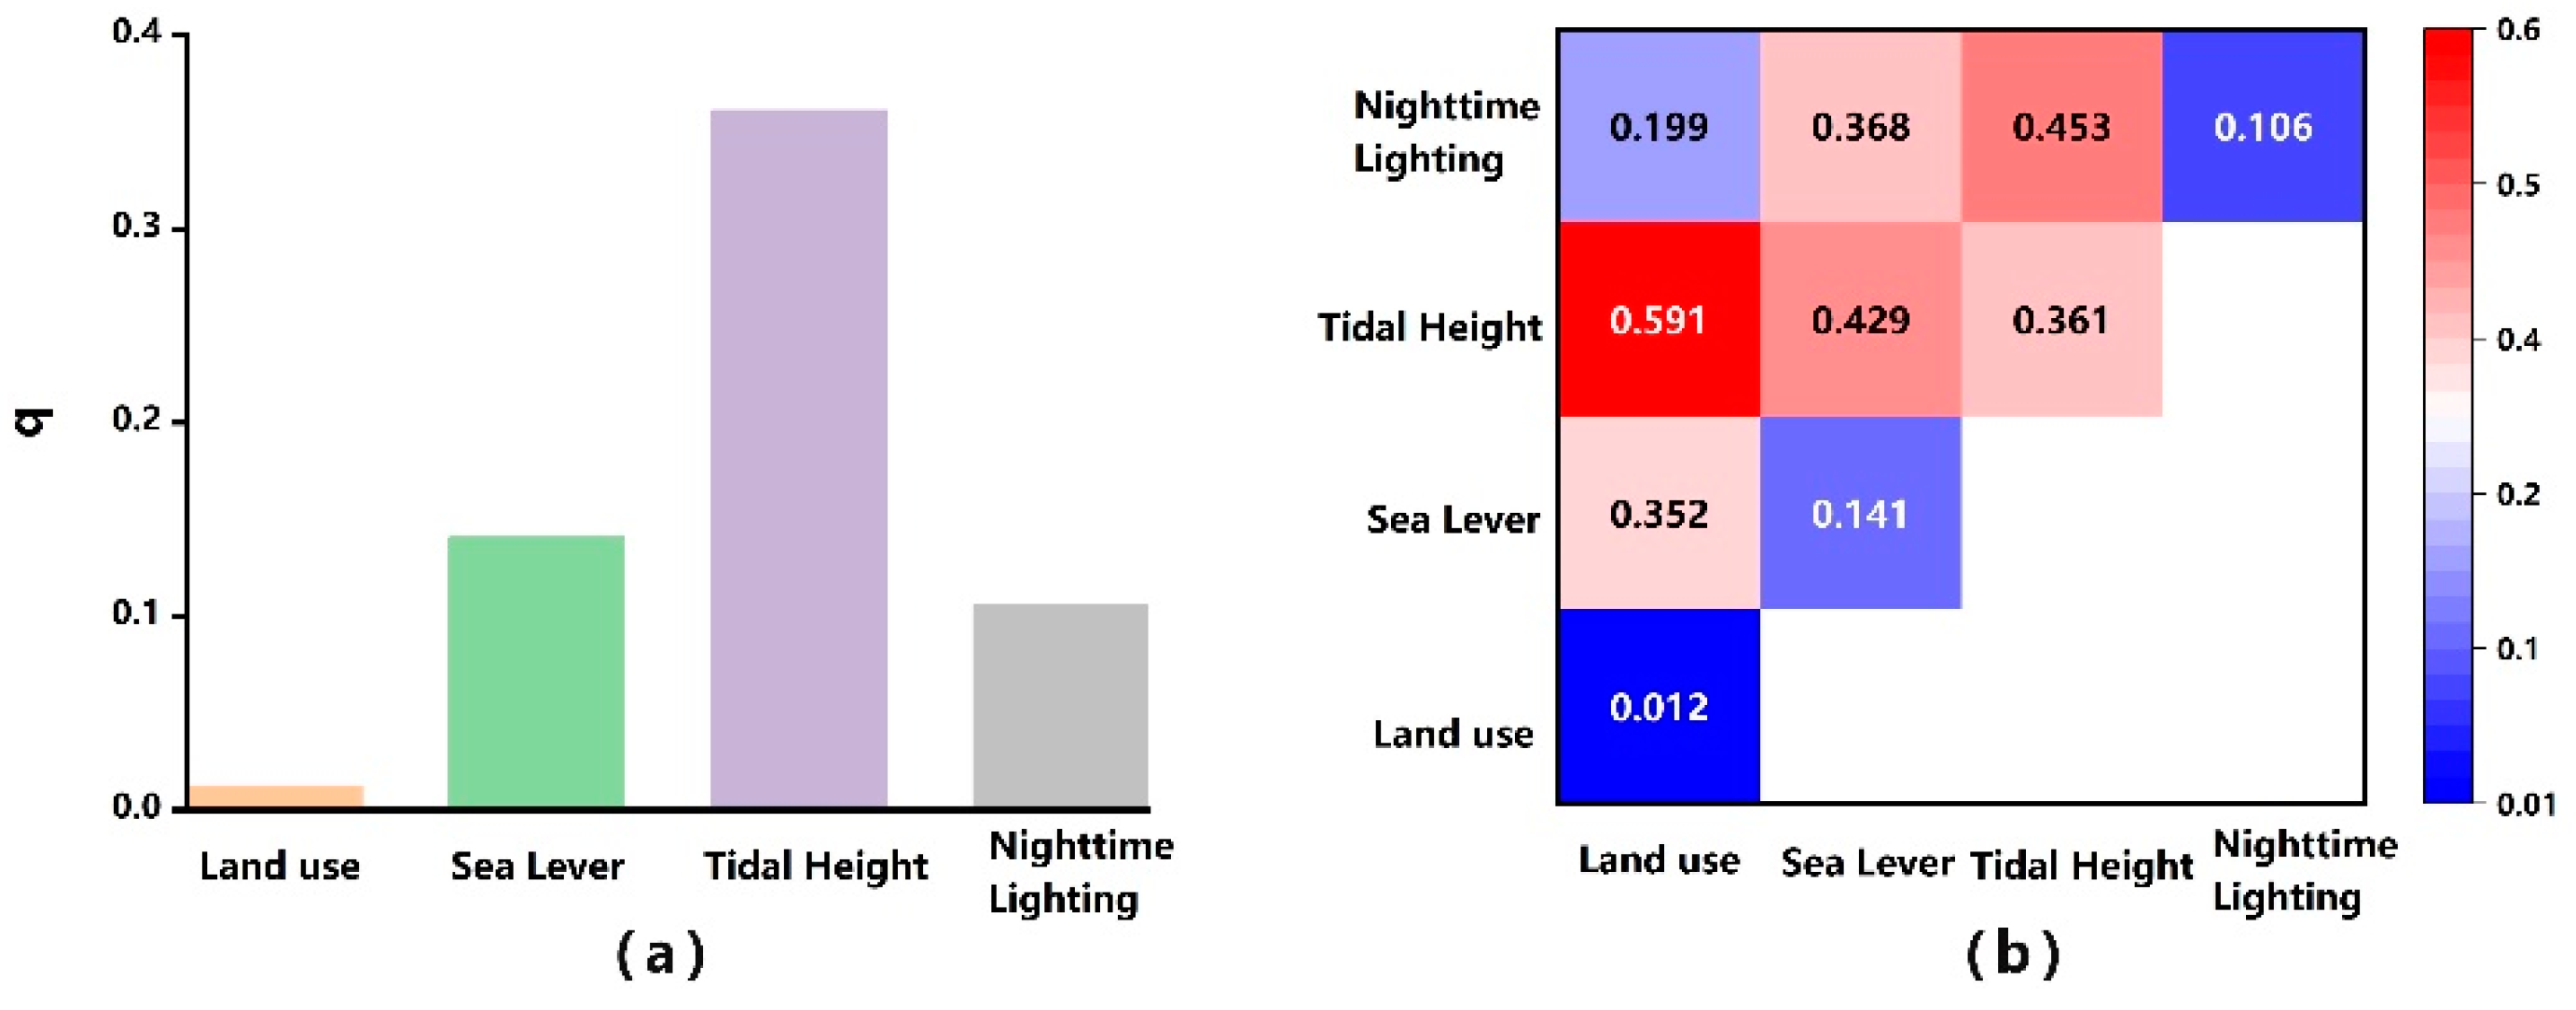
To explore the influence of different factors on the spatial differentiation of Jiangsu coastline, four types of detection factors were selected for analysis. Based on the single factor q value shown in Figure 10a, the order of influence of each factor on the spatial differentiation of Jiangsu coastline is as follows: tidal height > sea lever > nighttime lighting > land use. A q value of greater than 0.3 indicates a dominant factor in the change in coastline. The results show that among the four factors, the main factor affecting the spatial distribution of Jiangsu coastline is the natural factor. The interaction among various factors affecting the change in Jiangsu coastline is analyzed by interaction detector and is shown in Figure 10b. The two-factor enhancement is the main factor, and the order of the interaction between the two factors on the change in the Jiangsu coastline is as follows: land use ∩ tidal height (0.591), tidal height ∩ sea lever (0.429), nighttime lighting ∩ tidal height (0.453). The land use and tidal height interaction have the greater impact on the spatial distribution of Jiangsu coastline. The influence of the interaction of other factors on the coastline is less than 0.4, and the interaction between tidal height, land use, sea lever, and nighttime lighting is generally high, indicating that the tide height is the main factor affecting the coastline change among the four factors.
4.3. Impact of Terrestrial Provenance
The coastal siltation in Jiangsu has obvious spatial distribution characteristics. Before the Yellow River mouth was diverted in 1855, the abandoned Yellow River mouth was full of sand and good siltation [57], and the sediment concentration increased steadily. Figure 11 shows that from 2002 to 2020, the sediment load at the Lijin hydrological station of the Yellow River ranged from 0.05 to 37 billion m3, of which the sediment volume dropped significantly to 0.03 billion m3 in 2014 until 2018 when the sediment volume increased. The sediment load reaches a maximum of 37 billion m3, and the overall trend of runoff change is consistent with the change in sediment load. If the Yellow River estuary has not been diverted, the Guanhe–Fanshen estuary at the modern abandoned Yellow River estuary would be in a state of siltation, and the beach would expand to the sea. The amount of seawater scoured by the beach is greater than the amount of sediment supplied [58]. The coastline continues to move towards the land, causing erosion to occur in this section of the coast. The sediment and runoff of the Huaihe River Fuyang hydrological station showed an overall downward trend, and the decline in sediment discharge tended to be stable after 2010. Compared to the Lijin hydrological station of the Yellow River, the sediment load and runoff of the Huaihe Fuyang station are larger. The section in Figure 11b is located between the Guanhe estuary and Biandan estuary, and the tidal flats along the coast belong to the erosion zone. Under the action of tides, the intertidal zone scours violently, especially towards the beach, and the coastline elevation changes steadily. The elevation of the beach in Dongtai county in the middle east changes greatly, and the movement is intense (Figure 11c). The coastline is generally dominated by silted sections, with wide coverage and thick silt layers. The cross-sectional shape is complex and variable. Since the return of the Yellow River to the north, the siltation of the southern coastline became more stable. In Dafeng and Dongtai districts, the banks are silted up due to upstream scouring and sediment flow to the south.
4.4. Impact of Ocean Dynamics
The Third Assessment Report of the Intergovernmental Panel on Climate Change (IPCC) pointed out that the increase in tropical sea surface temperature will affect tropical cyclones when tropical cyclones transport distant ocean sediments offshore. According to the sixth report of IPCC, the global temperature is 1.1 °C higher than the pre-industrial level and coastlines will push seaward. From 2004 to 2020, the average sea level in Jiangsu showed a slow downward trend (Figure 12). Since the bedrock coastal crust in the Lianyungang area has been rising [59], sea level rise has little effect on the erosion of the sandy coast of the Xiuzhen–Xingzhuang estuary. The degree of sea level rise erosion on the silty muddy coast is less than the strong siltation process. In 2020, the largest area of seawater intrusion is in Dafeng county and Dongtai county with the maximum areas of 224 km2 and 228 km2 and the maximum intrusion distances of 6.36 km and 6.2 km, respectively. The sea surface in the Binhai and Xiangshui areas is relatively stable and less affected by ocean dynamics. Compared with Dafeng and Dongtai counties, Xiangshui and Binhai counties are less affected by seawater intrusion. The maximum intrusion distances in the two places are 2.8 km and 1.6 km, respectively, and the maximum intrusion areas are 47 km2 and 33 km2, respectively. According to the tide level data of Dafeng estuary, the interannual tide level trend line of Binhai estuary is between 180 cm and 220 cm, while the change oinf interannual tide level trend line of Dafeng county is between 330 cm and 380 cm. The water level in the first half of the year is lower than that in the second half of the year. The results show that the Dongtai and Dafeng are subjected to greater ocean dynamics than the Binhai and Xiangshui counties. In the tidal hydrodynamic environment, the tidal flats rapidly advance to the sea. The protection of beach vegetation covers the impact of erosion [60], and the coastline moves seaward.
4.5. Impact of Human Activities
4.5.1. Impact of Land Use Change
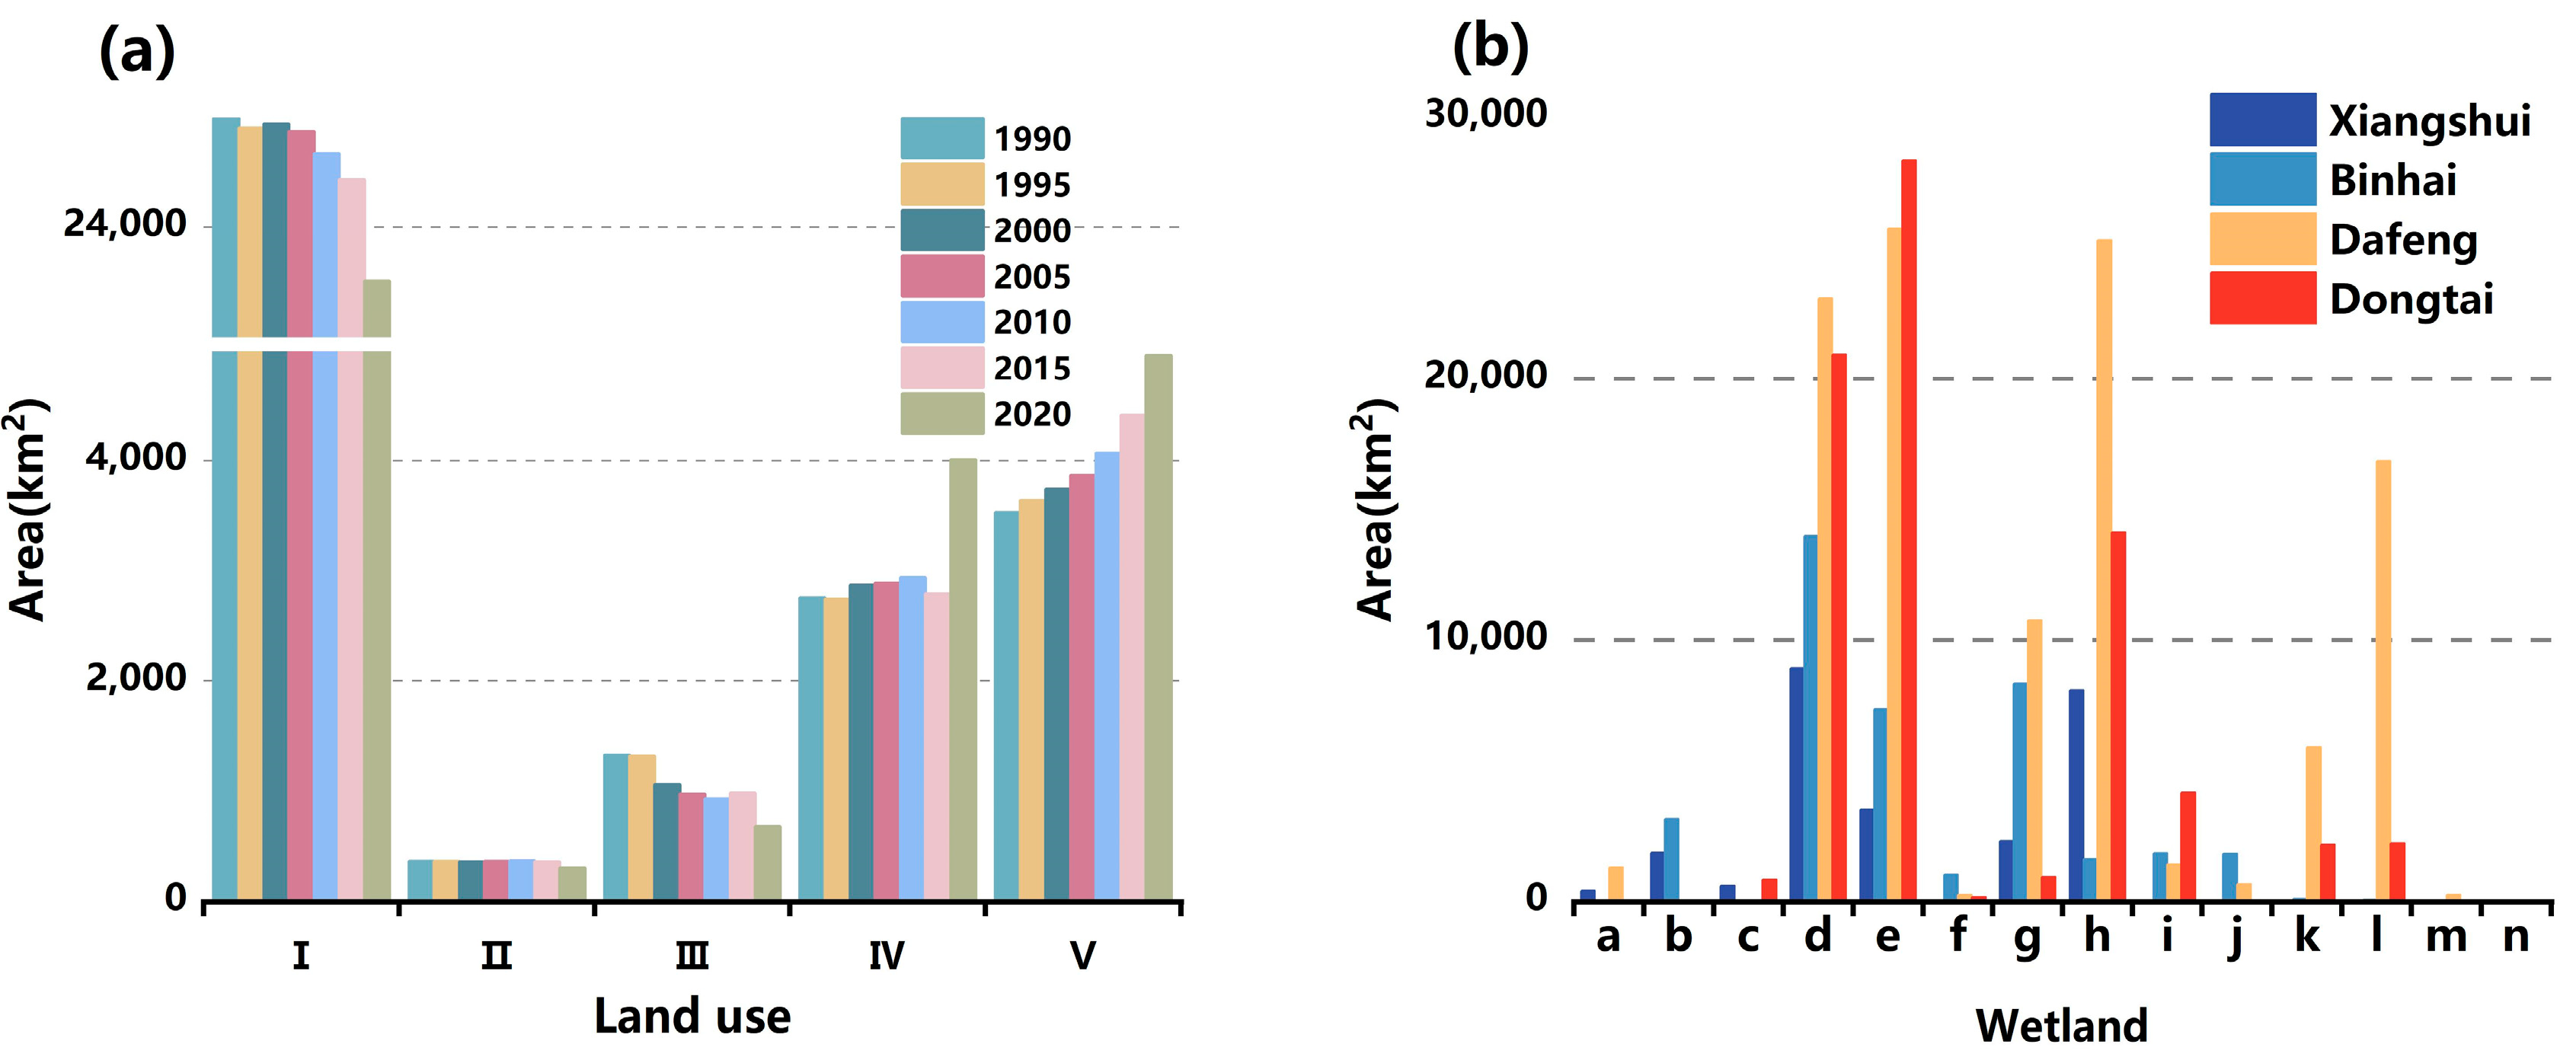
Figure 13 shows the change in coastal land use in Jiangsu. The proportion of each land use type from high to low is cultivated land, construction land, water land, grass land and wood land. From 1990 to 2020, the construction land area increased from 3536 km2 in 1990 (accounting for 10.7% of the total area) to 4961 km2 in 2020 (14.8% of the total area). The areas of cultivated land and grassland showed a decreasing trend. From 1990 to 2020, the area of cultivated land and grassland decreased from 24,993 km2 (75.7%) to 23,516 km2 (70.2%), water area and construction land showed an overall upward trend, from 2761 km2 to 23,516 km2 (70.2%), and from 3536 km2 (10.7%) to 4961 km2 (14.8%), respectively. The embankment area increased to 539 km2. The change in wood land area was small between 305 km2 and 364 km2. A total of 1127 km2 was converted from construction land to cultivated land and grassland. Correspondingly, 2116 km2 (13%) of arable land/grassland were converted to construction land, the construction land in the coastline area showed an upward trend, and the embankment area increased to 539 km2. Among them, Xiangshui, coastal shoals and breeding areas were relatively large. The area of light beach and breeding area in Xiangshui county is 89.33 km2 and 80.67 km2, respectively, and the area of light beach and breeding area in Binhai county is 139.8 km2 and 16.26 km2, respectively. Dafeng flat beach, aquaculture area and sea area are relatively large with 209.35 km2, 283.49 km2 and 141.06 km2, respectively, and reeds and Spartina alterniflora are widely distributed. The flat beach, breeding area, sea area and Spartina alterniflora in Dongtai account for a large proportion of the wetland ecosystem. The turbidity and silting in Dafeng and Dongtai areas enter the coast and continue to silt under the accumulation of sediment. The Jiangsu government introduced plants that moisten and remove silt. The coast is protected and the rate of coastline siltation slowed down [61]. After 2000, due to construction, paddock breeding and other projects, the area of the coastal zone increased by 428 km2, but the rate of increase in tidal flat erosion slowed down. In recent years, Jiangsu’s coastal development has become a national strategic development goal, and the pressure on land reclamation, embankment relief, and port and wharf construction increased.
4.5.2. Embankment Construction and Human Reclamation
The signs of coastline changes can be selected according to certain standards, such as high tide line, low tide line, dry and wet line, sea and land boundary line, beach water edge line, etc. Here, the coastal reclamation is analyzed based on the coastline and embankment changes extracted by GEE. There are dikes that are continuously built towards the sea along the Jiangsu coast, and these embankments include estuary, culture pond, revetment, etc. They are well-characterized on remote sensing images and easy to interpret visually. The construction of dikes and embankment is mainly controlled by human beings, and most of them are built according to economic needs. The expansion of most dikes and dams reflects the trend of coastal siltation [62].
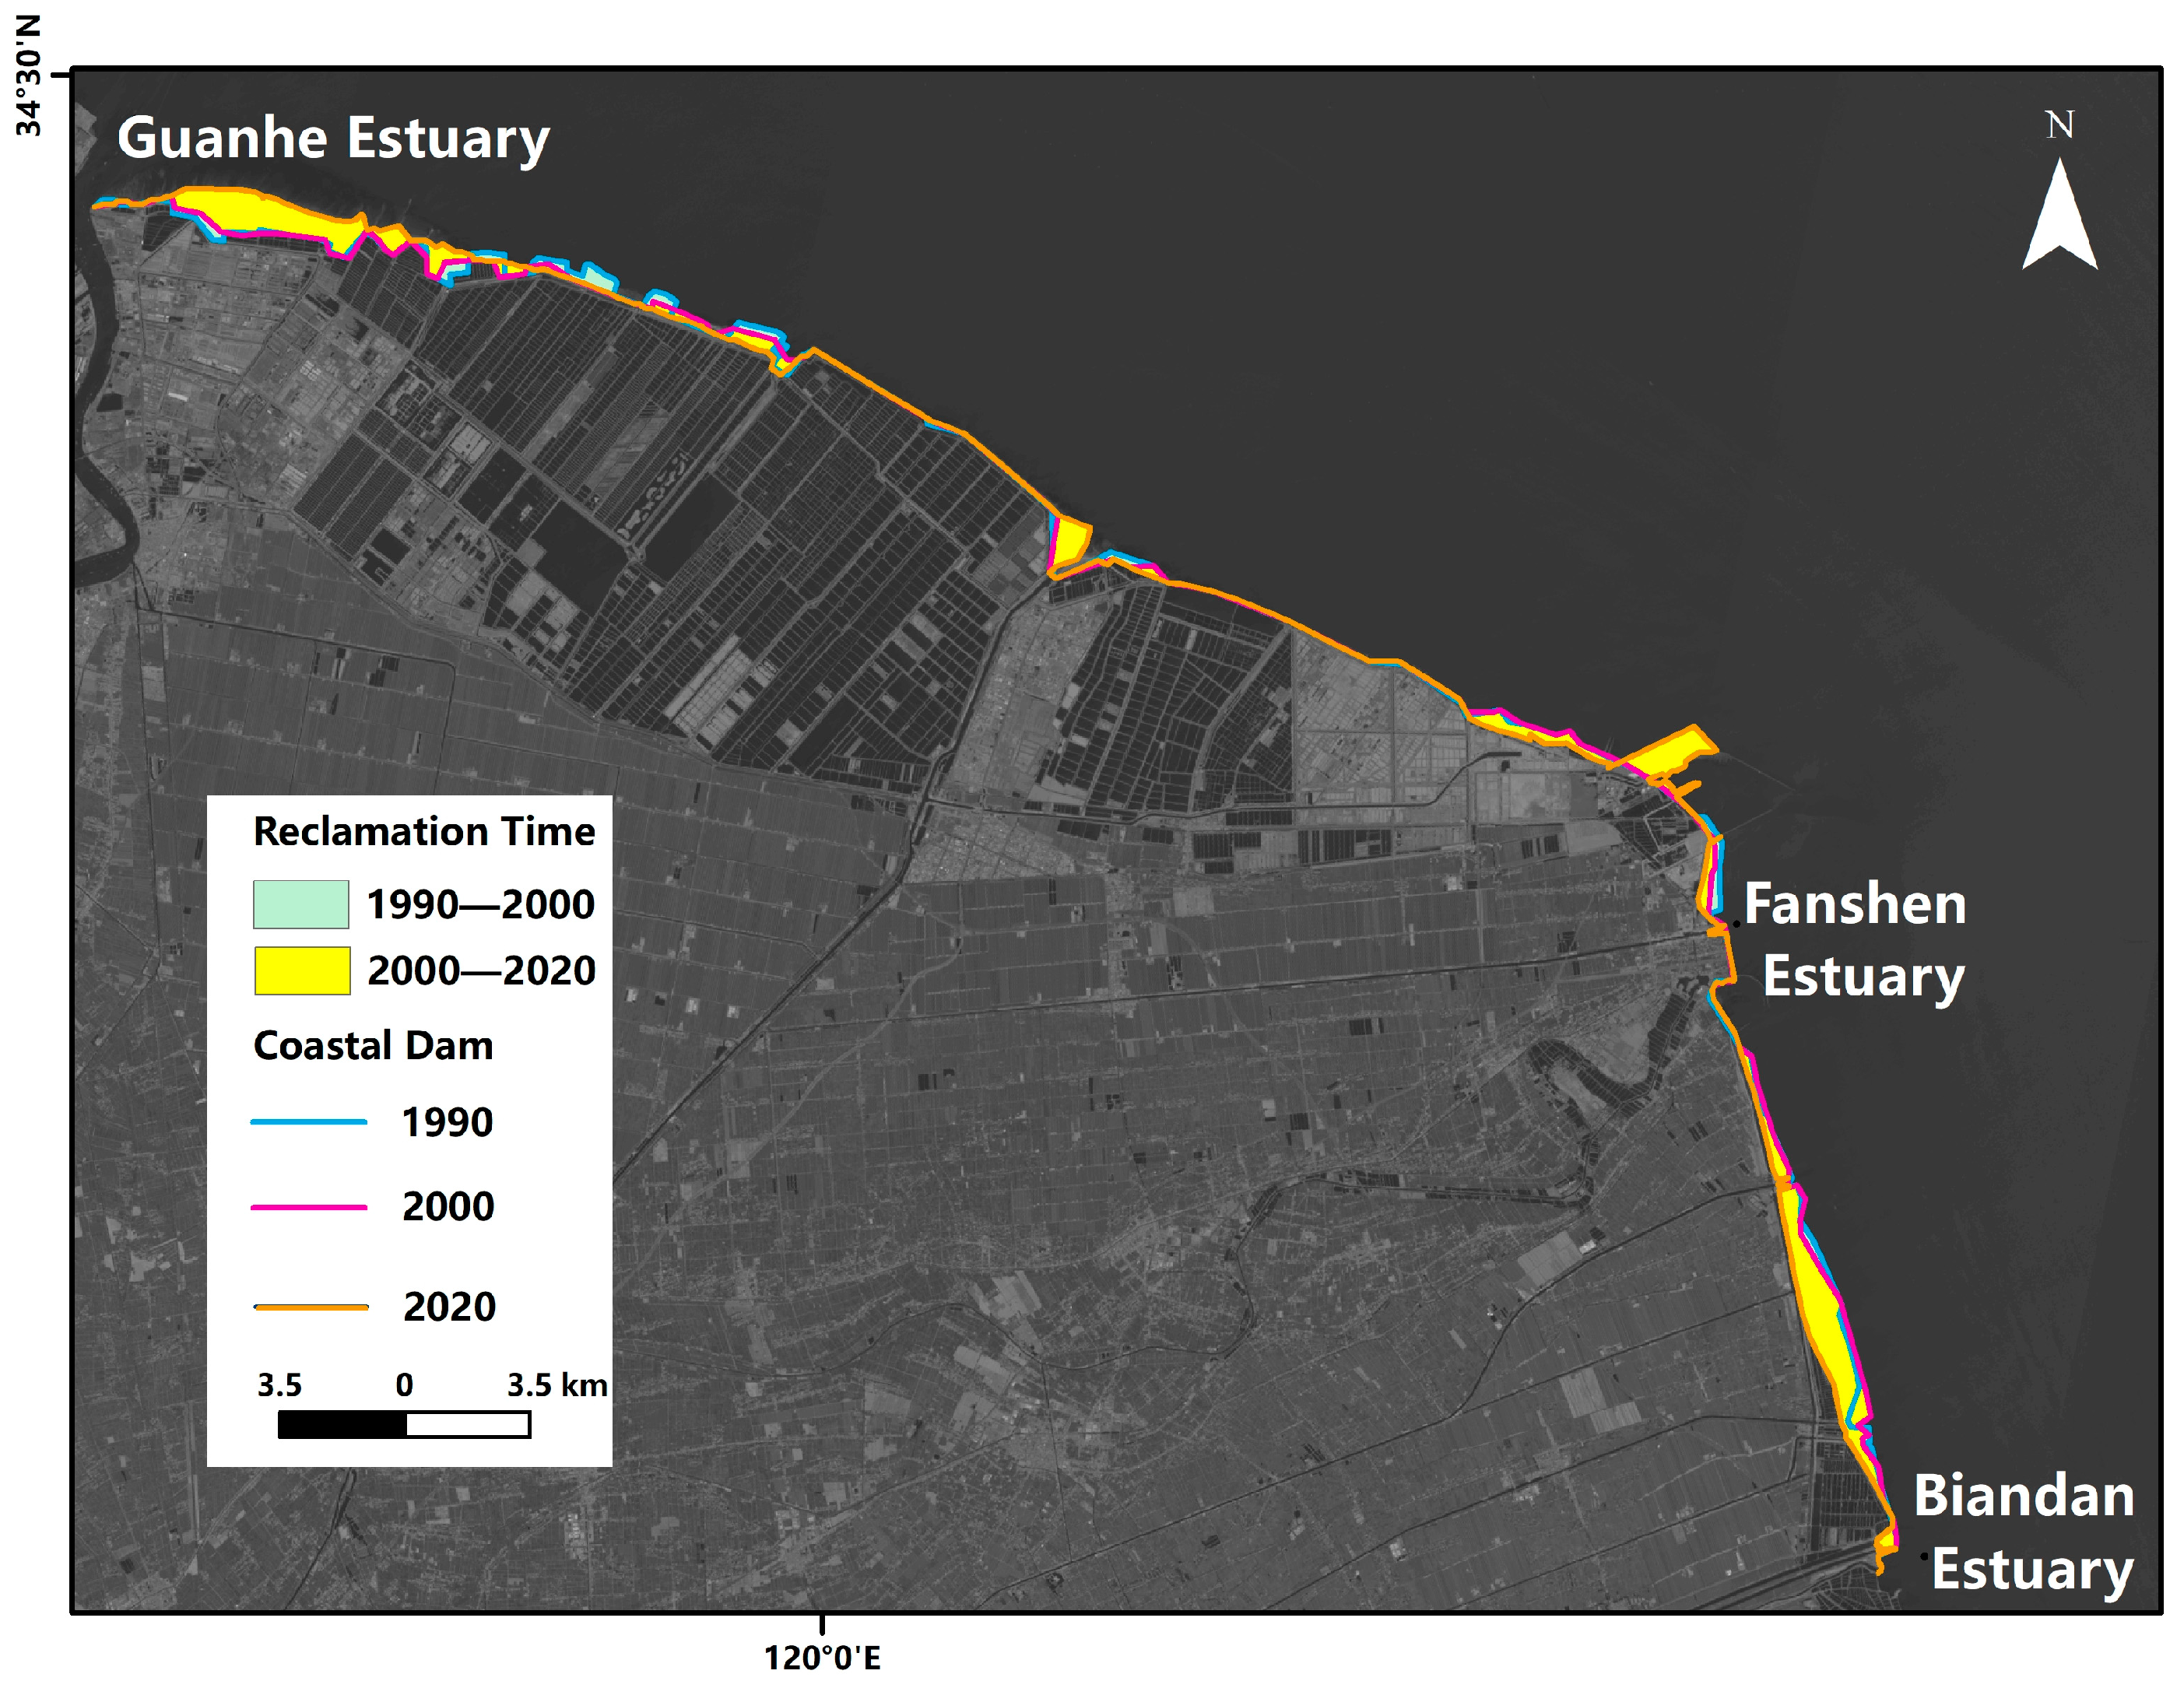
According to the analysis of the reclamation of the abandoned Yellow River mouth in the three periods of 1990–2000, 2000–2010, and 2010–2020 (Figure 14), 6.20 km2 of tidal flats were reclaimed in the Guanhe–Fanshen estuary from 1990 to 2000, of which the tidal flats in the Guanhe–Biandan estuary constituted 4.67 km2 and 1.53 km2 in the Biandan–Guanhe estuary, respectively. The tidal flat reclamation area of Guanhe–Fanshen estuary was 20.59 km2 from 2000 to 2020, of which the tidal flat reclamation area in the Guanhe–Biandan estuary constituted 13.06 km2, and 7.52 km2 in the Biandan–Guanhe estuary, respectively.
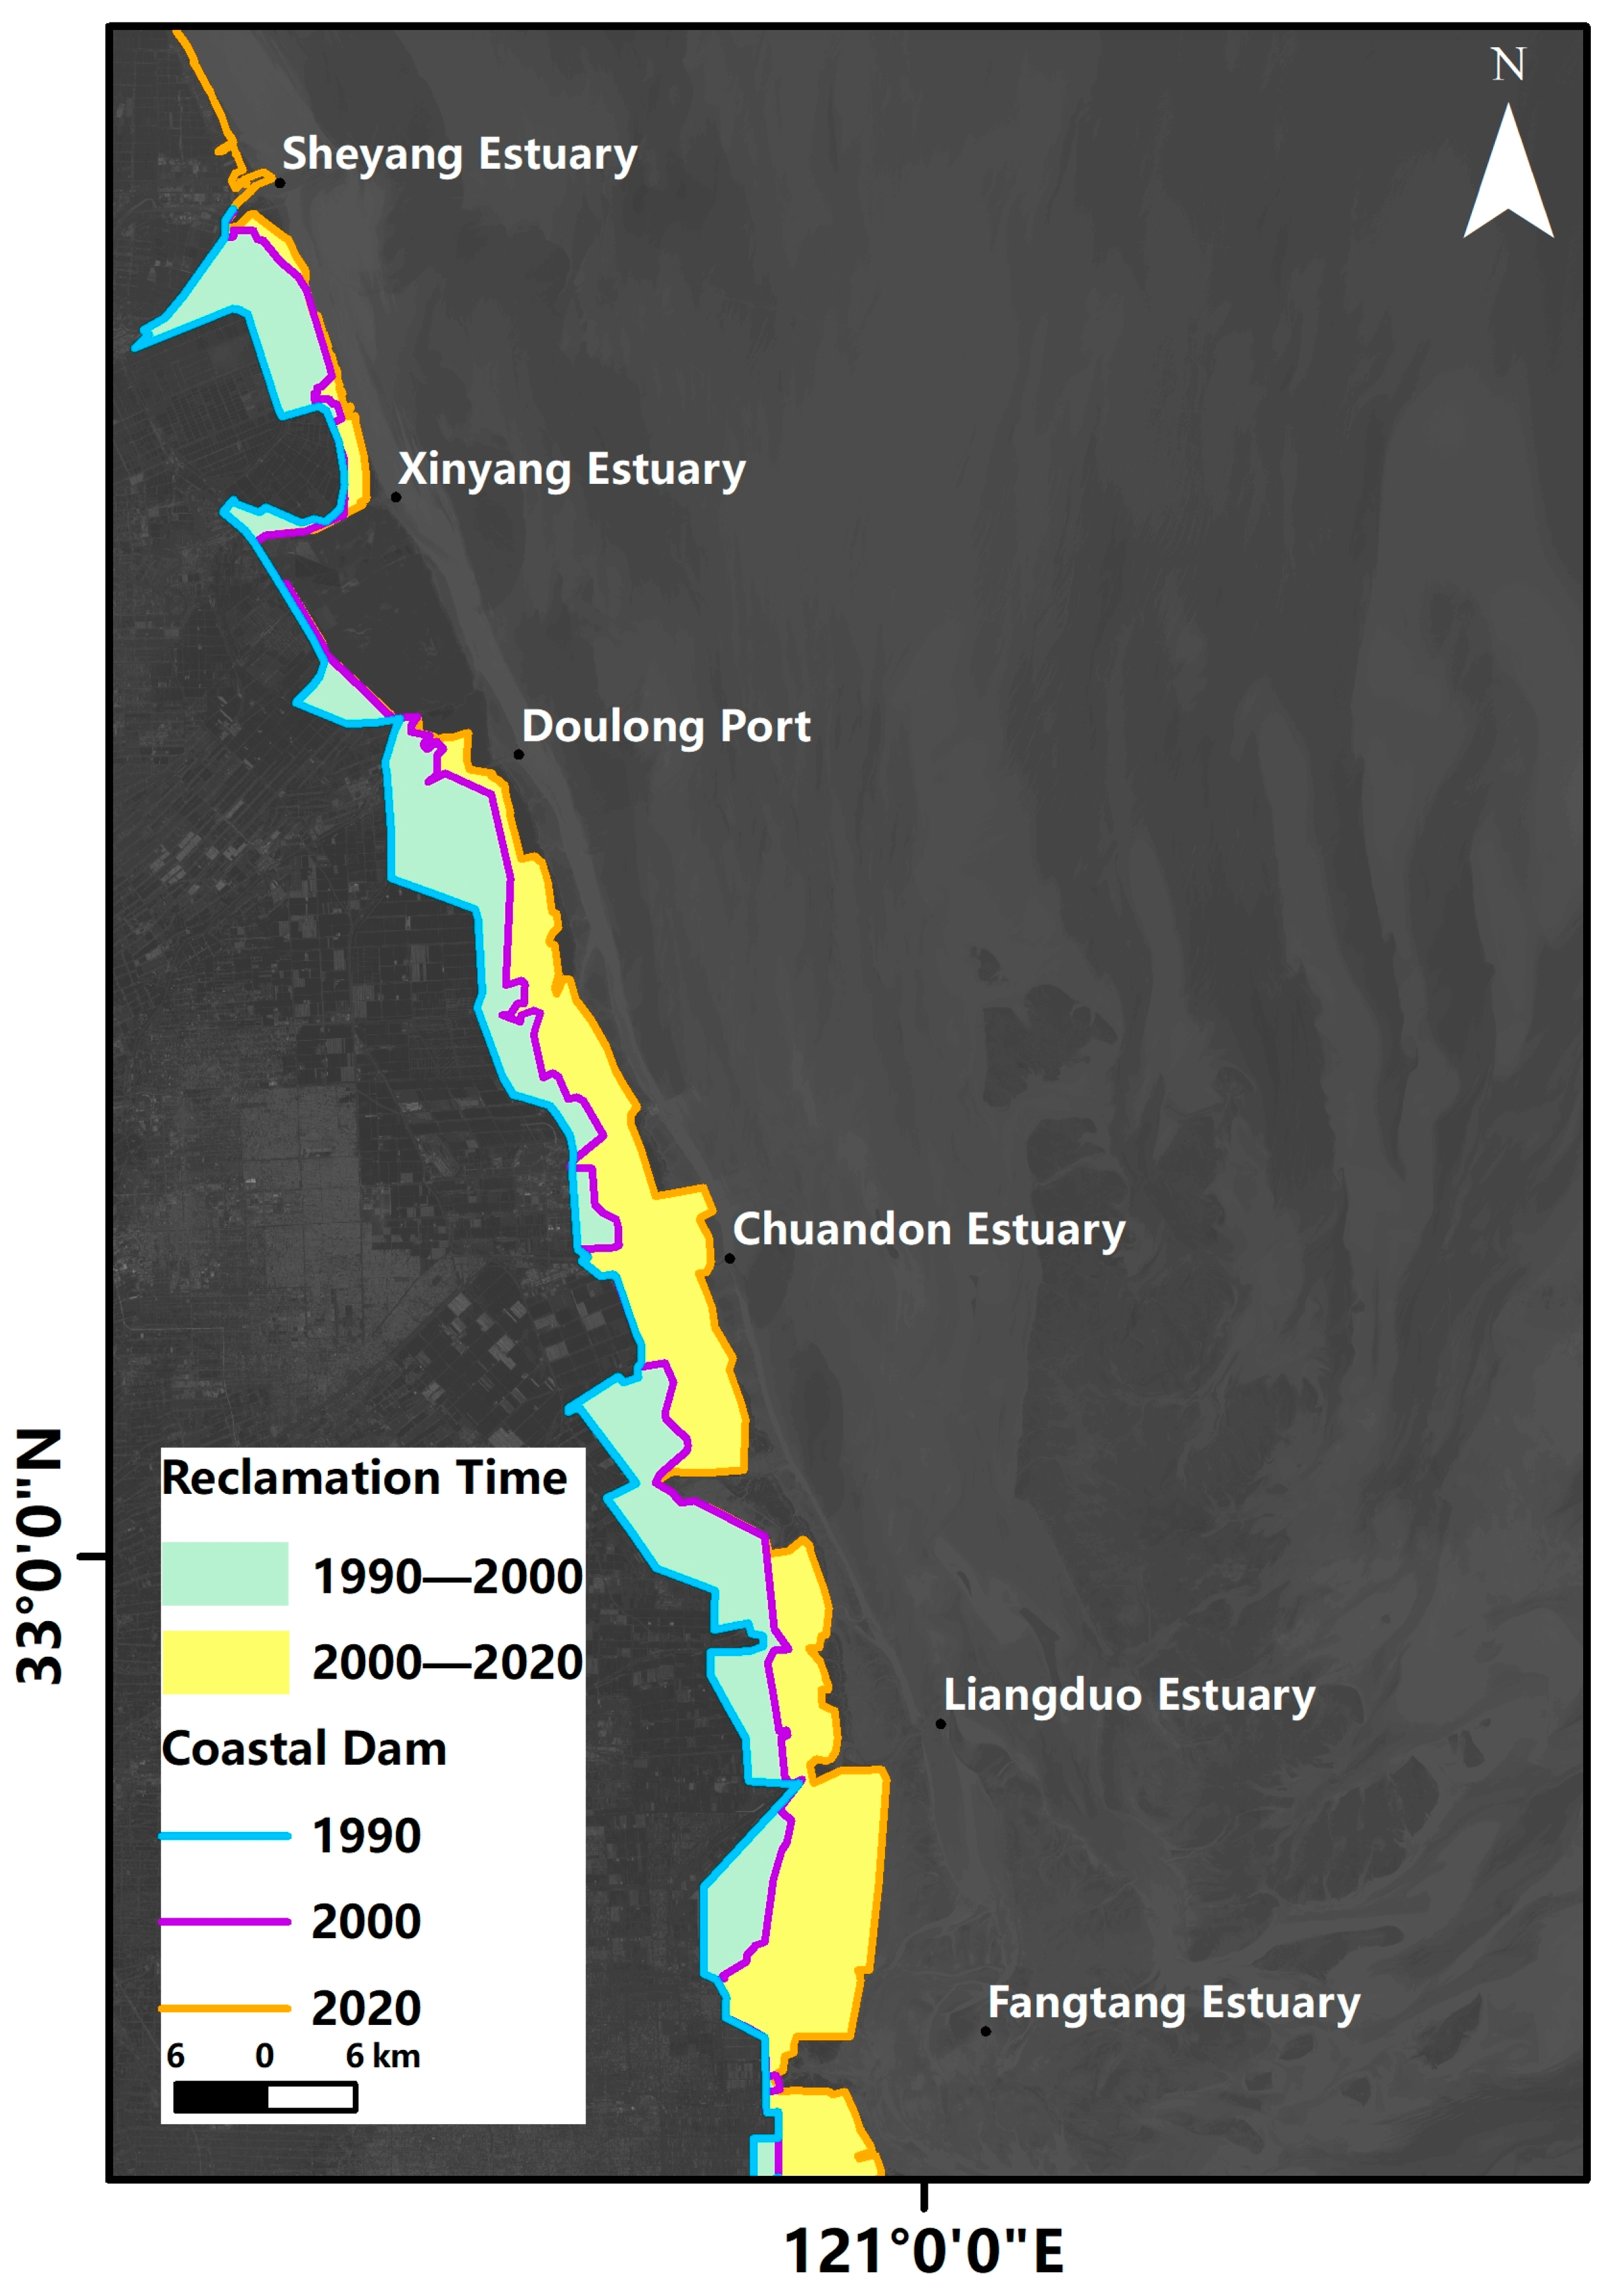
The reclamation activities mainly occurred on the coast north of the Fangtang estuary (Figure 15). From 1990 to 2000, the area of reclamation in the study area was 399.35 km2 out of the reclamation area of 629.44 km2 over the last 35 years. The reclamation area between Sheyang and Doulong estuary was relatively small with 108.73 km2 from 1990 to 2020. Due to the northward erosion of sediments, there is a large area of salt marsh wetland in the Xinyang–Doulong coast section which has been less affected by human reclamation since 2000. The reclamation of the Doulong–Fangtang estuary changed drastically. The reclamation area in 1990–2000 and 2000–2020 was 278.29 km2 and 380.03 km2, respectively. The external tidal flats of artificial coastlines in the early stage of reclamation were generally silted. The seawall weakened the tidal current bearing capacity, resulting in continuous siltation of sediment in front of the embankment, leading to gradual siltation of the upper part of the new tidal flat section. The evolution pattern of “upward siltation and downward intrusion” formed around the transition zone is the geomorphic response mode of coastal tidal flat reclamation activities [63]. The siltation in the upper section was further advanced, and a new coastline gradually formed, but human reclamation activities promoted the coastline to advance to the sea to a certain extent and caused the erosion of tidal flats in front of the coastline. The muddy coastal environment provides favorable conditions for inland reclamation.
4.5.3. Variation of Nighttime Lighting
Remotely sensed nighttime lighting was used to map patterns of spatially expanded human settlements and economic activity during urban expansion. The data provide different brightness in the form of Digital Number (DN: Light gray value) values from 0 to 63. For the nighttime light data, we used the DN value of the data as a proxy for the nighttime lighting intensity based on the nighttime temporal and spatial characteristics of light illumination according to Chu et al. (2020). The night lighting areas in 1995, 2000, 2005, 2010, 2015, and 2020 were divided into five types of (1) high night lighting areas (DN > 56), (2) medium–high night lighting areas (51 < DN < 56), (3) medium night lighting areas (33 < DN < 50), (4) medium–low night lighting areas (13 < DN < 32), and (5) low night lighting area (DN < 12) to indicate the spatial and temporal distribution of human settlements and economic expansion for comparative analysis with coastline change area. We calculated the pixel proportion in each of the five types of nighttime light areas. Figure 14 shows nighttime light change along the Jiangsu coast. The increase in human activities on the land suggests a possible link between human activities and siltation changes. The entire area dominated by low nighttime illumination areas (areas of low or no human activities) was large in the first two time periods and the areas of high illumination (areas of intense human activities) increased significantly. In particular, the low nighttime lighting intensity area decreased from 90% to 60%, especially from 2010 to 2020 (Figure 16).
4.6. Limitation and Future Studies
In this study, annual mean coastlines were extracted and causes for the variability and possible evolutions were analyzed by averaging the instantaneous coastline positions registered during the same year. However, with the intensification of the global warming process, the increase in extreme sea level rise events, frequent human activities, and the dynamic mechanism of coastlines are more complex and variable. Discussion on limitations of the present study and potential future studies is necessary.
The existence of many thin clouds affects the extraction of coastline based on remote sensing images. While extracting the coastline is more convenient than the traditional methods, it is still difficult to identify tidal flats on remote sensing images due to the presence of large amount of sediment. In addition, there are certain errors in the coastlines extracted by superposition of various algorithms and further manual corrections are required to meet the accuracy requirements. Among them, visual interpretation uses limited historical coastline data to estimate the change trend in the coastline, and the limitations of the data should also be recognized.
The process of coastline change involves multiple dynamic processes, and the uncertainty or location impact of changes in coastal provenance conditions under extreme sea conditions still needs to be further studied. In particular, the impact of storms and sandstorms on the coastline can last for several years or even decades or longer. Quantitative impact of extreme sea condition warrants future studies.
5. Conclusions
Jiangsu coast is a key area of the national experimental zones for comprehensive ocean development. In this study, we used the GEE to extract Jiangsu coastline information from 1985 to 2020 to determine the coastline type, annual change rate, land area, fractal dimension, spatial and temporal shift of the center of gravity and their contributing factors. The main findings are as follows.
(1) From 1985 to 2020, the current situation of Jiangsu coastline is dominated by artificial coastlines. The proportion of artificial coastlines increased from 14% in 1985 to 77% in 2020. From 1985 to 2020, the fractal dimension of coastlines increased from 1.04 to 1.09. In 2020, it moved 5.13 km in the direction of 61° northwest. From 1985 to 2020, the maximum silting speed of the coastline to the sea reached 800 m/a, and the change in the coastline can be divided into two stages: phases of natural change from 1985 to 2000 and phases of human-induced change from 2000 to 2020. Overall, modern coastlines are influenced by human activities that generally push the coastline out to sea. The coastal zone of Jiangsu presents the erosion-silting characteristics of stability–strong erosion–weak erosion–strong siltation–weak siltation–weak erosion from north to south.
(2) The coastline of mainland Jiangsu underwent dramatic changes under the dual influence of natural and human factors. Before 2000, the coastline of Jiangsu suffered more from natural impacts than human activities, especially in the central part of Jiangsu, while the bedrock coastline in the Lianyungang area of northern Jiangsu was less impacted by natural factors. After 2000, the development of the Jiangsu coastal zone intensified, and human activities exceeded the influence of natural factors, mainly planting Spartina alterniflora and reclamation of coastal dams.
Author Contributions
Methodology, G.Z.; Writing—original draft, L.H.; Writing—review & editing, C.Z. and J.Z.; Supervision, C.J. All authors have read and agreed to the published version of the manuscript.
Funding
This research received no external funding.
Data Availability Statement
Not applicable.
Acknowledgments
The authors of this study would like to express their appreciation to the key project of the National Natural Science Foundation (42130405) and the Innovative and Entrepreneurial Talent Program of Jiangsu Province (R2020SC04) for sponsorship.
Conflicts of Interest
The authors declare no conflict of interest.
References
- Boak, E.H.; Turner, I.L. Shoreline Definition and Detection: A Review. J. Coast. Res. 2005, 21, 688–703. [Google Scholar] [CrossRef]
- Mujabar, P.S.; Chandrasekar, N. Shoreline change analysis along the coast between Kanyakumari and Tuticorin of India using remote sensing and GIS. Arab. J. Geosci. 2013, 6, 647–664. [Google Scholar] [CrossRef]
- Syvitski, J.P.M. Predicting the terrestrial flux of sediment to the global ocean: A planetary perspective. Sediment. Geol. 2004, 162, 5–24, Erratum in Sediment. Geol. 2004, 164, 345. [Google Scholar] [CrossRef]
- Frihy, O.E.; Dewidar, K.M. Patterns of erosion/sedimentation, heavy mineral concentration and grain size to interpret boundaries of littoral sub-cells of the Nile Delta, Egypt. Mar. Geol. 2003, 199, 27–43. [Google Scholar] [CrossRef]
- Thanh, T.D.; Saito, Y.; Huy, D.V.; Nguyen, V.l.; Ta, T.K.O.; Tateishi, M. Regimes of human and climate impacts on coastal changes in Vietnam. Reg. Environ. Chang. 2004, 4, 49–62. [Google Scholar] [CrossRef]
- Primavera, J.H. Overcoming the impacts of aquaculture on the coastal zone. Ocean Coast. Manag. 2006, 49, 531–545. [Google Scholar] [CrossRef]
- Frihy, O.E. Nile Delta Shoreline Changes: Aerial Photographic Study of a 28-Year Period. J. Coast. Res. 1988, 4, 597–606. [Google Scholar]
- Cracknell, A.P. Remote sensing techniques in estuaries and coastal zones an update. Int. J. Remote Sens. 1999, 20, 485–496. [Google Scholar] [CrossRef]
- Solomon, S.M. Spatial and temporal variability of shoreline change in the Beaufort-Mackenzie region, northwest territories, Canada. Geo-Mar. Lett. 2005, 25, 127–137. [Google Scholar] [CrossRef]
- Chen, L.-C.; Rau, J.-Y. Detection of shoreline changes for tideland areas using multi-temporal satellite images. Int. J. Remote Sens. 1998, 19, 3383–3397. [Google Scholar] [CrossRef]
- Heidler, K.; Mou, L.; Baumhoer, C.; Dietz, A.; Zhu, X.X. HED-UNet: Combined segmentation and edge detection for monitoring the Antarctic coastline. IEEE Trans. Geosci. Remote Sens. 2021, 60, 1–14. [Google Scholar] [CrossRef]
- Seale, C.; Redfern, T.; Chatfield, P.; Luo, C.; Dempsey, K. Coastline detection in satellite imagery: A deep learning approach on new benchmark data. Remote Sens. Environ. 2022, 278, 113044. [Google Scholar] [CrossRef]
- Hu, X.; Wang, Y. Monitoring coastline variations in the Pearl River Estuary from 1978 to 2018 by integrating Canny edge detection and Otsu methods using long time series Landsat dataset. Catena 2022, 209, 105840. [Google Scholar] [CrossRef]
- Gorelick, N.; Hancher, M.; Dixon, M.; Ilyushchenko, S.; Thau, D.; Moore, R. Google Earth Engine: Planetary-scale geospatial analysis for everyone. Remote Sens. Environ. 2017, 202, 18–27. [Google Scholar] [CrossRef]
- Luijendijk, A.P.; Hagenaars, G.; Ranasinghe, R.; Baart, F.; Donchyts, G.; Aarninkhof, S.G.J. The State of the World’s Beaches. Sci. Rep. 2018, 8, 6641. [Google Scholar] [CrossRef] [PubMed]
- Hagenaars, G.; Luijendijk, A.P.; de Vries, S.; de Boer, W.P. Long Term Coastline Monitoring Derived from Satellite Imagery. 2017. Available online: http://resolver.tudelft.nl/uuid:34a0114b-5e39-4b52-9940-3a7e9f5a2982 (accessed on 20 April 2023).
- Li, X.; Damen, M.C.J. Coastline change detection with satellite remote sensing for environmental management of the Pearl River Estuary, China. J. Mar. Syst. 2010, 82, S54–S61. [Google Scholar] [CrossRef]
- Cui, B.-L.; Li, X.-Y. Coastline change of the Yellow River estuary and its response to the sediment and runoff (1976–2005). Geomorphology 2011, 127, 32–40. [Google Scholar] [CrossRef]
- Liu, Y.; Huang, H.; Qiu, Z.; Fan, J. Detecting coastline change from satellite images based on beach slope estimation in a tidal flat. Int. J. Appl. Earth Obs. Geoinf. 2013, 23, 165–176. [Google Scholar] [CrossRef]
- Kirui, K.B.; Kairo, J.G.; Bosire, J.O.; Viergever, K.; Rudra, S.; Huxham, M.; Briers, R.A. Mapping of mangrove forest land cover change along the Kenya coastline using Landsat imagery. Ocean Coast. Manag. 2013, 83, 19–24. [Google Scholar] [CrossRef]
- Bishop-Taylor, R.; Nanson, R.; Sagar, S.; Lymburner, L. Mapping Australia’s dynamic coastline at mean sea level using three decades of Landsat imagery. Remote Sens. Environ. 2021, 267, 112734. [Google Scholar] [CrossRef]
- Chen, C.; Liang, J.T.; Xie, F.; Hu, Z.J.; Sun, W.W.; Yang, G.; Yu, J.; Chen, L.; Wang, L.H.; Wang, L.Y.; et al. Temporal and spatial variation of coastline using remote sensing images for Zhoushan archipelago, China. Int. J. Appl. Earth Obs. Geoinf. 2022, 107, 102711. [Google Scholar] [CrossRef]
- Hou, X.Y.; Wu, T.; Wang, Y.D.; Xu, X.L.; Chen, Q.; Yu, L.J. Extraction and accuracy evaluation of multi-temporal coastlines of mainland china since 1940s. Mar. Sci. 2014, 38, 66–73. [Google Scholar]
- Hu, D.X. Upwelling and sedimentation dynamics. Chin. J. Oceanol. Limnol. 1984, 2, 12–19. [Google Scholar]
- Dong, L.X.; Guan, W.; Chen, Q.; Li, X.; Liu, X.; Zeng, X. Sediment transport in the Yellow Sea and East China Sea. Estuar. Coast. Shelf Sci. 2011, 93, 248–258. [Google Scholar] [CrossRef]
- Zhang, J.; Lu, X.; Wang, P.; Wang, Y.P. Study on linear and nonlinear bottom friction parameterizations for regional tidal models using data assimilation. Cont. Shelf Res. 2011, 31, 555–573. [Google Scholar] [CrossRef]
- Clinton, N. Otsu’s Method for Image Segmentation. In Google Earth and Earth Engine. 2017. Available online: https://medium.com/google-earth/otsus-method-for-image-segmentation-f5c48f405e (accessed on 20 April 2023).
- Huang, C.; Wylie, B.K.; Yang, L.; Homer, C.G.; Zylstra, G.J. Derivation of a tasselled cap transformation based on Landsat 7 at-satellite reflectance. Int. J. Remote Sens. 2002, 23, 1741–1748. [Google Scholar] [CrossRef]
- Liebovitch, L.S.; Tóth, T.I. A fast algorithm to determine fractal dimensions by box counting. Phys. Lett. A 1989, 141, 386–390. [Google Scholar] [CrossRef]
- Gong, M. Reclamation Evolution of Shandong Province and Its Influence on Natural Coastline Resources. Master’s Thesis, University of Chinese Academy of Sciences, Beijing, China, 2020. [Google Scholar]
- Xie, X.M.; Li, S.; Zhang, C.; Li, M.G.; Yao, S.S.; Li, W.D. Numerical Modling of Shoreline Evolution After Harbor Construction at Strong Longshore Sediment Transport Coast. China Harb. Eng. 2017, 37, 7. [Google Scholar]
- Zhu, W.J.; Wang, N.; Zhao, Q.H.; Dong, X.T.; Shen, N.B. Analysis of Erosion and Sedimentation Variation Characteristics of Muddy Coastline in Central Jiangsu from 1984 to 2019. J. Jiangsu Ocean Univ. (Nat. Sci. Ed.) 2020, 29, 58–63. [Google Scholar]
- Ren, M.E.; Xu, T.G.; Zhu, J.W. Comprehensive Survey of Coastal Zone and Tidal Flat Resources in Jiangsu Province; China Ocean Press: Beijing, China, 1986. [Google Scholar]
- Zhang, R.S. Suspended sediment transport processes on tidal mud flat in Jiangsu Province, China. Estuar. Coast. Shelf Sci. 1992, 35, 225–233. [Google Scholar]
- Zhou, L.; Liu, J.; Saito, Y.; Zhang, Z.; Chu, H.; Hu, G. Coastal erosion as a major sediment supplier to continental shelves: Example from the abandoned Old Huanghe (Yellow River) delta. Cont. Shelf Res. 2014, 82, 43–59. [Google Scholar] [CrossRef]
- Choi, B.H.; Fang, G. A Review of Tidal Models for the East China and Yellow Seas. J. Korean Soc. Coast. Ocean. Eng. 1993, 5, 151–171. [Google Scholar]
- Wang, Y.P.; Gao, S.; Jia, J.; Thompson, C.; Gao, J.H.; Yang, Y. Sediment transport over an accretional intertidal flat with influences of reclamation, Jiangsu coast, China. Mar. Geol. 2012, 291, 147–161. [Google Scholar] [CrossRef]
- Wang, Y.W.; Wang, Y.P.; Yu, Q.; Du, Z.; Wang, Z.B.; Gao, S. Sand-mud tidal flat morphodynamics influenced by alongshore tidal currents. Geophys Res. Ocean. 2019, 124, 3818–3836. [Google Scholar] [CrossRef]
- Chu, L.; Oloo, F.; Sudmanns, M.; Tiede, D.; Hölbling, D.; Blaschke, T.; Teleoaca, I. Monitoring long-term shoreline dynamics and human activities in the Hangzhou Bay, China, combining daytime and nighttime EO data. Big Earth Data 2020, 4, 242–264. [Google Scholar] [CrossRef]
- Yang, Y.T.; Bian, S.H. Discussion on coastline and its delineation method. Ocean Dev. Manag. 2007, 128, 34–35. [Google Scholar]
- Xu, N.; Gao, Z.Q.; Ning, J.C. Spatial-temporal variations of coastlines in Bohai Rim based on fractal dimension and their causes analysis. J. Mar. Sci. 2016, 34, 45–51. [Google Scholar]
- Wang, L.Y.; Li, P.; Li, S.H.; Jiao, H.B. Study on Coastline Extraction of High Spatial Resolution Images: Take the WorldView-2 Data for Example. Geomat. Spat. Inf. Technol. 2016, 39, 75–78. [Google Scholar]
- Wu, C.Y.; Chen, K.L.; Cao, G.C.; Duan, S.Q.; Xue, H.J.; E, C.Y.; Luo, Z.X. The spatial and temporal differences and driving forces of wind erosion climatic erosivity in Qinghai province from 1984 to 2013. Geogr. Res. 2018, 37, 717–730. [Google Scholar]
- Wang, M. Analysis the change of urban internal spatial structure based on the shift of city gravity in Dalian city. Territ. Nat. Resour. Study 2015, 4, 1–3. [Google Scholar]
- Huang, P.T.; Zhang, X.P. Analysis of temporal and spatial movement of the gravity center of city industry: A case study of Tianjin. Econ. Geogr. 2012, 32, 89–95. [Google Scholar]
- Thieler, E.R.; Himmelstoss, E.A.; Zichichi, J.L.; Ergul, A. The Digital Shoreline Analysis System (DSAS) Version 4.0—An ArcGIS Extension for Calculating Shoreline Change; US Geological Survey: Reston, VA, USA, 2009.
- Elvidge, C.D.; Ziskin, D.C.; Baugh, K.E.; Tuttle, B.T.; Ghosh, T.; Pack, D.W.; Erwin, E.H.; Zhizhin, M.N. A Fifteen Year Record of Global Natural Gas Flaring Derived from Satellite Data. Energies 2009, 2, 595–622. [Google Scholar] [CrossRef]
- Wang, J.F.; Xu, C.D. Geodetector: Principle and Prospective. Acta Geogr. Sin. 2017, 72, 116–134. [Google Scholar]
- Liu, C.; Shi, R.X.; Zhang, Y.H.; Shen, Y.; Ma, J.H.; Wu, L.Z.; Chen, W.B.; Tomoko, D.; Chen, L.J.; Lv, T.T.; et al. 2015: How Many Islands (IsIes, Rocks), How Larger Land Areas, and How Long of Shorelines in the World?—Vector Data Based on Google Earth Images. J. Glob. Chang. Data Discov. 2019, 3, 124–148. [Google Scholar]
- Cai, Z.J.; Wu, S.L. Remote sensing analysis of the coastline development in Jiangsu Province. Remote Sens. Land Resour. 2002, 14, 19–23. [Google Scholar]
- Yan, Q.; Liu, R.; Yi, M. Remote sensing analysis of shoreline changes along the coast near the Sheyang River Estuary of Jiangsu Province since 1973. Mar. Sci. 2015, 39, 94–100. [Google Scholar]
- Chen, H. Recent trend and protection of delta coast of old Yellow River estuary in Northern Jiangsu. Mar. Sci. Bull. 1991, 10, 59–65. [Google Scholar]
- Qin, P.; Xie, M.; Chen, S.L.; Chung, C.H. The dynamics of energy content in artificial vegetation of Spartina alterniflora in Binhai County, Jiangsu province. J. Nanjing Univ. 1994, 30, 488–493. [Google Scholar]
- Wang, J.; Zhong, Q. Conservation and countermeasures of biodiversity in the Yancheng Natural Reserve. J. Anhui Norm. Univ. (Nat. Sci.) 2006, 5, 475–479. [Google Scholar]
- Zhang, R.S.; Shen, Y.M.; Lu, L.Y.; Yan, S.G.; Wang, Y.H.; Li, J.L.; Zhang, Z.L. Formation of Spartina alterniflora Salt Marsh on Jiangsu Coast, China. Oceanol. Limnol. Sin. 2005, 4, 358–366. [Google Scholar]
- Qiu, G.L. The impact of human activities on the historical changes of the northern Jiangsu coastline. Kejifeng 2012, 24, 231–233. [Google Scholar]
- Zhang, R.S. Land-Forming History of the Huanghe River Delta and Coastal Plain of North Jiangsu. Acta Geogr. Sin. 1984, 39, 173–184. [Google Scholar]
- Zhang, Z.; Chen, P.; Mao, S.F.; Chang, M. Analysis of coastline changes and the influencing factorsin Yancheng inthelast 20 years. Trans. Oceanol. Limnol. 2022, 44, 136–142. [Google Scholar]
- Wang, X.; Yan, F.; Su, F. Changes in coastline and coastal reclamation in the three most developed areas of China 1980–2018. Ocean Coast. Manag. 2021, 204, 105542. [Google Scholar] [CrossRef]
- Chen, H.Y. The role of Spartina alterniflora in the development of tidal flats in Jiangsu Province. Water Resour. Plan. Des. 2009, 27, 29–56. [Google Scholar]
- Tang, T.G.; Zhang, W.J. Disscussion of Ecological Engineering Benefits of Spartina spp. and Its Ecological Invasion. Strateg. Study CAE 2003, 3, 15–20. [Google Scholar]
- Zhou, L.Y.; Zhang, Z.X.; Lu, K. Shoreline Change and Reclamation of Silty Coast in Jiangsu Province during 1985–2002. Mar. Geol. Front. 2010, 26, 7–11. [Google Scholar]
- Li, M.L.; Wu, S.L.; Gong, X.L.; Yang, L.; Gou, F.G.; Li, J. Characteristics of coastline change under the influence of human activities in central Jiangsu Province from 1989–2019. Mar. Sci. 2022, 46, 60–68. [Google Scholar]
Figure 1.
Research methodology flowchart.

Figure 2.
Study area. Estuaries (From north to South, indicated by asterisk: Xiuzhen, Xingzhuang, Xishu, Shaoxiang, Guanhe, Fanshen, Biandan, Sheyang, Xinyang, Doulong, Chuandon, Liangduo, Fangtang, Beikan, Tuanjie, Haozhi, Lianxing. Rivers: ①: Ancient yellow river, ②: Huai River and Subei General Irrigation Canal, ③: Sheyang River, ④: Dongtai River, ⑤: Yangzi River).

Figure 3.
Jiangsu coastline extracted based on GEE ((a): Lianyungang; (b): Yancheng; (c): Nantong; (d): Coastline Verification).
Figure 3.
Jiangsu coastline extracted based on GEE ((a): Lianyungang; (b): Yancheng; (c): Nantong; (d): Coastline Verification).

Figure 4.
Natural and artificial coastline changes from 1985 to 2020. Estuaries (From north to South, indicated by asterisk: Xiuzhen, Xingzhuang, Xishu, Shaoxiang, Guanhe, Fanshen, Biandan, Sheyang, Xinyang, Doulong, Chuandon, Liangduo, Fangtang, Beikan, Tuanjie, Haozhi, Lianxing).
Figure 4.
Natural and artificial coastline changes from 1985 to 2020. Estuaries (From north to South, indicated by asterisk: Xiuzhen, Xingzhuang, Xishu, Shaoxiang, Guanhe, Fanshen, Biandan, Sheyang, Xinyang, Doulong, Chuandon, Liangduo, Fangtang, Beikan, Tuanjie, Haozhi, Lianxing).

Figure 5.
Fractal dimension and artificialization index of Jiangsu coastline from 1985 to 2020.

Figure 6.
1985–2020 Jiangsu coastline center of gravity shift.

Figure 7.
Spatial variation of the northern coastline from 1985 to 2020 (A: Xiuzhen B: Xingzhuang C: Xishu D: Shaoxiang E: Guanhe F: Fanshen G: Biandan H: Sheyang).
Figure 7.
Spatial variation of the northern coastline from 1985 to 2020 (A: Xiuzhen B: Xingzhuang C: Xishu D: Shaoxiang E: Guanhe F: Fanshen G: Biandan H: Sheyang).

Figure 8.
Spatial changes in the southern coastline from 1985 to 2020 (H: Sheyang I: Xinyang J: Doulong K: Chuandong L: Liangduo M: Fangtang N: Beikan O: Tuanjie P: Haozhi Q: Lianxing).
Figure 8.
Spatial changes in the southern coastline from 1985 to 2020 (H: Sheyang I: Xinyang J: Doulong K: Chuandong L: Liangduo M: Fangtang N: Beikan O: Tuanjie P: Haozhi Q: Lianxing).

Figure 9.
Variation and mechanism of siltation or erosion at different sections of Jiangsu coastline ((a): Rapid siltation and erosion of Jiangsu coastline in 35 years. Estuaries (From north to South) indicated by asterisk: Xiuzhen, Xingzhuang, Xishu, Shaoxiang, Guanhe, Fanshen, Biandan, Sheyang, Xinyang, Doulong, Chuandon, Liangduo, Fangtang, Beikan, Tuanjie, Haozhi, Lianxing; (b): Jiangsu Coastal Environment).

Figure 10.
Quantitative analysis of influencing factors ((a) single factor effect; (b) Interaction).
Figure 10.
Quantitative analysis of influencing factors ((a) single factor effect; (b) Interaction).

Figure 11.
The tidal flat profile and sediment runoff change map in the coastal zone of Jiangsu ((a) Yancheng Shore Profile Monitoring Section, (b) Section elevation of Xiangshui and Binhai counties, (c) Section elevation of Dongtai County, (d) Sediment runoff at Lijin hydrological station, (e) Sediment runoff at Lijin hydrological station).

Figure 12.
Tides and sea level changes ((a) Sea level rise along the Jiangsu coast; (b) Maximum distance and area of seawater intrusion in 2020; (c) 2020 Marina Harbor Tide Level; (d) Tide Level of Dafeng Port in 2020).
Figure 12.
Tides and sea level changes ((a) Sea level rise along the Jiangsu coast; (b) Maximum distance and area of seawater intrusion in 2020; (c) 2020 Marina Harbor Tide Level; (d) Tide Level of Dafeng Port in 2020).

Figure 13.
Land use and wetland changes in Jiangsu coastal zone ((a) Land use change I: Arable land II: Wood land III: Grass land IV: Water land V: Construction land; (b) Classification of wetlands in Xiangshui, Binhai, Dafeng and Dongtai in 2020. a: Rice grass, b: Arable land, c: PV land, d: Light beach, e: Sea area, f: Lake, g: Salt field, h: Breeding area, i: Unused land, j: Construction land, k: Spartina alterniflora, l: Reed, m: River, n: Woodland).

Figure 14.
Guanhe–Biandan estuary artificial reclamation.

Figure 15.
Sheyang–Fangtang estuary artificial reclamation.

Figure 16.
Nighttime lighting changes I: High night lighting II: Medium–high night lighting III: Mid night lighting IV: Medium–low night lighting V: Low night lighting.
Figure 16.
Nighttime lighting changes I: High night lighting II: Medium–high night lighting III: Mid night lighting IV: Medium–low night lighting V: Low night lighting.

Disclaimer/Publisher’s Note: The statements, opinions and data contained in all publications are solely those of the individual author(s) and contributor(s) and not of MDPI and/or the editor(s). MDPI and/or the editor(s) disclaim responsibility for any injury to people or property resulting from any ideas, methods, instructions or products referred to in the content. |
© 2023 by the authors. Licensee MDPI, Basel, Switzerland. This article is an open access article distributed under the terms and conditions of the Creative Commons Attribution (CC BY) license (https://creativecommons.org/licenses/by/4.0/).
Share and Cite
MDPI and ACS Style
Huang, L.; Zhao, C.; Jiao, C.; Zheng, G.; Zhu, J. Quantitative Analysis of Rapid Siltation and Erosion Caused Coastline Evolution in the Coastal Mudflat Areas of Jiangsu. Water 2023, 15, 1679. https://doi.org/10.3390/w15091679
AMA Style
Huang L, Zhao C, Jiao C, Zheng G, Zhu J. Quantitative Analysis of Rapid Siltation and Erosion Caused Coastline Evolution in the Coastal Mudflat Areas of Jiangsu. Water. 2023; 15(9):1679. https://doi.org/10.3390/w15091679
Chicago/Turabian StyleHuang, Lirong, Chengyi Zhao, Caixia Jiao, Guanghui Zheng, and Jianting Zhu. 2023. "Quantitative Analysis of Rapid Siltation and Erosion Caused Coastline Evolution in the Coastal Mudflat Areas of Jiangsu" Water 15, no. 9: 1679. https://doi.org/10.3390/w15091679
Note that from the first issue of 2016, this journal uses article numbers instead of page numbers. See further details here.