Article

Temporal Dynamics of the Hydropower Water Reservoirs of the Tocantins–Araguaia Basin, Brazil, Based on Remote Sensing and Hydrometeorological Station Datasets

by
Larissa Vieira Valadão
1,*,
Iara Resende da Fonseca
2,
Rejane Ennes Cicerelli
1,
Tati de Almeida
1,
Jeremie Garnier
1 and
Edson Eyji Sano
3
1
Instituto de Geociências, Universidade de Brasília, Brasília 70910-900, DF, Brazil
2
Departamento de Engenharia Civil e Ambiental, Universidade de Brasília, Brasília 70910-900, DF, Brazil
3
Brazilian Agricultural Research Corporation, Embrapa Cerrados, Planaltina 73301-970, DF, Brazil
*
Author to whom correspondence should be addressed.
Water 2023, 15(9), 1684; https://doi.org/10.3390/w15091684
Submission received: 23 December 2022 / Revised: 16 March 2023 / Accepted: 24 March 2023 / Published: 26 April 2023

Abstract

:
The Tocantins–Araguaia Basin covers an extensive area of Brazilian territory and has a water reservoir system installed in a cascade that is very important for water storage and hydropower production. There is concern about the use of this resource because of the current tendency of surface water reduction in the reservoir systems. Sustainable management can help to guarantee the water supply and the hydropower supply. However, accurate data on the monitoring parameters are required. This study aims to analyze which factors most influence the changes in the areas of water reservoirs and, subsequently, the changes in the water availability. Trends, correlations, and principal component analyses (PCAs) were used to assess the association between the areas of water reservoirs and the liquid evaporation, discharge, precipitation, and land use and land cover (LULC) in the basin. We observed that the precipitation did not decrease significantly. On the other hand, changes in the LULC and the areas of reservoirs were highly correlated with each other. The PCA also showed a strong association between meteorological factors and the areas of reservoirs. In conclusion, this study showed that reductions in the areas of water reservoirs are mostly related to deforestation and reduced reservoir discharge rather than climate change. This paper provides a straightforward approach to monitoring reservoir changes based on the tendencies of some parameters that are strongly correlated with reservoir changes.

Graphical Abstract

1. Introduction

Brazilian hydropower systems are characterized by large water reservoirs with multiyear regulation capabilities, and they are often arranged in cascades [1]. Hydropower plants are responsible for 65% of the electricity generation in Brazil; this is about four times higher than the percentage of electricity generation that hydropower plants are responsible for worldwide (16%) [2,3]. In 2020, the installed capacity of electricity generation by hydropower plants in Brazil was 104,205 MW; 13% of this capacity (12,992 MW) comes from seven cascade reservoirs located in the Tocantins–Araguaia Basin [3,4]. This basin has a drainage area of 767,000 km2, that includes savannah and tropical rainforest ecosystems that are very ecologically sensitive since they include large and highly biodiverse floodplains [5,6,7]. Nevertheless, this basin has been subject to large-scale degradation, especially over the last 40 years [5].
The water reservoirs that are created during the construction of dams for hydropower plants are also used for human and animal consumption, agricultural irrigation, industrial needs, tourism, and fishing, among other activities. The growing water demand requires a high water availability to support these multiple usages and to increase water security [8]. Irrigation represented 45% of the water consumption in 2020 and may represent 52% of water consumption in this region by 2040 [9]. To guarantee the future water supply and hydropower production, it is important to monitor reservoirs continuously to avoid the shortage of water resources and to produce sustainable public policies and efficient management [5,10].
Recent studies have relied on field and remote sensing datasets to monitor different aspects of water reservoirs, such as the water quality and reservoir metrics (e.g., flooded area, water level, and volume) [11,12,13,14,15,16,17,18]. Some of these studies intended to monitor large areas and/or long time series [19,20,21,22,23,24], yet very few of them integrated multiple parameters, including weather variations and land use and land cover (LULC) changes, into the analysis of the spatiotemporal dynamics of water reservoirs. Hydrological modeling is one of the approaches that can support the use of these variables. However, many models are sensitive to the model calibration and prone to uncertainties associated with the input data, parameters, and model structure [25,26,27].
The challenges of utilizing an integrated approach in Brazil are related to the spatially limited and uneven distribution of weather stations and rain gauges in Brazil [28]. In addition, until recently, LULC studies were sporadic. Satellite-based global precipitation data, such as the global precipitation measurement (GPM), represent a good alternative to using weather stations and rain gauges. The GPM data are freely available in different databases, such as the NASA Goddard Earth Sciences (GES) Data and Information Services Center (DISC), the Giovanni web-based application developed by GES DISC, and IMERG (Integrated Multi-satellitE Retrievals) Global Viewer. Regarding LULC data, the products made available by the MapBiomas Project, an annual remote-sensing-based LULC mapping initiative, are currently available [29]. This project considers five major classes (forest; nonforest, natural formation; farming; nonvegetated areas; and water) that are subdivided hierarchically into other subclasses. The mapping procedure is based on the random forest algorithm, which is applied to time series of Landsat images available on the Google Earth Engine platform [29].
Costa et al. [30] considered precipitation and LULC changes as the two most important drivers of long-term changes in the discharge of the Tocantins River. By comparing two time periods (1949–1968 and 1979–1998), these authors found that the mean discharge increased by 25% as forests and savannahs were converted into pastures and farms. On the other hand, Penereiro et al. [31] did not find any significant change in the precipitation pattern during the period ranging from 1955 to 2016 in the Tocantins–Araguaia Basin. However, they found that the discharge began to decrease after the Tucuruí hydropower plant started operating in 1986. In the last decade, a significant reduction in the discharge was also registered in the Tocantins–Araguaia Basin by the Agência Nacional de Águas e Saneamento Básico (ANA) [8]. Some of the monitoring stations showed a decrease of 50% from 2010 to 2020 in comparison with the period from 1980 to 2010. The Serra da Mesa reservoir also showed a decreasing trend and pronounced losses in the water volume and discharge after new hydropower plants were installed in a cascade in the Tocantins River [15]. Since 2016, the precipitation and discharge in Brazil have been below the average precipitation and discharge values [8]. The total precipitation has increased over the last 2 years, but a significant improvement in the water availability was not observed. These pieces of evidence suggest that there are other factors causing droughts, such as changes in the use of water and land, that may have impacted the water availability in recent years.
Integrated management considering all these different factors is important for avoiding a crisis involving the water and energy supplies, especially in the Tocantins River, the second-largest river in Brazil [8], which includes a cascade of seven large reservoirs that are used for 8.5% of Brazilian hydropower generation. Zhou et al. [32] pointed out that LULC and global climate changes are the two primary causes of current and future water scarcity. Within this context, this study aims to analyze the changes in terms of the surface water area, discharge, liquid evaporation, LULC, and precipitation in the Tocantins–Araguaia Basin. The ultimate goal is to analyze which factors are most relevant when it comes to changes in the surface water area and, consequently, in the water availability of each reservoir. This is a crucial and easily implemented evaluation that can contribute to the definition of sustainable management policies for this vital water resource system in Brazil.

2. Materials and Methods
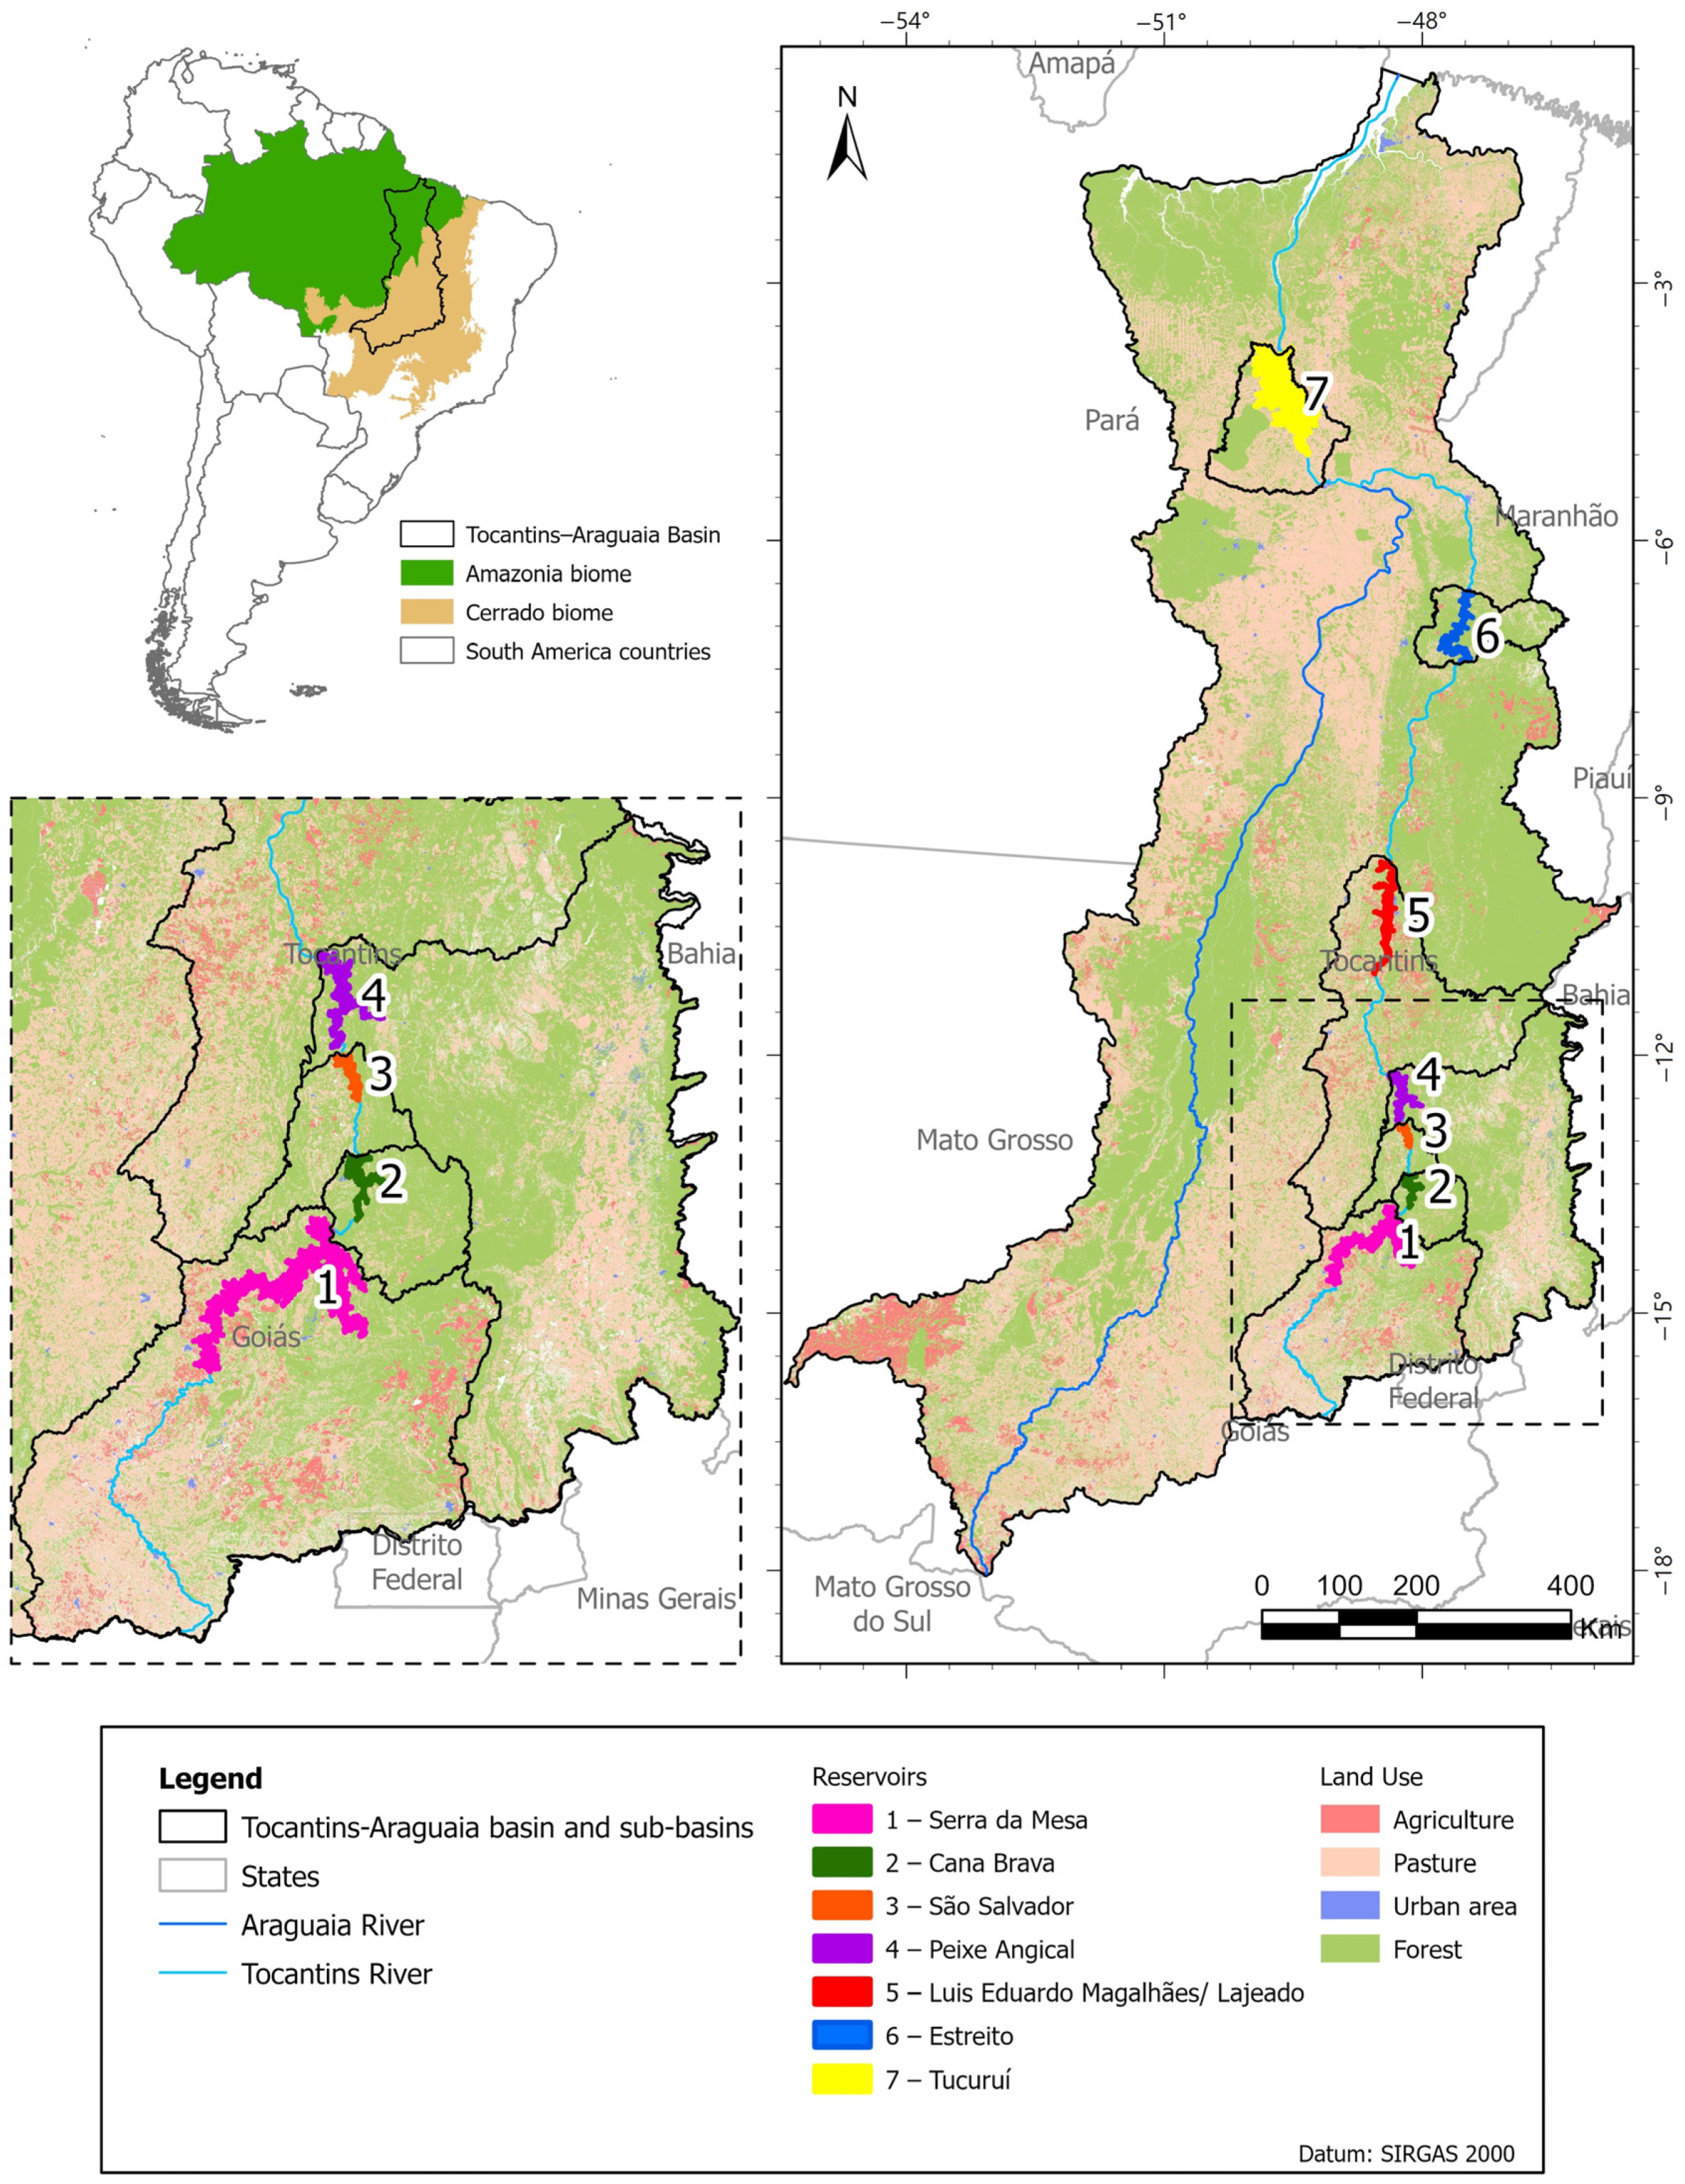
2.1. Study Area

The selected study area corresponds to the Tocantins–Araguaia Basin, located in the central part of Brazil. This basin is formed by the Araguaia and Tocantins rivers and their tributaries. It has an area of 767,000 km2 and partially covers the states of Goiás (21%), Tocantins (30%), Pará (30%), Maranhão (4%), and Mato Grosso (15%), in addition to the Federal District (0.1%) [33]. According to ANA [8], irrigation is the activity that consumes the most water in this basin, followed by domestic consumption and industrial activities. This basin is the second-largest basin in the country, with an installed hydroelectric potential of 11,563 MW (12% of the hydroelectric potential of Brazil). This basin also contains navigable rivers, including the Tocantins River [34].
According to the Köppen–Geiger climate classification system [35], the northern portion of the basin is defined as a tropical rainforest, whereas the southern part is classified as a tropical savannah. The mean annual rainfall is 1752 mm, and the mean annual potential evapotranspiration is 1768 mm [36]. The Tocantins–Araguaia Basin is partially covered by the Amazon and Cerrado biomes (Figure 1). Recently, the Tocantins River area has experienced intensive LULC changes due to extensive damming and the conversion of natural lands into agricultural areas [37].
There are seven large reservoirs operating in cascade in the Tocantins–Araguaia Basin: Serra da Mesa, Cana Brava, São Salvador, Peixe Angical, Luís Eduardo Magalhães/Lajeado, Estreito, and Tucuruí. Most of them are located in the Cerrado biome, except the Tucuruí reservoir, which is located in the Amazon biome. Four reservoirs (Cana Brava, São Salvador, Luís Eduardo Magalhães/Lajeado, and Estreito) correspond to run-of-the-river-type damns (Table 1), meaning that their discharge cannot be regulated. The upstream Serra da Mesa reservoir is quite important to the discharge management of downstream reservoirs [38].

2.2. Methods

The information on temporal changes was analyzed using an integrated approach, considering the data from all seven water reservoirs in the Tocantins River and the entire Tocantins–Araguaia Basin for the period from 2000 to 2020. More specifically, the analyses were performed for the entire time period and for two decades: 2000–2010, for the Tocantins–Araguaia Basin, and 2010–2020, for both the water reservoirs and the Tocantins–Araguaia Basin. This strategy was adopted since the artificial reservoirs were progressively built during the first decade and had entered full operation by 2010, except for the Estreito reservoir. The data analyzed in this study included the mean annual values of the surface area of reservoirs, discharge, and liquid evaporation, as well as the precipitation and LULC data at the basin scale. Changes and trends in these parameters are discussed in detail in the following sections. The data were processed with the R statistical package [39] and RStudio software [40].

2.2.1. Determination of Limits of the Tocantins–Araguaia Basin and Reservoirs

The Tocantins–Araguaia Basin limits were obtained from the metadata catalog of ANA [41]. This catalog stores several publications and spatial data, including the BHO250 hydrographic database [42], which is codified according to the Pfafstetter coding system [43] (1:250,000 scale). This codified hydrographic database (version 2.3) was generated in 2018 by ANA using the continuous cartography database of the Brazilian Institute of Geography and Statistics (IBGE) and the Shuttle Radar Topography Mission (SRTM) digital elevation model (DEM), which has a spatial resolution of 30 m. The BHO250 database has a consistent topology that correctly represents the river flow direction. It also contains the watershed’s boundaries, subdivided into six coding levels. The Tocantins–Araguaia Basin is represented by level 2 in this database.
The watersheds of each reservoir were defined by selecting the parts of level 4 of BHO250 that intersected the reservoirs, merging them, and sectioning the watersheds so that the most downstream point of each watershed coincides with the reservoir dam. This process was carried out by analyzing the water stream pattern, SRTM DEM, and flow direction, resulting in the definition of watersheds with different sizes for each reservoir (Figure 1; Table 1). The calculations of the average annual precipitation and LULC class areas were performed based on these individual reservoirs’ watersheds.

2.2.2. Estimation of Surface Area of Reservoirs

The estimation of the surface areas of reservoirs followed the method proposed by Valadão et al. [14] and Xavier et al. [15]. For each reservoir, collections of Landsat satellite images from every 6 months of the analyzed period were filtered for less cloud cover and used to obtain one mosaicked image per semester based on the median values of the filtered collections [14,15]. RGB color composites of shortwave infrared, near-infrared, and red bands were transformed into the HSV color representation system to classify the pixels corresponding to flooded areas [14,15]. Two estimates per year were obtained from the pixels representing water for each reservoir per semester (January–June and July–December). The average values of the two estimations were considered the annual average area (units of km2).
We performed all analyses on the cloud-based Google Earth Engine (GEE) platform [44]. Using this platform, we can combine long time series of spatial data without the need for powerful machines [14]. The area estimations were obtained from the Landsat Collection 1 Tier 1 images, which were processed to the top-of-atmosphere reflectance using the script available in the GEE data catalog. The images from 2000–2011, 2012, and 2013–2020 correspond to the Landsat 5 Thematic Mapper (TM), Landsat 7 Enhanced Thematic Mapper Plus (ETM+), and Landsat 8 Operational Land Imager (OLI) images, respectively. The spatial resolution of these images was 30 m, allowing the production of thematic maps at an approximate scale of 1:100,000.
We calculated the areas of the reservoirs from 2000 to 2020 for the Serra da Mesa and Tucuruí reservoirs only (Table 1) since they were the only reservoirs in operation at the beginning of the first decade. The other reservoirs were built after 2000. Their areas were only included in the analysis after they became stable, which, in most cases, happened in the year following the flooding. Therefore, the monitored period ranged from 2003 to 2020 for Cana Brava, 2009 to 2020 for São Salvador, 2006 to 2020 for Peixe Angical, 2002 to 2020 for Luís Eduardo Magalhães/Lajeado, and 2012 to 2020 for Estreito (Table 1). Data on surface areas for the Tocantins Basin considered the sum of all calculated reservoir areas from 2000 to 2020.

2.2.3. Hydrometeorological Data Selection and Processing (Discharge, Liquid Evaporation, and Precipitation)

Data on the discharge (m3 s−1) of the reservoirs of the Tocantins River are available on ANA’s website, where a daily updated database of measurements is available for hydropower plants in the Reservoir Monitoring System (SAR) database [45]. The Tocantins River reservoirs are included in Brazil’s National Interconnected System (SIN) within the SAR database, where in situ information on the discharges of these reservoirs since their construction is available for all selected reservoirs. The annual averages of the discharge were calculated for all reservoirs. For the Tocantins–Araguaia Basin, we considered the annual average discharge values for the most upstream reservoir, which is the Serra da Mesa reservoir. Similarly, the annual discharge averages were estimated for the most downstream reservoir, the Tucuruí reservoir.
Liquid evaporation data are also available in ANA’s metadata catalog [41]; a spreadsheet with the liquid evaporation data of artificial reservoirs with a mapped area larger than 1 km2 for the years 2001 to 2019 is available [46]. The liquid evaporation (m3 s−1) is given by the difference between the real evaporation of the water reservoir and the expected evapotranspiration in the same area if the artificial reservoir did not exist [46]. The estimates included in the database are based mainly on the physical principles of mass and heat transfer equations and the energy balance, which are included in a system developed specifically for liquid evaporation estimates known as the Lake Evaporation System Based on Surface Temperature (SELET); this system has a minimum level of sensitivity of 0.5 m3 s−1 [46]. In the data analysis for the entire Tocantins–Araguaia Basin, the sum of the liquid evaporation of all reservoirs was considered.
The precipitation data used in this study were obtained from the Giovanni website [47], which was developed by GES DISC. Annual time-averaged precipitation maps (mm month−1) of the Tocantins–Araguaia Basin from 2001 to 2020 were generated with GPM data, which were obtained by an international satellite mission that provides observations of rain and snow [48]. Rainfall estimates from the GPM were made with the Integrated Multi-satellitE Retrievals (IMERG) algorithm, which combines data from all passive-microwave instruments in the GPM constellation [48]. IMERG also intercalibrates, merges, and interpolates all satellite microwave precipitation estimates, together with microwave-calibrated infrared satellite estimates, rain gauge analyses, and other precipitation estimators [48]. Nascimento et al. [49] found that the products performed well in the estimation of monthly rainfall events, in terms of both the volume and spatial distribution. According to their work, there is a strong correlation between the monthly products of IMERG and the rain gauge data in Brazil, with a bias (mean bias error) of 5.98 mm and an accuracy (root mean squared error) of 50.12 mm.
Due to the large extent of the Tocantins–Araguaia Basin and the 21-year study period, satellite data such as GPM data are better suited to representing the area than point-based rain gauge data. Among the freely available satellite precipitation datasets, the GPM was chosen due to its high spatial and temporal resolutions, which fit the studied period well (only 1 year of missing data—2000). The data used in this study were the GPM IMERG final precipitation version 6 data, which have a spatial resolution of 0.1° × 0.1° and a temporal resolution of 30 days; these data were averaged in Giovanni to create a raster for each year that includes the entire Tocantins–Araguaia Basin [47,48]. The annual averages were calculated from the raster data for the whole basin and for the individual watersheds of each of the seven reservoirs.

2.2.4. Obtaining and Processing Land Use and Land Cover Data (Precipitation, Land Use, and Land Cover)

Historical land use and land cover (LULC) data were obtained from MapBiomas Collection 6 [29]. This collection provides annual maps of Brazilian LULC data from 1985 to 2021. The project produces these thematic maps based on the nonparametric random forest classifier with a pixel size of 30 m using cloud computing technology, the JavaScript and Python programming languages, and data storage capabilities provided by Google [29]. The training samples were obtained based on reference maps, earlier MapBiomas collections, and visual interpretation for each Brazilian biome; these training samples provided annual statistical variables for this machine learning algorithm. The overall accuracy of the LULC time series, based on a stratified random sample of 75,000 pixel locations, was 89%, with the Amazon forest and Cerrado savannah areas presenting overall accuracies of 95.1% and 81.4%, respectively.
We analyzed 21 years of data (2000–2020) for the Tocantins–Araguaia Basin and the watersheds of each reservoir using the MapBiomas Collection 6 annual LULC data, which were grouped into four classes: (1) natural, a class in which the forest (mainly forest and savannah formations) and nonforest natural formations (mainly grasslands and wetlands) were grouped; (2) urban area (urban areas with a predominance of paved surfaces and nonpermeable surface areas (infrastructure, urban expansion, or mining) not mapped into their classes); (3) pasture (predominantly planted pastures for livestock production); and (4) agriculture, a class in which the temporary crops (e.g., soybean, sugarcane, maize), perennial crops (e.g., coffee, citrus), forest plantations (tree species planted for commercial purposes; e.g., Pinus and Eucalyptus), and mosaics of agriculture and pasture (areas of agricultural use where it was not possible to distinguish between pasture and agriculture) were grouped.

2.2.5. Statistical Analysis

After all data were obtained, the analyses were performed using the R statistical package [39] and RStudio [40]. The first step was the use of the mice package [50], which implements a method in which each incomplete variable is imputed by the specified model (fully conditional specification). In this case, the mice method was implemented with 5 multiple imputations of 100 iterations using predictive mean matching. Second, the data frames containing data on all parameters for each reservoir and for the Tocantins–Araguaia Basin were transformed into a time-series-type format. They were subsequently analyzed using the Mann–Kendall trend test (H0: no monotonic trend; H1: monotonic trend) implemented in the Kendall package [51]. This allowed us to determine if these data display any significant monotonic trend (1) for the complete time range (2000–2020) and for the two individual decades (2000–2010 and 2010–2020) in the case of the entire basin and (2) from the starting monitoring year to 2020 and from 2010 to 2020, when most of the reservoirs were already built.
If no significant monotonic trend was identified, the data were tested for trend (H0: no trend, H1: with trend) using a local regression-based WAKV test implemented in the funtimes package [52]. Then, the data were checked to determine if they followed a normal distribution using visual analysis (boxplots, quantile–quantile plots, and distribution plots) and the Shapiro–Wilk normality test (H0: the population is normally distributed; H1: the population is not normally distributed). The correlation between the water surface areas and all other parameters and the statistical significance of these correlations were computed using the Pearson correlation for normally distributed data and Spearman’s rank correlation for the non-normal data.
Finally, principal component analysis (PCA) was applied to identify the parameters that are more closely associated with the changes in the water reservoir areas. For the correlation calculations and PCA for the entire Tocantins–Araguaia Basin, the number of reservoirs was included as a parameter since the number of reservoirs increased from two at the beginning of the time series to seven at the end of the time series. The number of reservoirs impacts the sum of the areas, especially when this number increases in the first decade of the time series. All hypothesis tests considered a 95% confidence interval.

3. Results

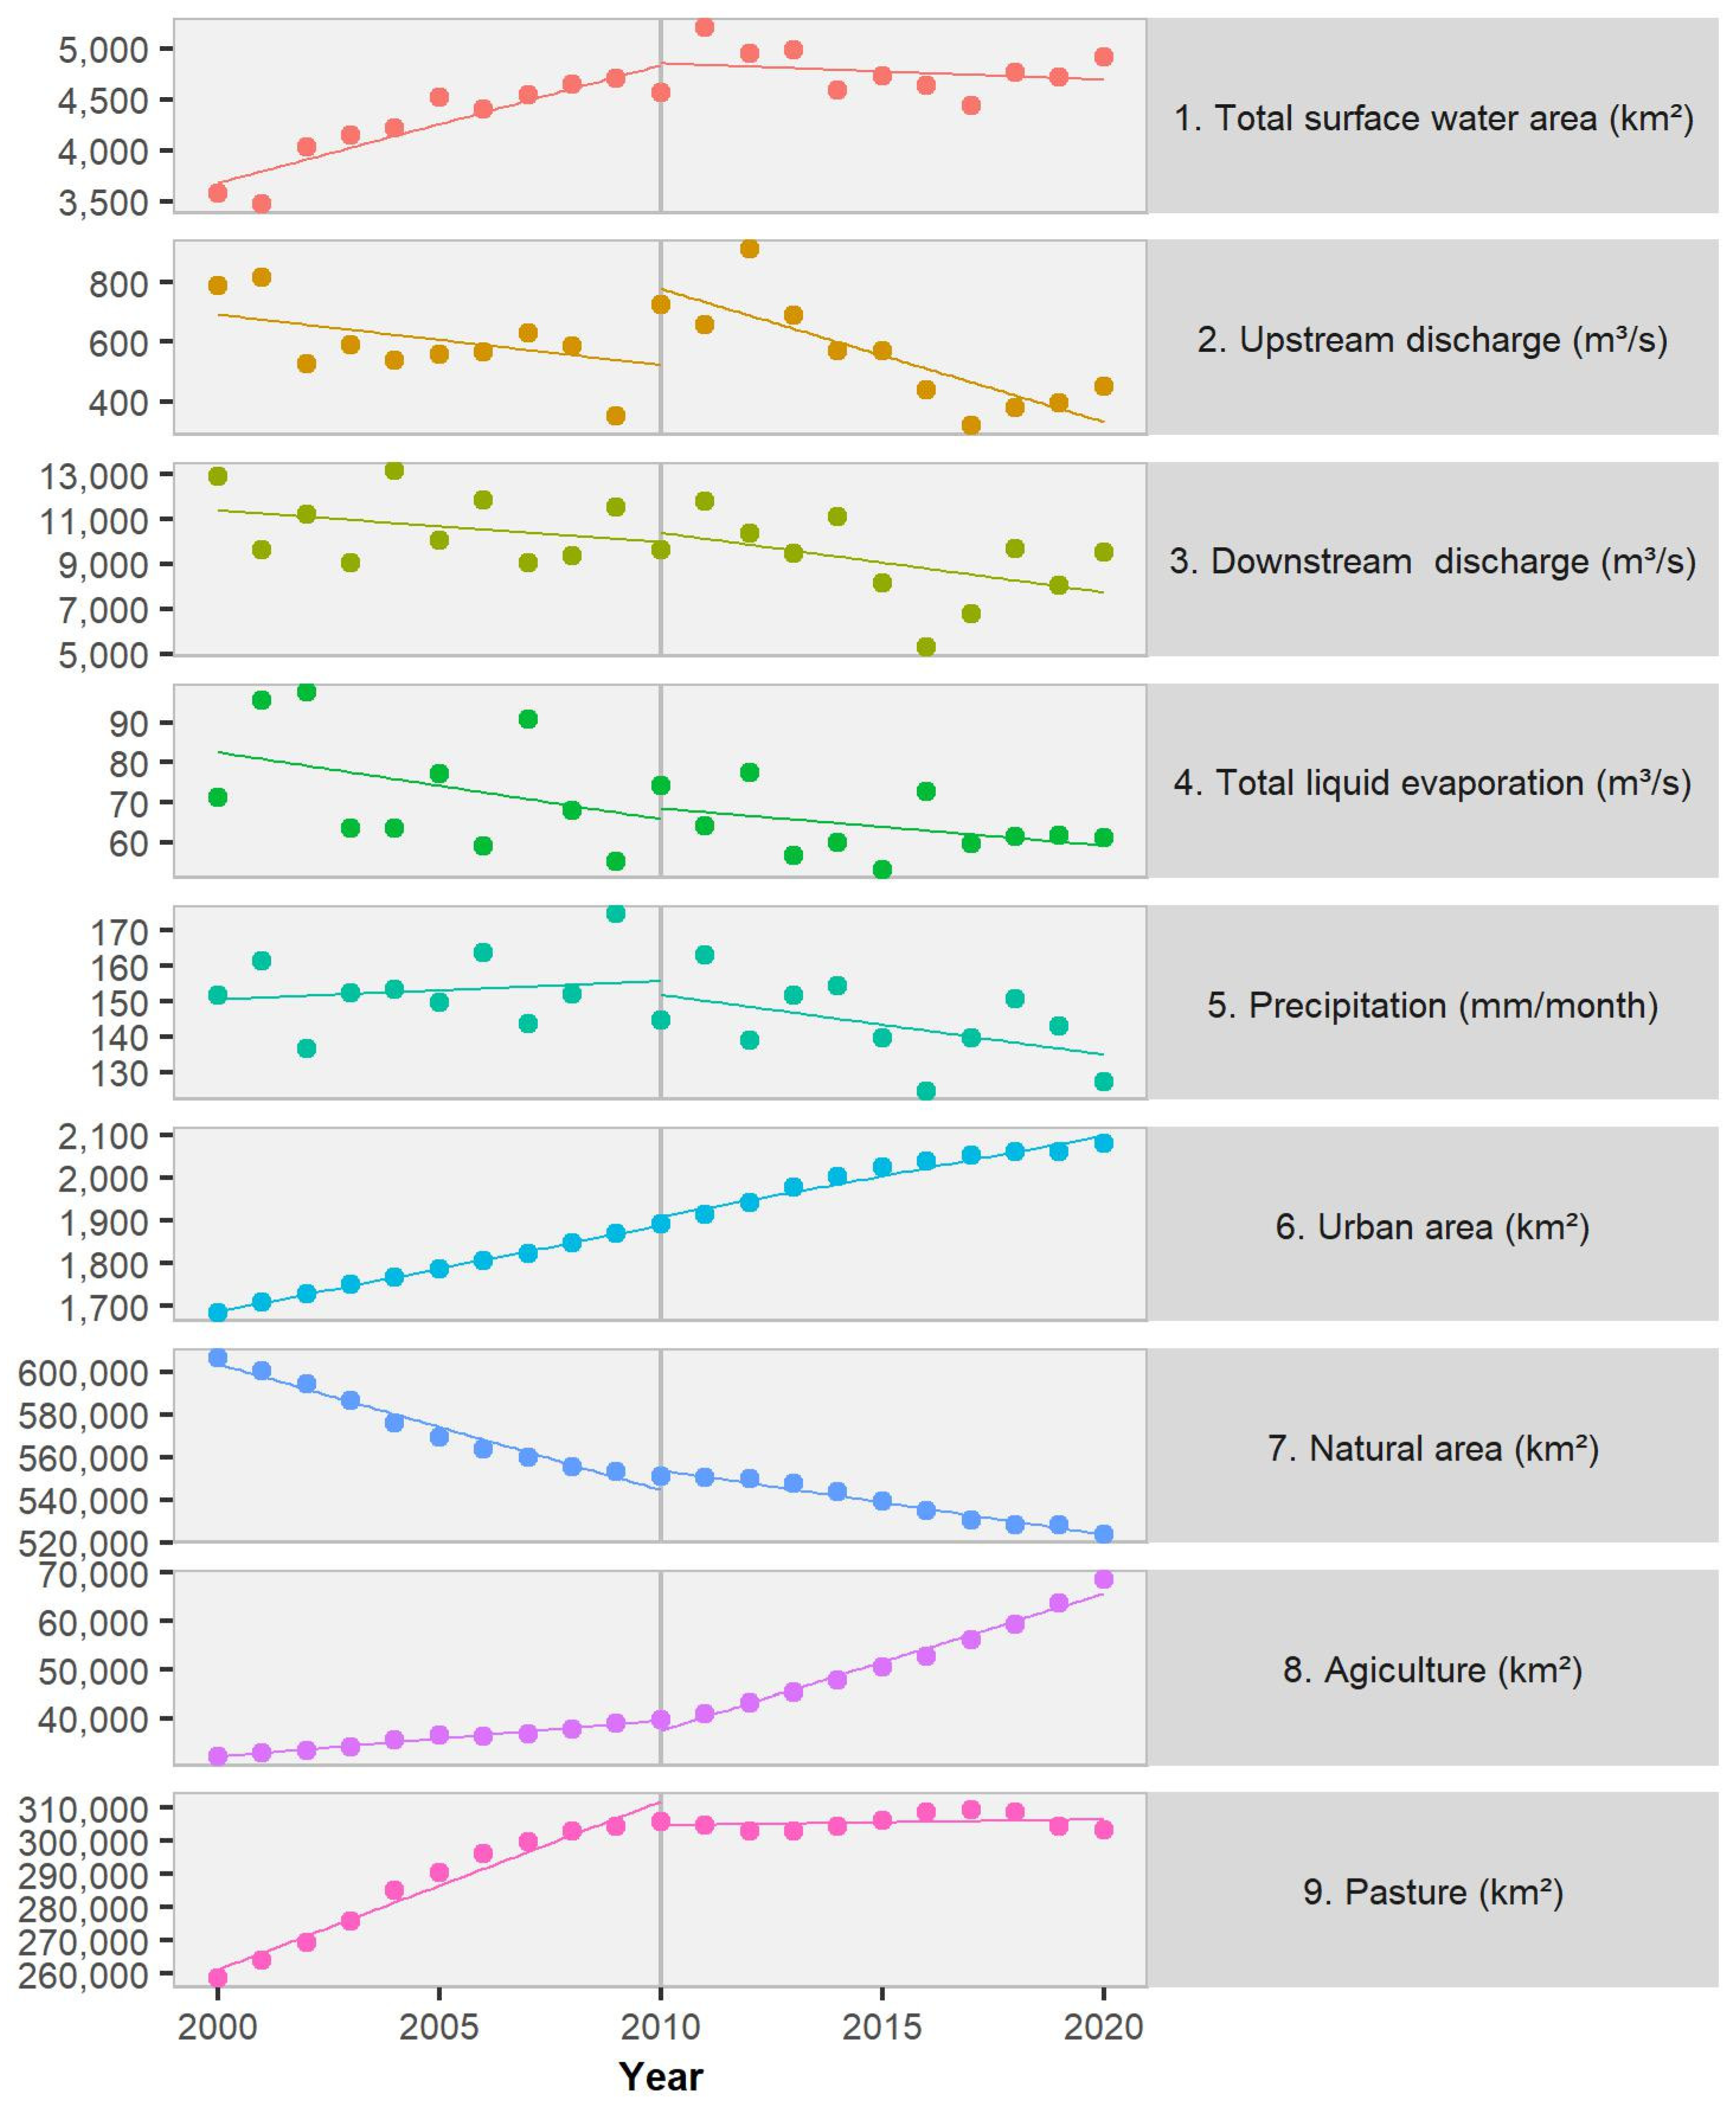
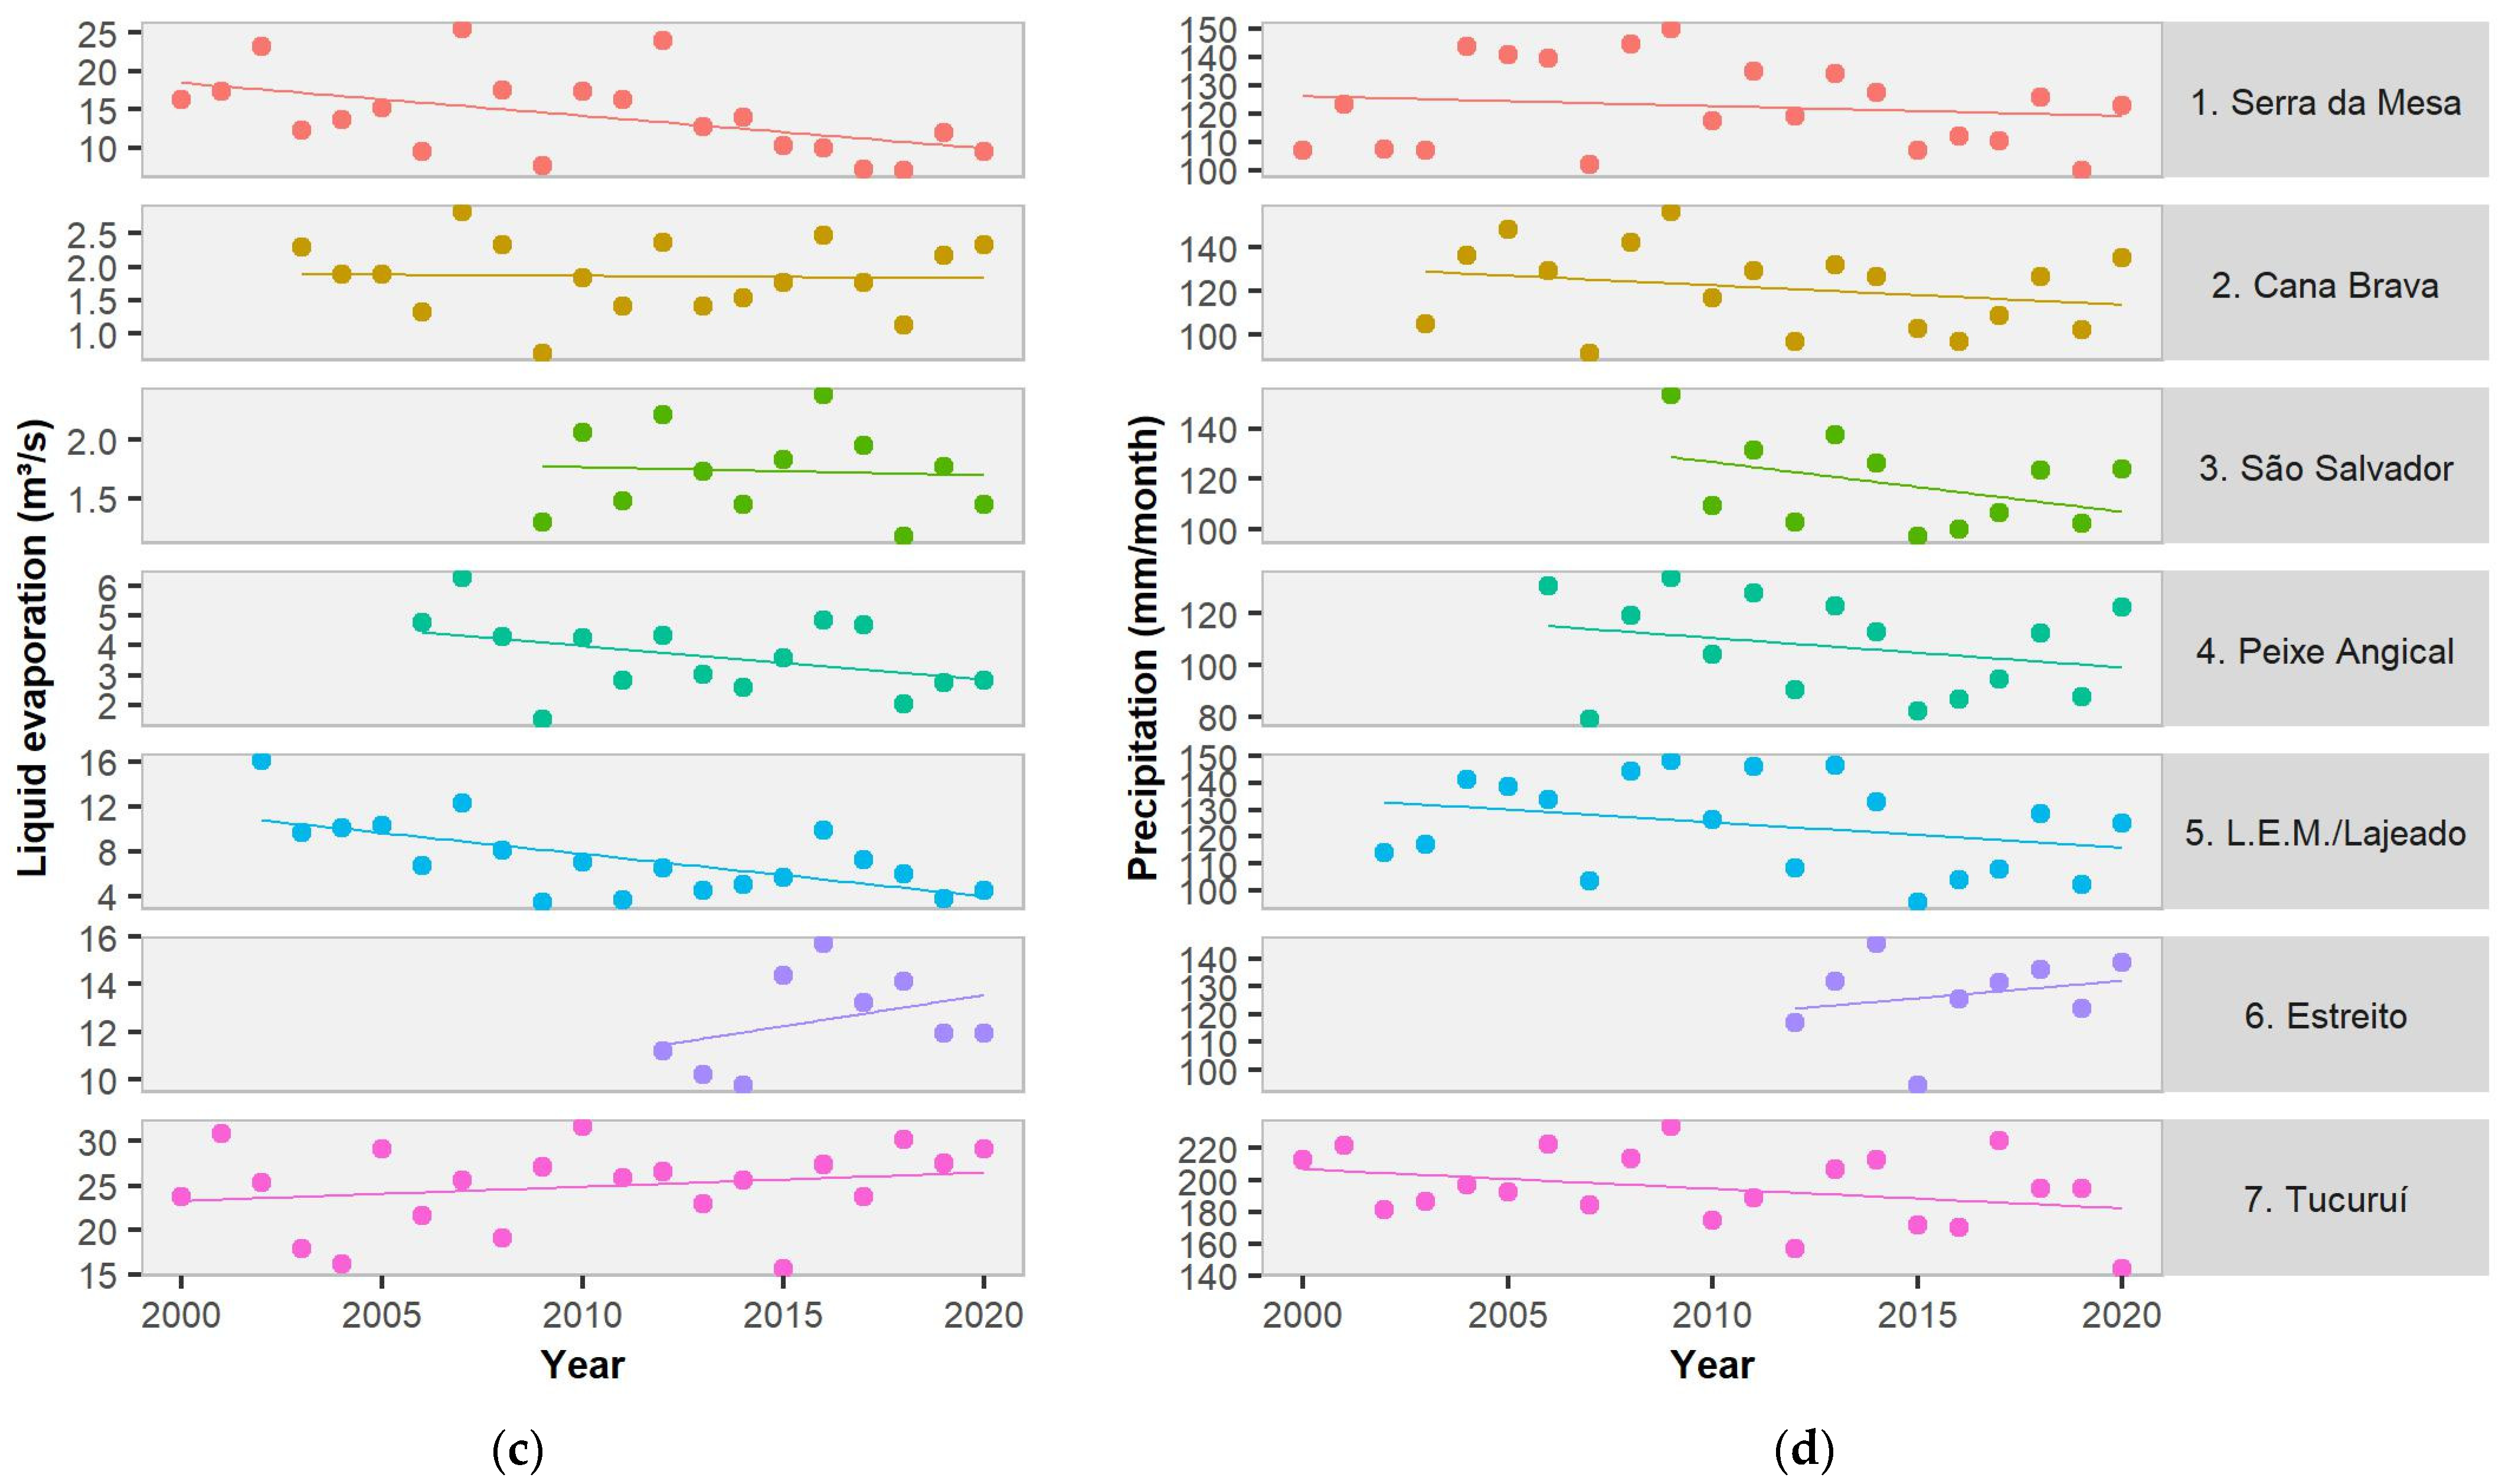
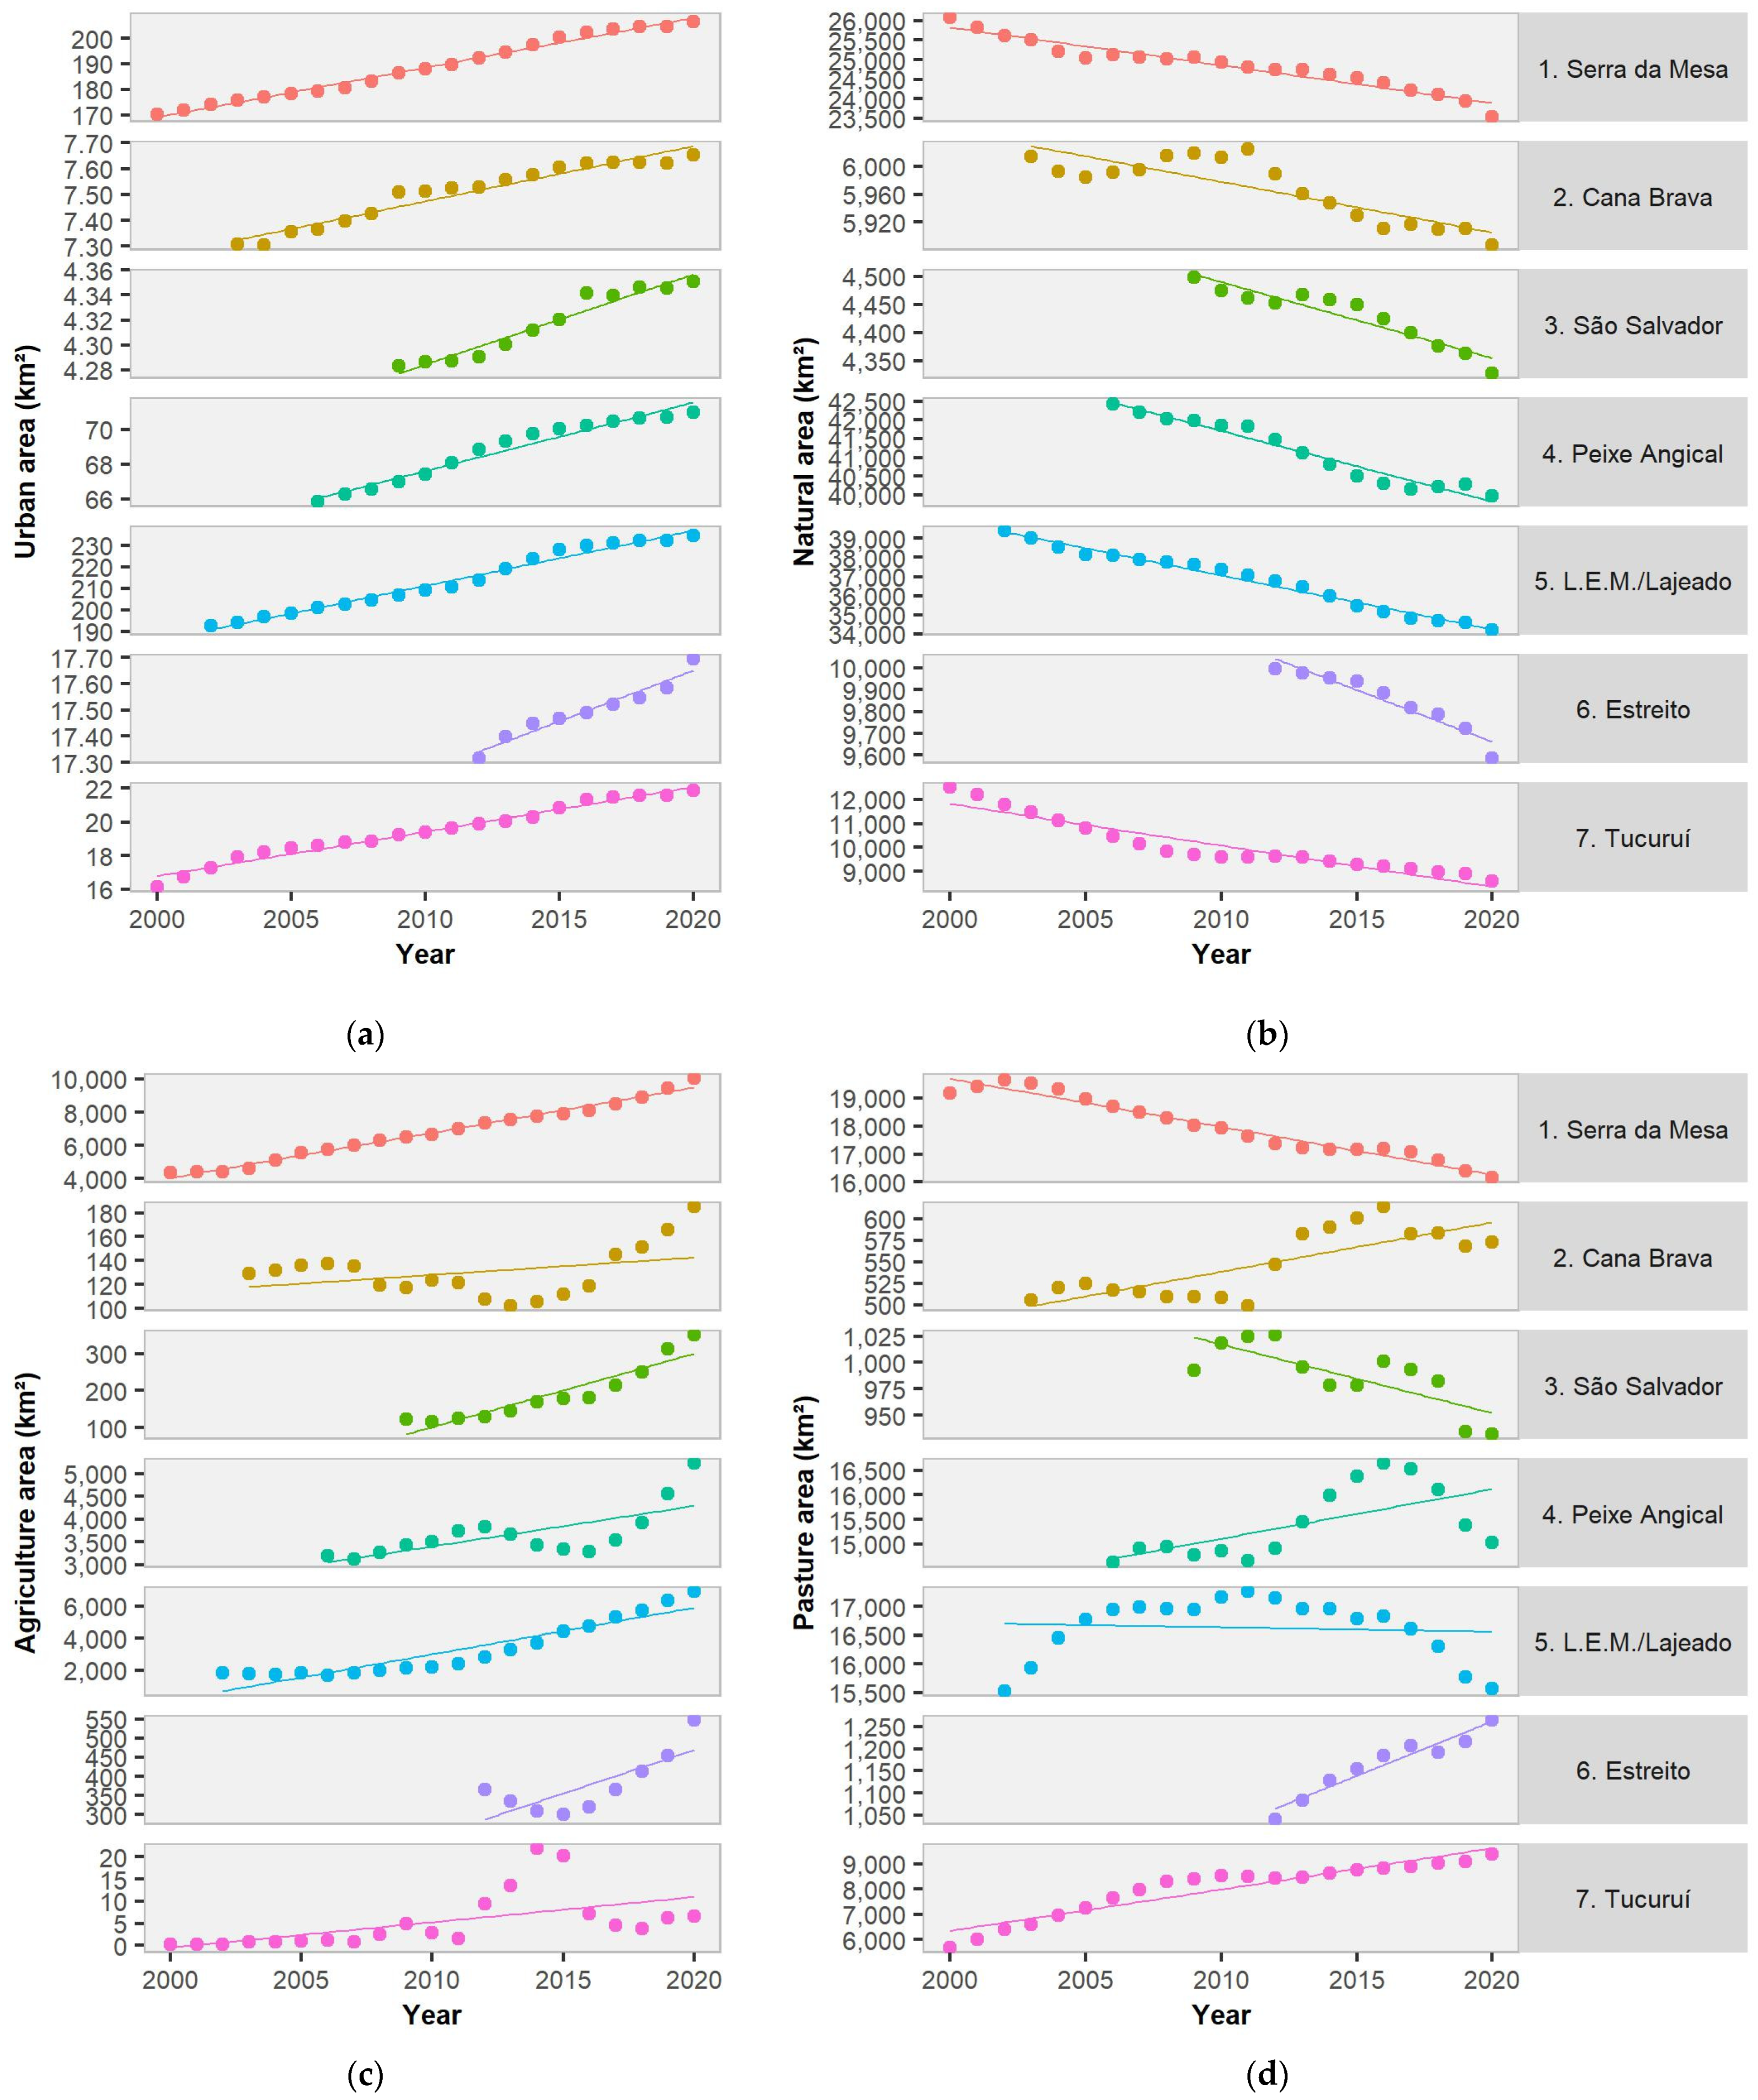
3.1. Time Series Analysis

The detailed results obtained from the time series analysis are provided in the Supplementary Materials (Tables S1–S6).

3.1.1. Tocantins–Araguaia Watershed

Because of the flooding processes related to the construction of new reservoirs, the total area of the water reservoirs in the Tocantins–Araguaia Basin increased significantly during the period from 2000 to 2010 (Figure 2; Table S1). The surface water area increased from 3575 km2 in 2000, when only the two largest reservoirs (Tucuruí and Serra da Mesa) existed, to 4567 km2 in 2010. After the last reservoir flooding, around 2011/2012, the total area of the reservoirs became relatively stable at 4948 km2 in 2012. The construction of new reservoirs led to a significant increase even when the two-decade period (2000–2020) was considered. The total sum of the surface water area in 2020 was 4923 km2, an increase of 38% during the period from 2000 to 2020.
The discharge of both the upstream and downstream reservoirs presented statistically significant decreasing trends for the second decade of the time series (Table S1). Only the discharge of the downstream reservoir presented a statistically significant decreasing trend for the entire time series and in the first decade (Table S1). The liquid evaporation had a statistically significant decreasing trend during the period from 2000 to 2020. However, this trend was not statistically significant for the data split into two decades.
Even though the mean annual precipitation values appear to have a decreasing trend after 2010, this trend was not statistically significant (Table S1) for the complete time series or for each decade. Nevertheless, four of the five lowest mean annual precipitation per month values occurred in the second decade. The lowest mean annual rainfall occurred in 2016, when the whole country experienced an intense dry period, which caused water supply crises in some regions [53,54], including the Serra da Mesa, Cana Brava, Peixe Angical, and Lajeado reservoirs. The precipitation and discharge data shown in Figure 2 have a very distinguishable sine pattern.
The LULC data changed substantially during the period from 2000 to 2020. The area of native savannahs and forests decreased by 14%, while the agricultural area increased by 113%, the pasture area increased by 17%, and the urbanized area increased by 23%. While the rate of change in natural and urban areas was somewhat consistent over these two decades, the total pasture area growth was more prominent from 2000 to 2010; it became more stable from 2010 to 2020. The opposite is seen for agricultural areas, which increased mainly during the second decade (73%). Especially for the period from 2010 to 2020, the increase in agricultural land resulted in a similar intense growth in irrigation. Previous studies showed that the water flow used for irrigation was 32.7 m3 s−1 in 2006 and 60.75 m3 s−1 in 2020 [8,55].

3.1.2. Water Reservoir System

There was a significant decreasing trend in the inundated area for most of the reservoirs when the entire period is considered (Figure 3a). Cana Brava’s surface area (Figure 3a; Table S2) decreased from 124.7 km2 in 2003 to 120.84 km2 in 2020 (−3.1%). São Salvador´s area decreased from 93.7 km2 in 2010 to 90.9 km2 in 2020 (−3.1%). Peixe Angical´s surface area (Table S3) decreased from 248.3 km2 in 2007 to 240.5 km2 in 2020 (−3.2%), while the Lajeado reservoir decreased from 669.5 km2 in 2003 to 656.8 km2 in 2020 (−1.9%). The Estreito reservoir also had a statistically significant decreasing tendency, with an area shrinkage of −5.8% (393.1 km2 in 2012 and 370.2 km2 in 2020). However, for some of the other variables, it was not possible to determine the statistical significance of the trend because of the relatively short time series available for some of the reservoirs.
The Tucuruí and Serra da Mesa reservoirs showed no statistically significant changes in their surface water areas during the 20-year period (Figure 3a; Table S3). However, they presented quite different apparent trends. The Tucuruí reservoir did not appear to be decreasing in the studied period (Figure 3a). On the other hand, there was an apparent decreasing trend in the Serra da Mesa reservoir. Serra da Mesa, from 2000 to 2010, had a statistically significant increasing trend in its surface water area (Table S4), which grew from 1057 to 1192 km2 (12.8%). However, from 2010 to 2020, the surface water area decreased significantly, reaching a value of 853 km2 (−28% in comparison with 2010) (Table S5). The Tucuruí reservoir, on the other hand, showed a statistically significant negative trend from 2000 to 2010 (Table S4), shrinking from 2257 to 2151 km2 (−4.7%), and a statistically significant positive trend from 2010–2020, attaining an area of 2590 km2 by 2020 (20.4% increase compared with 2010) (Table S6). This positive tendency is again the only positive tendency found for the second decade; all other reservoirs showed a statistically significant decreasing tendency. This difference in the pattern of the Tucuruí reservoir is probably due to the stronger influence of the Amazonian climate and the influence of the Araguaia River, whereas the other reservoirs mostly respond to the Cerrado climate and are located upstream of the convergence between the Araguaia and Tocantins rivers. In addition, since Tucuruí is the biggest reservoir in the study area, when the sum of the areas of the reservoirs in the Tocantins Basin is analyzed (Figure 2), the increase in this sum might mask the decrease observed in other reservoirs, resulting in the stable pattern that was observed for the second decade.
Figure 3b shows that the annual average discharge decreased for all reservoirs. However, this decreasing trend is only statistically significant for the São Salvador, Peixe Angical, Lajeado, and Tucuruí reservoirs (Tables S2 and S3). The percentage decreases were (1) −43.0% for Serra da Mesa from 2000 to 2020, (2) −15.5% for Cana Brava from 2003 to 2020, (3) −31.4% for São Salvador from 2010 to 2020, (4) −2.3% for Peixe Angical from 2006 to 2020, (5) −17.4% for Lajeado between 2002 and 2020, (6) −18.3% for Estreito between 2012 and 2020, and (7) −26.4% for Tucuruí between 2000 and 2020. All reservoirs showed statistically significant decreasing patterns between 2010 and 2020 (Tables S5 and S6). The discharge patterns are also somewhat coincident with areal patterns and show a sine variation and a strong seasonal influence, except for the Tucuruí reservoir before 2016.
Most of the liquid evaporation data presented no statistically significant trends, except for the decreasing trends of the Serra da Mesa and Luís Eduardo Magalhães/Lajeado reservoirs (Tables S2 and S3). Tucuruí and Estreito, the two most downstream reservoirs, showed evidence of a pattern of increasing liquid evaporation, while the other reservoirs appear to be closer to a decreasing trend over time (Figure 3c). When only the last 10 years are considered, only the Serra da Mesa reservoir presented a statistically significant decreasing trend (Tables S5 and S6).
The mean annual precipitation appears to have a decreasing trend for all reservoirs, except for Estreito (Figure 3d). No individual watershed precipitation time series presented a statistically significant increasing or decreasing trend (Tables S2–S6). The decrease in the surface water area is much steeper in the last 10 years than the decrease in the precipitation, except for Tucuruí, indicating that factors other than precipitation might be affecting the water content. In Tucuruí, the discharge and precipitation patterns are coincident, indicating that precipitation is the most important controlling factor for the discharge.
The LULC parameters of the reservoir’s watersheds (Figure 4a–d) showed tendencies similar to those observed for the entire Tocantins–Araguaia Basin (Figure 2): three land use classes are systematically replacing natural areas. All reservoir watersheds presented linear, monotonic, and statistically significant increasing trends in the sizes of urban areas (Tables S2 and S3). The growth in urban areas ranged from 36% for Tucuruí to 2% for São Salvador. Natural areas are decreasing in all reservoir watersheds, with losses varying from −2% in Cana Brava to −31% in Tucuruí. A statistically significant increasing trend in agriculture was also observed. The lowest increase was found in the Cana Brava watershed (44%), and the highest was found in the Tucuruí watershed (2832%). A steep decrease in the Tucuruí watershed’s agricultural area coincided with an intense drought in 2015. Changes in the pasture area are more variable since pastures often replace natural areas but may be replaced by agricultural areas at a later time.

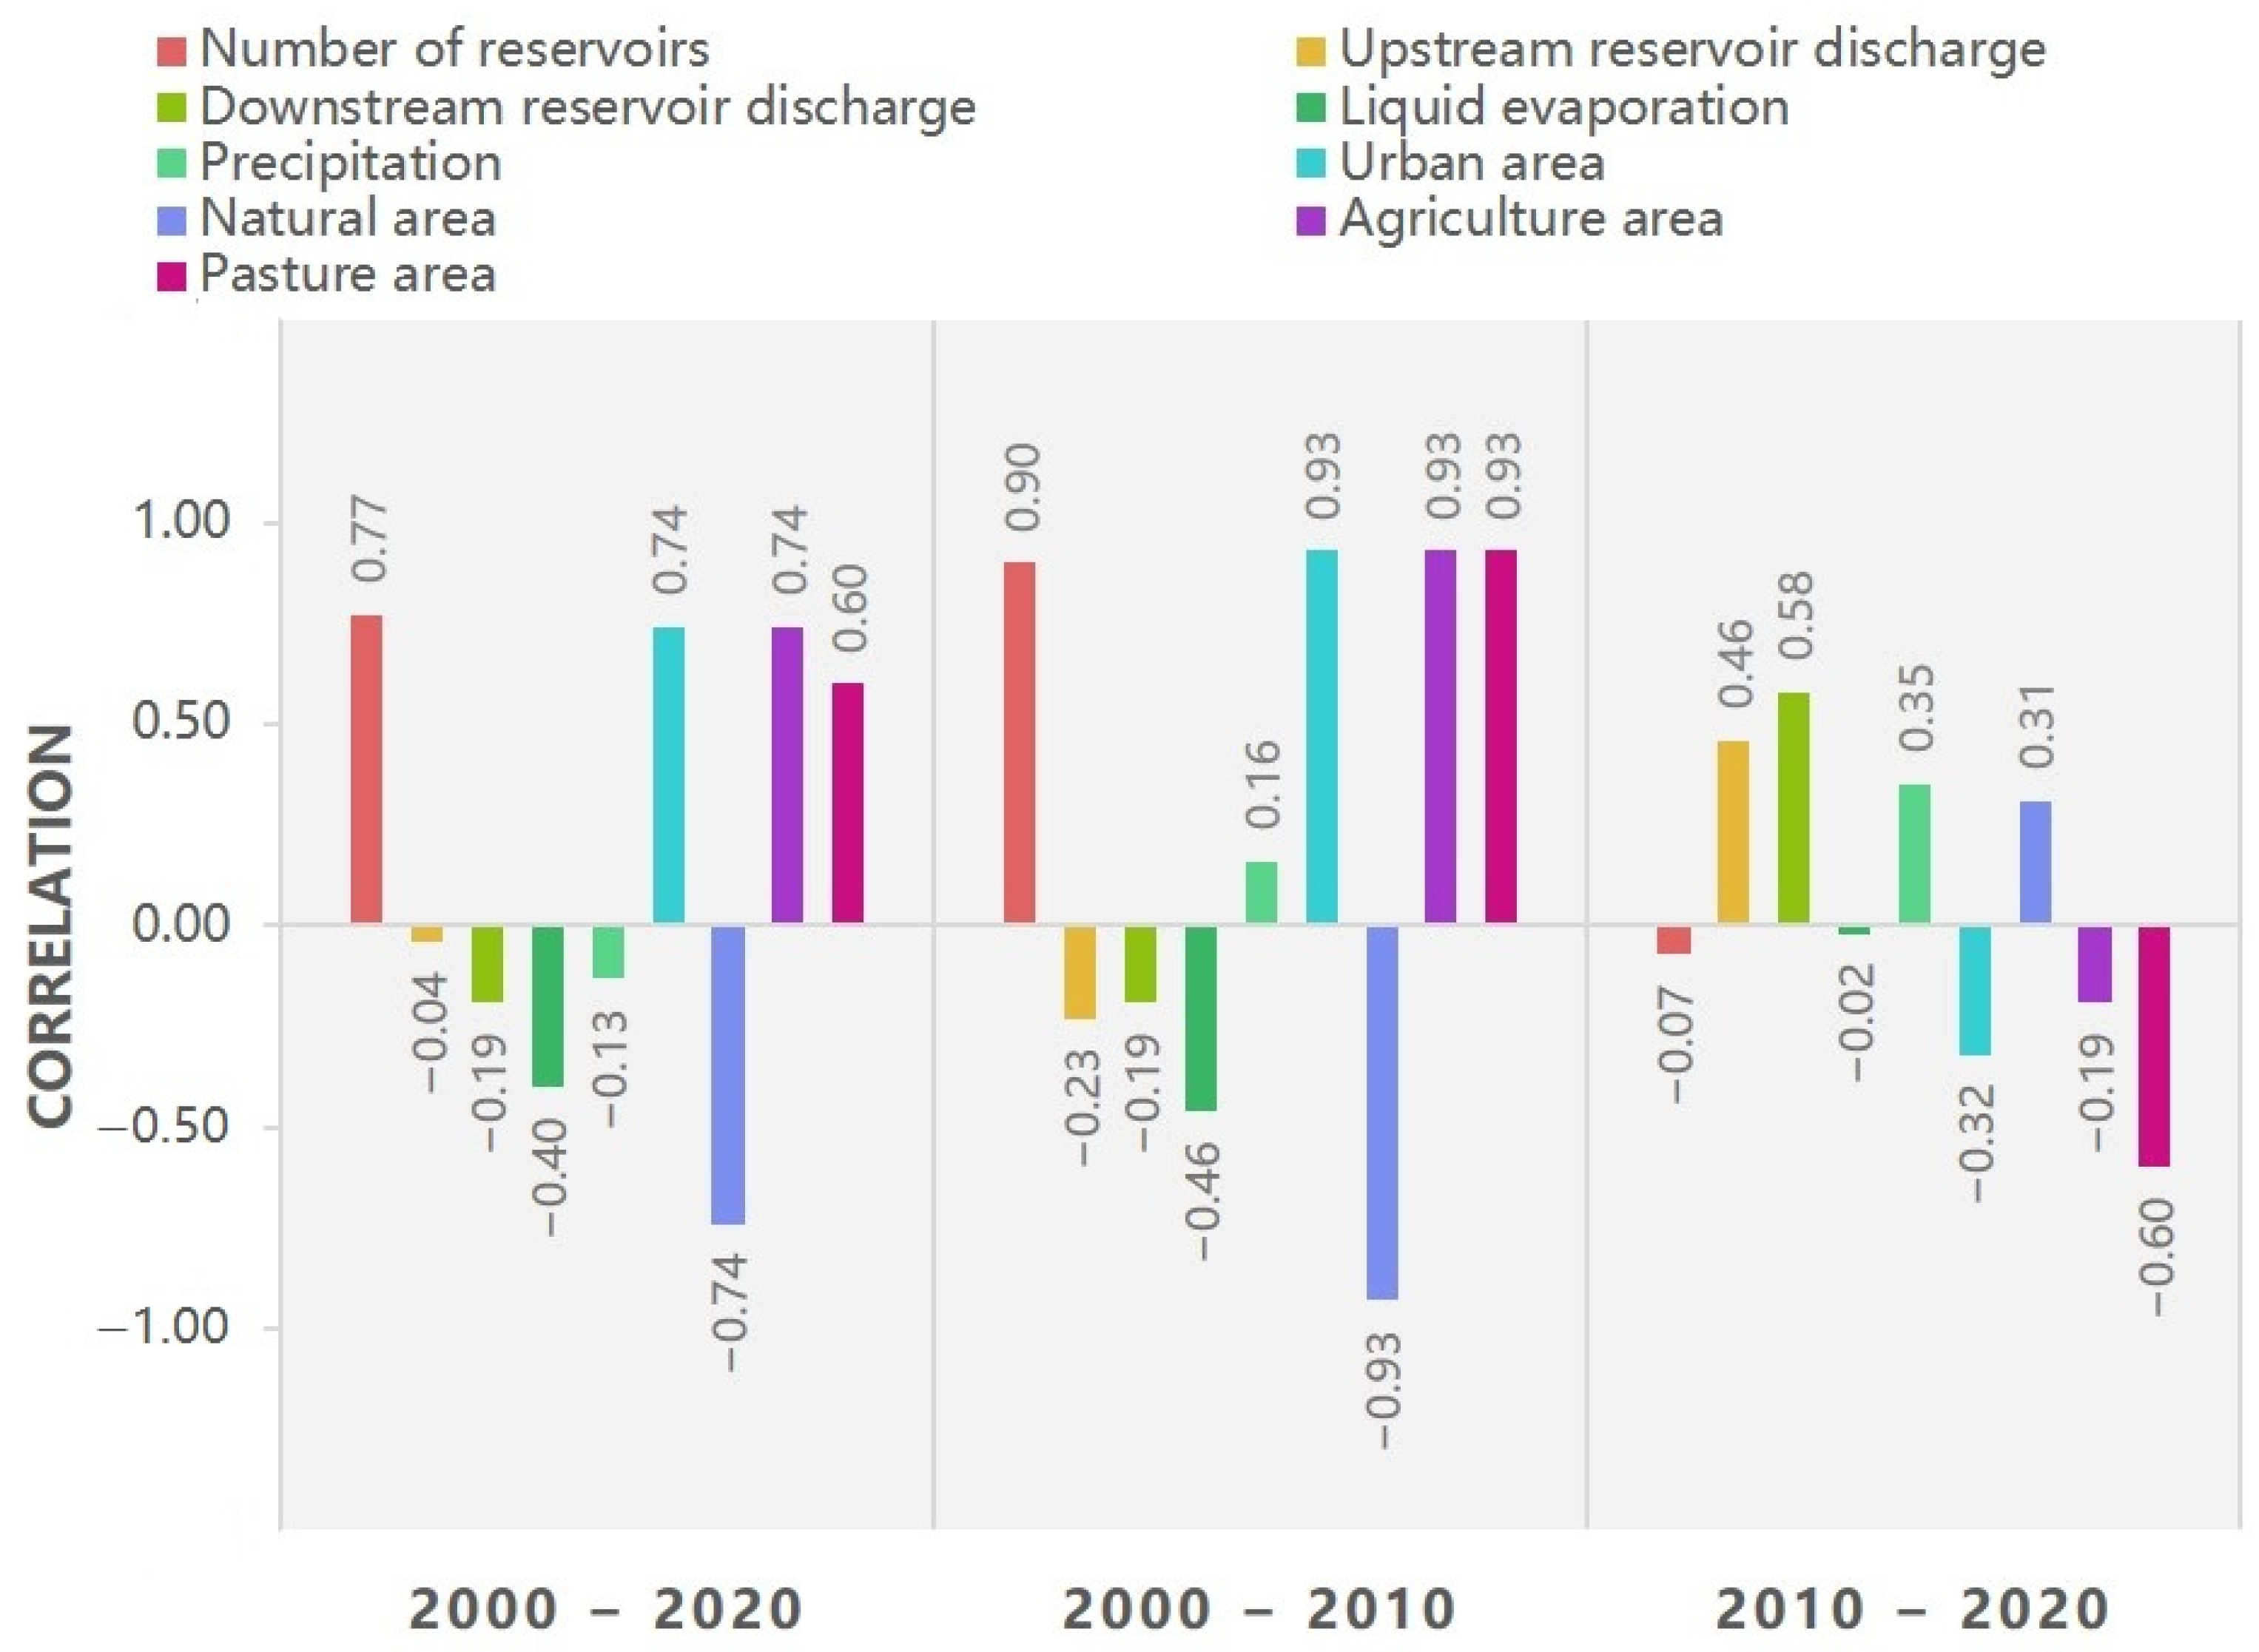
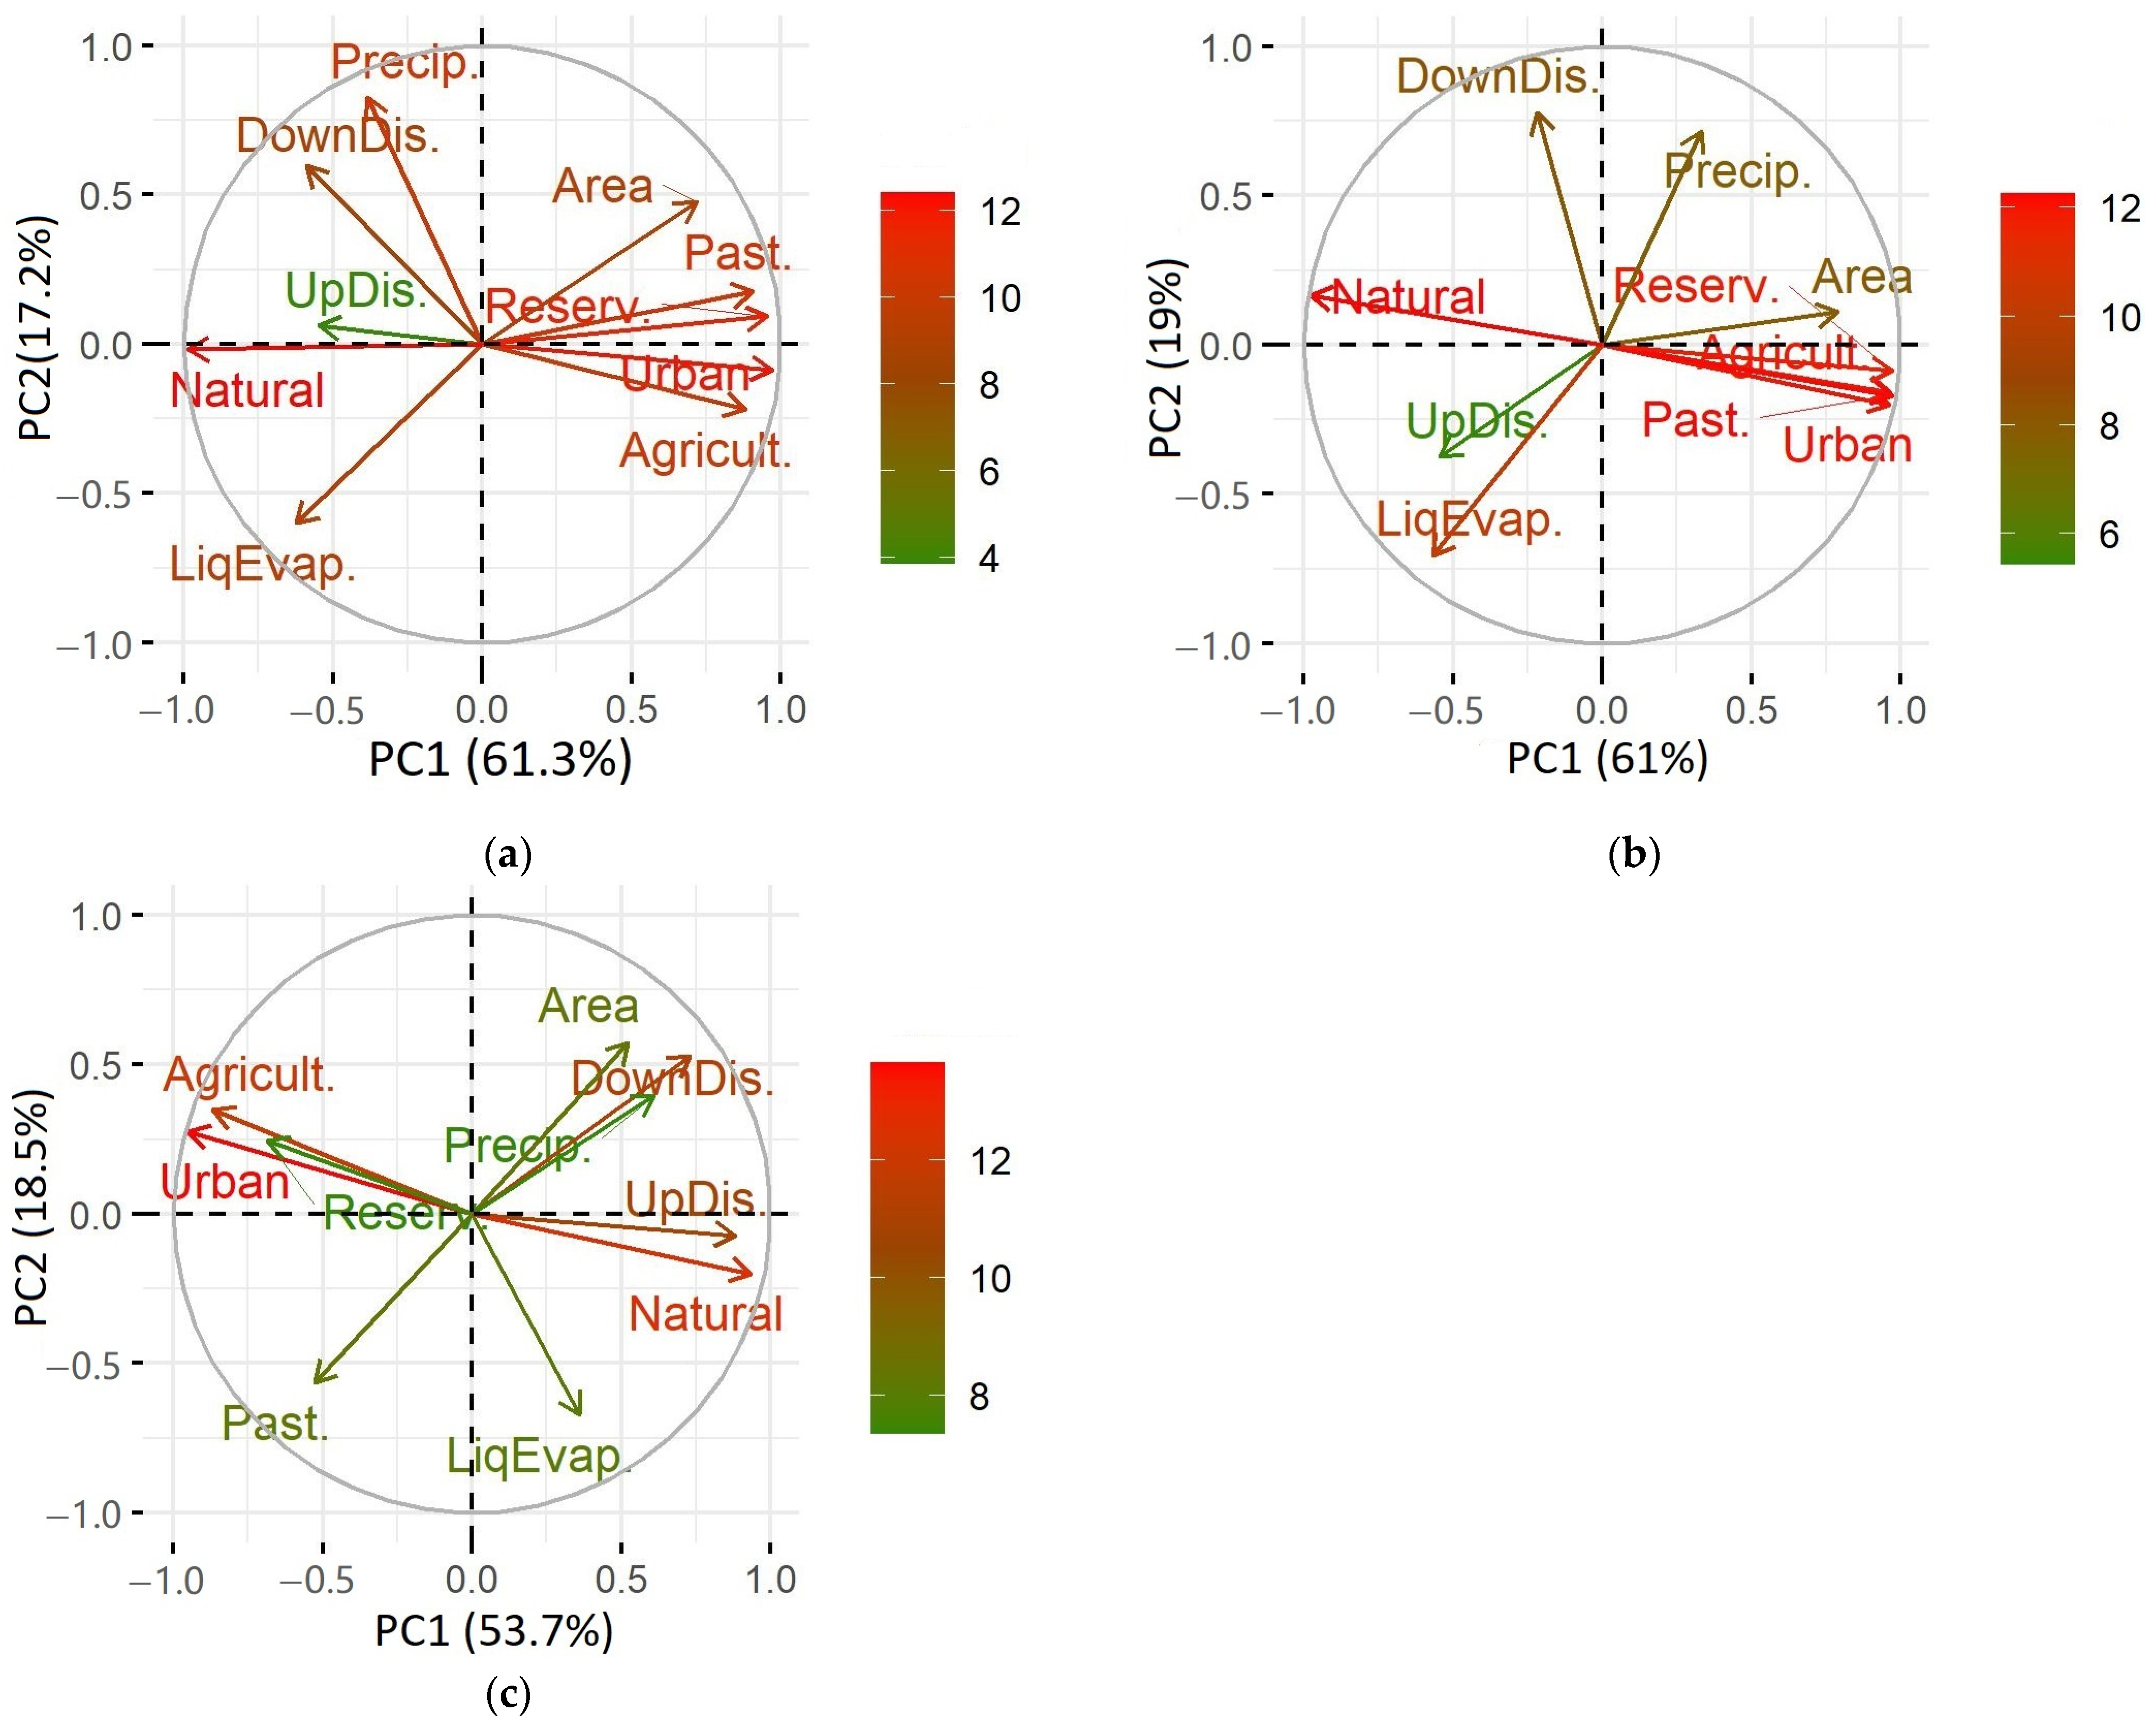
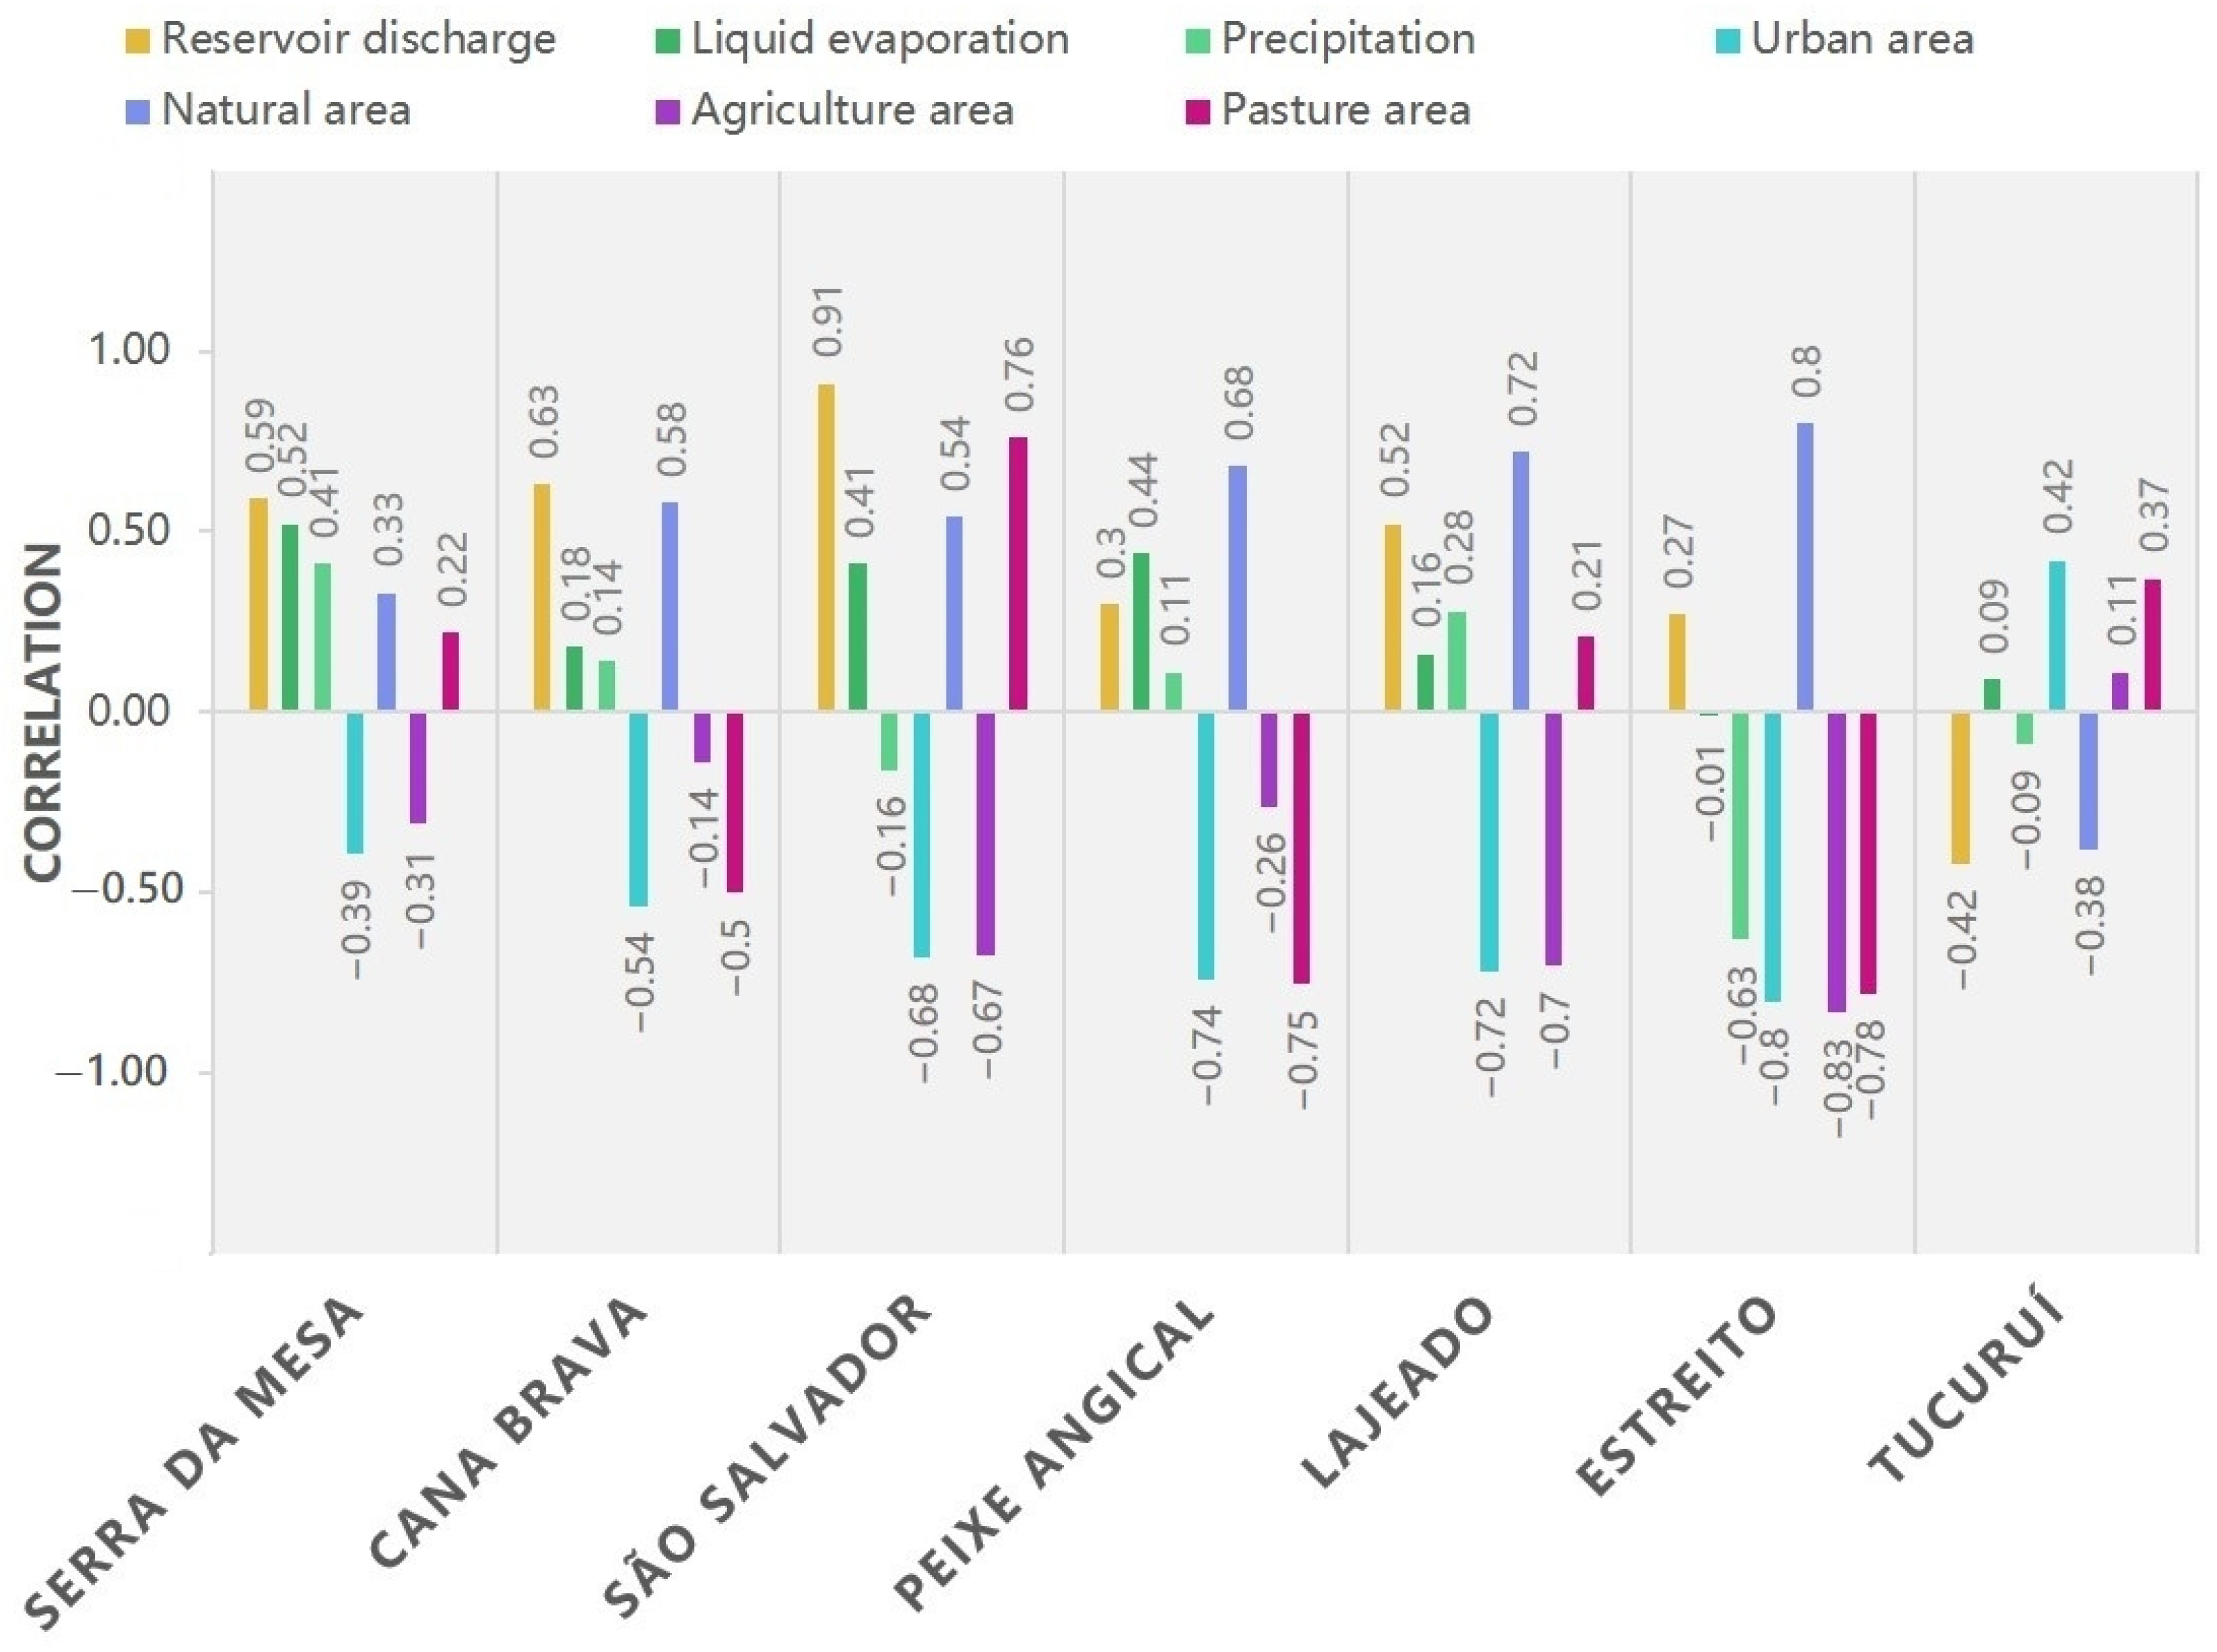
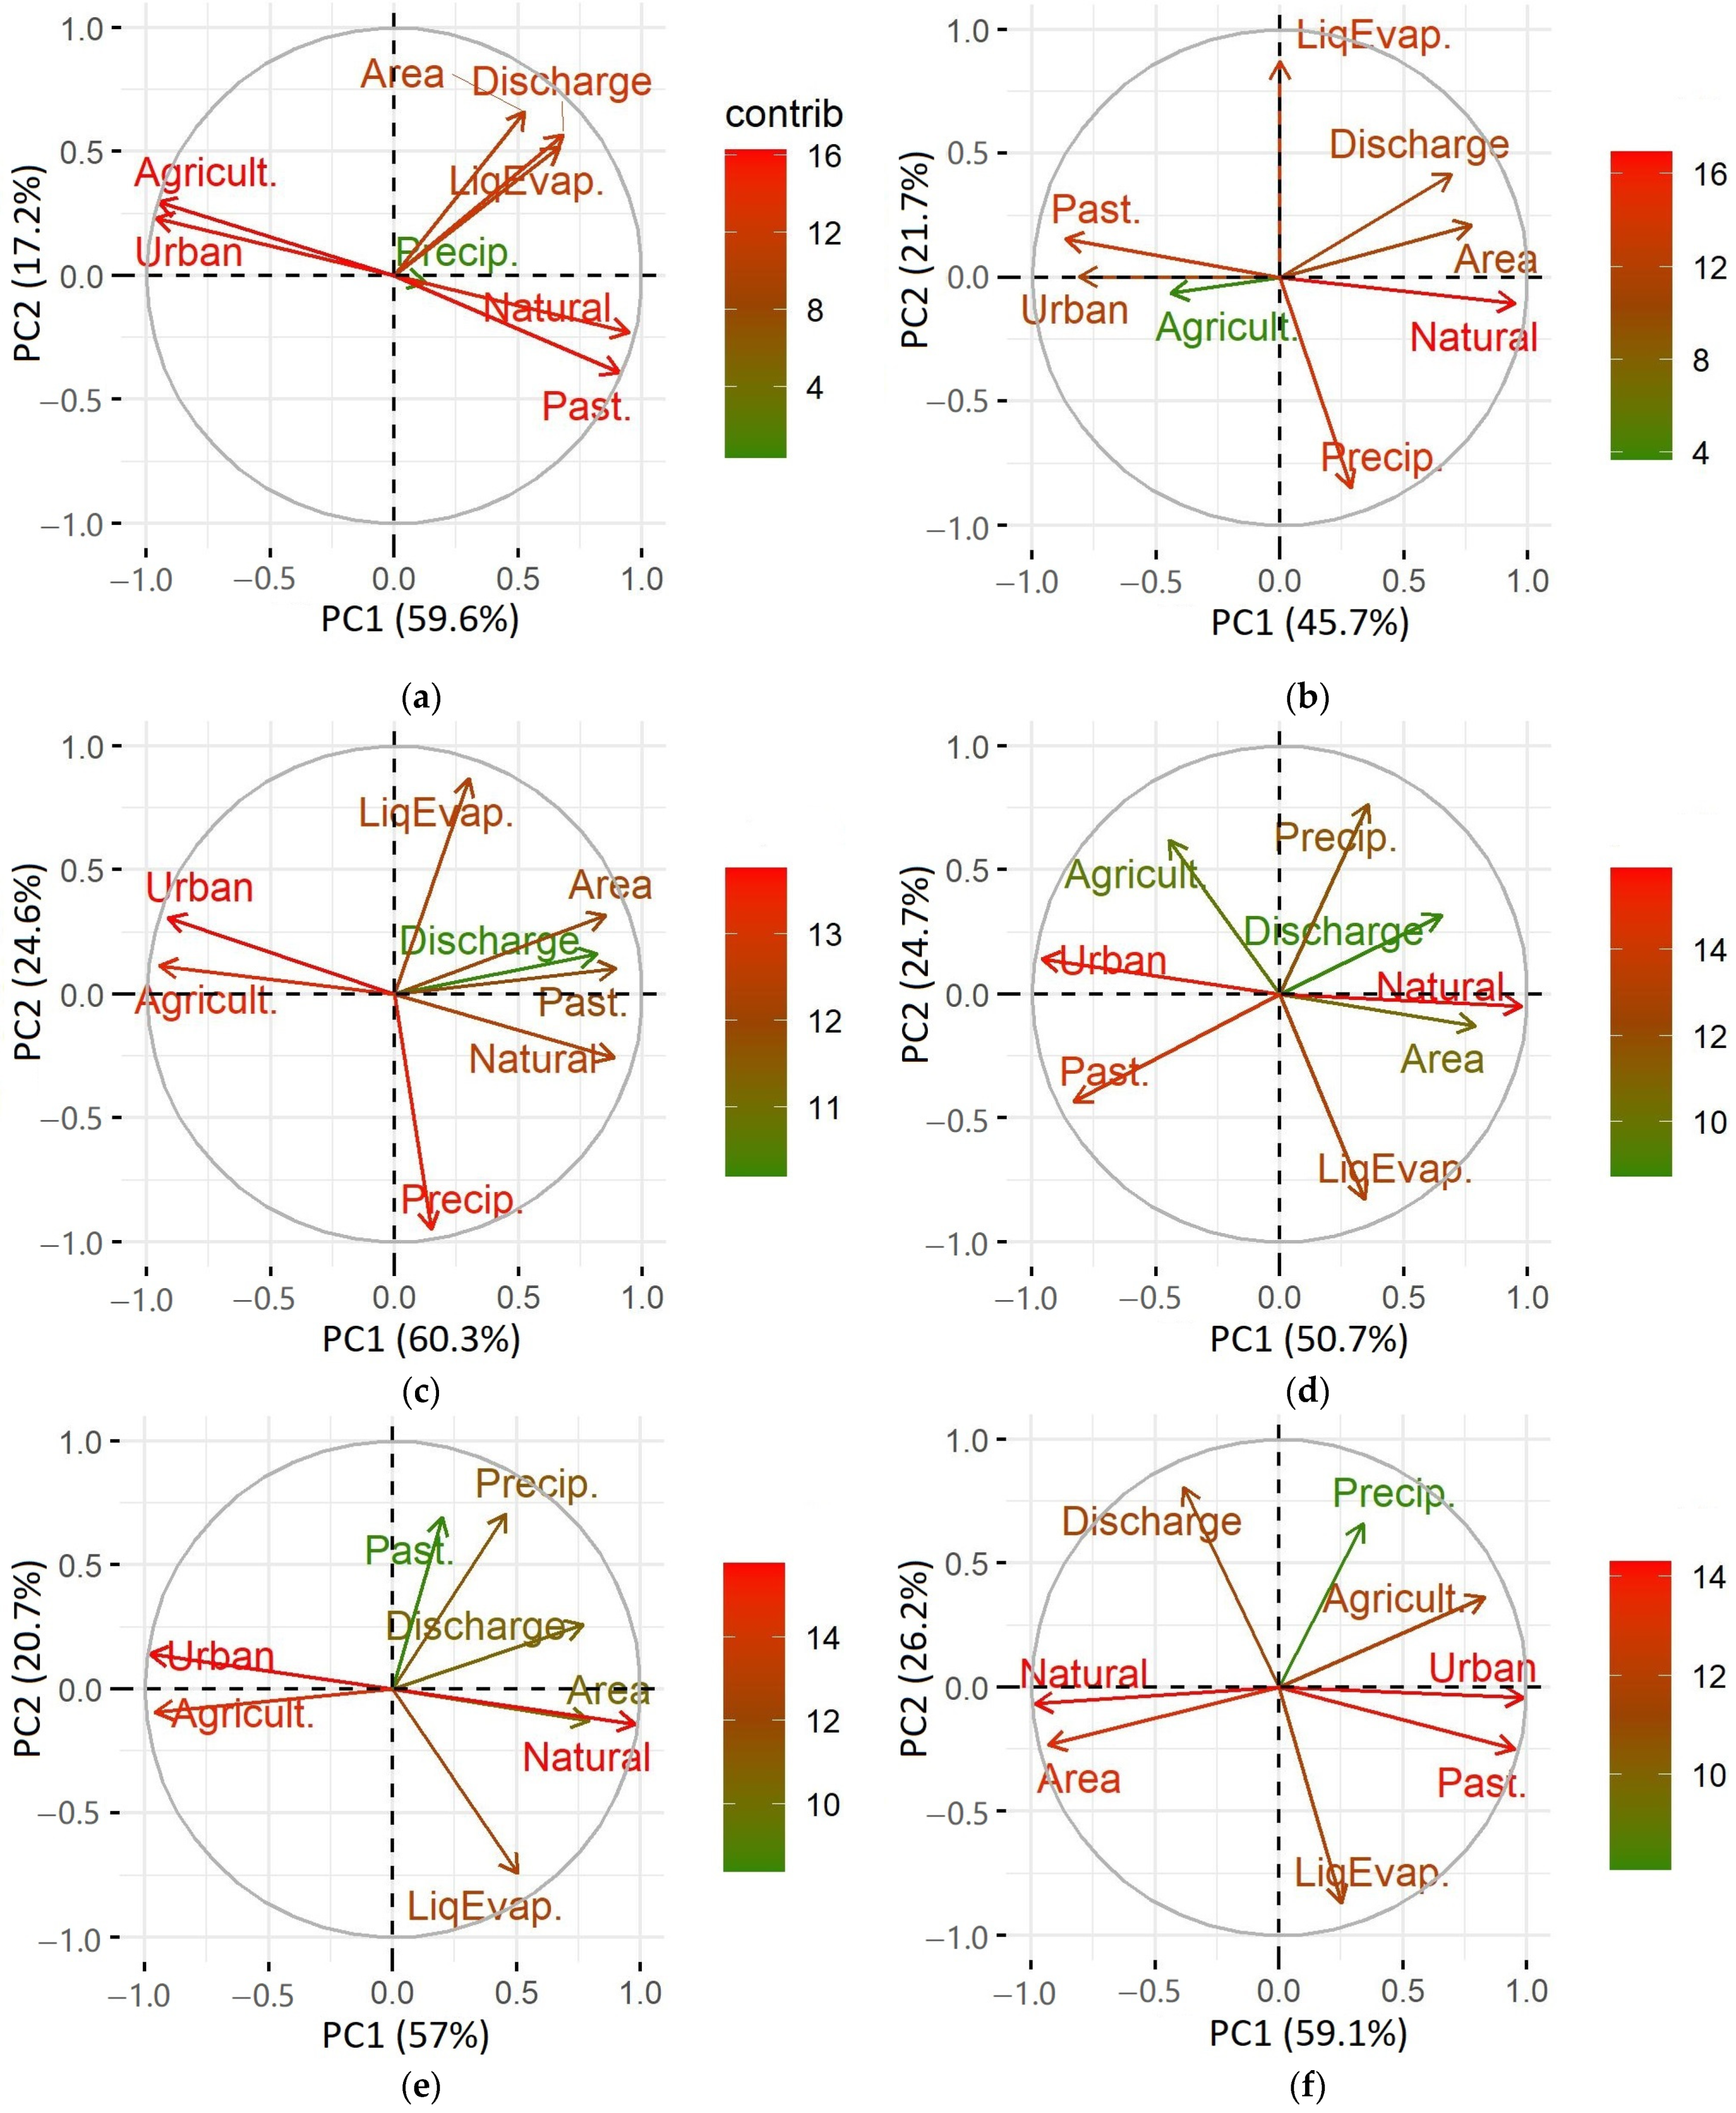
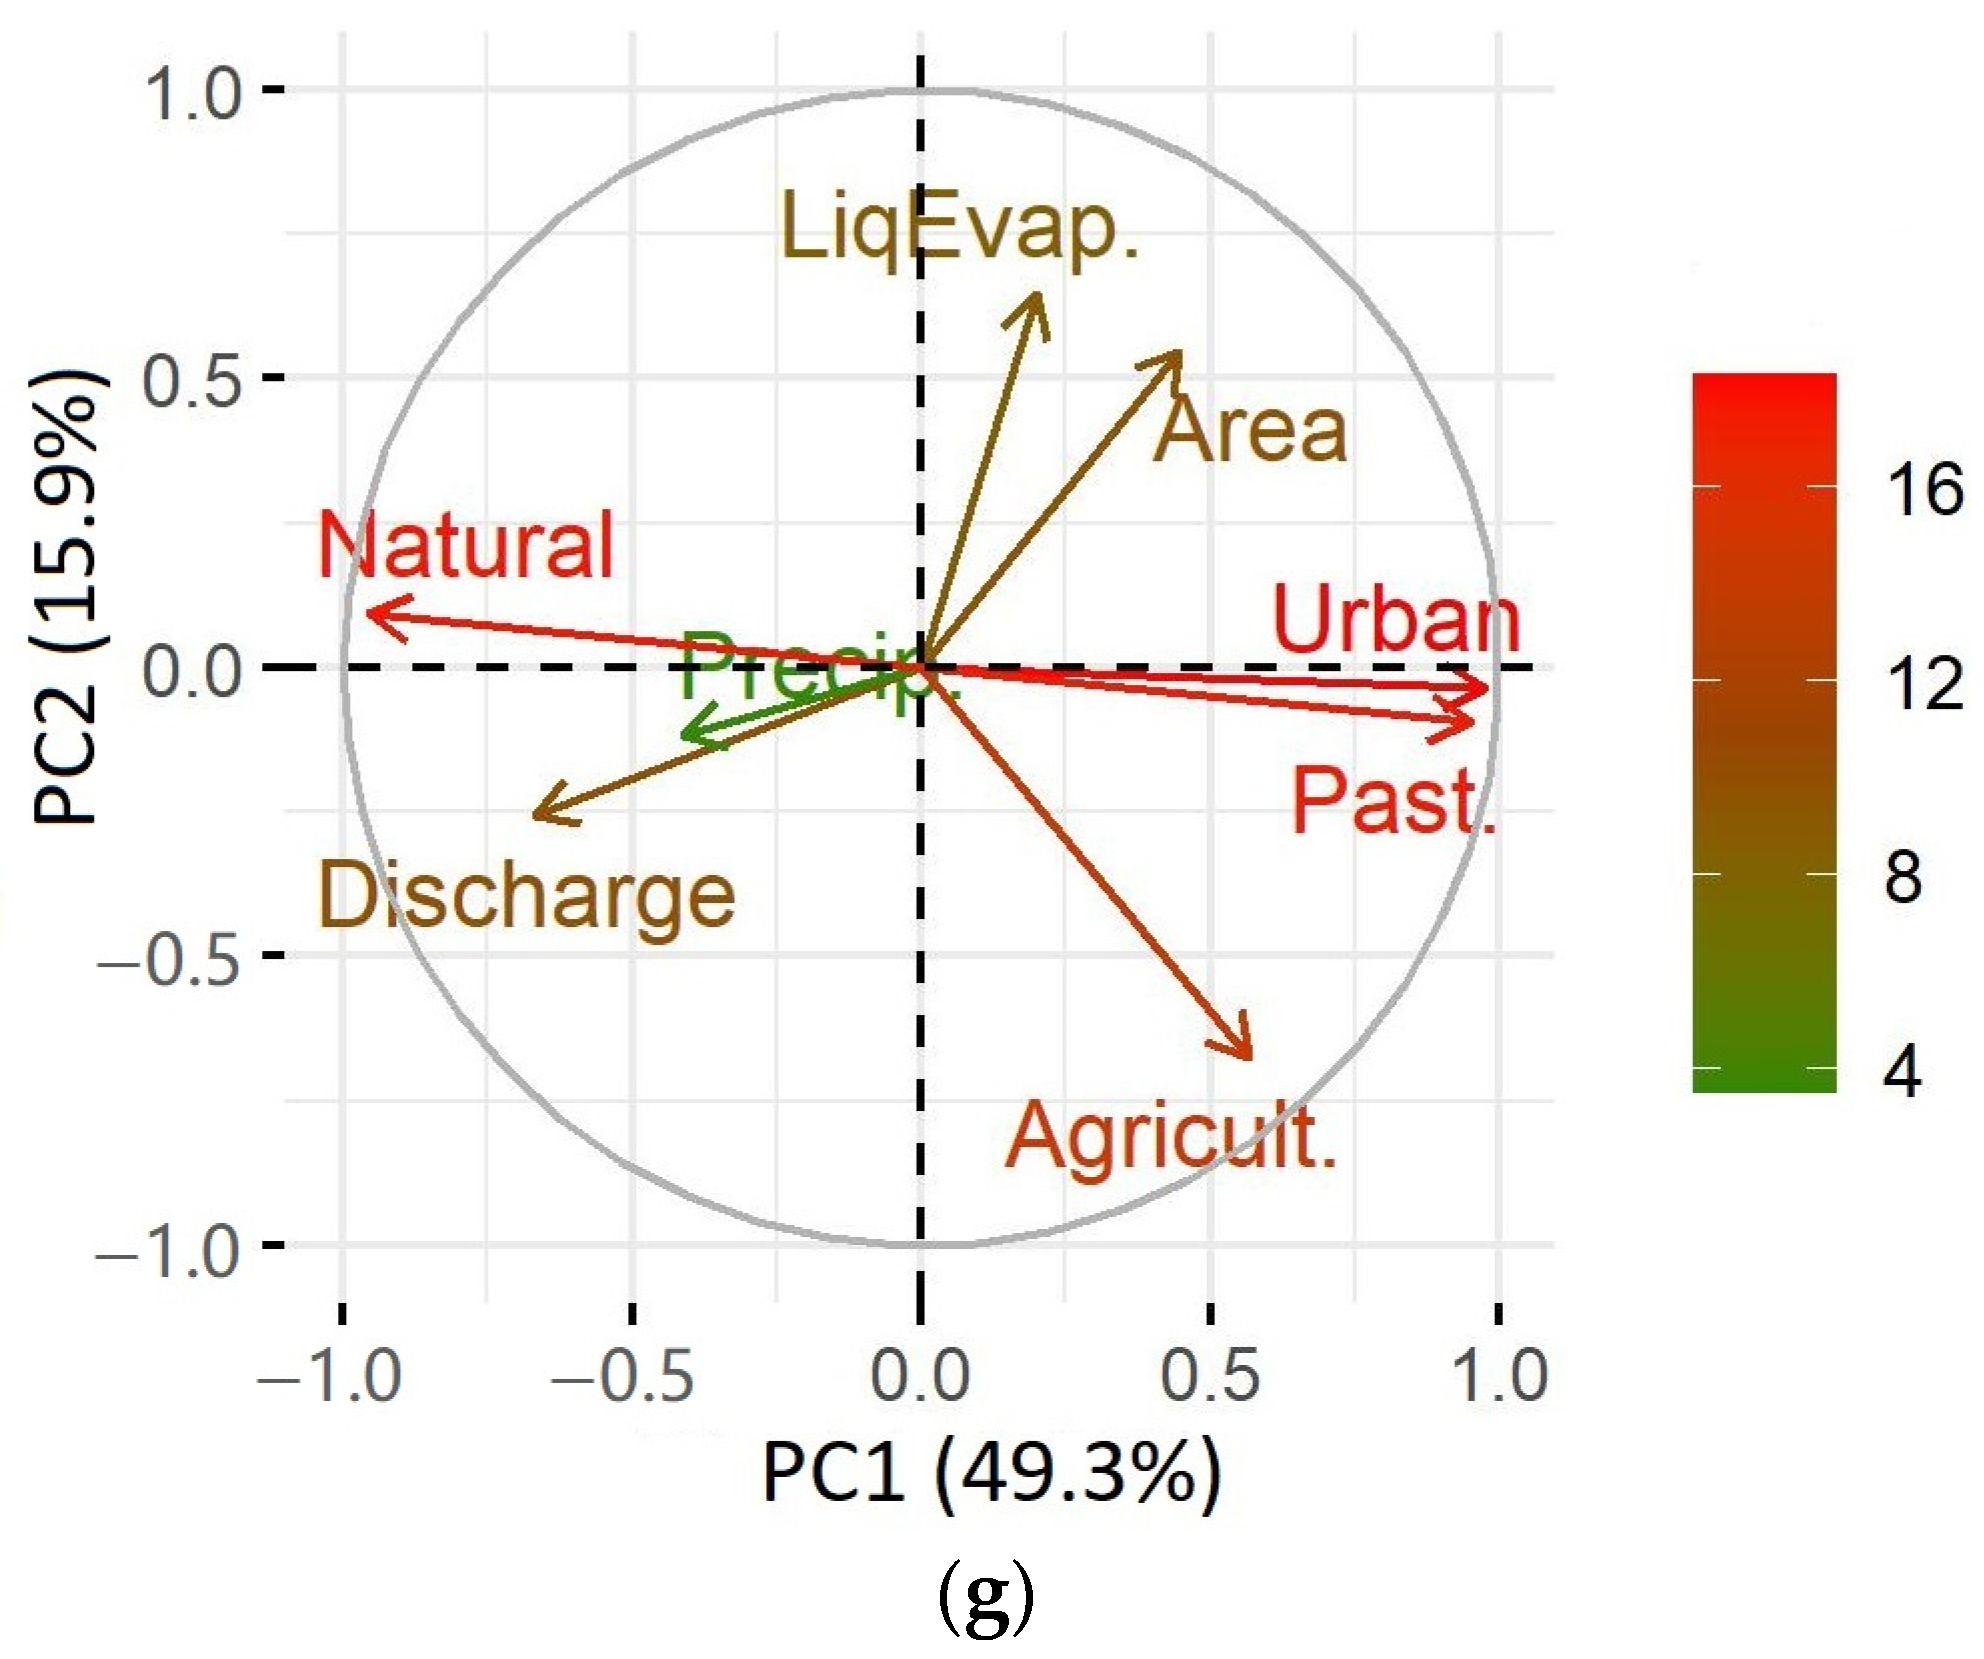
3.2. Correlation Analysis

All correlation significance tables (Tables S7 and S8) are available in the Supplementary Materials.

3.2.1. Tocantins–Araguaia Basin

For the first decade (2000–2010), only the LULC parameters and the number of reservoirs showed statistically significant correlations with the total area of the reservoirs (Table S7). These parameters show the highest correlations with the surface area (Figure 5). This was expected because the construction of a new reservoir makes a major contribution to the sum of the total area of the reservoirs. Considering the period from 2000 to 2010, the lowest correlation was found for precipitation, while the land-use-related classes were correlated positively with the total surface water area. Surprisingly, the area occupied by natural vegetation presented a high negative correlation. However, in the first decade, the area occupied by natural vegetation is converted not only into urban and farming areas but also into new artificial reservoirs, which explains this negative correlation. In the second decade, there was an inversion of the correlation between the surface water area and LULC parameters. In this period, the construction of dams decreased, causing the surface water area in the watershed to decrease as the land use increased.
Figure 6a,b show that the PCA corroborates the results discussed above. The number of reservoirs, the sum of the reservoir areas, and the LULC parameters were clustered together in both periods. One major difference is that in the period from 2000 to 2010, these parameters are close to each other, but they are not in the same quadrant as the total surface area (Figure 5b). The LULC parameters and the number of reservoirs also represent the highest contributions to the first two components (Figure 5a,b). Therefore, changes in the LULC data and the increasing number of reservoirs appear to be more closely associated with the total surface water area during the period from 2000 to 2010.
The second decade provided a better understanding of the behavior of the total surface water area without considering the effects of the addition of new reservoirs. In this period, the only parameter with a statistically significant correlation was the pasture area (highly negative correlation). Although the correlation with the precipitation increased in this period, it was not statistically significant (Table S7). This positive correlation is a more coherent result than the negative correlation observed in the other periods. As the pasture area increased significantly, we were expecting a decrease in the surface water area for the entire period. However, Figure 6c shows that not only the pasture area but also the precipitation and discharge of the downstream reservoirs are located in the same quadrant as the total surface water area. This indicates that the precipitation may have a greater impact than the correlation analysis indicated. Even if the precipitation is associated with the reservoir areas at the watershed scale, there is no sign of a significant decrease in the mean precipitation in the second decade that would explain the changes in the trend of the reservoir areas from one decade to the other.

3.2.2. Water Reservoir System

Changes in the LULC data are the most commonly correlated with the changes in the reservoir area. For the following five reservoirs, at least three LULC parameters were significantly correlated with the reservoir area (Table S8): Cana Brava, São Salvador, Peixe Angical, Lajeado, and Estreito. The upstream and downstream reservoir areas were not correlated with the LULC parameters, except for the reservoir located more internally in the cascade system. Three run-of-the-river-type dams located in the Cerrado savannah region (Cana Brava, São Salvador, and Lajeado) showed a significant correlation between the discharge and both the surface water area and LULC parameters (Table S8). In addition, the discharge of the Serra da Mesa reservoir was significantly correlated with the surface area.
The correlation analysis also showed that the surface water area of Tucuruí had no statistically significant correlation with any of the tested parameters. Serra da Mesa was the only reservoir that showed a statistically significant correlation between the liquid evaporation and the reservoir area. No reservoir showed any statistically significant correlation between the precipitation and the reservoir area.
Figure 7 shows that the discharge and the urban and agriculture areas in the reservoirs’ individual watersheds were correlated with the surface water area. Tucuruí showed a pattern that was the opposite of the patterns of the other reservoirs. The discharge has a decreasing trend, and the agricultural and urban areas tend to decrease in all reservoirs; only the Tucuruí reservoir has an increasing surface area.
Although the PCA (Figure 8) corroborates the finding that the parameters most often associated with reservoir areas are the LULC parameters and the discharge, there is new important information to be added. For all reservoirs, except for the Estreito reservoir (Figure 8f), the liquid evaporation is one of the factors most closely associated with the reservoir areas. In the Estreito reservoir, the most important parameter is the natural vegetation, even though other LULC parameters and the precipitation also present relatively high correlations. Associations with natural vegetation areas can also be seen in Cana Brava, São Salvador, Peixe Angical, and Lajeado. In the case of the Tucuruí reservoir, even though the liquid evaporation has a correlation lower than those of the other parameters and no statistically significant correlation, the main observed association of the reservoir area is its association with the liquid evaporation.

4. Discussion

Previous studies suggest the importance of considering climate change effects in the planning of water resource utilization to ensure the efficient and secure management of hydropower dams [10,56,57,58]. Climate change can affect the safety and performance of hydropower dams in multiple ways [10,59]: for example, it can (1) reduce the precipitation, consequently reducing the runoff; (2) increase the precipitation and possibly increase the river flow, which may lead to unproductive spills; (3) increase the temperature and, as a consequence, affect the soil moisture, which interferes with the runoff and storage of hydropower reservoirs; (4) cause extreme droughts; and (5) cause flooding, which can bring higher sediment loads than those forecasted. Although climate change effects are potentially important to the changes in the surface water area observed in our study area, no increase or decrease in the mean precipitation or any significant correlation with the reservoir area was observed for the Tocantins–Araguaia Basin and its reservoirs’ individual watersheds. There were, however, drought events, especially around the year 2016, that impacted some reservoir volumes not only in the Tocantins–Araguaia Basin and its reservoirs’ watersheds but also in reservoirs located in other regions of Brazil [53,54,60], and these events were possibly related to climate change. Penereiro et al. [31] also did not observe changes in precipitation patterns in the Tocantins–Araguaia Basin. Indeed, they observed significant positive temperature trends, mainly at stations located along the Tocantins River.
It is not possible to state that the changes in the reservoir areas are linked to climate change, especially if the temperature changes are confirmed and are partially responsible for changes in the flow of the Tocantins River [30,31,61] and in the discharge of the reservoirs. However, river flow changes are more associated with the construction of the dams and LULC changes in the basin [30,61]. A significant decrease in the discharge of the reservoirs, especially the Serra da Mesa reservoir, demonstrates the possibility that less water has arrived in the reservoir system or that more water has been extracted for human use. This is a relationship that should be studied and investigated in future hydrological studies.
Even though climate change may impact the decrease in the surface water area of the Tocantins–Araguaia Basin, changes in the LULC and the discharge presented high association with shrinking areas. The decrease in reservoir areas and discharges also seems to have intensified over the last decade. The precipitation had an overall decreasing trend in the Tocantins–Araguaia Basin, but so far, this trend is not statistically significant. Nonetheless, these relations should be further explored in future works since changes in the precipitation do not imply similar changes in other variables, as shown by Deusdará-Leal et al. [62], who found that a 1% change in the rainfall resulted in changes in the streamflow from 1.2% to 2.2% in an annual analysis and from 1.8% to 4.8% in an analysis of 20-year moving averages in southeast Brazil. Cuartas et al. [63] observed significant forest cover loss in basins located in the Central West Region of Brazil, including the Tocantins–Araguaia Basin; forests were mostly replaced by agricultural areas. There was no evidence of an increasing trend in the frequency of droughts in these basins according to the standardized precipitation index. Decreasing trends in the standardized precipitation and evapotranspiration index (increased frequency of water deficit conditions) were observed in these basins. The study’s findings indicate a link between deforestation in some areas and a trend toward an increasing water deficit due to increasing surface temperatures.
The Tocantins–Araguaia Basin showed an intense LULC change over the last two decades: natural environments were progressively replaced by anthropic environments, such as agricultural and pasture areas. The biomes that cover the Tocantins–Araguaia Basin (Amazonia and Cerrado) have suffered widespread degradation [64,65,66]. Agricultural area growth also augments the water demand due to the need to irrigate crops. Moreover, Volken et al. [64] observed that the low flows are critical during the dry season in the Urubu River Basin, which is part of the Tocantins–Araguaia Basin. Irrigation in this period is mainly associated with seed crops (soybeans) sown at the beginning of May that require large amounts of water. This high water demand is linked not only to the needs of plants but also to the predominant irrigation system in the basin. Irrigation requires large volumes of water and has a low capacity for the optimization of water consumption. Evaporation from irrigation also increases the water demand. Additional studies involving evapotranspiration are needed to better understand the associations between the variables included in this study. Although Deusdará-Leal et al. [62] found negative trends between the streamflow and rainfall and an increasing trend in the potential evapotranspiration, this may also be associated with LULC changes that lead to disturbances in the atmosphere–surface–cover–groundwater cycle.
Since the presence of dams interferes with the river flow and since the discharge of the reservoirs is strongly associated with the reservoir area, the management of reservoirs and hydropower production is a key component of guaranteeing the sustainability of the reservoirs and mitigating shrinking. The integrated management of all reservoirs and the continuous monitoring of climate change effects to adjust the management plan to new environmental conditions is indispensable to maintain water security and hydropower production. Furthermore, the construction of dams and LULC changes not only impact the river flows, as discussed above, but also change the riparian forests associated with the floodplain of the Tocantins River [37,67]. The floodplains are undergoing drastic hydrologic alteration because of multiple dams causing cumulative and nonlinear impacts, especially for hydroperiod and flood timing [37,67].
The multiple dams are a factor that alters the LULC and the flow of the Tocantins River and, consequently, the discharge of the reservoirs. The amount of discharge is also dependent on resource management decision making. In fact, the operation conditions of Serra da Mesa and other reservoirs have been revised multiple times in the last decade to decrease the minimum discharge values due to drought events and/or critically low water levels [38]. Guaranteeing the sustainability of the reservoirs is imperative to maintaining the water supply in the context of growing demand in the watershed due to increasing agricultural and domestic consumption. Smaller reservoir areas and lower water levels can affect the country’s hydropower production negatively since these reservoirs are responsible for more than 8% of Brazilian hydropower production.
To mitigate these outcomes and better control the flow between reservoirs, the integrated management of all the cascade reservoirs is essential. It is also vital to reduce the rate of the degradation of the natural environments of the watershed to avoid further loss in the mean reservoir area in the future.

5. Conclusions

This study shows that the construction of new reservoirs led to an increase of 37.7% in the total water surface area of the reservoirs located in the Tocantins–Araguaia Basin during the period from 2000 to 2020. However, there is a significant decreasing trend in the surface area for most of the studied reservoirs when they are considered individually, except for the Tucuruí and Serra da Mesa reservoirs, which showed no significant surface area trend for the entire 20-year period. Tucuruí is the only reservoir that does not seem to have a decreasing area, especially after 2010. Serra da Mesa, on the other hand, from 2010 to 2020, presented a significantly decreasing trend in the surface water area. The annual average discharge shows an apparent decrease for all the reservoirs, even though this decrease is only statistically significant for the São Salvador, Peixe Angical, Lajeado, and Tucuruí reservoirs. All reservoirs showed significant decreasing patterns between 2010 and 2020.
Even though the mean annual precipitation values appear to have an overall decreasing trend, this trend was not statistically significant in the Tocantins–Araguaia Basin or in the reservoirs’ watersheds for the complete time series or for each decade. The decrease in the reservoir areas was steeper, especially over the last 10 years, than the decrease in the precipitation, except for Tucuruí; this makes it impossible to relate changes in the precipitation to changes in the reservoir surface area.
From 2000 to 2020, the LULC changed substantially, and the three anthropic land use classes systematically replaced natural areas. The areas of native savannahs and forests decreased sharply in the Tocantins–Araguaia Basin and in all reservoirs’ individual watersheds (up to 36% in the Tucuruí reservoir watershed). In contrast, agricultural, pasture, and urban areas increased significantly (up to 2832% growth in the agricultural area in the Tucuruí watershed). Agricultural areas increased mostly from 2010 to 2020, accompanied by a large increase in crop irrigation.
In the Tocantins–Araguaia Watershed during the first decade (2000–2010), the construction of new reservoirs was the major contributor to the sum of the total water surface area. The number of reservoirs has, therefore, a high, positive correlation with the sum of the areas of the reservoirs. From 2010 to 2020, the construction of dams decreased and the reservoir areas in the watershed also started to decrease, even though the land use increased. The PCA corroborates these results, but for the period from 2010 to 2020, it did not show the influence of the pasture area, precipitation, and discharge on the increase in the surface water area. This indicates that the precipitation possibly has a more significant impact than the correlation analysis indicated.
Changes in the LULC and discharge are the most correlated with the changes in separate reservoir areas. The upstream and downstream reservoir areas are more correlated with the areas of reservoirs located more internally in the cascade system. Four out of seven reservoirs had discharge parameters that were significantly correlated with the surface water area. The surface water area of Tucuruí had no statistically significant correlation with any of the parameters tested. No reservoir showed any significant correlation between the precipitation and the reservoir area.
These results indicate that although climate change effects are potentially important to the changes in the water reservoir areas, it is not possible to state that the changes in the reservoir areas are linked to climate change. The precipitation shows an overall decreasing trend in the Tocantins–Araguaia Basin, but this trend was not statistically significant. The decrease in the reservoir areas was associated with the replacement of natural vegetation by agriculture. The increase in irrigation possibly led to a reduction in reservoir discharges. This evidence needs to be further analyzed in hydrological studies, especially through hydrological modeling.
The significant decrease in the discharge of the Serra da Mesa reservoir, the first of the cascade system, might also indicate that less water is coming from the upstream watershed of the Tocantins River to feed the cascade system, which should be investigated in future studies. The fact that the Tocantins River has a high number of dams is another factor that affects the reservoir discharge since the amount of water discharged into the downstream system is dependent on human management. The minimum values have been lowered several times in recent years in response to drought events. This management should be sustainable and guarantee the long-term water supply and hydropower energy in the context of growing demand. This is only possible with the integrated management of all reservoirs and a reduction in the rate of degradation of natural environments. In this sense, this paper provides a simple methodology that can be used to help monitor the continuity of the tendencies in the analyzed parameters and portray their associations with reservoir changes, which are helpful for watershed management. The results will continue to improve as more data are collected and the time series grow.

Supplementary Materials

The following supporting information can be downloaded at: https://www.mdpi.com/article/10.3390/w15091684/s1, Table S1: Results of the trend test parameters for the Tocantins–Araguaia Basin. Table S2: Results of the trend test parameters for Serra da Mesa, Cana Brava, and São Salvador reservoirs from initial monitoring year to 2020. Table S3: Results of the trend test parameters for Peixe Angical, Lajeado, Estreito, and Tucuruí reservoirs from the initial monitoring year to 2020. Table S4: Results of the trend test parameters from 2000 to 2010 for Serra da Mesa and Tucuruí reservoirs. Table S5: Results of the trend test parameters for Serra da Mesa, Cana Brava, and São Salvador reservoirs from 2010 to 2020. Table S6: Results of the trend test parameters for Peixe Angical, Lajeado, and Tucuruí reservoirs from 2010 to 2020. Table S7: Correlation between Tocantins–Araguaia Basin parameters and the total area of water reservoirs. Table S8: Correlation between reservoir parameters and area of water reservoir.

Author Contributions

L.V.V.: conceptualization, methodology, validation, formal analysis, data curation, visualization, writing—original draft. I.R.d.F.: conceptualization, methodology, formal analysis, data curation, visualization, writing—original draft. R.E.C.: conceptualization, methodology, writing—review and editing, supervision. T.d.A.: conceptualization, methodology, supervision. J.G.: methodology, writing—review and editing. E.E.S.: methodology, writing—review and editing. All authors have read and agreed to the published version of the manuscript.

Funding

This research was funded by Fundação de Amparo à Pesquisa do Distrito Federal (FAPDF) grant number 00193.00001143/2021-15, Fundação de Amparo à Pesquisa do Distrito Federal (FAPDF) support for scientific publications, Universidade de Brasília support for scientific publication and by the Coordenação de Aperfeiçoamento de Pessoal de Nível Superior—Brasil (CAPES)—Finance Code 001.

Institutional Review Board Statement

Not applicable.

Informed Consent Statement

Not applicable.

Data Availability Statement

The links to the databases used in this paper are listed below: Precipitation: https://giovanni.gsfc.nasa.gov/giovanni/#service=TmAvMp&starttime=&endtime=&dataKeyword=gpm (accessed on 11 November 2022); liquid evaporation: https://metadados.snirh.gov.br/geonetwork/srv/eng/catalog.search#/metadata/c5b45a6e-69df-4a26-9dd9-846160b10e2a (accessed on 11 November 2022); script for area calculation of water reservoirs in the Google Earth Engine platform: git clone: https://earthengine.googlesource.com/users/valadaolarissa/tocantinsReservoirsAreas (accessed on 11 November 2022); discharge data: https://www.ana.gov.br/sar0/MedicaoSin (accessed on 11 November 2022); LULC data produced by the MapBiomas Project: https://mapbiomas.org/ (accessed on 11 November 2022).

Acknowledgments

The authors would like to acknowledge the professors and staff from the University of Brasília who made this work possible to be accomplished despite the difficult times of social distancing, home office work, and remote lectures.

Conflicts of Interest

The authors declare that there are no competing financial interest or personal relationship that could have appeared to influence the work reported in this paper.

References

  1. International Energy Agency (IEA). Management Models for Hydropower Cascade Reservoir: Main Report; International Energy Agency (IEA): Paris, France, 2021. [Google Scholar]
  2. International Energy Agency (IEA). Electricity Information: Overview; International Energy Agency (IEA): Paris, France, 2021. [Google Scholar]
  3. Empresa de Pesquisa Energética (EPE). Balanço Energético Nacional 2021: Ano Base 2020; EPE: Rio de Janeiro, Brazil, 2021; 292p. [Google Scholar]
  4. Ministério de Minas e Energia (MME). Anuário Estatístico de Energia Elétrica 2021; MME: Brasília, Brazil, 2021; 255p. [Google Scholar]
  5. Pelicice, F.M.; Agostinho, A.A.; Akama, A.; Andrade Filho, J.D.; Azevedo-Santos, V.M.; Barbosa, M.V.M.; Bini, L.M.; Brito, M.F.G.; Candeiro, C.R.D.A.; Caramaschi, P.; et al. Large-scale degradation of the Tocantins-Araguaia River Basin. Environ. Manag. 2021, 68, 445–452. [Google Scholar] [CrossRef] [PubMed]
  6. Latrubesse, E.M.; Arima, E.; Ferreira, M.E.; Nogueira, S.H.; Wittmann, F.; Dias, M.S.; Dagosta, F.C.P.; Bayer, M. Fostering water resource governance and conservation in the Brazilian Cerrado biome. Conserv. Sci. Pract. 2019, 1, e77. [Google Scholar] [CrossRef]
  7. Martins, P.R.; Sano, E.E.; Martins, E.S.; Vieira, L.C.G.; Salemi, L.F.; Vasconcelos, V.; Couto Júnior, A.F. Terrain units, land use and land cover, and gross primary productivity of the largest fluvial basin in the Brazilian Amazonia/Cerrado ecotone: The Araguaia River Basin. Appl. Geogr. 2021, 127, 102379. [Google Scholar] [CrossRef]
  8. Agência Nacional de Águas e Saneamento Básico (ANA). Conjuntura dos Recursos Hídricos no Brasil 2021—Relatório Pleno; ANA: Brasília, Brazil, 2022; 132p. [Google Scholar]
  9. Agência Nacional de Águas e Saneamento Básico (ANA). Atlas Irrigação: Uso da Água na Agricultura Irrigada, 2nd ed.; ANA: Brasília, Brazil, 2021. [Google Scholar]
  10. Dias, V.S.; Luz, M.P.; Medero, G.M.; Nascimento, D.T.F.N. An overview of hydropower reservoirs in Brazil: Current situation, future perspectives and impacts of climate change. Water 2018, 10, 592. [Google Scholar] [CrossRef]
  11. Sagan, V.; Peterson, K.T.; Maimaitijiang, M.; Sidike, P.; Sloan, J.; Greeling, B.A.; Maalouf, S.; Adams, C. Monitoring inland water quality using remote sensing: Potential and limitations of spectral indices, bio-optical simulations, machine learning, and cloud computing. Earth-Sci. Rev. 2020, 205, 103187. [Google Scholar] [CrossRef]
  12. Kutser, T.; Pascual, G.C.; Barbosa, C.; Paavel, B.; Ferreira, R.; Carvalho, L.; Toming, K. Mapping inland water carbon content with Landsat 8 data. Int. J. Remote Sens. 2016, 37, 2950–2961. [Google Scholar] [CrossRef]
  13. Curtarelli, M.; Neto, E.; Siqueira, F.; Yopan, F.; Soares, G.; Pauli, G.; Souza, J.; Silva, L.; Sagaz, M.; Demay, M.; et al. QDA-System: A cloud-based system for monitoring water quality in Brazilian hydroelectric reservoirs from space. Remote Sens. 2022, 14, 1541. [Google Scholar] [CrossRef]
  14. Valadão, L.V.; Cicerelli, R.E.; Almeida, T.; Ma, J.B.C.; Garnier, J. Reservoir metrics estimated by remote sensors based on the Google Earth Engine platform. Remote Sens. Appl. Soc. Environ. 2021, 24, 100652. [Google Scholar] [CrossRef]
  15. Xavier, G.O.; Almeida, T.; Oliveira, C.M.M.; Oliveira, P.D.S.; Costa, V.H.B.; Granado, L.M.A. Estimate and evaluation of reservoir metrics in Serra da Mesa dam (GO) using the Google Earth Engine platform. Rev. Ambiente Água 2020, 15, e2584. [Google Scholar] [CrossRef]
  16. Martins, V.S.; Kaleita, A.; Barbosa, C.C.F.; Fassoni-Andrade, A.C.; Lobo, F.L.; Novo, E.M.L.M. Remote sensing of large reservoir in the drought years: Implications on surface water change and turbidity variability of Sobradinho reservoir (Northeast Brazil). Remote Sens. Appl. Soc. Environ. 2019, 13, 275–288. [Google Scholar] [CrossRef]
  17. Pipitone, C.; Maltese, A.; Dardanelli, G.; Lo Brutto, M.; La Loggia, G. Monitoring water surface and level of a reservoir using different remote sensing approaches and comparison with dam displacements evaluated via GNSS. Remote Sens. 2018, 10, 71. [Google Scholar] [CrossRef]
  18. Kansara, P.; Lakshmi, V. Water levels in the major reservoirs of the Nile River Basin—A comparison of Sentinel with satellite altimetry data. Remote Sens. 2022, 14, 4667. [Google Scholar] [CrossRef]
  19. Lobo, F.D.; Nagel, G.W.; Maciel, D.A.; Carvalho, L.A.; Martins, V.S.; Barbosa, C.C.; Novo, E.M. AlgaeMAp: Algae bloom monitoring application for inland waters in Latin America. Remote Sens. 2021, 13, 2874. [Google Scholar] [CrossRef]
  20. Wang, Q.; Song, K.; Xiao, X.; Jacinthe, P.-A.; Wen, Z.; Zhao, F.; Tao, H.; Li, S.; Shang, Y.; Wang, Y.; et al. Mapping water clarity in North American lakes and reservoirs using Landsat images on the GEE platform with the RGRB model. ISPRS J. Photogramm. Remote Sens. 2022, 194, 39–57. [Google Scholar] [CrossRef]
  21. Gao, H.; Birkett, C.; Lettenmaier, D.P. Global monitoring of large reservoir storage from satellite remote sensing. Water Resour. Res. 2012, 48, W09504. [Google Scholar] [CrossRef]
  22. Yao, J.; Sun, S.; Zhai, H.; Feger, K.-H.; Zhang, L.; Tang, X.; Li, G.; Wang, Q. Dynamic monitoring of the largest reservoir in North China based on multi-source satellite remote sensing from 2013 to 2022: Water area, water level, water storage and water quality. Ecol. Indic. 2022, 144, 109470. [Google Scholar] [CrossRef]
  23. Zhou, B.; Shang, M.; Feng, L.; Shan, K.; Feng, L.; Ma, J.; Liu, X.; Wu, L. Long-term remote tracking the dynamics of surface water turbidity using a density peaks-based classification: A case study in the Three Gorges Reservoir, China. Ecol. Indic. 2020, 116, 106539. [Google Scholar] [CrossRef]
  24. Cai, X.; Feng, L.; Hou, X.; Chen, X. Remote sensing of the water storage dynamics of large lakes and reservoirs in the Yangtze River Basin from 2000 to 2014. Sci. Rep. 2016, 6, 36405. [Google Scholar] [CrossRef]
  25. Ávila, L.; Silveira, R.; Campos, A.; Rogiski, N.; Gonçalves, J.; Scortegagna, A.; Freita, C.; Aver, C.; Fan, F. Comparative evaluation of five hydrological models in a large-scale and tropical river basin. Water 2022, 14, 3013. [Google Scholar] [CrossRef]
  26. Foglia, L.; Hill, M.C.; Mehl, S.W.; Burlando, P. Sensitivity analysis, calibration, and testing of a distributed hydrological model using error-based weighting and one objective function. Water Resour. Res. 2009, 45, W06427. [Google Scholar] [CrossRef]
  27. Salamon, P.; Feyen, L. Disentangling uncertainties in distributed hydrological modeling using multiplicative error models and sequential data assimilation. Water Resour. Res. 2010, 46, W12501. [Google Scholar] [CrossRef]
  28. Monteiro, J.A.F.; Strauch, M.; Srinivasan, R.; Abbaspour, K.; Gücker, B. Accuracy of grid precipitation data for Brazil: Application in river discharge modelling of the Tocantins catchment. Hydrol. Process. 2016, 30, 1419–1430. [Google Scholar] [CrossRef]
  29. Souza, C.M.; Shimbo, J.Z.; Rosa, M.R.; Parente, L.L.; Alencar, A.A.; Rudorff, B.F.T.; Hasenack, H.; Matsumoto, M.; Ferreira, L.G.; Souza-Filho, P.W.M.; et al. Reconstructing three decades of land use and land cover changes in Brazilian biomes with Landsat archive and Earth Engine. Remote Sens. 2020, 12, 2735. [Google Scholar] [CrossRef]
  30. Costa, M.H.; Botta, A.; Cardille, J.A. Effects of large-scale changes in land cover on the discharge of the Tocantins River, Southeastern Amazonia. J. Hydrol. 2003, 283, 206–217. [Google Scholar] [CrossRef]
  31. Penereiro, J.C.; Martins, L.L.S.; Beretta, V.Z. Identificação de variabilidades e tendências interanuais em medidas hidro-climáticas na região hidrográfica do Tocantins-Araguaia, Brasil. Rev. Bras. Climatol. 2016, 18, 219–241. [Google Scholar] [CrossRef]
  32. Zhou, C.; Xie, Y.; Zhang, A.; Liu, C.; Yang, J. Spatiotemporal analysis of interactions between seasonal water, climate, land use, policy, and socioeconomic changes: Hulun-Buir steppe as a case study. Water Res. 2022, 209, 117937. [Google Scholar] [CrossRef]
  33. Agência Nacional de Águas e Saneamento Básico (ANA). Conjuntura dos Recursos Hídricos no Brasil: Regiões Hidrográficas Brasileiras-Edição Especial; ANA: Brasília, Brazil, 2015. [Google Scholar]
  34. Oliveira, M.A.; Oliveira, M.S. Caracterização operacional da usina hidrelétrica Luis Eduardo Magalhães e o uso dos recursos hídricos do rio Tocantins para geração de energia. Braz. J. Dev. 2021, 7, 44952–44964. [Google Scholar] [CrossRef]
  35. Peel, M.C.; Finlayson, B.L.; McMahon, T.A. Updated world map of the Köppen-Geiger climate classification. Hydrol. Earth Syst. Sci. 2007, 11, 1633–1644. [Google Scholar] [CrossRef]
  36. Ho, J.T.; Thompson, J.R.; Brierley, C. Projections of hydrology in the Tocantins-Araguaia Basin, Brazil: Uncertainty assessment using the CMIP5 Ensemble. Hydrol. Sci. J. 2016, 61, 551–567. [Google Scholar] [CrossRef]
  37. Swanson, A.C.; Bohlman, S. Cumulative impacts of land cover change and dams on the land–water interface of the Tocantins River. Front. Environ. Sci. 2021, 9, 662904. [Google Scholar] [CrossRef]
  38. Fioreze, A.P.; Pena, D.L.; Lima, A.A.B.D.; Mendonca, B.C.D.S.E. Relatório de Análise de Impacto Regulatório No 1/2020/CORSH/SOE; ANA: Brasília, Brazil, 2020; 39p. [Google Scholar]
  39. R Core Team. R: A Language and Environment for Statistical Computing; R Foundation for Statistical Computing: Viena, Austria, 2021. [Google Scholar]
  40. RStudio Team. RStudio: Integrated Development for R; RStudio: Boston, MA, USA, 2022. [Google Scholar]
  41. Agência Nacional de Águas e Saneamento Básico (ANA). Catálogo de Metadados da ANA. Available online: https://metadados.snirh.gov.br/geonetwork/srv/eng/catalog.search#/home (accessed on 26 January 2023).
  42. Agência Nacional de Águas e Saneamento Básico (ANA). Base Hidrográfica Ottocodificada; ANA: Brasília, Brazil, 2015. [Google Scholar]
  43. Pfafstetter, O. Classificação de Bacias Hidrográficas: Metodologia de Codificação; Departamento Nacional de Obras de Saneamento (DNOS): Rio de Janeiro, Brazil, 1989. [Google Scholar]
  44. Gorelick, N.; Hancher, M.; Dixon, M.; Ilyushchenko, S.; Thau, D.; Moore, R. Google Earth Engine: Planetary-scale geospatial analysis for everyone. Remote Sens. Environ. 2017, 202, 18–27. [Google Scholar] [CrossRef]
  45. Agência Nacional de Águas e Saneamento Básico (ANA). SAR. Sistema de Acompanhamento de Reservatórios. Available online: https://www.ana.gov.br/sar/ (accessed on 5 January 2023).
  46. Agência Nacional de Águas e Saneamento Básico (ANA). Evaporação Líquida de Reservatórios Artificiais no Brasil; ANA: Brasília, Brazil, 2021; 91p. [Google Scholar]
  47. Acker, J.G.; Leptoukh, G. Online analysis enhances use of NASA Earth Science data. Eos Trans. Am. Geophys. Union 2007, 88, 14–17. [Google Scholar] [CrossRef]
  48. Huffman, G.J.; Stocker, E.F.; Bolvin, D.T.; Nelkin, E.J.; Jackson, T. GPM IMERG Final Precipitation L3 1 Month 0.1 Degree × 0.1 Degree V06; Greenbelt, M.D., Ed.; GES DISC: Greenbelt, Maryland, 2019. [Google Scholar]
  49. Nascimento, J.G.; Althoff, D.; Bazame, H.C.; Neale, C.M.U.; Duarte, S.N.; Ruhoff, A.L.; Gonçalves, I.Z. Evaluating the latest IMERG products in a subtropical climate: The case of Paraná State, Brazil. Remote Sens. 2021, 13, 906. [Google Scholar] [CrossRef]
  50. van Buuren, S.; Groothuis-Oudshoorn, K. Mice: Multivariate imputation by chained equations in R. J. Stat. Softw. 2011, 45, 1–67. [Google Scholar] [CrossRef]
  51. McLeod, A.I. Package “Kendall”. 2022. Available online: https://cran.r-project.org/web/packages/Kendall/Kendall.pdf (accessed on 10 December 2022).
  52. Lyubchich, V.; Gel, Y.R. Funtimes: Functions for Time Series Analysis. R Documentation. 2022. Available online: https://rdrr.io/cran/funtimes/ (accessed on 11 November 2022).
  53. Empinotti, V.L.; Budds, J.; Aversa, M. Governance and water security: The role of the water institutional framework in the 2013–15 water crisis in São Paulo, Brazil. Geoforum 2019, 98, 46–54. [Google Scholar] [CrossRef]
  54. Hunt, J.D.; Stilpen, D.; Freitas, M.A.V. A review of the causes, impacts and solutions for electricity supply crises in Brazil. Renew. Sustain. Energy Rev. 2018, 88, 208–222. [Google Scholar] [CrossRef]
  55. Agência Nacional de Águas e Saneamento Básico (ANA). Conjuntura dos Recursos Hídricos no Brasil 2009. Relatório Pleno; ANA: Brasília, Brazil, 2009; 204p. [Google Scholar]
  56. Babur, M.; Babel, M.S.; Shrestha, S.; Kawasaki, A.; Tripathi, N.K. Assessment of climate change impact on reservoir inflows using multi climate-models under RCPs. The case of Mangla dam in Pakistan. Water 2016, 8, 389. [Google Scholar] [CrossRef]
  57. Lumbroso, D.M.; Woolhouse, G.; Jones, L. A review of the consideration of climate change in the planning of hydropower schemes in sub-saharan Africa. Clim. Change 2015, 133, 621–633. [Google Scholar] [CrossRef]
  58. Mateus, M.C.; Tullos, D. Reliability, sensitivity, and vulnerability of reservoir operations under climate change. J. Water Resour. Plan. Manag. 2017, 143, 04016085. [Google Scholar] [CrossRef]
  59. Mukheibir, P. Potential consequences of projected climate change impacts on hydroelectricity generation. Clim. Change 2013, 121, 67–78. [Google Scholar] [CrossRef]
  60. Agência Nacional de Águas e Saneamento Básico (ANA). Conjuntura dos Recursos Hídricos no Brasil 2017. Relatório Pleno; ANA: Brasília, Brazil, 2017; 169p. [Google Scholar]
  61. Chaudhari, S.; Pokhrel, Y. Alteration of river flow and flood dynamics by existing and planned hydropower dams in the Amazon River Basin. Water Resour. Res. 2022, 58, e2021WR030555. [Google Scholar] [CrossRef]
  62. Deusdará-Leal, K.; Mohor, G.S.; Cuartas, L.A.; Seluchi, M.E.; Marengo, J.A.; Zhang, R.; Broedel, E.; Amore, D.J.; Alvalá, R.C.S.; Cunha, A.P.M.A.; et al. Trends and climate elasticity of streamflow in south-eastern Brazil basins. Water 2022, 14, 2245. [Google Scholar] [CrossRef]
  63. Cuartas, L.A.; Cunha, A.P.M.A.; Alves, J.A.; Parra, L.M.P.; Deusdará-Leal, K.; Costa, L.C.O.; Molina, R.D.; Amore, D.; Broedel, E.; Seluchi, M.E.; et al. Recent hydrological droughts in Brazil and their impact on hydropower generation. Water 2022, 14, 601. [Google Scholar] [CrossRef]
  64. Volken, N.J.; Minoti, R.T.; Alves, C.M.A.; Vergara, F.E. Analyzing the impact of agricultural water-demand management on water availability in the Urubu River Basin − Tocantins, Brazil. Rev. Ambiente Água 2022, 17, e2847. [Google Scholar] [CrossRef]
  65. Bullock, E.L.; Woodcock, C.E.; Souza, C., Jr.; Olofsson, P. Satellite-based estimates reveal widespread forest degradation in the Amazon. Glob. Change Biol. 2020, 26, 2956–2969. [Google Scholar] [CrossRef] [PubMed]
  66. Santos, G.L.; Pereira, M.G.; Delgado, R.C.; Magistrali, I.C.; Silva, C.G.; Oliveira, C.M.M.; Larangeira, J.P.B.; Silva, T.P. Degradation of the Brazilian Cerrado: Interactions with human disturbance and environmental variables. For. Ecol. Manag. 2021, 482, 118875. [Google Scholar] [CrossRef]
  67. Swanson, A.C.; Kaplan, D.; Toh, K.-B.; Marques, E.E.; Bohlman, S.A. Changes in floodplain hydrology following serial damming of the Tocantins River in the Eastern Amazon. Sci. Total Environ. 2021, 800, 149494. [Google Scholar] [CrossRef]
Figure 1. Map of the Tocantins–Araguaia Basin in Brazil. The reservoirs in cascade along the Tocantins River are numbered sequentially from south (upstream) to north (downstream). The land use and land cover classification data for the year 2020 were produced by the MapBiomas Project.
Water 15 01684 g001
Figure 2. Temporal evolution of the following data from the Tocantins–Araguaia Basin: (1) the sum of the surface water area of hydropower reservoirs, (2) discharge in the most upstream reservoir (Serra da Mesa), (3) discharge in the most downstream reservoir (Tucuruí), (4) sum of all reservoirs’ liquid evaporation, (5) mean annual precipitation, (6) total urban area, (7) total natural vegetation area, (8) total agricultural area, and (9) total pasture lands.
Water 15 01684 g002
Figure 3. Temporal patterns of (a) the surface water area, (b) discharge, (c) liquid evaporation, and (d) mean annual precipitation in the hydropower reservoirs located in the Tocantins–Araguaia Basin during the period from 2000 to 2020.
Water 15 01684 g003aWater 15 01684 g003b
Figure 4. Temporal changes in the areas of the reservoir’s individual watersheds for the following LULC parameters: (a) urban area, (b) natural area, (c) agricultural area, and (d) pasture area.
Water 15 01684 g004
Figure 5. Correlation between the total surface water area of hydropower reservoirs in the Tocantins–Araguaia Basin and the other nine parameters.
Water 15 01684 g005
Figure 6. Biplot of the first principal component (PC1) vs. the second principal component (PC2) for the Tocantins–Araguaia Basin for (a) 2000–2020, (b) 2000–2010, and (c) 2010–2020. The variables are classified with a color palette according to their total contributions to the two principal component dimensions. Area: total surface water area; UpDis: upstream reservoir discharge; DownDis: downstream reservoir discharge; LiqEvap: liquid evaporation; Precip: precipitation; Urban: urban area; Agricult: agriculture area; and Past: pasture area.
Water 15 01684 g006
Figure 7. Correlation between the surface water area of reservoirs in the Tocantins–Araguaia Watershed and the other seven parameters.
Water 15 01684 g007
Figure 8. Biplot of the first dimension vs. the second dimension of the principal component analysis of the following reservoirs: (a) Serra da Mesa, (b) Cana Brava, (c) São Salvador, (d) Peixe Angical, (e) Lajeado, (f) Estreito, and (g) Tucuruí. Highly correlated parameters were omitted. In this case, only the parameter with the highest correlation with the reservoir area was represented. The time period varies for each reservoir and corresponds to the beginning of the monitoring of each reservoir to 2020.
Water 15 01684 g008aWater 15 01684 g008b
Table 1. Characteristics of the hydropower reservoirs in terms of the type of damming, beginning of operation, beginning of monitoring, and surface area of reservoirs.
ReservoirTypeOperationMonitoringArea (km2)
Serra da MesaAccumulation1998200051,460
Cana BravaRun-of-the-river200220036813
São SalvadorRun-of-the-river200920095732
Peixe AngicalAccumulation2006200662,128
Luís Eduardo Magalhães/LajeadoRun-of-the-river2001200258,177
EstreitoRun-of-the-river2011201211,893
TucuruíAccumulation1984200021,021
Disclaimer/Publisher’s Note: The statements, opinions and data contained in all publications are solely those of the individual author(s) and contributor(s) and not of MDPI and/or the editor(s). MDPI and/or the editor(s) disclaim responsibility for any injury to people or property resulting from any ideas, methods, instructions or products referred to in the content.

