


Feasibility Studies of Rainwater Harvesting System for Ablution Purposes
by
 , , and
Fadhlul Wafi Awg Kapli
,
Fatin Amanina Azis
 ,
,
Hazwani Suhaimi
,
Norazanita Shamsuddin
and
Pg Emeroylariffion Abas
* Faculty of Integrated Technologies, Universiti Brunei Darussalam, Jalan Tungku Link, Gadong BE1410, Brunei
*
Author to whom correspondence should be addressed.
Water 2023, 15(9), 1686; https://doi.org/10.3390/w15091686
Submission received: 3 March 2023
/
Revised: 23 April 2023
/
Accepted: 24 April 2023
/
Published: 26 April 2023
(This article belongs to the Special Issue Rainwater Harvesting and Treatment)
Abstract
:For countries with an abundance of rain, there is definite potential to implement a rainwater harvesting system for different applications. This paper describes feasibility studies of an open-pond rainwater harvesting system for ablution purposes, analysing the quality of harvested rainwater and formulating a rainwater harvesting model with suitable performance measures. The formulated model can be used to analyse the feasibility of the system in any locality by inputting local meteorological data. Quality analysis has shown that the harvested rainwater can be used safely for ablution purposes, albeit with a slightly acidic pH below 6.5. At a depth of 1.0 m and using the current pond configuration of a local mosque, the reliability of the system is 62.5% (228 days per year), and the amount of water saved is 345 m3, which is 60.7% of the water demand. It has been shown that a pond surface area of 60–70 m2 provides optimum reliability and water saving, and more water savings can be expected with a more economical usage of water during ablution. These results indicate the feasibility of implementing a rainwater harvesting system for ablution purposes in religious institutions to help curb the water shortage crisis.
1. Introduction
The continuous and rapid growth of the world population is putting extra strain on the already depleted natural resources. Coupled with the higher standards of living partly caused by an increase in the usage of technologies, humankind is putting an ever-increasing demand on basic utilities, particularly energy and water. On the research front, researchers and industries are continuously exploring alternative sources of energy [1,2,3] and water [4,5], as well as working on improving the efficiencies of current technologies [6,7,8,9] to ensure current and future demands can be satisfied.
Research on energy and water is extremely important for Brunei, a small oil-producing tropical country. The country is one of the largest consumers of both energy (23.4 kWh/day per person) and water (380 L/day per person) in the region [10], and with the plentiful abundance of both sunshine and rain, there is definite potential to utilise these renewable sources of energy and water to satisfy its demand. Much research has been conducted to explore the potential of solar energy in Brunei [11]; however, thus far, only limited research [12,13] has been conducted to look into the increasingly prominent water issues by taking advantage of the high frequency of rainfall, with an annual average yield of 3200 mm.
Rainwater harvesting (RWH) has attracted attention in recent years, despite it being a water collection method that has been used for centuries. It is potentially able to alleviate the modern-day potable water shortages [14,15], with the integration of the RWH system having been reported to achieve water saving of up to 60% [16]. To prevent calcium carbonate (CaCO3) precipitation, which is the primary cause of hard water, a rainwater harvesting system can be entirely built above ground level [17]. Additionally, RWH implementation also benefits the environment by reducing stormwater run-off and hence, alleviates the rate of soil erosion and mitigates floods [18]. RWH systems have been successfully implemented in many countries, including Australia, which receives a lesser amount of rainfall than Brunei [19], as well as other countries in the region [14]. Additionally, it has various applications in both urban [4,20] and rural settings [8,21], including domestic [22], commercial [23], and agricultural [24] applications. In this paper, the implementations of an RWH system in religious institutions, specifically mosques, which are abundant in the relatively religious country, are explored. An open pond was taken to be the water storage component of the RWH system. Harvested rainwater in the open pond was used for ablution (wudhu) purposes to serve the large number of congregants attending the five daily obligatory prayers and the weekly congregational prayer. Ablution (wudhu) can be translated as “to clean and beautify”, with the act of ablution necessitating the cleaning of specific limbs using clean water. Performing ablution is one of the pre-conditions of selected acts of worship in Islam, including prayers [25,26].
Analysis of an RWH system typically uses a simple water balance model [12,27] advances, which primarily requires historical rainfall data as input to the model. Generally, high average annual rainfall indicates higher potential water savings from the implementation of an RWH system, highlighting the potential benefit of implementing an RWH system in Brunei due to its high amount of rainfall. However, most models fail to consider evaporation, which may be significant from a large open-surface pond in a relatively hot country. Adequately sizing the RWH storage system is also important to derive full benefits from the system. Several works [28,29] have highlighted the importance of having large water storage to maximise water savings and increase the reliability of the system. However, unnecessarily large water storage increases capital costs with low marginal benefits as well as potentially reducing water quality due to water ageing [30]. Additionally, within the context of an open pond, excessive evaporation may occur [31,32]. As such, the optimal volume of the open pond needs to be taken into account in designing an RWH system. The estimation of RWH design parameters is influenced by many factors, including water demand and various climate parameters, such as rainfall patterns and amount, temperature, wind speed, irradiance, and humidity.
In this paper, water samples collected from direct rainfall, rainfall run-off from the rooftop catchment area, and an open pond were analysed to determine their qualities as well as suitability for ablution purposes. Such measured parameters include pH, total dissolved solids (TDS), electrical conductivity (EC), turbidity, dissolved oxygen (DO), and temperature. These parameters were chosen based on their ability to affect the quality of harvested rainwater. The atmospheric deposition could affect turbidity and DO. The presence of excess ions in water could contribute to higher conductivity and TDS, whereas low pH due to acid rain would be a concern as it could corrode RWH if made with cement. A rainwater harvesting (RWH) model was formulated, which considers not only rainfall data but also evaporation from the open pond by considering different environmental factors, including temperature, wind speed, irradiance, and humidity. The model was then used to simulate an RWH system and derive important system performance measures using local weather data. Additionally, sensitivity analyses were performed to determine the effect of changing different parameters on system performance. It needs to be highlighted that although local data were used as input to the model, the developed RWH model can be easily adapted to measure the feasibility of an RWH system in other localities.
2. Methodology
The rainwater harvesting system assumed in this paper is made up of a catchment area, conveyance system, open pond, and water pump to deliver water via the distribution system. The open pond functions as storage for the harvested rainwater. However, it also acts as a decorative pond, making the area of the mosque more attractive to visitors. During the period of rainfall, rainwater is harvested from the catchment area and then transferred to the pond via the conveyance sub-system, as well as from the direct rainwater falling onto the open pond.
2.1. Rainwater Quality Analysis
One of the issues affecting the uptake of a rainwater harvesting (RWH) system is the quality of the harvested rainwater. Its quality may vary and is influenced by the atmospheric environment and methods of harvesting and storage [33,34]. A polluted atmosphere, caused by the presence of polluting industries and power generation plants, may result in the degradation of the quality of rainwater, especially during the early stage of precipitation. Rainwater falling onto a contaminated catchment area and conveyance of the rainwater via a poorly maintained conveyance system may also change the characteristics of the harvested rainwater. Finally, the storage method can also play a role in determining the quality of the harvested water.
For the RWH system under consideration, rainwater was collected from the rooftop of the mosque as well as from rainwater falling directly onto the open pond, which acts as a storage area for the RWH system. Water samples were collected from 3 sources:
- Rainwater falling directly (to simulate rainwater falling onto the open pond)—Experiment 1;
- Rainwater run-off from the roof (to simulate rainwater collected from the rooftop of the mosque)—Experiment 2;
- Harvested rainwater of an existing pond (to simulate rainwater storage in an open pond)—Experiment 3.
For Experiments 1 and 2, the rainwater collections were performed at the Jame’ Asr Hassanil Bolkiah Mosque, whilst for Experiment 3, water samples were collected from an existing pond at the Jame’ Asr Hassanil Bolkiah Mosque itself. The pond has been operational for years and hence can simulate an aged open pond of an RWH system.
Rainwater samples were collected in HDPE plastic basins, which were then transferred into small HDPE water bottles for Experiments 1 and 2. On the other hand, only small HDPE water bottles were used to collect water samples from the pond for Experiment 3. The equipment was properly cleaned using distilled water before use. Samplings were conducted twice a day (at 9:00 a.m. and 6:00 p.m.) for Experiments 1 and 2, but once a day for Experiment 3. Temperature measurement was performed on-site using a portable meter. Samples were kept at room temperature before sending them immediately to the water analysis laboratory at the Faculty of Integrated Technologies (FIT) of Universiti Brunei Darussalam (UBD).
Several important parameters of the samples were measured, including temperature during collection and temperature before analysis in the laboratory, pH, electrical conductivity (EC), total dissolved solids (TDS), turbidity, and dissolved oxygen (DO). Changes in pH and temperature [35] may alter the concentration of other substances in the rainwater as well as affect the RWH system. For instance, a very alkaline pH may affect the toxicity of ammonia, whilst acidic rainwater is not only detrimental to health but also may corrode the RWH system [36]. Similarly, EC, TDS, and turbidity need to be below certain levels; high levels of EC, TDS, and turbidity may cause fast chemical build-up and deterioration to the RWH system and are harmful to human health, especially if consumed over extended periods [37,38]. DO describes the amount of free, non-compound oxygen dissolved in the rainwater; good-quality water typically contains a high DO level. Authorities, including the World Health Organisation, typically provide guidelines for potable water quality with these parameters [39,40], as given in Table 1.
The laboratory equipment used to assess the quality of the samples were the following: Microprocessor-based Bench Meters HI2210/HI2211 (HANNA® instruments, Smithfield, RI, USA) for pH measurement, Multiparameter Bench Meter Mi180 (Milwaukee, Brookefield, WI, USA) for TDS and conductivity measurements, Dissolved Oxygen Bench Meter HI2400 (HANNA® instruments) for DO measurement, and M100+™ Laboratory Turbidimeter Model 28060/28061 (Scientific® WATTS, Fort Myers, FL, USA) for turbidity measurement. Beakers, funnels, and vials were used during laboratory analysis and were rigorously cleaned using distilled water before and between analyses. The electrodes of applicable equipment were similarly cleaned to prevent cross-contamination. Measurements and calibration procedures were performed according to the manuals provided with the equipment.
2.2. Rainwater Harvesting Model
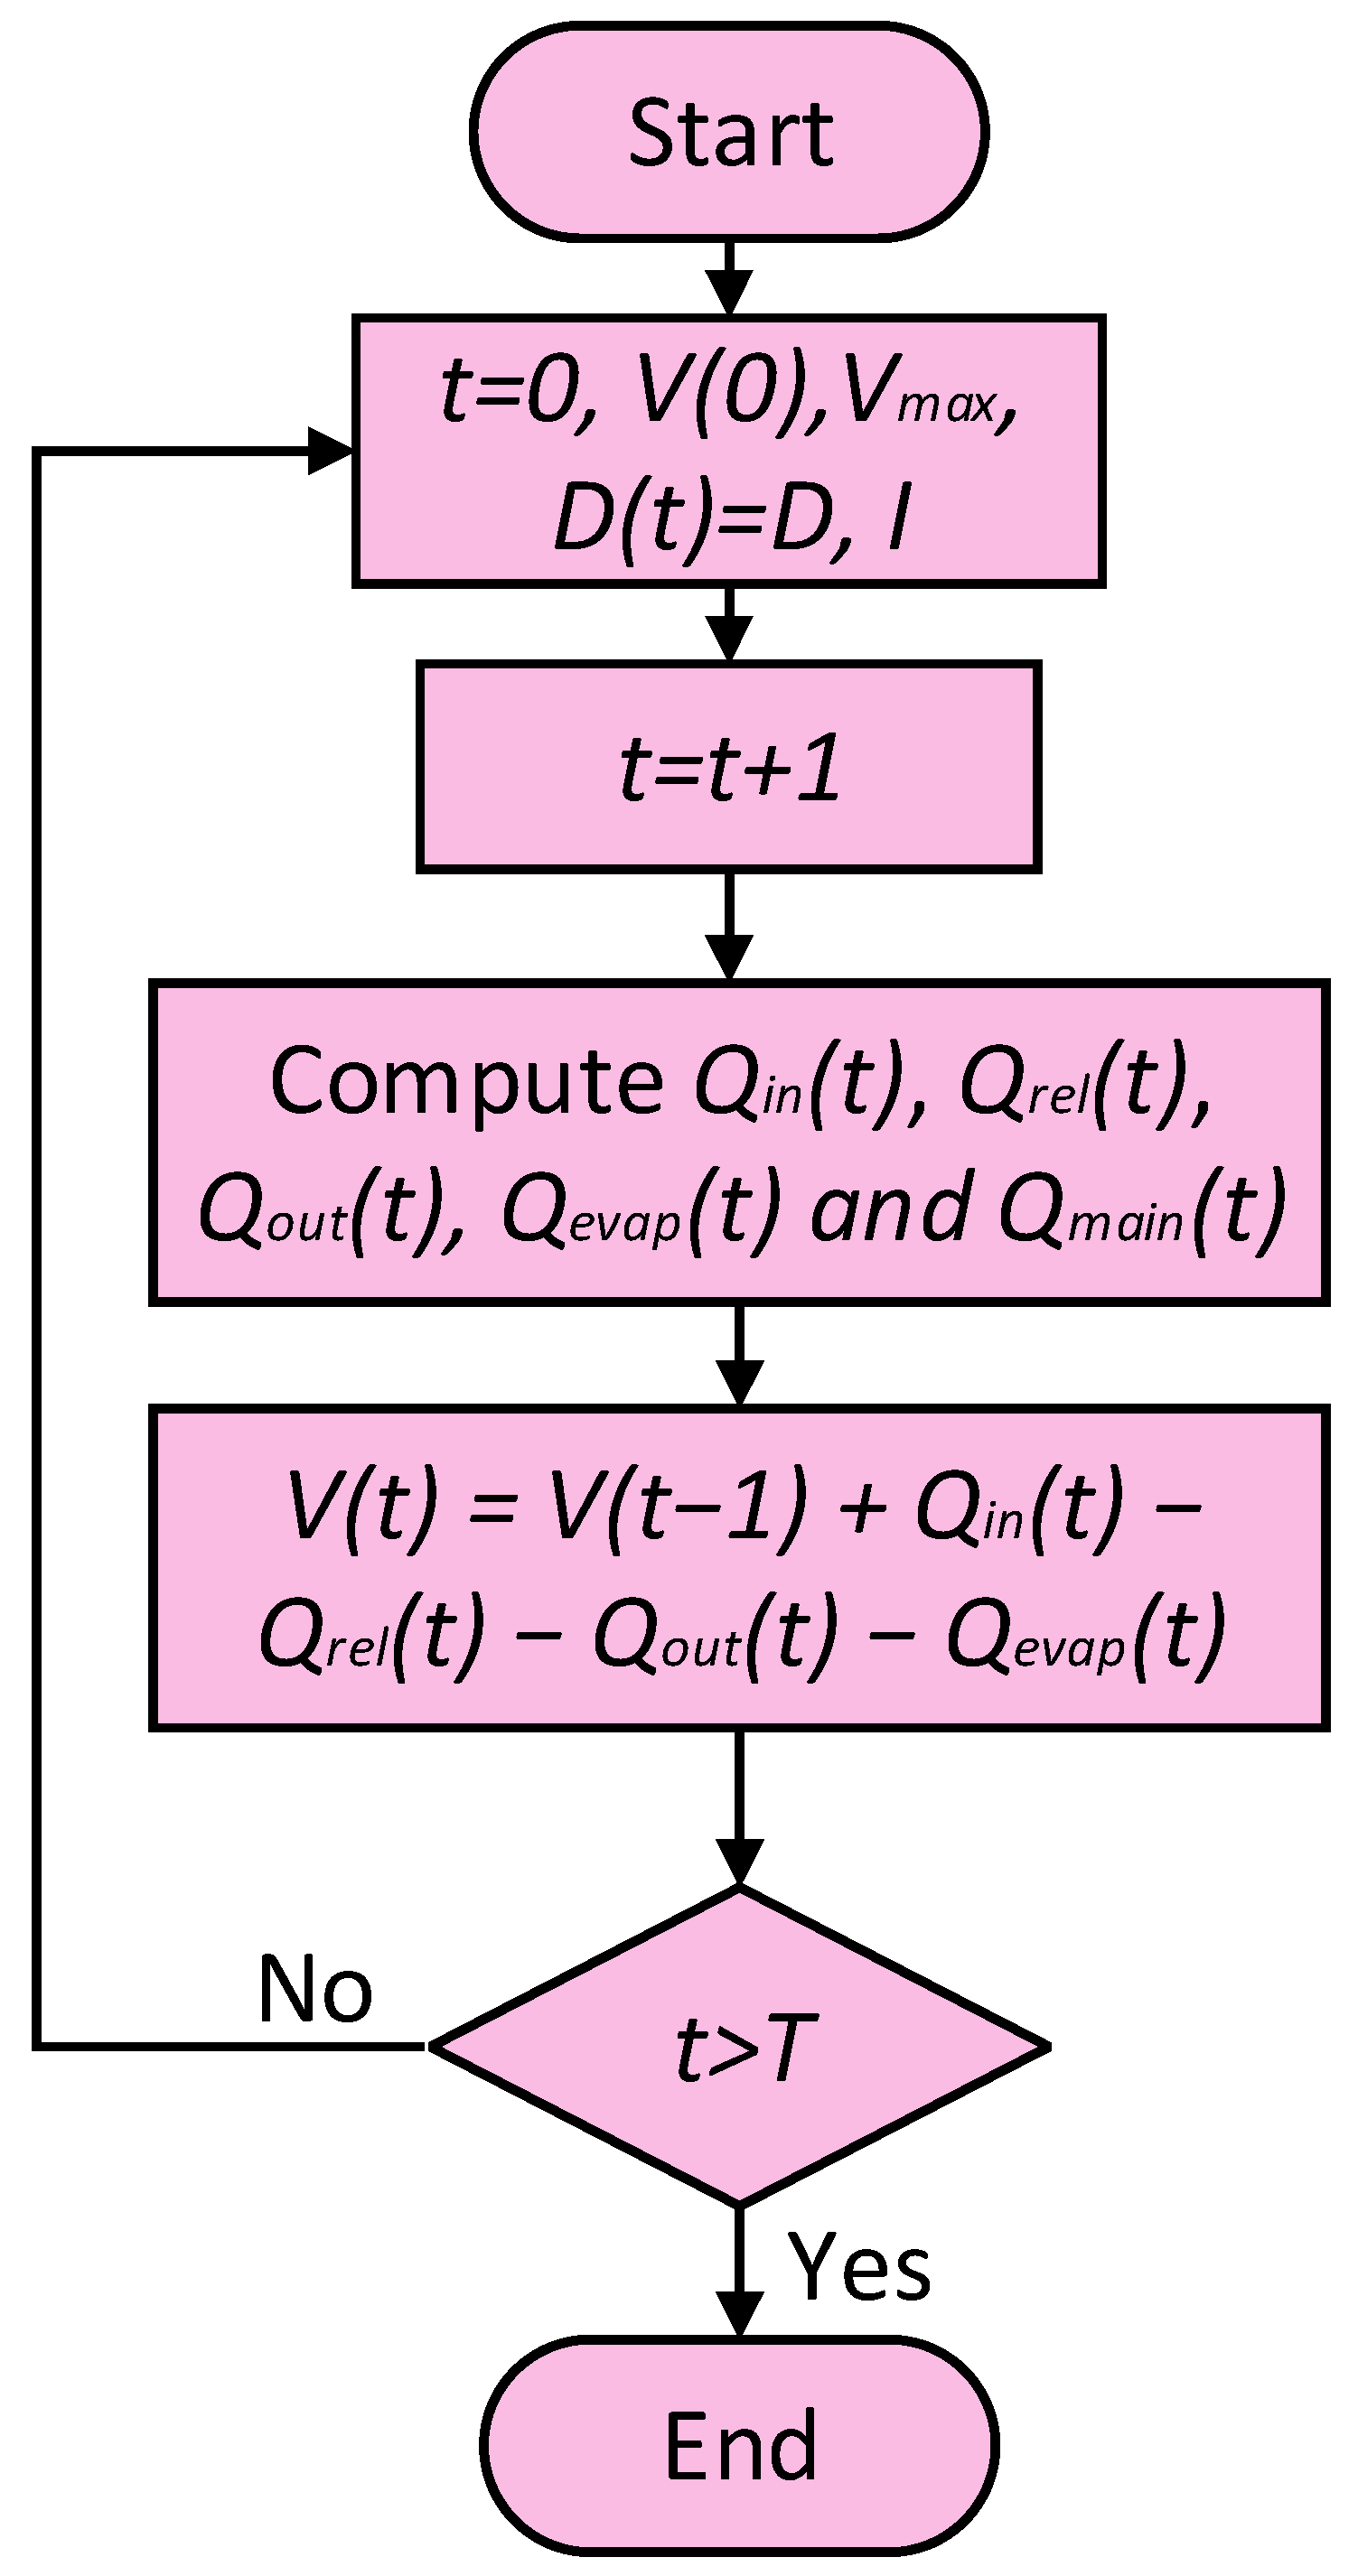
The volume of rainwater in the pond of the system at time t is dependent on the volume of water in the pond at the end of the previous time, i.e., , the volume of water entering the pond at time t, the volume of water released by the system to meet the water demand at time t, the volume of water overflowing from the pond at time t and evaporation from the open pond at time t. Mathematically, can be presented as
Via recursive substitutions, Equation (1) above may be conveniently expressed as:
The amount of rainwater collected comes from the roof catchment area and the open surface area of the pond, as well as, depending on the configuration of the RWH system, water from the main water distribution system. The amount of rainwater collected from the roof catchment area is determined by the size and materials of the roof, as well as the local rainfall at time t. Different roof types have different runoff coefficients , where [41]. Generally, a larger roof catchment area with heavier and more frequent rain gives more harvested rainwater. As an open pond is employed, rainwater falling directly on the open pond is also harvested. Additionally, the pond may also receive water from the main water distribution system. Given rainfall data at time t, I(t) and the area of the open pond , the volume of water entering the system at time is given by
where is the amount of water received from the main water distribution system. Since rainfall I(t) is commonly measured in mm, a factor of 0.001 is used for conversion to m.
Water from the pond may be released to meet water demand for its intended purposes, or if the pond is full, water may overflow. Of course, the volume of water released to meet the water demand is dependent on whether there exists sufficient water in the pond to meet the water demand in the first place. and are given by
where functions min(a,b) and max(a,b) give minimum and maximum values, respectively, of either a or b. is the maximum capacity of the pond, and assuming the pond to be a rectangular prism with a surface area and depth , maximum capacity is given by . Since the storage is an open pond, it is subjected to environmental elements, and it can be expected that some of the harvested water would evaporate. The Penman evaporation equation [31] may be used to estimate potential evaporation of the harvested water at time t from the open pond by taking into consideration different meteorological parameters, including minimum and maximum air temperatures, relative humidity, wind speed and irradiance, as well as elevation of the open pond. Details of the Penman evaporation equation are given in Appendix A. The actual rate of evaporation at time t is given by
The model in Equation (1) depicts that the ability of the system to meet its water demand is dependent on the amount of water already harvested in the pond , which is dependent on the size of the pond, the amount of overflowing water , the amount of water harvested , and the amount of evaporated water . The amount of water harvested is, in turn, dependent on the amount of rainfall as well as the amount of water received from the mains .
For a system that solely relies on rainwater as its only source of water [19], . However, to guarantee water demand can be met, the RWH system can be connected to the main water distribution system [42] and configured to receive water from the mains anytime the water in the pond falls below a certain threshold value . This can be easily accomplished by implementing a float valve to control water flow from the mains and ensure that water does not fall below . For such a configuration, the amount of water received from the mains can be expressed as
The above RWH model is generic in the sense that the model can be adapted to the timescale of the rainfall data. In this paper, a daily timescale has been used for analysis, using daily rainfall data and demand data, with representing the total number of days under consideration. Figure 1 gives the flowchart of the RWH model used, with output from the model used as the input in the calculations of different performance measures of the RWH system.
2.3. Feasibility of the Rainwater Harvesting System
Reliability of the system, RoS [12], expresses the ratio of the number of days that the system is able to fully meet the water demand of the mosque to the total number of days that the system is in operation. A high RoS corresponds to a more reliable RWH system. For a mosque that is solely relying on the RWH system as the only source of its water supply, i.e., , reliability of the system is a critical measure. Mathematically, is given by
where is a threshold function defined by
From Equation (9), has a binary value of either 1 or 0. and for and , respectively.
However, for an RWH system which has been configured to be supplemented with water from the mains, RoS is less important; rather, the water saving potential from the implementation of the RWH system should be taken into consideration. Water saving (WS) and percentage water saving (PWS) measure the average annual volume of water supplied by the RWH system and annual water saving in proportion to the annual water demand of the mosque, respectively [12]. High WS and PWS indicate high potential benefits of implementing the RWH system, in terms of water saving, with PWS = 100% signifying that the RWH system is able to replace main water supplies. WS and PWS can be calculated from
In an ideal scenario, water collected in the pond is fully used to meet the water demand of the mosque, with no overflow occurring. In this regard, rainwater use efficiency (RUE) may be used to measure the utilisation efficiency of rainwater. RUE is defined as the percentage of total water supplied by the system to satisfy water demand to the total water entering the system [12], with high RUE indicating that most of the water entering the system is used to meet water demand rather than overflowing from the pond. Finally, to measure the proper sizing of the pond, the utilisation of the system (UoS) can be calculated. UoS is defined as the average annual amount of water supplied by the system, given its maximum storage capacity [12]. Efficient utilisation of the open pond results in a higher UoS value.
2.4. Sensitivity Analysis
The system performances of the RWH system are calculated based on key assumptions and parameters. Particularly, the current set-up of an existing pond and rooftop, as well as the historical footfall of congregants at the Jame’ Asr Hassanil Bolkiah Mosque, were considered. The effects of variations in some key parameters were considered in this paper. Consideration of different mosques and even designs would alter the total surface area of the catchment area , with a bigger mosque expected to have a larger catchment area. Similarly, varying sizes of the open pond can be considered, which can be expected to increase the capacity of rainwater that can be harvested as well as increase the amount of rainwater harvested from direct rainfall.
Finally, the amount of water used for ablution purposes varies between individuals. As such, sensitivity analysis was performed by varying the ablution water required by each individual to study the effect of different amounts of ablution water used on system performance. It is particularly interesting to see the effects caused by excessive usage of water during ablution, which is quite common nowadays. Indeed, there is a revival in the community to encourage Muslim congregants to follow the prophetic tradition, whereby it has been shown that only approximately 0.544 L of water (or any amount less than 1 L as proven by other studies [43]) has been used for ablution purpose.
3. Result and Discussion
3.1. Analysis of Rainwater Samples
Samplings were performed between 1 January and 16 January 2022 for Experiments 1, 2, and 3, which represent simulations of rainwater falling directly onto an open pond, rainwater collected via the catchment area, and water stored in an open pond, respectively. A total of 69 water samples were collected, with 26, 28, and 15 samples for Experiments 1, 2, and 3, respectively. Some water samples from Experiments 1 and 2 could not be obtained due to the absence of rain.
Table 2 summarises the temperature, pH, TDS, EC, turbidity, and DO of the water samples from the three experiments. Overall, the direct rainfall (Experiment 1), rainwater collected from the catchment area (Experiment 2), and water in the open pond (Experiment 3) have pH values between 4.11 and 6.46, which are below the quality standards of drinking water (pH 6.5–8.5) [39]. This indicates that the water is unpotable and would require further processing to increase its pH. However, in terms of TDS, EC, turbidity, and DO, all the water samples can be used for potable purposes; TDS, EC, and turbidity values were all below limits of 500 ppm, 400 μS/cm, and 5 NTU for TDS, EC, and turbidity of WHO standard potable water [38], respectively, whilst DO values were above the 3 ppm level, below which water is considered hypoxic. It is noted that for its intended purpose in this paper, which is for ablution and cleaning purposes, the water collected from direct rainfall, from the catchment area, and gathered from the open pond can be safely used without any pre-treatment or processing required.
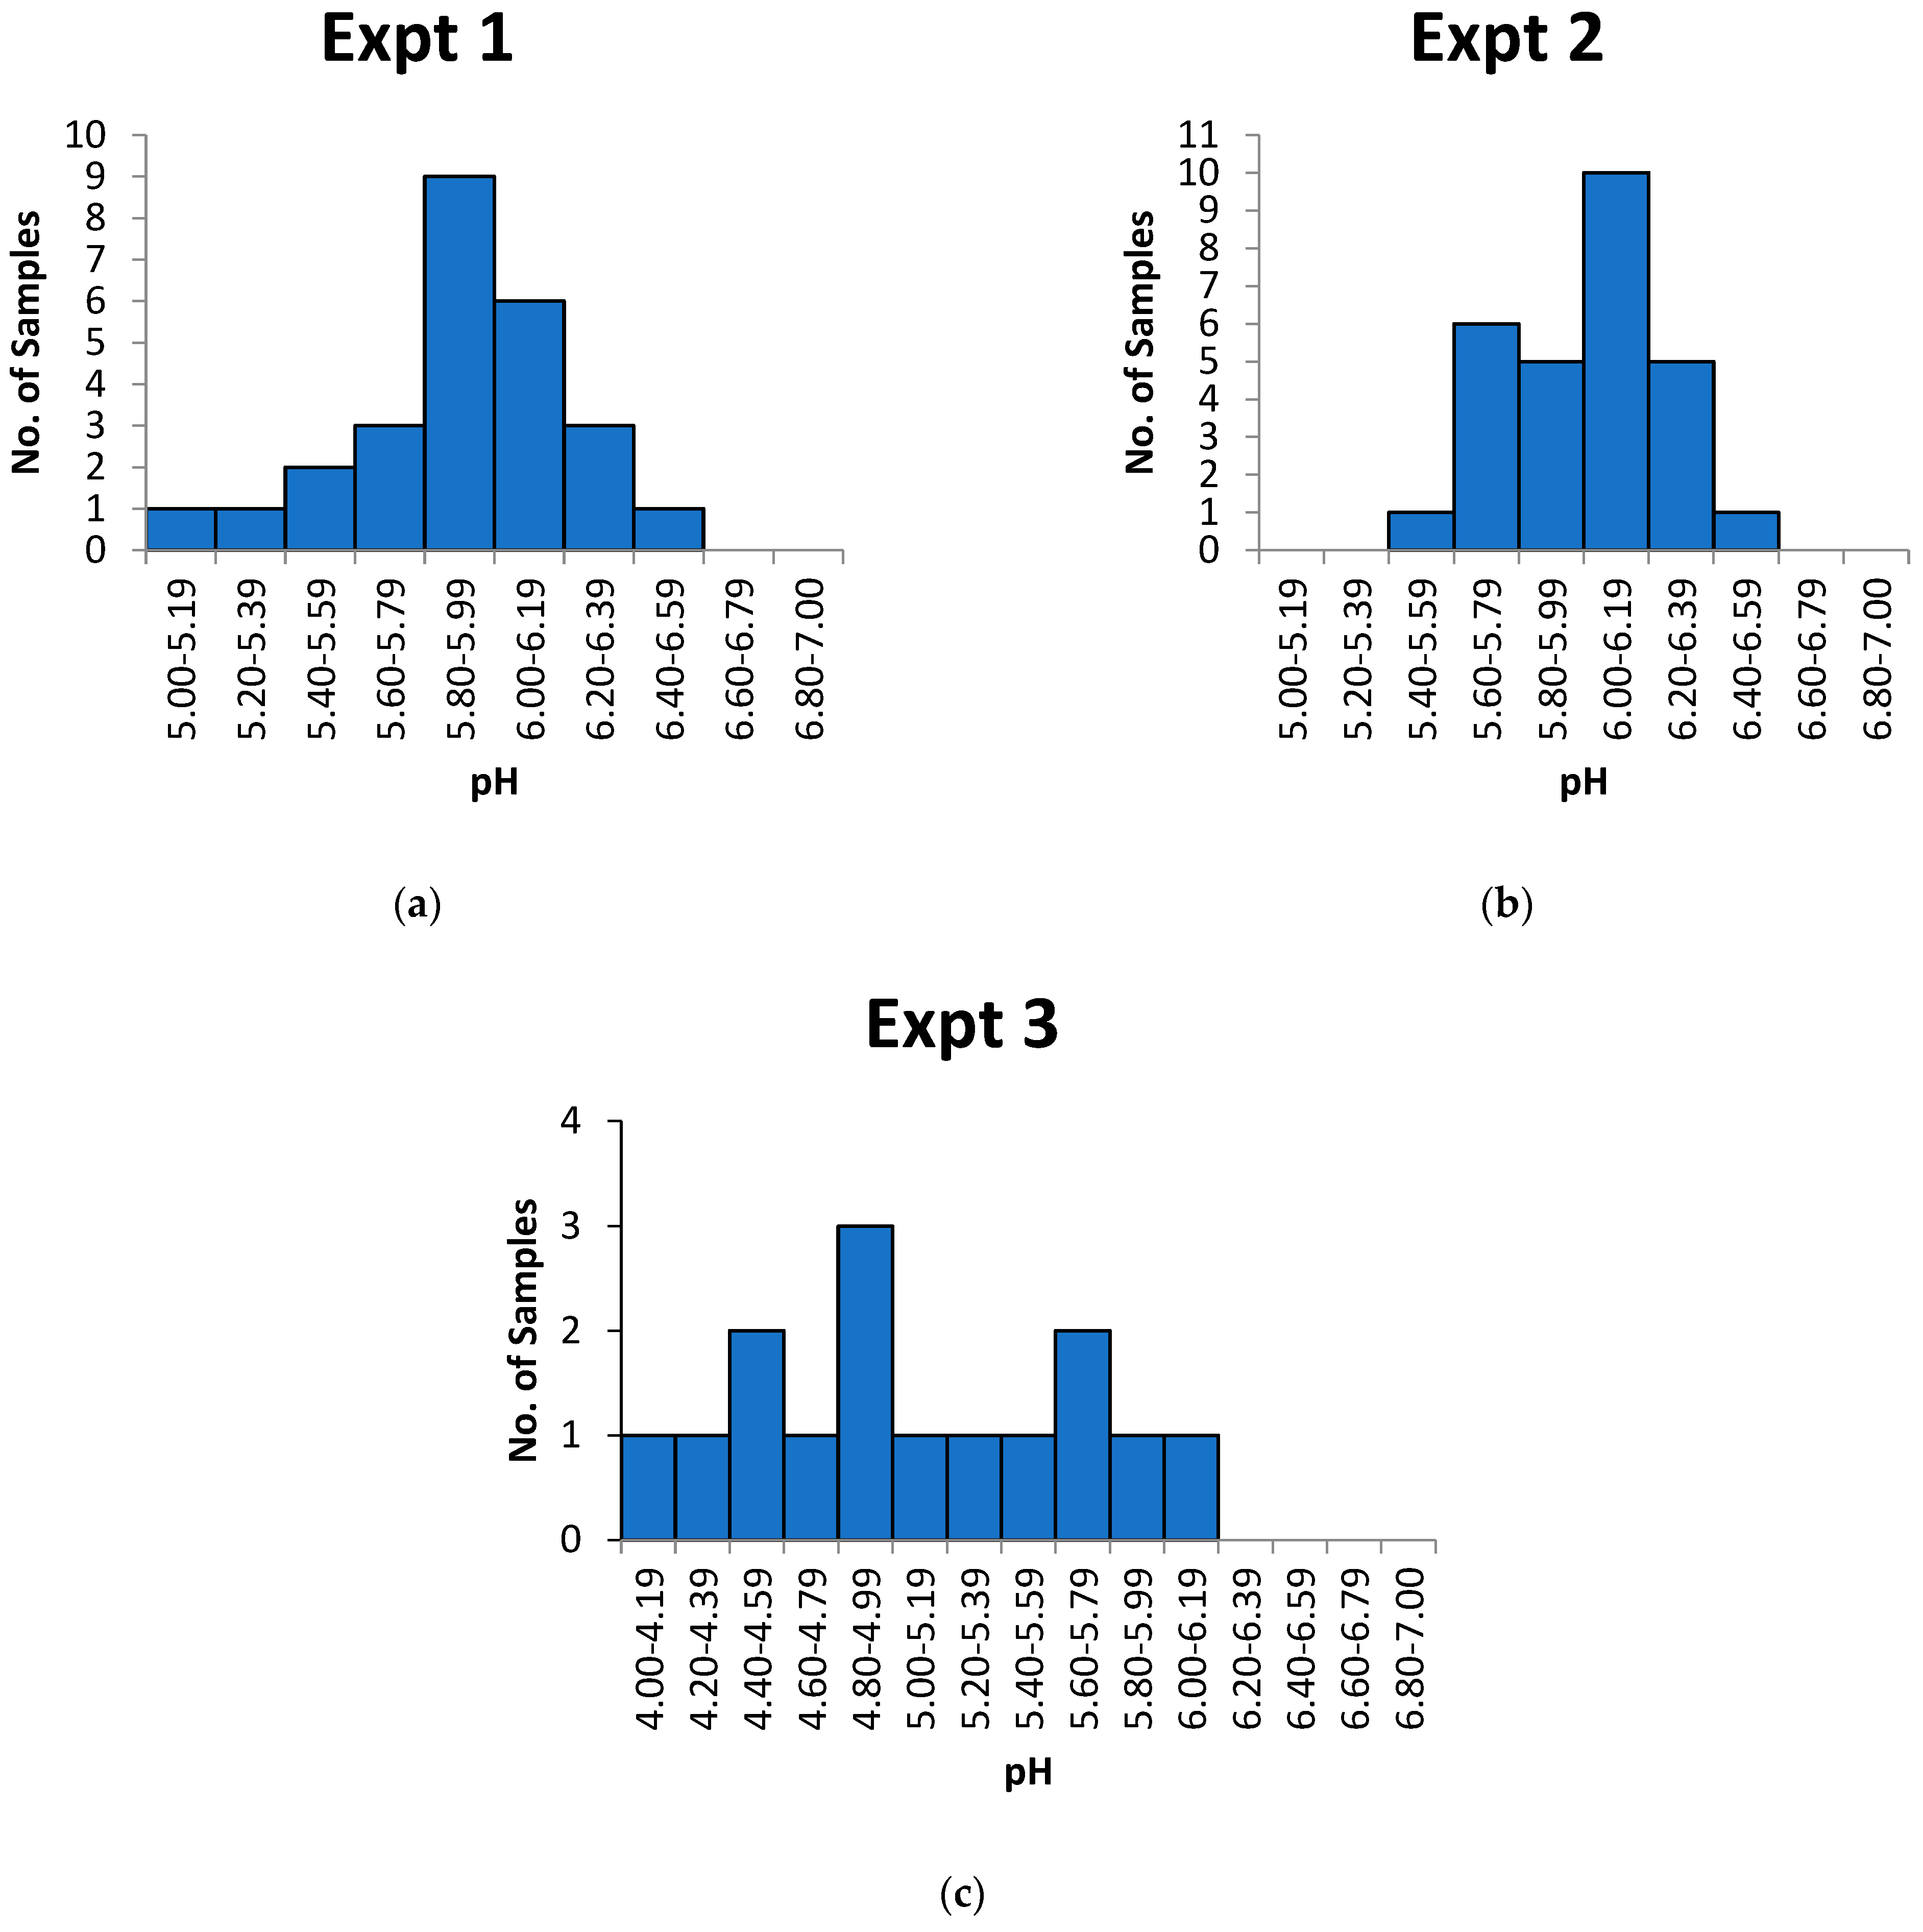
The frequency distribution of pH for the water samples for the three experiments is given in Figure 2. It is noted that a pH of 5.6 represents the pH of rainwater in equilibrium with atmospheric CO2, and hence, a pH of below 5.6 represents acidic deposition [44]. CO2 is more important as compared to other pollutants, including sulphur oxide and nitrogen oxide, as Brunei is a relatively non-industrialised country, with few polluting industries present. Furthermore, the location under consideration is far away from any of the small industries residing locally. For Experiment 1, pH values were between 5.0 and 6.40, with 15.4% of the rainwater samples having a pH of below 5.6, indicating the occurrence of acidic deposition in the rainfall during the sampling period. This is similar to the previous report [44], albeit with less occurrence (15.4% of the samples instead of 77%) and less severity (minimum pH value of 5.0 instead of 4.35). On the other hand, the average EC value of 24.7 μS/cm was comparatively higher than the average EC value of 10.9 reported at the same general location [44], albeit 15 years ago.
Water samples from rainwater falling on the rooftop (Experiment 2) had pH values between 5.52 and 6.46, a slight increase from Experiment 1. Interactions of the rainwater with the rooftop [45] may have caused the rainwater collected from the catchment area to increase its pH value. On the other hand, the pH values of water samples collected from the open pond were the lowest, with pH values between 4.11 and 6.03. Over time, gases in the atmosphere, including carbon dioxide, may be dissolved in the water, which lowers the pH of the water.
Comparisons between the experiments across different parameters demonstrate that the water samples taken from the pond of Jame’ Asr Mosque have a lower pH value (hence, higher acidity), slightly higher TDS value, and significantly higher TDS and EC levels than the samples from Experiments 1 and 2. However, no significant differences in DO readings were observed from the three experiments. The very high level of TDS and EC levels in water samples from the open pond may be due to the ageing of the water, growth of microorganisms, and accumulation of micro substances, as the water has not been used and recycled for a very long time [30].
Comparing the parameters of direct rainwater and collected rainwater from the catchment area indicates that water samples from Experiment 2 have slightly higher pH but lower EC, TDS, and turbidity than Experiment 1, and no noticeable change in DO. Ref。 [45] sampled rainwater collected from catchment areas made of galvanised metal roofs and reported that average turbidity values of 11 NTU and 5.3 NTU were obtained from the first flush and collection tanks, respectively. These are comparatively higher than the turbidity values obtained from all experiments, particularly from Experiment (2), with average turbidity of only 0.38 NTU. The quality of harvested rainwater from the rooftop is dependent on many factors, including the material and age of the roof used as the catchment area, the occurrence of plant decay deposits, and, more importantly, the atmospheric conditions and pollutant level in the vicinity. Brunei has a very low pollutant level due to its very sparse industrial activities as well as the abundant presence of virgin forests.
Table 3 provides the correlation coefficients between measured parameters, with their corresponding p-values. A correlation coefficient larger than 0.7 and between 0.5 and 0.7 may be considered strong (bolded and underlined in the table) and moderately strong correlations (underlined in the table), respectively, whilst a p-value of below 0.05 indicates a significant correlation between the parameters.
For water samples collected directly from rainfall (Experiment 1), the rooftop (Experiment 2), and the open pond (Experiment 3), a perfect correlation is observed between TDS and EC. Indeed, due to their correlation, TDS measurement, which is often a time-consuming process, is often estimated from EC measurement [46].
For Experiment 1, turbidity has a moderately strong negative correlation with the temperature of the water samples measured in the laboratory and moderately strong positive correlations with TDS and EC. Turbidity exhibits stronger positive correlations with both TDS and EC in Experiment (2), and a similar moderately strong negative correlation with the temperature of the water samples measured in the laboratory. Additionally, a moderately strong correlation exists between DO and temperature of the water samples measured in the laboratory in Experiment 2 only. Rainfall effectively cleans out pollutants from the atmosphere, with some of them absorbed by the rainwater, causing an increase in TDS, and some of them causing haziness in the rainwater, i.e., increased turbidity. Since TDS is correlated with EC, a higher EC value is also observed.
Interestingly, turbidity has strong negative correlations with TDS and EC of water samples collected from the open pond. Water samples in the pond have ample time to settle, with some of the particles dissolved in the water, hence the negative correlations observed between turbidity and TDS/EC. pH has strong positive correlations with turbidity, but negative correlations with TDS and EC. DO is also observed to have moderately strong positive correlations with TDS and EC.
The following can be highlighted from the results. Whilst low turbidity (a measure of the amount of suspended particles in the water), which can be approximately observed using the naked eye, indicates a correspondingly low TDS and EC for rainfall water, the opposite is true for water from the pond. Seemingly safe pond water with low turbidity may indicate dangerously high TDS/EC and acidic water.
3.2. Performance of the Rainwater Harvesting (RWH) System
3.2.1. Data for the Rainwater Harvesting (RWH) System
Local Brunei data, including meteorological data and specification data, have been used to ascertain the feasibility of implementing an open-pond RWH system for ablution and cleaning purposes at mosques. Table 4 provides the system specifications of the RWH system, as well as important assumptions for the RWH model. The RWH system specifications, including sizing of the pond and catchment, were taken from the existing decorative open pond and rooftop of the local Jame’ Asr Mosque. As the rooftop is made up of galvanised metal material, the roof runoff coefficient is taken to be 0.9 [41]. Water consumption and patterns were calculated from the recorded average footfall at the mosque, with an average of 100 worshippers attending the 5 daily prayers, an average of 4000 worshippers attending the weekly Friday prayer, and an increased number of average worshippers to 200 attending the 5 daily prayers during the Muslim holy month of Ramadhan.
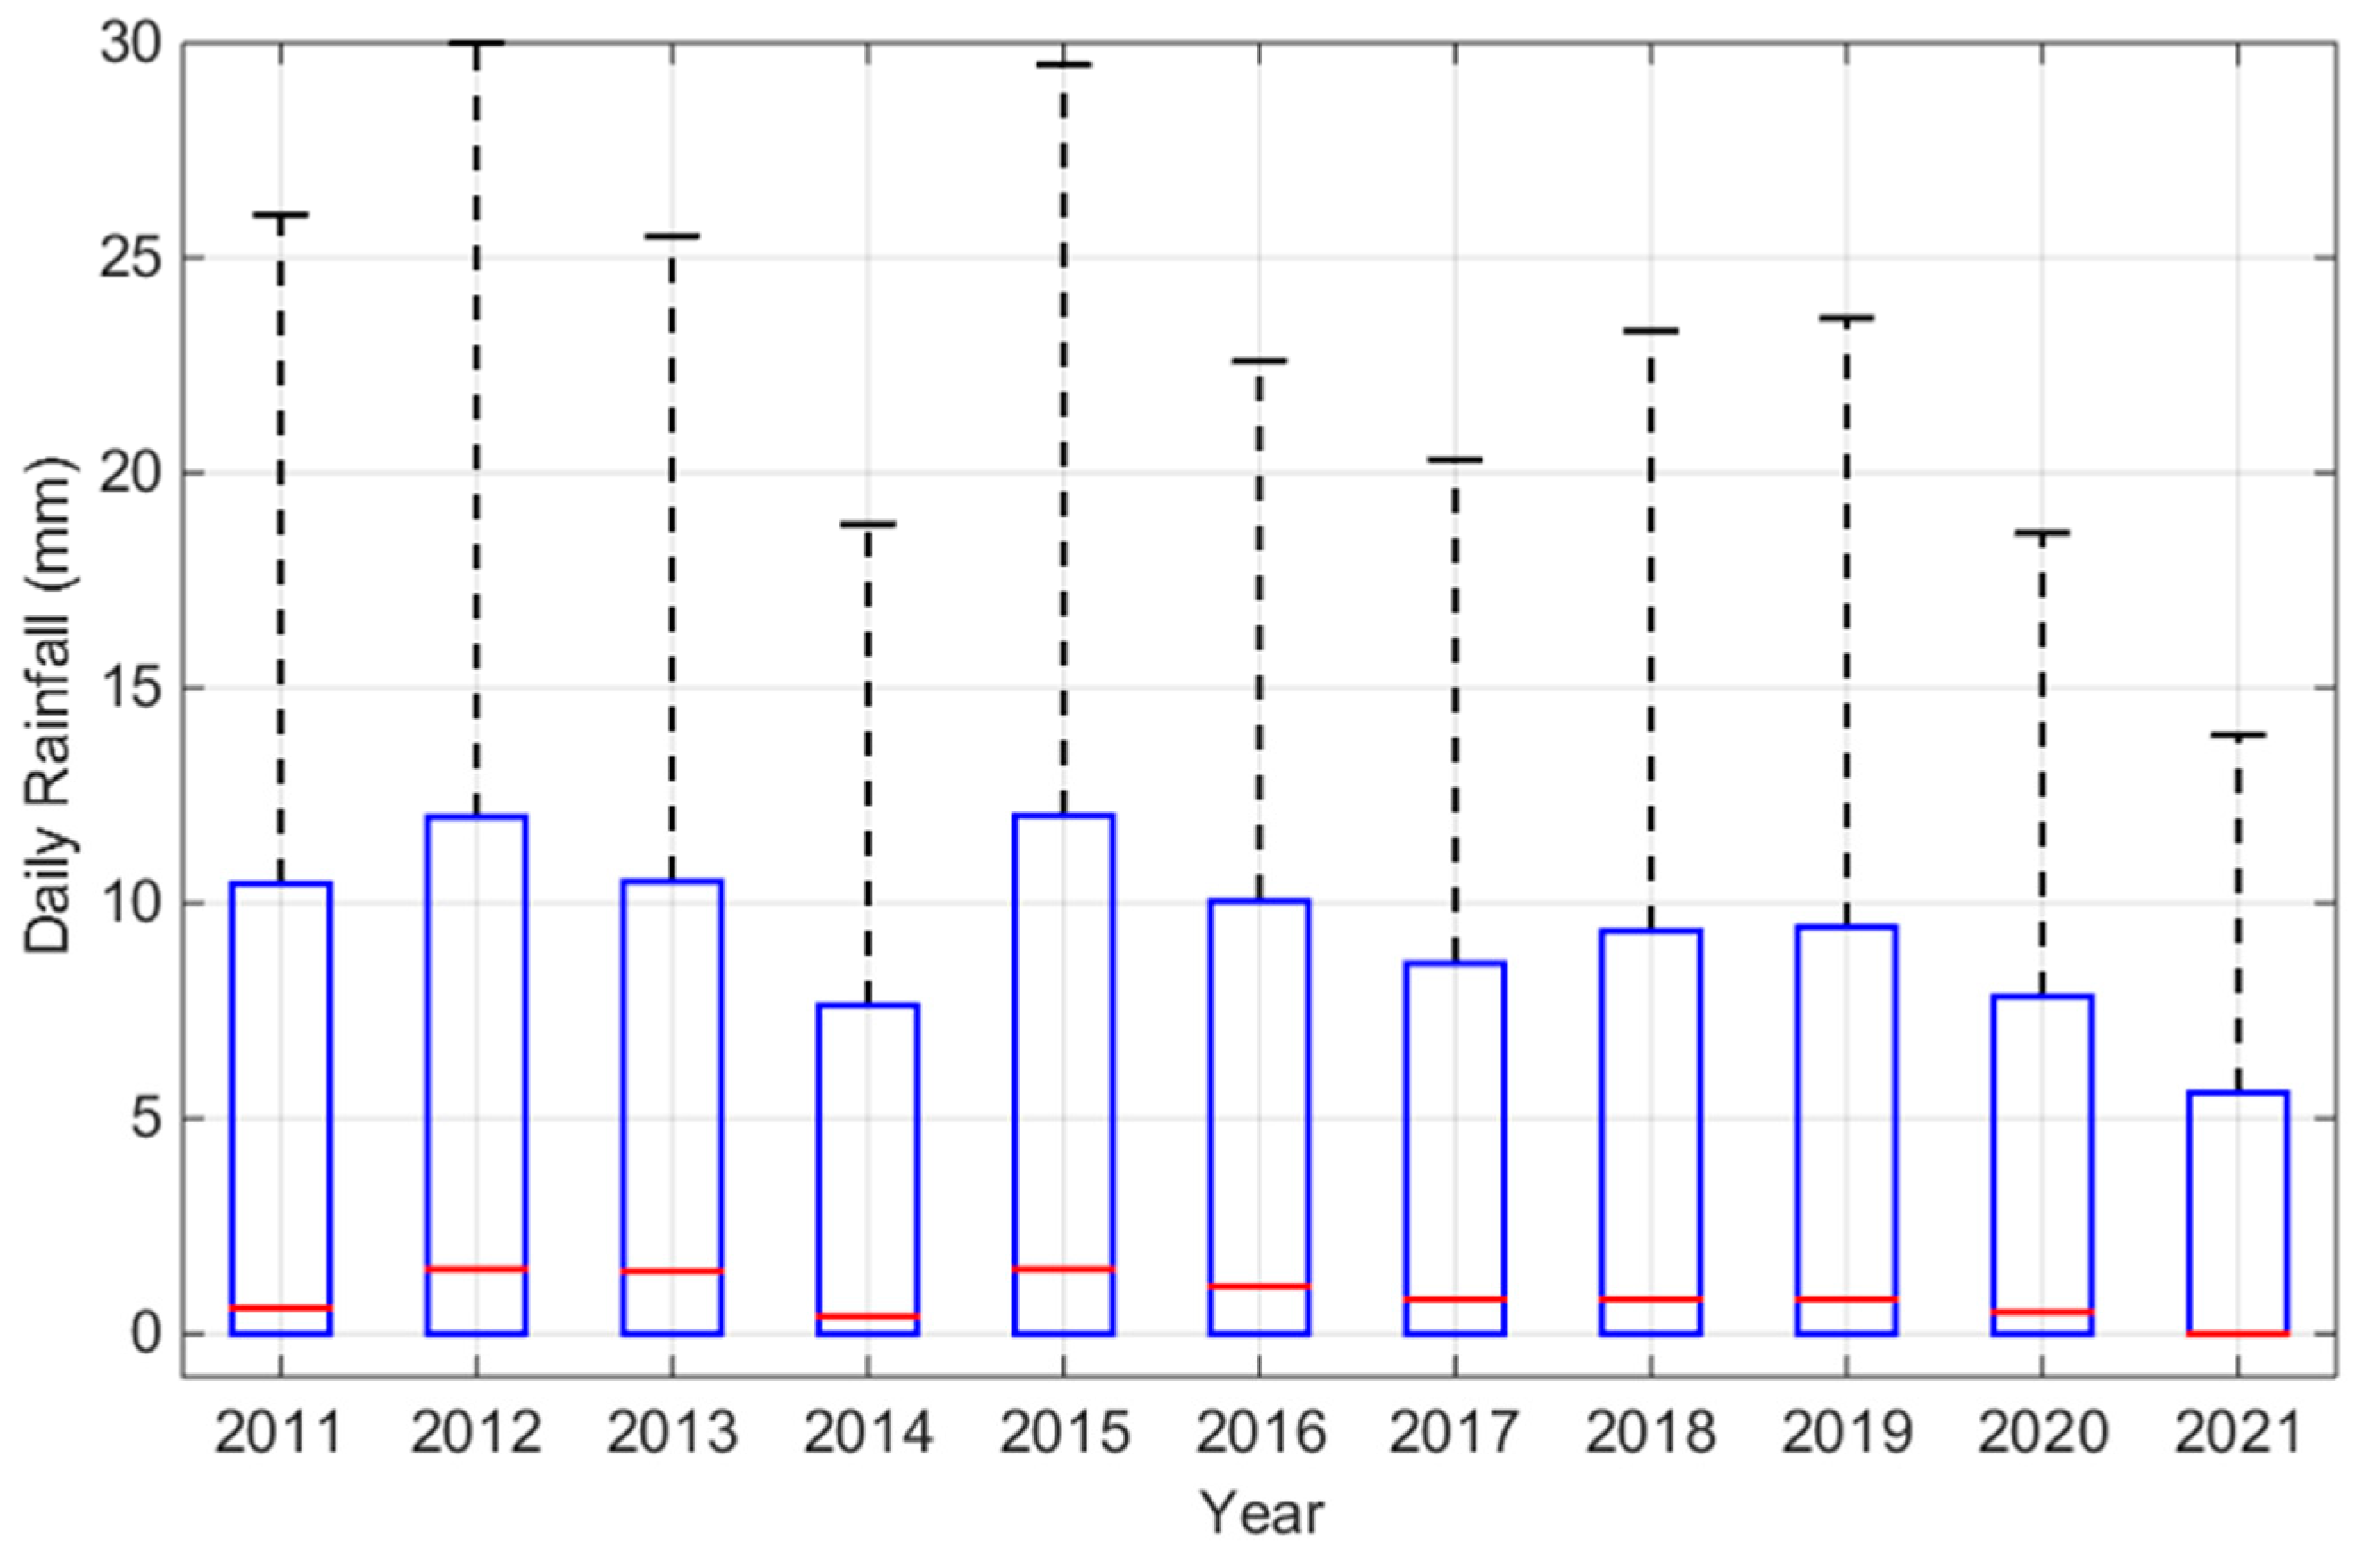
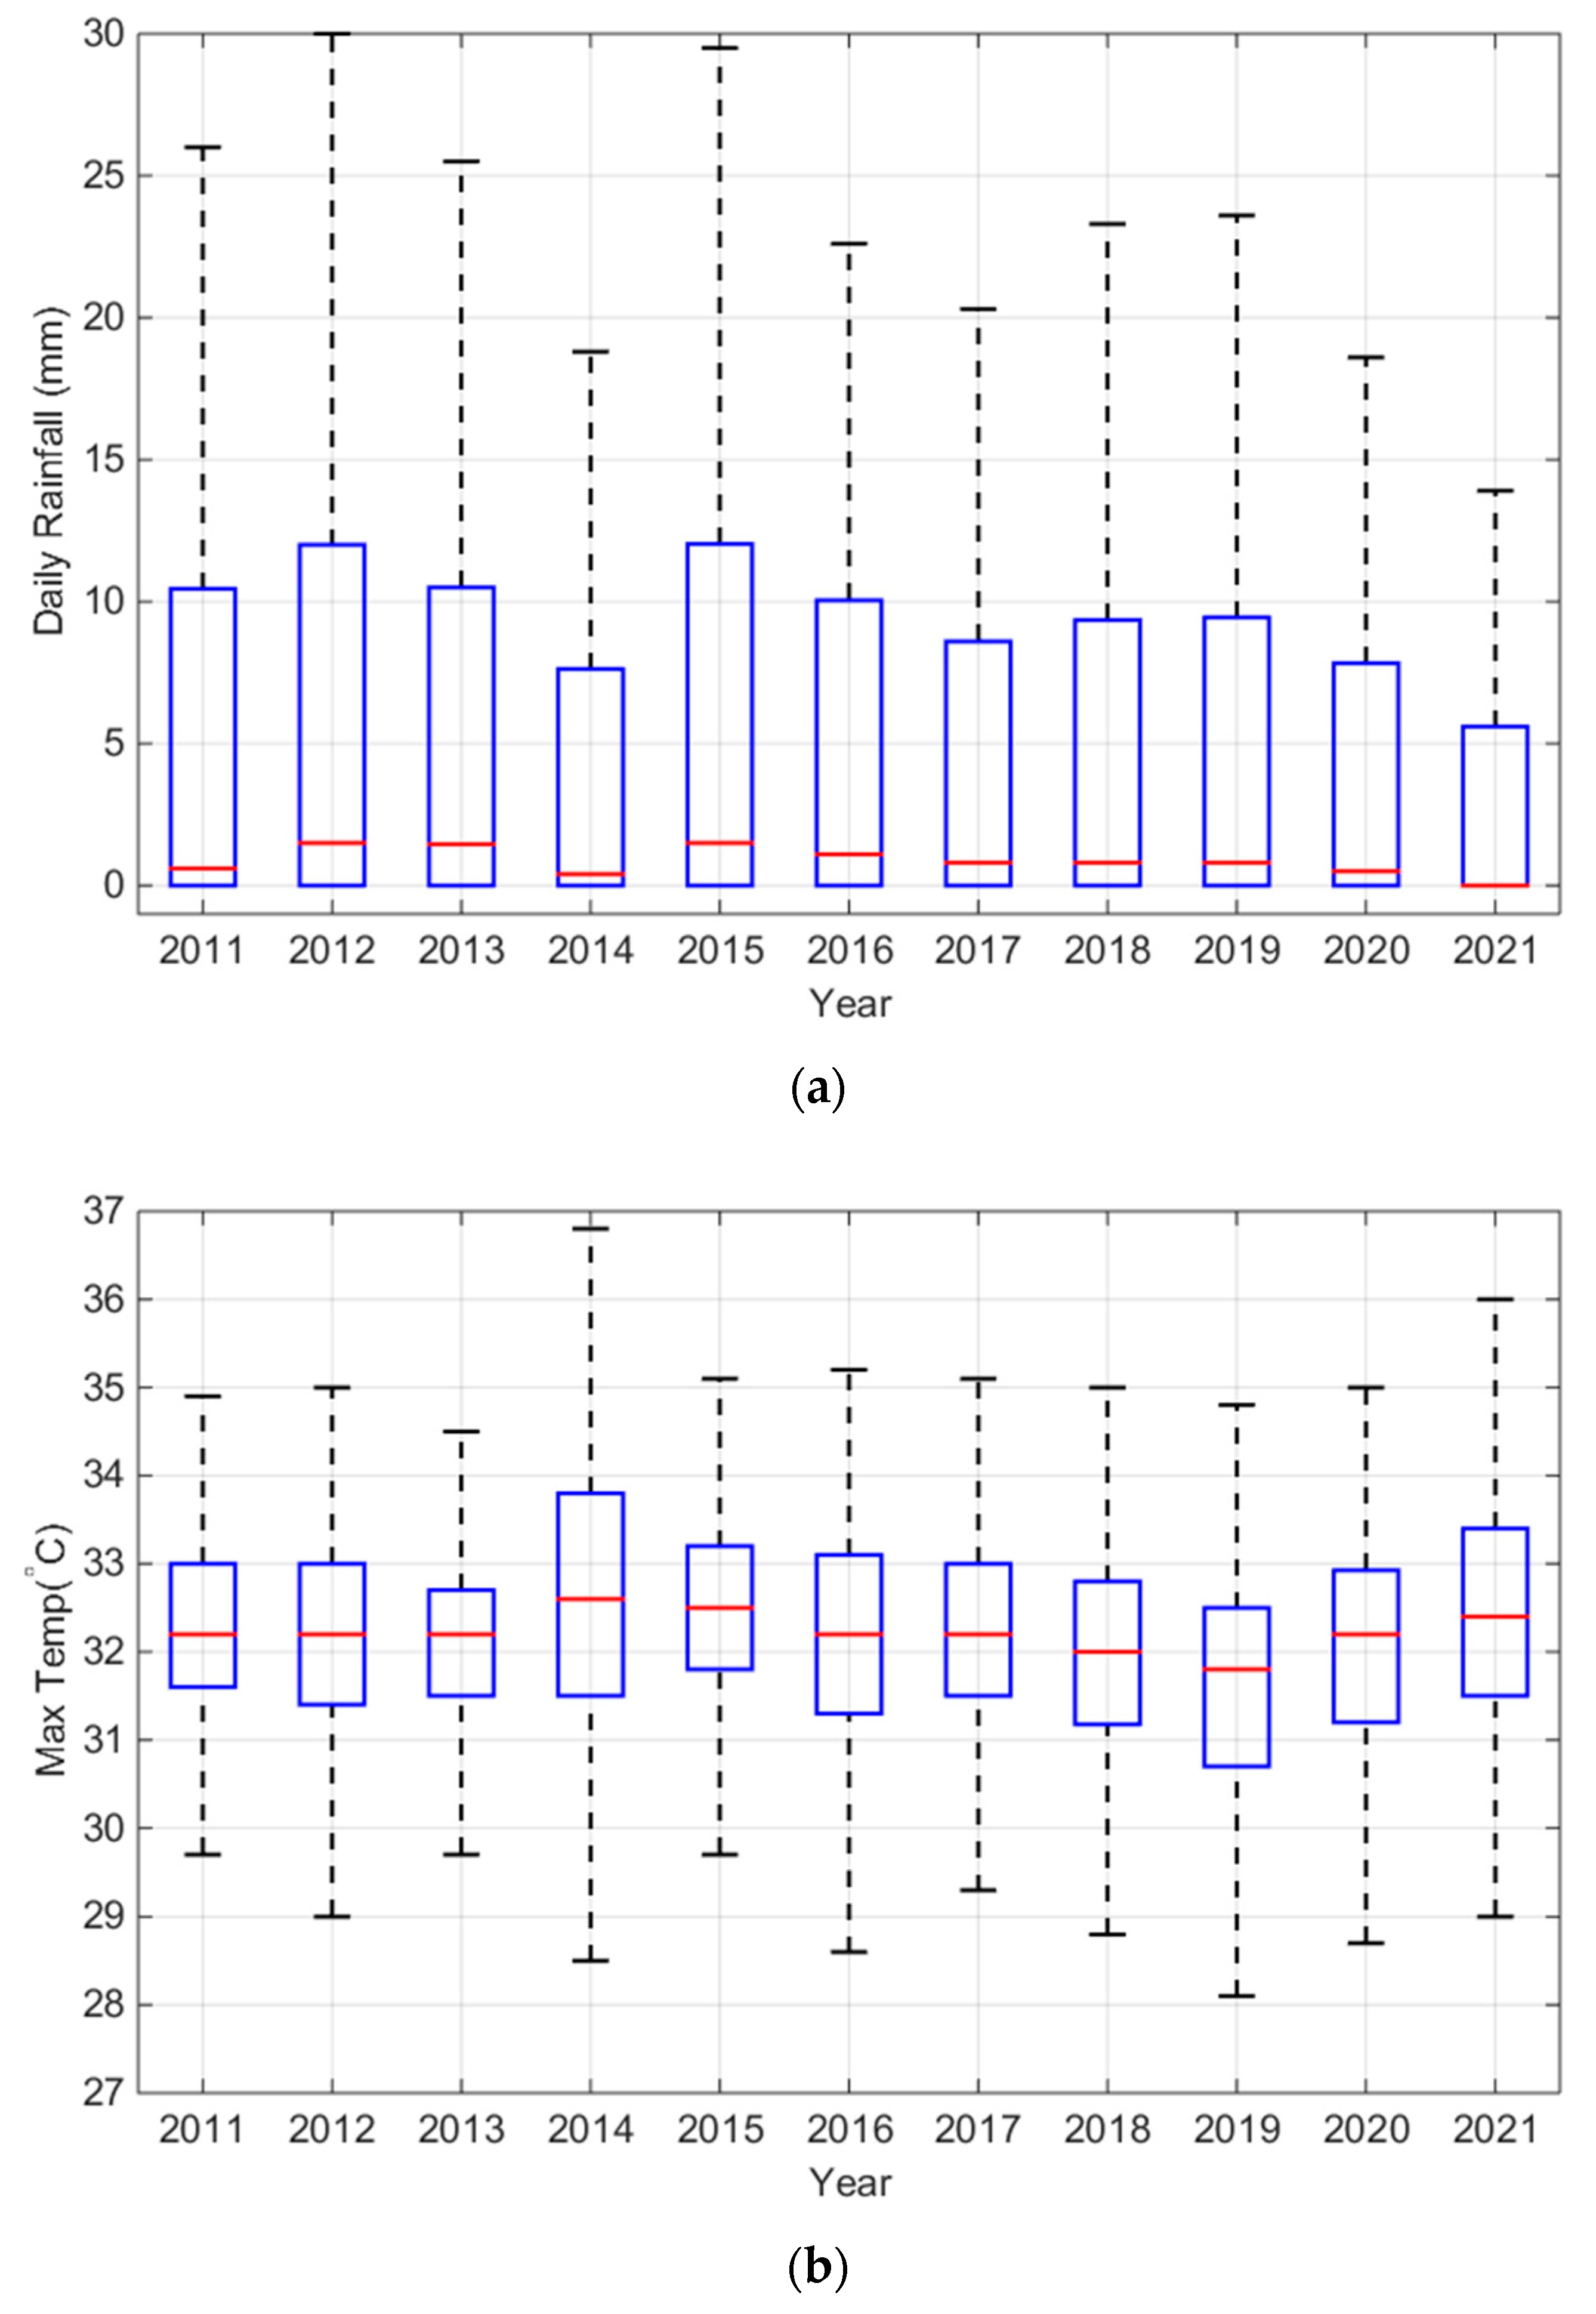
Local meteorological data between the years 2011 and 2020, including minimum and maximum air temperatures, relative humidity, wind speed, and irradiance, as well as elevation of the open pond, were used as input to the model. Box plots of the local meteorological data between 2011 and 2021 are given in Appendix A, with Figure 3 depicting the total daily rainfall statistics, emphasising the importance of rainfall data in the performance of the RWH system. The median of the rainfall data is indicated by a red line in the middle of the boxes, with the bottom and top of the boxes providing the 25th and 75th percentiles, respectively. Whiskers of the boxes provide the maximum/minimum values of the rainfall data. The median daily rainfall for the 2011–2021 period was 0.80 mm. The highest median daily rainfall was 1.45 mm in 2012 and 2015, whilst the lowest was 0.00 mm in 2021.
Table 5 summarises the statistics of the meteorological data, in terms of mean and standard deviation. The average total daily rainfall for the 2011–2021 period was 8.98 mm with a standard deviation of 18.6 mm. This equates to nearly 3300 mm per annum, illustrating the potential benefit of rainwater harvesting in Brunei. However, the relatively high average total daily rainfall but low median daily rainfall of 0.80 mm for the 2011–2021 period indicate that most days have a relatively low level of rainfall, with some days having a very high level of rainfall.
During the earlier period of 2012–2016, the mean and standard deviation of rainfall were 10.1 mm and 20.6 mm, respectively, decreasing to 8.01 mm and 16.8 mm, respectively, in the later period of 2017–2021. Mean of the maximum and minimum daily temperatures, relative humidity, wind speed, and solar radiance for the 2011–2021 period were 32.1 °C, 24.0 °C, 82.7%, 4.71 mm/s, and 9.17 × 10³ MJ/m2/d, respectively.
Although local data were used, it needs to be highlighted that the RWH model can be easily adapted to measure the feasibility of an RWH system for different applications, including residential, commercial, and industrial, as well as at other localities, by simply changing the assumptions on water consumptions and patterns, or the meteorological data.
3.2.2. Performance of the Rainwater Harvesting (RWH) System
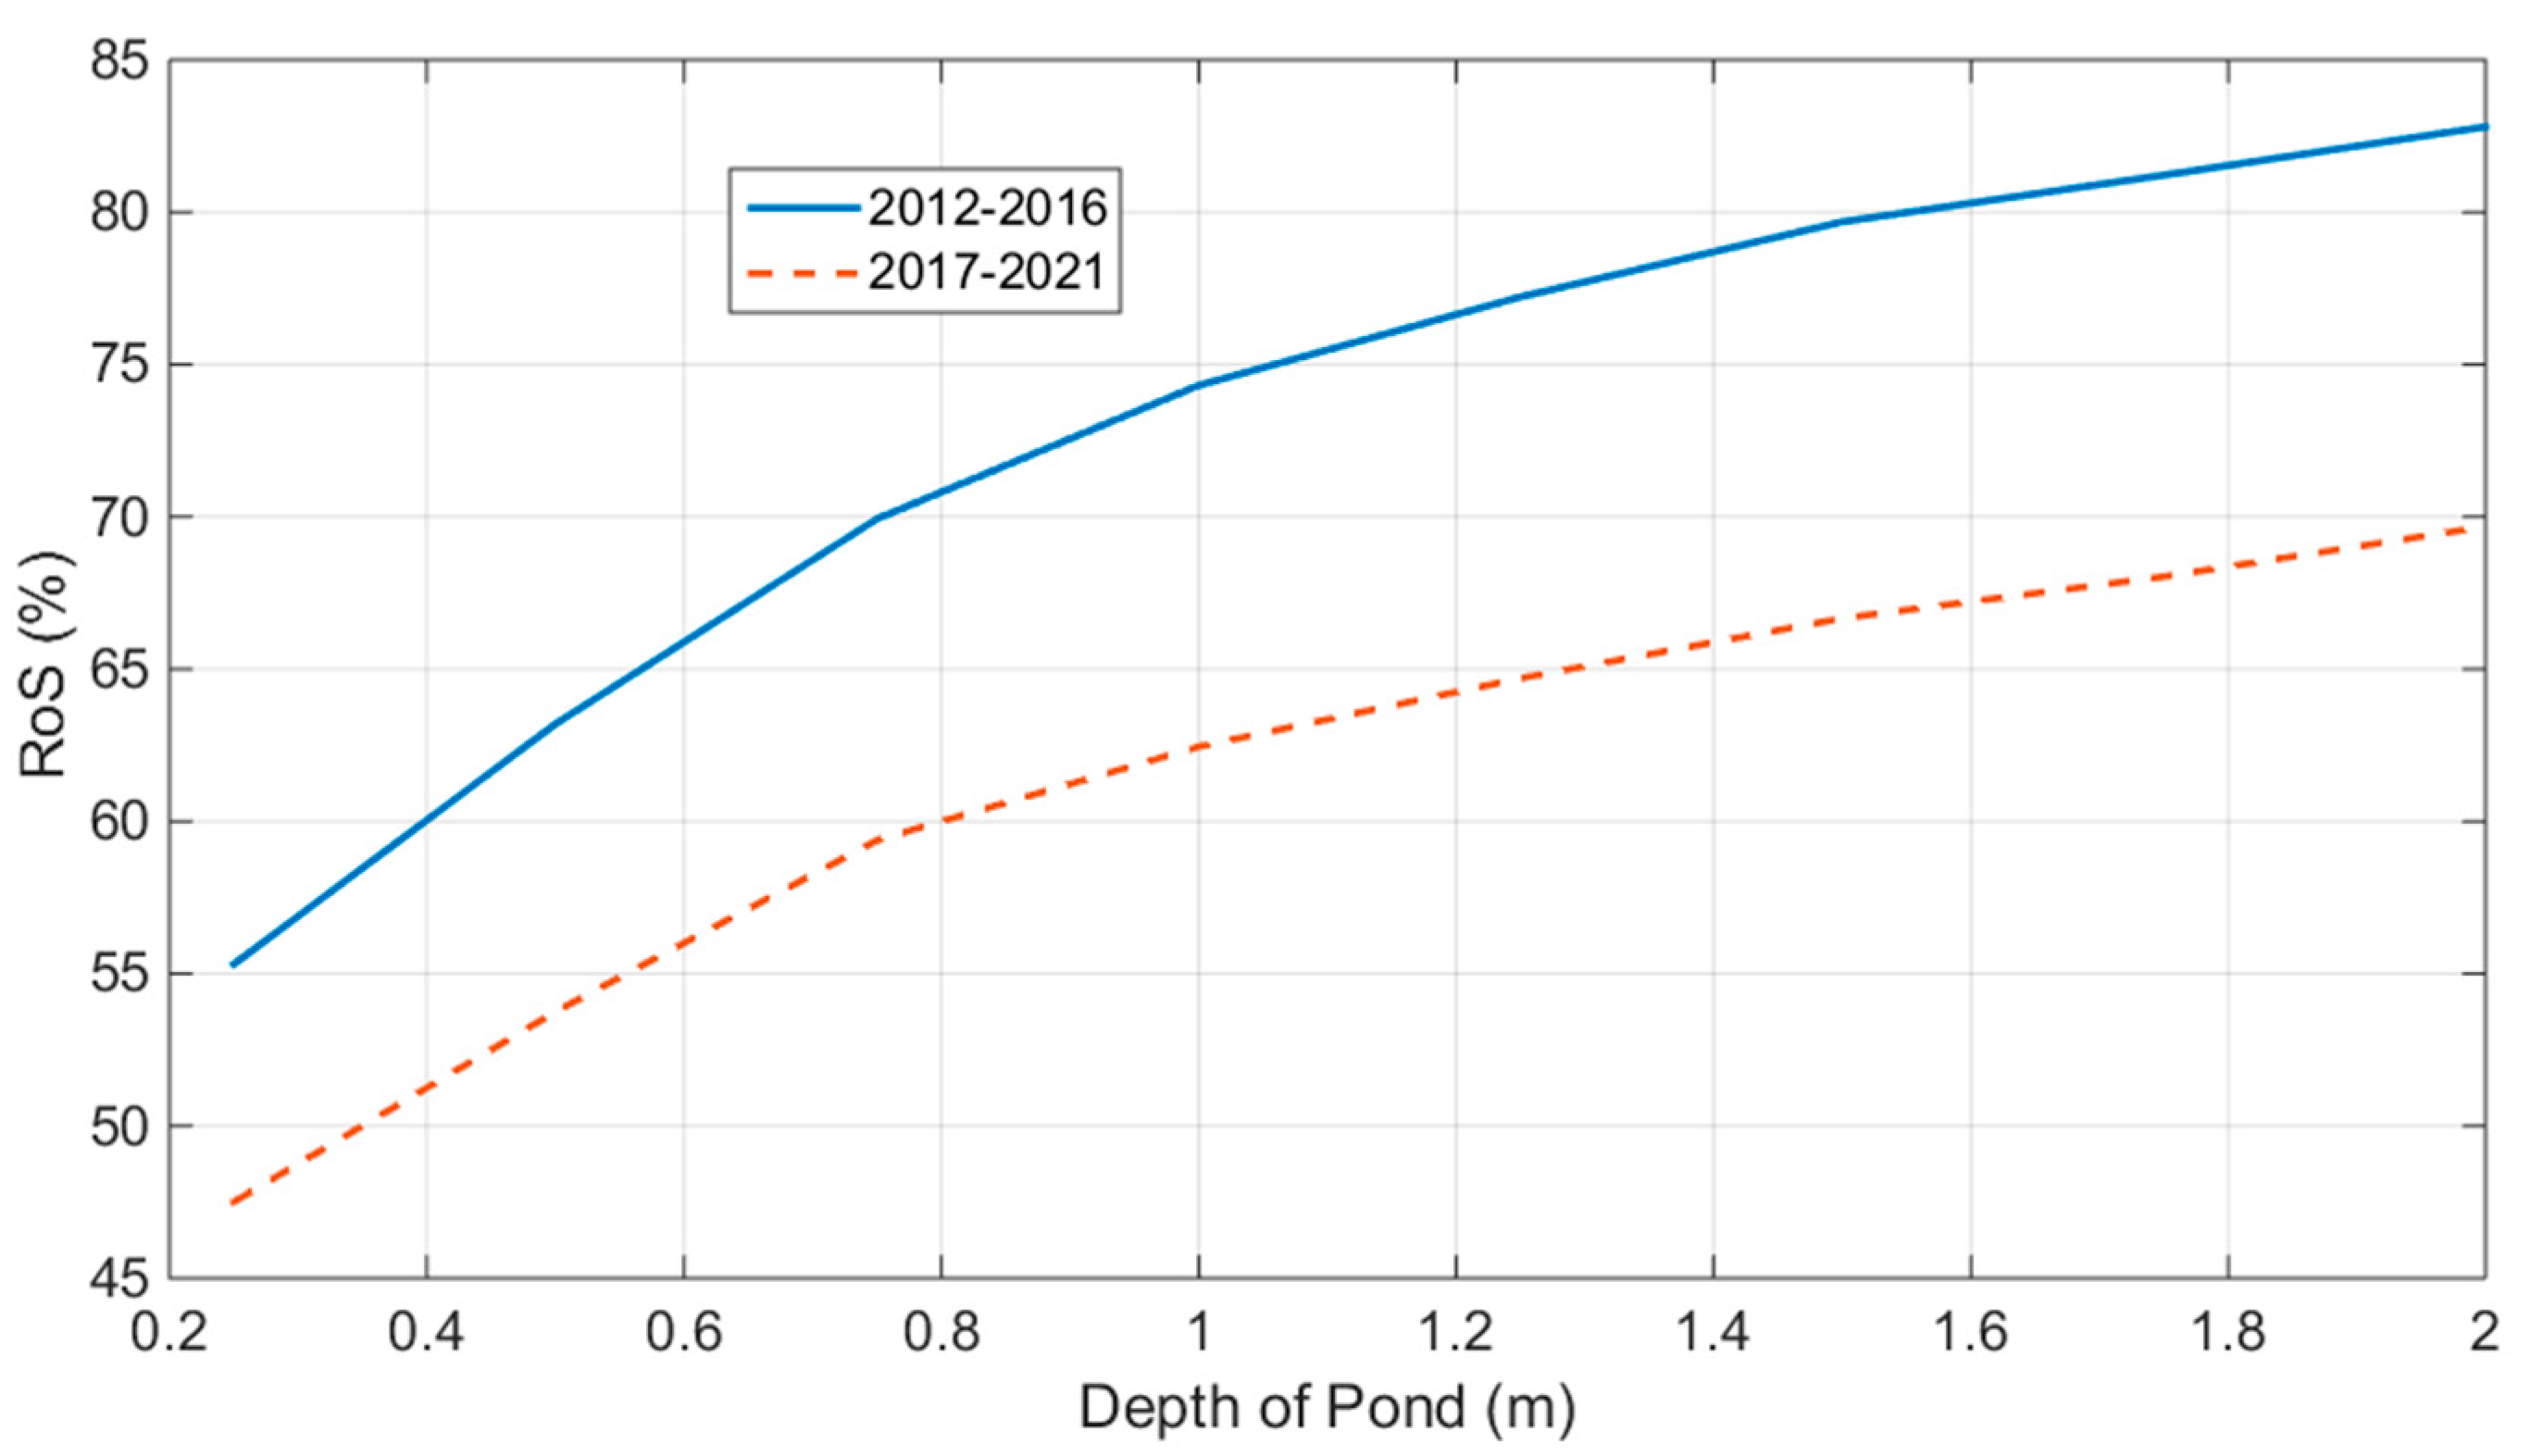
The input parameters were used in the RWH model in Equation (1). Figure 4 shows the average reliability of the RWH system for different depths of the open pond, divided into five-year periods of 2011–2015 and 2016–2020. It can be seen that the reliability of the RWH system increases with the depth of the open pond. Increasing the depth from 0.25 m to 1.0 m results in increased reliability by approximately 15%, from 48% to 62.5% for the period 2016–2020. However, increasing it further to 1.75 m results in a proportionately lower increase in reliability of only 9%. In fact, increasing the depth to the maximum of 2.0 m gives a reliability of 70%. It can be speculated that there is a maximum reliability (approximately 75%), which cannot be exceeded irrespective of the depth of the pond. This equates to approximately 273 days of the 365-day year that the RWH system is able to sufficiently supply enough water to the congregants for ablution purposes. The deficit is caused by the imperfect matching of the supply of rainwater to the demand.
Comparing the reliability between the two periods demonstrates that average reliability is generally higher in the period 2011–2015 than the period 2016–2021, irrespective of the depth of the pond. This is mainly because of the difference in weather conditions between the two periods, particularly rainfall patterns; average rainfall levels are 9.91 mm/day and 8.21 mm/day during the former and latter periods, respectively. In fact, average rainwater entering the system and evaporating from the system were 18.3 m3 and 3.1 m3, respectively, for the period 2011–2015. For the period 2016–2020, the average rainwater entering the system was less, at 15.2 m3/day, but water evaporating was more, at 3.54 m3/day.
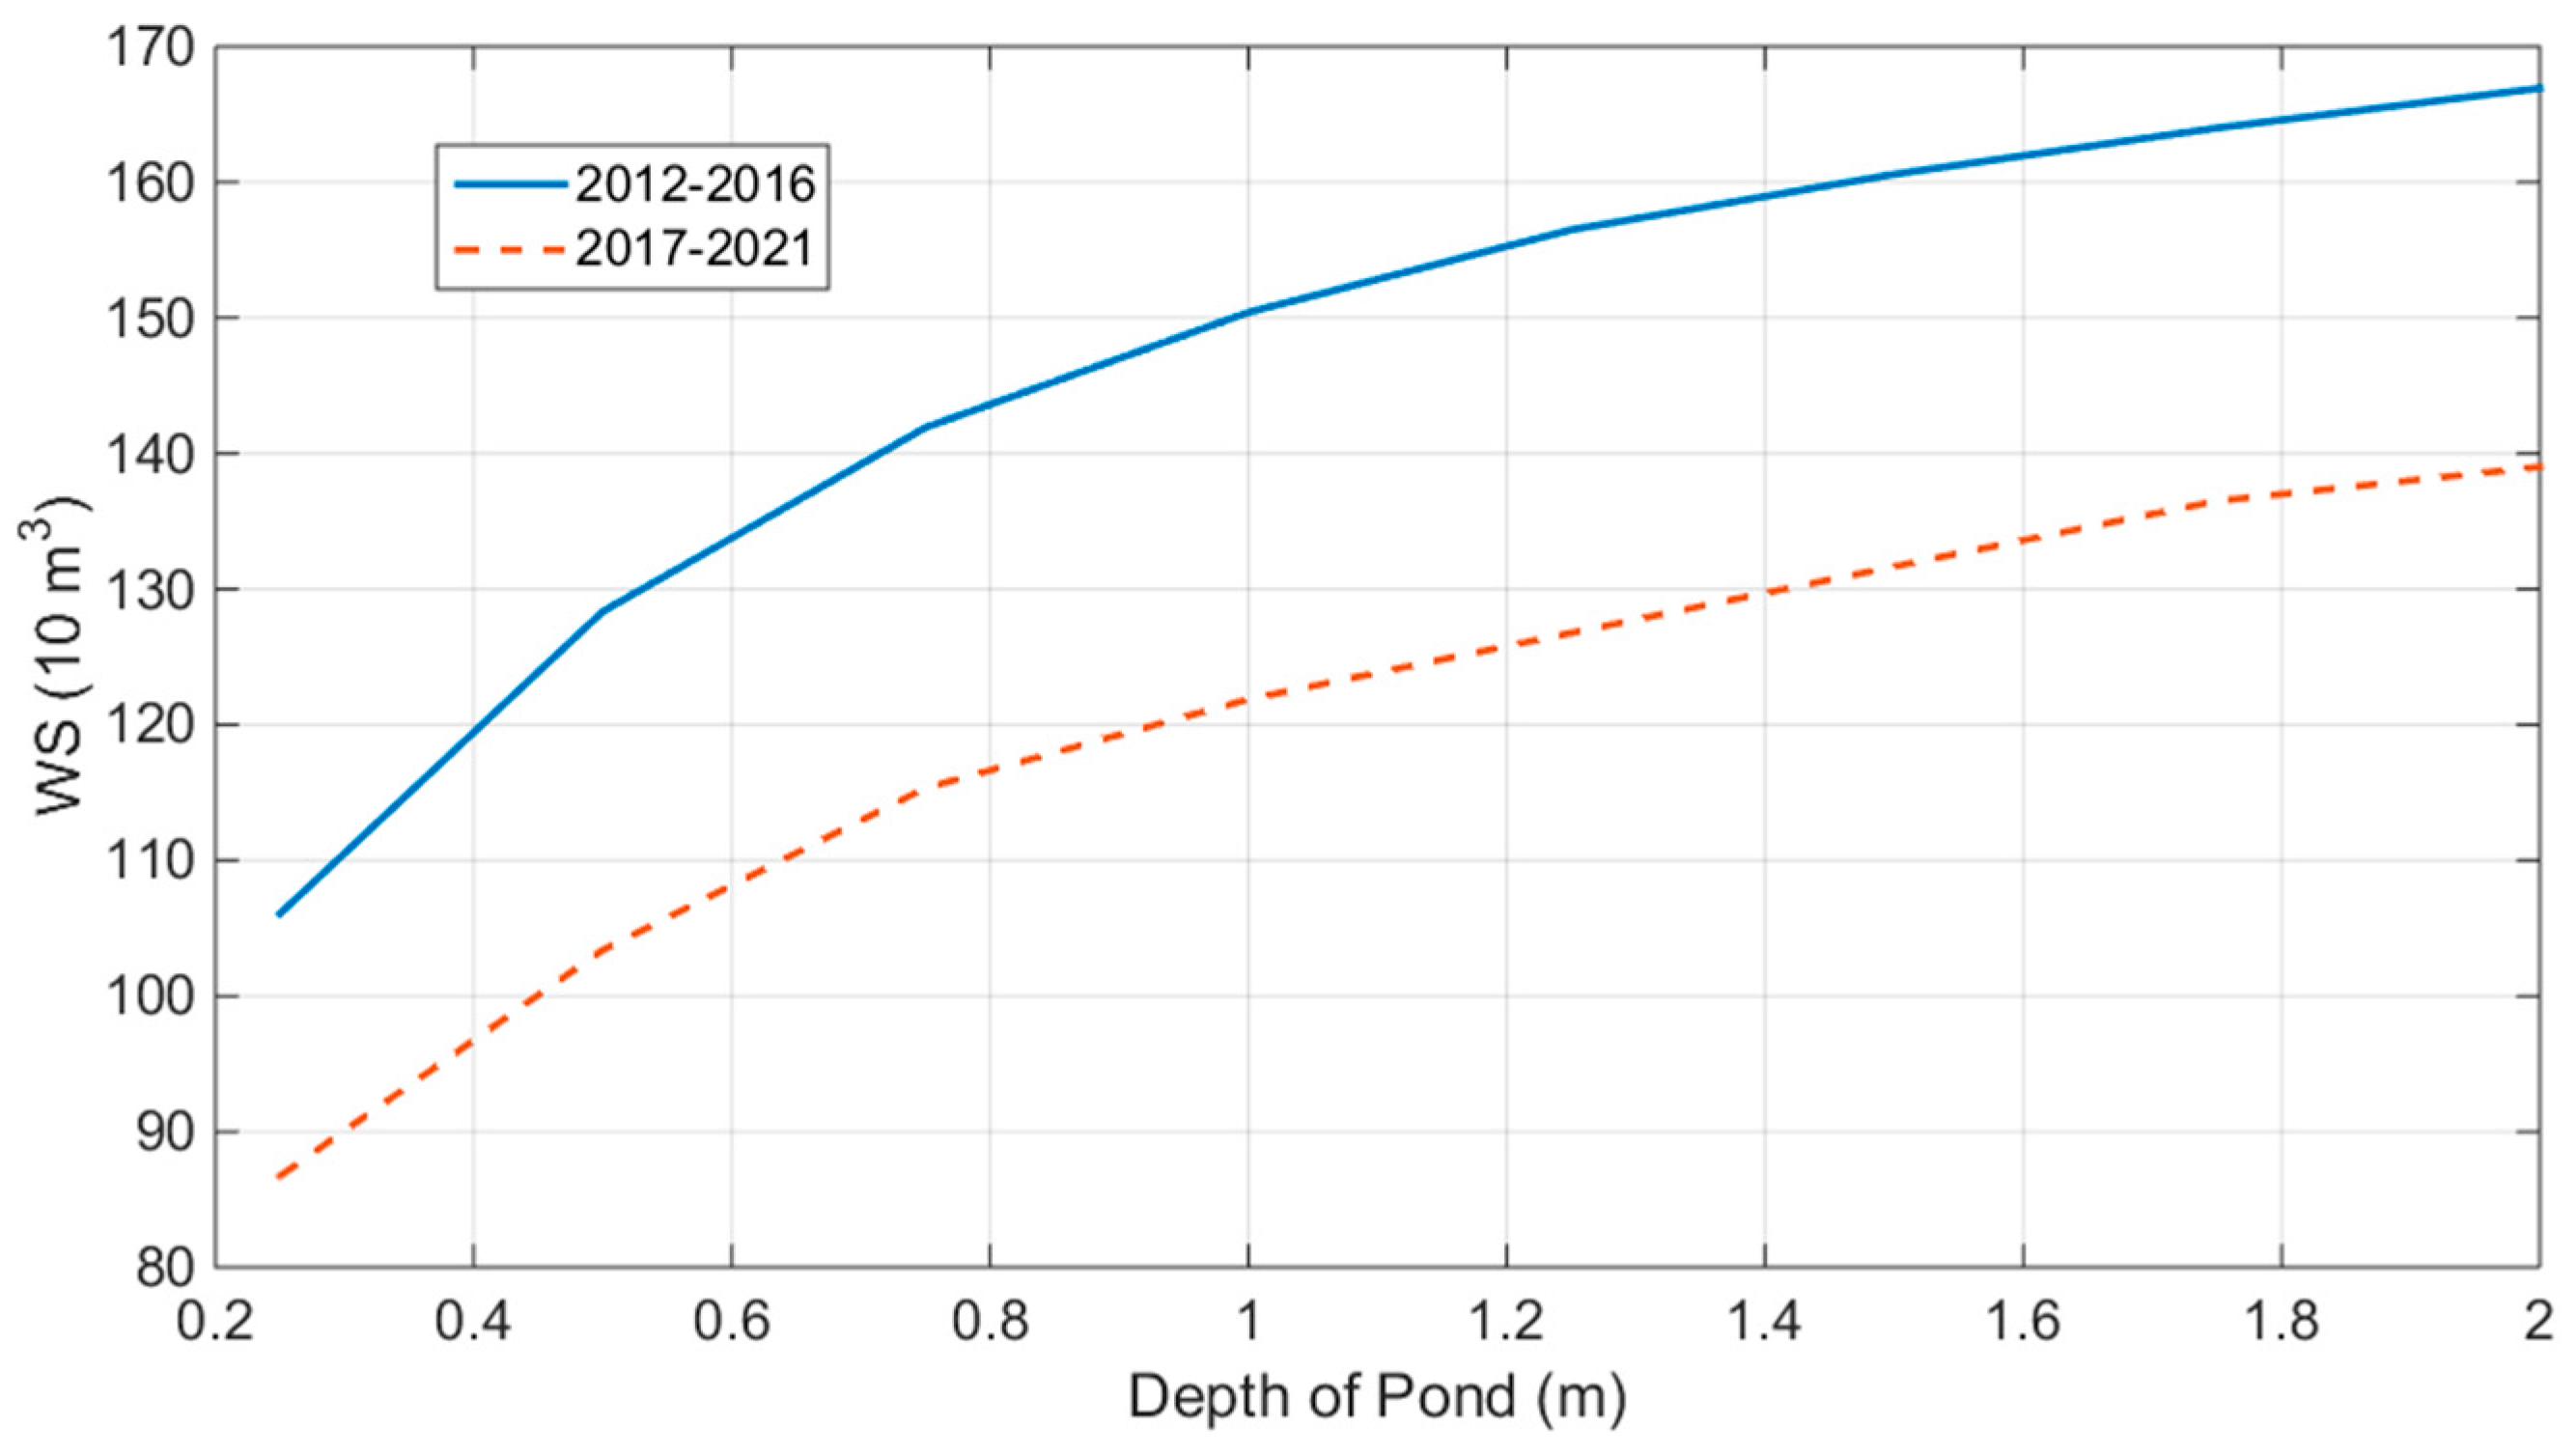
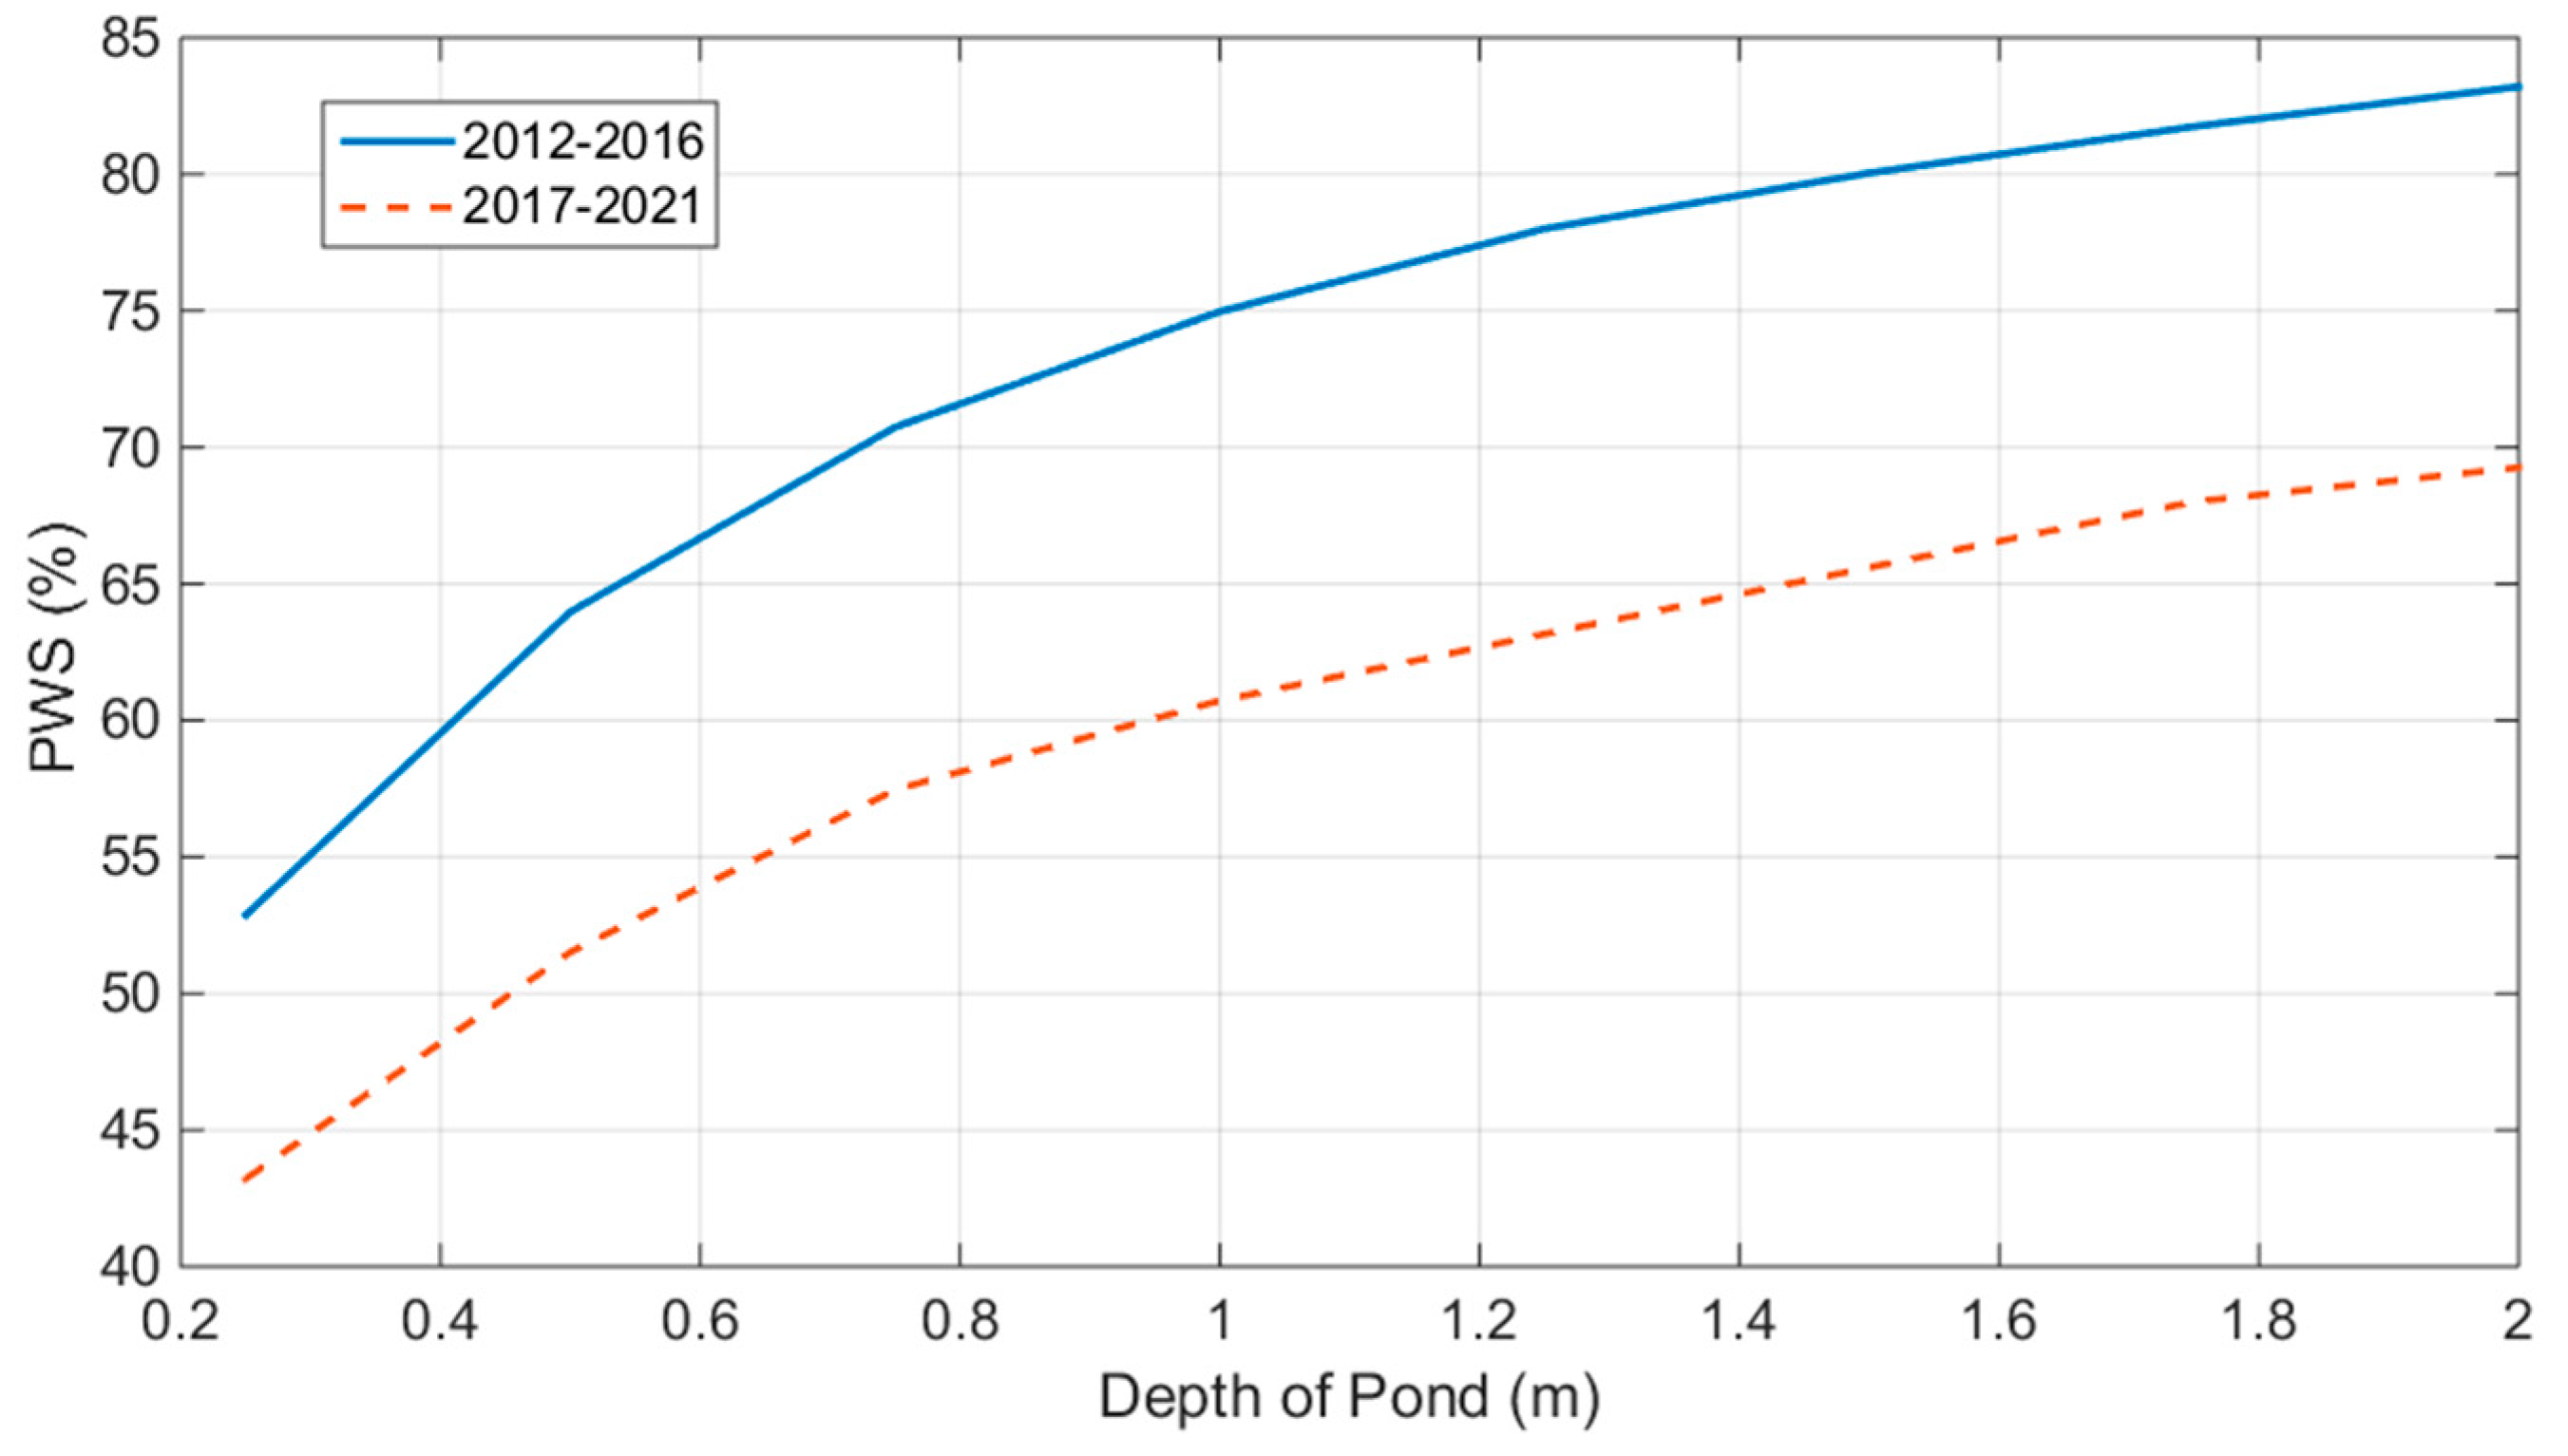
Figure 5 and Figure 6 depict the average amount of water saved by implementing the RWH system as well as the percentage water saving in proportion to water demand for different depths of the open pond. As with reliability, the amount of water saved and percentage water saving increase with an increase in the depth of the pond; however, both water saving and percentage water saving flatten as the depth increases beyond a certain volume. At a depth of 0.25 m, water saving and percentage water saving are 867 m3 and 43.2%, respectively. Increasing depth by 0.75 m to 1 m increases water saving and percentage water saving by 345 m3 and 17.5%, respectively, whilst increasing depth by a further 0.75 m to 1.75 m increases water saving and percentage water saving only by 147 m3 and 7.3%, respectively. Maximum water savings that can be achieved by the RWH system is approximately 1450 m3 or 72% of the average water demand of 2007 m3.
Similar to reliability, average water saving and percentage water saving are generally higher in the period 2011–2015 than in the period 2016–2020 at all depths of the pond.
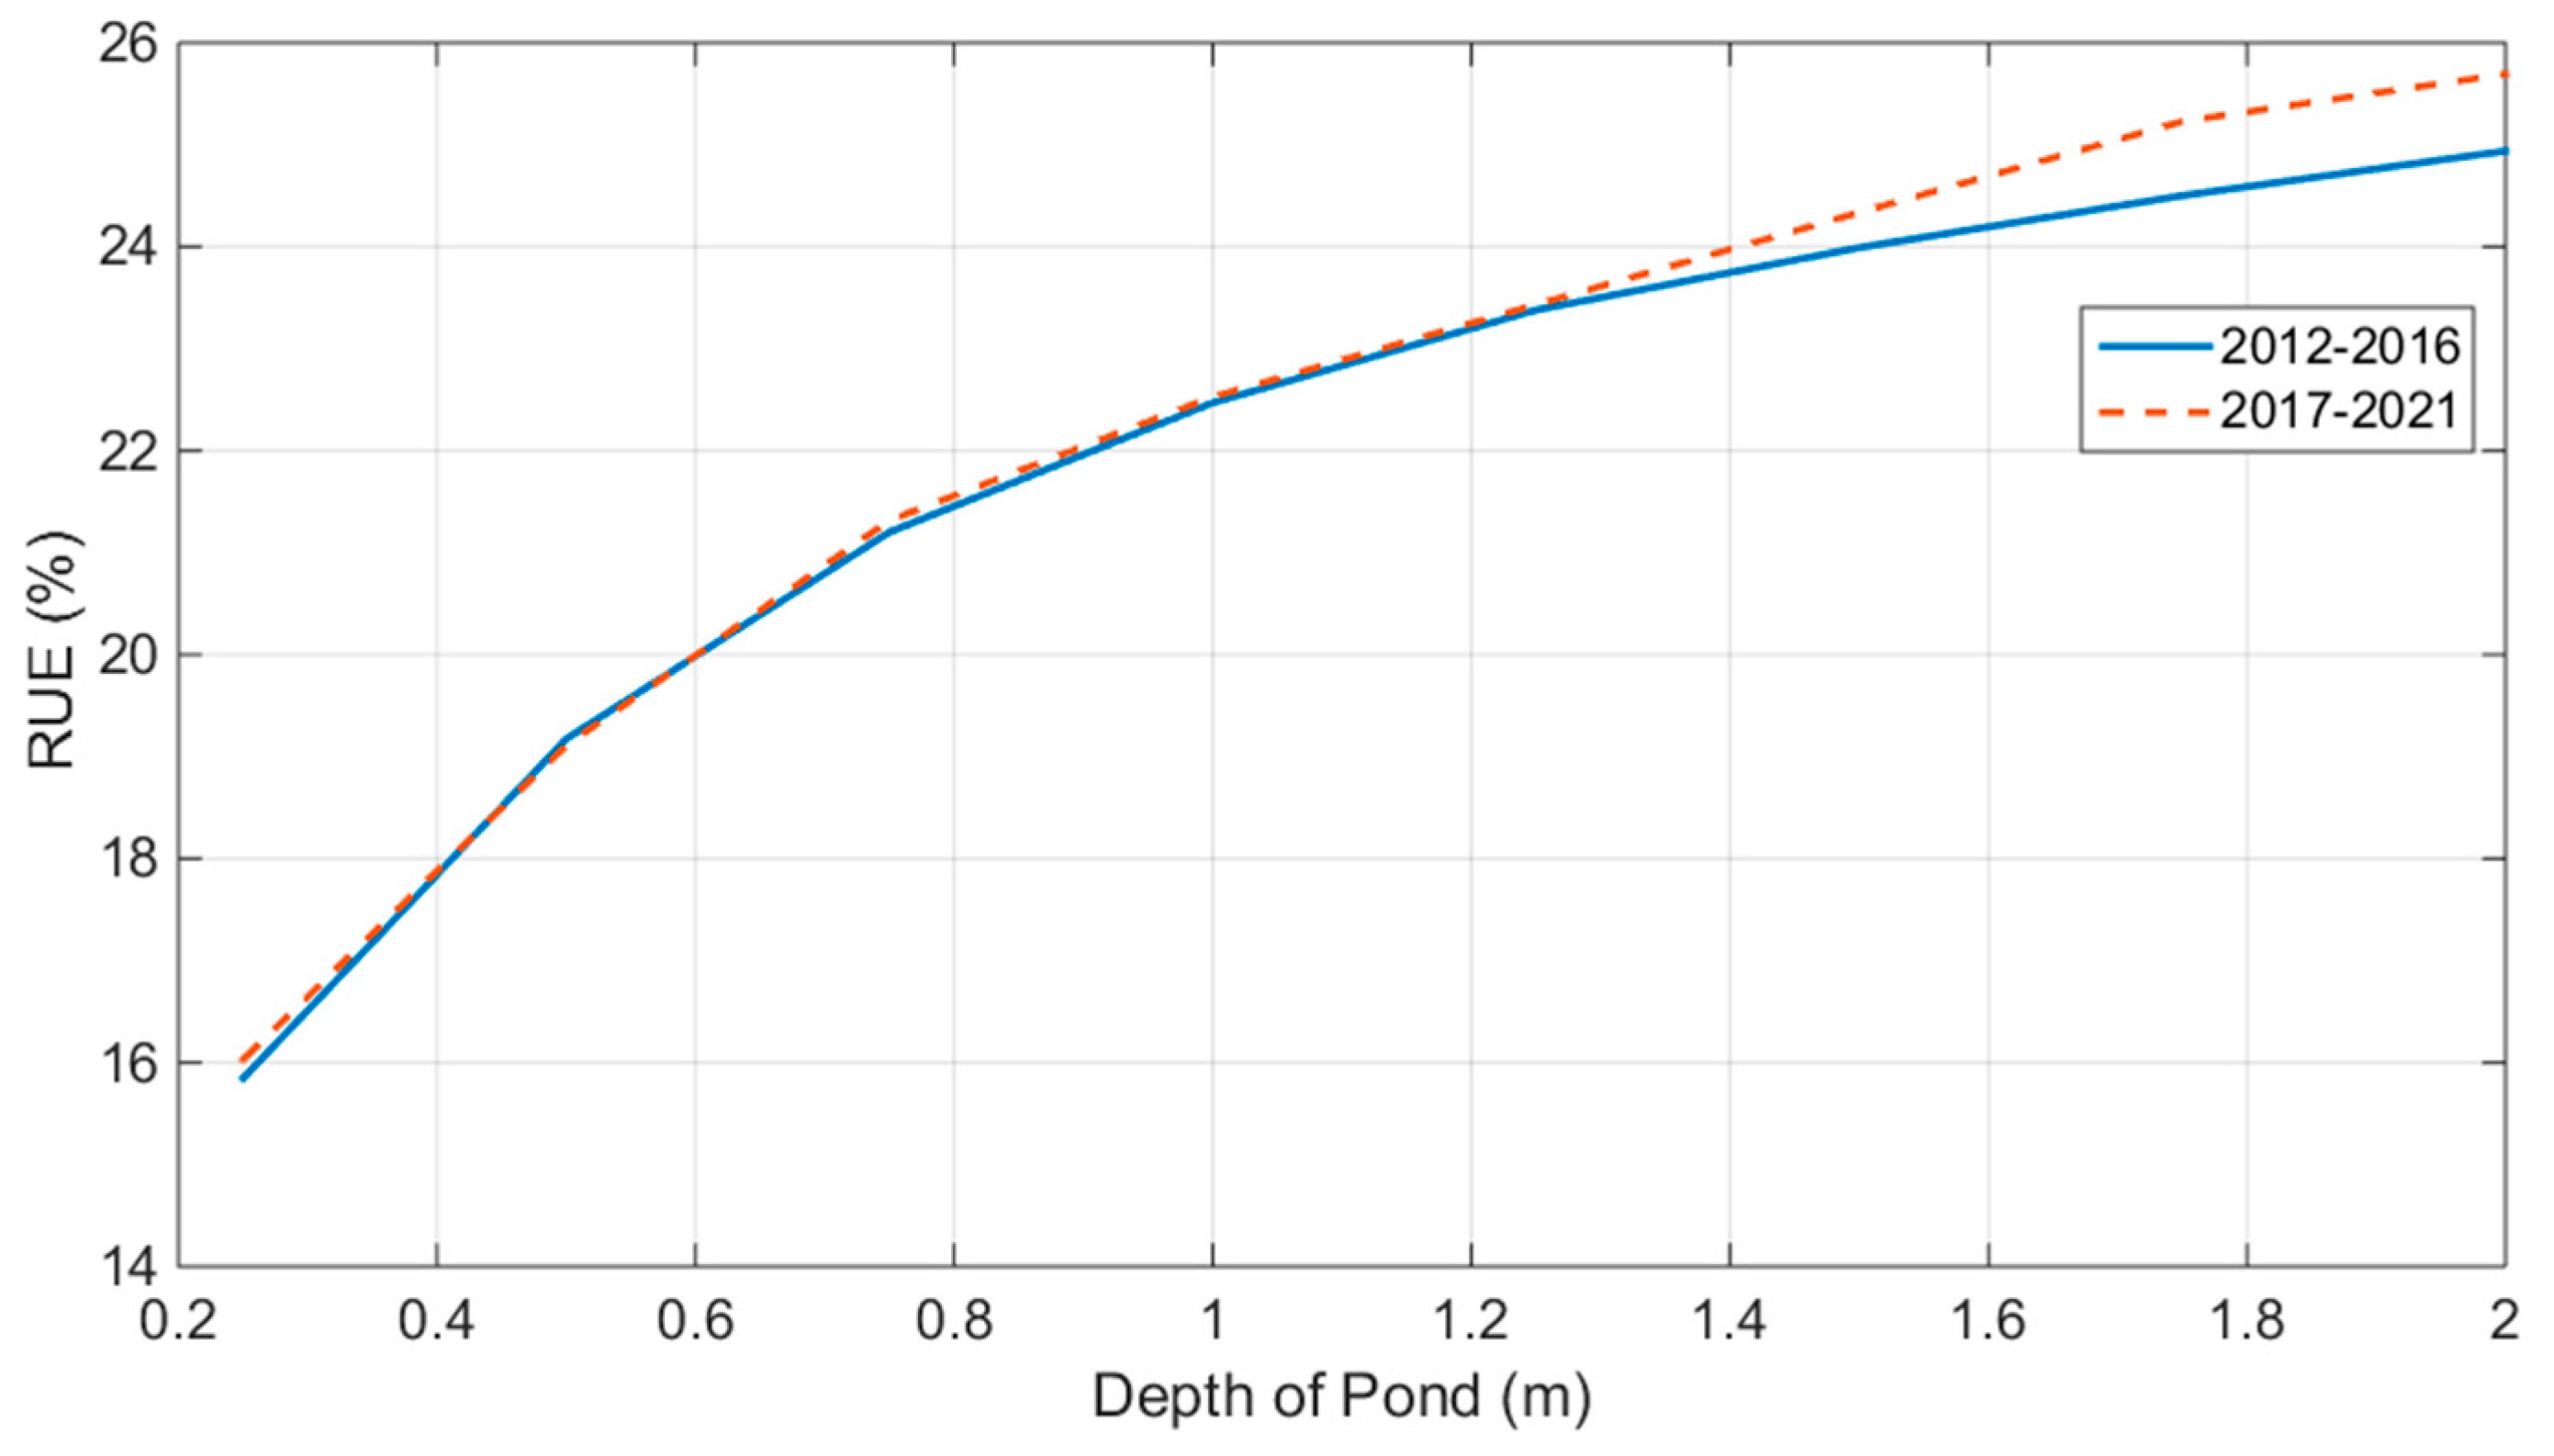
Figure 7 shows the rainwater utilisation efficiency (RUE) of the RWH system against different depths for the two periods. RUE represents the proportion of collected rainwater that is used for its intended purpose to the total amount of rainwater entering the system. It can be seen that RUE ranged between 16% and 26% for the depth under consideration, with RUE increasing with the depth of the pond. These low values indicate that most of the rainwater collected and entering the system was wasted in the form of evaporation and overflow from the pond instead of being used for its intended purpose. Interestingly, RUEs for the period 2016–2020 were generally slightly higher than the period 2011–2015, despite the higher amount of rainfall and less evaporation during the 2016–2020 period. Although more rainwater entered the system, most of it was not used to serve demand; rather, it overflowed from the system. RUE was around 16.0%, 22.5%, and 25.2% at depths of 0.25 m, 1.0 m, and 1.75 m, respectively, with maximum RUE of approximately 26%.
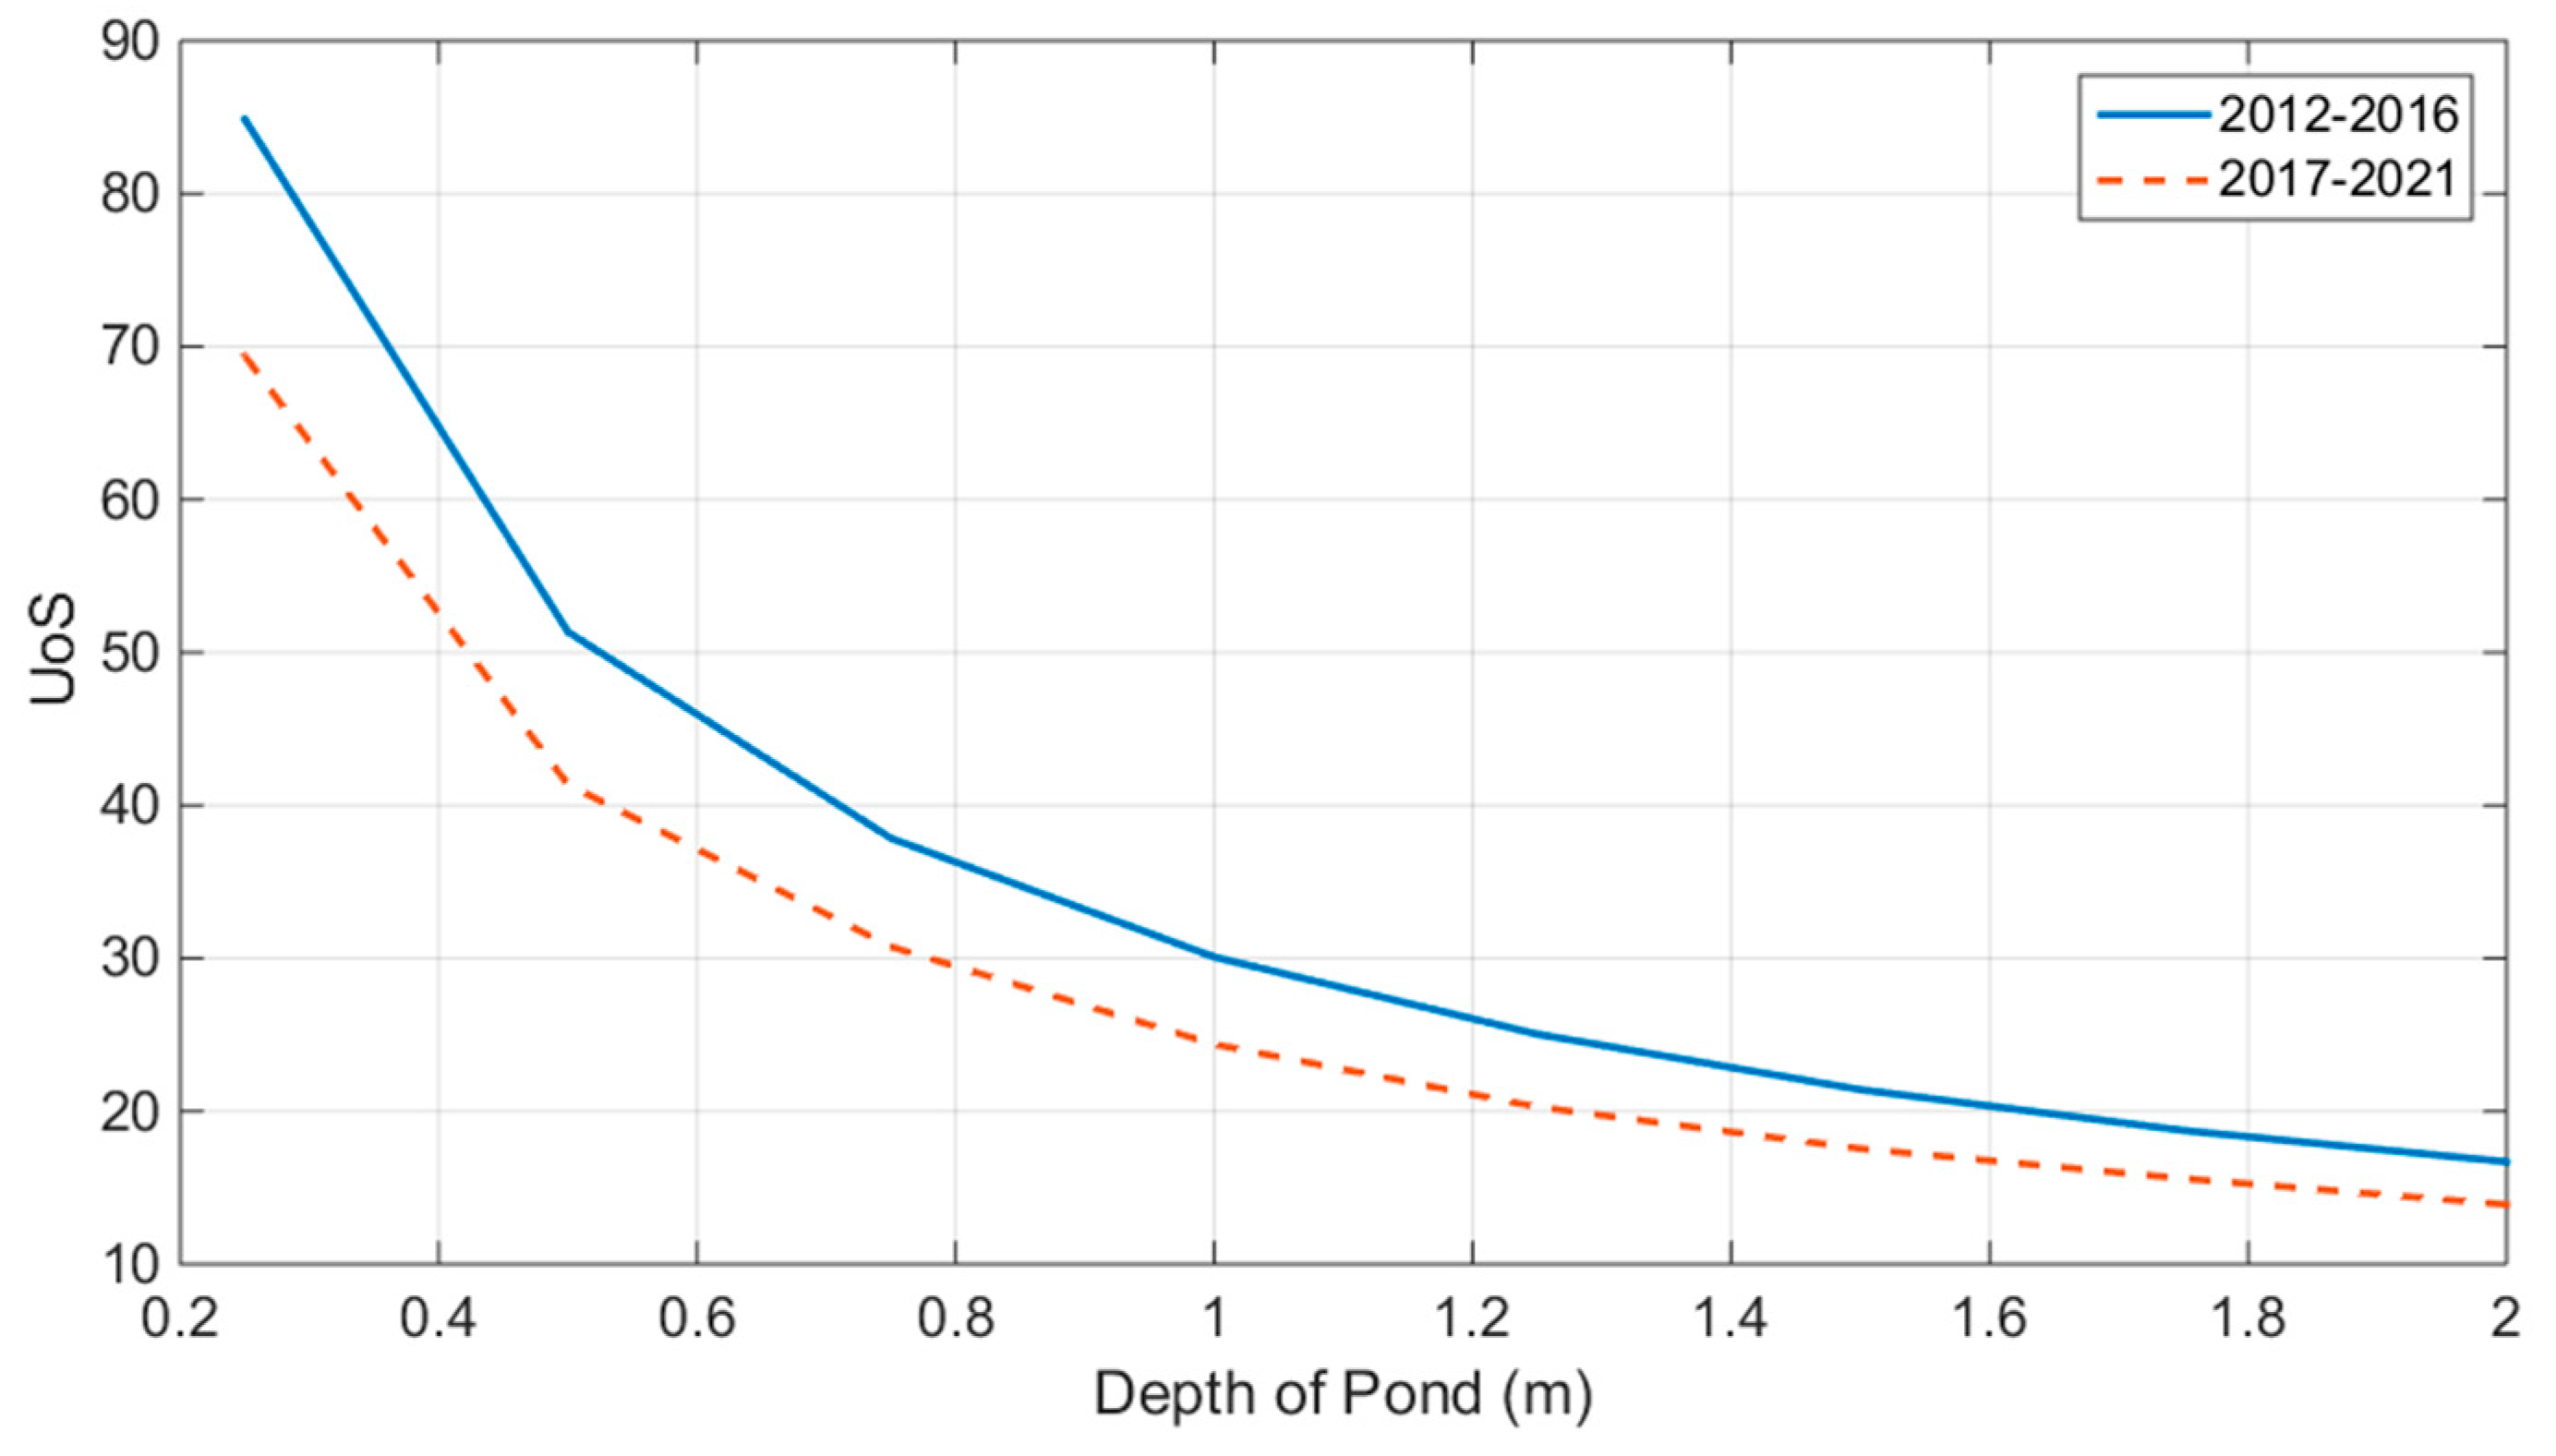
The utilisation of the system (UoS) of the RWH system against different depths for the two periods is given in Figure 8. It can be seen that UoS generally decreases exponentially with depth. High UoS indicates that most of the water stored in the pond is used to meet demand. For the period 2016–2020, UoS was 69 at a depth of 0.25 m and decreased to 24.4 and 15.6 at depths of 1.0 m and 1.75 m, respectively. UoS was higher for the period 2010–2015, with UoS of 84.9, 30.1, and 18.7 at depths of 0.25 m, 1.0 m, and 1.75 m, respectively. The higher water saving in the earlier period generally results in a higher UoS, with UoS decreasing with an increase in depth, as per Equation (13).
3.2.3. Sensitivity Analysis
The above performances were made based on system specification of the existing decorative open pond and rooftop of the local Jame’ Asr Mosque, as well as historical footfall at the mosque. Sensitivity analysis was performed by changing different parameters: area of the open pond , catchment area , and water demand . The size of the open pond can be adjusted by design, whilst variation in the catchment area and water demand can be expected from variations in the size of the mosque. Figure 9, Figure 10 and Figure 11 show the effect of varying , , and on the different performance measures, with the depth of the pond kept constant at 0.5 m.
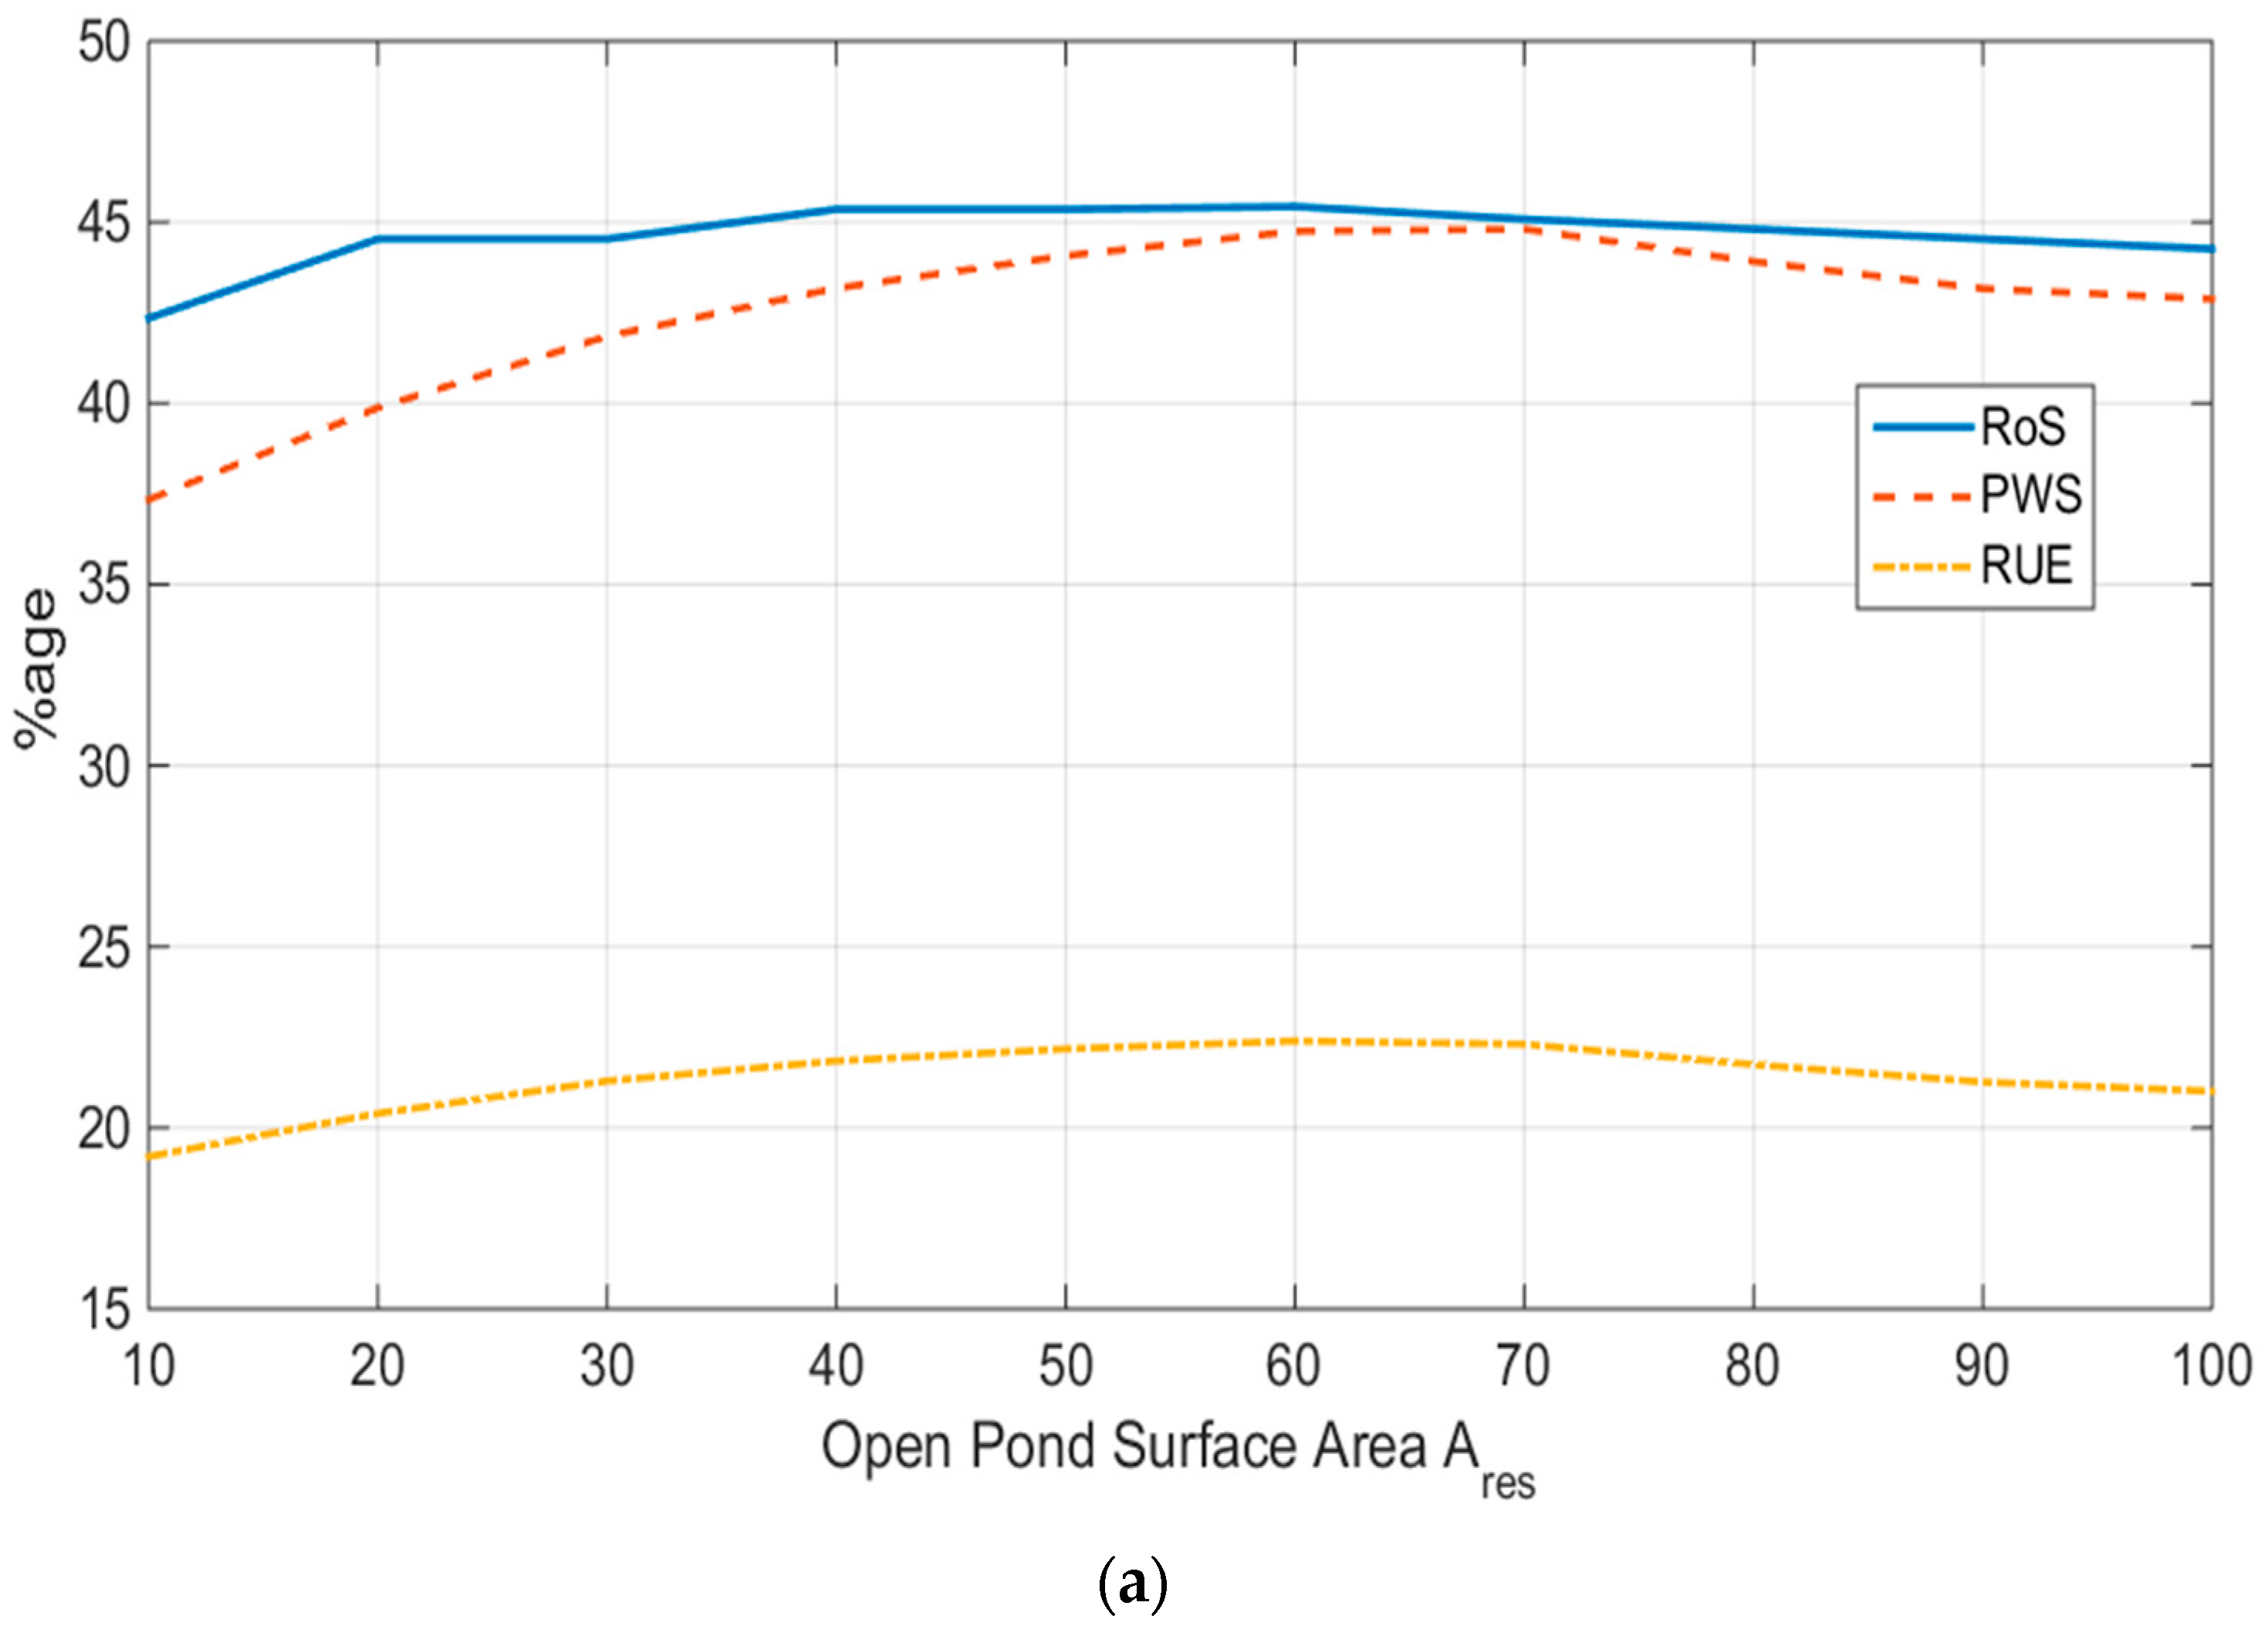
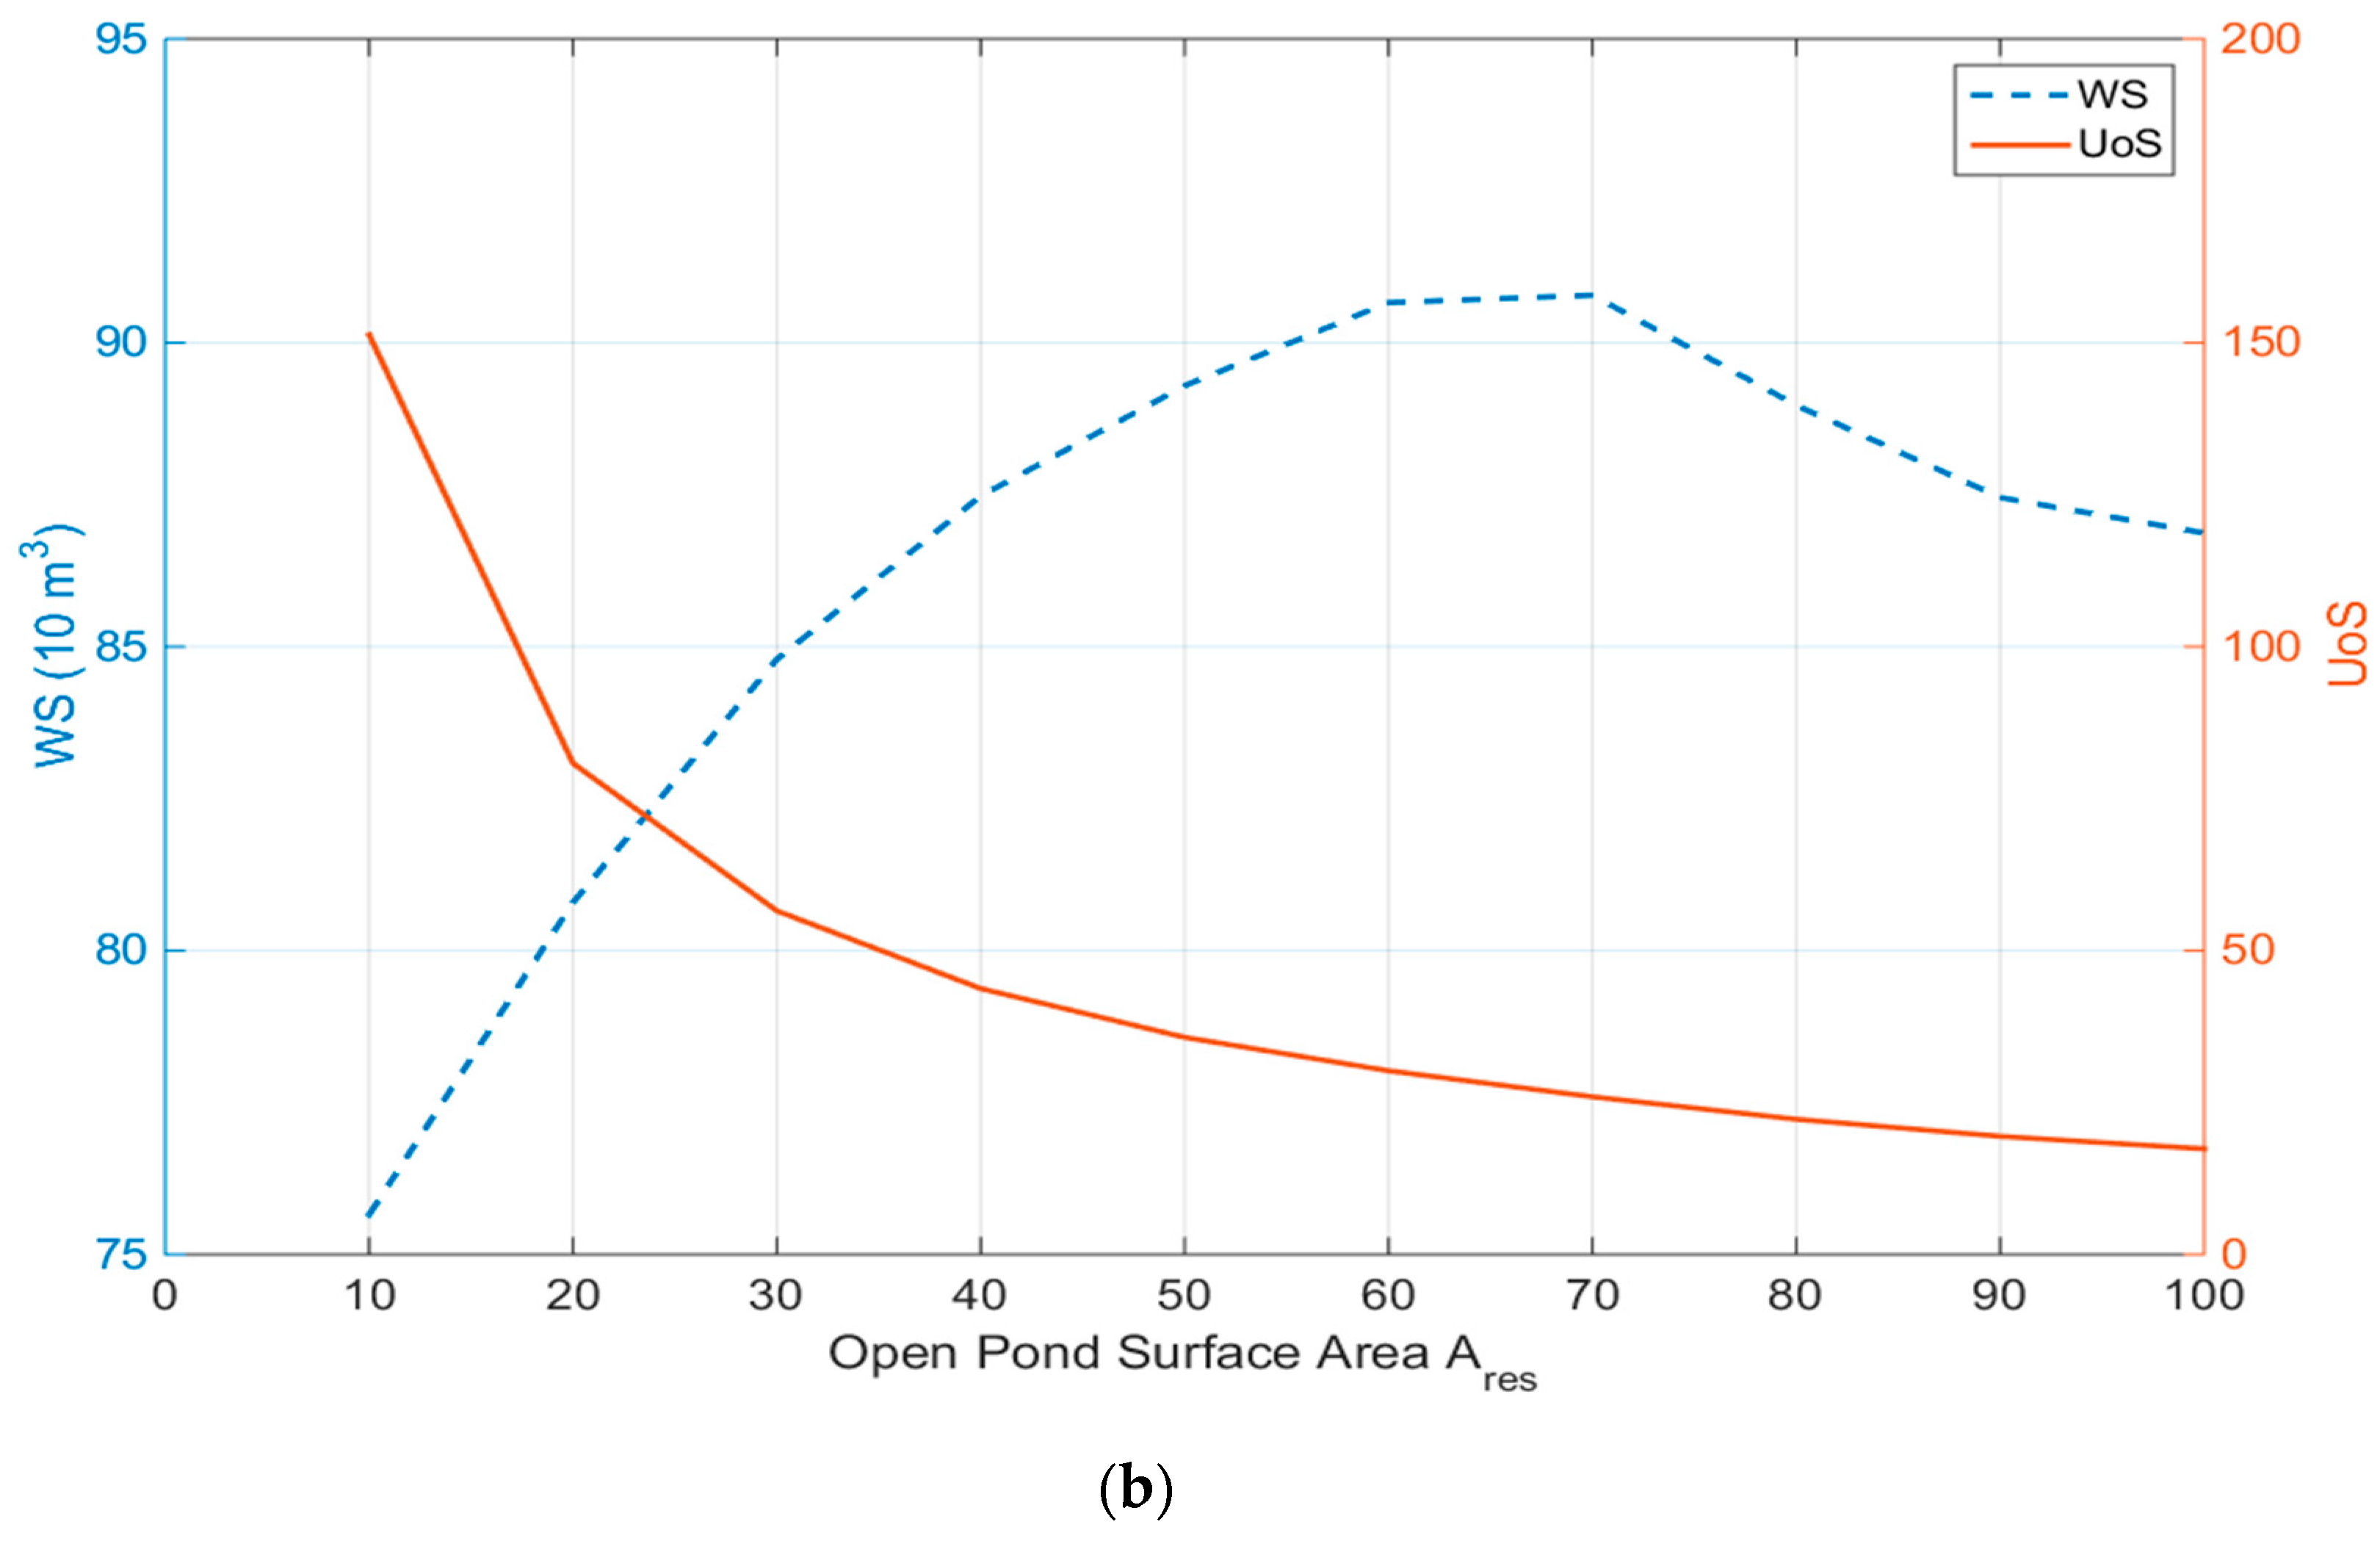
From Figure 9, it can be seen that reliability Rt varies only slightly between 42% and 45.5% with changes in the pond’s surface area , peaking at 45.5% when . Although the volume of the pond increases with an increase in , water evaporation also increases. It can also be observed that there exists an optimum pond surface area of 70 m2, which would provide maximum water saving, percentage water saving, and RUE of 907.8 m3, 44.8%, and 22.3%, respectively. The utilisation of RWH to its maximum capacity throughout the year (UoS) decreases as the volume of the pond increases from the increase in surface area; hence, the open pond was not fully utilised to its maximum potential to store rainwater.
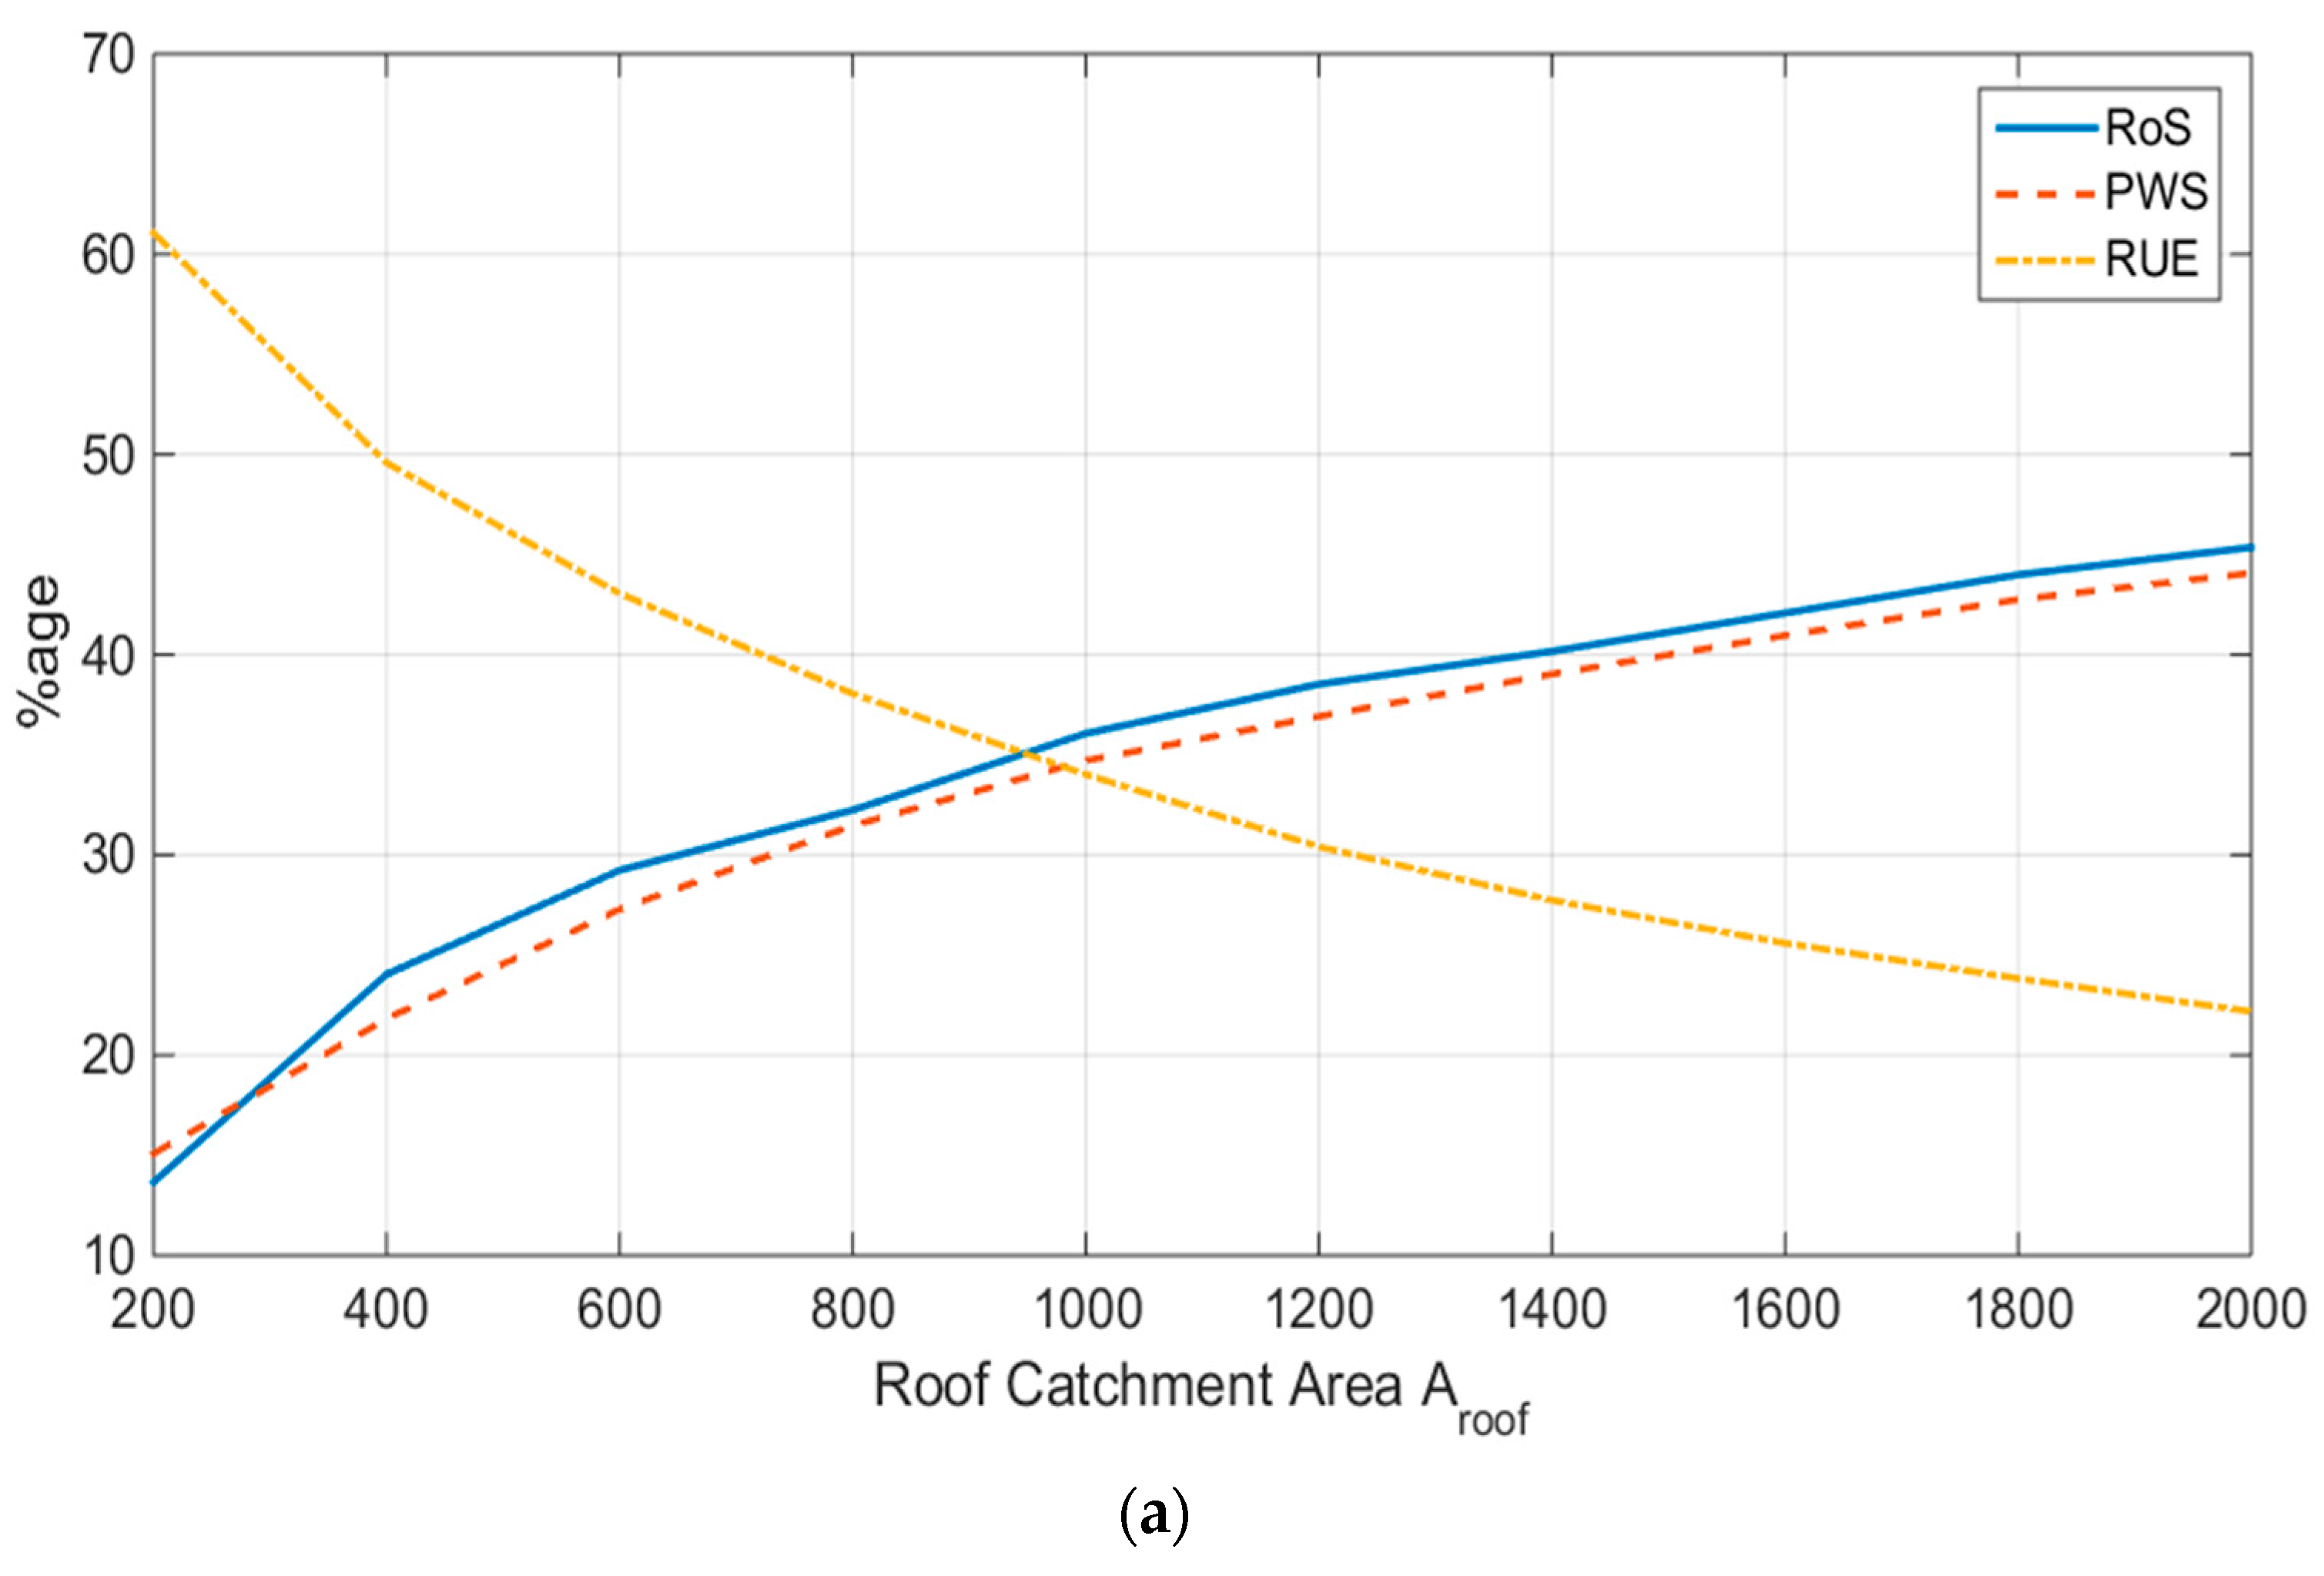
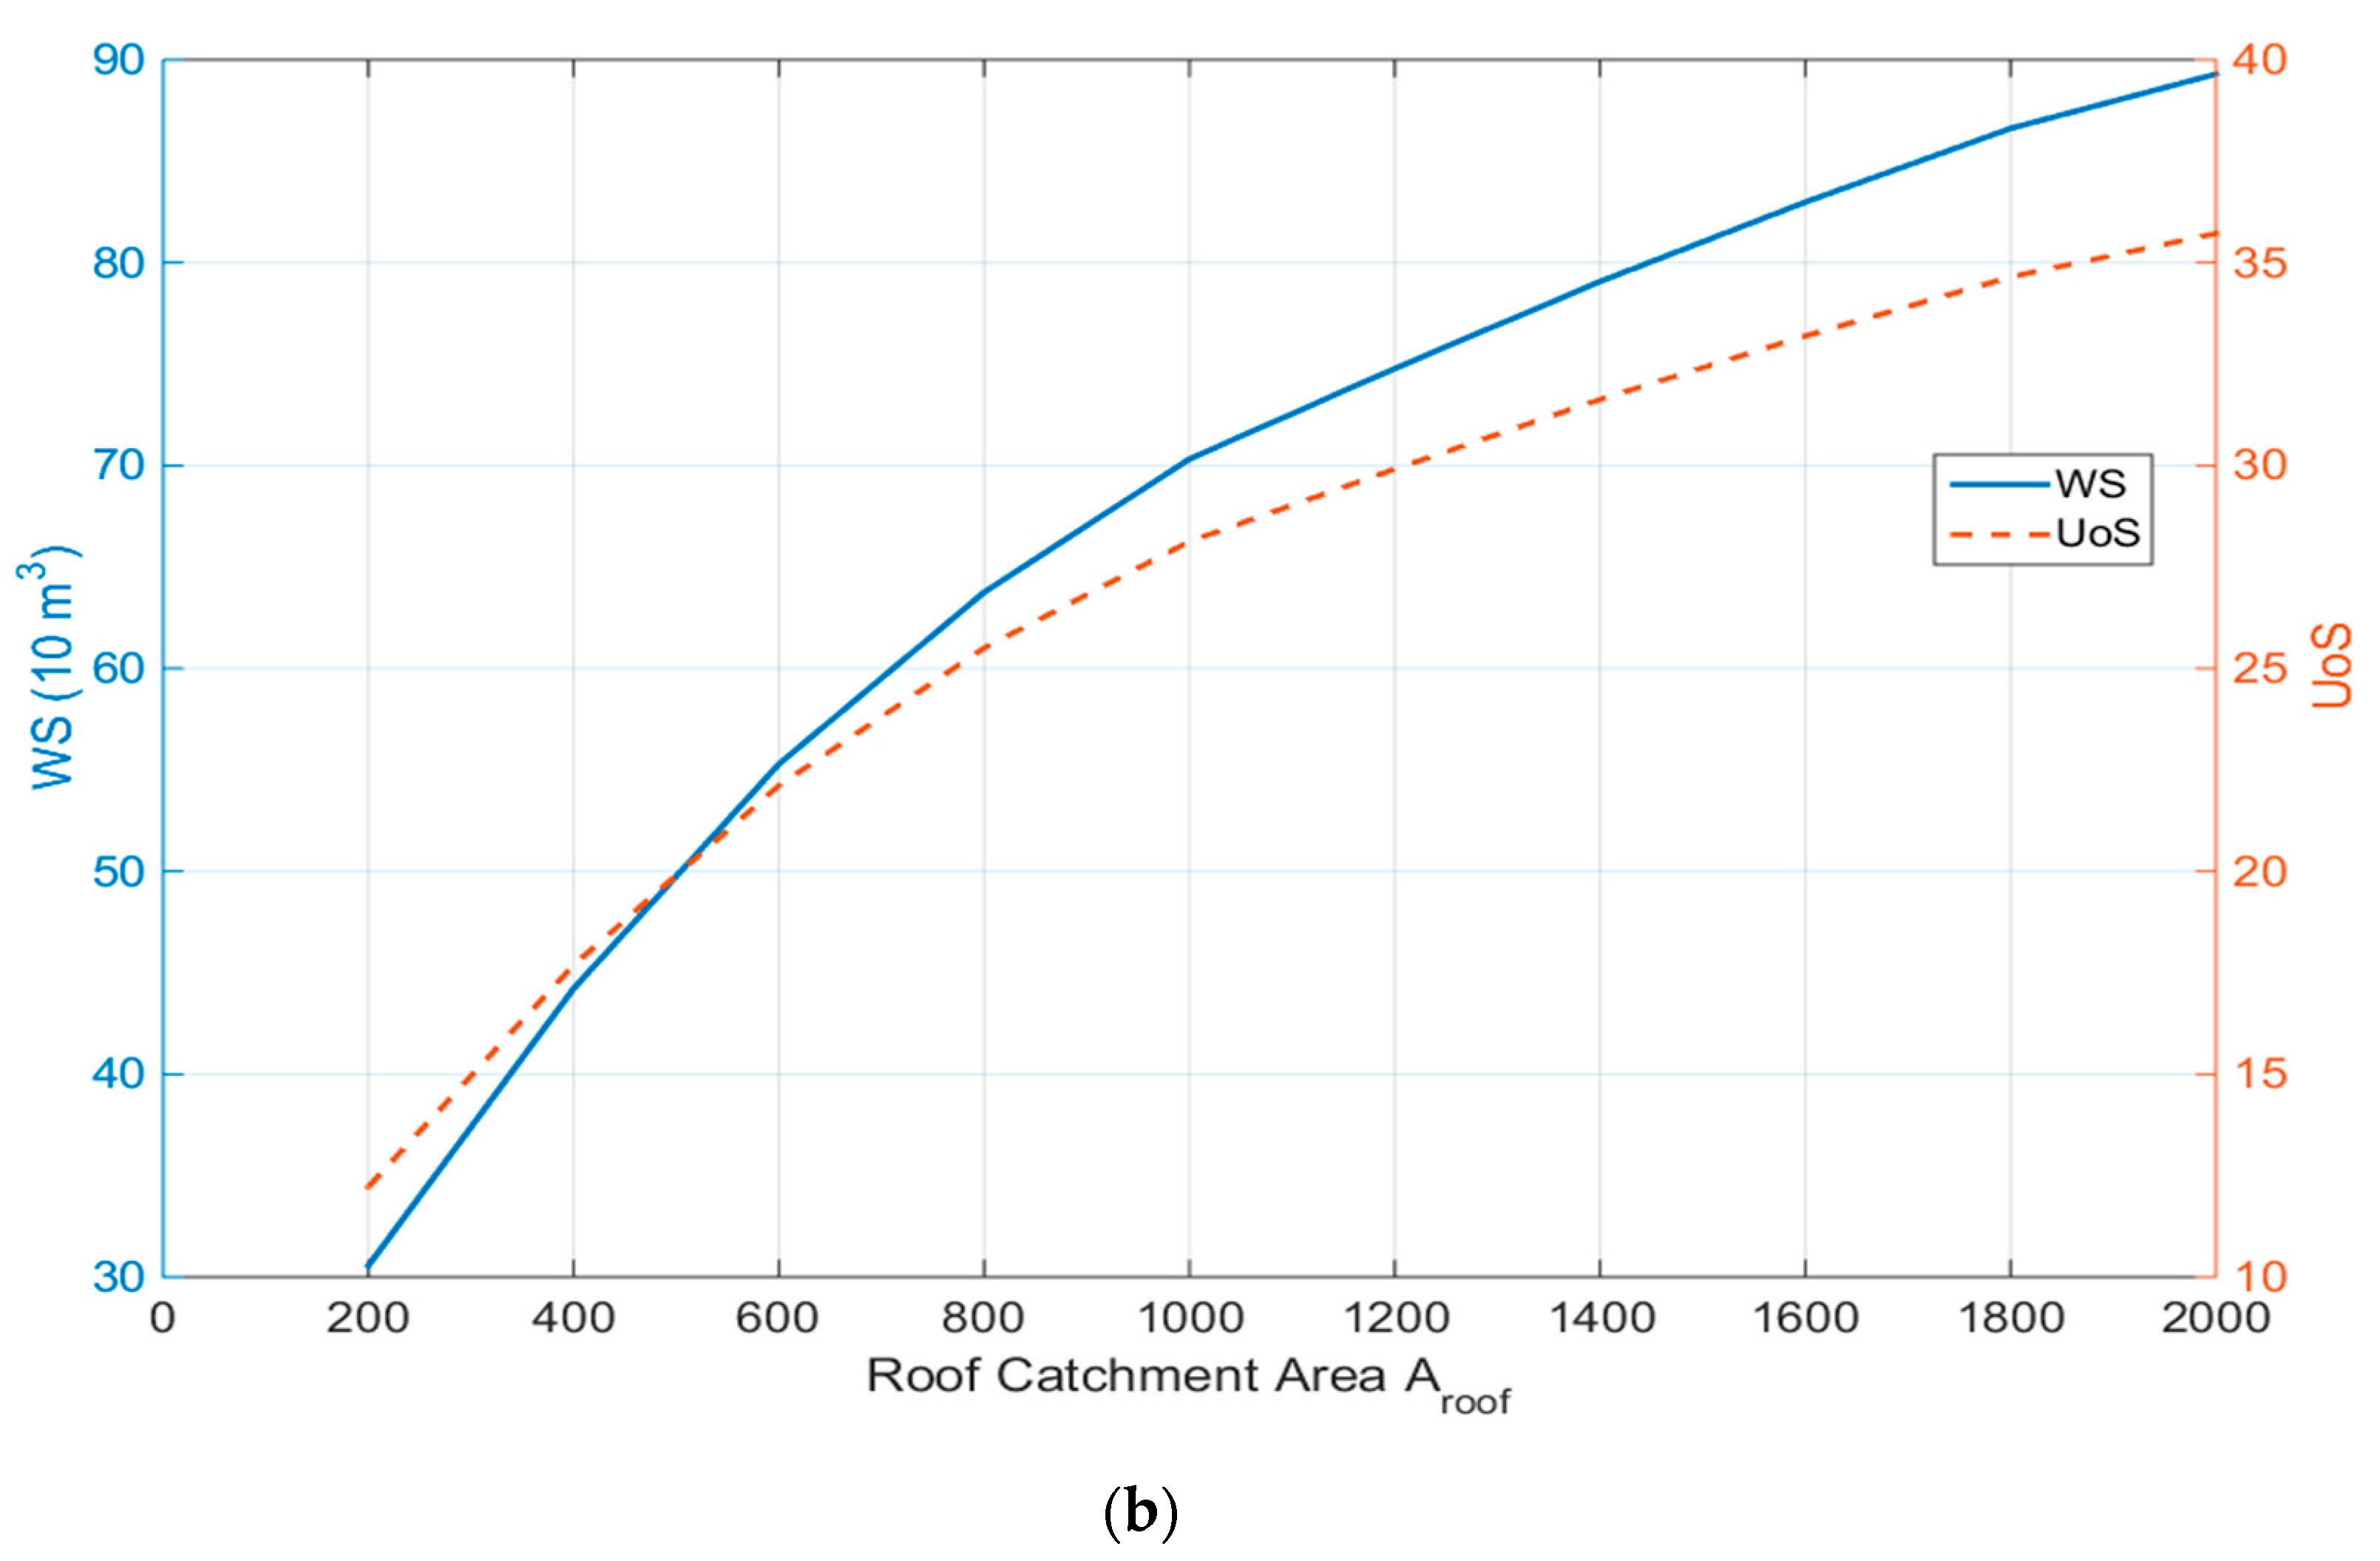
Figure 10 shows the performance of the RWH system with different roof catchment areas . It can be seen that RoS, WS, PWS, and UoS increase with an increase in the roof catchment area. Naturally, a large catchment area is able to harvest a larger volume of rainwater for the RWH system, keeping the pond always full and consequently providing ample amount of water to satisfy demand to give high reliability and water saving, as well as utilising the open pond fully for water storage. However, the larger volume of harvested rainwater also results in more water overflowing from the pond relative to the amount of water used to satisfy demand. This results in a reduced RUE with an increase in the roof catchment area .
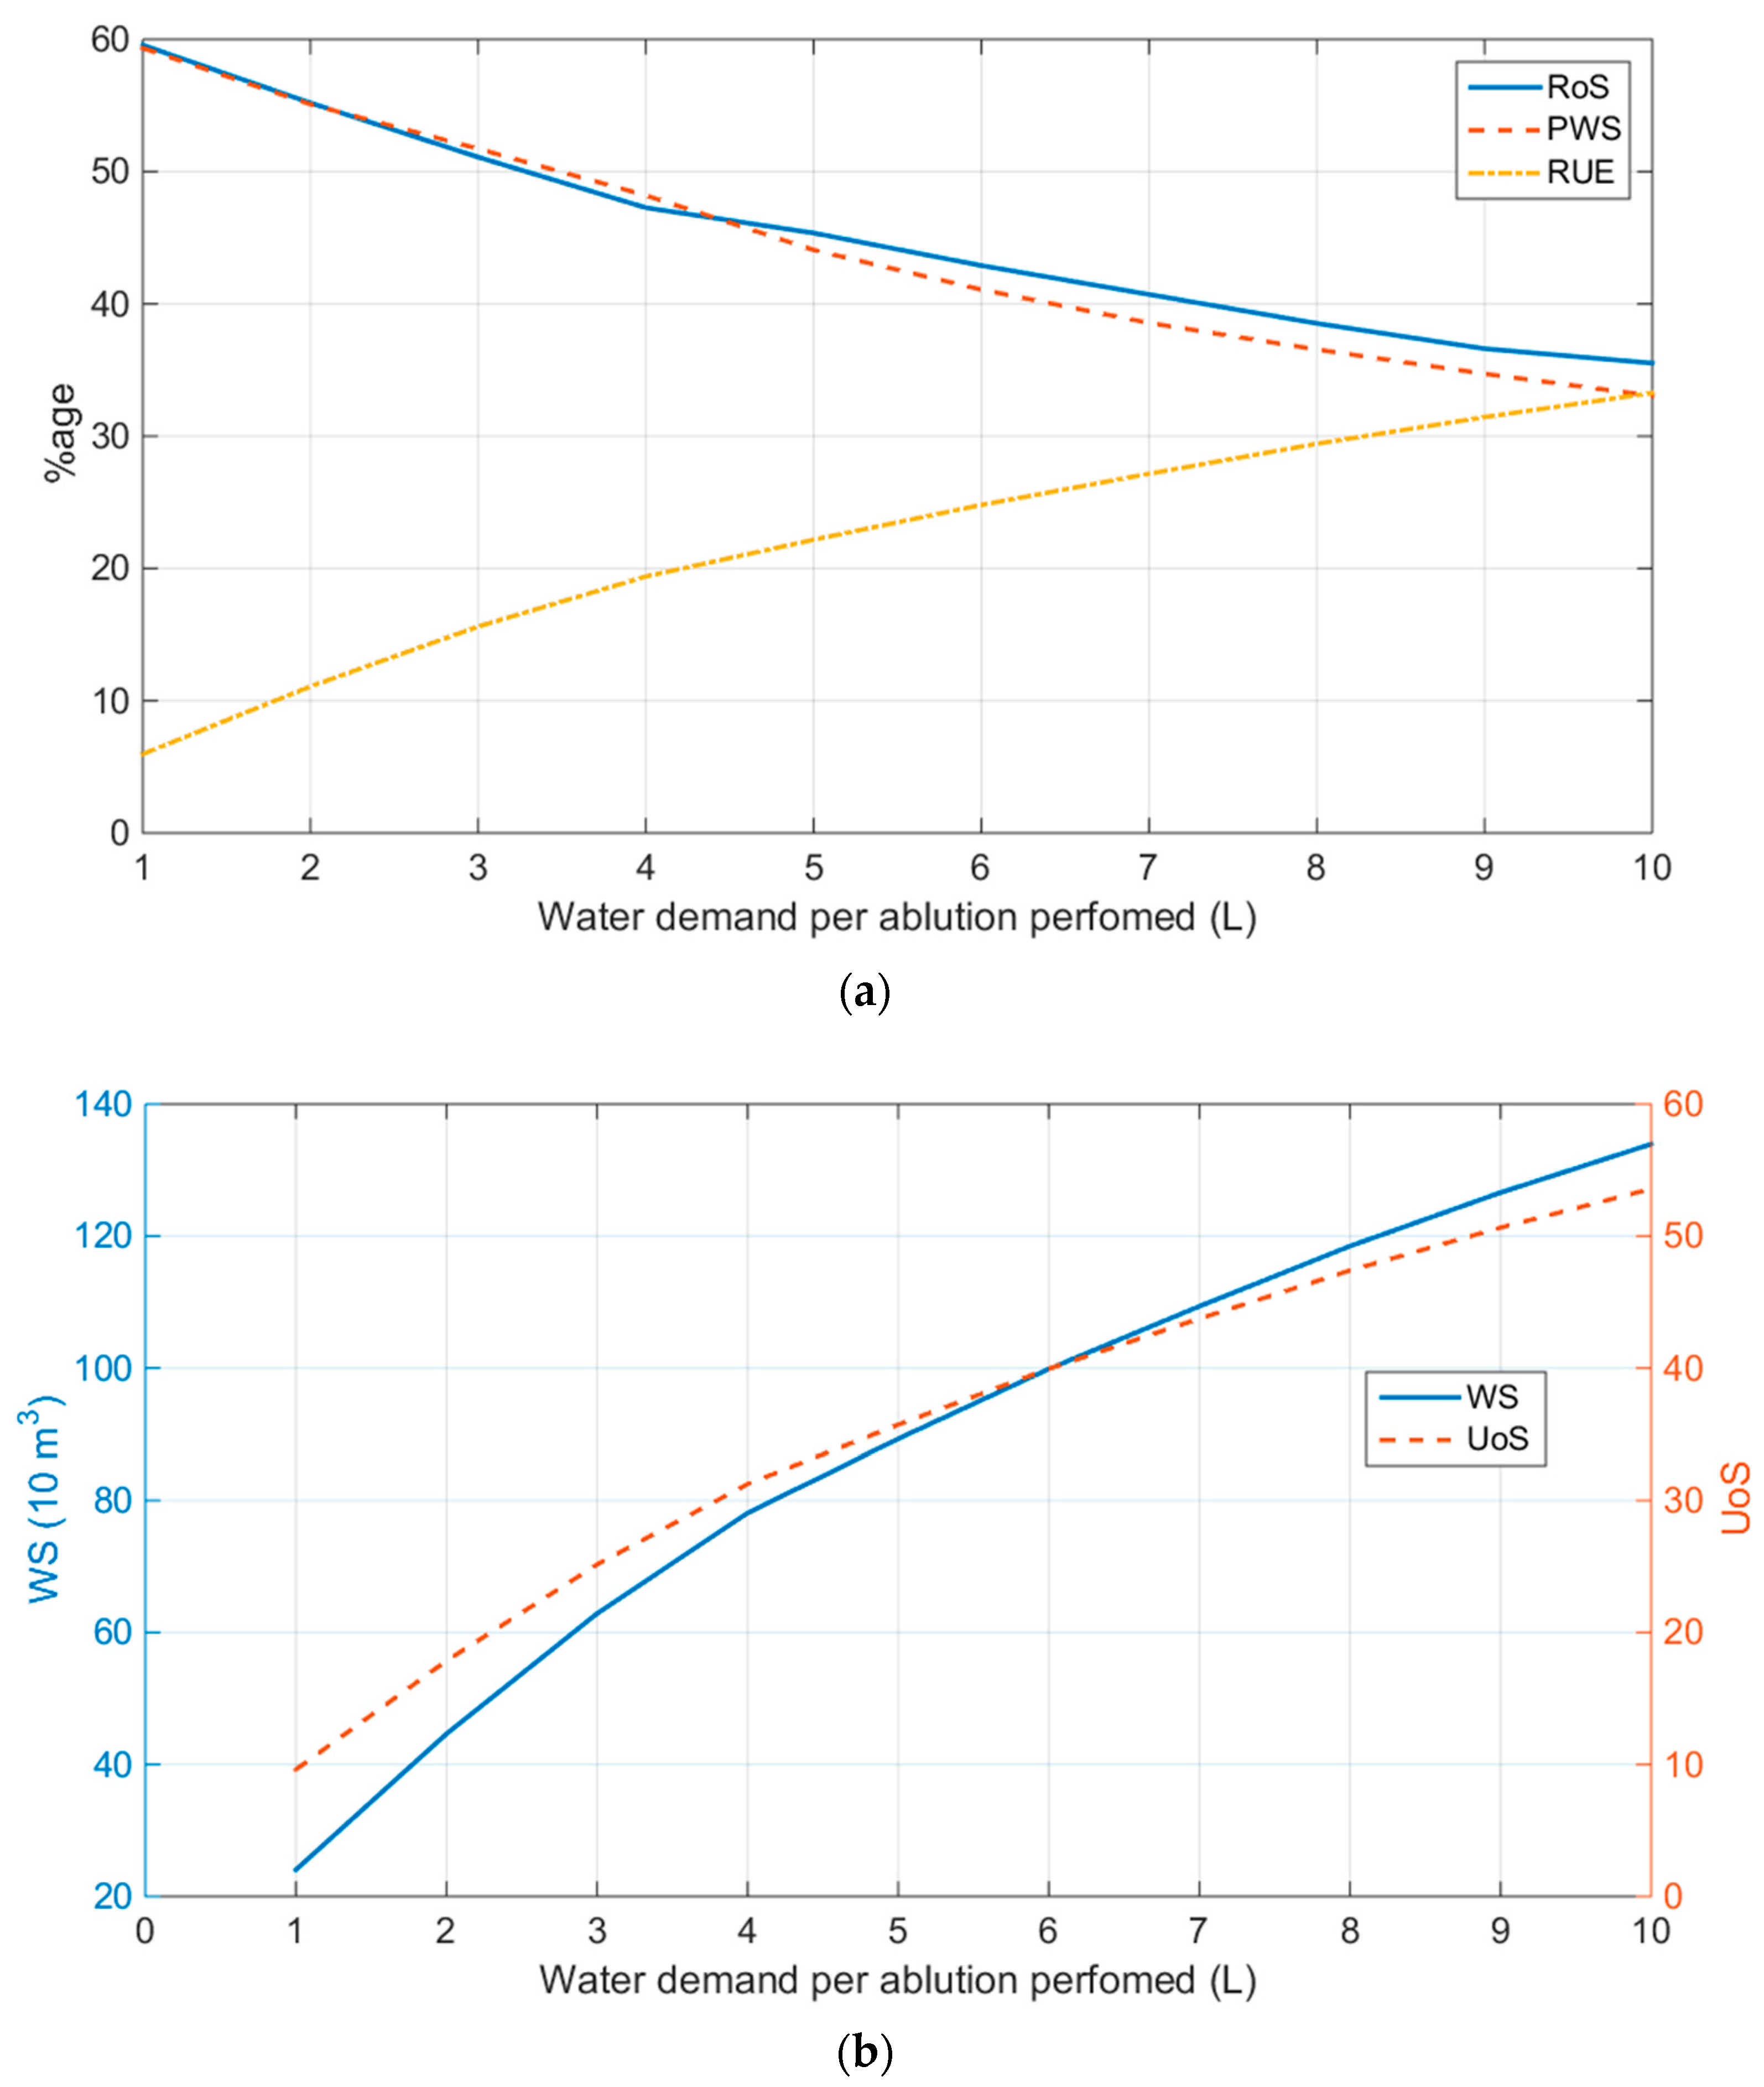
So far, the amount of water used for ablution per person has been assumed to be 5 L/person. Figure 11 shows the variation in performance of the RWH system with different volumes of water used per person, between 1 L/person and 10 L/person. As expected, the amount of water saving WS increases with an increase in water demand. This also means that both RUE and UoS increase, as more harvested rainwater is used to satisfy demand rather than overflowing from the open pond. However, as the RWH is unable to supply enough water to the increasing water demand, both reliability and PWS reduce.
3.2.4. Discussions of Results
The results indicate that the quality of the harvested rainwater satisfies the standards of potable water (in terms of TDS, EC, and turbidity), except for pH, which has been shown to be slightly acidic, particularly the harvested rainwater left in the open pond. The pH of the rainwater samples taken from direct rainfall, roof run-off, and from the pond at a local mosque gave averages of 5.91, 5.99, and 5.07, respectively, which fall outside the World Health Organisation’s pH standard range of 6.5–8.5 for potable water. This can be easily solved by the regular addition of an alkaline substance, such as baking soda (sodium bicarbonate), into the harvested rainwater to increase pH [47]. Other researchers [16,48] have also suggested the use of neutralising filter containing limestone to filter the harvested rainwater whilst increasing its pH to an acceptable level. Nevertheless, since the harvested rainwater is only to be used for ablution purposes, it can be argued that no further treatment is necessary.
Utilising the RWH model, it has been demonstrated that the RWH system is able to sufficiently supply enough water for up to 273 days in a year, i.e., 75% reliability. The limit on water saving is 1450 m3 or 72% of water demand, and the maximum RUE is 26%. It is noted that these maximum limits are achieved with a very deep pond, with the performance measures exhibiting logarithmic growth with depth. When designing such a publicly assessable system, cost and more importantly safety aspects of the open pond need to be carefully considered. Implementing a dangerously deep open pond with minimal performance improvement benefits may potentially discourage, rather than encourage, the adoption of rainwater harvesting. To ensure safety, the open pond needs to be designed at a suitable depth. At a safe depth of 1.0 m, the reliability of the system is 62.5% (228 days per year), water saving is 345 m3 or 60.7% of demand, RUE is 22.5%, and UoS is 24.4. To increase efficiency further without jeopardising safety, storage water tanks may be used for additional storage of overflowing water from the open pond.
Sensitivity analyses have also been performed to see the effect of changing pond surface area, roof surface area, and water demand on the performance of the system. Increasing pond surface area increases the volume of storage; however, it also increases evaporation. A pond surface area of 60–70 m2 struck the balance between increasing volume for storage and limiting evaporation loss to give the optimum reliability, water saving, and RUE. In terms of variation in performance with respect to roof surface area, it is shown that system performance generally improves with an increase in roof surface area. This is expected as an increase in surface area allows an increase in harvested rainwater. On the other hand, increasing water demand generally decreases performance, as the system struggles to keep up with the increase in demand. This highlights the importance of water use conservation.
Selecting the optimum parameters, including open pond area, depth, and rooftop area, for implementing an RWH system at religious institutions is often difficult, as it needs to consider the often varying weather conditions, weather patterns, and water demands. Mosques generally have spurts of high demand, particularly during Friday congregation prayer times, and the RWH system may not be able to fully satisfy water demand during those times. As such, it may be beneficial to supplement the RWH system with the main water distribution system.
It can be seen from the study that the implementation of an RWH system for ablution purposes is possible by looking into the quality of the harvested rainwater and beneficial by looking into the amount of water savings that can be achieved by implementing the system. Applications of the RWH system are not only limited to religious institutions. Indeed, many studies have concluded that an RWH system is potentially beneficial in different applications, including domestic [12], commercial [23], and agricultural [13] settings. Despite this, the adoption of an RWH system is limited [49], even in tropical countries which enjoy plentiful rainfall [50].
It needs to be borne in mind that religious places, such as mosques, are highly sensitive places, and the use of harvested rainwater for ablution purposes, as part of religious activities, may face resistance from some quarters. Rather than taking them as impediments, the authorities need to take advantage of the status of such a revered public place and take the leading role in adopting the use of harvested rainwater for such a sacred activity. Indeed, the Quran has referred to rainwater as “purifying water” [51] and rainwater has been used for ablution purposes in the past, although its usage has seen a decline due to the advent of modern water management [52]. On top of its inherent water saving benefit, the adoption of an RWH system in mosques can be used to increase awareness and public acceptance of its usage. Additionally, it would also increase awareness of water conservation by highlighting the importance of economical water usage, even for ablution purposes. The adoption of an RWH system in mosques can be the springboard to wider adoptions of RWH systems in domestic, commercial, and agricultural applications such that rainwater is no longer wasted but rather utilised as part of a more sustainable and environmentally ecosystem.
Mosques, especially main national mosques, are frequently visited places not only by Muslims but also tourists. Indeed, many countries have designed and built grand mosques to attract tourists, in addition to their primary function as places of worship. As such, to improve public perception of rainwater harvesting, the RWH system must properly blend in with its surrounding, with the pond decorated and beautified, such that it will provide additional attraction for the public to enjoy the already serene mosques.
4. Conclusions and Future Works
A rainwater harvesting system has the potential to supply essential water for different applications to society in a sustainable way. We conducted feasibility studies of a rainwater harvesting system for ablution purposes by analysing the quality of harvested rainwater and formulating a rainwater harvesting model with appropriate system performance measures. By considering an open-pond rainwater harvesting system, the proposed model considers rainfall and evaporation, as well as other system specifications for its computation. The effect of evaporation cannot be neglected for an open-pond RWH, especially in hot countries. Although local weather data were used in this paper, the model can also be used to determine feasibility in other localities by merely changing the local meteorological data.
Different rainwater samples, including direct rainfall, harvested rainwater from the rooftop, and harvested water in a pond, were collected to ascertain the quality of the harvested rainwater, particularly for ablution purposes. The results indicated that the harvested rainwater exhibits characteristics that satisfy the standards for potable water, with the exception of pH. Utilising the RWH model and assuming a pond depth of 1.0 m, the reliability of the system is 62.5% (228 days per year), water saving is 345 m3 or 60.7% of demand, RUE is 22.5%, and UoS is 24.4. Increasing the rainwater collection surface area and decreasing the water demand have the potential to increase system performance, with a pond surface area of 60–70 m2 giving the optimum reliability, water saving, and RUE. It can be seen from the study that the implementation of an RWH system for ablution purposes is potentially feasible and beneficial.
In the future, the effect of changes in climate conditions, particularly changes in the frequency and intensity of rainfall, as well as the purported increase in temperature, on the feasibility and implementation aspect of the RWH system shall be analysed. As water quality data were only collected for a 2-week period in this study, this can be extended to cover a longer period of time in order to obtain a more accurate representation, although drastic changes are not expected for an equatorial country with only one season, such as Brunei. Holistic work on the effect of other related sources of water, particularly water from the main distribution system and its sources, would also need to be considered. Collectively, these works would undoubtedly contribute to the provision of sustainable and clean water to all, as intended in one of the objectives of the United Nations Sustainable Development Goals (SDG).
Author Contributions
Conceptualisation, P.E.A.; methodology, P.E.A. and F.W.A.K.; software, F.W.A.K.; validation, P.E.A. and F.A.A.; formal analysis, F.W.A.K., P.E.A., H.S. and N.S.; investigation, F.W.A.K. and P.E.A.; resources, F.W.A.K., P.E.A. and N.S.; data curation, F.W.A.K., F.A.A. and P.E.A.; writing—original draft preparation, F.W.A.K.; writing—review and editing, F.A.A. and P.E.A.; visualisation, F.W.A.K., F.A.A. and P.E.A.; supervision, P.E.A., H.S. and N.S.; project administration, P.E.A.; funding acquisition, P.E.A., H.S. and N.S. All authors have read and agreed to the published version of the manuscript.
Funding
This research was funded by a Faculty Research Grant of Universiti Brunei Darussalam, grant number UBD/RSCH/URC/NIG/3.0/2022/002.
Data Availability Statement
The data presented in this study are available on request from the corresponding author. The data are not publicly available as commercial data were used.
Conflicts of Interest
The authors declare no conflict of interest.
Appendix A
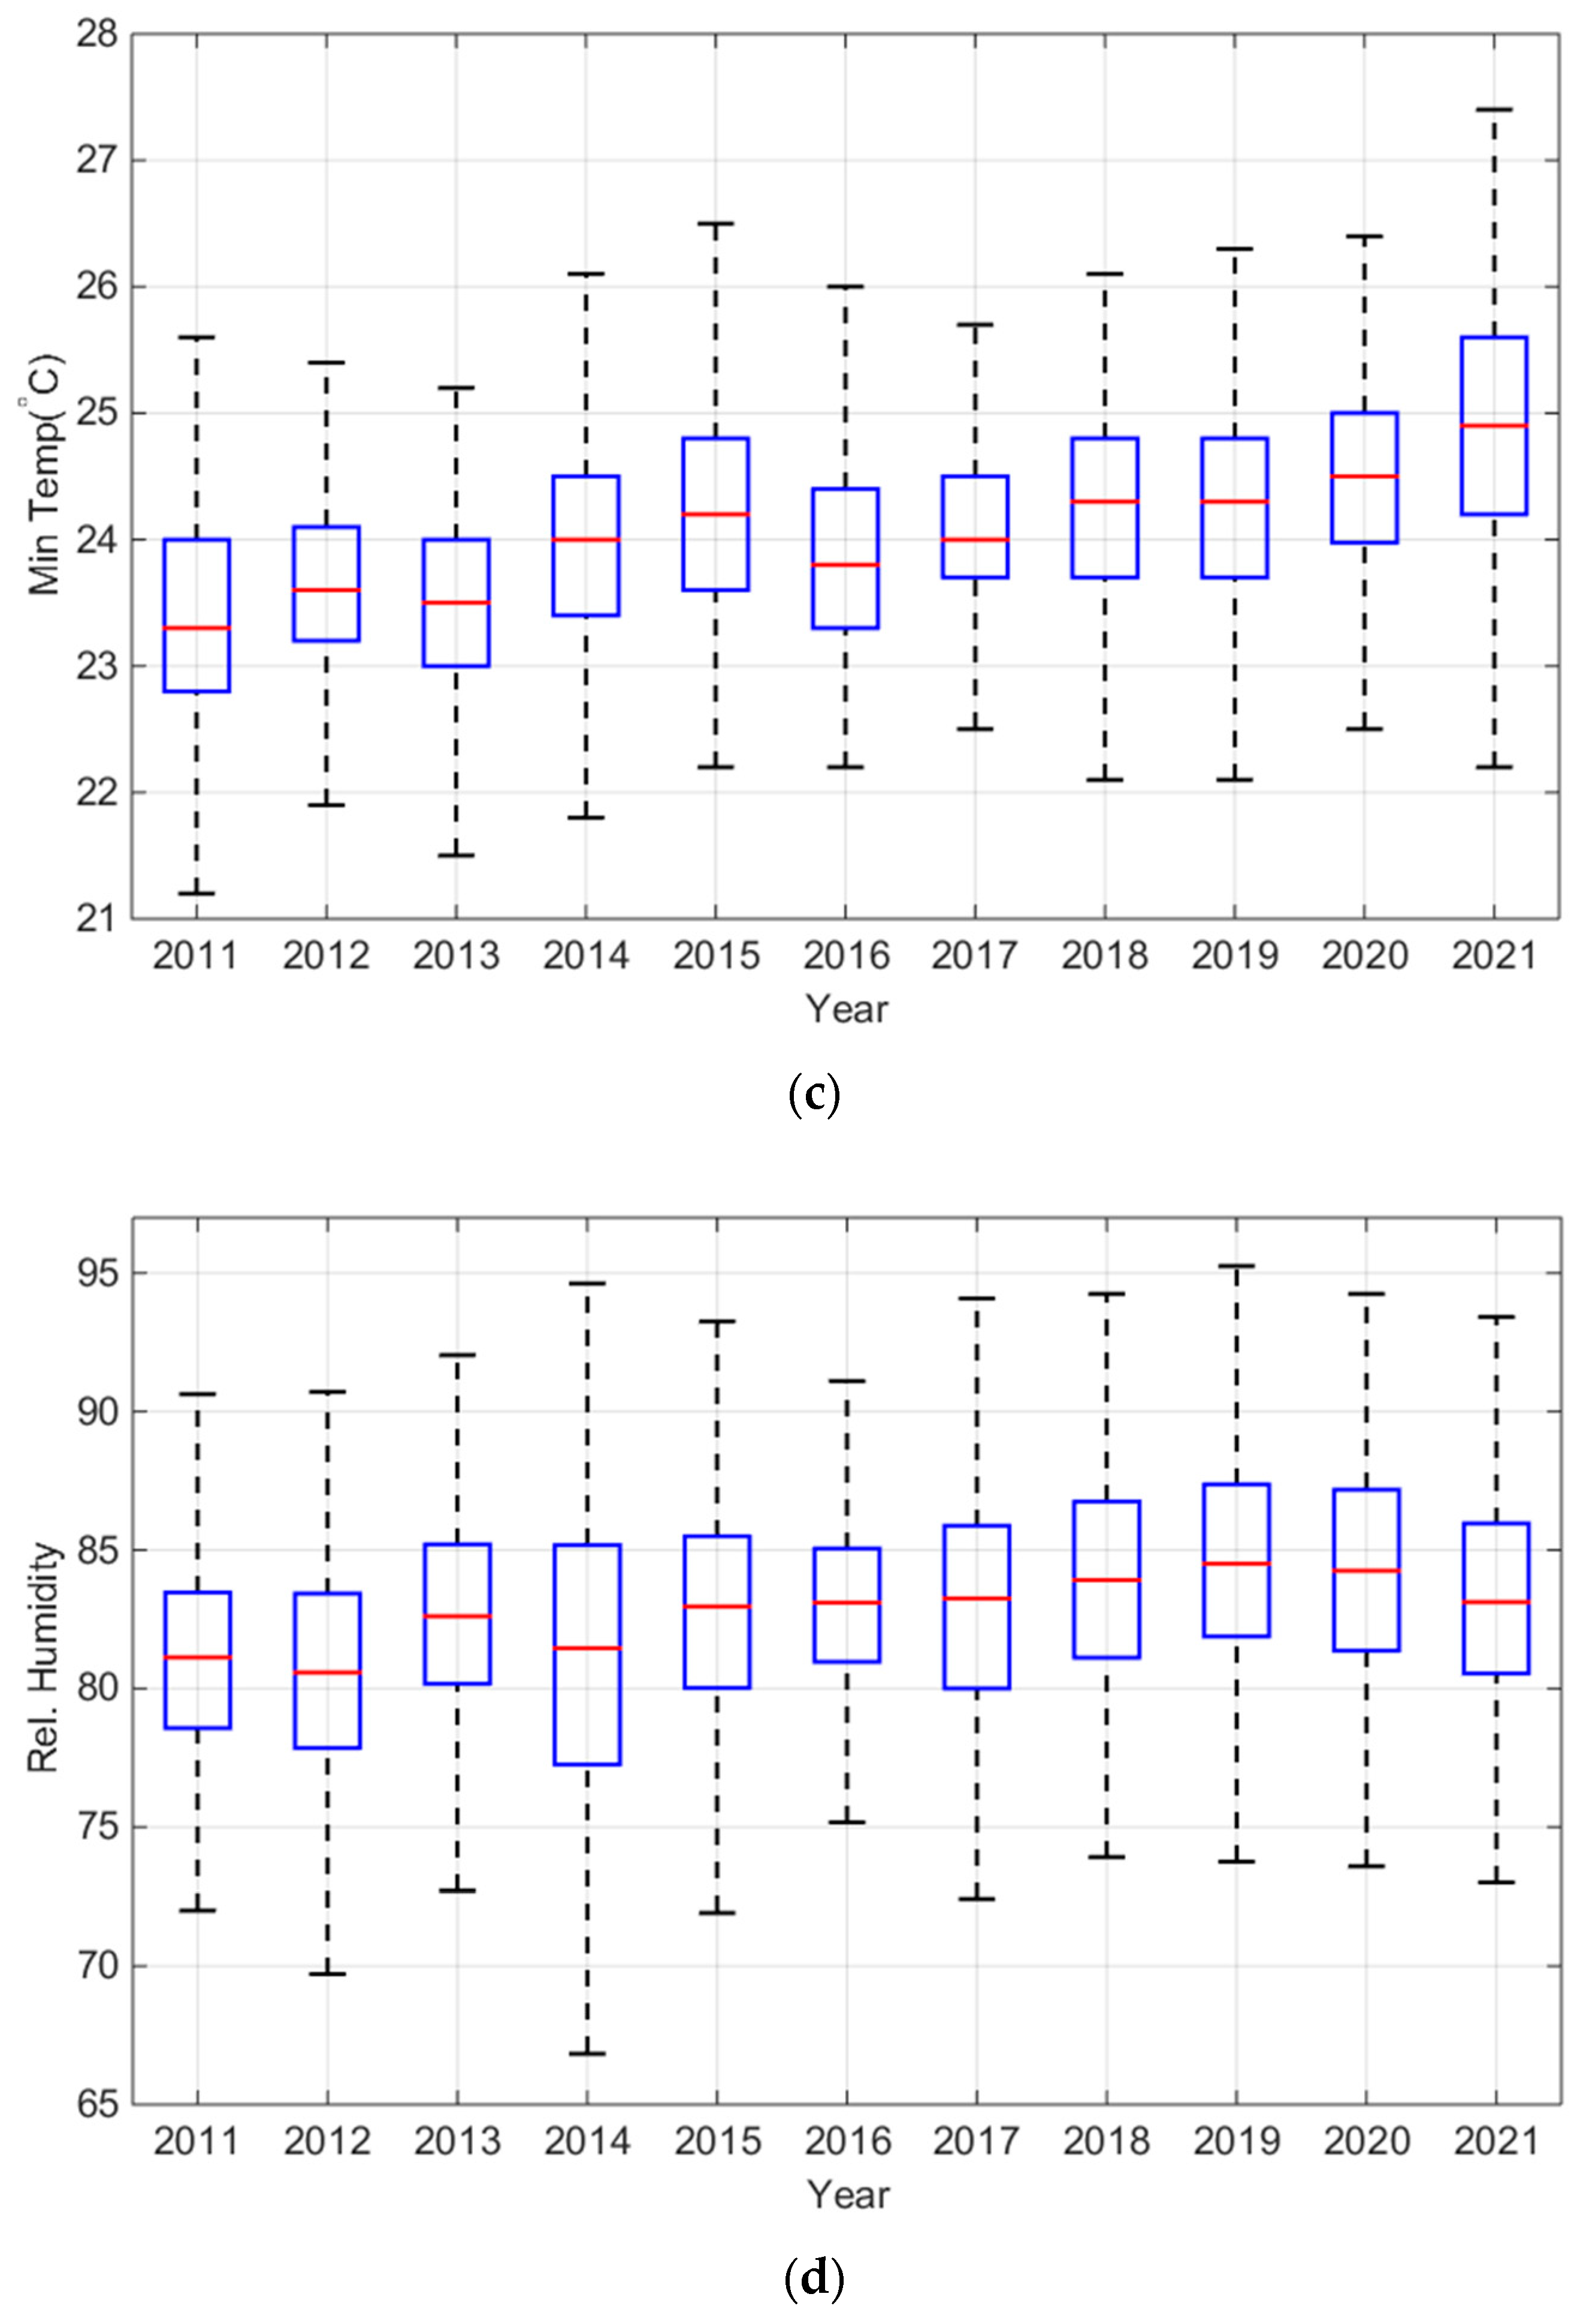
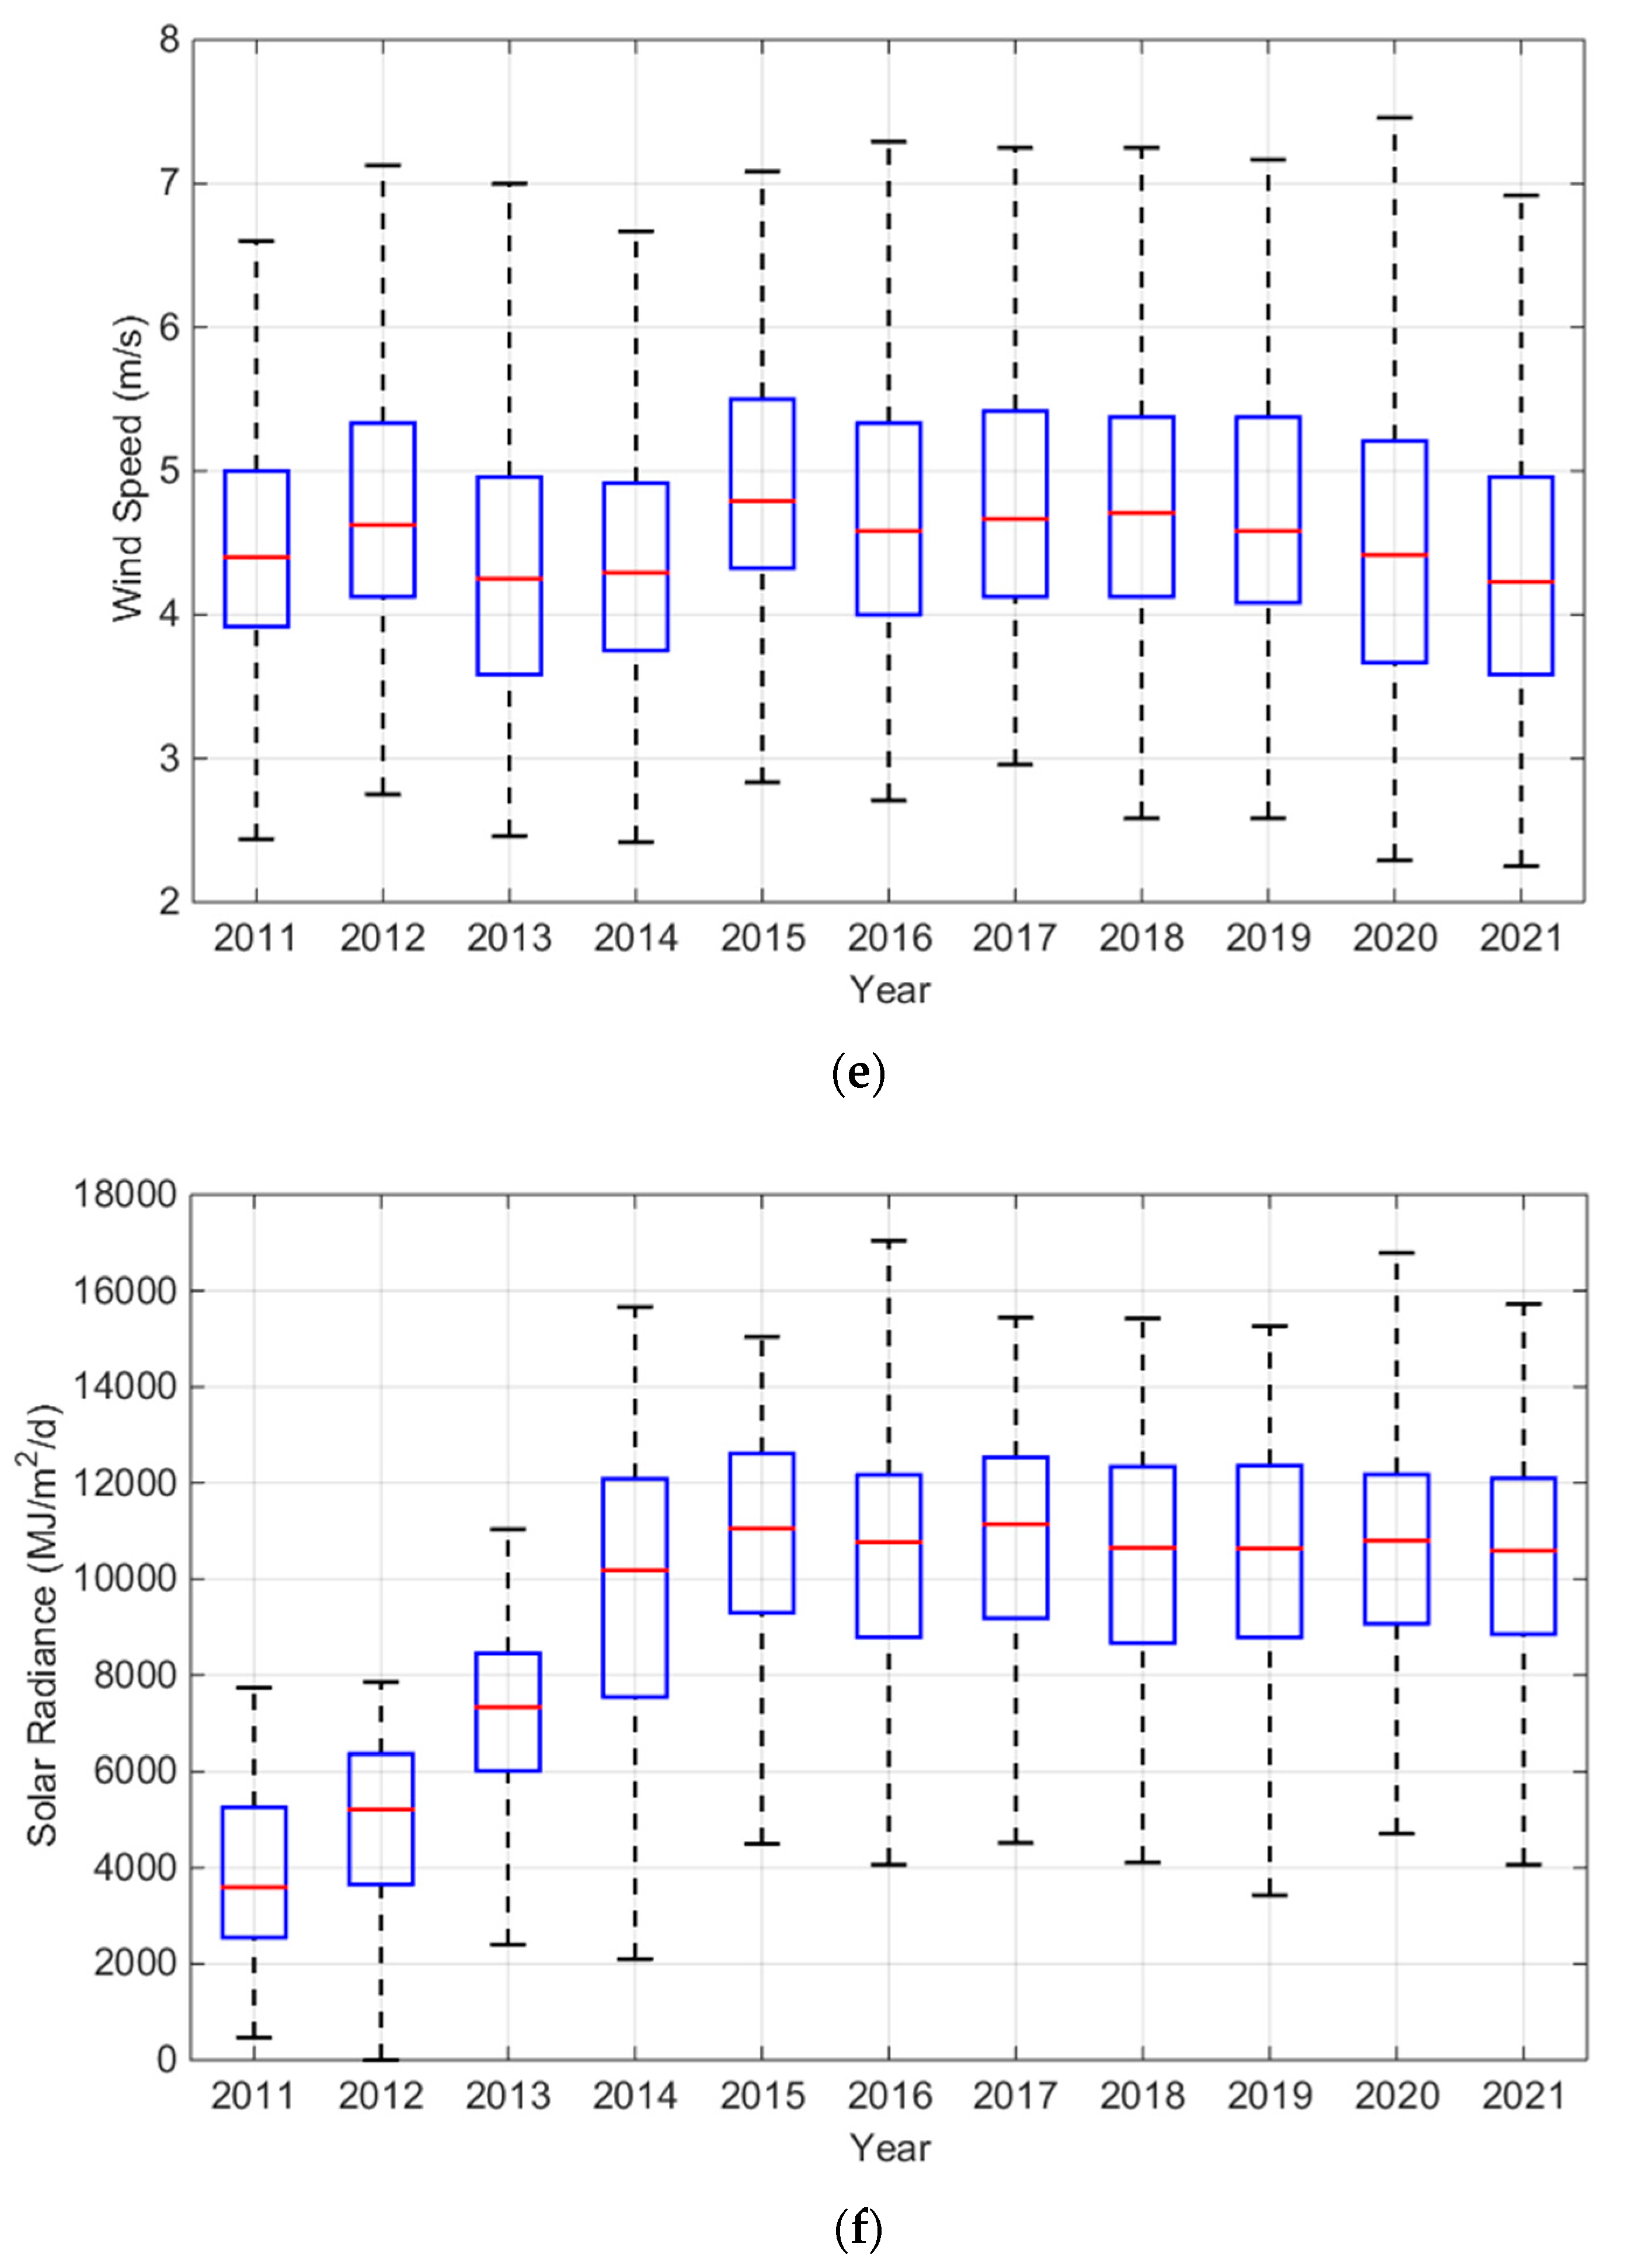
Evaporation from the open pond at time t is estimated by using the Penman evaporation equation [31], considering different meteorological parameters, including minimum and maximum air temperatures, relative humidity, wind speed, and irradiance, as well as elevation of the open pond. Figure A1 provides the statistical data of the meteorological parameters.
Figure A1.
(a) Average daily rainfall, (b) maximum temperature, (c) minimum temperature, (d) relative humidity, (e) wind speed, and (f) solar radiance statistics between 2011 and 2021.
Figure A1.
(a) Average daily rainfall, (b) maximum temperature, (c) minimum temperature, (d) relative humidity, (e) wind speed, and (f) solar radiance statistics between 2011 and 2021.


The Penman evaporation equation is given by
where is the potential evaporation at time t, Δ (kPa/°C) is the slope of saturation vapour pressure curve, γ (kPa/°C) is the psychrometric coefficient, Rn (MJ/m2/day) is net radiation on the surface, and λ (MJ/kg) is the latent heat of vaporisation.
D (kPa) is the vapour pressure deficit between es and ea, where D = es − ea, where es (kPa) is saturation vapour pressure and ea (kPa) is actual vapour pressure. fu is the wind function, which can be estimated using
where au is the wind function coefficient, bu is the wind function coefficient, and u (m/s) is the measured wind speed.
Given that Tav (°C) is the mean air temperature which can be estimated by Tav = (Tmax + Tmin)/2, where Tmax (°C) is the measured maximum air temperature and Tmin (°C) is the measured minimum air temperature, the slope of saturation vapour pressure curve, Δ, can be expressed as
where saturation vapour pressure, es, can be expressed as
Given that P (kPa) is atmospheric pressure and Z (m) is the elevation of the pond, the psychrometric coefficient, γ, can be evaluated as
The latent heat of vaporisation λ can be calculated as
The net radiation on the surface, Rn, is described as
where RnS (MJ/m2/d) and RnL (MJ/m2/d) are the incoming net short-wave radiation and outgoing net long-wave radiation, respectively. The incoming net short-wave radiation RnS can be estimated as
where RS (MJ/m2/d) is the measured incoming solar radiation and α is the reflection coefficient. Since the pond is considered an open water surface, the value of α is 0.08 [31]. The outgoing net long-wave radiation RnL is mathematically defined as
where f is an adjustment for cloud cover, ε′ is the net emissivity between the atmosphere and the ground, and σ = 4.903 × 10⁻⁹ MJ/m2/K4/d is the Stephan–Boltzmann constant. The parameter f is usually estimated using
where RSO and RA (MJ/m2/d) are the clear sky radiation and extraterrestrial solar radiation, respectively, which can be evaluated using
where dr is the relative distance between the Earth and the sun, ωS (radians) is the sunset hour angle in radians, (radians) is the latitude of the RWH system (for Brunei, φ = 4.535277° = 0.0791555 radians), and δ (radians) is the solar declination.
The relative distance between the Earth and the sun dr can be evaluated as
where J is the number of days in the year, which can be found from a meteorological table, with the value of J starting from 1, i.e., 1 January, to 365, i.e., 31 December.
The sunset hour angle, ωs (radians), is expressed as
δ (radians) is the solar declination expressed in the following equation:
Net emissivity between the atmosphere and the ground, ε′, is commonly estimated using
The actual vapour pressure, ea (kPa), is calculated as shown:
where RH is the measured relative humidity.
References
- Mahapatra, S.; Kumar, D.; Singh, B.; Sachan, P.K. Biofuels and their sources of production: A review on cleaner sustainable alternative against conventional fuel, in the framework of the food and energy nexus. Energy Nexus 2021, 4, 100036. [Google Scholar] [CrossRef]
- Stančin, H.; Mikulčić, H.; Wang, X.; Duić, N. A review on alternative fuels in future energy system. Renew. Sustain. Energy Rev. 2020, 128, 109927. [Google Scholar] [CrossRef]
- Mahlia, T.M.I.; Syazmi, Z.; Mofijur, M.; Abas, A.P.; Bilad, M.; Ong, H.C.; Silitonga, S.A. Patent landscape review on biodiesel production: Technology updates. Renew. Sustain. Energy Rev. 2020, 118, 109526. [Google Scholar] [CrossRef]
- Ozcelik, M.; Sarp, G. Evaluation of sustainable water supply alternatives in karstified rock masses using GIS and AHP methodology for Antalya (Turkey) urban area. Environ. Earth Sci. 2018, 77, 696. [Google Scholar] [CrossRef]
- Adapa, S.; Bhullar, N.; de Souza, S.V. A systematic review and agenda for using alternative water sources for consumer markets in Australia. J. Clean. Prod. 2016, 124, 14–20. [Google Scholar] [CrossRef]
- Mahlia, T.M.I.; Lim, J.Y.; Aditya, L.; Riayatsyah, T.M.I.; Abas, A.E.P.; Nasruddin. Methodology for implementing power plant efficiency standards for power generation: Potential emission reduction. Clean Technol. Environ. Policy 2018, 20, 309–327. [Google Scholar] [CrossRef]
- Abas, A.E.P.; Mahlia, T.M.I. Development of energy labels based on consumer perspective: Room air conditioners as a case study in Brunei Darussalam. Energy Rep. 2018, 4, 671–681. [Google Scholar] [CrossRef]
- Berbel, J.; Gutierrez-Marín, C.; Expósito, A. Microeconomic analysis of irrigation efficiency improvement in water use and water consumption. Agric. Water Manag. 2018, 203, 423–429. [Google Scholar] [CrossRef]
- Mahlia, T.M.I.; Syaheed, H.; Abas, A.E.P.; Kusumo, F.; Shamsuddin, A.H.; Ong, H.C.; Bilad, M.R. Organic rankine cycle (ORC) system applications for solar energy: Recent technological advances. Energies 2019, 12, 2930. [Google Scholar] [CrossRef]
- Ahmad, A.; Othman, H.M. Electricity consumption in Brunei Darussalam: Challenges in energy conservation. Int. Energy J. 2014, 14, 155–166. [Google Scholar]
- Malik, A.Q. Assessment of the potential of renewables for Brunei Darussalam. Renew. Sustain. Energy Rev. 2011, 15, 427–437. [Google Scholar] [CrossRef]
- Abas, P.E.; Mahlia, T.M.I. Techno-economic and sensitivity analysis of rainwater harvesting system as alternative water source. Sustainability 2019, 11, 2365. [Google Scholar] [CrossRef]
- Wen, L.Z.; Suhaimi, H.; Abas, P.E. Techno-economic feasibility of rainwater harvesting system for vertical aquaponics in Brunei Darussalam. AIP Conf. Proc. 2022, 2676, 30001. [Google Scholar]
- Gurung, T.R.; Sharma, A. Communal rainwater tank systems design and economies of scale. J. Clean. Prod. 2014, 67, 26–36. [Google Scholar] [CrossRef]
- Campisano, A.; Butler, D.; Ward, S.; Burns, M.; Friedler, E.; DeBusk, K.; Fisher-Jeffes, L.; Ghisi, E.; Rahman, A.; Furumai, H.; et al. Urban rainwater harvesting systems: Research, implementation and future perspectives. Water Res. 2017, 115, 195–209. [Google Scholar] [CrossRef] [PubMed]
- Alim, M.A.; Rahman, A.; Tao, Z.; Samali, B.; Khan, M.M.; Shirin, S. Suitability of roof harvested rainwater for potential potable water production: A scoping review. J. Clean. Prod. 2020, 248, 119226. [Google Scholar] [CrossRef]
- Yang, Y.; Kim, H.; Starikovskiy, A.; Cho, Y.; Fridman, A. Mechanism of calcium ion precipitation from hard water using pulsed spark discharges. Plasma Chem. Plasma Process. 2011, 31, 51–66. [Google Scholar] [CrossRef]
- Yannopoulos, S.; Giannopoulou, I.; Kaiafa-Saropoulou, M. Investigation of the current situation and prospects for the development of rainwater harvesting as a tool to confront water scarcity worldwide. Water 2019, 11, 2168. [Google Scholar] [CrossRef]
- Gómez, Y.D.; Teixeira, L.G. Residential rainwater harvesting: Effects of incentive policies and water consumption over economic feasibility. Resour. Conserv. Recycl. 2017, 127, 56–67. [Google Scholar] [CrossRef]
- Ortiz, S.; de Barros Barreto, P.; Castier, M. Rainwater harvesting for domestic applications: The case of Asunción, Paraguay. Results Eng. 2022, 16, 100638. [Google Scholar] [CrossRef]
- Amos, C.C.; Rahman, A.; Karim, F.; Gathenya, J.M. A scoping review of roof harvested rainwater usage in urban agriculture: Australia and Kenya in focus. J. Clean. Prod. 2018, 202, 174–190. [Google Scholar] [CrossRef]
- Nandi, S.; Gonela, V. Rainwater harvesting for domestic use: A systematic review and outlook from the utility policy and management perspectives. Util. Policy 2022, 77, 101383. [Google Scholar] [CrossRef]
- Lani, N.H.M.; Syafiuddin, A.; Yusop, Z.; Adam, U.; Amin, M.Z.M. Performance of small and large scales rainwater harvesting systems in commercial buildings under different reliability and future water tariff scenarios. Sci. Total Environ. 2018, 636, 1171–1179. [Google Scholar] [CrossRef]
- Terêncio, D.P.S.; Fernandes, L.F.S.; Cortes, R.M.; Moura, J.P.; Pacheco, F.A.L. Rainwater harvesting in catchments for agro-forestry uses: A study focused on the balance between sustainability values and storage capacity. Sci. Total Environ. 2018, 613–614, 1079–1092. [Google Scholar] [CrossRef] [PubMed]
- Susilo, G. Rainwater Harvesting as Alternative Source for Wudlu Water in Indonesia. Civ. Environ. Sci. 2018, 1, 62–69. [Google Scholar] [CrossRef]
- Al Mamun, A.; Muyibi, S.A.; Razak, N.A.B.A. Treatment of used ablution water from IIUM Masjid for reuse. Adv. Environ. Biol. 2014, 8, 558–564. [Google Scholar]
- Rahman, A. Recent Advances in Modelling and Implementation of Rainwater Harvesting Systems towards Sustainable Development. Water 2017, 9, 959. [Google Scholar] [CrossRef]
- Eroksuz, E.; Rahman, A. Rainwater tanks in multi-unit buildings: A case study for three Australian cities. Resour. Conserv. Recycl. 2010, 54, 1449–1452. [Google Scholar] [CrossRef]
- Ali, S.; Sang, Y.F. Implementing rainwater harvesting systems as a novel approach for saving water and energy in flat urban areas. Sustain. Cities Soc. 2023, 89, 104304. [Google Scholar] [CrossRef]
- Semaan, M.; Day, S.D.; Garvin, M.; Ramakrishnan, N.; Pearce, A. Optimal sizing of rainwater harvesting systems for domestic water usages: A systematic literature review. In Resources, Conservation and Recycling: X; Elsevier: Amsterdam, The Netherlands, 2020; Volume 6. [Google Scholar]
- Valiantzas, J.D. Simplified versions for the Penman evaporation equation using routine weather data. J. Hydrol. 2006, 331, 690–702. [Google Scholar] [CrossRef]
- Mcmahon, T.; Peel, M.; Lowe, L.; Srikanthan, R.; McVicar, T. Estimating actual, potential, reference crop and pan evaporation using standard meteorological data: A pragmatic synthesis. Hydrol. Earth Syst. Sci. 2013, 17, 1331. [Google Scholar] [CrossRef]
- Sánchez, A.S.; Cohim, E.; Kalid, R.A. A review on physicochemical and microbiological contamination of roof-harvested rainwater in urban areas. In Sustainability of Water Quality and Ecology; Elsevier: Amsterdam, The Netherlands, 2015; Volume 6, pp. 119–137. [Google Scholar]
- Hong, W.J.; Shamsuddin, N.; Abas, E.; Apong, R.A.; Masri, Z.; Suhaimi, H.; Gödeke, S.H.; Noh, M.N.A. Water Quality Monitoring with Arduino Based Sensors. Environments 2021, 8, 6. [Google Scholar] [CrossRef]
- Zhuiykov, S. (Ed.) 8—Semiconductor nanocrystals in environmental sensors. In Nanostructured Semiconductor Oxides for the Next Generation of Electronics and Functional Devices: Properties and Applications; Woodhead Publishing: Sawston, UK, 2014; pp. 374–426. [Google Scholar]
- Likens, G.; Butler, T. Acid Rain: Causes, Consequences, and Recovery in Terrestrial, Aquatic, and Human Systems. In Encyclopedia of the Anthropocene; Elsevier Ltd.: Amsterdam, The Netherlands, 2018; pp. 23–31. [Google Scholar]
- Mann, A.G.; Tam, C.C.; Higgins, C.D.; Rodrigues, L.C. The association between drinking water turbidity and gastrointestinal illness: A systematic review. BMC Public Health 2007, 7, 256. [Google Scholar] [CrossRef]
- Meride, Y.; Ayenew, B. Drinking water quality assessment and its effects on residents health in Wondo genet campus, Ethiopia. Environ. Syst. Res. 2016, 5, 1. [Google Scholar] [CrossRef]
- World Health Organisation. Guidelines for Drinking-Water Quality; WHO: Geneva, Switzerland, 2011.
- Washington State Department of Ecology. Dissolved Oxygen and the Water Quality Standards; Washington State Department of Ecology: Washington, DC, USA, 2002.
- Kumar, M.D. Roof Water Harvesting for Domestic Water Security: Who Gains and Who Loses? Water Int. 2004, 29, 43–53. [Google Scholar] [CrossRef]
- Rahman, A.; Keane, J.; Imteaz, M.A. Rainwater harvesting in Greater Sydney: Water savings, reliability and economic benefits. Resour. Conserv. Recycl. 2012, 61, 16–21. [Google Scholar] [CrossRef]
- Zaied, R.A. Water use and time analysis in ablution from taps. Appl. Water Sci. 2017, 7, 2329–2336. [Google Scholar] [CrossRef]
- Radojevic, M.; Lim, L.H. A Rain Acidity Study in Brunei Darussalam. Water Air Soil Pollut. 1995, 85, 2369–2374. [Google Scholar] [CrossRef]
- Mao, J.; Xia, B.; Zhou, Y.; Bi, F.; Zhang, X.; Zhang, W.; Xia, S. Effect of roof materials and weather patterns on the quality of harvested rainwater in Shanghai, China. J. Clean. Prod. 2021, 279, 123419. [Google Scholar] [CrossRef]
- Taylor, M.; Elliott, H.A.; Navitsky, L.O. Relationship between total dissolved solids and electrical conductivity in Marcellus hydraulic fracturing fluids. Water Sci. Technol. 2018, 77, 1998–2004. [Google Scholar] [CrossRef]
- Yehia, H.M.A.-S.; Said, S.M. Drinking Water Treatment: pH Adjustment Using Natural Physical Field. J. Biosci. Med. 2021, 9, 55–66. [Google Scholar] [CrossRef]
- Alim, M.A.; Ashraf, A.F.M.A.; Rahman, A.; Tao, Z.; Roy, R.; Khan, M.; Shirin, S. Experimental investigation of an integrated rainwater harvesting unit for drinking water production at the household level. J. Water Process. Eng. 2021, 44, 102318. [Google Scholar] [CrossRef]
- Huang, Z.; Nya, E.L.; Rahman, M.A.; Mwamila, T.B.; Cao, V.; Gwenzi, W.; Noubactep, C. Integrated Water Resource Management: Rethinking the Contribution of Rainwater Harvesting. Sustainability 2021, 13, 8338. [Google Scholar] [CrossRef]
- Hafizi Md Lani, N.; Yusop, Z.; Syafiuddin, A. A review of rainwater harvesting in Malaysia: Prospects and challenges. Water 2018, 10, 506. [Google Scholar] [CrossRef]
- Saheeh International, Quran, 25:48; Dar Abul Qasim: Jeddah, Saudi Arabia, 2013.
- Mithen, S. The domestication of water: Water management in the ancient world and its prehistoric origins in the Jordan Valley. Philos. Trans. Math. Phys. Eng. Sci. 2010, 368, 5249–5274. [Google Scholar] [CrossRef]
Figure 1.
Flowchart of the rainwater harvesting (RWH) model.

Figure 2.
Frequency distribution of pH of the water samples for Experiments (a) 1, (b) 2, and (c) 3.
Figure 2.
Frequency distribution of pH of the water samples for Experiments (a) 1, (b) 2, and (c) 3.

Figure 3.
Rainfall data statistics between 2011 and 2021.

Figure 4.
Reliability chart for RWH with 5 operating years.

Figure 5.
Water saving efficiency chart for RWH with 5 operating years.

Figure 6.
Percentage water saving chart for RWH with 5 operating years.

Figure 7.
Rainwater use efficiency chart for RWH with 5 operating years.

Figure 8.
Utilisation of system chart for RWH with 5 operating years.

Figure 9.
(a) Reliability, % water saving, and rainwater utilisation efficiency and (b) water saving and utilisation of system, against the surface area of the RWH pond.
Figure 9.
(a) Reliability, % water saving, and rainwater utilisation efficiency and (b) water saving and utilisation of system, against the surface area of the RWH pond.


Figure 10.
(a) Reliability, % water saving, and rainwater utilisation efficiency and (b) water saving and utilisation of system against the surface area of the catchment area.
Figure 10.
(a) Reliability, % water saving, and rainwater utilisation efficiency and (b) water saving and utilisation of system against the surface area of the catchment area.


Figure 11.
(a) Reliability, % water saving, and rainwater utilisation efficiency and (b) water saving and utilisation of system against water demand per ablution.
Figure 11.
(a) Reliability, % water saving, and rainwater utilisation efficiency and (b) water saving and utilisation of system against water demand per ablution.


| Water Parameters | Limits |
|---|---|
| pH | 6.5–8.5 |
| Electrical Conductivity (EC) | ≤ |
| Total Dissolved Solids (TDS) | ≤ |
| Turbidity | ≤ |
| Dissolved Oxygen (DO) | ≤ |
Table 2.
Summary of the readings from the collected water samples.
| Exp. No. | Parameter | Min. | Max. | Average | S.D. |
|---|---|---|---|---|---|
| Expt. 1 | Temp1 (°C) 1 | 28 | 28.6 | 28.4 | 0.139 |
| Temp2 (°C) 2 | 24.3 | 25.6 | 22.9 | 0.691 | |
| pH | 5.00 | 6.40 | 5.91 | 0.320 | |
| TDS (ppm) | 3.92 | 35.6 | 12.4 | 7.36 | |
| EC (µS/cm) | 7.84 | 71.2 | 24.7 | 14.7 | |
| Turbidity (NTU) | 0.150 | 1.10 | 0.423 | 0.222 | |
| DO (ppm) | 3.95 | 5.21 | 4.51 | 0.43 | |
| Expt. 2 | Temp1 (°C) 1 | 28.4 | 28.4 | 28.4 | 0 |
| Temp2 (°C) 2 | 23.0 | 25.6 | 24.4 | 0.723 | |
| pH | 5.52 | 6.46 | 5.99 | 0.240 | |
| TDS (ppm) | 2.19 | 14.42 | 6.79 | 4.70 | |
| EC (µS/cm) | 4.38 | 28.84 | 13.58 | 9.40 | |
| Turbidity (NTU) | 0.15 | 1.02 | 0.377 | 0.211 | |
| DO (ppm) | 3.92 | 5.27 | 4.66 | 0.33 | |
| Expt. 3 | Temp1 (°C) 1 | 27.8 | 28.6 | 28.3 | 0.197 |
| Temp2 (°C) 2 | 22.8 | 25.3 | 24.2 | 0.796 | |
| pH | 4.11 | 6.03 | 5.07 | 0.616 | |
| TDS (ppm) | 116.3 | 207 | 148.27 | 29.04 | |
| EC (µS/cm) | 232.6 | 414 | 296.55 | 57.95 | |
| Turbidity (NTU) | 0.21 | 1.19 | 0.61 | 0.37 | |
| DO (ppm) | 4.07 | 5.23 | 4.68 | 0.34 |
Notes: 1 Temp1—temperature of the water sample upon collection. 2 Temp2—temperature of the water sample before analysis in the laboratory.
Table 3.
Correlations and p-values between different parameters for (a) Experiment 1, (b) Experiment 2, and (c) Experiment 3, with p-values given in brackets.
Table 3.
Correlations and p-values between different parameters for (a) Experiment 1, (b) Experiment 2, and (c) Experiment 3, with p-values given in brackets.
| (a) | |||||||
| Temp1 1 | Temp2 2 | pH | TDS | EC | Turb. | DO | |
| Temp1 1 | 1.00 (1.00) | ||||||
| Temp2 2 | −0.18 (0.39) | 1.00 (1.00) | |||||
| pH | −0.13 (0.52) | −0.17 (0.39) | 1.00 (1.00) | ||||
| TDS | 0.01 (0.95) | −0.11 (0.61) | 0.15 (0.45) | 1.00 (1.00) | |||
| EC | 0.01 (0.95) | −0.11 (0.60) | 0.15 (0.45) | 1.00 (0.00) | 1.00 (1.00) | ||
| Turb. | 0.13 (0.54) | −0.62 (0.00) | 0.49 (0.01) | 0.55 (0.00) | 0.55 (0.00) | 1.00 (1.00) | |
| DO | −0.20 (0.33) | 0.33 (0.10) | −0.27 (0.18) | −0.34 (0.09) | −0.34 (0.09) | −0.41 (0.04) | 1.00 (1.00) |
| (b) | |||||||
| Temp1 1 | Temp2 2 | pH | TDS | EC | Turb. | DO | |
| Temp1 1 | 1.00 (1.00) | ||||||
| Temp2 2 | −0.00 (1.00) | 1.00 (1.00) | |||||
| pH | −0.00 (1.00) | −0.20 (0.30) | 1.00 (1.00) | ||||
| TDS | 0.00 (1.00) | −0.35 (0.06) | 0.19 (0.34) | 1.00 (1.00) | |||
| EC | −0.00 (1.00) | −0.35 (0.06) | 0.19 (0.34) | 1.00 (0.00) | 1.00 (1.00) | ||
| Turb. | 0.00 (1.00) | −0.57 (0.00) | 0.39 (0.04) | 0.76 (0.00) | 0.76 (0.00) | 1.00 (1.00) | |
| DO | −0.00 (1.00) | 0.55 (0.00) | −0.07 (0.71) | −0.34 (0.08) | −0.34 (0.08) | −0.34 (0.08) | 1.00 (1.00) |
| (c) | |||||||
| Temp1 1 | Temp2 2 | pH | TDS | EC | Turb. | DO | |
| Temp1 1 | 1.00 (1.00) | ||||||
| Temp2 2 | −0.55 (0.03) | 1.00 (1.00) | |||||
| pH | −0.03 (0.92) | −0.39 (0.15) | 1.00 (1.00) | ||||
| TDS | 0.03 (0.92) | 0.16 (0.56) | −0.82 (0.00) | 1.00 (1.00) | |||
| EC | 0.03 (0.91) | 0.16 (0.57) | −0.83 (0.00) | 1.00 (0.00) | 1.00 (1.00) | ||
| Turb. | −0.31 (0.45) | −0.28 (0.31) | 0.90 (0.00) | −0.72 (0.00) | −0.73 (0.00) | 1.00 (1.00) | |
| DO | −0.45 (0.09) | 0.32 (0.24) | −0.21 (0.45) | 0.51 (0.05) | 0.51 (0.05) | −0.15 (0.60) | 1.00 (1.00) |
Notes: 1 Temp1—temperature of the water sample upon collection. 2 Temp2—temperature of the water sample before analysis in the laboratory. Bolded and underlined value—strong and significant correlation. Underlined value—moderately strong and significant correlation.
Table 4.
System specifications and assumptions of the rainwater harvesting (RWH) system.
| RWH Specifications | Amount |
| Depth of the open pond, (m) | 0.5/1/2 |
| Surface area of the pond, (m2) | 50 |
| Area of roof utilised for the RWH system, (m2) | 2000 |
| Roof runoff coefficient, | 0.9 |
| Water Consumptions | Amount |
| Maximum capacity of worshippers in Jame’ Asr Mosque (pax) | 5000 |
| Expected number of worshippers in Jame’ Asr Mosque for every Muslim prayer time (pax) | 100 |
| Expected number of worshippers in Jame’ Asr Mosque for Friday prayers (pax) | 4000 |
| Expected number of worshippers in Jame’ Asr Mosque for every Muslim prayer time during Ramadan (pax) | 200 |
| Assumed amount of water required for ablution per pax (L) | 5 |
| Total daily water required for ablution at Jame’ Asr Mosque, (m3) | 2.5 |
| Total daily water required for ablution at Jame’ Asr Mosque (Friday), (m3) | 22 |
Table 5.
Statistical information on the meteorological data between 2011 and 2021.
| Parameters | 2011 | 2012 | 2013 | 2014 | 2015 | 2016 | 2017 | 2018 | 2019 | 2020 | 2021 | 2012–2016 | 2017–2021 | |
|---|---|---|---|---|---|---|---|---|---|---|---|---|---|---|
| Tot. daily Rainfall (mm) | Mean | 8.21 | 9.63 | 10.9 | 8.66 | 12.2 | 9.21 | 8.53 | 8.62 | 8.69 | 8.26 | 5.96 | 10.1 | 8.01 |
| S.D. | 16.2 | 17.7 | 23.7 | 19.1 | 22.5 | 19.3 | 16.3 | 18.0 | 18.0 | 17.2 | 14.0 | 20.6 | 16.8 | |
| Max. daily Temp. (°C) | Mean | 32.2 | 32.1 | 32.0 | 32.6 | 32.4 | 32.1 | 32.3 | 31.9 | 31.5 | 32.0 | 32.5 | 32.2 | 32.0 |
| S.D. | 1.20 | 1.37 | 1.27 | 1.67 | 1.17 | 1.36 | 1.16 | 1.23 | 1.68 | 1.37 | 1.34 | 1.40 | 1.40 | |
| Min. daily Temp. (°C) | Mean | 23.4 | 2.36 | 23.5 | 23.9 | 24.2 | 23.8 | 24.1 | 24.2 | 24.2 | 24.5 | 25.0 | 23.8 | 24.4 |
| S.D. | 0.850 | 0.777 | 0.774 | 0.861 | 0.850 | 0.744 | 0.729 | 0.773 | 0.865 | 0.848 | 0.966 | 0.844 | 0.891 | |
| Rel. Humidity (%) | Mean | 81.1 | 80.7 | 82.6 | 81.4 | 82.8 | 82.8 | 82.8 | 83.8 | 84.6 | 84.2 | 83.2 | 82.1 | 83.7 |
| S.D. | 4.11 | 4.11 | 4.14 | 5.48 | 3.95 | 9.18 | 4.70 | 4.10 | 4.33 | 4.35 | 4.13 | 4.32 | 4.37 | |
| Wind Speed (mm/s) | Mean | 4.48 | 4.85 | 4.46 | 4.46 | 5.04 | 4.73 | 4.85 | 4.88 | 4.76 | 4.62 | 4.63 | 4.71 | 4.75 |
| S.D. | 0.866 | 1.09 | 1.23 | 1.04 | 1.10 | 1.06 | 1.06 | 1.15 | 1.02 | 1.31 | 1.79 | 1.13 | 1.30 | |
| Solar Radiance (×103 MJ/m2/d) | Mean | 3.97 | 4.91 | 7.63 | 9.85 | 10.8 | 10.8 | 11.0 | 10.6 | 10.5 | 10.5 | 10.5 | 8.80 | 10.6 |
| S.D. | 1.84 | 1.96 | 8.09 | 2.93 | 2.43 | 5.84 | 3.20 | 3.44 | 3.04 | 2.57 | 3.20 | 5.35 | 3.11 | |
Disclaimer/Publisher’s Note: The statements, opinions and data contained in all publications are solely those of the individual author(s) and contributor(s) and not of MDPI and/or the editor(s). MDPI and/or the editor(s) disclaim responsibility for any injury to people or property resulting from any ideas, methods, instructions or products referred to in the content. |
© 2023 by the authors. Licensee MDPI, Basel, Switzerland. This article is an open access article distributed under the terms and conditions of the Creative Commons Attribution (CC BY) license (https://creativecommons.org/licenses/by/4.0/).
Share and Cite
MDPI and ACS Style
Kapli, F.W.A.; Azis, F.A.; Suhaimi, H.; Shamsuddin, N.; Abas, P.E. Feasibility Studies of Rainwater Harvesting System for Ablution Purposes. Water 2023, 15, 1686. https://doi.org/10.3390/w15091686
AMA Style
Kapli FWA, Azis FA, Suhaimi H, Shamsuddin N, Abas PE. Feasibility Studies of Rainwater Harvesting System for Ablution Purposes. Water. 2023; 15(9):1686. https://doi.org/10.3390/w15091686
Chicago/Turabian StyleKapli, Fadhlul Wafi Awg, Fatin Amanina Azis, Hazwani Suhaimi, Norazanita Shamsuddin, and Pg Emeroylariffion Abas. 2023. "Feasibility Studies of Rainwater Harvesting System for Ablution Purposes" Water 15, no. 9: 1686. https://doi.org/10.3390/w15091686
Note that from the first issue of 2016, this journal uses article numbers instead of page numbers. See further details here.