
Impregnation of Modified Magnetic Nanoparticles on Low-Cost Agro-Waste-Derived Biochar for Enhanced Removal of Pharmaceutically Active Compounds: Performance Evaluation and Optimization Using Response Surface Methodology

 ,
,  , , , ,
  , and
, and
Abstract
:
1. Introduction
2. Materials and Methods
2.1. Materials
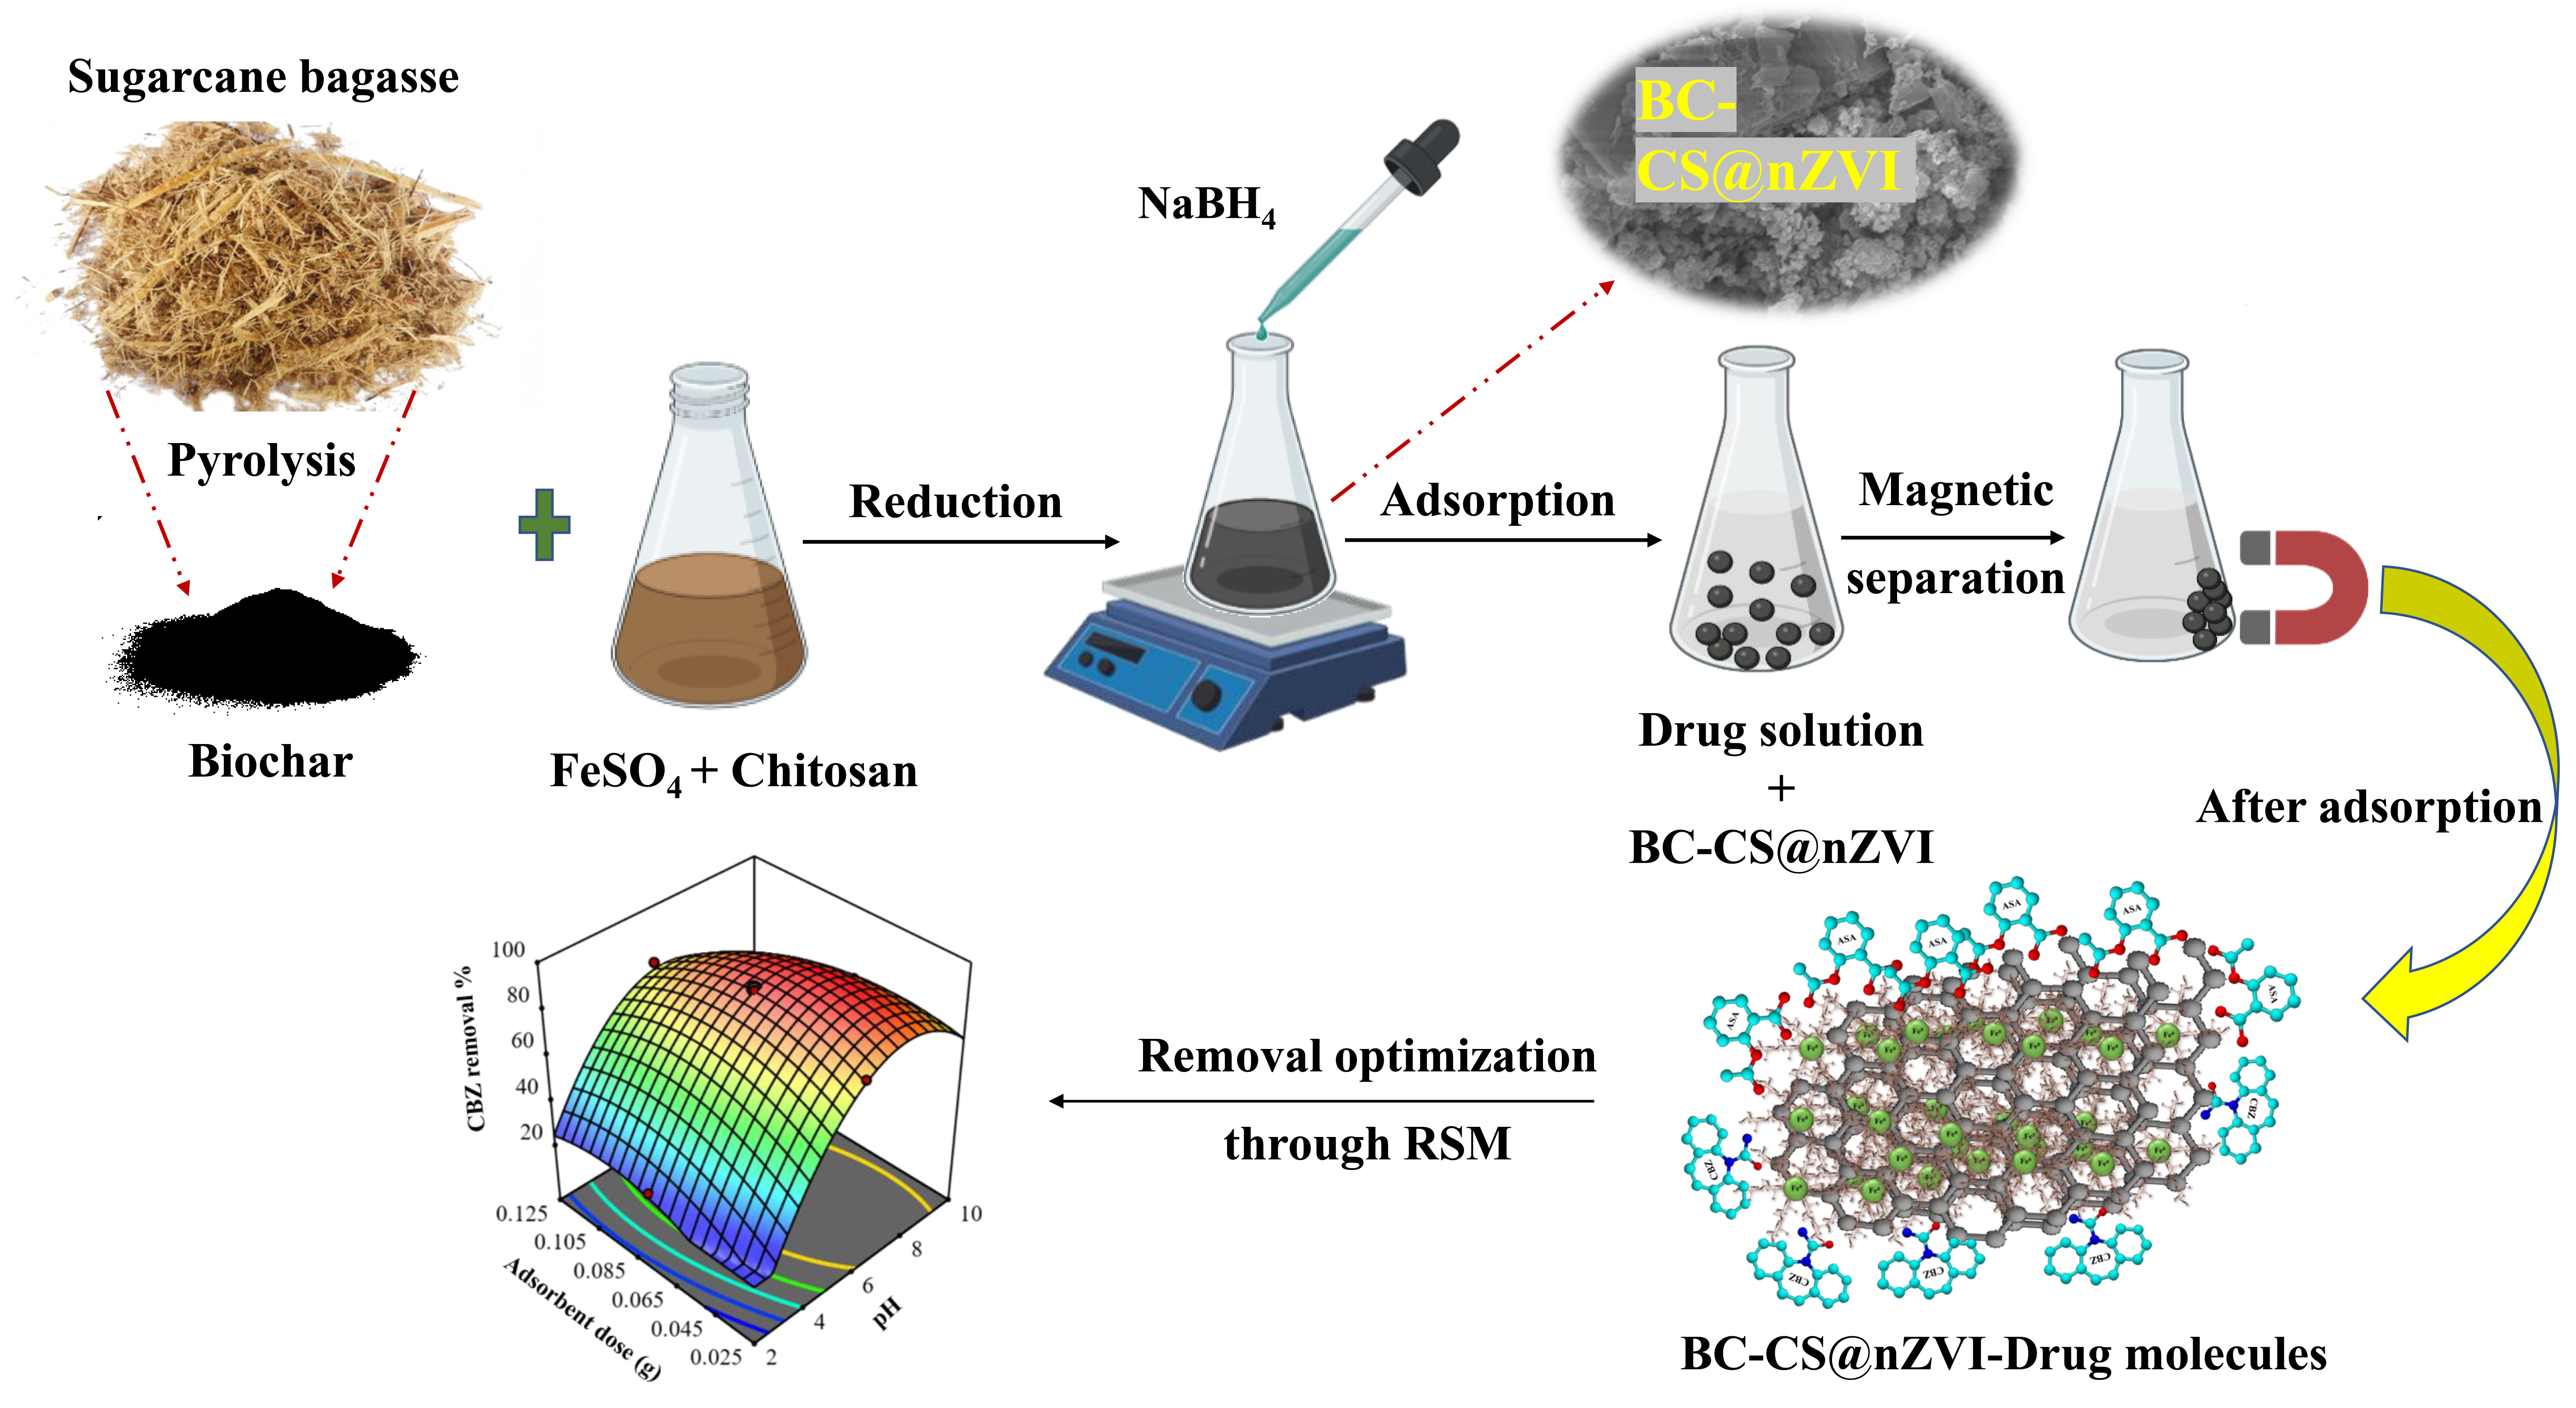
2.2. Synthesis of BC-CS@nZVI
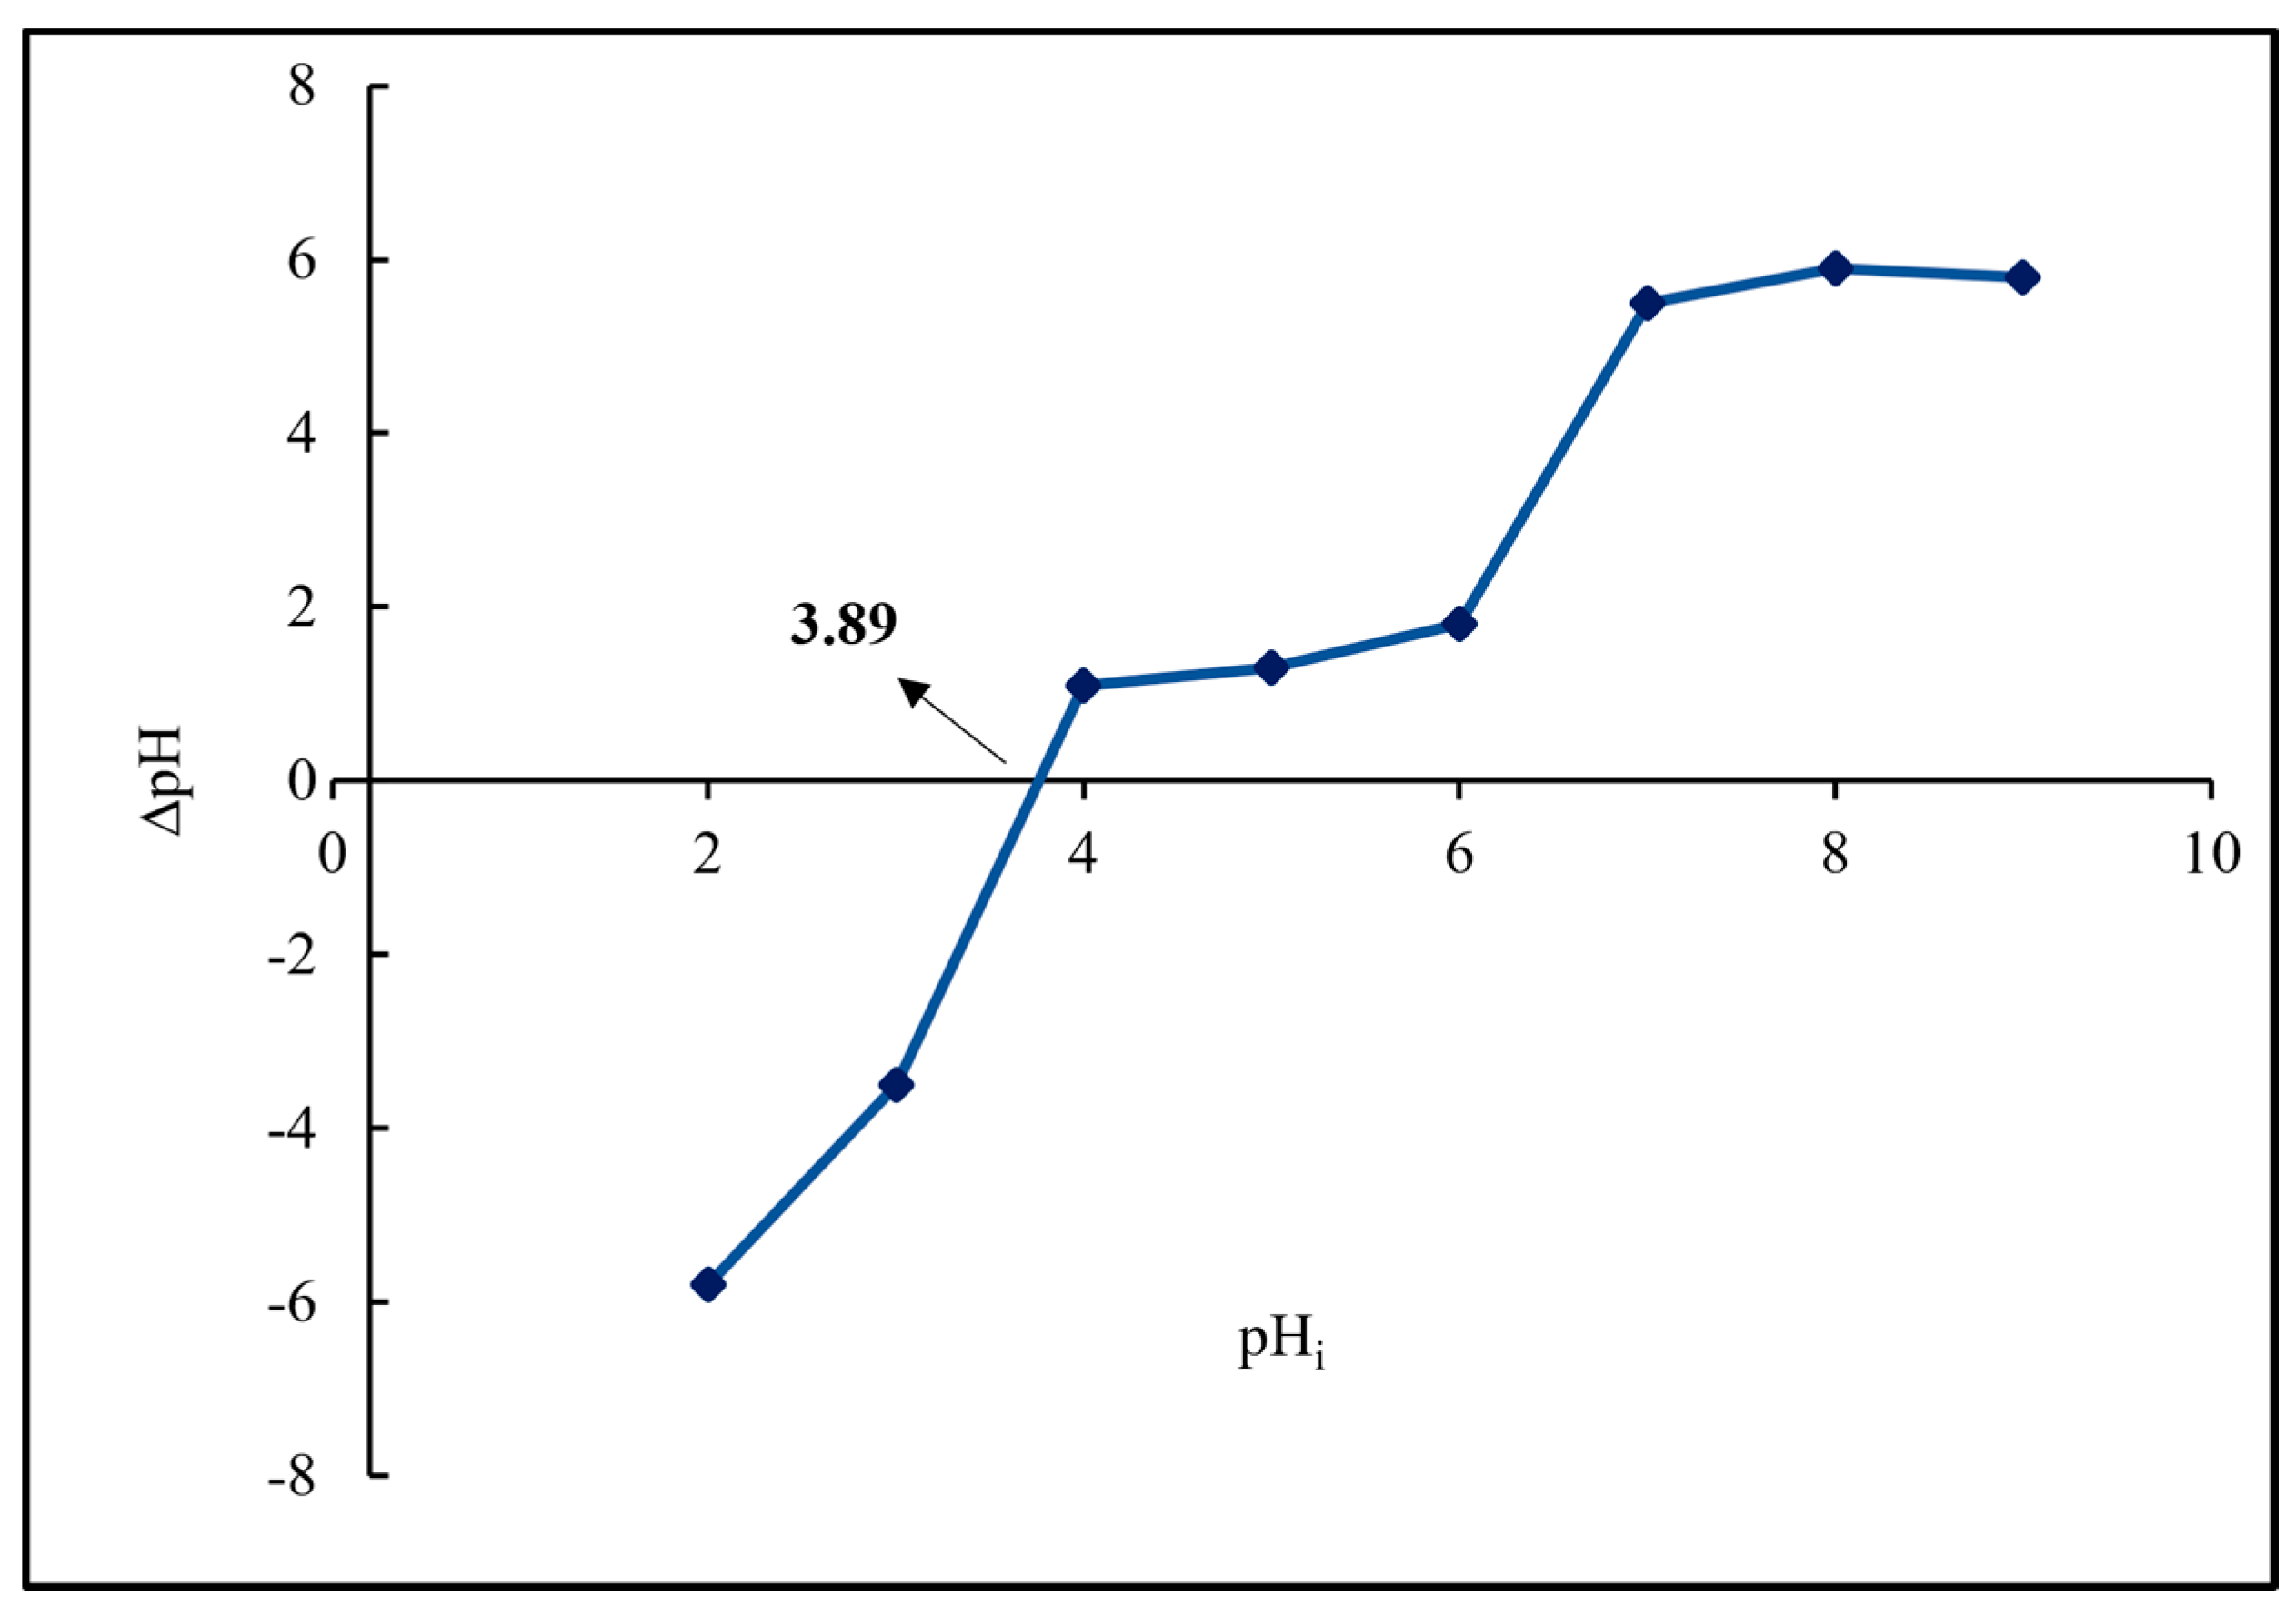
2.3. Point of Zero Charge (pHpzc)
2.4. Instrumentation
2.5. Batch Experiments
2.6. Optimization of Process Parameters through RSM-CCD
2.7. Reusability
2.8. Application in Real Water Samples
3. Results and Discussion
3.1. Characterization of the Synthesized BC-CS@nZVI Magnetic Nanocomposite
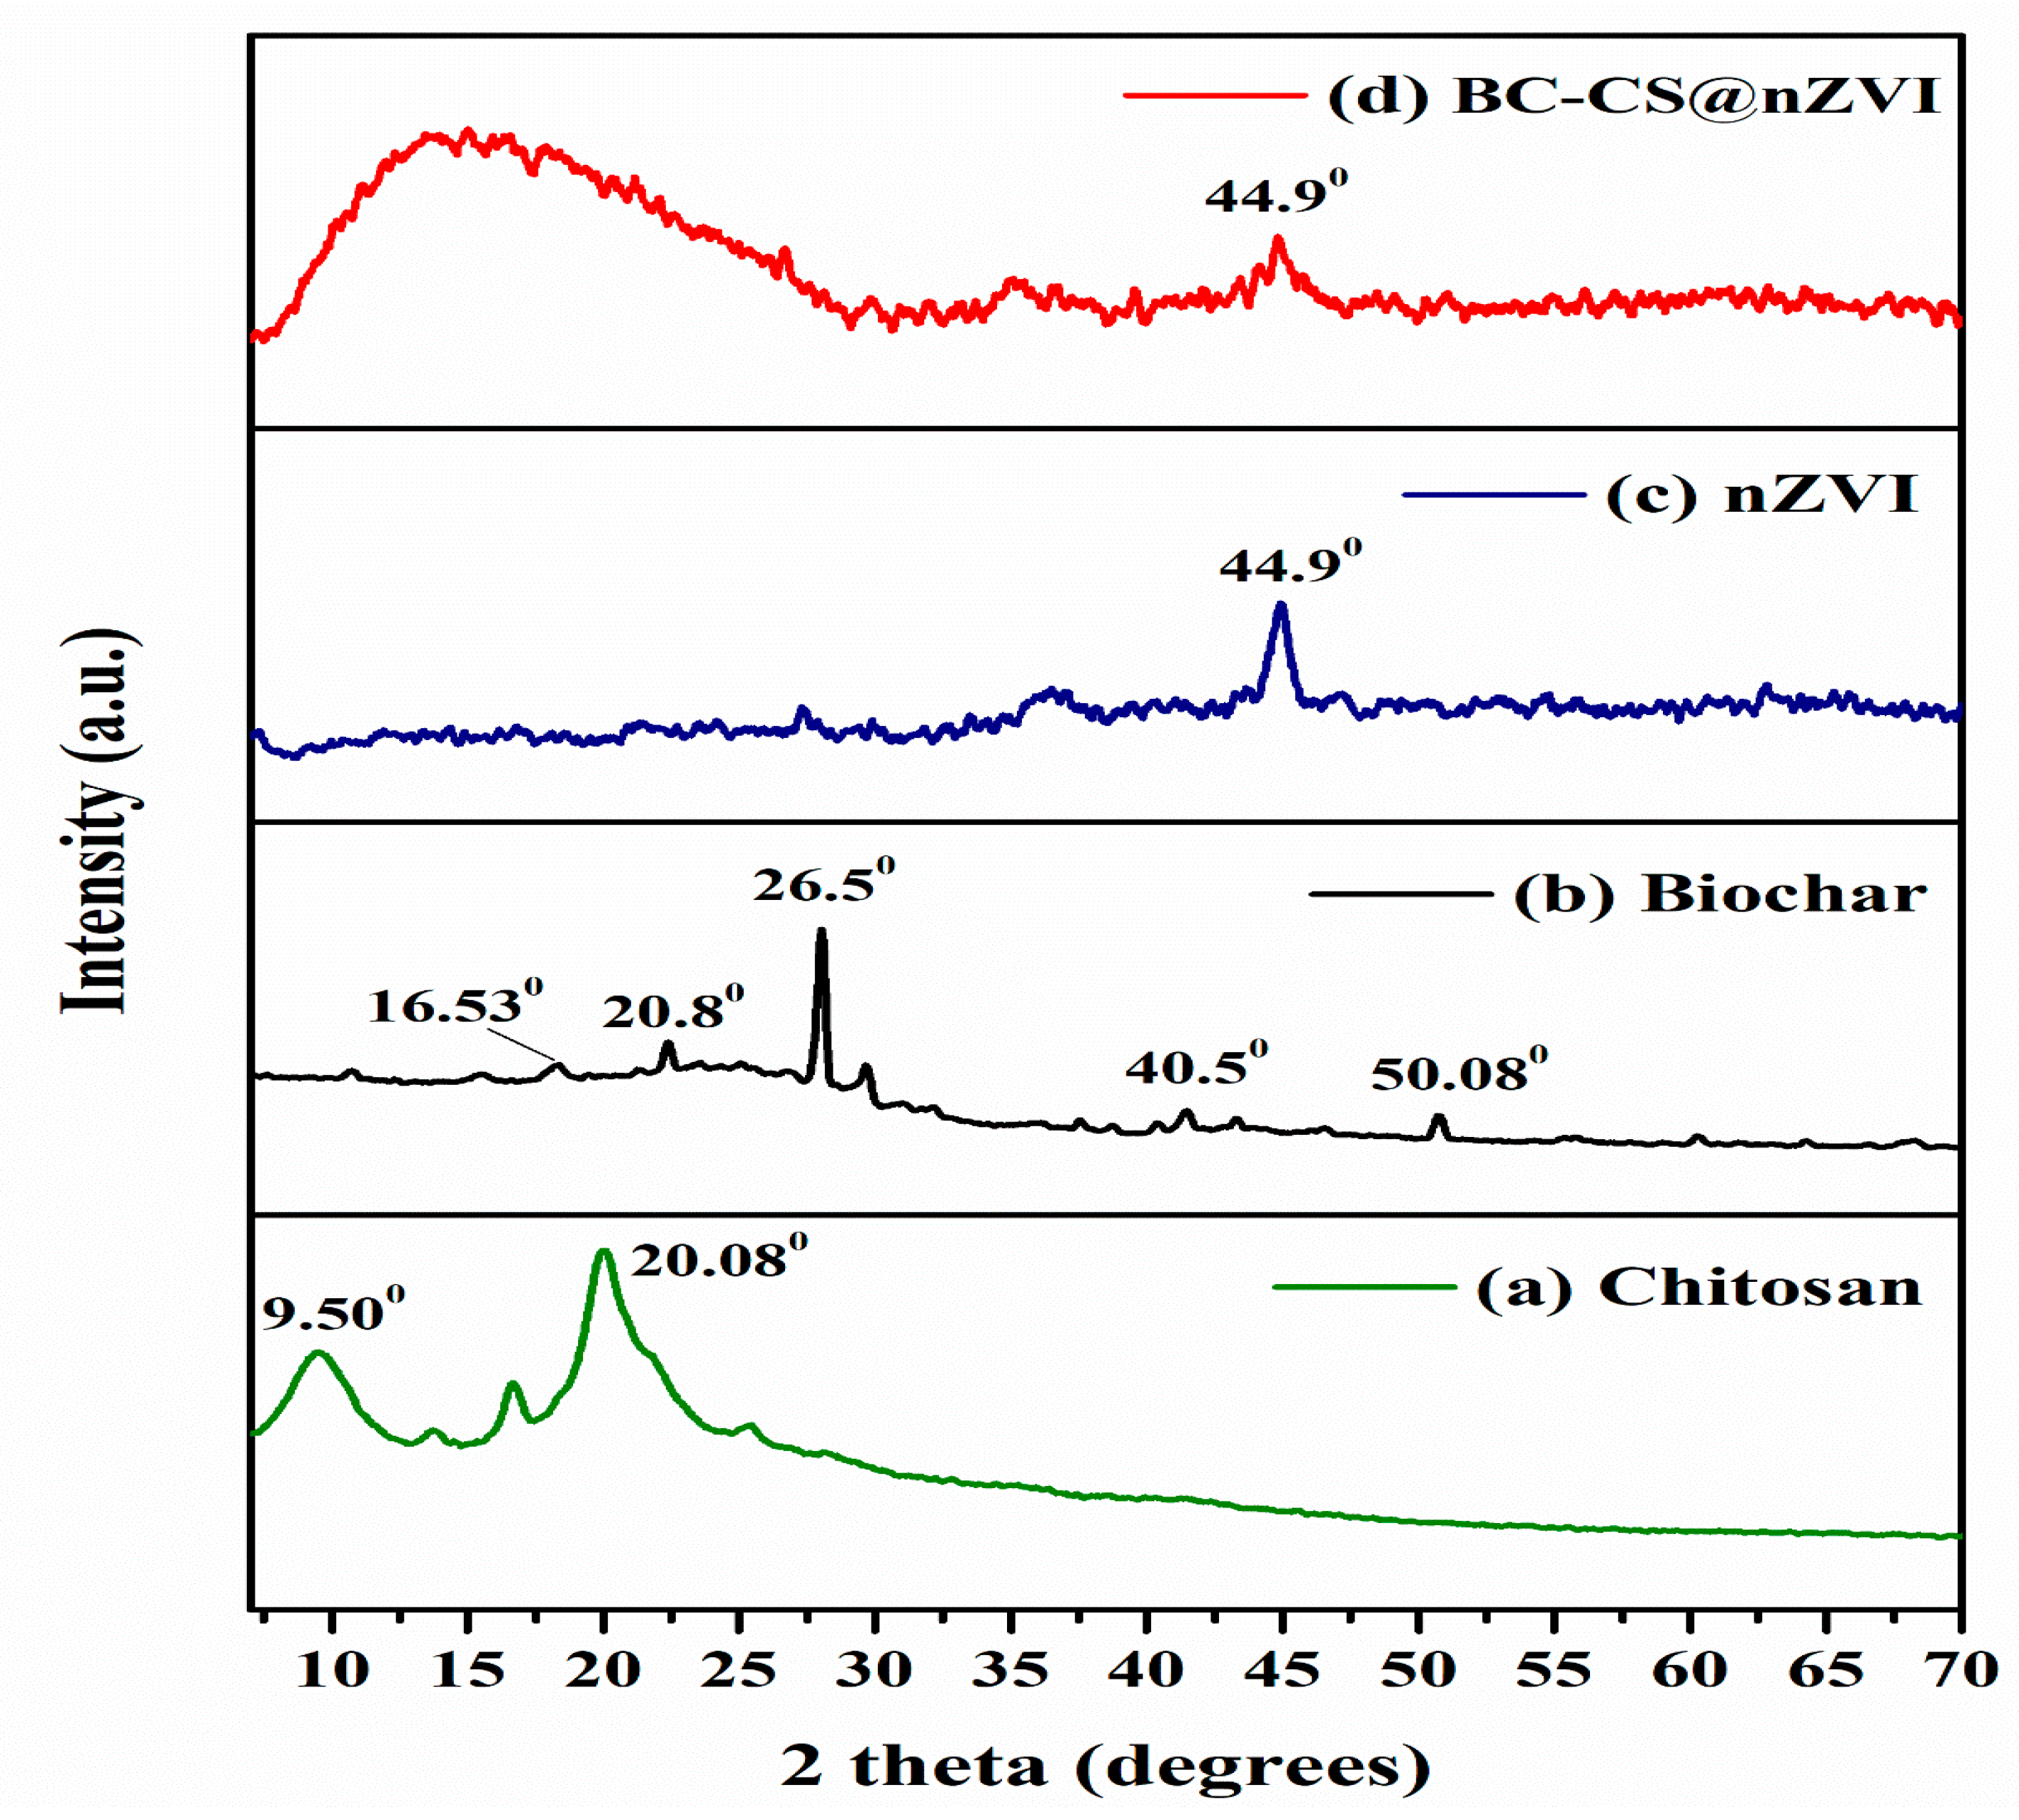
3.1.1. XRD
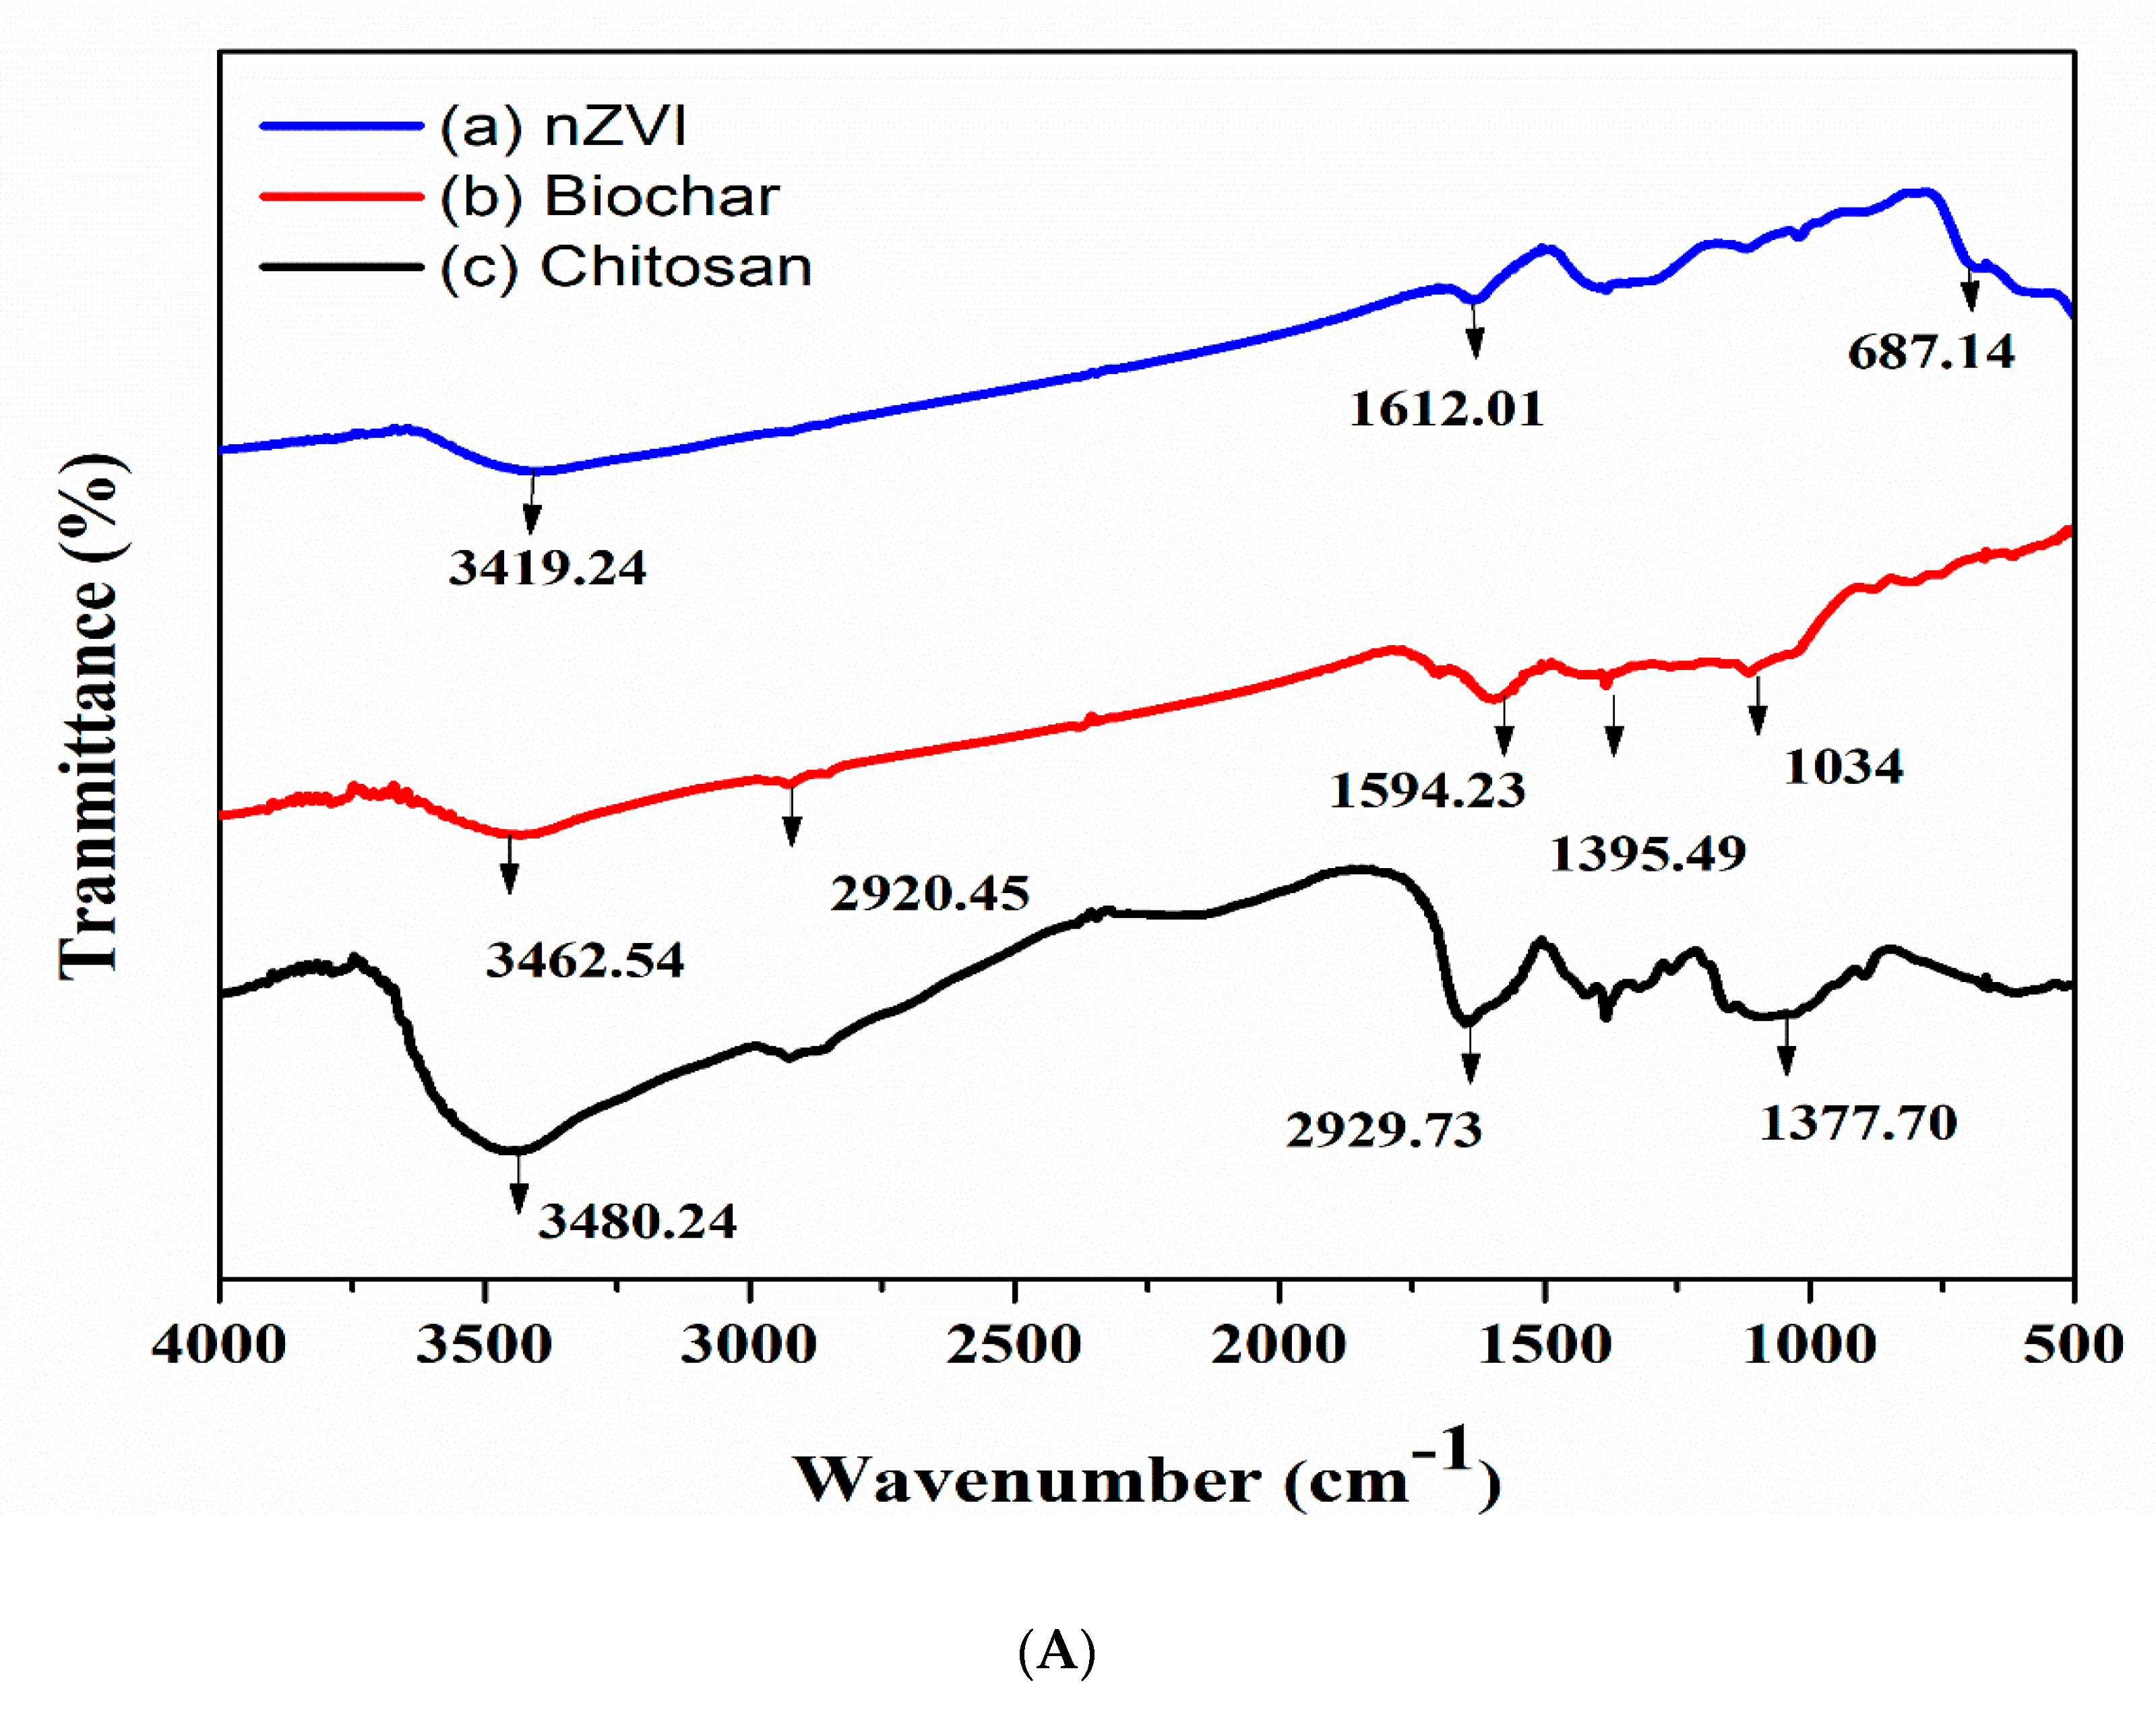
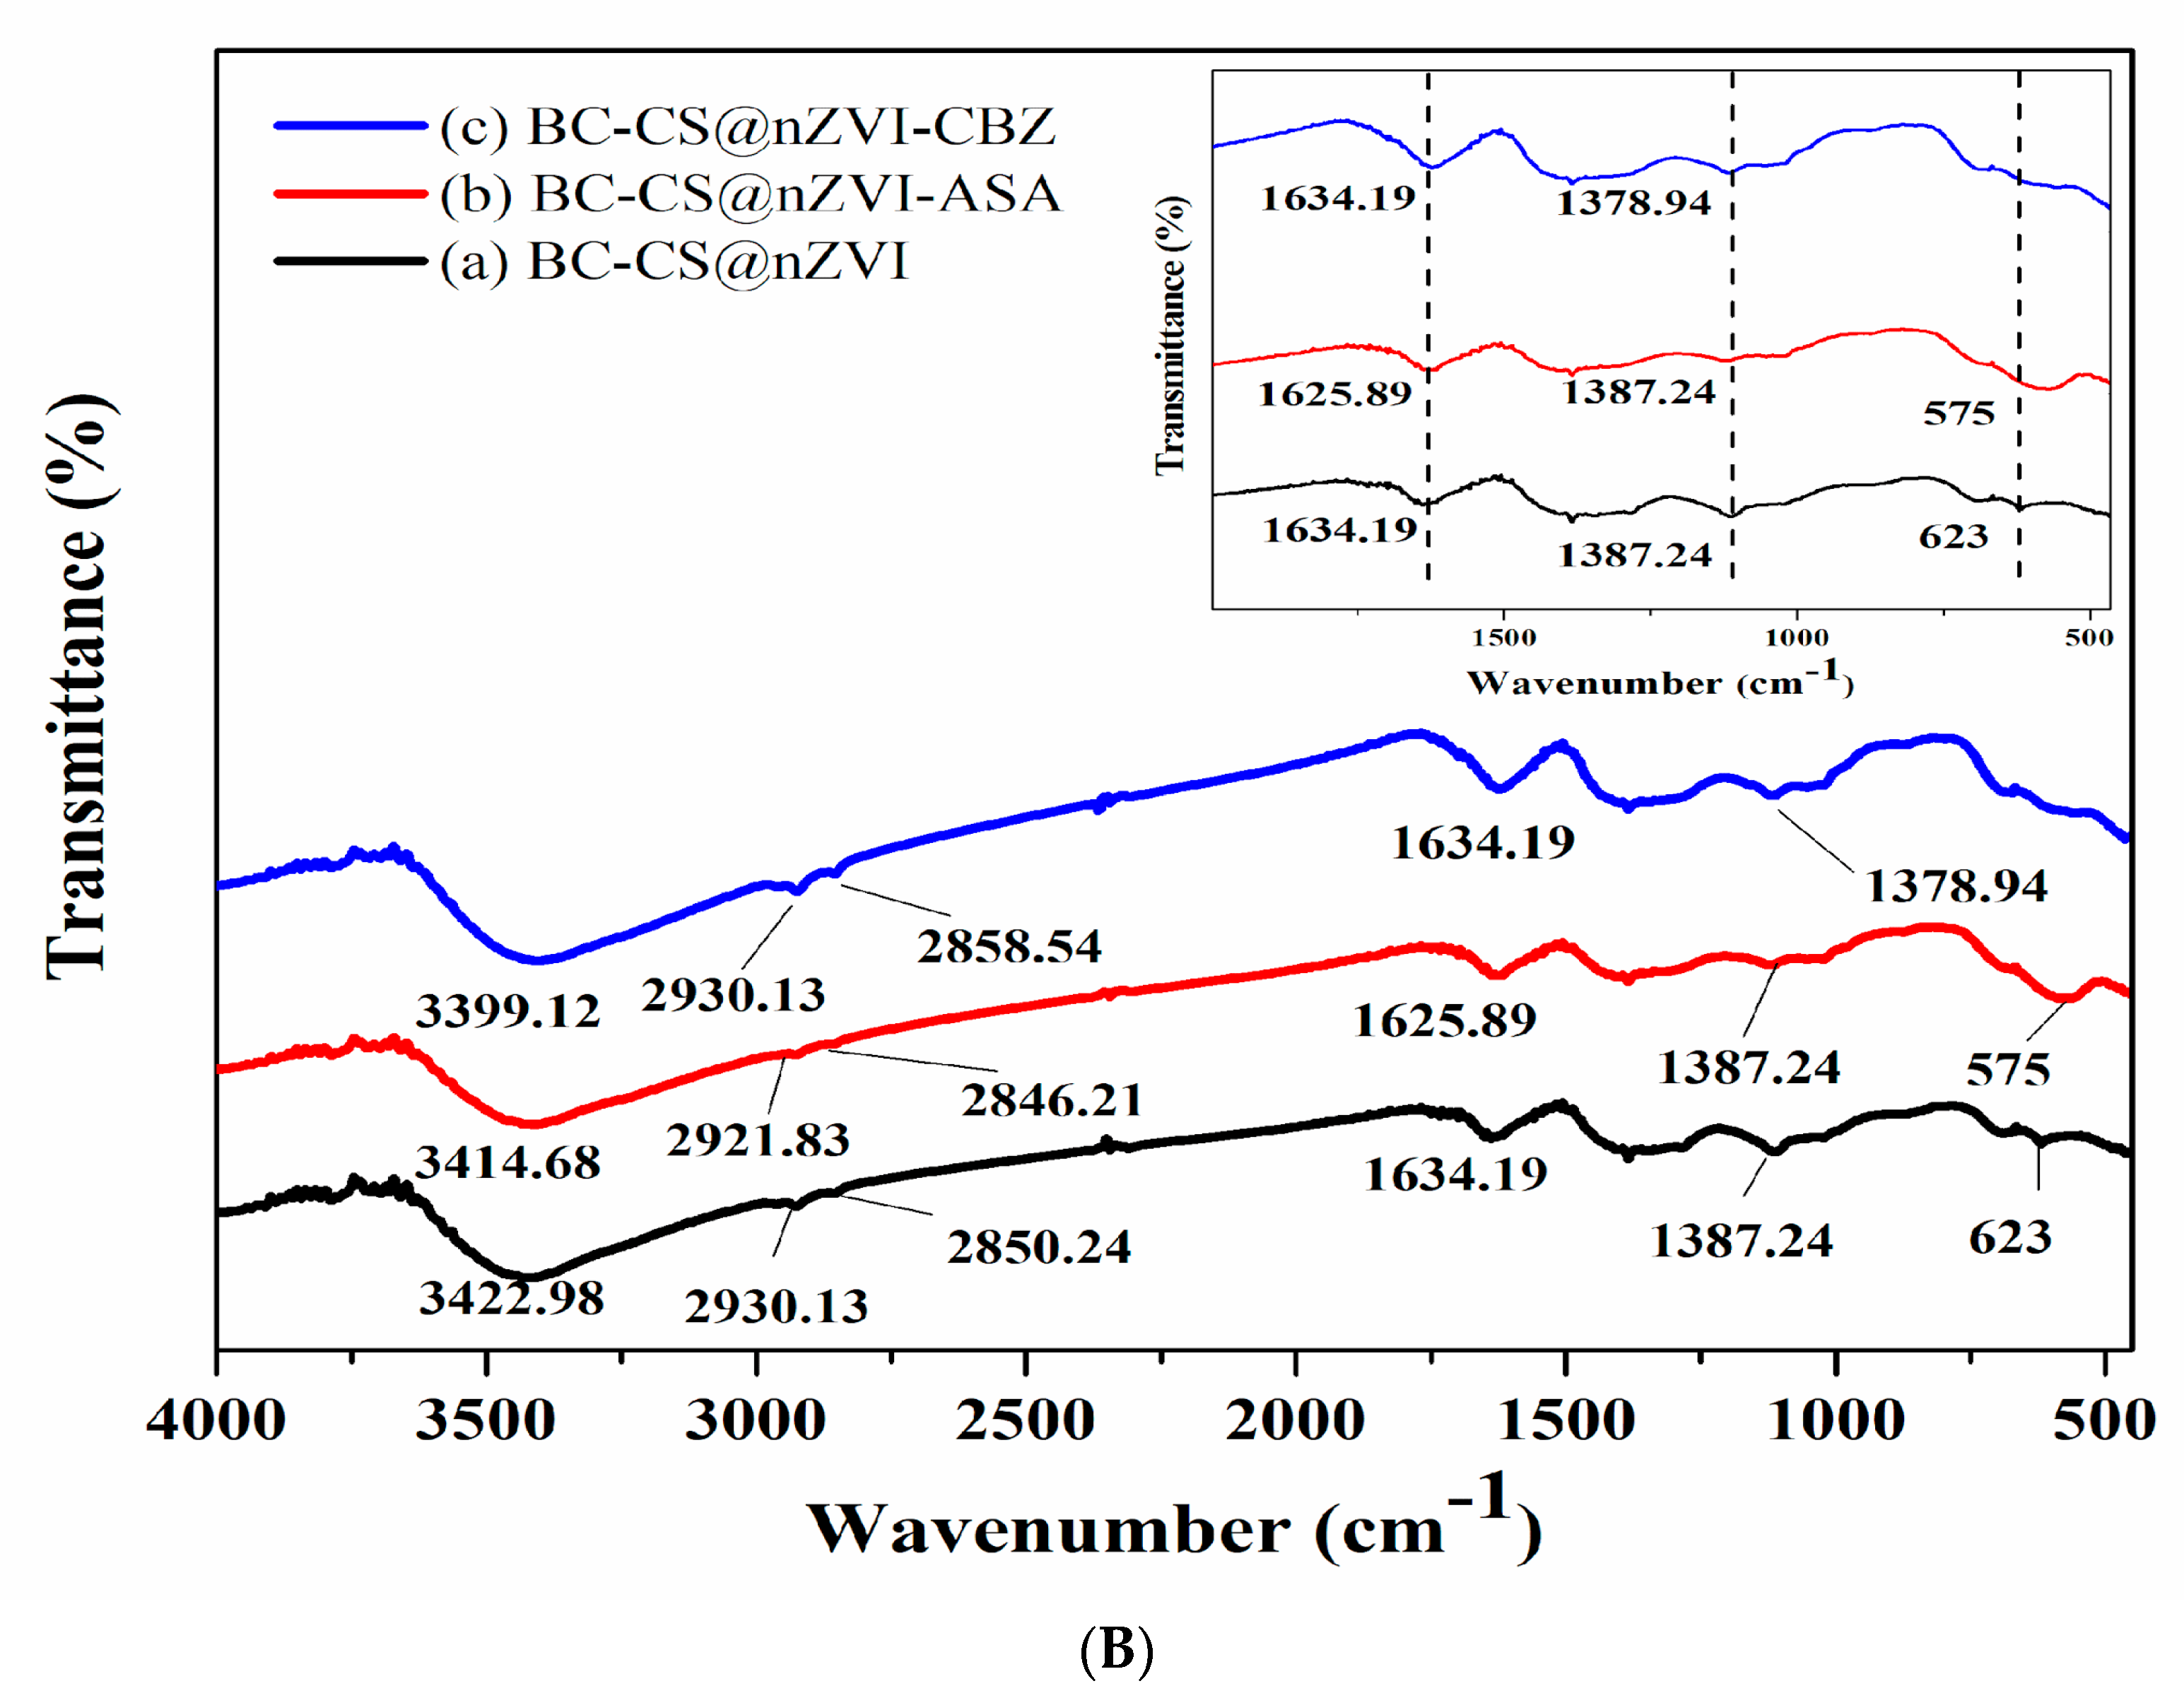
3.1.2. FTIR
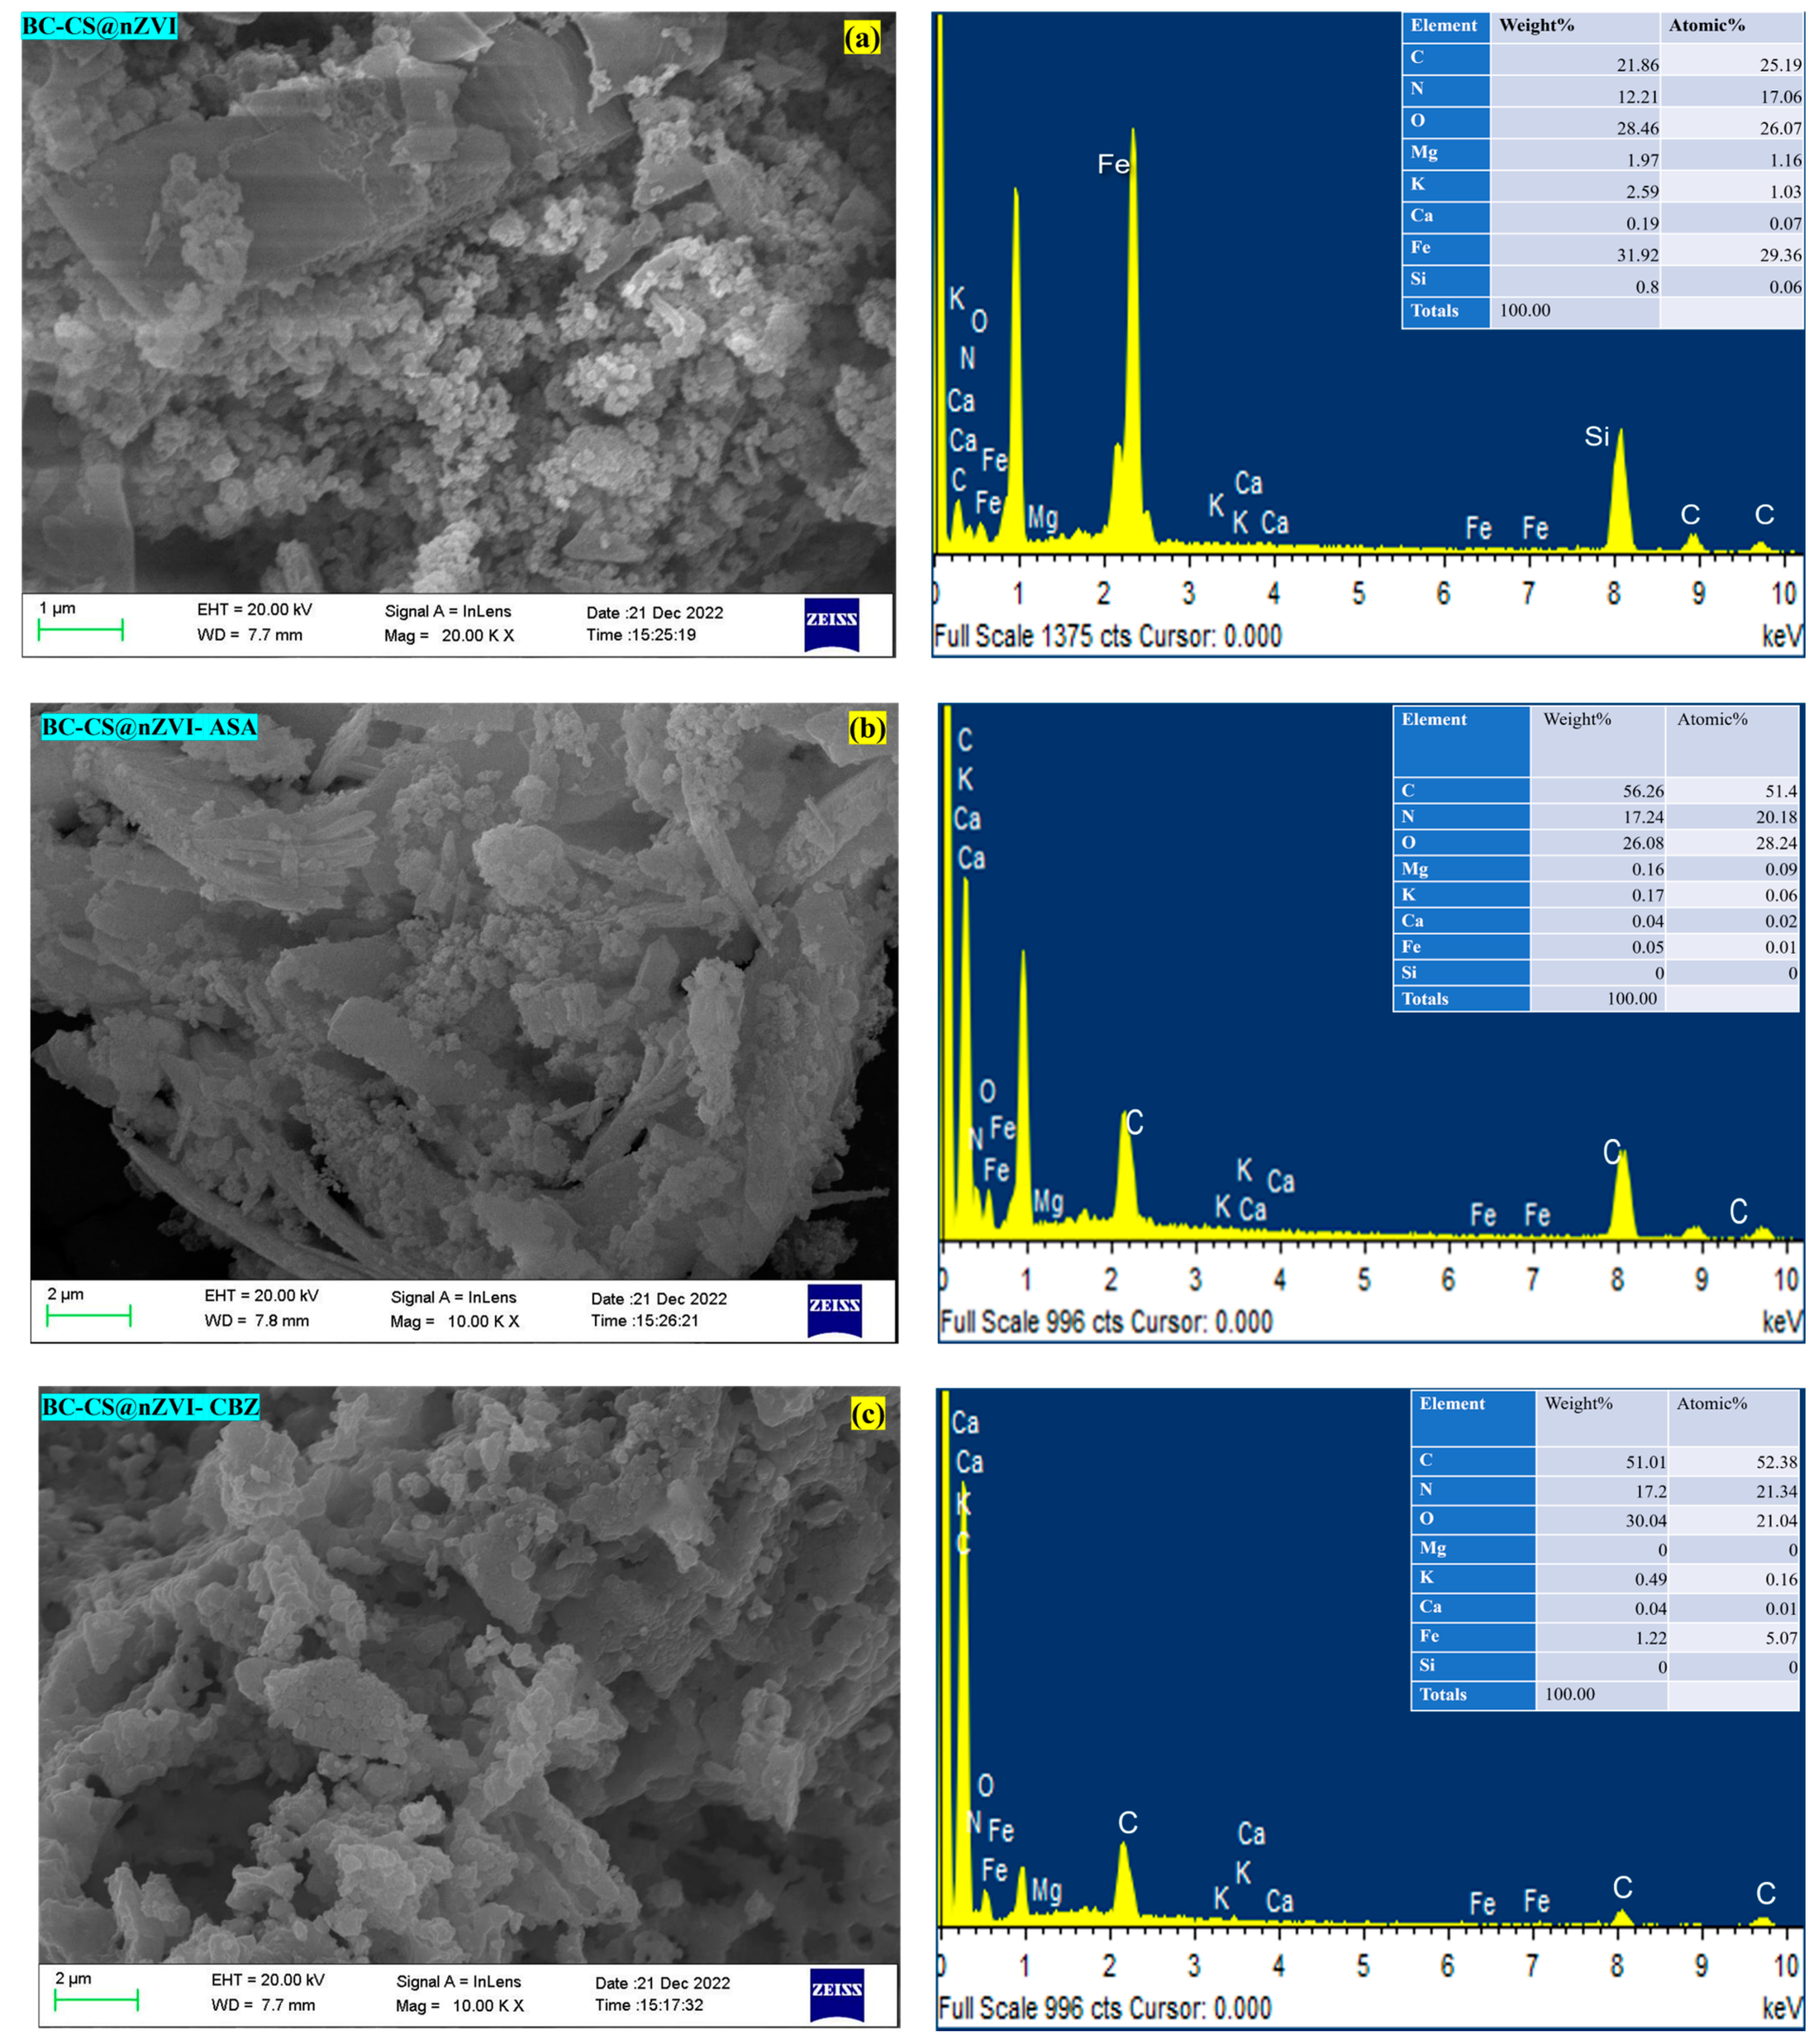
3.1.3. FE-SEM/EDX
3.2. Optimization of Process Variables Using RSM-CCD
3.2.1. Model Fitting and ANOVA Analysis
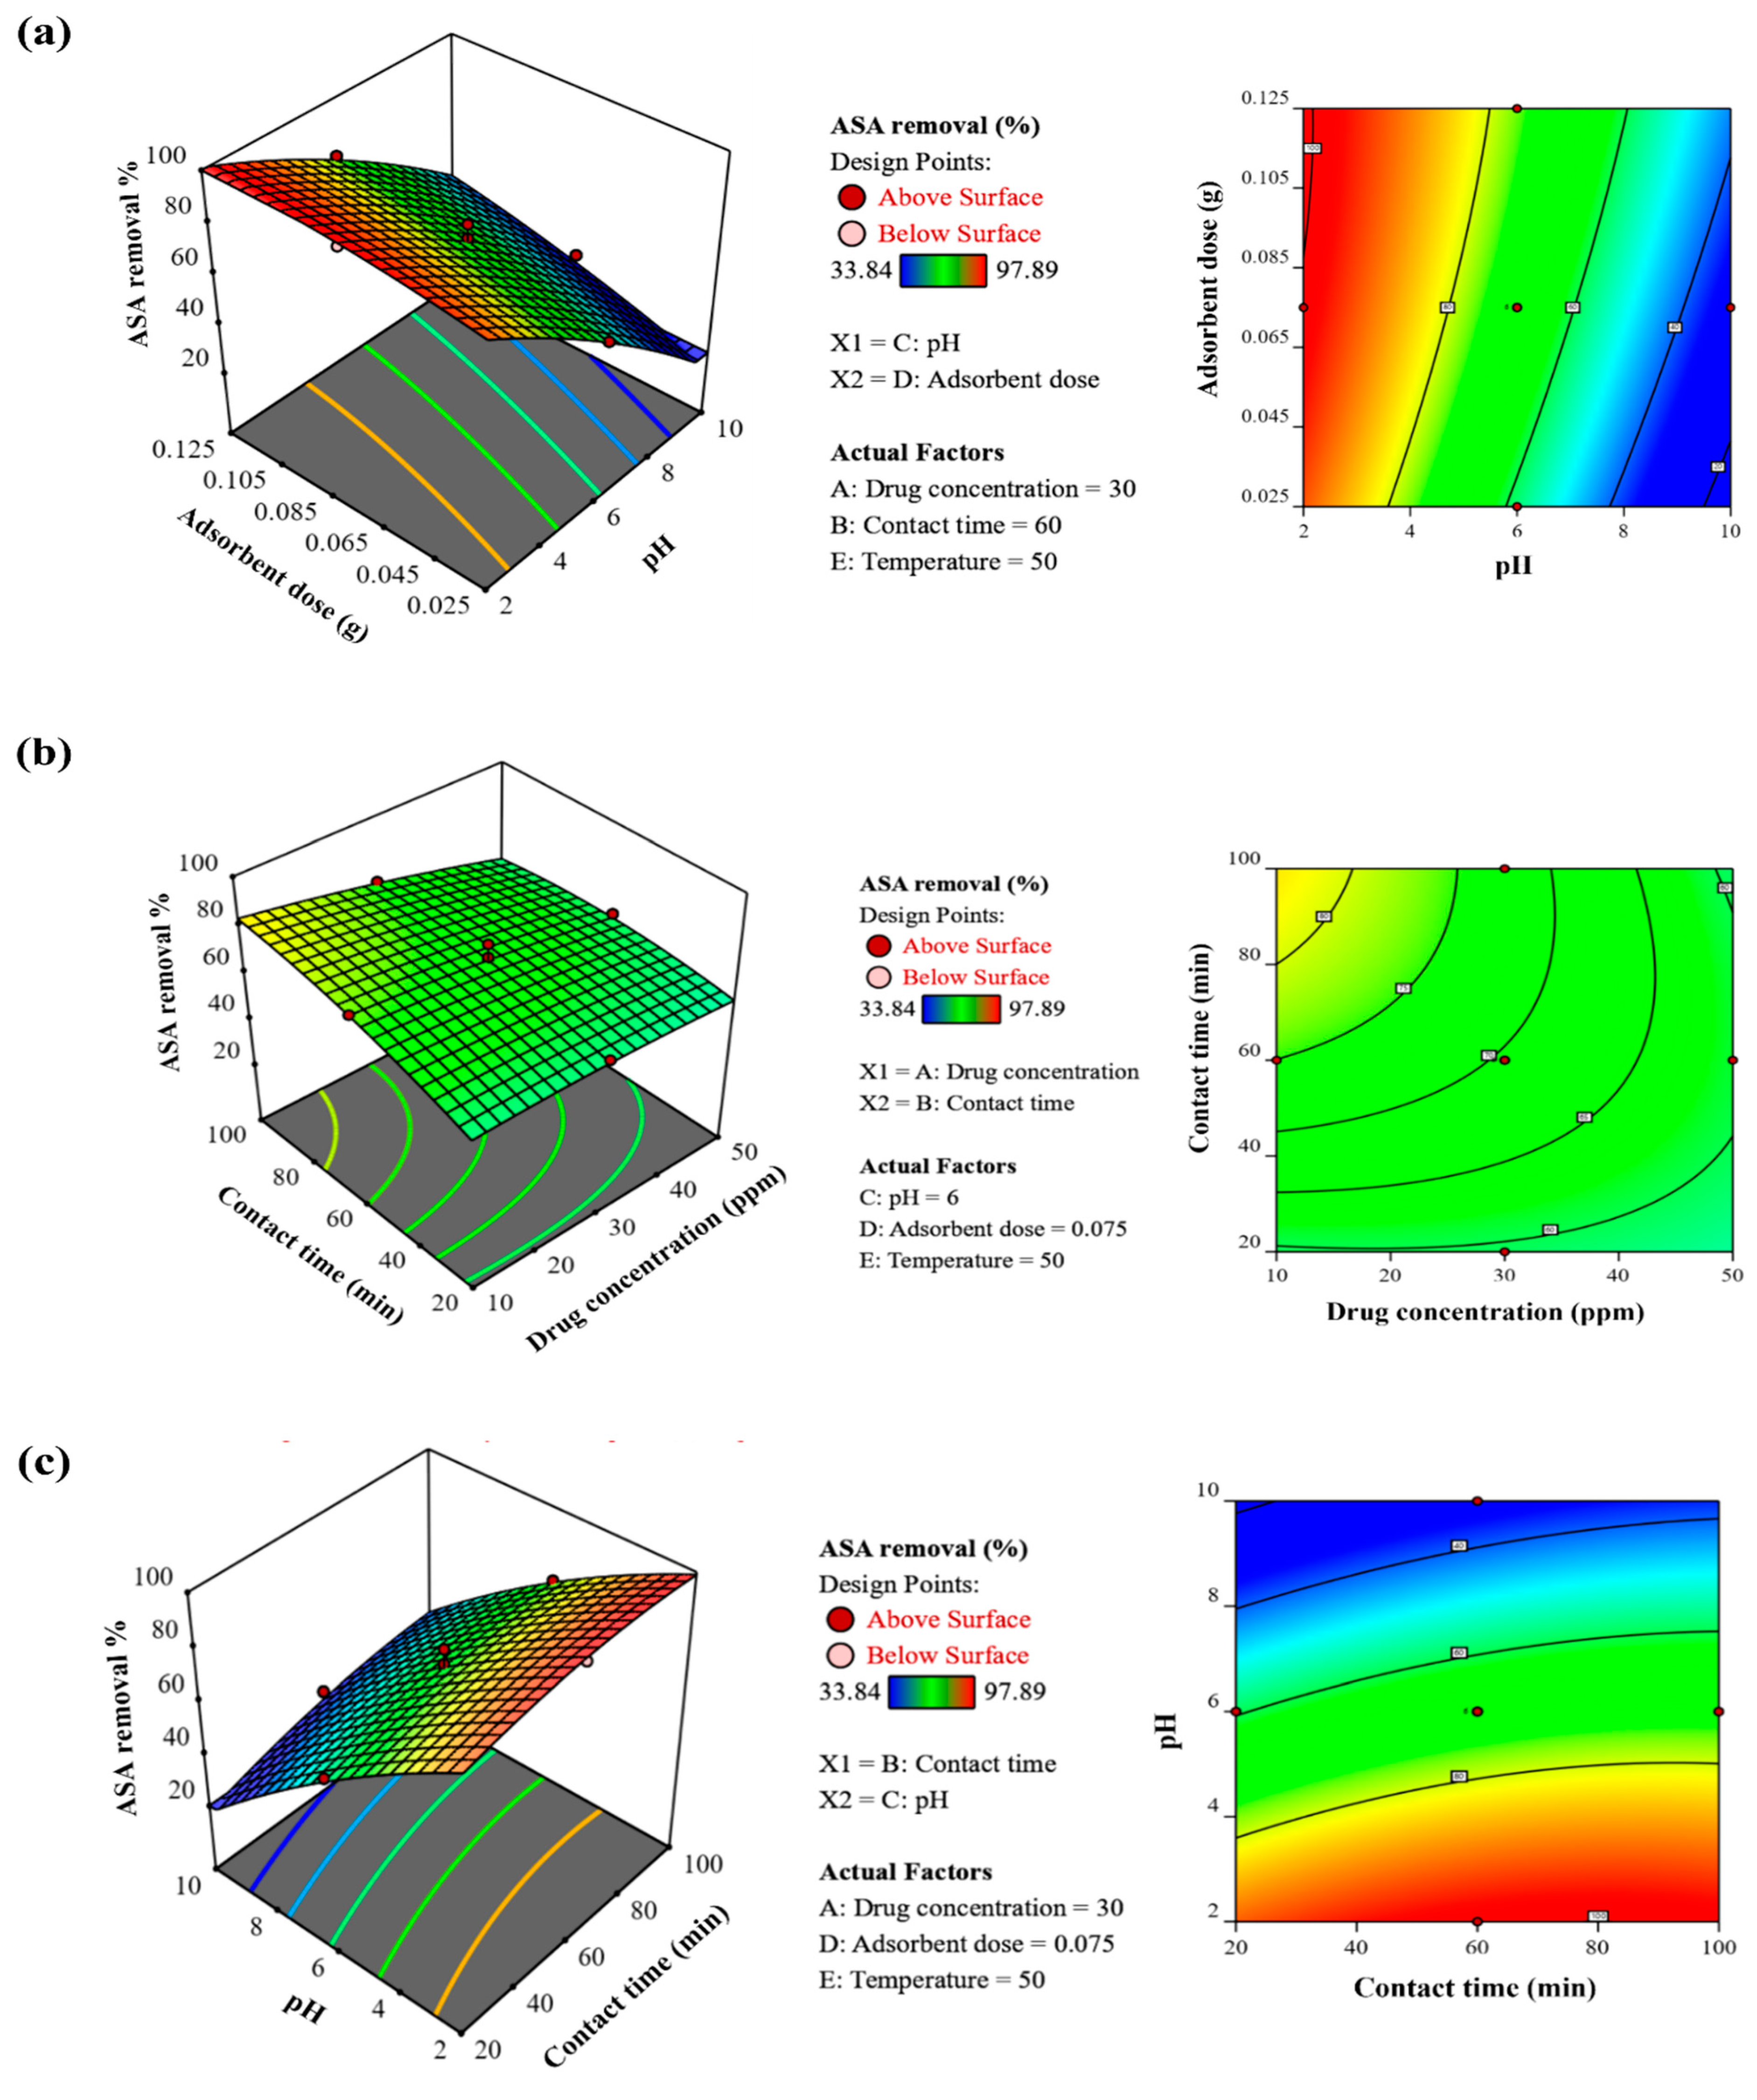
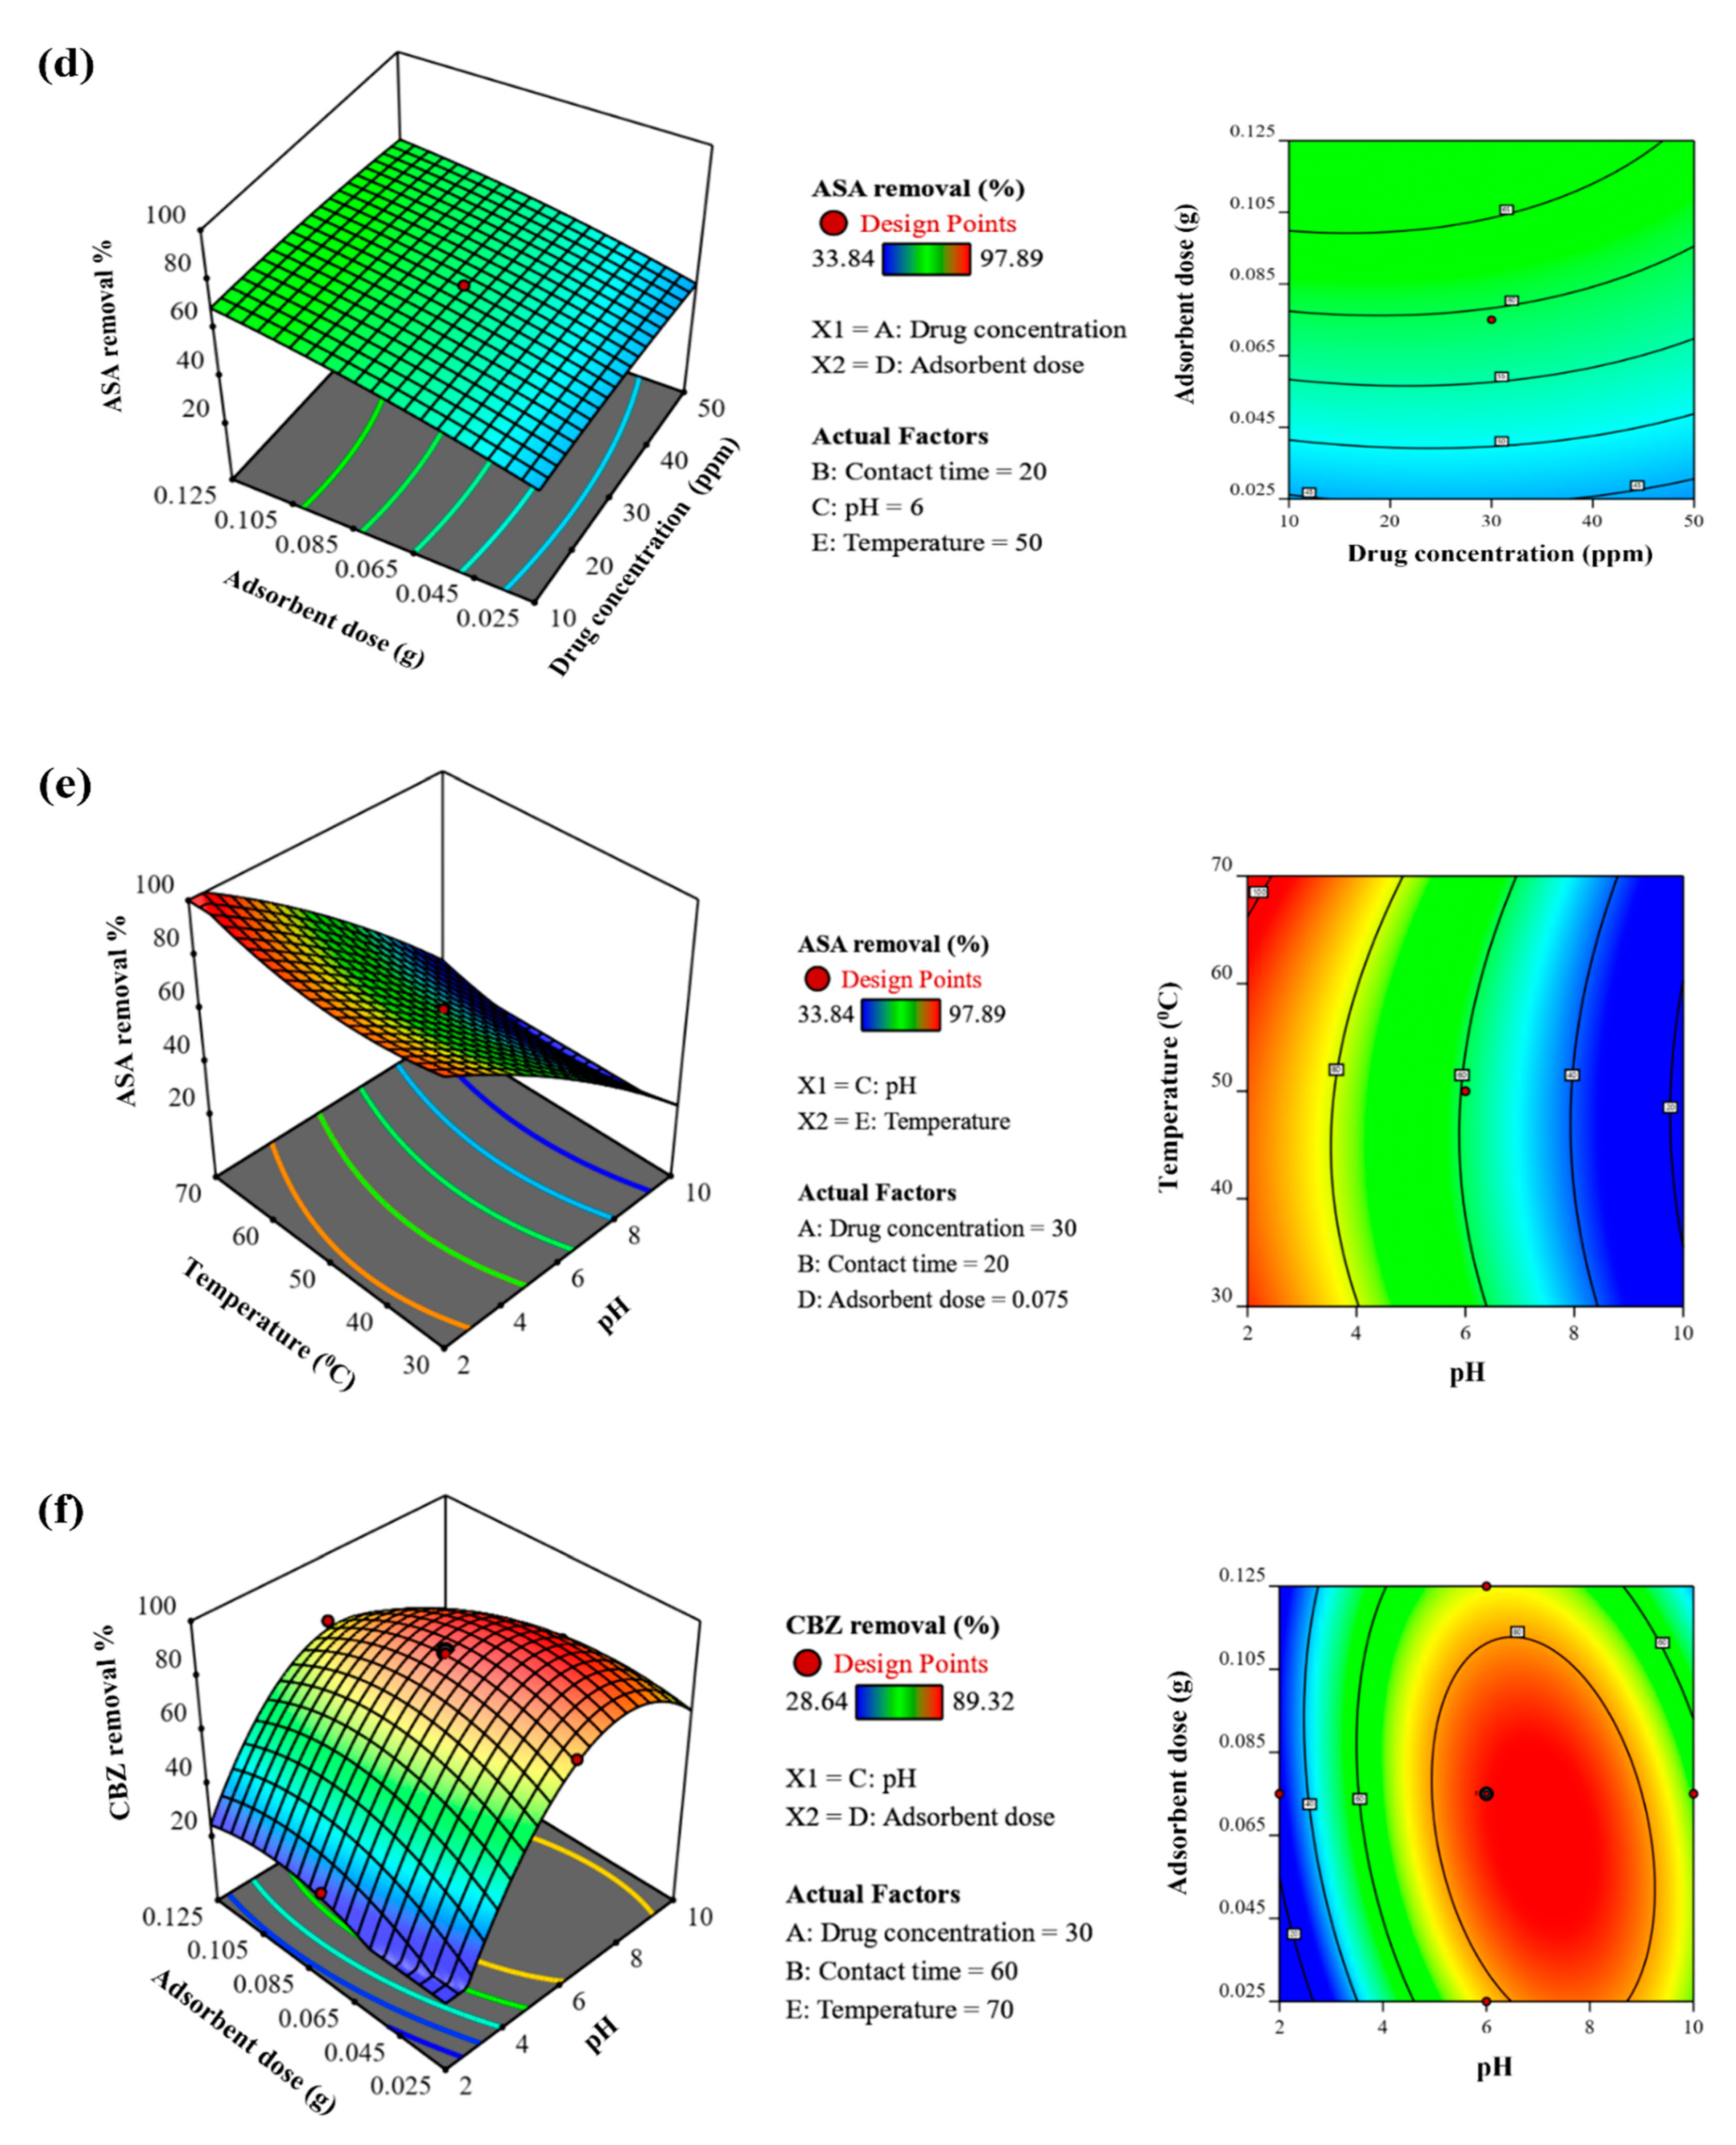
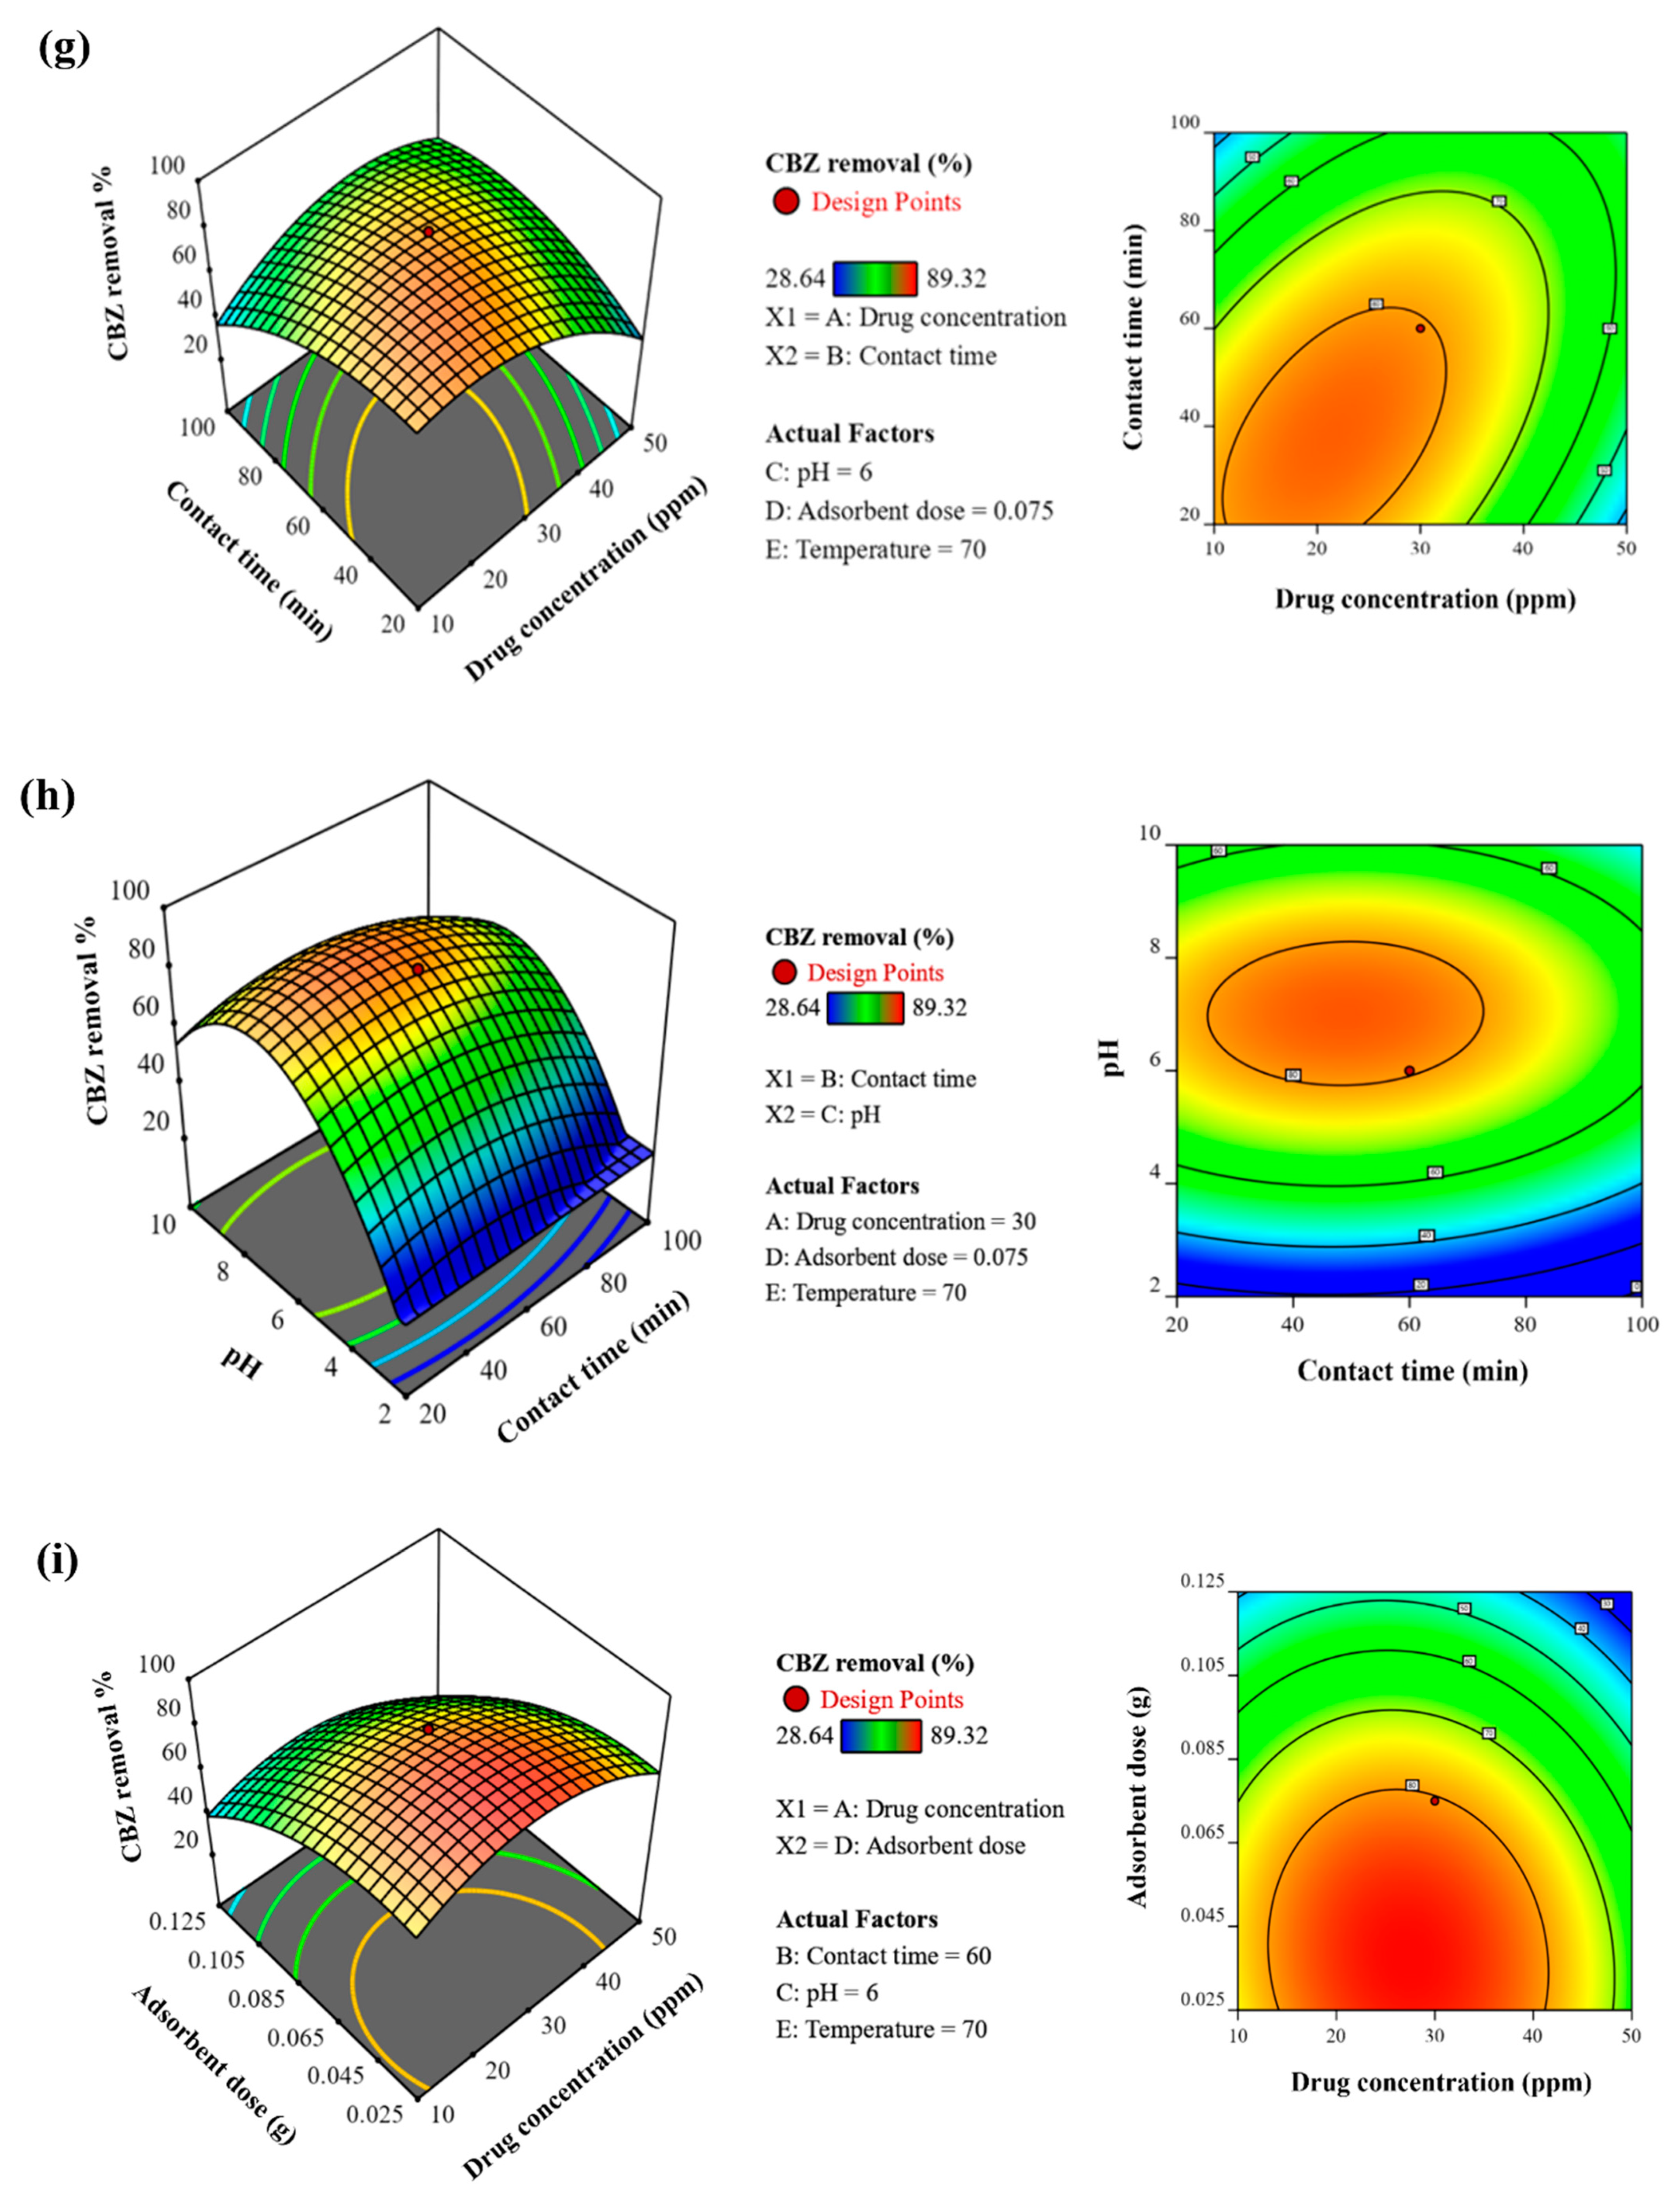
3.2.2. Interaction among Influencing Factors
Effect of pH and Adsorbent Dose
Effect of Initial Drug Concentration and Contact Time
Effect of Contact Time and pH
Effect of Adsorbent Dose and Initial Drug Concentration
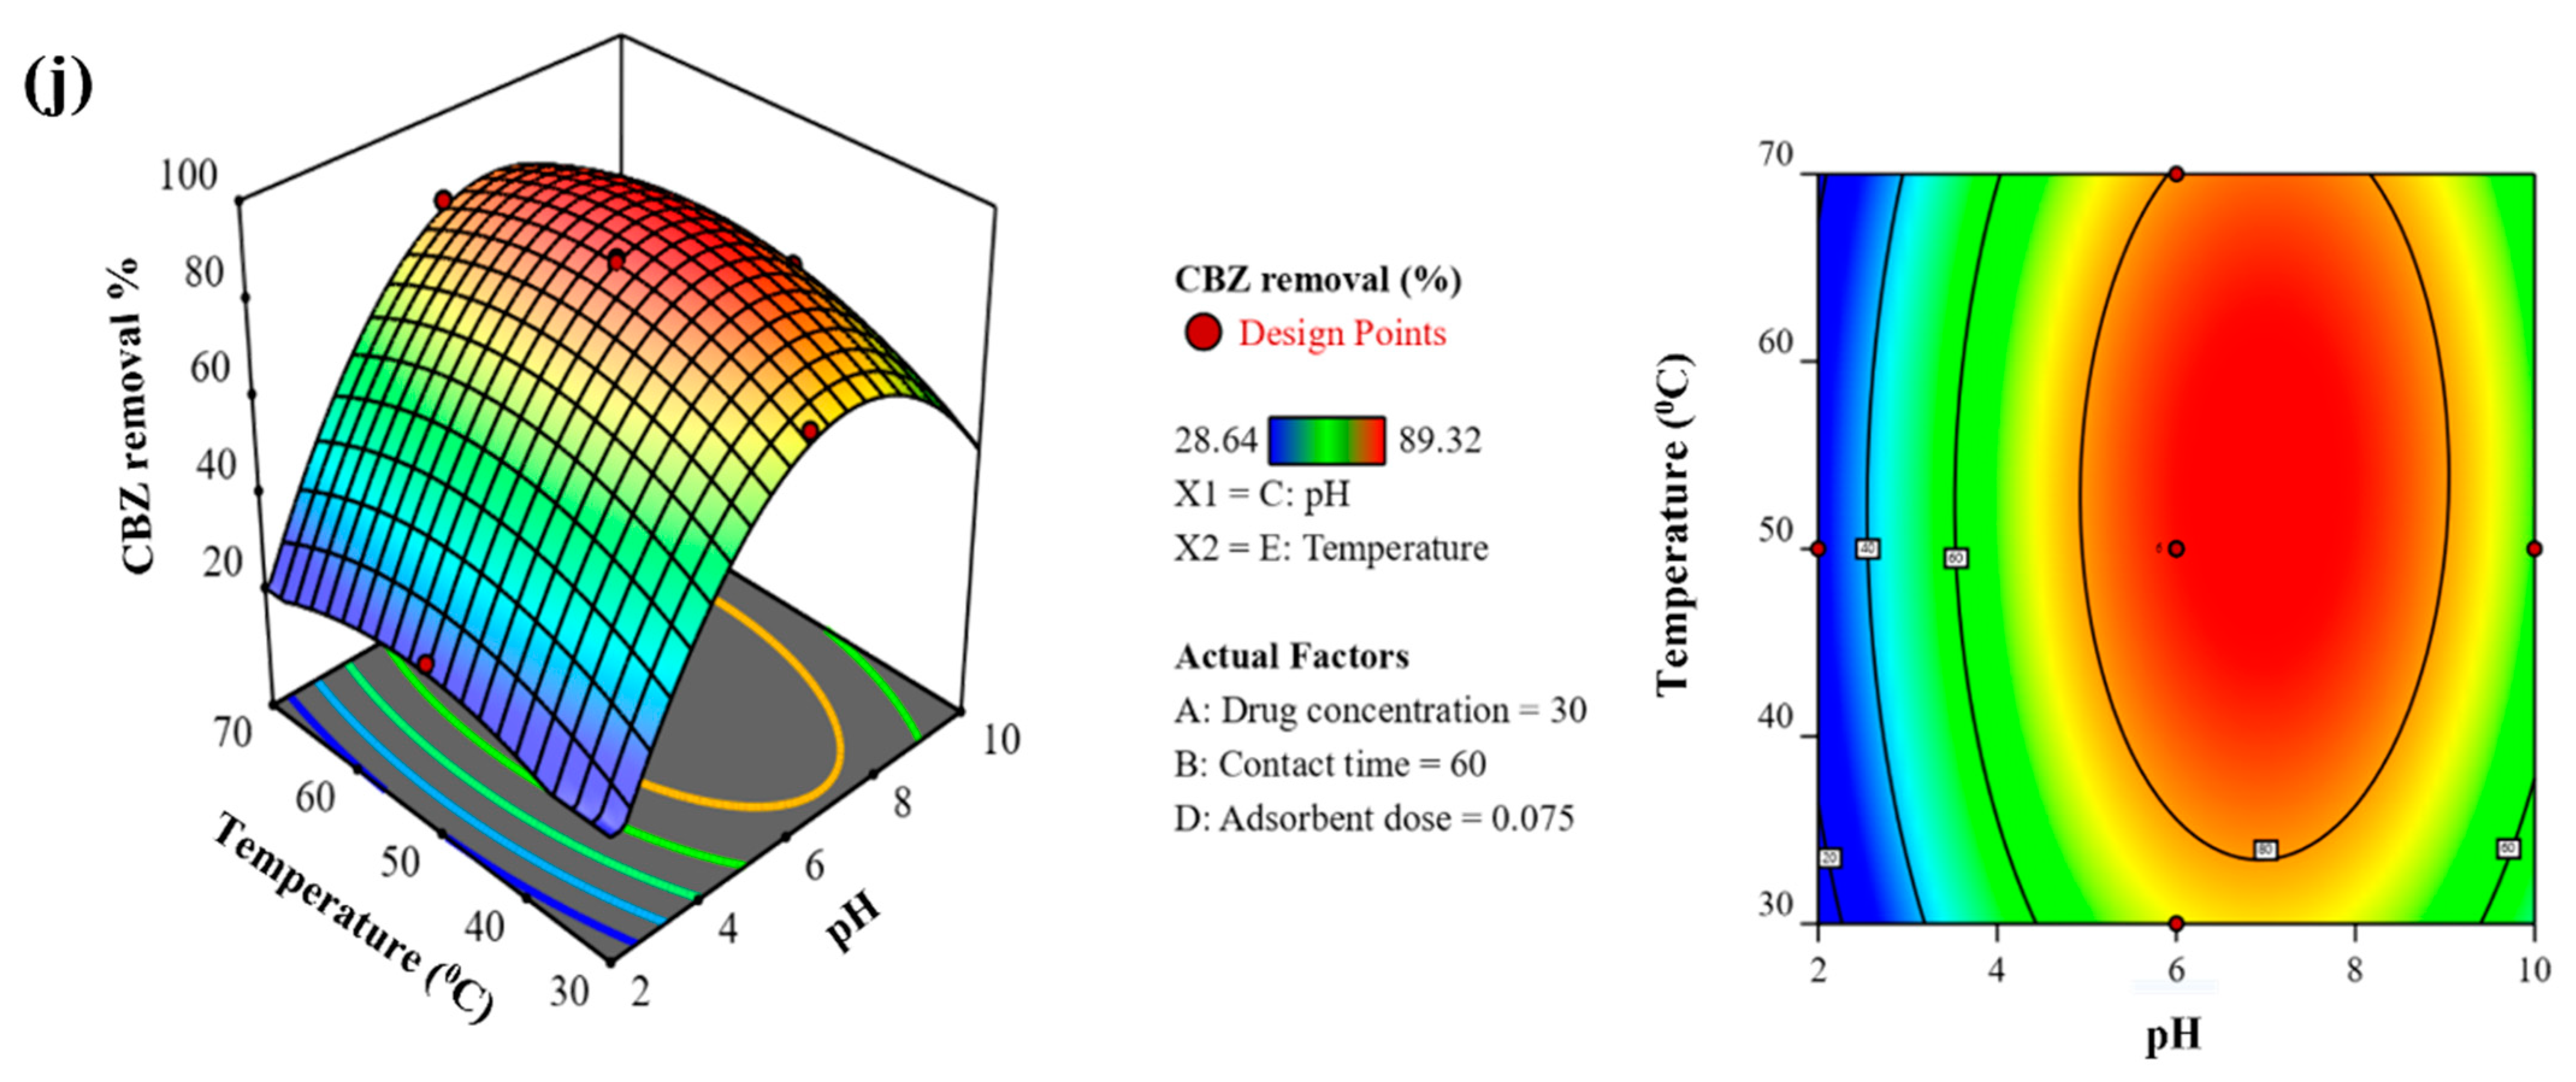
Effect of Temperature and pH
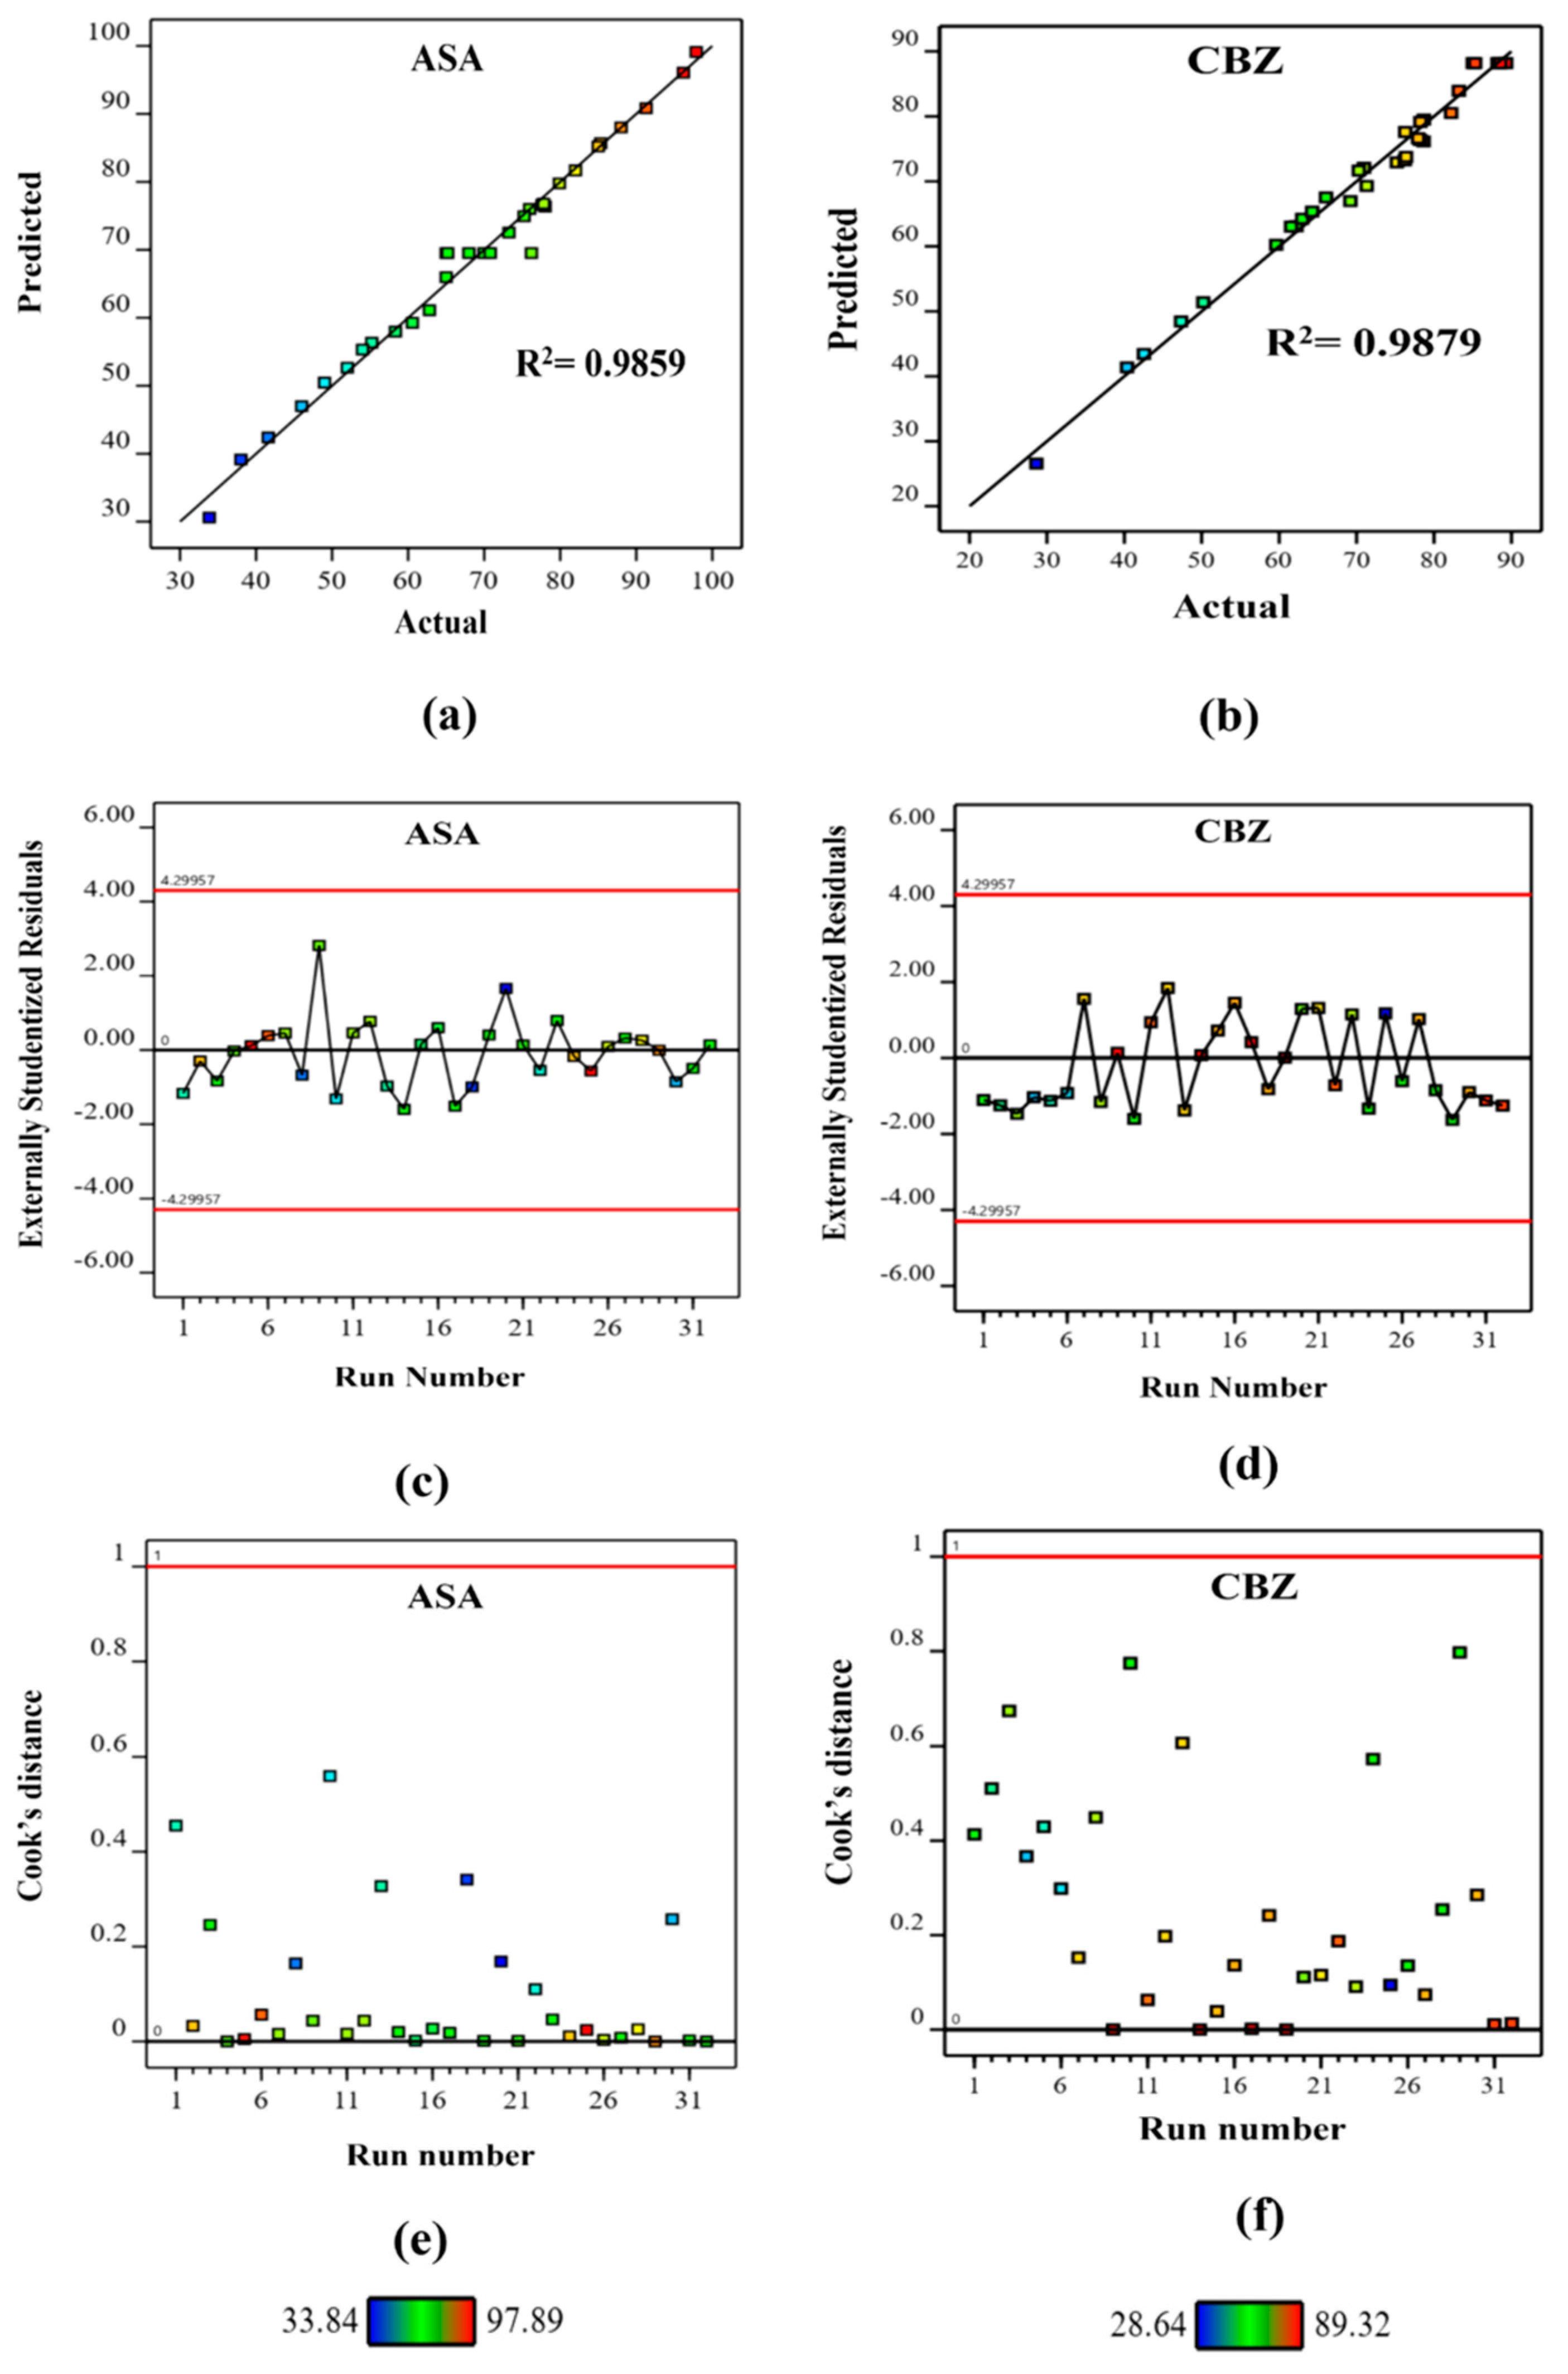
3.2.3. The Diagnostic Plot Analysis
3.3. Adsorption Kinetic Model
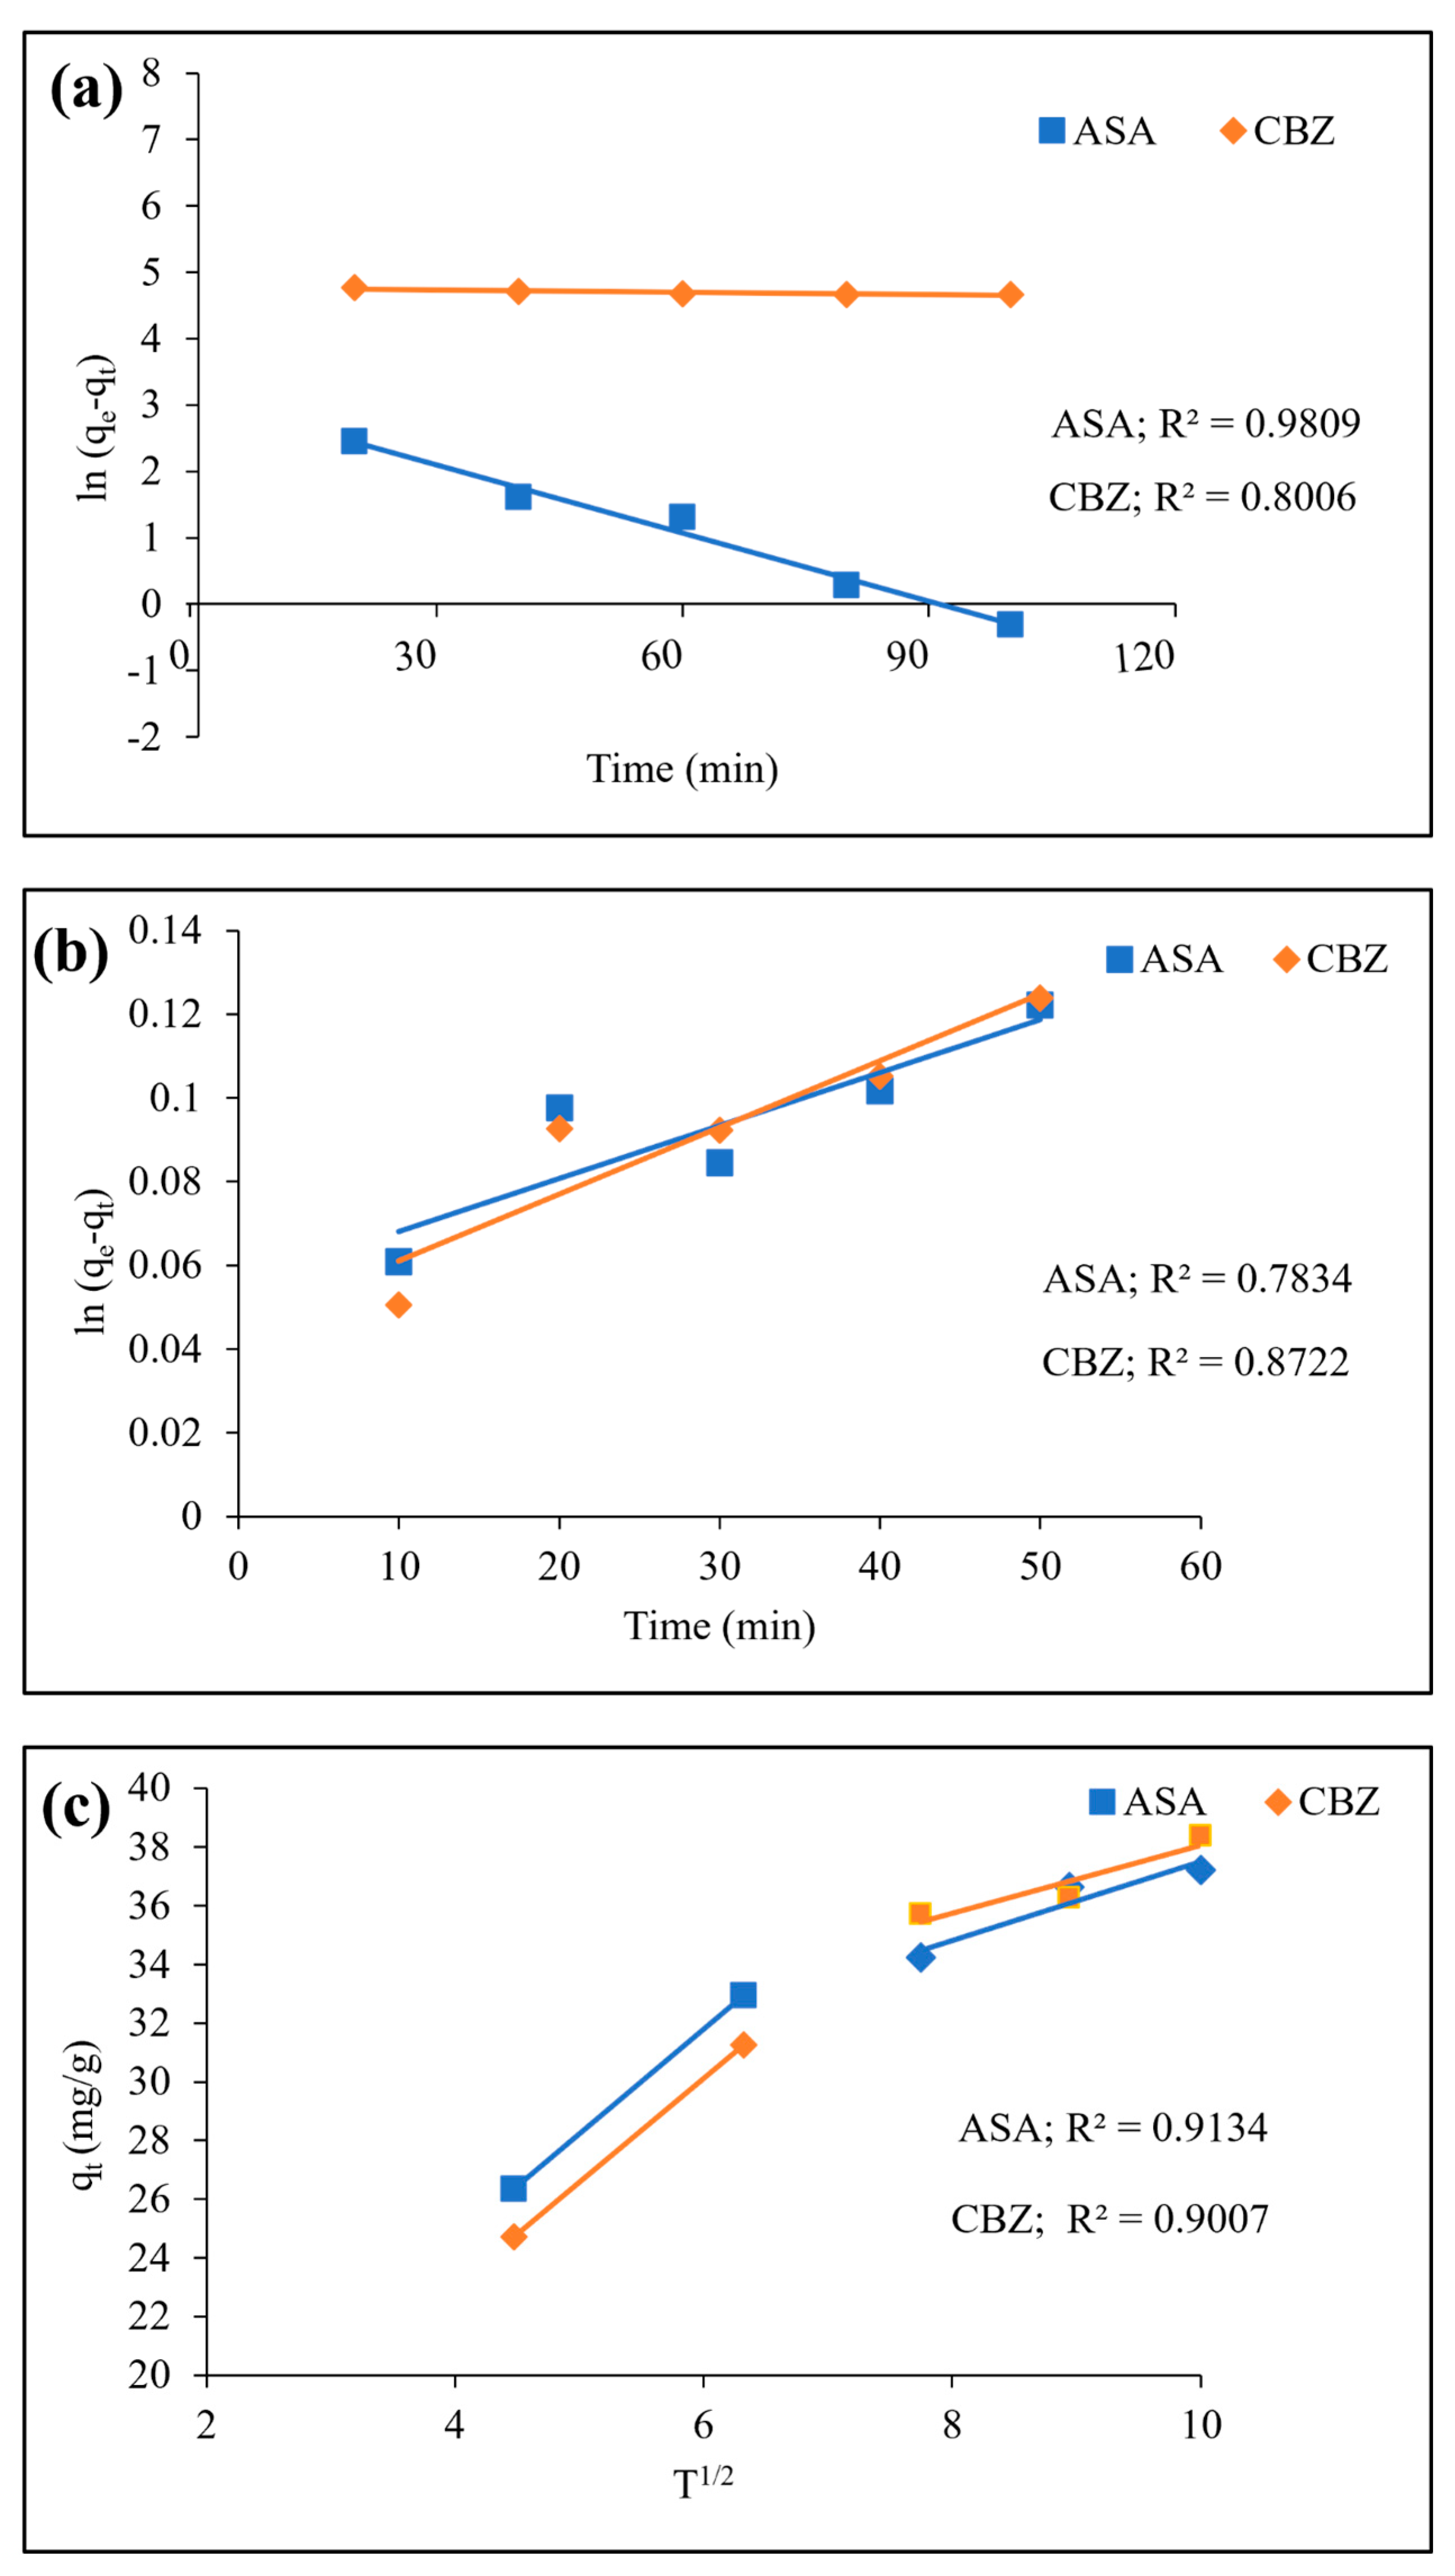
3.3.1. Pseudo-First-Order Reaction
3.3.2. Pseudo-Second-Order Reaction
3.3.3. Intraparticle Diffusion Model
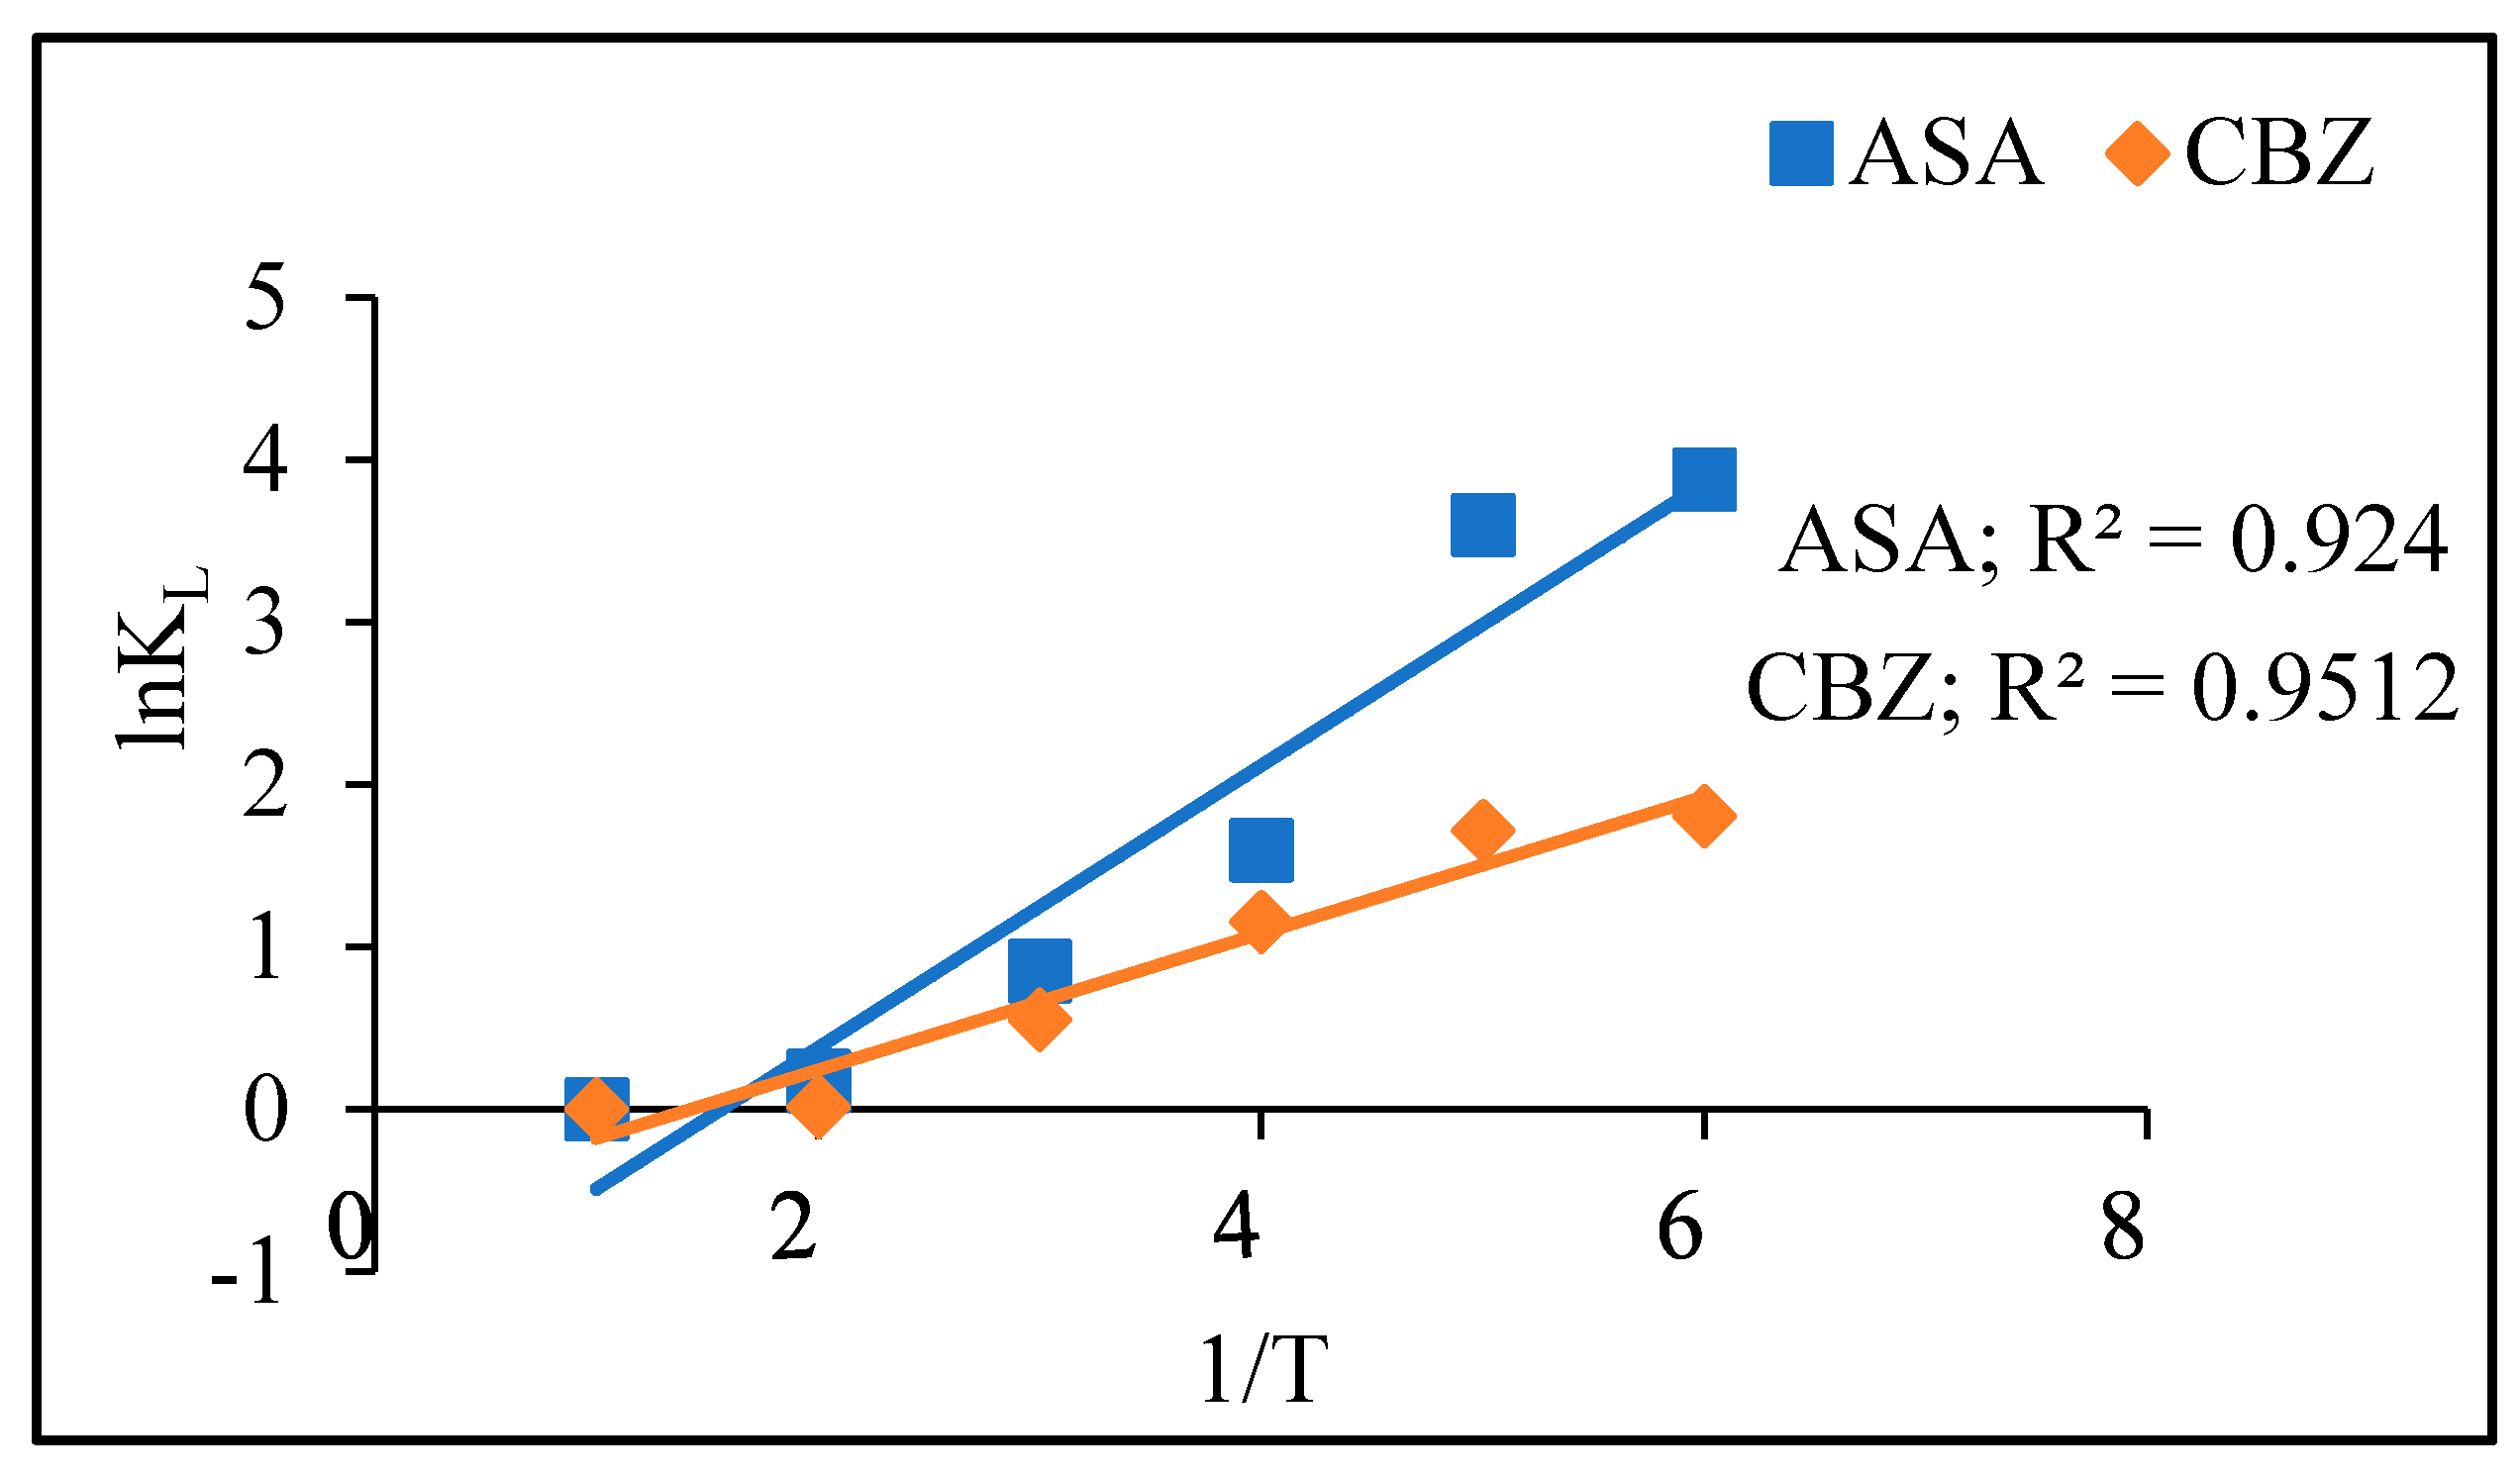
3.4. Thermodynamic Study
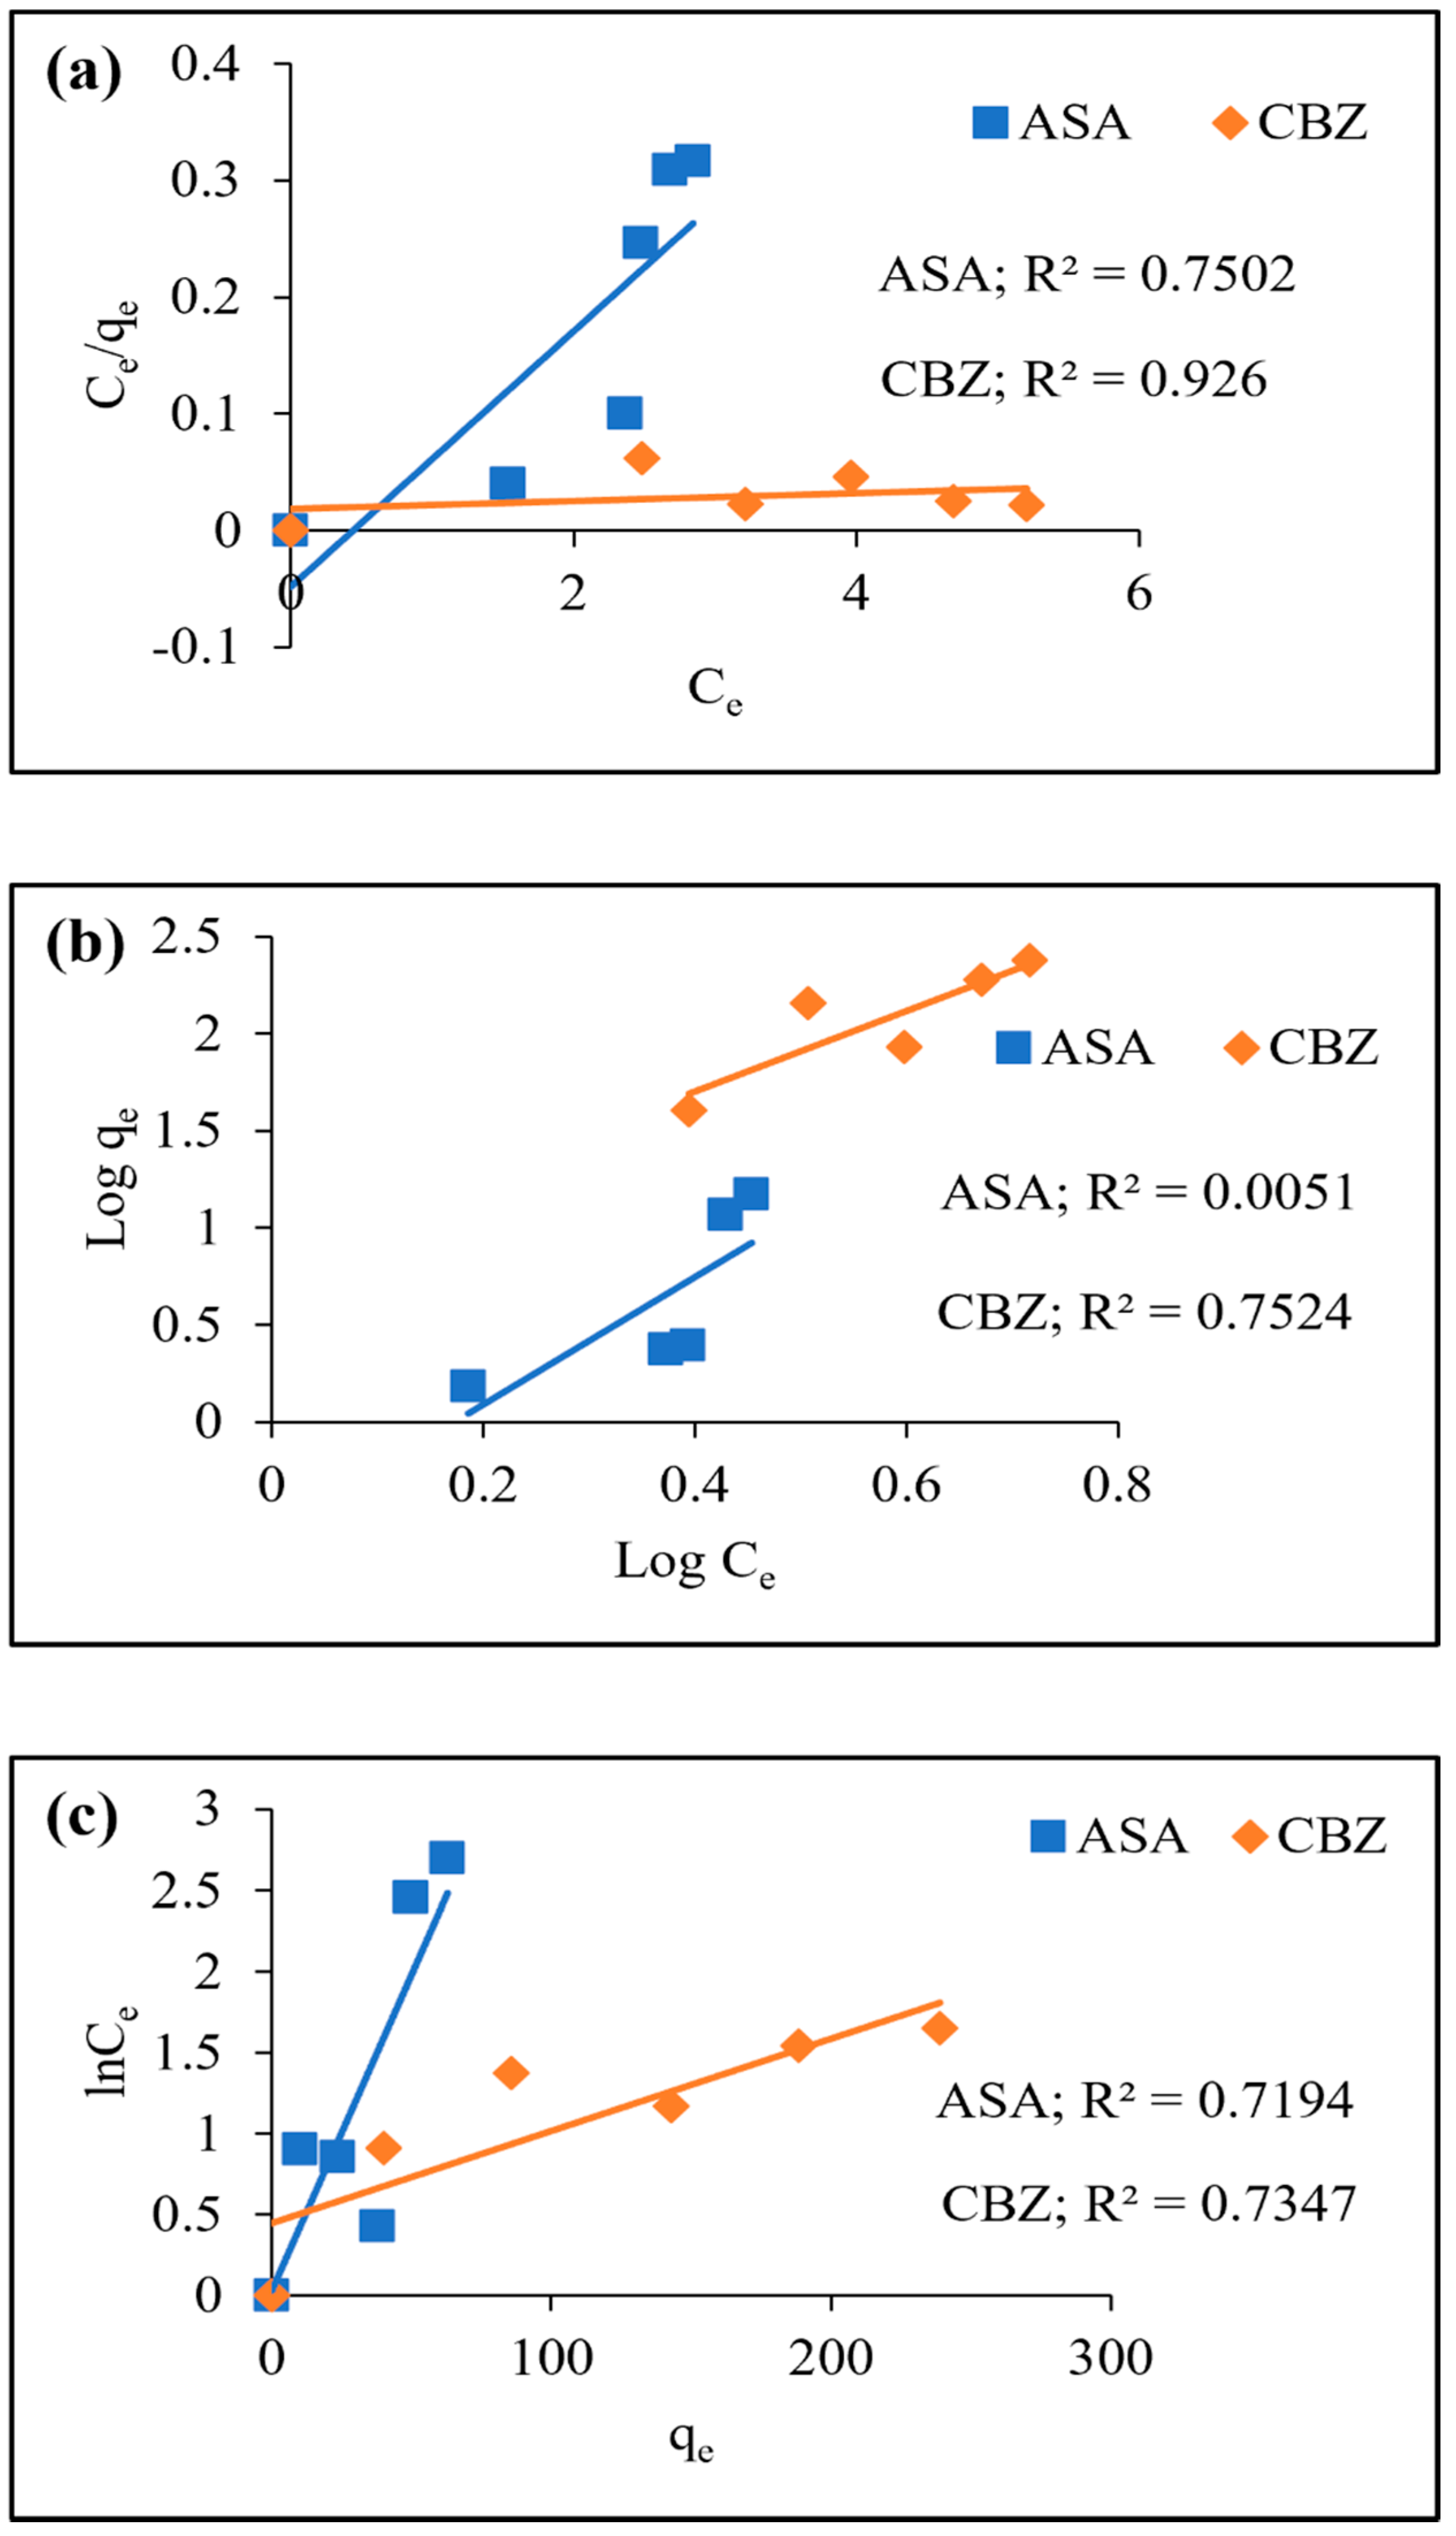
3.5. Adsorption Isotherms
3.5.1. Langmuir Isotherm
3.5.2. Freundlich Isotherm
3.5.3. Temkin Isotherm
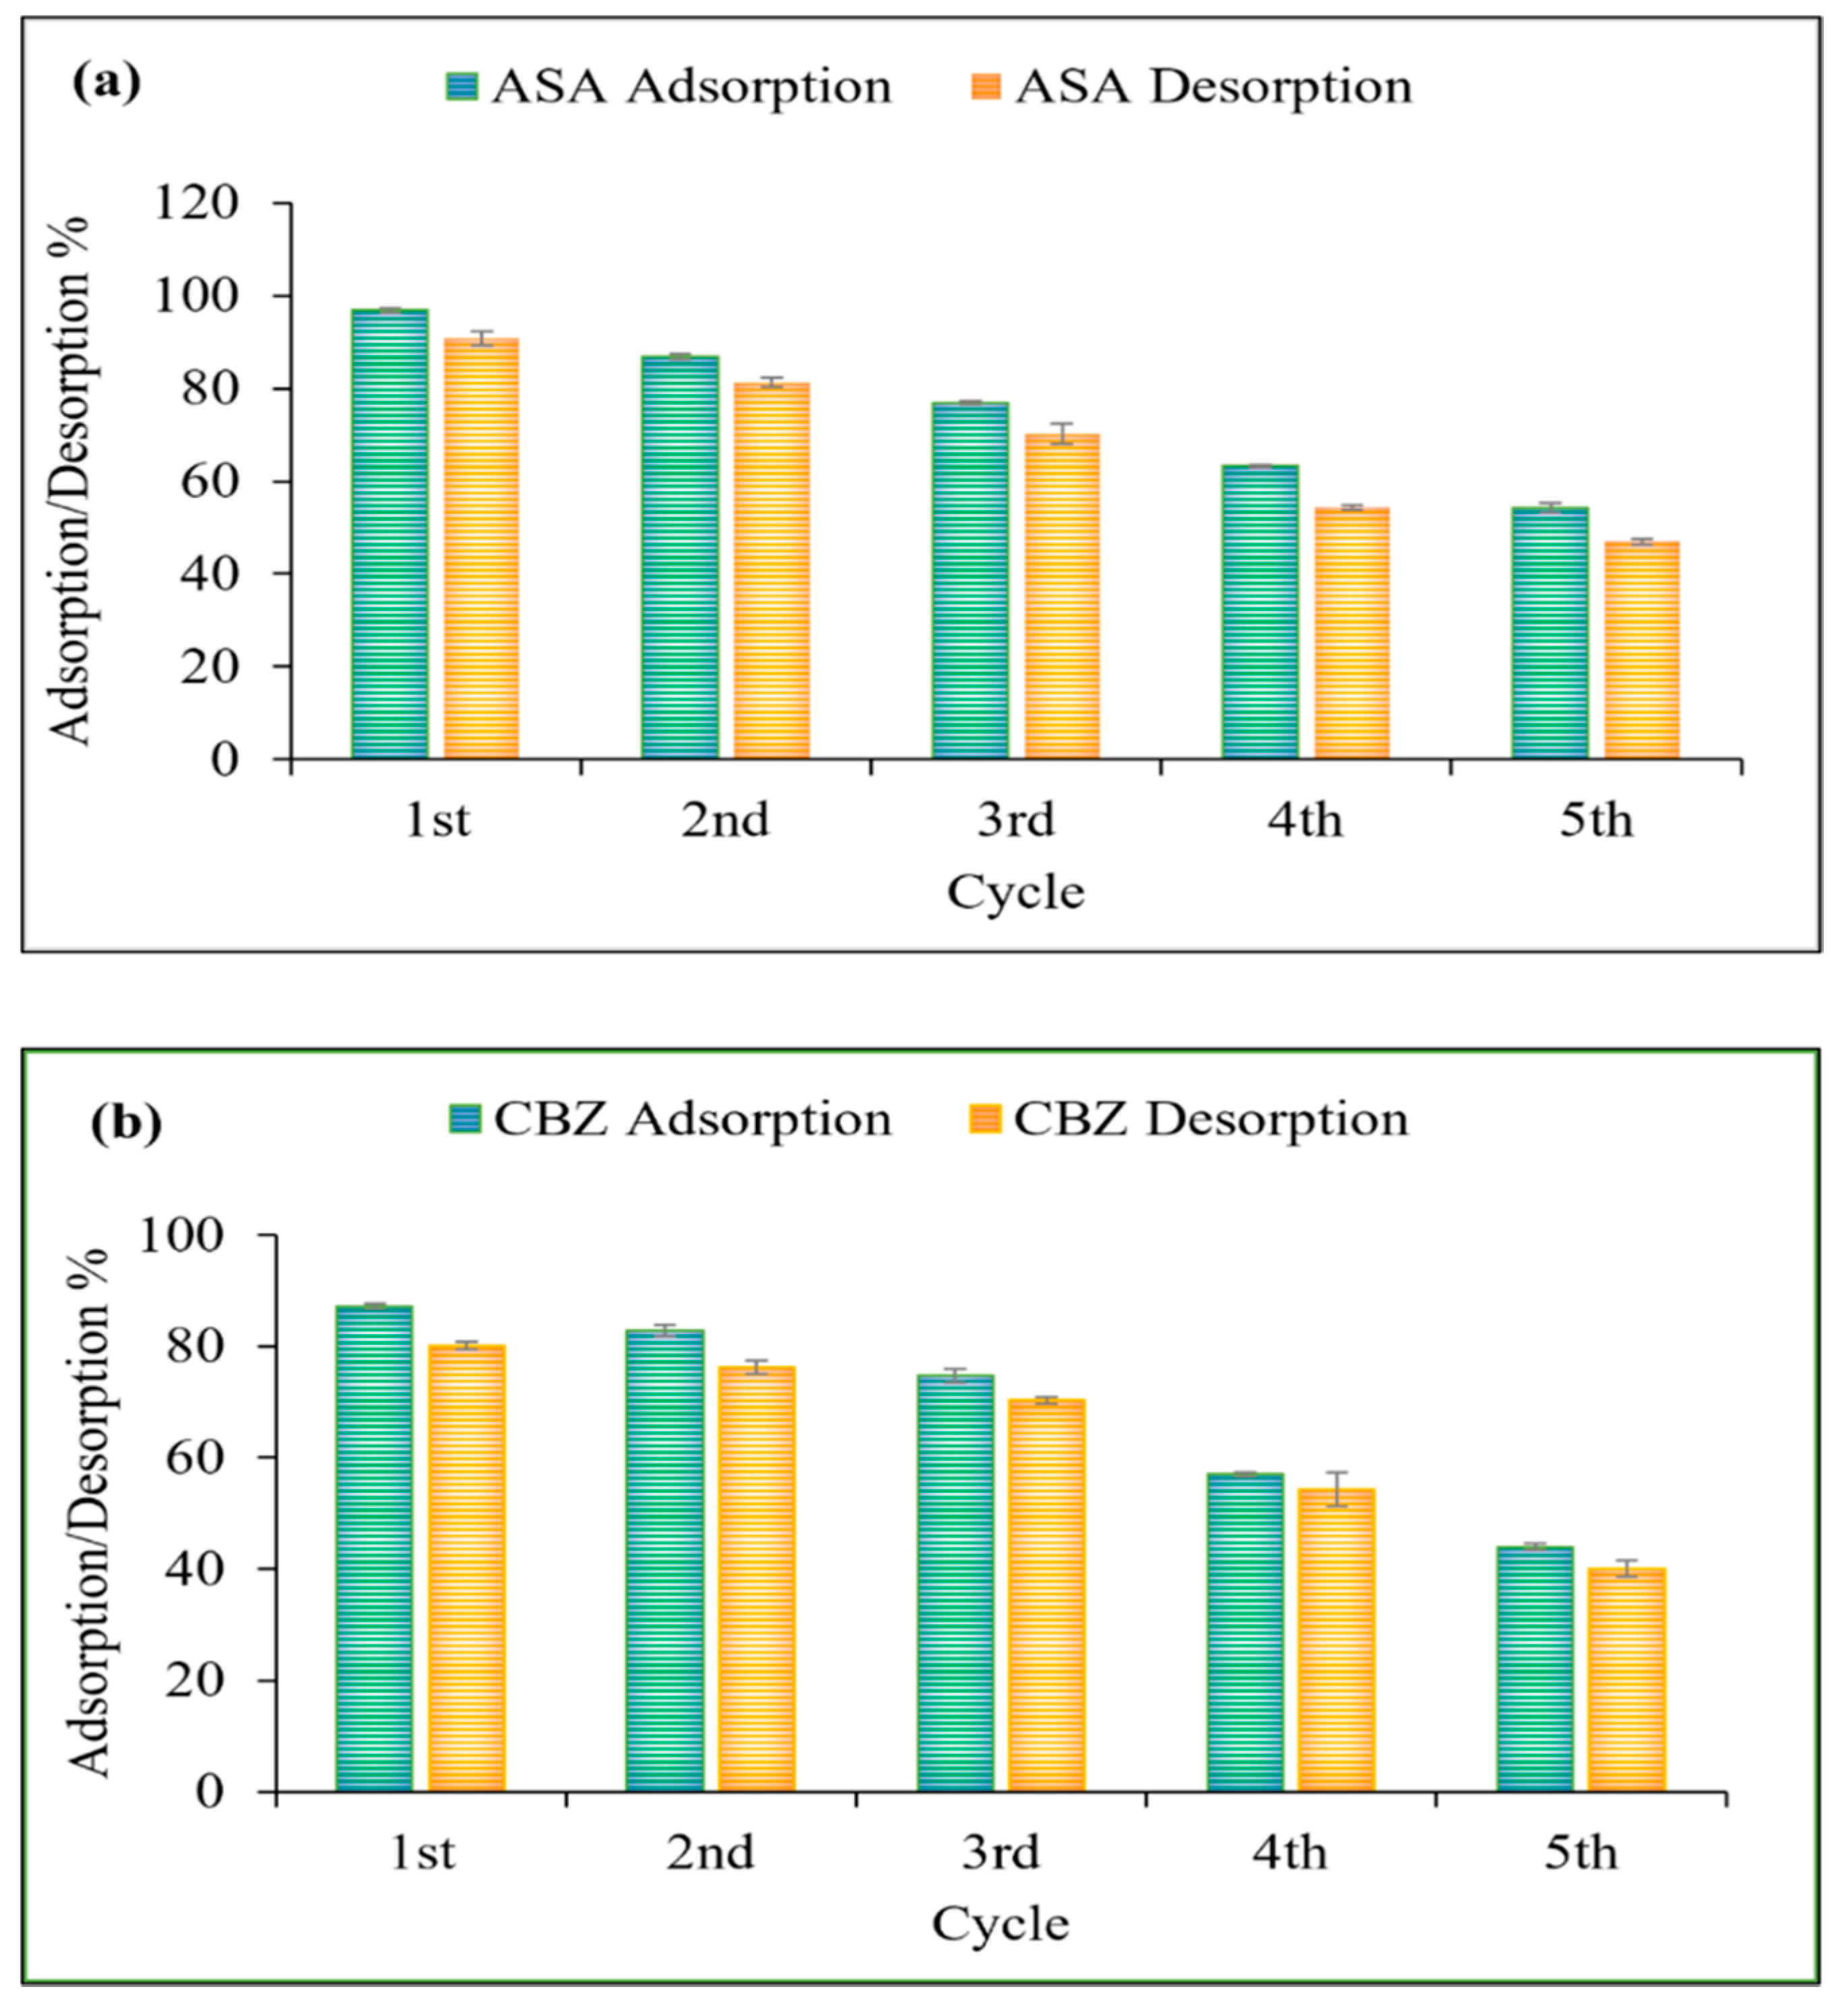
3.6. Reusability of BC-CS@nZVI
3.7. Comparison with Other Adsorbents
3.8. Application in Real Water Samples
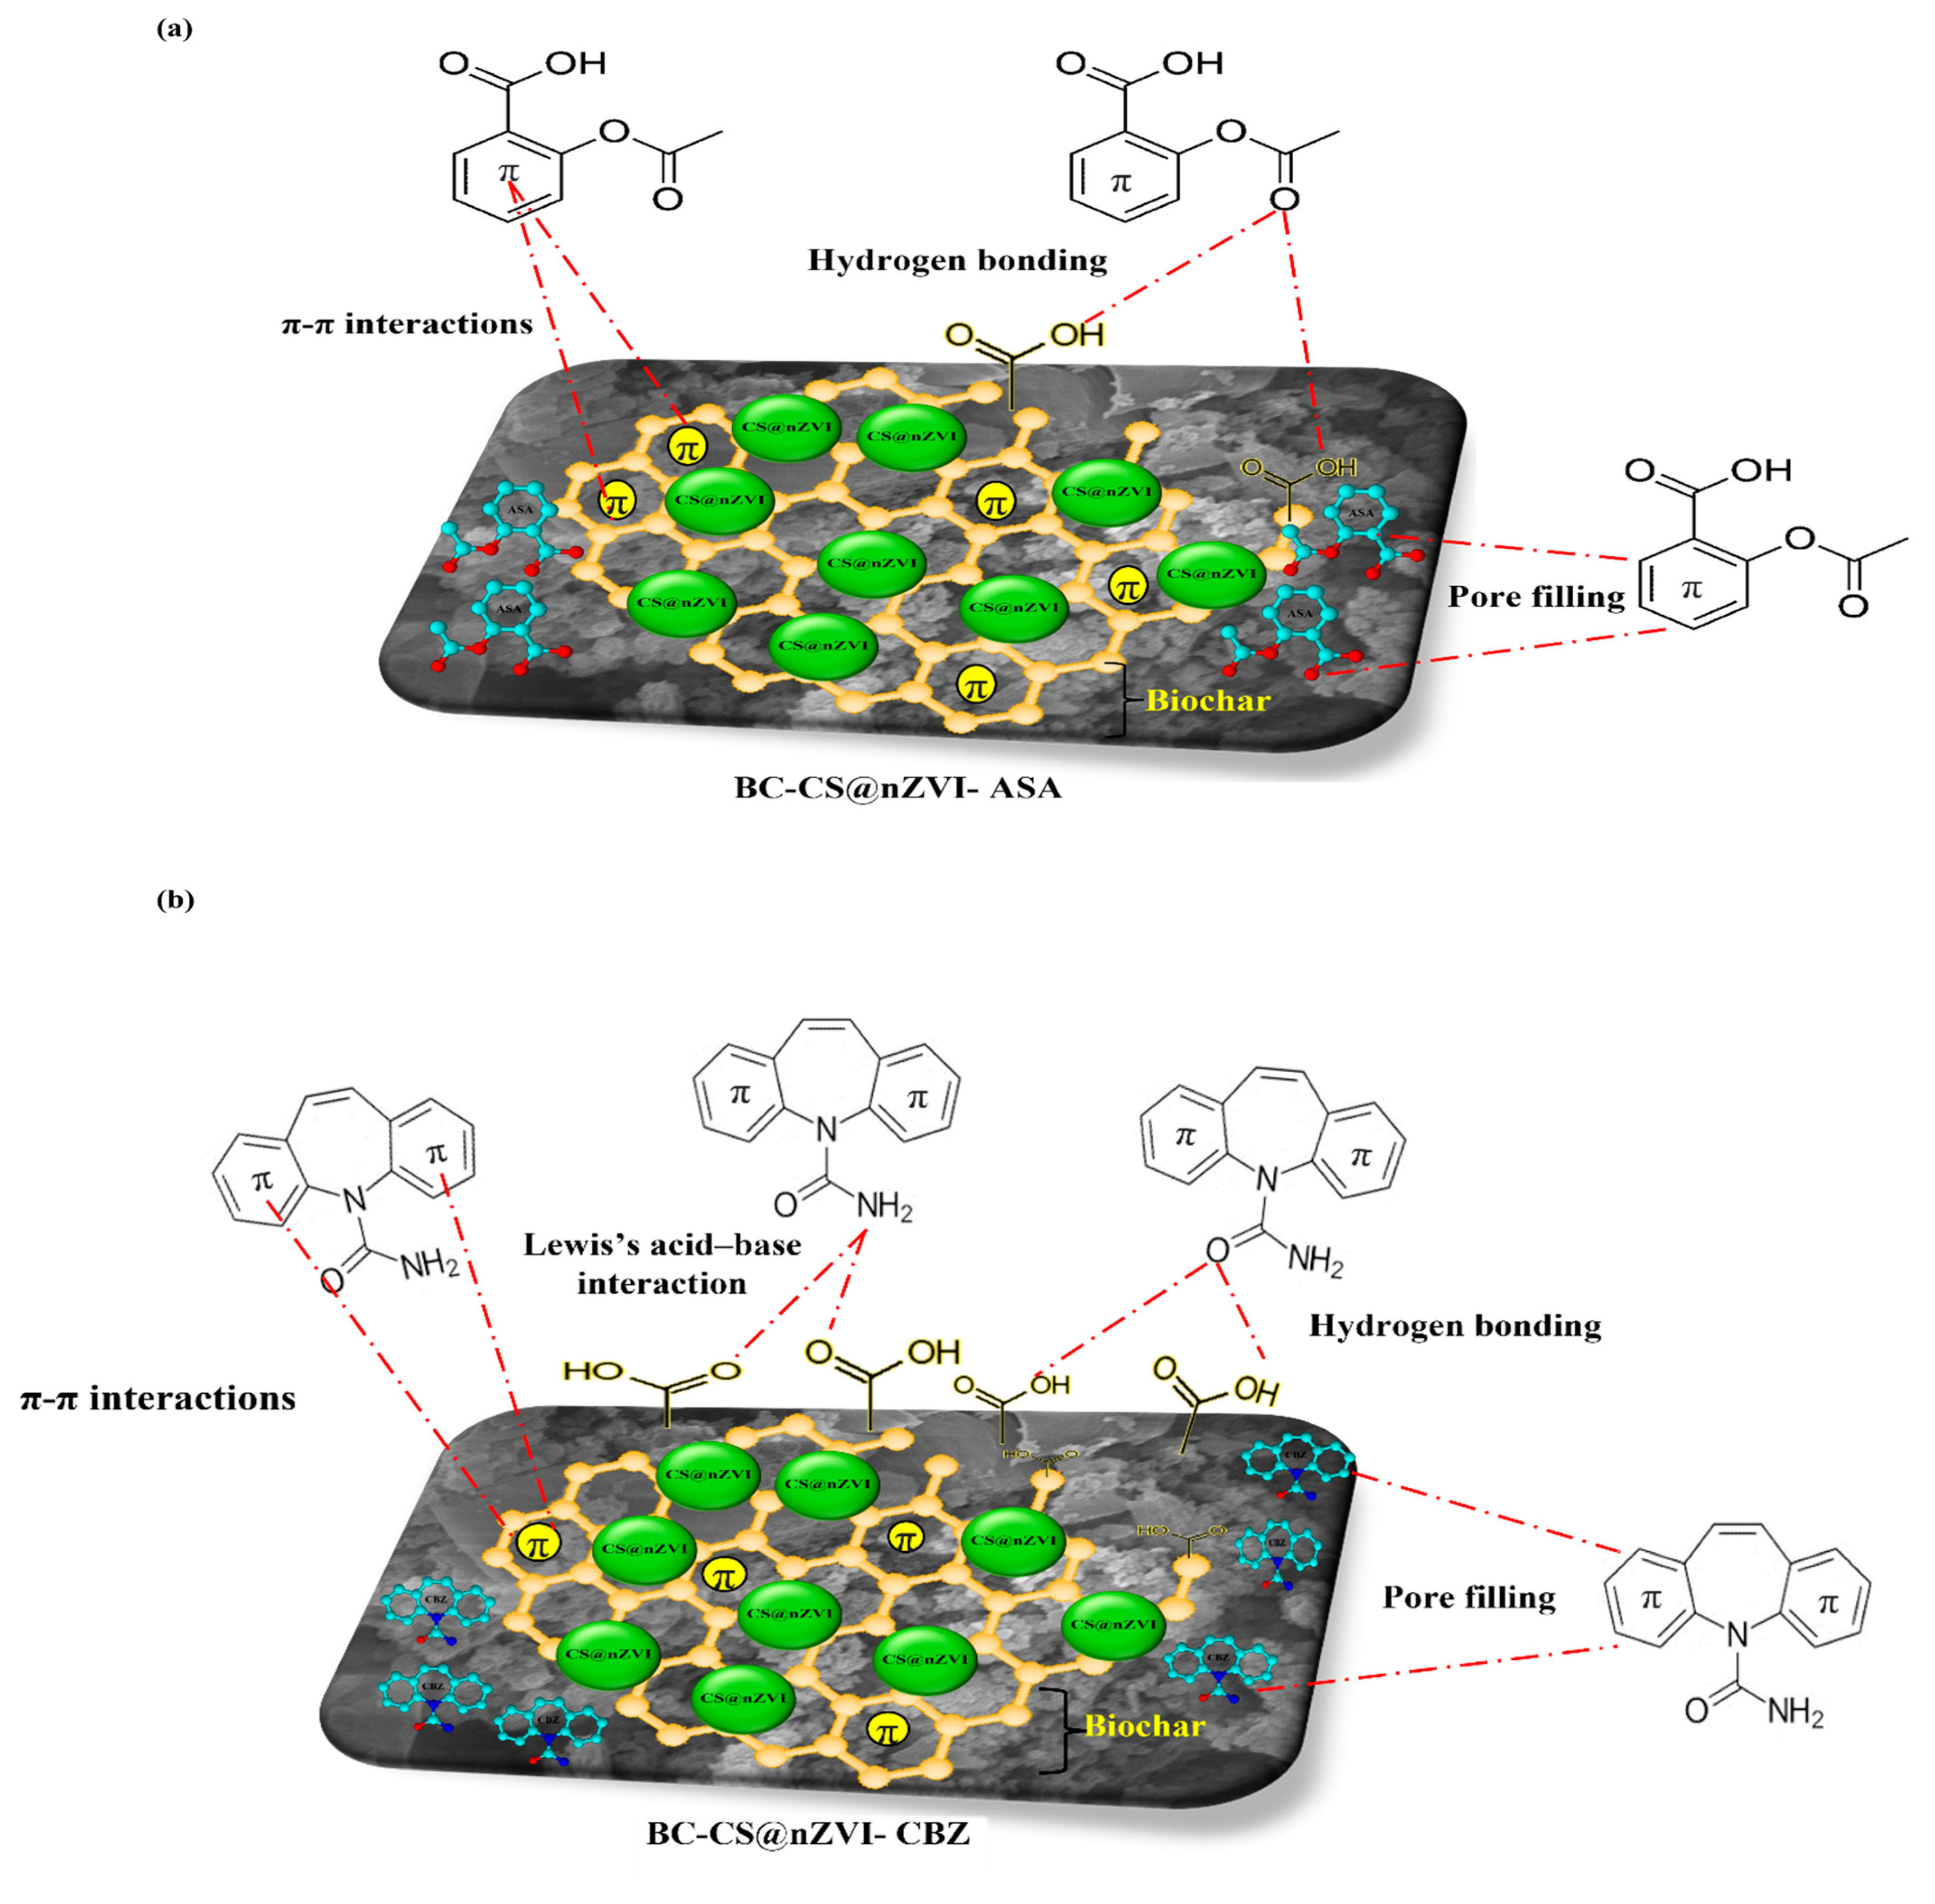
3.9. Mechanisms of ASA and CBZ Removal by BC-CS@nZVI

| S.No. | Adsorbent | Adsorbate | Adsorption Capacity (mg/g or R%) | References |
|---|---|---|---|---|
| 1. | Pinewood-derived nano biochar | CBZ | 74 μg/g | [90] |
| 2. | Bimetallic nano zero-valent Fe/Cu | CBZ | 26.15 | [92] |
| 3. | Granular carbon nanotubes (CNTs)/alumina (Al2O3) hybrid | CBZ | 157.4 μmol/g | [93] |
| 4. | UiO-66 (Universitetet i Oslo)// Graphene nanoplatelet (GNP)/UiO-66 composites | CBZ | 16.69 mg/g/ 51.17 mg/g | [7] |
| 5. | Upconversion particles (UCNPs@MIP) coated with new molecular-imprinted polymer | CBZ | 2.23 mg/g | [14] |
| 6. | UV/ZnO | ASA | 83.11% | [13] |
| 7. | Magnetite nanoparticle immobilization on a carbon felt cathode | ASA | 94.3% | [12] |
| 8. | 500 °C-calcinated nanosheets (TiO2-BNSs-500) | ASA | 87.8% | [5] |
| 9. | Rice hull activated carbon | ASA | 95.42% | [66] |
| 10. | Graphene nanoplatelets | ASA | 94.3% | [95] |
| 11. | Biochar-supported chitosan-modified nanoscale zero-valent iron (BC-CS@nZVI) | ASA CBZ | 97.8% (20.62 mg/g) 89.32% (55.25 mg/g) | Present study |
4. Conclusions
Author Contributions
Funding
Data Availability Statement
Acknowledgments
Conflicts of Interest
References
- Ebele, A.J.; Abou-Elwafa Abdallah, M.; Harrad, S. Pharmaceuticals and personal care products (PPCPs) in the freshwater aquatic environment. Emerg. Contam. 2017, 3, 1–16. [Google Scholar] [CrossRef]
- Karimi-Maleh, H.; Ayati, A.; Davoodi, R.; Tanhaei, B.; Karimi, F.; Malekmohammadi, S.; Orooji, Y.; Fu, L.; Sillanpää, M. Recent advances in using of chitosan-based adsorbents for removal of pharmaceutical contaminants: A review. J. Clean. Prod. 2021, 291, 125880. [Google Scholar] [CrossRef]
- Ma, N.; Liu, X.W.; Yang, Y.J.; Li, J.Y.; Mohamed, I.; Liu, G.R.; Zhang, J.Y. Preventive Effect of Aspirin Eugenol Ester on Thrombosis in κ-Carrageenan-Induced Rat Tail Thrombosis Model. PLoS ONE 2015, 10, e0133125. [Google Scholar] [CrossRef] [PubMed]
- Adebayo, G.I.; Williams, J.; Healy, S. Aspirin esterase activity—Evidence for skewed distribution in healthy volunteers. Eur. J. Intern. Med. 2007, 18, 299–303. [Google Scholar] [CrossRef] [PubMed]
- Li, D.; Cheng, X.; Yu, X.; Xing, Z. Preparation and characterization of TiO2-based nanosheets for photocatalytic degradation of acetylsalicylic acid: Influence of calcination temperature. Chem. Eng. J. 2015, 279, 994–1003. [Google Scholar] [CrossRef]
- Gierbolini, J.; Giarratano, M.; Benbadis, S.R. Carbamazepine-related antiepileptic drugs for the treatment of epilepsy-a comparative review. Expert Opin. Pharmacother. 2016, 17, 885–888. [Google Scholar] [CrossRef] [PubMed]
- ElHussein, E.A.A.; Şahin, S.; Bayazit, Ş.S. Removal of carbamazepine using UiO-66 and UiO-66/graphene nanoplatelet composite. J. Environ. Chem. Eng. 2020, 8, 103898. [Google Scholar] [CrossRef]
- Almeida, C. Overview of Sample Preparation and Chromatographic Methods to Analysis Pharmaceutical Active Compounds in Waters Matrices. Separations 2021, 8, 16. [Google Scholar] [CrossRef]
- Clara, M.; Strenn, B.; Kreuzinger, N. Carbamazepine as a possible anthropogenic marker in the aquatic environment: Investigations on the behaviour of Carbamazepine in wastewater treatment and during groundwater infiltration. Water Res. 2004, 38, 947–954. [Google Scholar] [CrossRef]
- Ginebreda, A.; Muñoz, I.; de Alda, M.L.; Brix, R.; López-Doval, J.; Barceló, D. Environmental risk assessment of pharmaceuticals in rivers: Relationships between hazard indexes and aquatic macroinvertebrate diversity indexes in the Llobregat River (NE Spain). Environ. Int. 2010, 36, 153–162. [Google Scholar] [CrossRef]
- Vieno, N.M.; Härkki, H.; Tuhkanen, T.; Kronberg, L. Occurrence of pharmaceuticals in river water and their elimination in a pilot-scale drinking water treatment plant. Environ. Sci. Technol. 2007, 41, 5077–5084. [Google Scholar] [CrossRef] [PubMed]
- Muzenda, C.; Arotiba, O.A. Improved Magnetite Nanoparticle Immobilization on a Carbon Felt Cathode in the Heterogeneous Electro-Fenton Degradation of Aspirin in Wastewater. ACS Omega 2022, 7, 19261–19269. [Google Scholar] [CrossRef] [PubMed]
- Karimi, P.; Baneshi, M.M.; Malakootian, M. Photocatalytic degradation of aspirin from aqueous solutions using the UV/ZnO process: Modelling, analysis and optimization by response surface methodology (RSM). Desalination Water Treat. 2019, 161, 354–364. [Google Scholar] [CrossRef]
- Elmasry, M.R.; Tawfik, S.M.; Kattaev, N.; Lee, Y.-I. Ultrasensitive detection and removal of carbamazepine in wastewater using UCNPs functionalized with thin-shell MIPs. Microchem. J. 2021, 170, 106674. [Google Scholar] [CrossRef]
- Liu, K.; Yu, J.C.-C.; Dong, H.; Wu, J.C.S.; Hoffmann, M.R. Degradation and Mineralization of Carbamazepine Using an Electro-Fenton Reaction Catalyzed by Magnetite Nanoparticles Fixed on an Electrocatalytic Carbon Fiber Textile Cathode. Environ. Sci. Technol. 2018, 52, 12667–12674. [Google Scholar] [CrossRef]
- Ngeno, E.C.; Mbuci, K.E.; Necibi, M.C.; Shikuku, V.O.; Olisah, C.; Ongulu, R.; Matovu, H.; Ssebugere, P.; Abushaban, A.; Sillanpää, M. Sustainable re-utilization of waste materials as adsorbents for water and wastewater treatment in Africa: Recent studies, research gaps, and way forward for emerging economies. Environ. Adv. 2022, 9, 100282. [Google Scholar] [CrossRef]
- Kyzas, G.Z.; Kostoglou, M. Green Adsorbents for Wastewaters: A Critical Review. Materials 2014, 7, 333–364. [Google Scholar] [CrossRef]
- Dai, Y.; Sun, Q.; Wang, W.; Lu, L.; Liu, M.; Li, J.; Yang, S.; Sun, Y.; Zhang, K.; Xu, J.; et al. Utilizations of agricultural waste as adsorbent for the removal of contaminants: A review. Chemosphere 2018, 211, 235–253. [Google Scholar] [CrossRef]
- Sulyman, M.; Namiesnik, J.; Gierak, A. Low-cost Adsorbents Derived from Agricultural By-products/Wastes for Enhancing Contaminant Uptakes from Wastewater: A Review. Pol. J. Environ. Stud. 2017, 26, 479–510. [Google Scholar] [CrossRef]
- Mpatani, F.M.; Kombo, U.M.; Kheir, K.R.; Nassor, N.K.; Joshua, D.; Mussa, S.S.; Mohamed, S.A.; Mbarak, S.A.; Hamad, A.S.; Ahmada, S.A. Impregnation of Silver Nanoparticles onto Polymers Based on Sugarcane Bagasse for the Remediation of Endocrine Disruptor–Bisphenol A from Water. Adsorpt. Sci. Technol. 2022, 2022, 4997205. [Google Scholar] [CrossRef]
- Aruna; Bagotia, N.; Sharma, A.K.; Kumar, S. A review on modified sugarcane bagasse biosorbent for removal of dyes. Chemosphere 2021, 268, 129309. [Google Scholar] [CrossRef] [PubMed]
- Amusat, S.O.; Kebede, T.G.; Dube, S.; Nindi, M.M. Ball-milling synthesis of biochar and biochar–based nanocomposites and prospects for removal of emerging contaminants: A review. J. Water Process Eng. 2021, 41, 101993. [Google Scholar] [CrossRef]
- Kang, Z.; Jia, X.; Zhang, Y.; Kang, X.; Ge, M.; Liu, D.; Wang, C.; He, Z. A Review on Application of Biochar in the Removal of Pharmaceutical Pollutants through Adsorption and Persulfate-Based AOPs. Sustainability 2022, 14, 10128. [Google Scholar] [CrossRef]
- Singh, M.; Ahsan, M.; Pandey, V.; Singh, A.; Mishra, D.; Tiwari, N.; Singh, P.; Karak, T.; Khare, P. Comparative assessment for removal of anionic dye from water by different waste-derived biochar vis a vis reusability of generated sludge. Biochar 2022, 4, 13. [Google Scholar] [CrossRef]
- Gholami, P.; Khataee, A.; Soltani, R.; Dinpazhoh, L.; Bhatnagar, A. Photocatalytic degradation of gemifloxacin antibiotic using Zn-Co-LDH@biochar nanocomposite. J. Hazard. Mater. 2019, 382, 121070. [Google Scholar] [CrossRef]
- El-Shafie, A.S.; Ahsan, I.; Radhwani, M.; Al-Khangi, M.A.; El-Azazy, M. Synthesis and Application of Cobalt Oxide (Co3O4)-Impregnated Olive Stones Biochar for the Removal of Rifampicin and Tigecycline: Multivariate Controlled Performance. Nanomaterials 2022, 12, 379. [Google Scholar] [CrossRef]
- Chakhtouna, H.; Benzeid, H.; Zari, N.; el kacem Qaiss, A.; Bouhfid, R. Functional CoFe2O4-modified biochar derived from banana pseudostem as an efficient adsorbent for the removal of amoxicillin from water. Sep. Purif. Technol. 2021, 266, 118592. [Google Scholar] [CrossRef]
- Jiang, Z.; Wei, J.; Zhang, Y.; Niu, X.; Li, J.; Li, Y.; Pan, G.; Xu, M.; Cui, X.; Cui, N.; et al. Electron transfer mechanism mediated nitrogen-enriched biochar encapsulated cobalt nanoparticles catalyst as an effective persulfate activator for doxycycline removal. J. Clean. Prod. 2023, 384, 135641. [Google Scholar] [CrossRef]
- Chen, L.; Li, F.; Wei, Y.; Li, G.; Shen, K.; He, H.-J. High cadmium adsorption on nanoscale zero-valent iron coated Eichhornia crassipes biochar. Environ. Chem. Lett. 2019, 17, 589–594. [Google Scholar] [CrossRef]
- Zou, Y.; Wang, X.; Khan, A.; Wang, P.; Liu, Y.; Alsaedi, A.; Hayat, T.; Wang, X. Environmental Remediation and Application of Nanoscale Zero-Valent Iron and Its Composites for the Removal of Heavy Metal Ions: A Review. Environ. Sci. Technol. 2016, 50, 7290–7304. [Google Scholar] [CrossRef]
- Yoadsomsuay, T.; Grisdanurak, N.; Liao, C.H. Influence of chitosan on modified nanoscale zero-valent iron for arsenate removal. Desalination Water Treat. 2016, 57, 17861–17869. [Google Scholar] [CrossRef]
- Kumari, N.; Behera, M.; Singh, R. Facile synthesis of biopolymer decorated magnetic coreshells for enhanced removal of xenobiotic azo dyes through experimental modelling. Food Chem. Toxicol. Int. J. Publ. Br. Ind. Biol. Res. Assoc. 2023, 171, 113518. [Google Scholar] [CrossRef] [PubMed]
- Mustafa, S.; Dilara, B.; Nargis, K.; Naeem, A.; Shahida, P. Surface properties of the mixed oxides of iron and silica. Colloids Surf. A Physicochem. Eng. Aspects 2002, 205, 273–282. [Google Scholar] [CrossRef]
- Garg, U.K.; Kaur, M.P.; Garg, V.K.; Sud, D. Removal of nickel (II) from aqueous solution by adsorption on agricultural waste biomass using a response surface methodological approach. Bioresour. Technol. 2008, 99, 1325–1331. [Google Scholar] [CrossRef] [PubMed]
- Ciğeroğlu, Z.; Küçükyıldız, G.; Erim, B.; Alp, E. Easy preparation of magnetic nanoparticles-rGO-chitosan composite beads: Optimization study on cefixime removal based on RSM and ANN by using Genetic Algorithm Approach. J. Mol. Struct. 2021, 1224, 129182. [Google Scholar] [CrossRef]
- Khoshnamvand, N.; Kord Mostafapour, F.; Mohammadi, A.; Faraji, M.J.A.E. Response surface methodology (RSM) modeling to improve removal of ciprofloxacin from aqueous solutions in photocatalytic process using copper oxide nanoparticles (CuO/UV). AMB Express 2018, 8, 48. [Google Scholar] [CrossRef]
- Dash, A.R.; Lakhani, A.J.; Devi Priya, D.; Surendra, T.; Khan, M.M.R.; Samuel, E.; Roopan, S.M. Green Synthesis of Stannic Oxide Nanoparticles for Ciprofloxacin Degradation: Optimization and Modelling Using a Response Surface Methodology (RSM) Based on the Box–Behnken Design. J. Clust. Sci. 2023, 34, 121–133. [Google Scholar] [CrossRef]
- Dey, S.; Al-Amin, M.; Rashid, T.; Sultan, Z.; Ashaduzzaman, M.; Sarker, M.; Shamsuddin, S. Preparation, characterization and performance evaluation of chitosan as an adsorbent for remazol red. Int. J. Latest Res. Eng. Technol. 2016, 2, 52–62. [Google Scholar]
- Hao, G.; Hu, Y.; Shi, L.; Chen, J.; Cui, A.; Weng, W.; Osako, K. Physicochemical characteristics of chitosan from swimming crab (Portunus trituberculatus) shells prepared by subcritical water pretreatment. Sci. Rep. 2021, 11, 1646. [Google Scholar] [CrossRef]
- Cui, L.; Wei, X.; Li, J.; Chang, G.; Huang, X.; Han, D. Structure and Saccharification of Sugarcane Bagasse Pretreated with Acid Coupled Alkaline. In International Symposium on Mechanical Engineering and Material Science (ISMEMS 2017); Atlantis Press: Amsterdam, The Netherlands, 2017; pp. 104–107. [Google Scholar]
- Shikuku, V.; Jemutai-Kimosop, S. Efficient Removal of Sulfamethoxazole onto Sugarcane Bagasse-derived Biochar: Two and Three-parameter Isotherms, Kinetics and Thermodynamics. S. Afr. J. Chem. Suid Afrik. Tydskr. Vir Chem. 2020, 73, 111–119. [Google Scholar]
- Elshafai, M.; Hamdy, A.; Hefny, M. Zero-valent iron nanostructures: Synthesis, characterization and application. J. Environ. Biotechnol 2018, 7, 1–10. [Google Scholar]
- Wang, Y.-Y.; You, L.-C.; Lyu, H.-H.; Liu, Y.-X.; He, L.-L.; Hu, Y.-D.; Luo, F.-C.; Yang, S.-M. Role of biochar–mineral composite amendment on the immobilization of heavy metals for Brassica chinensis from naturally contaminated soil. Environ. Technol. Innov. 2022, 28, 102622. [Google Scholar] [CrossRef]
- Bagbi, Y.; Sarswat, A.; Tiwari, S.; Mohn, D.; Pandey, A.; R Solanki, P. Nanoscale zero-valent iron for aqueous lead removal. Adv. Mater. Proc. 2017, 2, 235–241. [Google Scholar]
- Sun, L.; Chen, D.; Wan, S.; Yu, Z. Adsorption studies of dimetridazole and metronidazole onto biochar derived from sugarcane bagasse: Kinetic, equilibrium, and mechanisms. J. Polym. Environ. 2018, 26, 765–777. [Google Scholar] [CrossRef]
- Rodier, L.; Bilba, K.; Onésippe, C.; Arsène, M.A. Utilization of bio-chars from sugarcane bagasse pyrolysis in cement-based composites. Ind. Crops Prod. 2019, 141, 111731. [Google Scholar] [CrossRef]
- Drabczyk, A.; Kudłacik-Kramarczyk, S.; Głąb, M.; Kędzierska, M.; Jaromin, A.; Mierzwiński, D.; Tyliszczak, B. Physicochemical investigations of chitosan-based hydrogels containing Aloe Vera designed for biomedical use. Materials. 2020, 13, 3073. [Google Scholar] [CrossRef]
- Xu, H.; Gao, M.; Hu, X.; Chen, Y.; Li, Y.; Xu, X.; Zhang, R.; Yang, X.; Tang, C.; Hu, X. A novel preparation of S-nZVI and its high efficient removal of Cr(VI) in aqueous solution. J. Hazard. Mater. 2021, 416, 125924. [Google Scholar] [CrossRef]
- Zheng, L.; Gao, Y.; Du, J.; Zhang, W.; Huang, Y.; Wang, L.; Zhao, Q.; Pan, X. A novel, recyclable magnetic biochar modified by chitosan–EDTA for the effective removal of Pb (II) from aqueous solution. RSC Adv. 2020, 10, 40196–40205. [Google Scholar] [CrossRef]
- Zhang, M.; Liu, Y.; Li, T.; Xu, W.; Zheng, B.; Tan, X.; Wang, H.; Guo, Y.; Guo, F.; Wang, S. Chitosan modification of magnetic biochar produced from Eichhornia crassipes for enhanced sorption of Cr(VI) from aqueous solution. RSC Adv. 2015, 5, 46955–46964. [Google Scholar] [CrossRef]
- Chen, X.L.; Li, F.; Xie, X.J.; Li, Z.; Chen, L. Nanoscale Zero-Valent Iron and Chitosan Functionalized Eichhornia crassipes Biochar for Efficient Hexavalent Chromium Removal. Int. J. Environ. Res. Public Health 2019, 16, 3046. [Google Scholar] [CrossRef]
- Wang, J.; Zheng, S.; Shao, Y.; Liu, J.; Xu, Z.; Zhu, D. Amino-functionalized Fe3O4@SiO2 core–shell magnetic nanomaterial as a novel adsorbent for aqueous heavy metals removal. J. Colloid Interface Sci. 2010, 349, 293–299. [Google Scholar] [CrossRef] [PubMed]
- Castañeda Ramírez, A.A.; Rojas García, E.; López Medina, R.; Larios, J.L.C.; Suárez Parra, R.; Maubert Franco, A.M. Selective Adsorption of Aqueous Diclofenac Sodium, Naproxen Sodium, and Ibuprofen Using a Stable Fe(3)O(4)-FeBTC Metal-Organic Frameworka. Materials 2021, 14, 2293. [Google Scholar] [CrossRef] [PubMed]
- Ahmaruzzaman, M. Biochar based nanocomposites for photocatalytic degradation of emerging organic pollutants from water and wastewater. Mater. Res. Bull. 2021, 140, 111262. [Google Scholar] [CrossRef]
- Chausali, N.; Saxena, J.; Prasad, R. Nanobiochar and biochar based nanocomposites: Advances and applications. J. Agric. Food Res. 2021, 5, 100191. [Google Scholar] [CrossRef]
- Chen, Z.; Wang, T.; Jin, X.; Chen, Z.; Megharaj, M.; Naidu, R. Multifunctional kaolinite-supported nanoscale zero-valent iron used for the adsorption and degradation of crystal violet in aqueous solution. J. Colloid Interface Sci. 2013, 398, 59–66. [Google Scholar] [CrossRef] [PubMed]
- Wang, H.; Liu, R.; Chen, Q.; Mo, Y.; Zhang, Y. Biochar-supported starch/chitosan-stabilized nano-iron sulfide composites for the removal of lead ions and nitrogen from aqueous solutions. Bioresour. Technol. 2022, 347, 126700. [Google Scholar] [CrossRef]
- Chen, G.; Wang, H.; Han, L.; Yang, N.; Hu, B.; Qiu, M.; Zhong, X. Highly efficient removal of U(VI) by a novel biochar supported with FeS nanoparticles and chitosan composites. J. Mol. Liq. 2021, 327, 114807. [Google Scholar] [CrossRef]
- Yang, Y.; Zhang, Y.; Wang, G.; Yang, Z.; Xian, J.; Yang, Y.; Li, T.; Pu, Y.; Jia, Y.; Li, Y.; et al. Adsorption and reduction of Cr(VI) by a novel nanoscale FeS/chitosan/biochar composite from aqueous solution. J. Environ. Chem. Eng. 2021, 9, 105407. [Google Scholar] [CrossRef]
- Shen, Q.; Wang, Z.; Yu, Q.; Cheng, Y.; Liu, Z.; Zhang, T.; Zhou, S. Removal of tetracycline from an aqueous solution using manganese dioxide modified biochar derived from Chinese herbal medicine residues. Environ. Res. 2020, 183, 109195. [Google Scholar] [CrossRef]
- Behera, M.; Kumari, N.; Raza, K.; Singh, R. Fabrication of glutathione functionalized self-assembled magnetite nanochains for effective removal of crystal violet and phenol red dye from aqueous matrix. Environ. Sci. Pollut. Res. 2022, 29, 72260–72278. [Google Scholar] [CrossRef]
- Mokete, R.; Eljamal, O.; Sugihara, Y. Exploration of the reactivity of nanoscale zero-valent iron (NZVI) associated nanoparticles in diverse experimental conditions. Chem. Eng. Process. Process Intensif. 2020, 150, 107879. [Google Scholar] [CrossRef]
- Ouachtak, H.; El Guerdaoui, A.; El Haouti, R.; Haounati, R.; Ighnih, H.; Toubi, Y.; Alakhras, F.; Rehman, R.; Hafid, N.; Addi, A.A.; et al. Combined molecular dynamics simulations and experimental studies of the removal of cationic dyes on the eco-friendly adsorbent of activated carbon decorated montmorillonite Mt@AC. RSC Adv. 2023, 13, 5027–5044. [Google Scholar] [CrossRef]
- Li, L.; Qiuling, M.; Wang, S.; Song, S.; Li, B.; Ruonan, G.; Cheng, X.; Cheng, Q. Photocatalytic Performance and Degradation Mechanism of Aspirin by TiO2 through Response Surface Methodology. Catalysts 2018, 8, 118. [Google Scholar] [CrossRef]
- Boushara, R.S.; Ngadi, N.; Wong, S.; Mohamud, M.Y. Removal of aspirin from aqueous solution using phosphoric acid modified coffee waste adsorbent. Mater. Today Proc. 2022, 65, 2960–2969. [Google Scholar] [CrossRef]
- Mukoko, T.; Mupa, M.; Guyo, U.; Dziike, F. Preparation of Rice Hull Activated Carbon for the Removal of Selected Pharmaceutical Waste Compounds in Hospital Effluent. J. Environ. Anal. Toxicol. 2015, S7, 008. [Google Scholar] [CrossRef]
- Rocha, L.S.; Pereira, D.; Sousa, É.; Otero, M.; Esteves, V.I.; Calisto, V. Recent advances on the development and application of magnetic activated carbon and char for the removal of pharmaceutical compounds from waters: A review. Sci. Total Environ. 2020, 718, 137272. [Google Scholar] [CrossRef]
- Shan, D.; Deng, S.; Zhao, T.; Wang, B.; Wang, Y.; Huang, J.; Yu, G.; Winglee, J.; Wiesner, M.R. Preparation of ultrafine magnetic biochar and activated carbon for pharmaceutical adsorption and subsequent degradation by ball milling. J. Hazard. Mater. 2016, 305, 156–163. [Google Scholar] [CrossRef]
- Wong, K.T.; Yoon, Y.; Snyder, S.A.; Jang, M. Phenyl-functionalized magnetic palm-based powdered activated carbon for the effective removal of selected pharmaceutical and endocrine-disruptive compounds. Chemosphere 2016, 152, 71–80. [Google Scholar] [CrossRef]
- Rajendran, K.; Sen, S. Adsorptive removal of carbamazepine using biosynthesized hematite nanoparticles. Environ. Nanotechnol. Monit. Manag. 2018, 9, 122–127. [Google Scholar] [CrossRef]
- Nezhadali, A.; Koushali, S.E.; Divsar, F. Synthesis of polypyrrole-chitosan magnetic nanocomposite for the removal of carbamazepine from wastewater: Adsorption isotherm and kinetic study. J. Environ. Chem. Eng. 2021, 9, 105648. [Google Scholar] [CrossRef]
- Shi, X.; Karachi, A.; Hosseini, M.; Yazd, M.S.; Kamyab, H.; Ebrahimi, M.; Parsaee, Z. Ultrasound wave assisted removal of Ceftriaxone sodium in aqueous media with novel nano composite g-C3N4/MWCNT/Bi2WO6 based on CCD-RSM model. Ultrason. Sonochem. 2020, 68, 104460. [Google Scholar] [CrossRef] [PubMed]
- Yousefi, M.; Gholami, M.; Oskoei, V.; Mohammadi, A.A.; Baziar, M.; Esrafili, A. Comparison of LSSVM and RSM in simulating the removal of ciprofloxacin from aqueous solutions using magnetization of functionalized multi-walled carbon nanotubes: Process optimization using GA and RSM techniques. J. Environ. Chem. Eng. 2021, 9, 105677. [Google Scholar] [CrossRef]
- Dargahi, A.; Samarghandi, M.R.; Shabanloo, A.; Mahmoudi, M.M.; Nasab, H.Z. Statistical modeling of phenolic compounds adsorption onto low-cost adsorbent prepared from aloe vera leaves wastes using CCD-RSM optimization: Effect of parameters, isotherm, and kinetic studies. Biomass Convers. Biorefin. 2021, 5, 1–15. [Google Scholar] [CrossRef]
- Saputra, E.; Muhammad, S.; Sun, H.; Ang, H.M.; Tadé, M.O.; Wang, S. Different Crystallographic One-dimensional MnO2 Nanomaterials and Their Superior Performance in Catalytic Phenol Degradation. Environ. Sci. Technol. 2013, 47, 5882–5887. [Google Scholar] [CrossRef]
- Zhang, L.; Zhao, X.; Niu, C.; Tang, N.; Guo, H.; Wen, X.; Liang, C.; Zeng, G. Enhanced activation of peroxymonosulfate by magnetic Co3MnFeO6 nanoparticles for removal of carbamazepine: Efficiency, synergetic mechanism and stability. Chem. Eng. J. 2019, 362, 851–864. [Google Scholar] [CrossRef]
- Langeroudi, M.P.; Binaeian, E. Tannin-APTES modified Fe3O4 nanoparticles as a carrier of Methotrexate drug: Kinetic, isotherm and thermodynamic studies. Mater. Chem. Phys. 2018, 218, 210–217. [Google Scholar] [CrossRef]
- Binaeian, E.; Seghatoleslami, N.; Chaichi, M.J. Synthesis of oak gall tannin-immobilized hexagonal mesoporous silicate (OGT-HMS) as a new super adsorbent for the removal of anionic dye from aqueous solution. Desalination Water Treat. 2016, 57, 8420–8436. [Google Scholar] [CrossRef]
- Akpomie, K.G.; Conradie, J. Isotherm, kinetic, thermodynamics and reusability data on the adsorption of antidepressant onto silver nanoparticle-loaded biowaste. Data Brief 2021, 39, 107575. [Google Scholar] [CrossRef]
- Ho, Y.-S. Review of second-order models for adsorption systems. J. Hazard. Mater. 2006, 136, 681–689. [Google Scholar] [CrossRef]
- Bhattacharya, S.; Banerjee, D.P.; Das, P.; Bhowal, A.; Majumdar, S.; Ghosh, P. Removal of aqueous carbamazepine using graphene oxide nanoplatelets: Process modelling and optimization. Sustain. Environ. Res. 2020, 30, 17. [Google Scholar] [CrossRef]
- Weber, W.J., Jr.; Morris, J.C. Kinetics of adsorption on carbon from solution. J. Sanit. Eng. Div. 1963, 89, 31–59. [Google Scholar] [CrossRef]
- Moreno-Marenco, A.R.; Giraldo, L.; Moreno-Piraján, J.C. Parabens Adsorption onto Activated Carbon: Relation with Chemical and Structural Properties. Molecules 2019, 24, 4313. [Google Scholar] [CrossRef]
- Moawed, E.A.; El-Shahat, M.F. Equilibrium, kinetic and thermodynamic studies of the removal of triphenyl methane dyes from wastewater using iodopolyurethane powder. J. Taibah Univ. Sci. 2016, 10, 46–55. [Google Scholar] [CrossRef]
- Zhang, L.; Zeng, Y.; Cheng, Z. Removal of heavy metal ions using chitosan and modified chitosan: A review. J. Mol. Liq. 2016, 214, 175–191. [Google Scholar] [CrossRef]
- Hadizade, G.; Binaeian, E.; Emami, M.R.S. Preparation and characterization of hexagonal mesoporous silica/polyacrylamide nanocomposite capsule (PAM-HMS) for dye removal from aqueous solutioxns. J. Mol. Liq. 2017, 238, 499–507. [Google Scholar] [CrossRef]
- Ayawei, N.; Ebelegi, A.N.; Wankasi, D. Modelling and Interpretation of Adsorption Isotherms. J. Chem. 2017, 2017, 3039817. [Google Scholar] [CrossRef]
- Teixeira, S.; Gurke, R.; Eckert, H.; Kühn, K.; Fauler, J.; Cuniberti, G. Photocatalytic degradation of pharmaceuticals present in conventional treated wastewater by nanoparticle suspensions. J. Environ. Chem. Eng. 2016, 4, 287–292. [Google Scholar] [CrossRef]
- Décima, M.A.; Marzeddu, S.; Barchiesi, M.; Di Marcantonio, C.; Chiavola, A.; Boni, M.R. A Review on the Removal of Carbamazepine from Aqueous Solution by Using Activated Carbon and Biochar. Sustainability 2021, 13, 11760. [Google Scholar] [CrossRef]
- Naghdi, M.; Taheran, M.; Pulicharla, R.; Rouissi, T.; Brar, S.K.; Verma, M.; Surampalli, R.Y. Pine-wood derived nanobiochar for removal of carbamazepine from aqueous media: Adsorption behavior and influential parameters. Arab. J. Chem. 2019, 12, 5292–5301. [Google Scholar] [CrossRef]
- Chegeni, M.; Mousavi, Z.; Soleymani, M.; Dehdashtian, S. Removal of aspirin from aqueous solutions using graphitic carbon nitride nanosheet: Theoretical and experimental studies. Diam. Relat. Mater. 2020, 101, 107621. [Google Scholar] [CrossRef]
- Abdel-Aziz, H.M.; Farag, R.S.; Abdel-Gawad, S.A. Carbamazepine Removal from Aqueous Solution by Green Synthesis Zero-Valent Iron/Cu Nanoparticles with Ficus Benjamina Leaves’ Extract. Int. J. Environ. Res. 2019, 13, 843–852. [Google Scholar] [CrossRef]
- Wei, H.; Deng, S.; Huang, Q.; Nie, Y.; Wang, B.; Huang, J.; Yu, G. Regenerable granular carbon nanotubes/alumina hybrid adsorbents for diclofenac sodium and carbamazepine removal from aqueous solution. Water Res. 2013, 47, 4139–4147. [Google Scholar] [CrossRef] [PubMed]
- Ji, L.; Chen, W.; Duan, L.; Zhu, D. Mechanisms for strong adsorption of tetracycline to carbon nanotubes: A comparative study using activated carbon and graphite as adsorbents. Environ. Sci. Technol. 2009, 43, 2322–2327. [Google Scholar] [CrossRef] [PubMed]
- Al-Khateeb, L.A.; Almotiry, S.; Salam, M.A. Adsorption of pharmaceutical pollutants onto graphene nanoplatelets. Chem. Eng. J. 2014, 248, 191–199. [Google Scholar] [CrossRef]


| S.No. | Property | ASA | CBZ |
|---|---|---|---|
| 1. | Molar mass | 180.16 g/mol | 236.27 g/mol |
| 2. | pKa | 3.49 | 15.96 |
| 3. | Solubility | <1 mg/mL | >35.4 ug/mL |
| 4. | Density | 1.4 ± 0.1 g/cm³ | 1.3 ± 0.1 g/cm3 |
| 5. | Boiling point | 140 °C | 411.0 ± 48.0 °C |
| Independent Variable | Units | Symbol | Coded Levels | |||
|---|---|---|---|---|---|---|
| −alpha | −1 | +1 | +alpha | |||
| Drug concentration | ppm | A | 10.00 | 20.00 | 40.00 | 50.00 |
| Contact time | min | B | 20.00 | 40.00 | 80.00 | 100.00 |
| pH | … | C | 2.00 | 4.00 | 8.00 | 10.00 |
| Adsorbent dose | g | D | 0.025 | 0.05 | 0.1 | 0.125 |
| Temperature | °C | E | 30.00 | 40.00 | 60.00 | 70.00 |
| S. NO. | % REMOVAL | ||||||||
|---|---|---|---|---|---|---|---|---|---|
| Drug Concentration (ppm) | Time (min) | pH | Adsorbent Dose (g) | Temperature (°C) | ASA | CBZ | |||
| Expt. | Pred. | Expt. | Pred. | ||||||
| 1 | 40 | 80 | 8 | 0.1 | 60 | 54 | 55.32 | 64.27 | 65.35 |
| 2 | 40 | 40 | 4 | 0.1 | 60 | 85.32 | 85.67 | 50.2 | 51.40 |
| 3 | 20 | 80 | 8 | 0.1 | 40 | 65 | 65.97 | 70.28 | 71.66 |
| 4 | 40 | 40 | 4 | 0.05 | 40 | 75.98 | 76.01 | 40.36 | 41.38 |
| 5 | 20 | 80 | 4 | 0.1 | 60 | 96.2 | 96.06 | 47.33 | 48.43 |
| 6 | 20 | 80 | 4 | 0.05 | 40 | 91.3 | 90.84 | 42.53 | 43.45 |
| 7 | 30 | 60 | 6 | 0.075 | 30 | 77.61 | 76.61 | 76.39 | 73.76 |
| 8 | 20 | 40 | 8 | 0.05 | 40 | 41.6 | 42.39 | 70.96 | 72.08 |
| 9 | 30 | 60 | 6 | 0.075 | 50 | 76.21 | 69.53 | 88.56 | 88.19 |
| 10 | 40 | 40 | 8 | 0.1 | 40 | 49 | 50.46 | 66.05 | 67.53 |
| 11 | 30 | 60 | 6 | 0.075 | 70 | 77.812 | 76.80 | 82.21 | 80.52 |
| 12 | 30 | 60 | 6 | 0.125 | 50 | 78 | 76.35 | 76.23 | 73.24 |
| 13 | 20 | 40 | 8 | 0.1 | 60 | 55.21 | 56.33 | 76.29 | 77.60 |
| 14 | 30 | 60 | 6 | 0.075 | 50 | 65 | 69.53 | 88.39 | 88.19 |
| 15 | 30 | 60 | 6 | 0.025 | 50 | 58.32 | 57.96 | 77.96 | 76.64 |
| 16 | 30 | 20 | 6 | 0.075 | 50 | 60.56 | 59.26 | 78.65 | 76.16 |
| 17 | 30 | 60 | 6 | 0.075 | 50 | 65.2 | 69.53 | 89.32 | 88.19 |
| 18 | 40 | 40 | 8 | 0.05 | 60 | 38 | 39.14 | 78.69 | 79.51 |
| 19 | 30 | 60 | 6 | 0.075 | 50 | 70.8 | 69.53 | 88.21 | 88.19 |
| 20 | 30 | 60 | 10 | 0.075 | 50 | 33.84 | 30.61 | 69.2 | 66.95 |
| 21 | 10 | 60 | 6 | 0.075 | 50 | 75.25 | 74.94 | 75.2 | 72.91 |
| 22 | 20 | 80 | 8 | 0.05 | 60 | 52 | 52.65 | 83.21 | 83.94 |
| 23 | 50 | 60 | 6 | 0.075 | 50 | 62.8 | 61.10 | 71.32 | 69.29 |
| 24 | 40 | 80 | 4 | 0.1 | 40 | 85 | 85.21 | 62.98 | 64.25 |
| 25 | 30 | 60 | 2 | 0.075 | 50 | 97.89 | 99.11 | 28.64 | 26.57 |
| 26 | 40 | 80 | 4 | 0.05 | 60 | 79.89 | 79.77 | 59.62 | 60.24 |
| 27 | 30 | 100 | 6 | 0.075 | 50 | 73.25 | 72.54 | 78.2 | 76.37 |
| 28 | 20 | 40 | 4 | 0.05 | 60 | 82 | 81.68 | 62.25 | 63.10 |
| 29 | 20 | 40 | 4 | 0.1 | 40 | 88 | 88.01 | 61.54 | 63.04 |
| 30 | 40 | 80 | 8 | 0.05 | 40 | 46 | 46.99 | 78.25 | 79.15 |
| 31 | 30 | 60 | 6 | 0.075 | 50 | 67.98 | 69.53 | 85.32 | 88.19 |
| 32 | 30 | 60 | 6 | 0.075 | 50 | 69.98 | 69.53 | 85.02 | 88.19 |
| Source | Sum of Squares | df | Mean Square | F-Value | p-Value | Regression Coefficient | ||
|---|---|---|---|---|---|---|---|---|
| Model | 8364.66 | 20 | 418.23 | 38.36 | <0.0001 | significant | Factor | Estimate (ASA) |
| A-Drug concentration | 287.18 | 1 | 287.18 | 26.34 | 0.0003 | Intercept | 69.53 | |
| B-Contact time | 264.40 | 1 | 264.40 | 24.25 | 0.0005 | A-Drug concentration | −3.46 | |
| C-pH | 7037.69 | 1 | 7037.69 | 645.45 | <0.0001 | B-Contact time | 3.32 | |
| D-Adsorbent dose | 507.10 | 1 | 507.10 | 46.51 | <0.0001 | C-pH | −17.12 | |
| E-Temperature | 0.0545 | 1 | 0.0545 | 0.0050 | 0.9449 | D-Adsorbent dose | 4.60 | |
| AB | 27.83 | 1 | 27.83 | 2.55 | 0.1385 | E-Temperature | 0.0477 | |
| AC | 1.27 | 1 | 1.27 | 0.1161 | 0.7397 | AB | −1.32 | |
| AD | 1.03 | 1 | 1.03 | 0.0945 | 0.7643 | AC | 0.2813 | |
| AE | 0.1849 | 1 | 0.1849 | 0.0170 | 0.8987 | AD | −0.2537 | |
| BC | 9.15 | 1 | 9.15 | 0.8392 | 0.3793 | AE | 0.1075 | |
| BD | 5.00 | 1 | 5.00 | 0.4581 | 0.5125 | BC | 0.7563 | |
| BE | 7.78 | 1 | 7.78 | 0.7139 | 0.4161 | BD | −0.5587 | |
| CD | 25.65 | 1 | 25.65 | 2.35 | 0.1533 | BE | −0.6975 | |
| CE | 1.90 | 1 | 1.90 | 0.1747 | 0.6840 | CD | 1.27 | |
| DE | 2.82 | 1 | 2.82 | 0.2589 | 0.6210 | CE | −0.3450 | |
| A² | 4.16 | 1 | 4.16 | 0.3812 | 0.5495 | DE | 0.4200 | |
| B² | 24.10 | 1 | 24.10 | 2.21 | 0.1652 | A² | −0.3764 | |
| C² | 39.91 | 1 | 39.91 | 3.66 | 0.0821 | B² | −0.9064 | |
| D² | 10.30 | 1 | 10.30 | 0.9449 | 0.3519 | C² | −1.17 | |
| E² | 94.52 | 1 | 94.52 | 8.67 | 0.0133 | D² | −0.5927 | |
| Residual | 119.94 | 11 | 10.90 | E² | 1.80 | |||
| Lack of Fit | 32.50 | 6 | 5.42 | 0.3098 | 0.9070 | not significant | ||
| Pure Error | 87.44 | 5 | 17.49 | |||||
| Cor Total | 8484.60 | 31 | ||||||
| Mean | Std. Dev. | CV% | PRESS | R2 | Adj. R2 | Pred. R2 | Adeq. precision | |
| 68.59 | 3.30 | 4.81 | 937.06 | 0.9859 | 0.9602 | 0.8896 | 25.6066 | |
| Source | Sum of Squares | df | Mean Square | F-Value | p-Value | Regression Coefficient | ||
|---|---|---|---|---|---|---|---|---|
| Model | 7163.00 | 20 | 358.15 | 44.72 | <0.0001 | significant | Factor | Estimate (CBZ) |
| A-Drug concentration | 19.67 | 1 | 19.67 | 2.46 | 0.1453 | Intercept | 88.19 | |
| B-Contact time | 0.0630 | 1 | 0.0630 | 0.0079 | 0.9309 | A-Drug concentration | −0.9054 | |
| C-pH | 2446.42 | 1 | 2446.42 | 305.48 | <0.0001 | B-Contact time | 0.0512 | |
| D-Adsorbent dose | 17.32 | 1 | 17.32 | 2.16 | 0.1694 | C-pH | 10.10 | |
| E-Temperature | 68.51 | 1 | 68.51 | 8.56 | 0.0138 | D-Adsorbent dose | −0.8496 | |
| AB | 206.71 | 1 | 206.71 | 25.81 | 0.0004 | E-Temperature | 1.69 | |
| AC | 10.55 | 1 | 10.55 | 1.32 | 0.2755 | AB | 3.59 | |
| AD | 6.14 | 1 | 6.14 | 0.7664 | 0.4000 | AC | −0.8119 | |
| AE | 21.69 | 1 | 21.69 | 2.71 | 0.1280 | AD | −0.6194 | |
| BC | 2.18 | 1 | 2.18 | 0.2726 | 0.6120 | AE | −1.16 | |
| BD | 26.45 | 1 | 26.45 | 3.30 | 0.0965 | BC | 0.3694 | |
| BE | 49.46 | 1 | 49.46 | 6.18 | 0.0303 | BD | −1.29 | |
| CD | 165.83 | 1 | 165.83 | 20.71 | 0.0008 | BE | −1.76 | |
| CE | 1.52 | 1 | 1.52 | 0.1897 | 0.6716 | CD | −3.22 | |
| DE | 346.24 | 1 | 346.24 | 43.23 | <0.0001 | CE | 0.3081 | |
| A² | 535.32 | 1 | 535.32 | 66.84 | <0.0001 | DE | −4.65 | |
| B² | 260.61 | 1 | 260.61 | 32.54 | 0.0001 | A² | −4.27 | |
| C² | 3146.47 | 1 | 3146.47 | 392.89 | <0.0001 | B² | −2.98 | |
| D² | 322.00 | 1 | 322.00 | 40.21 | <0.0001 | C² | −10.36 | |
| E² | 223.76 | 1 | 223.76 | 27.94 | 0.0003 | D² | −3.31 | |
| Residual | 88.09 | 11 | 8.01 | E² | −2.76 | |||
| Lack of Fit | 71.46 | 6 | 11.91 | 3.58 | 0.0915 | not significant | ||
| Pure Error | 16.63 | 5 | 3.33 | |||||
| Cor Total | 7251.10 | 31 | ||||||
| Mean | Std. Dev. | CV% | PRESS | R2 | Adj. R2 | Pred. R2 | Adeq. precision | |
| 70.43 | 2.83 | 4.02 | 1669.36 | 0.9879 | 0.9658 | 0.7698 | 26.8791 | |
| S.No. | Kinetics Parameters | Values | |
|---|---|---|---|
| ASA | CBZ | ||
| 1. | Pseudo-first-order | qe max (Cal) = 22.79 mg/g qe max(exp) = 37.95 mg/g K1 = −0.0005 R2 = 0.9809 | qe max (Cal) = 118.63 mg/g qe max (exp) = 142.28 mg/g K1 = −2.17 R2 = 0.8006 |
| 2. | Pseudo-second-order | qe max (Cal)= 769.23 mg/g qe max (exp) = 37.95 mg/g qe2= 591716 K2 = 0.0013 R2= 0.751 | qe max (Cal)= 625 mg/g qe max (exp) = 142.28 mg/g qe2= 390625 K2 = 5.66 R2= 0.8722 |
| 3. | Intraparticle diffusion | ki = 1.3425 g/mg min C = 24.08 R2 = 0.9134 | ki = 0.2946 g/mg min C = 35.50 R2 = 0.9007 |
| PhAC | Temperature (K) | −ΔGθ (kJ/mol) | ΔSθ (kJ/mol) | ΔHθ (kJ/mol) |
|---|---|---|---|---|
| ASA | 303 313 323 333 343 | −0.44228 −2.21769 −4.28489 −9.96554 −1.06059 | −0.01125 | −0.0035 |
| CBZ | 303 313 323 333 343 | −0.04208 −1.43613 −3.0971 −4.74838 −5.14778 | −0.00498 | −0.0735 |
| S.No. | Isotherm Parameter | Values | |
|---|---|---|---|
| ASA | CBZ | ||
| 1. | Langmuir Isotherm | KL = 0.442 L/mg qmax = 20.62 mg/g RL = 0.008 R2 = 0.7502 | KL = 5.171 L/mg qmax = 55.25 mg/g RL = 0.101 R2 = 0.926 |
| 2. | Freundlich Isotherm | 1/n = 0.212 Kf = 25.81 L/mg R2 = 0.0051 | 1/n = 2.072 Kf = 7.46 L/mg R2 = 0.7524 |
| 3. | Temkin Isotherm | BT = 0.0107 (J/mol) AT = 1.894 (L/mol) R2 = 0.3927 | BT = 0.0057 (J/mol) AT = 9.094 (L/mol) R2 = 0.7347 |
Disclaimer/Publisher’s Note: The statements, opinions and data contained in all publications are solely those of the individual author(s) and contributor(s) and not of MDPI and/or the editor(s). MDPI and/or the editor(s) disclaim responsibility for any injury to people or property resulting from any ideas, methods, instructions or products referred to in the content. |
© 2023 by the authors. Licensee MDPI, Basel, Switzerland. This article is an open access article distributed under the terms and conditions of the Creative Commons Attribution (CC BY) license (https://creativecommons.org/licenses/by/4.0/).
Share and Cite
Siddiqui, A.J.; Kumari, N.; Adnan, M.; Kumar, S.; Abdelgadir, A.; Saxena, J.; Badraoui, R.; Snoussi, M.; Khare, P.; Singh, R. Impregnation of Modified Magnetic Nanoparticles on Low-Cost Agro-Waste-Derived Biochar for Enhanced Removal of Pharmaceutically Active Compounds: Performance Evaluation and Optimization Using Response Surface Methodology. Water 2023, 15, 1688. https://doi.org/10.3390/w15091688
Siddiqui AJ, Kumari N, Adnan M, Kumar S, Abdelgadir A, Saxena J, Badraoui R, Snoussi M, Khare P, Singh R. Impregnation of Modified Magnetic Nanoparticles on Low-Cost Agro-Waste-Derived Biochar for Enhanced Removal of Pharmaceutically Active Compounds: Performance Evaluation and Optimization Using Response Surface Methodology. Water. 2023; 15(9):1688. https://doi.org/10.3390/w15091688
Chicago/Turabian StyleSiddiqui, Arif Jamal, Nisha Kumari, Mohd Adnan, Sanjeev Kumar, Abdelmushin Abdelgadir, Juhi Saxena, Riadh Badraoui, Mejdi Snoussi, Puja Khare, and Ritu Singh. 2023. "Impregnation of Modified Magnetic Nanoparticles on Low-Cost Agro-Waste-Derived Biochar for Enhanced Removal of Pharmaceutically Active Compounds: Performance Evaluation and Optimization Using Response Surface Methodology" Water 15, no. 9: 1688. https://doi.org/10.3390/w15091688