
An Analysis of Landslide Risk Using the Change in the Volumetric Water Content Gradient in the Soil Layer Per Unit Time of Effective Cumulative Rainfall

1
Forest Engineering Research Institute, National Forestry Cooperative Federation, 1800 Dongseo-daero, Daedeok-Gu, Daejeon 34417, Republic of Korea
2
National Center for AgroMeteorology, 1 Gwanak-ro, Gwanak-Gu, Seoul 08826, Republic of Korea
*
Authors to whom correspondence should be addressed.
Water 2023, 15(9), 1699; https://doi.org/10.3390/w15091699
Submission received: 6 March 2023
/
Revised: 12 April 2023
/
Accepted: 18 April 2023
/
Published: 27 April 2023
(This article belongs to the Special Issue Geological Hazards: Landslides Induced by Rainfall and Infiltration)
Abstract
:The topographical characteristics of South Korea are coupled with heavy rain and typhoons concentrated from July to September, which take up two-thirds of the country’s annual precipitation, causing substantial damage from slope failures, landslides, debris flows, and other mountain disasters. This study uses the Land-Atmosphere Modeling Package (LAMP) data to study the area, which has been affected by numerous landslides in the past. Specifically, to analyze the likelihood of slope failure, this study simulates the rainfall events in the area at the time of the landslides as well as changes in the volumetric water content in the soil layer and uses the changes in the volumetric water content per unit time, which are affected by the effective cumulative rainfall within the soil layer. To that end, this study assesses the risk of landslides based on how rainwater infiltration in the saturation depth changes the saturation depth ratio and compares the results with the landslide spots in the past. Moreover, this study analyzes the landslide risk by applying the saturation depth ratio () to an infinite slope stability analysis model. The landslide threshold proposed in this study was obtained by analyzing the rainfall events that caused the landslides in the study area using the LAMP model. It can then be concluded that, when compared with the spatial information on the previous landslides, if the change in the volumetric water content per unit time during the first and second rainfall events is 0.7, a landslide may occur. These results indicated that the landslide risk increases the volumetric water content in the soil layer, along with the congruence between past landslide risk points and spatial landslide risks.
1. Introduction
Continuous urbanization and the resulting global warming have been affecting the global climate, which has caused unprecedented natural disasters, including heat waves, cold waves, and earthquakes. Korea has about 64% of its land covered by mountains, and most of its rainfall is concentrated in the summer. The combination of these two factors has resulted in frequent ground disasters such as slope failures, landslides, and debris flows. Between 2013 and 2021, the annual average area of lands affected by mountain disasters stood at around 235 ha, and the annual average of restoration costs was around USD 51.24 million, with the annual average estimated at two. In particular, in July and August of 2020, 53 days of heavy rain caused landslides that affected 1343 ha of land and claimed the lives of 9 people [1,2]. To reduce the recurring damage from landslides caused by heavy rain, we need to analyze the landslide risk from rainfall events.
Most landslides in South Korea are caused by a shallow failure with a surface of around 2 m, in which rainwater infiltrates into the soil layer and causes collapse [3,4]. In most of these landslide events, rainwater infiltrates and moves down the soil layer, forming a seepage line, thereby saturating the soil layer and weakening the shear strength of the layer [5,6,7]. As such, landslide risk assessments should understand how rainwater infiltration changes the hydraulic characteristics of the soil layer. Many researchers have studied landslide risks and ways to reduce them by examining how rainfall changes the hydraulic characteristics and considering the changes in the effective stress at different soil layer depths caused by rainwater intruding into the soil layer [8,9,10,11]. Furthermore, some researchers have analyzed and assessed landslide risk levels with the assumption that the soil layer is at full saturation [12,13,14,15,16,17,18,19] and explored early landslide warnings based on internal and external changes in the environment [20,21,22,23,24].
The high percentage of mountains in Korea, coupled with the concentration of housing along the boundaries of these mountains, restricts the country’s ability to implement structural prevention measures. Rather than preventing landslides and similar events, it seems more practical to alert residents living in areas where failures are expected so that they can evacuate in advance. Early identification of landslide risks serves as an effective means to achieve that goal [25,26]. If we can predict future weather events and use the information to detect landslide risks in advance, it will give the staff tasked with managing mountain disasters enough time to plan appropriate responses. This approach would require the medium- and long-term prediction of rainfall events and changes in the volumetric water content in the soil layer using a numerical meteorological model, as well as the development and use of the technologies to use the information to predict changes in landslide risks.
This study used the Land-Atmosphere Modeling Package (LAMP) model to simulate the rainfall events in Pyeongchang-gun, Gangwon Province, South Korea, when Typhoon Ewiniar hit the region in 2006, causing multiple landslides. One of the methods for estimating the volumetric water content of the soil layer is the LAMP model. The LAMP model has the advantage of simulating rainfall during a specific period and analyzing the change in the volumetric water content of the soil layer. This allows for a more accurate assessment of the soil water balance and the potential for drought or flooding. The LAMP model can also account for the effects of vegetation, land use, and topography on the volumetric water content distribution.
This study applied a GIS analysis for an infinite slope stability analysis to assess the landslide susceptibility of a region. The infinite slope stability analysis method uses a physically based model that estimates the factor of safety (FS) of slopes based on geometrical and geotechnical parameters. The infinite slope stability analysis also incorporates a hydrogeologic model that simulates the variation of the wetting front due to rainfall infiltration. Next, landslide risks were analyzed using an infinite slope stability model by applying the saturation depth ratio, which allowed the consideration of rainwater infiltrating into the soil layer. Lastly, this study calculated the effective cumulative rainfall that affects the increase in the volumetric water content and used the changes in the volumetric water content in the soil layer to propose a threshold to determine landslide failure occurrence using the change in the volumetric water content per unit of time.
2. Methodology
2.1. Selection of the Study Area and Development of the Spatial Data
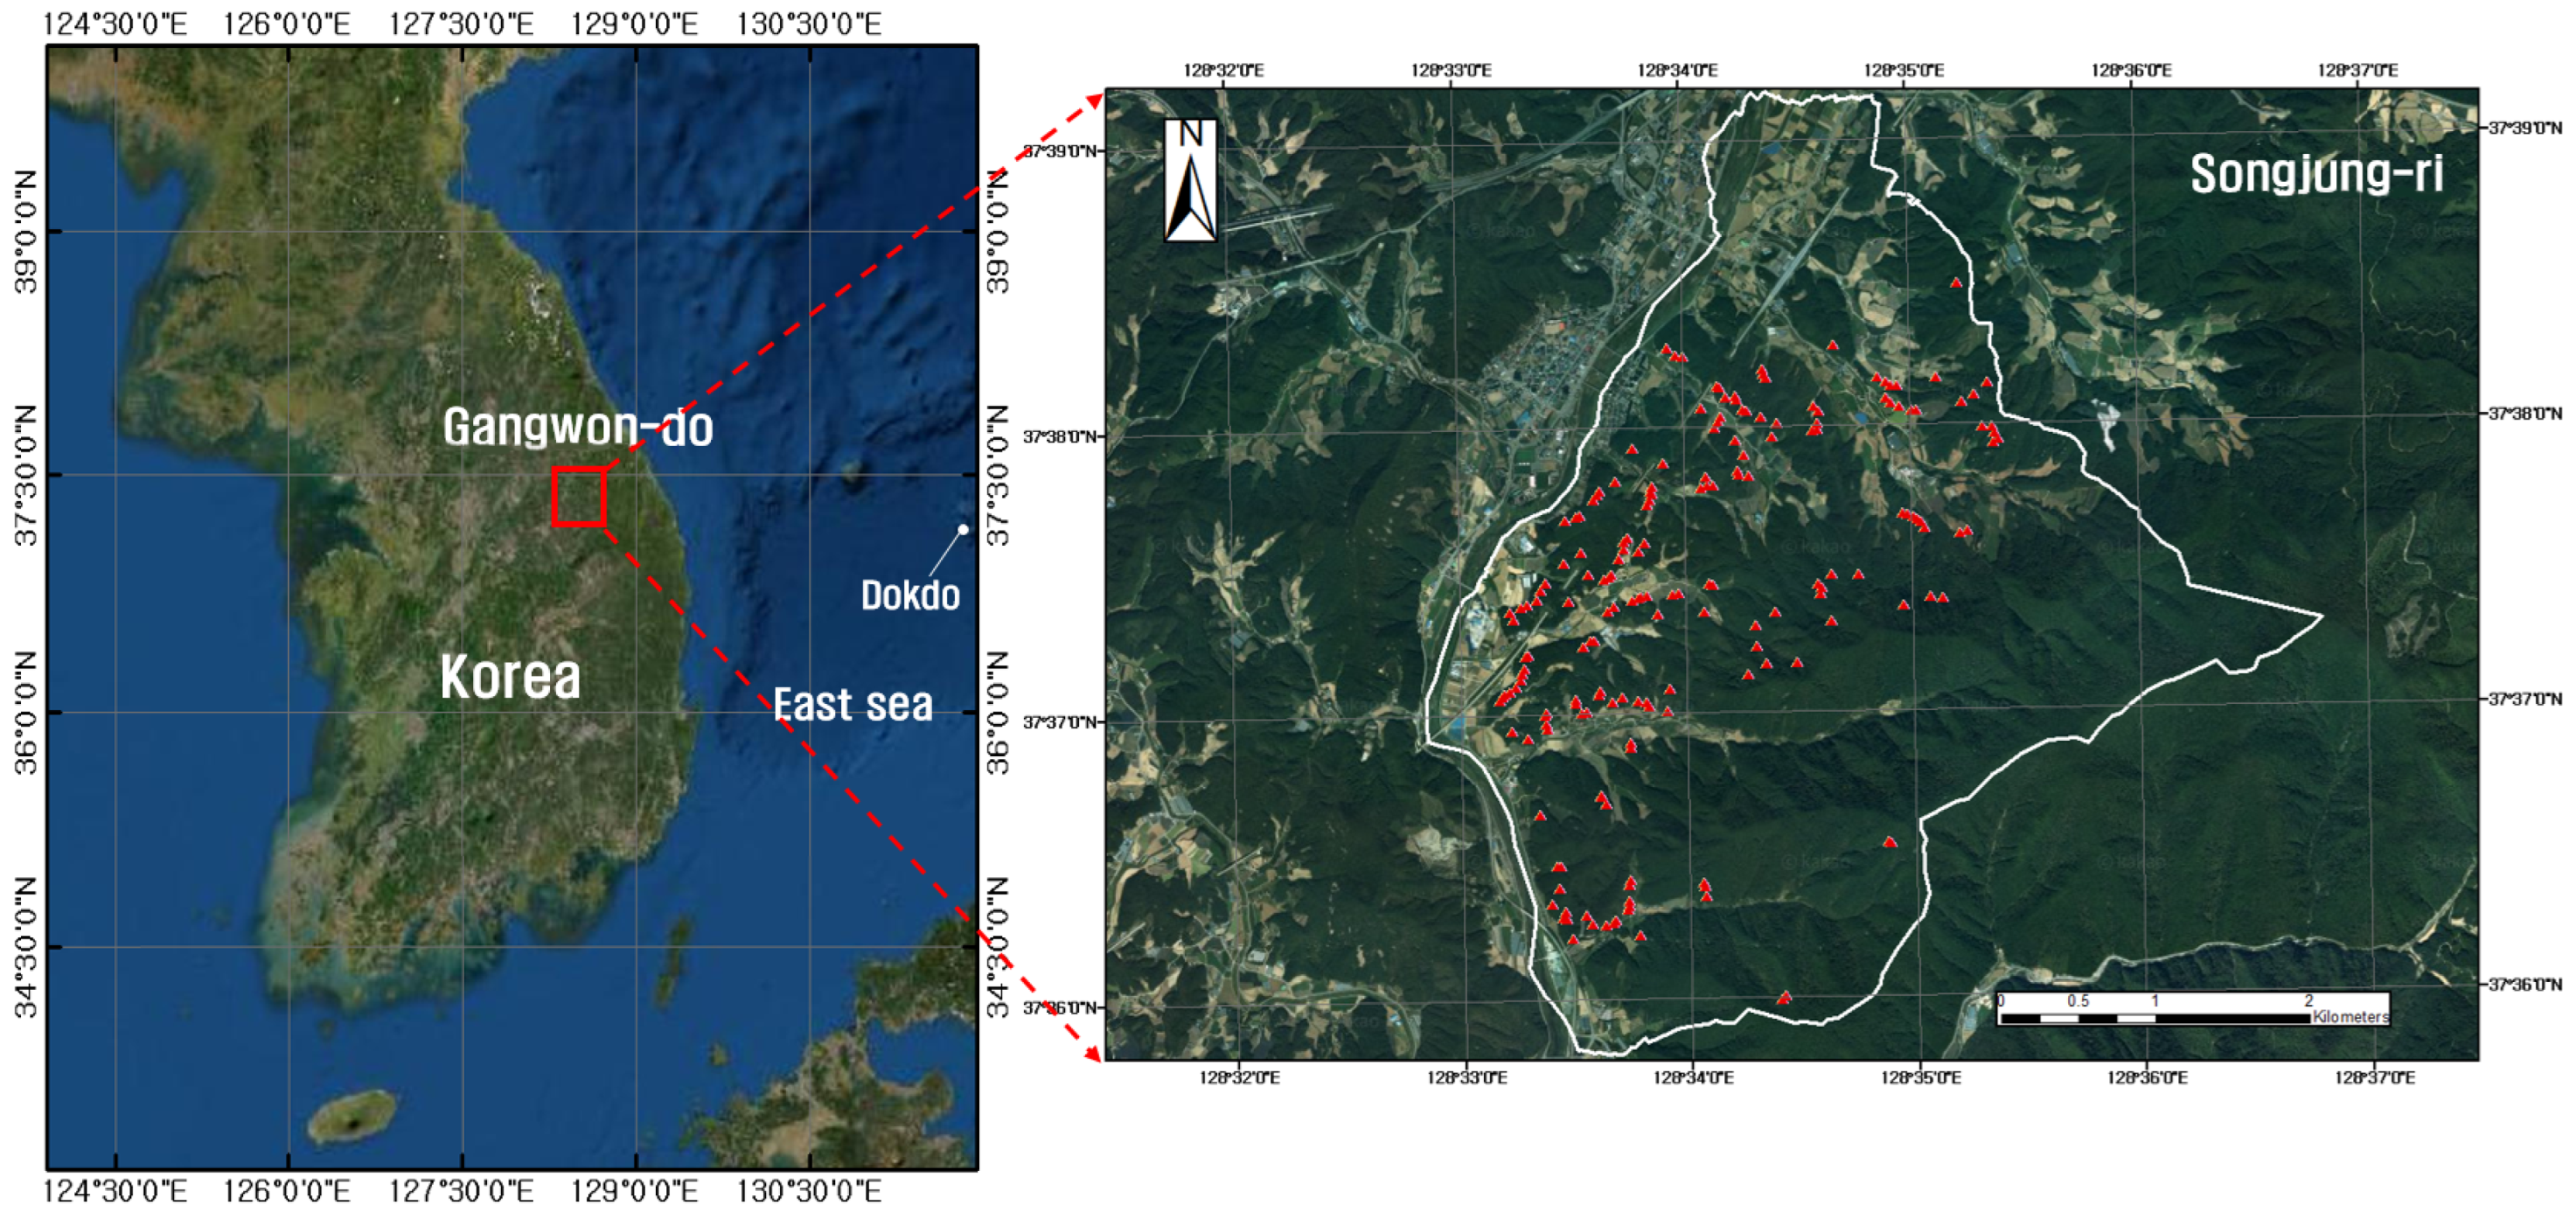
Between 14 and 18 July 2006, Typhoon Ewiniar and heavy rain caused multiple mountain disasters, including landslides and debris flow, in Pyeongchang-gun and Inje-gun, Gangwon Province. The cumulative rainfall in Pyeongchang-gun reached 540 mm, causing landslides, debris flows, and other soil disasters concentrated in areas with weathered granite soil. In Pyeongchang-gun, landslides occurred at 2631 locations, of which 1872 were concentrated in Jinbu-myeon in Pyeongchang-gun.
Pyeongchang-gun is located in the Taebaek Mountains at the center of the southern part of Gangwon Province. With an average altitude of over 600 m, Odaesan Mountain, Gyebangsan Mountain, Hwangbyeongsan Mountain, and Daegwallyeong Pass can be found in the north, and Charyeong Mountains run from Odaesan Mountain in the west. As for the geology of the study area, the western part of the area is characterized by a wide gneiss complex consisting of Precambrian meta-sedimentary rocks and granitic rocks, while the eastern part consists of the strata falling under the Joseon supergroup and the Pyeongan supergroup.
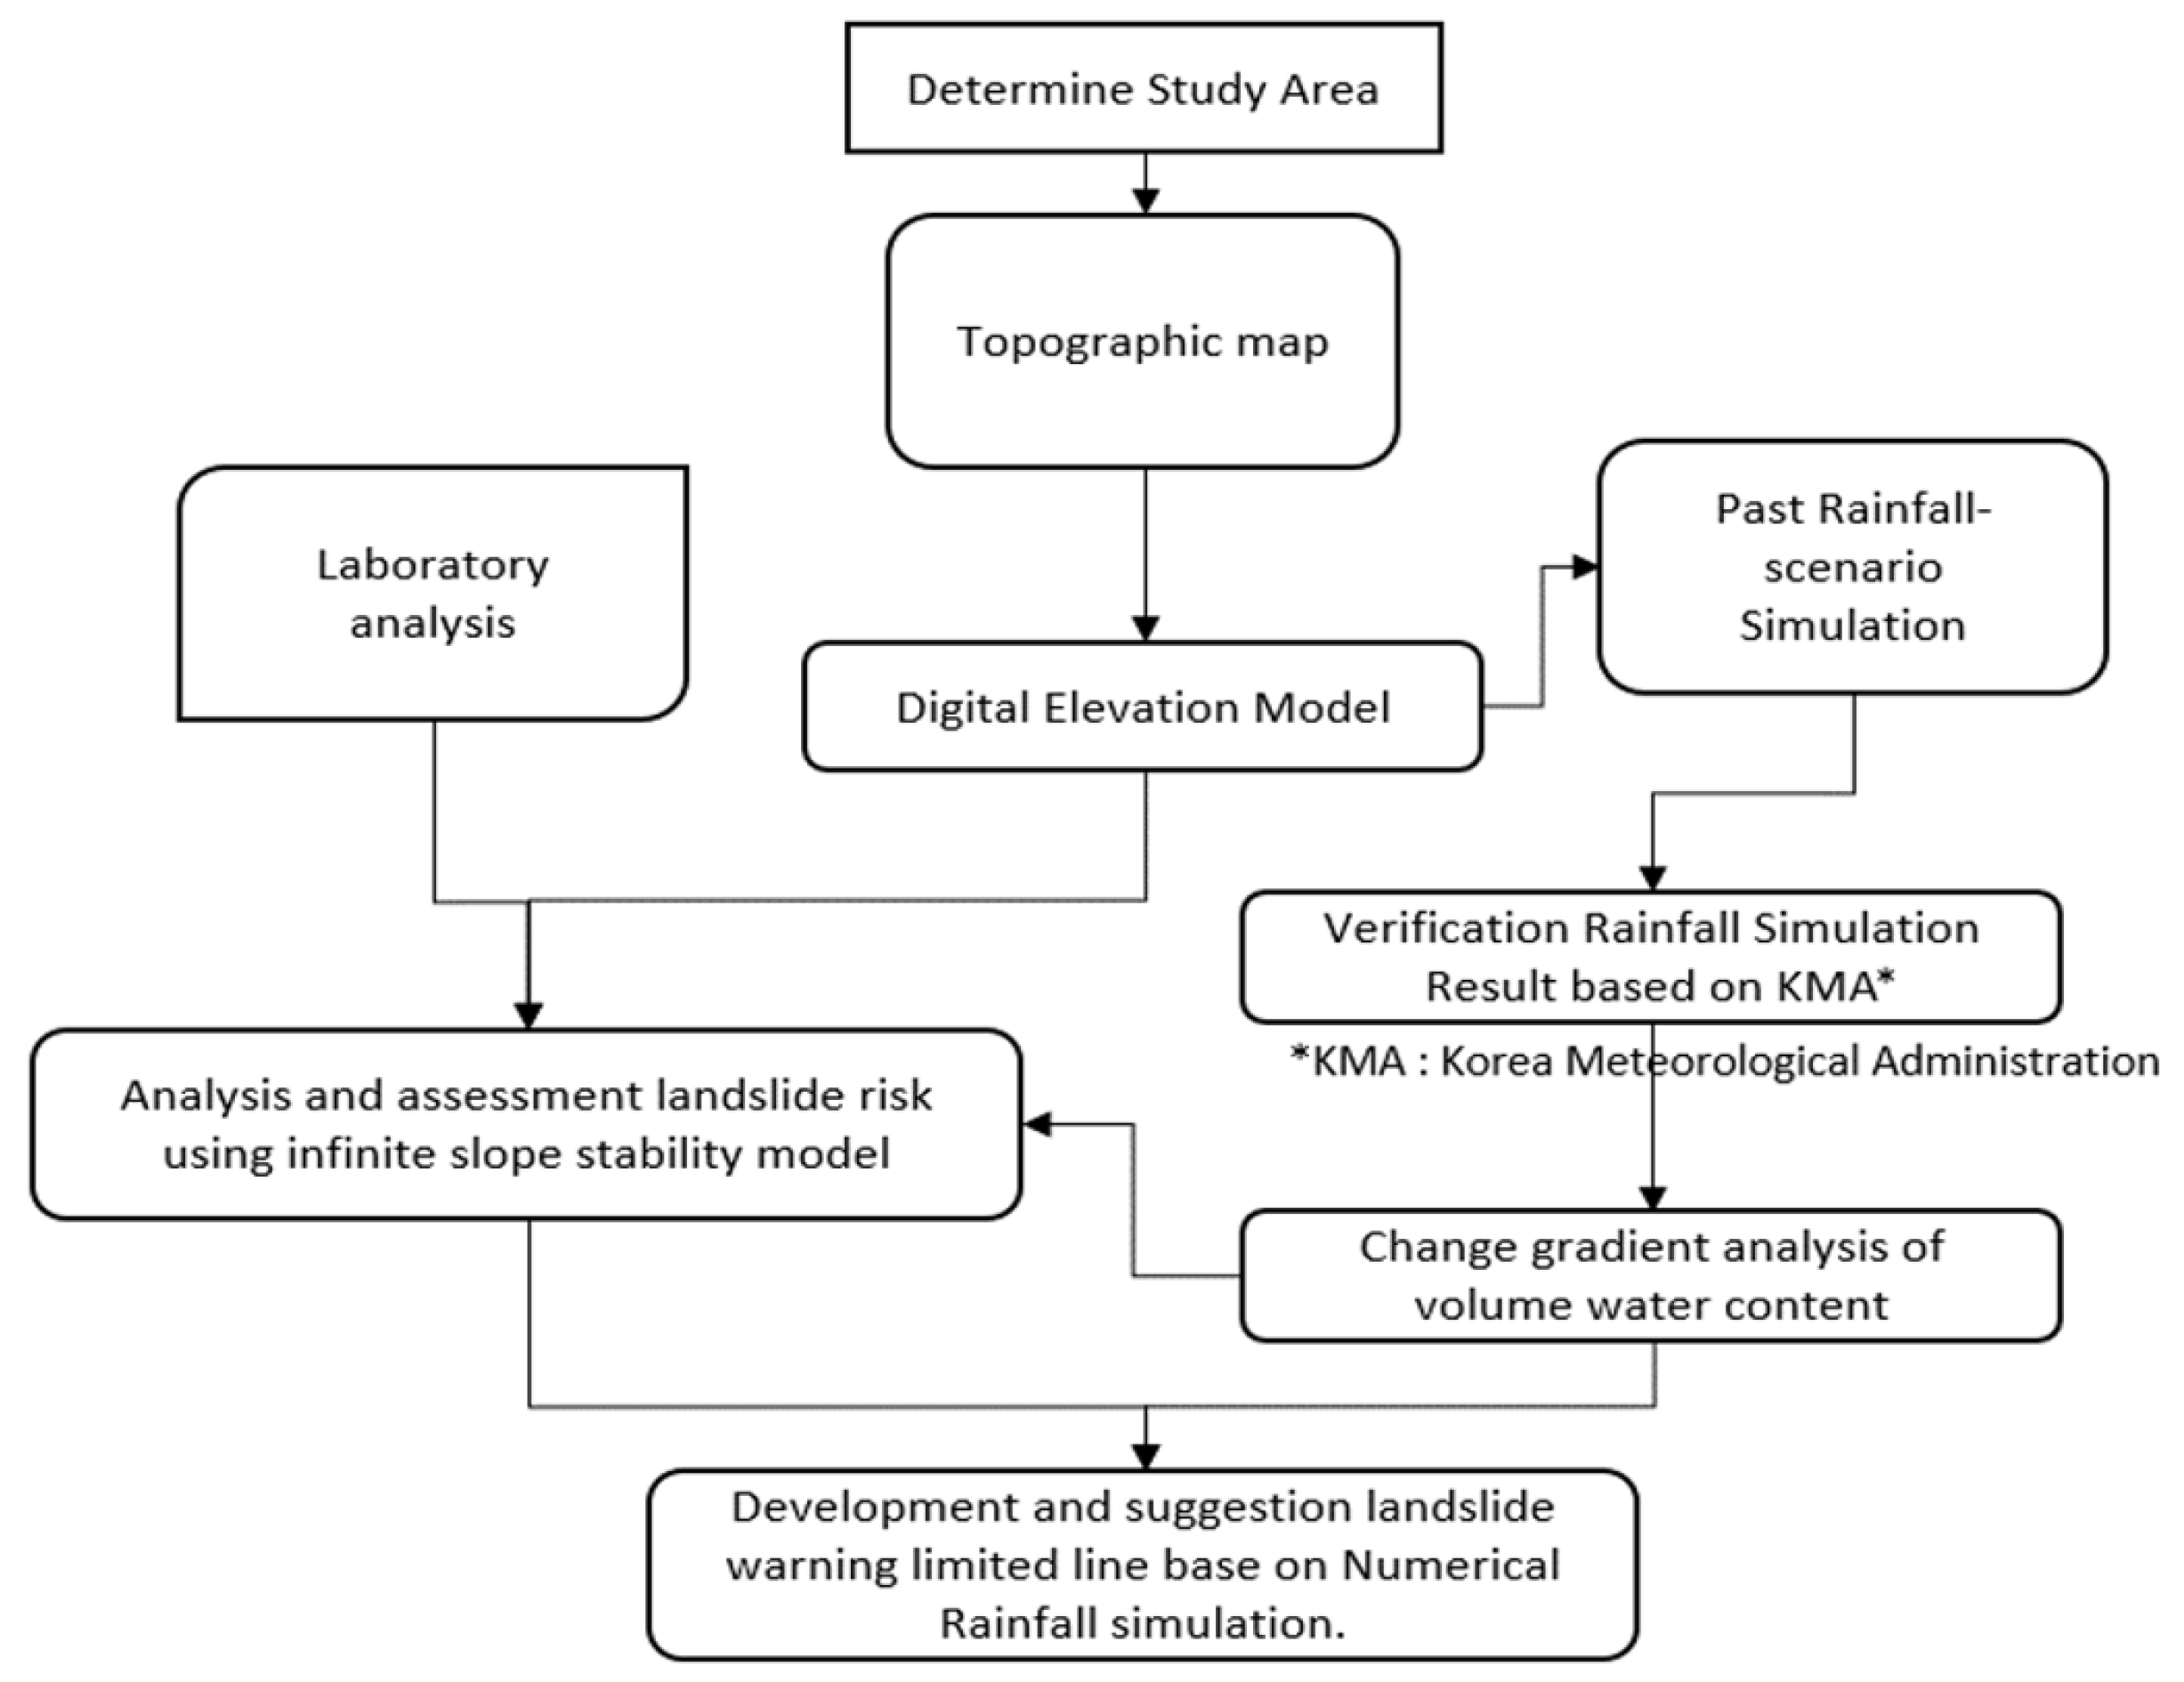
As shown in Figure 1, this study selected Songjeong-ri, Pyeongchang-gun, Gangwon Province, where landslides occurred at 187 locations due to Typhoon Ewiniar in 2006, as the study area. Figure 2 shows a method of analyzing landslide risk using a modified infinite slope stability analysis model that reflects the gradient of volumetric water content analysis results of the soil layer based on rainfall data based on digital elevation model (DEM) information.
To develop a point database on landslide locations in the study area (Songjeong-ri, Jinbu-myeon, Pyeongchang-gun, Gangwon Province in South Korea) based on a geospatial information system (GIS), this study collected information on landslide locations from aircraft photographs, satellite images, and on-site reports before and after the 2006 typhoon event. This resulted in a database of the 187 landslide locations, based on which the area to be analyzed was selected.
Moreover, to develop GIS-based spatial data on the engineering and topographical characteristics of the study area, including the effective soil depth, this study used the numerical topographical map of the area to develop a digital elevation model (DEM). Around 90 soil samples were also collected from natural mountain areas with 15° to higher inclinations and 60 cm or higher soil layer depths within the mountain boundaries on the forest-type map. Specifically, this study collected 5 undisturbed soil samples and 2 kg of disturbed soil samples from each sampling area. The angle of internal friction cohesion of the soil was analyzed using the collected soil samples by performing a unit weight [27] and a direct shear test [28] in accordance with the standards proposed by the American Society for Testing and Materials (ASTM). This study also collected information on the physical properties of the soil based on the test results by combining them with the coordinates of the sampling locations.
The resulting physical property values constitute point data, which are difficult to apply to the overall study area. As such, the point data was converted to area data using an interpolation analysis method called inverse distance weighting (IDW), thereby developing spatial information on the physical properties of soil at each location. The IDW offers the benefit of simple concepts and calculations and is based on Tobler’s first law of geography, which states that “everything is related to everything else, but near things are more related than distant things”. It is used as a standard spatial interpolation method along with GIS programs for geographical spaces [29,30,31].
2.2. Numerical Meteorological Modeling
This study used LAMP data produced by the National Center for AgroMeteorology (NCAM-LAMP). As shown in Figure 3, NCAM-LAMP is capable of high-resolution multidimensional modeling and consists of a Weather Research and Forecasting (WRF)/Noah-MP system and an offline one-dimensional Noah-MP model [32,33]. The LAMP WRF predicts medium-range, high-resolution (810 m) precipitation and is capable of providing information on atmospheric, vegetation, and soil variables (volumetric water content calculated for four soil layers) at a 1 h interval for up to 12 days. Here, the soil analyzed by the LAMP model is divided into four soil layers. If rainfall occurs at the same time, the change in volumetric water content is analyzed differently depending on the depth of the four soil layers. In this study, we analyzed the landslide risk using the volumetric water content calculated for each soil layer.
The previous result of the characterization of variations in volumetric water content to predict shallow slope failure [34] compared the volumetric water content at two different ground surfaces before and after harvest using the Automated Agricultural Observation System (AAOS) of the Korea Meteorological Administration (KMA) and the nearby NCAM tower, respectively and confirmed that both sites indicated an increase/decrease in the volumetric water content of the soil layer caused by rainfall. It was also shown that volumetric water content was affected by the environmental factors of the surrounding areas, including the rainwater within the soil layer and the soil characteristics of the ground.
This study used the LAMP model to produce rainfall data and the volumetric water content of the soil layer between 22:00 on July 14 and 01:00 on July 16, 2006, during which Typhoon Ewiniar caused multiple landslides in the study area. As can be seen in Table 1, this study used the Domain 4 specifications to develop the data as well as the Noah-MP surface model included in the LAMP model to simulate the volumetric water content. The Noah-MP model was revamped from the Noah model proposed by [35] by changing various parameter options that affect the model [36,37]. The Noah-MP surface model considers soil layer depths and simulates the behaviors of rainwater intruding into the soil layer for different rainfall durations; this study, therefore, used the model to analyze changes in the physical properties of the soil layer, including its volumetric water content and evapotranspiration.
2.3. Analysis of Landslide Risks Based on the Saturation Depth Ratio of the Soil Layer
The infinite slope stability model is an analysis method that assumes that the sliding surface is parallel to the slope surface [38]. This model is used to assess the stability of a slope in which the length of the sliding surface is longer than the depth of the sliding surface. Here, the rainwater infiltration in the soil layer forms a wetting front, with the part above the wetting front saturated and the part below the wetting front unsaturated (Figure 4).
In general, the safety factor is lowest when rainwater infiltrates into the impermeable layer, assuming that the soil properties and the groundwater level do not change across the overall slope. The factors with the highest impact on the factor of safety (FS) in the traditional infinite slope stability model are the inclination of the slope (α), the cohesion of the soil layer (c), and the angle of internal friction () [40,41]. The rainfall event, which is a major factor causing slope failures in actual cases, can be analyzed using changes in the volumetric water content in the soil layer, that is, the depth of the wetting front that represents the behavior of infiltrating water into the soil layer [5].
The traditional infinite slope stability model was proposed by [42] and is represented in Equation (1).
where, : the cohesion of the plant roots (N/m2), : the cohesion of soil (N/m2), : the inclination of the slope (°), : the overall density of soil (kg/m3), : the density of water (kg/m3), : gravitational acceleration (9.81 m/s2), : soil layer depth (m), : wetting front depth in the soil layer (m), : the angle of internal friction of soil (°).
Using Equation (1), the saturation depth ratio is the ratio of the depth of the wetting front against the total depth of the soil layer [39]. The saturation depth ratio can be represented in Equation (2).
As shown in Equation (1), when analyzing soil cohesion, the influence of plant roots and soil should be considered. However, as the type and depth of plant roots can vary, the equation can be simplified, as in Equation (3), by considering only the representative cohesion (C).
In addition, the soil layer density changes along with the changes in the volumetric water content in the pores caused by rainwater infiltration. Therefore, the relationship between the water density and the soil layer density can be represented in Equation (4).
By applying the equation for the physical soil constant to Equation (1), an infinite slope stability model that considers the ratio of the saturation depth against the total soil layer depth can be applied as in Equation (5).
where, is the cohesion ratio against the soil layer weight (non-dimension), is the inclination of the sleep slope (°), . is the angle of internal friction of soil (°), is the ratio of the water density against the overall density, and is the saturation depth ratio within the soil layer over time, which can be defined as , considering the changes in the wetting front within the soil layer caused by rainfall and the soil layer depth. Therefore, is the ratio of the saturation depth of the wetting front against the soil layer depth, and has a value between 0 and 1.
The revised model considers changes in saturation within the soil layer caused by rainwater infiltration. Landslides in the study area can be characterized as shallow failures, mostly occurring between the boundary between the shallow failure and the bedrock. As such, it is crucial to accurately determine the soil layer depth [39,43]. The soil layer depth directly impacts the FS, depending on changes in in Equation (5). The FS is the lowest when the rainwater infiltration in the soil layer completely saturates the layer. The opposite result is obtained when the infiltration only partially saturates the soil layer. This relationship between the soil layer depth and the saturation depth ratio causes the FS to be lower in sections with a shallower soil layer. In sum, shallow failures can be analyzed using changes in the FS within the shallow failures of slopes caused by rainwater infiltration within the layers.
The revised infinite slope stability model used in this study considers changes in the saturation of the soil layer caused by rainwater infiltration with no consideration for groundwater levels. Therefore, this study analyzed the FS by converting changes in the volumetric water content at different soil layer depths from the LAMP results into the saturation depth ratio of each soil layer depth and calculated the landslide risk index from the relationship with the FS analyzed based on the ratio of the saturation depth against the critical slope FS (<1.0). The findings were then divided into three levels (1st grade, 2nd grade, and 3rd grade) and validated using the risk rating proposed by the Landslide Risk Map of the Korea Forest Service (KFS).
2.4. Analysis of the Landslide Threshold for Rainfall Affecting the Volumetric Water Content of the Soil Layer
This study used a method to analyze the relationship between rainfall causing slope failures or landslides and changes in the volumetric water content in the soil layer [20] to propose a landslide threshold for changes in the volumetric water content in the soil layer caused by rainfall events from the LAMP results. To determine the changes in the volumetric water content and the time of slope failures, this study represented the time between the change in the volumetric water content () and the full saturation () as a ratio of unit time () and analyzed the ratios against the effective cumulative rainfall affecting landslide occurrence and the results of a linear regression analysis. Then, using the changes in the volumetric water content per unit of time () and the relationship with the effective cumulative rainfall affecting landslides, a landslide threshold was proposed, which was calculated by applying the effective cumulative rainfall and the changes in the volumetric water content in each soil layer from the LAMP results.
3. Result
3.1. Analysis of Changes in the Volumetric Water Content Caused by Changes in the Effective Cumulative Rainfall Based on the LAMP Results
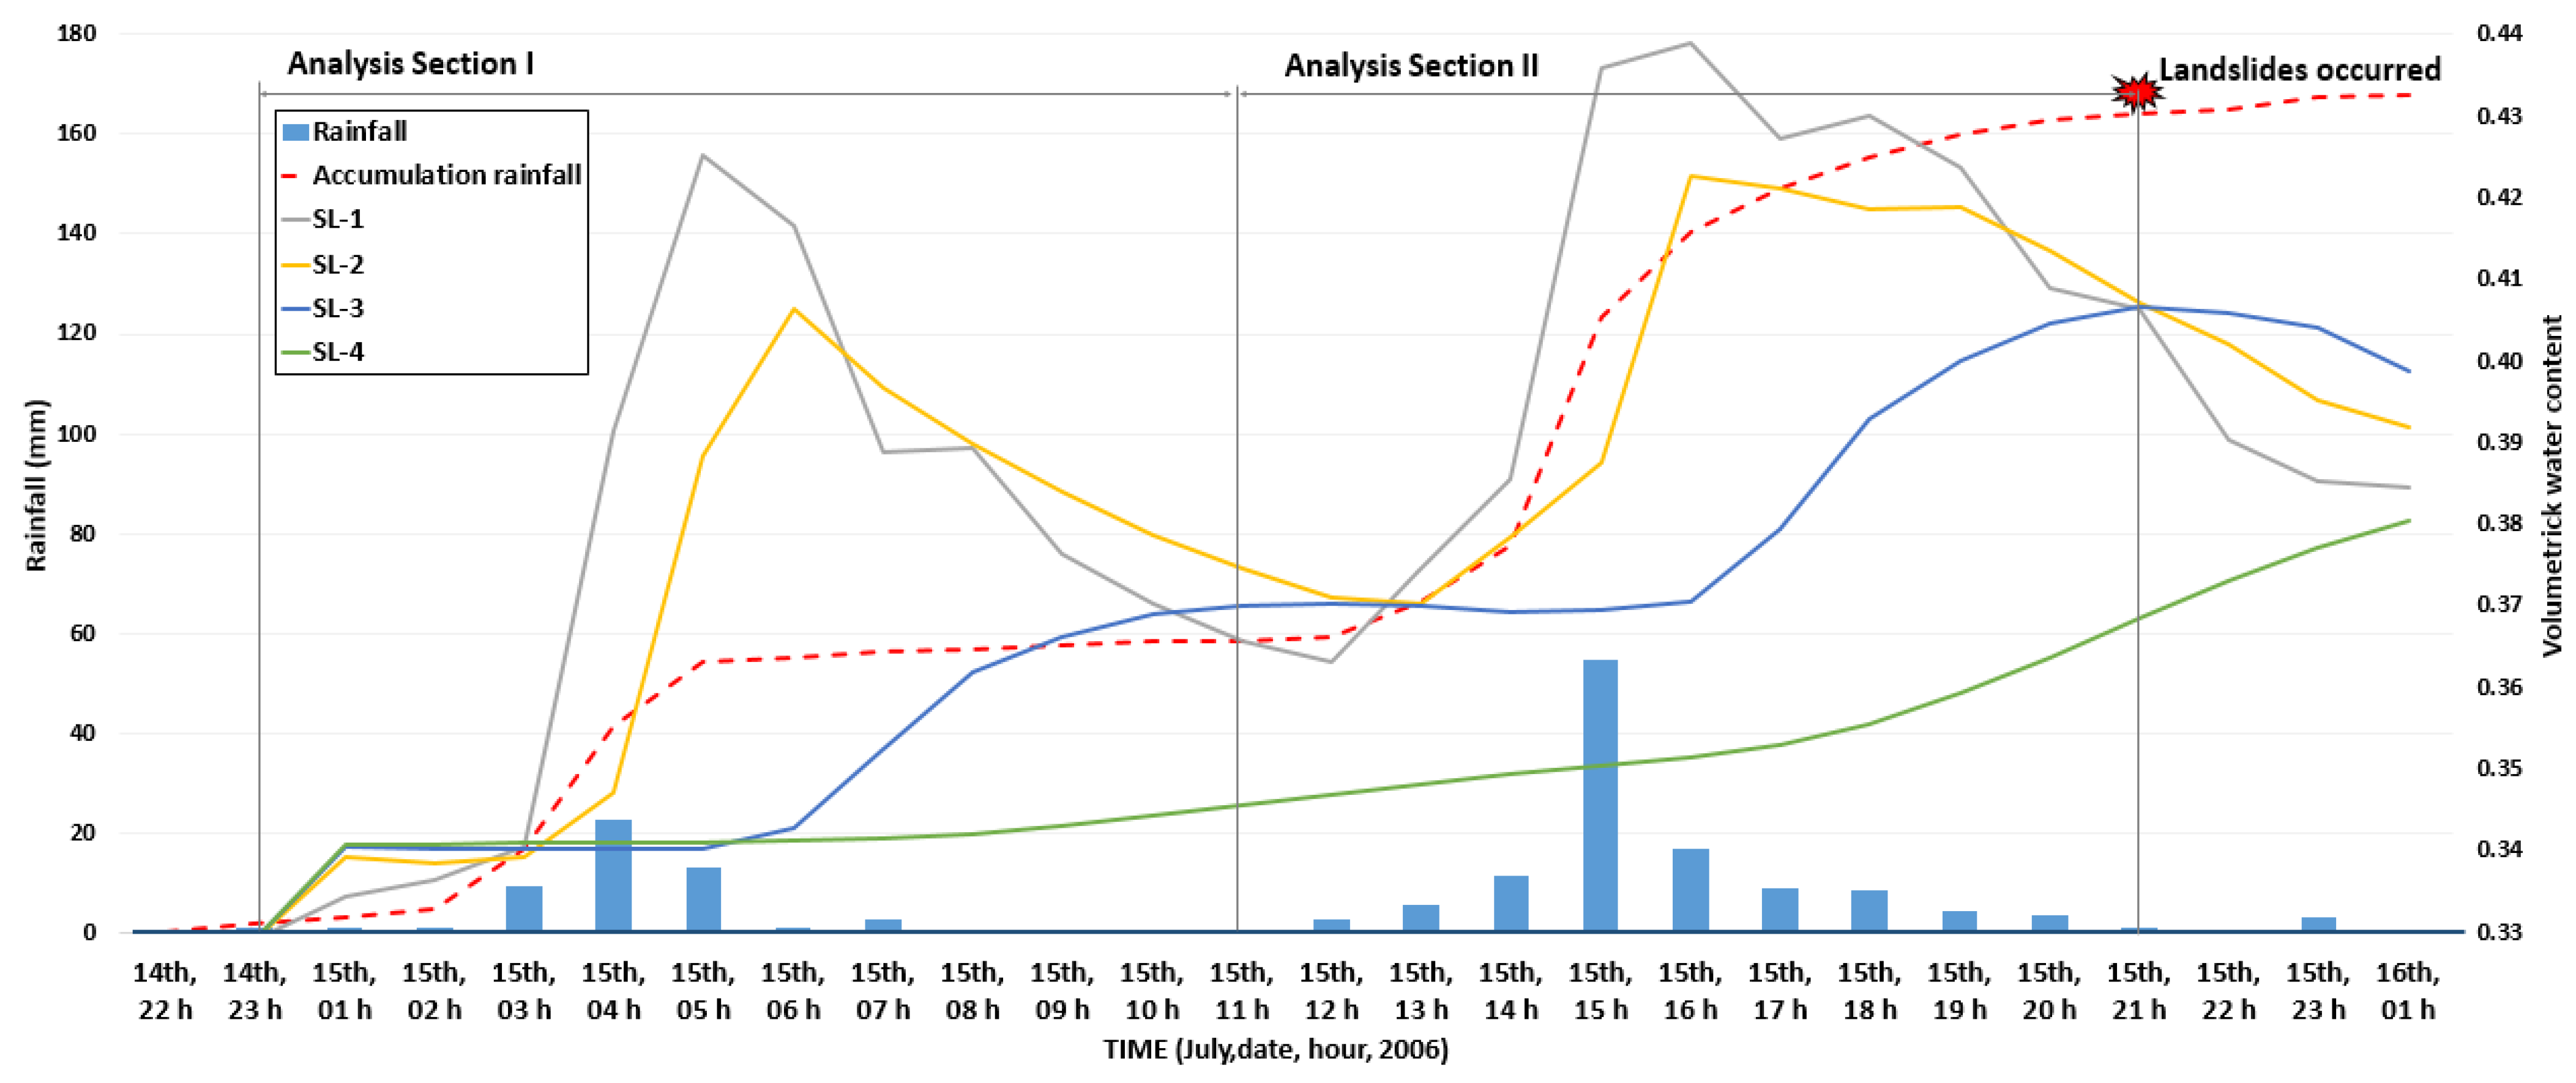
Rainwater events on 14 and 15 July 2006, were simulated for this study using the LAMP model, from which the findings indicated two rainfall events (Figure 5). The first rainfall event lasted from 23:00 on 14 July to 07:00 on 15 July. The second rainfall event occurred 4 h later and continued from 11:00 on 15–16 July. The cumulative rainfall during the first rainfall event was around 60 mm, and the rainfall intensity was 9 mm/hr. During the second rainfall event, the cumulative rainfall was 100, and the highest hourly rainfall was 58 mm/h.
According to the KMA, the cumulative daily precipitation on 15 July 2006, which is the day of the landslides, was 168 mm/day, which is 7 mm lower than the simulated daily precipitation for the same day from the LAMP model.
3.2. Analysis of Changes in the Volumetric Water Content in Each Soil Layer Based on the Effective Cumulative Rainfall
To analyze the changes in volumetric water content during each rainfall event, a linear regression analysis was carried out on the relationship between the unit time () and the changes in the effective cumulative rainfall in each soil layer, based on the effective cumulative rainfall of the first and second events. The findings indicated that the volumetric water content rapidly increased when the rainfall began at the soil layer depths of GL-0–0.1 m (SL-1) and GL-0.1–0.4 m (SL-2) and declined after the rainfall. In these soil layers, the changes in volumetric water content were similar in both analysis sections. In SL-1 and SL-2, where the soil layers were relatively shallow, the volumetric water content was highly sensitive to changes in rainfall patterns. As shown in Figure 5, in SL-3 (GL-0.4–1.0 m), which accounts for 50% of the total soil layer depth of 2 m, the volumetric water content began to slowly increase only 2 to 3 h after the rainfall event began and then plateaued after some time. On the contrary, in SL-4 (GL-1.0–2.0 m), the volumetric water content gradually increased, driven by the effective cumulative rainfalls in the analysis section I and II. This finding can be explained by the rainwater infiltrating and moving down through the pores in the soil layer.
Figure 6 shows the changes in the volumetric water content per unit time based on the effective cumulative rainfalls in both analysis sections, and the times of the landslides in Figure 5. We applied the changes by selecting the effective cumulative rainfall per unit time that affects the increase in volumetric water content in each soil layer. The volumetric water content per unit time changes more when the unit time required for the volumetric water content increase is shorter.
In the analysis section I, the gradients of volumetric water content per unit time in SL-1 and SL-2 () were 0.82 and 0.74, respectively. In the analysis section II, the gradients were 0.81 and 0.64. Between the first and second rainfall events, in SL-1 and SL-2, the gradient of volumetric water content per unit time did not significantly change or decline in the analysis section II (Table 2). However, in SL-3, the volumetric water content began to slowly increase after the rainfall began. The gradient of volumetric water content per unit time in the analysis section I was 0.37, which increased by 0.07 to 0.44 in the analysis section II. In SL-4, the gradient was 0.04 in the analysis section I and increased by 0.16 to 0.20 in the analysis section II.
These results showed the opposite trends to SL-1 and SL-2, where the changes in the volumetric water content remained the same or declined in the second rainfall event, which can be explained by the fact that rainwater infiltrates and drains faster in shallower soil layers. After some time, during additional rainfall, the volumetric water content changes in similar patterns as before. In deeper soil layers, such as SL-3 and SL-4, additional rainfall occurred before the effective cumulative rainwater could completely run off, which resulted in slightly faster changes in the volumetric water content. These results indicated that the LAMP model used in this study reasonably simulated rainwater infiltration and drainage in typical soil layers.
3.3. Landslide Risk Assessment Results
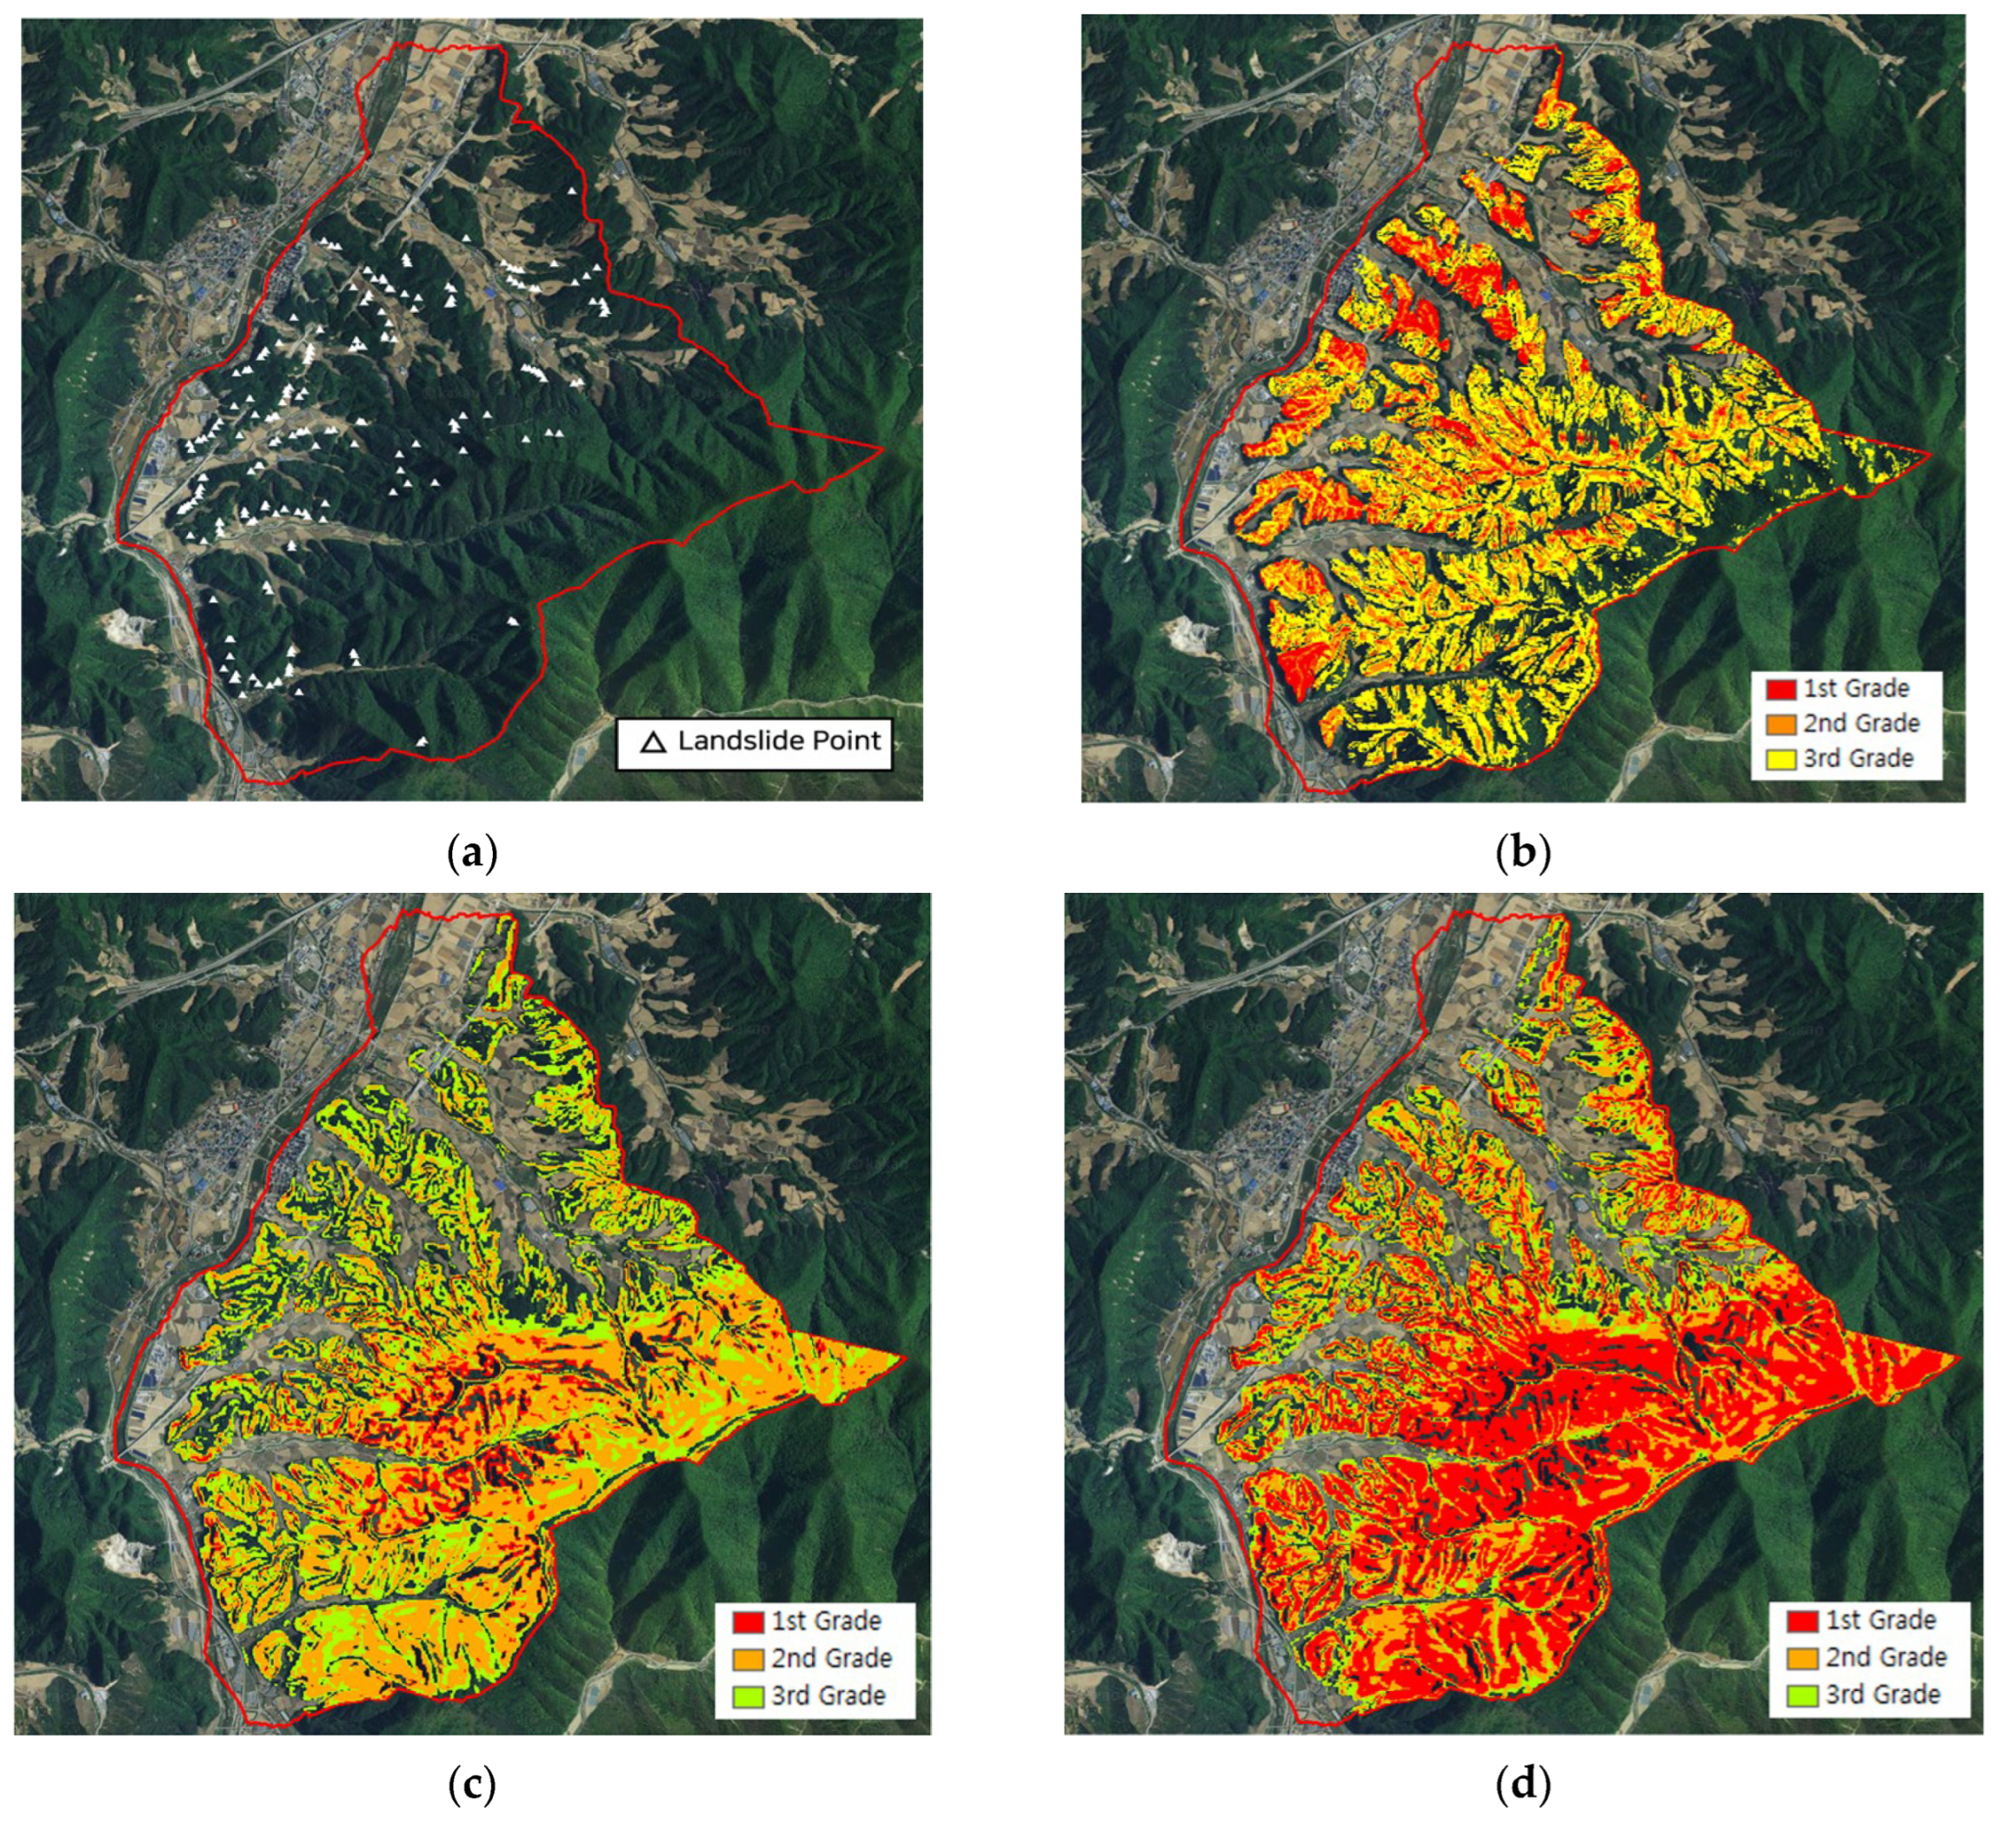
Based on the analysis of the volumetric water content gradient in each soil layer and the effective cumulative rainfalls from the LAMP results, this study assessed the landslide risk in the study area (Figure 7). The assessment showed the landslide risk concentrated around the mountain borders and the valleys. In addition, a higher effective cumulative rainfall increased the landslide risk by increasing the volumetric water content in the soil layer.
To validate these findings, this study assessed the landslide risk using the GIS data on the landslide locations (187) and the Landslide Risk Map provided by the KFS (Figure 7b). Among the landslide risk levels from the Landslide Risk Map, this study only used the data on the top three levels (very high, high, and modest) and excluded the data on the other two levels (low and very low). The landslide locations where the landslide risk assessment in this study does not overlap with the KFS map were also excluded.
In the validation, this study’s risk assessment for the first rainfall event section identified 112 of the actual 187 landslide locations, showing a 59.9% congruence rate. In the analysis section II, where the change in the volumetric water content in the soil layer rapidly increased, this study’s assessment identified 135 of the landslide locations as posing landslide risks, recording a 72.2% congruence. On the other hand, the KFS map identified 115 of the actual landslide locations, representing a congruence rate of 61.5%.
The difference between the LAMP results, which are based on changes in the volumetric water content in each soil layer caused by the effective cumulative rainfall, and the KFS map can be explained by the application of the saturation depth ratio (), which considers changes in the volumetric water content at different soil depths. In other words, the difference comes from the use of a dynamic concept that reflects the characteristics of rainwater infiltration during rainfall events.
4. Discussion
To reduce damage caused by landslides, it is crucial to rapidly assess and address landslide risks, which change depending on the rainfall event. The KFS landslide risk map represents the risk level of each area, rated on a five-point scale based on statistical analysis considering topographical, geological, soil, and other factors along with the adjusting factors affecting landslide occurrence. The map can contribute only so much to identifying changes in landslide risks affected by rainfall events, which presents the need for an appropriate alternative.
This study analyzed the landslide risk using an infinite slope stability model revised to consider changes in the volumetric water content in the soil layer above the bedrock, where landslides usually occur during rainfall events. Landslide risks were assessed based on the LAMP simulation results for the first rainfall event, and the results were 59.9% consistent with the actual landslide locations, whereas the KFS map recorded a 61.5% congruence rate. However, for the second rainfall event, where additional rainfall raised the volumetric water content to over 50%, the LAMP model showed a congruence rate of 72.2%, which was higher than the KFS map.
The infinite slope stability model, revised based on the saturation depth ratio proposed in this study, can be used to assess changes in landslide risks during a rainfall event. In addition, it can be used as an alternative to address the limitations of the KFS map.
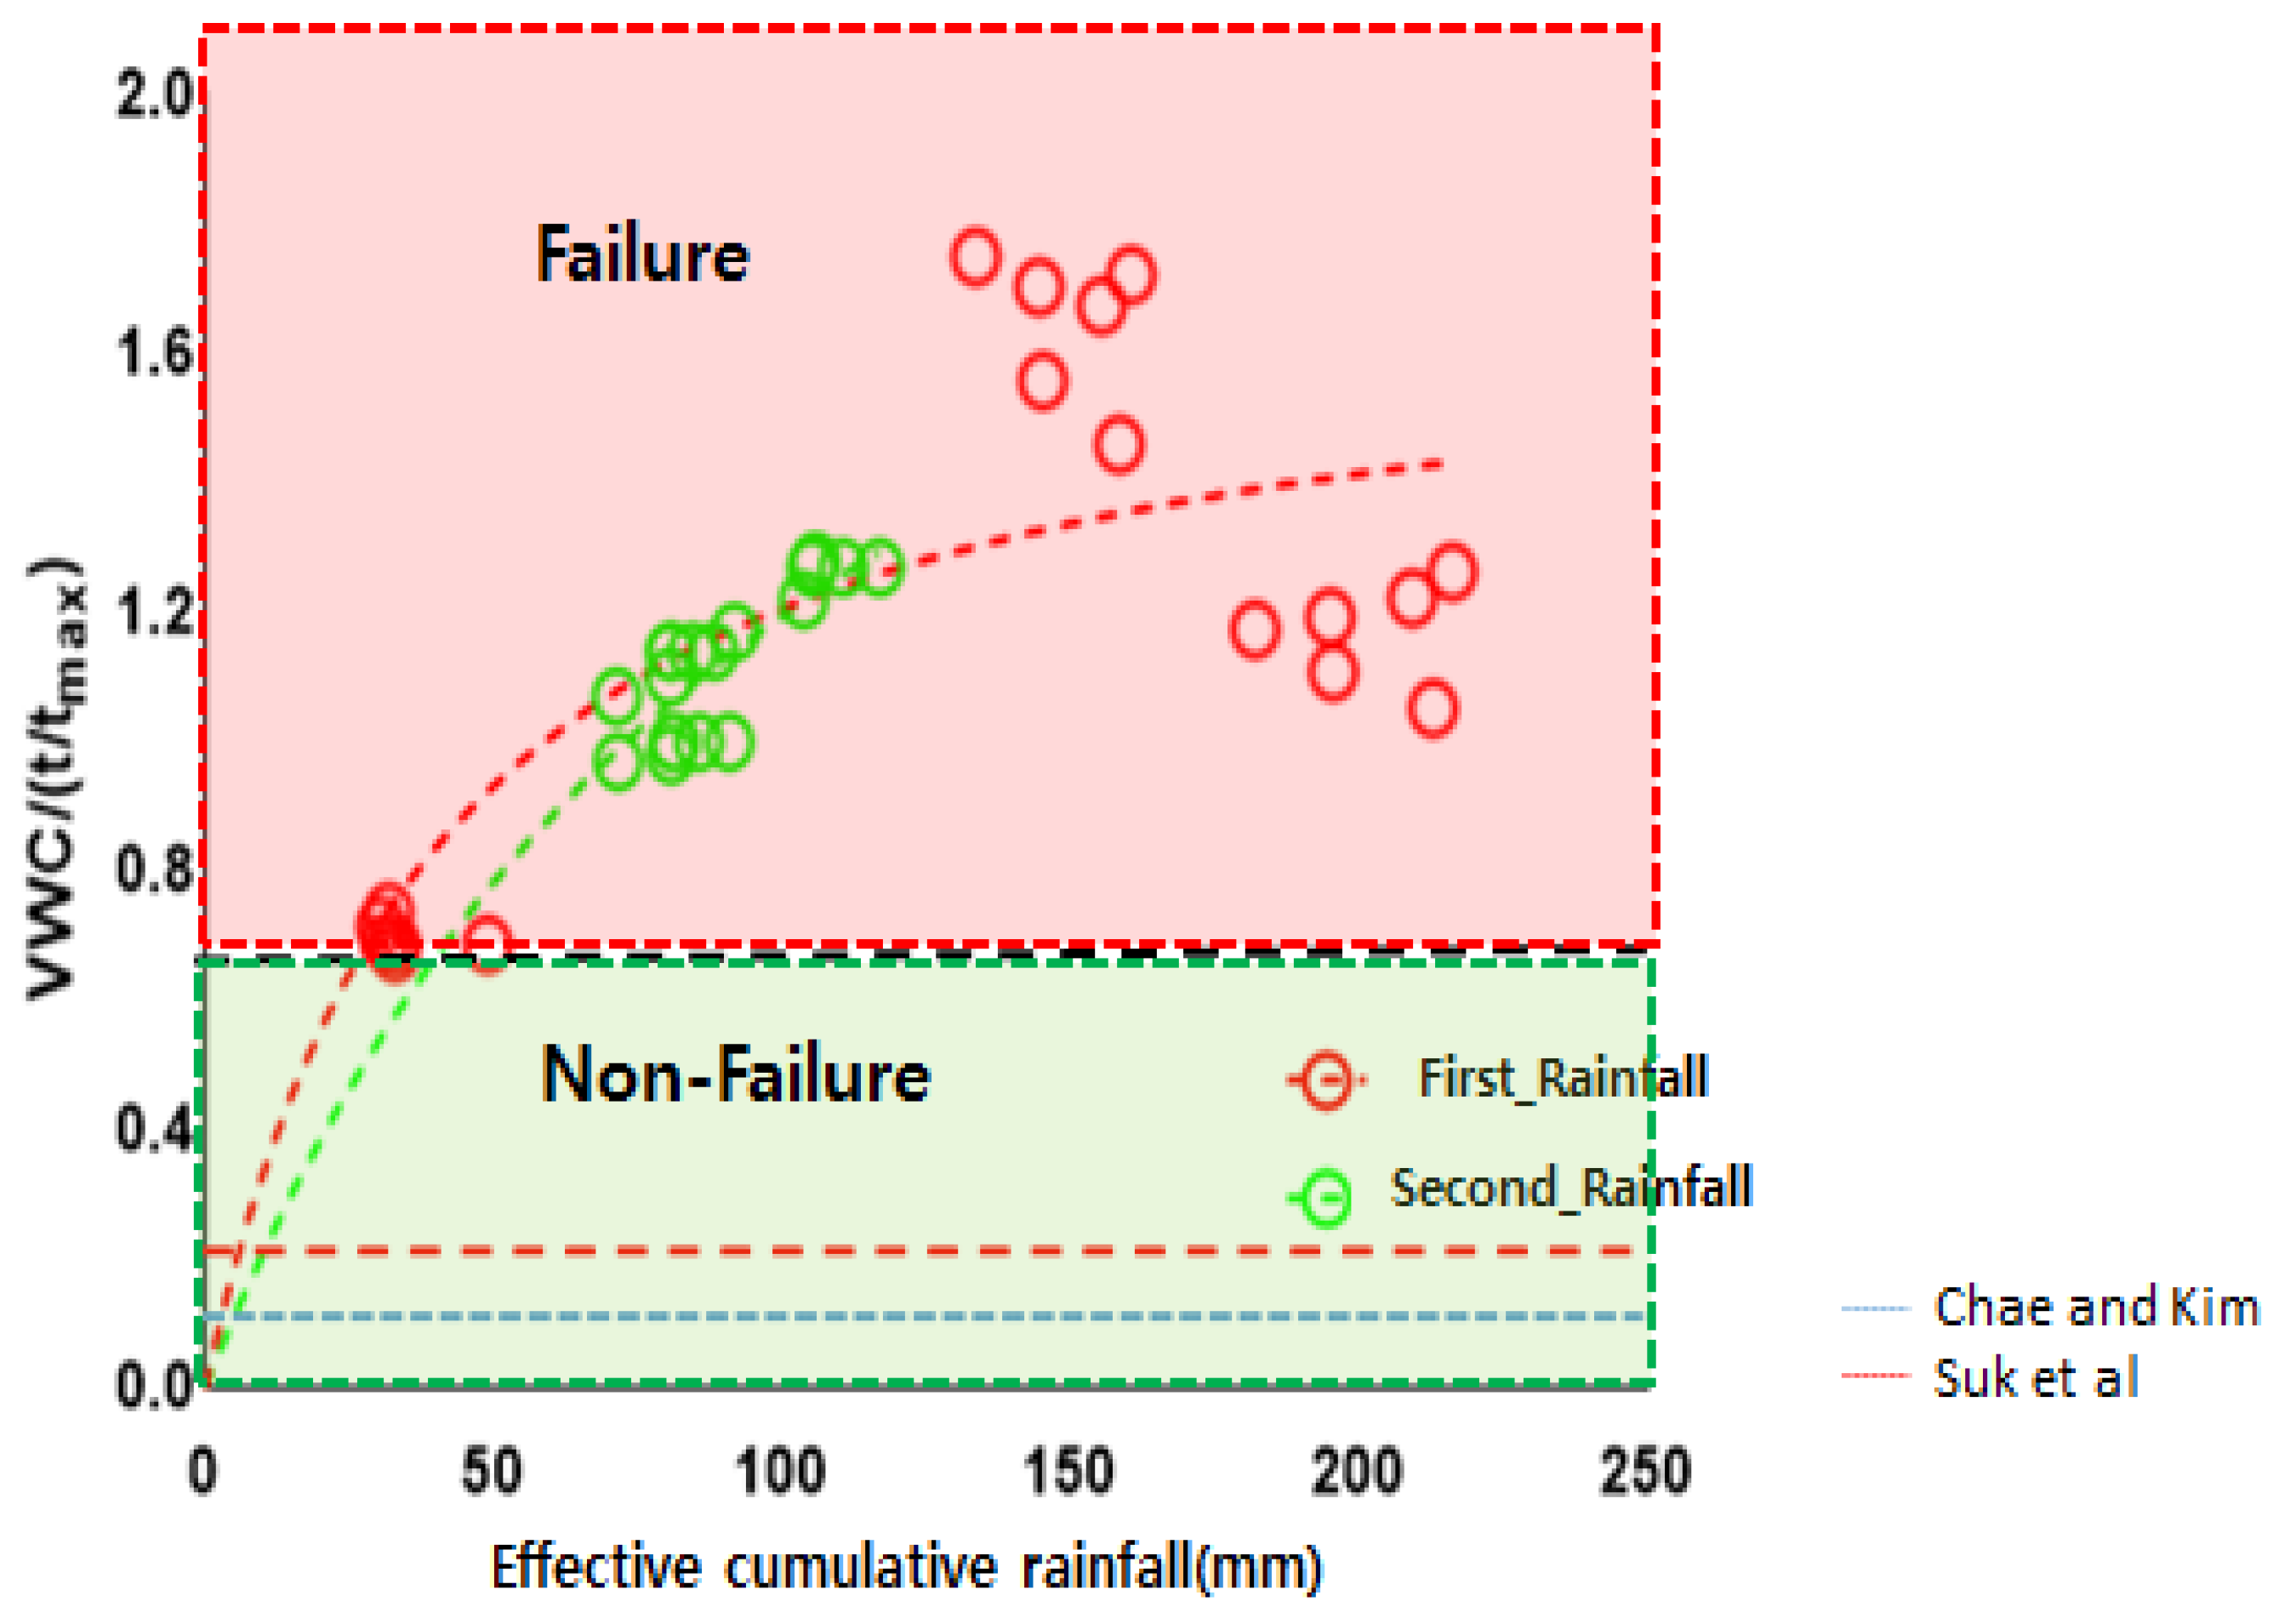
Some researchers assessed landslide risks by setting landslide (failure) sections and non-landslide (non-failure) sections based on the change in the volumetric water content gradient per unit time to estimate the time of landslide occurrence [20,26,44]. Based on indoor failure tests and on-site tests, they proposed the threshold of the change in the volumetric water content gradient for landslide occurrence (failure) at 0.1 [20] and 0.3 [26].
Based on these authors’ work, this study used the LAMP results on the volumetric water content gradient at different soil layer depths, and the resulting threshold was 0.7 (Figure 8). The landslide threshold proposed in this study was obtained by analyzing the rainfall events that caused the landslides in the study area using the LAMP model. It can then be concluded that, when compared with the spatial information on the previous landslides, if the change in the volumetric water content per unit time during the first and second rainfall events is 0.7, a landslide may occur.
The proposed method can be used to estimate the likelihood of a landslide by analyzing the change in the volumetric water content per unit time using the volumetric water content data in the soil layer during possible rainfall events in areas with similar topographical and geological conditions to the study area.
The rainfall amount analyzed by the LAMP model and the resulting change in the volumetric water content of the soil layer are considered sufficiently applicable for regional landslide risk analysis. The research method proposed in this study has the characteristic of being able to analyze landslide risk differently depending on the research area because it uses spatial information based on DEM for landslide risk analysis.
To demonstrate the validity of the limited research method, we will conduct a comparative analysis of past landslide occurrence areas based on a theoretical basis and experimental results. In the future, we will clearly identify the advantages and limitations of the proposed research method and suggest directions for continuous improvement in this study. By improving this research method, we hope to increase the reliability and validity of the proposed research method and provide a way to effectively recognize landslide risk in climate change environments such as extreme rainfall events.
5. Conclusions
This study used the LAMP model to simulate the change in the volumetric water content within the soil layer caused by rainwater infiltration at the time of the landslides that occurred in the study area (Pyeongchang-gun, Gangwon Province in South Korea) and analyzed the likelihood of slope failure or non-failure using the volumetric water content gradient.
The volumetric water content at different soil layer depths showed a clear difference between the first and second rainfall events, with the volumetric water content being more sensitive to rainfall at shallower layer depths. On the other hand, in deeper layers, the volumetric water content gradually increased before converging at a certain level. In the case of rainfall (the second event), before the complete drainage of the water from the previous event (the first event), the volumetric water content rapidly progresses to saturation.
Based on these characteristics, this study assessed landslide risks using the infinite slope stability model (Equation (5)) based on the saturation depth ratio () and confirmed that the landslide risk increases with the volumetric water content, which also increases the congruence with the actual locations of previous landslides.
The landslide risk tended to increase with the volumetric water content, which can mean that this change can be used to calculate the change in the volumetric water content per unit time in each soil layer and set the threshold for landslide occurrence. The landslide threshold proposed in this study is a “prototype that only applies to the study area where actual landslides occurred in the past and comes with specific conditions regarding the time of the landslide occurrence. By expanding the study area in follow-up studies and building up case studies in the future, it is expected that the volumetric water content gradient per unit time can be used to provide more reliable predictions on landslide occurrences.
Author Contributions
Conceptualization, M.-I.K.; methodology, M.-I.K.; validation, M.-I.K. and S.-J.L.; data curation, M.-I.K. and S.-J.L.; writing—original draft preparation, M.-I.K.; writing—review and editing, M.-I.K. and S.-J.L. All authors have read and agreed to the published version of the manuscript.
Funding
This study was carried out with the support of ‘the R&D Program for Forest Science Technology (Project No. 2021341C10-2223-CD01)’ provided by the Korea Forest Service (Korea Forestry Promotion Institute), and this research was supported by a grant (2022-MOIS61-001) of Development Risk Prediction Technology of Storm and Flood For Climate Change based on Artificial Intelligence funded by the Ministry of Interior and Safety (MOIS, Republic of Korea).
Conflicts of Interest
The authors declare no conflict of interest.
References
- Public Data Portal. Past Landslide Information from the Korea Forest Service. Available online: https://www.data.go.kr/ (accessed on 30 December 2022).
- Ministry of Public Administration and Security. Disaster Yearbook. Available online: https://mois.go.kr (accessed on 22 November 2022).
- Kim, W.Y.; Che, B.-G. Characteristics of rainfall, geology and failure geometry of the landslide areas on natural terrains, Korea. J. Eng. Geol. 2009, 19, 331–344, (In Korean with English Abstract). [Google Scholar]
- Kim, J.; Kim, W. Review of Research Trends on Landslide Hazards. J. Eng. Geol. 2013, 23, 305–314, (In Korean with English Abstract). [Google Scholar] [CrossRef] [Green Version]
- Kim, J.; Jeong, S.; Park, S.; Sharma, J. Influence of rainfall-induced wetting on the stability of slopes in weathered soils. Eng. Geol. 2004, 75, 251–262. [Google Scholar] [CrossRef]
- White, J.A.; Singham, D.I. Slope Stability Assessment using Stochastic Rainfall Simulation. Procedia Comput. Sci. 2012, 9, 699–706. [Google Scholar] [CrossRef] [Green Version]
- Khan, M.I.; Wang, S. Stability Analysis to Correlate Shear Strength with Slope Angle and Shear Stress by Considering Saturated and Unsaturated Seismic Conditions. Appl. Sci. 2021, 11, 4568. [Google Scholar] [CrossRef]
- Terzaghi, K. Theoretical Soil Mechanics; John Wiley and Sons: New York, NY, USA, 1943. [Google Scholar]
- Bishop, A.W. The principle of effective stress. Tech. Ukebl. 1959, 106, 859–863. [Google Scholar]
- Lu, N.; Likos, W.J. Suction Stress Characteristic Curve for Unsaturated Soil. J. Geotech. Geoenviron. Eng. 2006, 132, 131–142. [Google Scholar] [CrossRef] [Green Version]
- Fotopoulou, S.D.; Pitilakis, K.D. Towards the vulnerability assessment of low-code RC frame buildings at precarious slopes subjected to rainfall induced landslide hazard. Structures 2021, 34, 239–261. [Google Scholar] [CrossRef]
- Chen, C.-Y.; Chen, T.-C.; Yu, F.-C.; Lin, S.-C. Analysis of time-varying rainfall infiltration induced landslide. Environ. Geol. 2005, 48, 466–479. [Google Scholar] [CrossRef]
- Salciarini, D.; Godt, J.W.; Savage, W.Z.; Conversini, P.; Baum, R.L.; Michael, J.A. Modeling regional initiation of rainfall-induced shallow landslides in the eastern Umbria Region of central Italy. Landslides 2006, 3, 181–194. [Google Scholar] [CrossRef]
- Huang, J.-C.; Kao, S.-J.; Hsu, M.-L.; Liu, Y.-A. Influence of Specific Contributing Area algorithms on slope failure prediction in landslide modeling. Nat. Hazards Earth Syst. Sci. 2007, 7, 781–792. [Google Scholar] [CrossRef]
- Godt, J.; Baum, R.; Savage, W.; Salciarini, D.; Schulz, W.; Harp, E. Transient deterministic shallow landslide modeling: Requirements for susceptibility and hazard assessments in a GIS framework. Eng. Geol. 2008, 102, 214–226. [Google Scholar] [CrossRef]
- Liu, C.-N.; Wu, C.-C. Mapping susceptibility of rainfall-triggered shallow landslides using a probabilistic approach. Environ. Geol. 2008, 55, 907–915. [Google Scholar] [CrossRef]
- Ho, J.-Y.; Lee, K.T.; Chang, T.-C.; Wang, Z.-Y.; Liao, Y.-H. Influences of spatial distribution of soil thickness on shallow landslide prediction. Eng. Geol. 2012, 124, 38–46. [Google Scholar] [CrossRef]
- Lee, J.H.; Park, H.J. Assessment of Landslide Susceptibility using a Coupled Infinite Slope Model and Hydrologic Model in Jinbu Area, Gangwon-Do. Econ. Environ. Geol. 2012, 45, 697–707. [Google Scholar] [CrossRef] [Green Version]
- Kim, J.; Shin, H. Slope Stability Assessment on a Landslide Risk Area in Ulsan During Rainfall. J. Korean Geotech. Soc. 2016, 32, 27–40, (In Korean with English Abstract). [Google Scholar] [CrossRef] [Green Version]
- Chae, B.-G.; Kim, M.-I. Suggestion of a method for landslide early warning using the change in the volumetric water content gradient due to rainfall infiltration. Environ. Earth Sci. 2012, 66, 1973–1986. [Google Scholar] [CrossRef]
- Lee, C.; Kim, D.; Woo, C.; Kim, Y.S.; Seo, J.; Kwon, H. Construction and Operation of the National Landslide Forecast System Using Soil Water Index in Republic of Korea. J. Korean Soc. Hazard Mitig. 2015, 15, 213–221, (In Korean with English Abstract). [Google Scholar] [CrossRef] [Green Version]
- Kang, M.; Seo, J.; Kim, D.; Lee, C.; Woo, C. Analysis of sensors’ behavior and its utility for shallow landslide early warning through model slope collapse experiment. J. Korean Soc. For. Sci. 2019, 108, 208–215, (In Korean with English Abstract). [Google Scholar]
- Song, Y.-S.; Park, J.-Y. State-of-the-art on development and operation of landslide early warning system for climate change response. J. Geol. Soc. Korea 2022, 58, 509–525, (In Korean with English Abstract). [Google Scholar] [CrossRef]
- Mallick, J.; Alqadhi, S.; Talukdar, S.; AlSubih, M.; Ahmed, M.; Khan, R.A.; Ben Kahla, N.; Abutayeh, S.M. Risk Assessment of Resources Exposed to Rainfall Induced Landslide with the Development of GIS and RS Based Ensemble Metaheuristic Machine Learning Algorithms. Sustainability 2021, 13, 457. [Google Scholar] [CrossRef]
- Kwak, J.H.; Kim, M.-I.; Lee, S.-J. Landslide susceptibility assessment considering the saturated depth ratio by rainfall change. J. Eng. Geol. 2018, 28, 687–699, (In Korean with English Abstract). [Google Scholar]
- Suk, J.-W.; Kang, H.-S.; Choi, S.-G.; Jeong, H.S.; Song, H.-S. Characterization of increases in volumetric water content in soil slopes to predict the risk of shallow failure. J. Eng. Geol. 2020, 30, 485–496, (In Korean with English Abstract). [Google Scholar]
- ASTM-D7263-21; Standard Test Methods for Laboratory Determination of Density and Unit Weight of Soil Specimens. ASTM International: West Conshohocken, PA, USA, 2021; 7p.
- ASTM-D3080-04; Standard Test Method for Direct Shear Test of Soils under Drained Conditions. ASTM International: West Conshohocken, PA, USA, 2012; 7p.
- Longley, P. Geographic Information System and Science; John Wiley and Sons: New York, NY, USA, 2005; 496p. [Google Scholar]
- Burrough, P.A.; McDonnell, R.A.; Lloyd, C.D. Principles of Geographical Information Systems, 2nd ed.; Oxford University Press: Oxford, UK, 2013; 330p, ISBN 978-0-19823-366-4. [Google Scholar]
- Yu, J.-S.; Muhammad, W.; Shin, J.-Y.; Kim, T.-W. Evaluation of extended inverse distance weighting method for constructing a flow duration curve at ungauged basin. J. Korean Soc. Hazard Mitig. 2015, 15, 329–337, (In Korean with English Abstract). [Google Scholar] [CrossRef] [Green Version]
- Lee, S.-J.; Song, J.; Kim, Y.-J. The NCAM Land-Atmosphere Modeling Package (LAMP) Version 1: Implementation and Evaluation. Korean J. Agric. For. Meteorol. 2016, 18, 307–319, (In Korean with English Abstract). [Google Scholar] [CrossRef] [Green Version]
- Lee, S.-M.; Choi, S.-W.; Lee, S.-J.; Kim, M.-I. Comparison of spatial interpolation processing environment of numerical model rainfall prediction data. Korean J. Agric. For. Meteorol. 2022, 24, 337–345, (In Korean with English Abstract). [Google Scholar]
- Park, J.; Lee, S.-J.; Kang, M.; Kim, J.; Yang, I.; Kim, B.-G.; You, K.-G. Suggestions for improving data quality assurance and spatial representativeness of Cheorwon AAOS data. Korean J. Agric. For. Meteorol. 2018, 20, 47–56, (In Korean with English Abstract). [Google Scholar]
- Chen, F.; Dudhia, J. Coupling an advanced land-surface–hydrology model with the Penn State–NCAR MM5 modeling system. Part I: Model implementation and sensitivity. Mon. Weather. Rev. 2001, 129, 569–585. [Google Scholar] [CrossRef]
- Niu, G.-Y.; Yang, Z.-L.; Mitchell, K.E.; Chen, F.; Ek, M.B.; Barlage, M.; Kumar, A.; Manning, K.; Niyogi, D.; Rosero, E.; et al. The community Noah land surface model with multiparameterization options (Noah-MP): 1. Model description and evaluation with local-scale measurements. J. Geophys. Res. Atmos. 2011, 116, 1–19. [Google Scholar] [CrossRef] [Green Version]
- Yang, Z.-L.; Niu, G.-Y.; Mitchell, K.E.; Chen, F.; Ek, M.B.; Barlage, M.; Longuevergne, L.; Manning, K.; Niyogi, D.; Tewari, M.; et al. The community Noah land surface model with multiparameterization options (Noah-MP): 2. Evaluation over global river basins. J. Geophys. Res. Atmos. 2011, 116, 1–16. [Google Scholar] [CrossRef]
- Chae, B.-G.; Lee, J.-H.; Park, H.-J.; Choi, J. A method for predicting the factor of safety of an infinite slope based on the depth ration of the wetting front induced by rainfall infiltration. Nat. Hazards Earth Syst. Sci. 2015, 15, 1835–1849. [Google Scholar] [CrossRef] [Green Version]
- Chae, B.-G.; Park, K.-B.; Park, H.-J.; Choi, J.-H.; Kim, M.-I. Analysis of Slope Stability Considering the Saturation Depth Ratio by Rainfall Infiltration in Unsaturated Soil. J. Eng. Geol. 2012, 22, 343–351, (In Korean with English Abstract). [Google Scholar] [CrossRef] [Green Version]
- Kang, S.; Lee, S.-R.; Cho, S.-E. Slope Stability Analysis of Unsaturated Soil Slopes Based on the Site-Specific Characteristics: A Case Study of Hwangryeong Mountain, Busan, Korea. Sustainability 2020, 12, 2839. [Google Scholar] [CrossRef] [Green Version]
- Fredlund, D.G.; Rahardjo, H. Soil Mechanics for Unsaturated Soils; John Wiley and Sons, Inc.: Hoboken, NJ, USA, 1993. [Google Scholar]
- Hammond, C.; Hall, D.; Miller, S.; Swetik, P. Level I Stability Analysis (LISA) Documentation for Version 2.0; General Technical Report INT-285; USDA Forest Service Intermountain Research Station: Ogden, UT, USA, 1992; 36p. [Google Scholar]
- Mehnatkesh, A.; Ayoubi, S.; Jalalian, A.; Sahrawat, K.L. Relationships between soil depth and terrain attributes in a semi arid hilly region in western Iran. J. Mt. Sci. 2013, 10, 163–172. [Google Scholar] [CrossRef]
- Suk, J.W.; Song, H.S.; Kang, H.S.; Kim, H.J. A study on applicability of volumetric water content to predict shallow failure. J. Korea Acad.-Ind. 2019, 20, 737–746, (In Korean with English Abstract). [Google Scholar]
Figure 1.
Location of study areas with satellite images (in the detailed figure on the left, the white line represents the Songjung-ri boundary, and the red triangle represents the landslide trigger point).
Figure 1.
Location of study areas with satellite images (in the detailed figure on the left, the white line represents the Songjung-ri boundary, and the red triangle represents the landslide trigger point).

Figure 2.
Flowchart for this study’s methodology and objective.

Figure 3.
Research flow diagram that combines the National Center for AgroMeteorology-Land-Atmosphere Modeling Package and landslide moel [32].
Figure 3.
Research flow diagram that combines the National Center for AgroMeteorology-Land-Atmosphere Modeling Package and landslide moel [32].

Figure 4.
A simulated diagram of the saturation depth ratio in the infinite slope stability model was revised based on the soil depth of each layer of the Land-Atmosphere Modeling Package (LAMP) model (based on [39]).
Figure 4.
A simulated diagram of the saturation depth ratio in the infinite slope stability model was revised based on the soil depth of each layer of the Land-Atmosphere Modeling Package (LAMP) model (based on [39]).

Figure 5.
Results of the simulation of rainfall events and changes in the volumetric water content in each soil layer before the landslides using the Land-Atmosphere Modeling Package (LAMP) model (cumulative rainfall in Analysis Section I: 55.4 mm; cumulative rainfall in Analysis Section II: 108.61 mm).

Figure 6.
Results of the analysis on the change in the volumetric water content gradient in each soil layer per unit time () based on the effective cumulative rainfall in the first and second rainfall events, to analyze the effective cumulative rainfall at the times of the landslides. (a) Change in the volumetric water content gradient per unit time at an effective cumulative rainfall of 55.54 mm in the analysis section I; (b) Change in the volumetric water content gradient per unit time at an effective cumulative rainfall of 108.61 mm in the analysis section II.

Figure 7.
Spatial distribution of landslide risks was analyzed by applying the saturation depth ratio () to the infinite slope stability model proposed in this study, considering the changes in the volumetric water content at different soil layer depths. (a) Landslide locations in the study area; (b) Landslide risk map of the Korea Forest Service; (c) spatial distribution of landslide risks based on the effective cumulative rainfall of 55.54 mm in the analysis section I; (d) spatial distribution of landslide risks based on the effective cumulative rainfall of 108.61 mm in the analysis section II.

Figure 8.
The Land-Atmosphere Modeling Package (LAMP) results on the effective cumulative rainfall and the change in the volumetric water content per unit time in the soil layer, and the failure/non-failure ranges based on the results are shown with the findings of the previous literature ([20,26,44]; where green boxes represent non-failure ranges and red boxes represent failure ranges).


Table 1.
National Center for AgroMeteorology-Land-Atmosphere Modeling Package (NCAM-LAMP WRF) specifications.
Table 1.
National Center for AgroMeteorology-Land-Atmosphere Modeling Package (NCAM-LAMP WRF) specifications.
| Domain 1 | Domain 2 | Domain 3 | Domain 4 | |
|---|---|---|---|---|
| Resolution (m) | 21,870 | 7290 | 2430 | 810 |
| Topography and land use data | 30″ | 30″ | 30″ | 30″ |
| Initial condition | NCEP/NCAR GDAS (FNL) analysis (6 h) | |||
| Shortwave radiation scheme | Goddard shortwave | |||
| Longwave radiation scheme | RRTM | |||
| Microphysics | WSM 6 | |||
| Cumulus parameterization | New Kain-Fritsch | off | ||
| Planetary boundary layer | YSU PBL | |||
| Land surface | Noah-MP with dynamic vegetation | |||
Notes: Noah-MP: Noah with multiparameterization; NCEP: National Center for Environmental Prediction; NCAR: National Center for Atmospheric Research; GDAS: global data assimilation system; FNL: final (analysis); RRTM: rapid radiative transfer model; WSM 6: weather research and forecasting (WRF) single-moment 6-class microphysics scheme; YSU PBL: Yonsei University planetary boundary layer.
Table 2.
Results of the linear regression analysis on the change in the volumetric water content gradient per unit time () affecting the volumetric water content in each soil layer, considering the effective cumulative rainfall.
Table 2.
Results of the linear regression analysis on the change in the volumetric water content gradient per unit time () affecting the volumetric water content in each soil layer, considering the effective cumulative rainfall.
| Analysis Section | Soil Layer | Y = aX + b | R2 | |
|---|---|---|---|---|
| a | b | |||
| I | SL-1 | 0.82 | 0.01 | 0.56 |
| SL-2 | 0.74 | −0.04 | 0.74 | |
| SL-3 | 0.37 | −0.01 | 0.88 | |
| SL-4 | 0.04 | 0.08 | 0.80 | |
| II | SL-1 | 0.81 | 0.24 | 0.74 |
| SL-2 | 0.64 | 0.26 | 0.82 | |
| SL-3 | 0.44 | 0.24 | 0.86 | |
| SL-4 | 0.20 | 0.11 | 0.90 | |
Disclaimer/Publisher’s Note: The statements, opinions and data contained in all publications are solely those of the individual author(s) and contributor(s) and not of MDPI and/or the editor(s). MDPI and/or the editor(s) disclaim responsibility for any injury to people or property resulting from any ideas, methods, instructions or products referred to in the content. |
© 2023 by the authors. Licensee MDPI, Basel, Switzerland. This article is an open access article distributed under the terms and conditions of the Creative Commons Attribution (CC BY) license (https://creativecommons.org/licenses/by/4.0/).
Share and Cite
MDPI and ACS Style
Kim, M.-I.; Lee, S.-J. An Analysis of Landslide Risk Using the Change in the Volumetric Water Content Gradient in the Soil Layer Per Unit Time of Effective Cumulative Rainfall. Water 2023, 15, 1699. https://doi.org/10.3390/w15091699
AMA Style
Kim M-I, Lee S-J. An Analysis of Landslide Risk Using the Change in the Volumetric Water Content Gradient in the Soil Layer Per Unit Time of Effective Cumulative Rainfall. Water. 2023; 15(9):1699. https://doi.org/10.3390/w15091699
Chicago/Turabian StyleKim, Man-Il, and Seung-Jae Lee. 2023. "An Analysis of Landslide Risk Using the Change in the Volumetric Water Content Gradient in the Soil Layer Per Unit Time of Effective Cumulative Rainfall" Water 15, no. 9: 1699. https://doi.org/10.3390/w15091699
Note that from the first issue of 2016, this journal uses article numbers instead of page numbers. See further details here.